Embed Size (px)
Citation preview

Large accumulation of anthropogenic CO2 in the East (Japan) Sea and
its significant impact on carbonate chemistry
Geun-Ha Park,1 Kitack Lee,1 Pavel Tishchenko,2 Dong-Ha Min,3 Mark J. Warner,4
Lynne D. Talley,5 Dong-Jin Kang,6 and Kyung-Ryul Kim6
Received 19 December 2005; revised 10 July 2006; accepted 26 July 2006; published 22 November 2006.
[1] This paper reports on a basin-wide inventory of anthropogenic CO2 in the East(Japan) Sea determined from high-quality alkalinity, chlorofluorocarbon, and nutrientdata collected during a summertime survey in 1999 and total dissolved inorganic carbondata calculated from pH and alkalinity measurements. The data set comprisesmeasurements from 203 hydrographic stations and covers most of the East Sea with theexception of the northwestern boundary region. Anthropogenic CO2 concentrations areestimated by separating this value from total dissolved inorganic carbon using a tracer-based (chlorofluorocarbon) separation technique. Wintertime surface CFC-12 datacollected in regions of deep water formation off Vladivostok, Russia, improve theaccuracy of estimates of anthropogenic CO2 concentrations by providing improved air-sea CO2 disequilibrium values for intermediate and deep waters. Our calculation yields atotal anthropogenic CO2 inventory in the East Sea of 0.40 ± 0.06 petagrams of carbon asof 1999. Anthropogenic CO2 has already reached the bottom of the East Sea, largelyowing to the effective transport of anthropogenic CO2 from the surface to the oceaninterior via deep water formation in the waters off Vladivostok. The highest specificcolumn inventory (vertically integrated inventory per square meter) of anthropogenic CO2
of 80 mol C m�2 is found in the Japan Basin (40�N�44�N). Comparison of this inventorywith those for other major basins of the same latitude band reveal that the East Sea valuesare much higher than the inventory for the Pacific Ocean (20�30 mol C m�2) and aresimilar to the inventory for the North Atlantic (66�72 mol C m�2). The substantialaccumulation of anthropogenic CO2 in the East Sea during the industrial era has causedthe aragonite and calcite saturation horizons to move upward by 80�220 m and500�700 m, respectively. These upward movements are approximately 5 times greaterthan those found in the North Pacific. Both the large accumulation of anthropogenicCO2 and its significant impact on carbonate chemistry in the East Sea suggest thatthis sea is an important site for monitoring the future impact of the oceanic invasionof anthropogenic CO2.
Citation: Park, G.-H., K. Lee, P. Tishchenko, D.-H. Min, M. J. Warner, L. D. Talley, D.-J. Kang, and K.-R. Kim (2006), Large
accumulation of anthropogenic CO2 in the East (Japan) Sea and its significant impact on carbonate chemistry, Global Biogeochem.
Cycles, 20, GB4013, doi:10.1029/2005GB002676.
1. Introduction
[2] Coastal and marginal seas potentially play an impor-tant role in absorbing atmospheric CO2 because highinputs and an efficient use of nutrients from adjoiningland result in a decrease in the surface water CO2 con-centration, which in turn drives CO2 transfer from theatmosphere to the surface ocean. These seas also play akey role in the global carbon cycle by connecting terres-trial and oceanic carbon reservoirs [Tsunogai et al., 1999;Thomas et al., 2004]. Little attention has been devoted tothe role of coastal and marginal seas as a sink ofatmospheric CO2 because these seas account for only 7%of the total area of the world ocean. As a result, onlylimited information is available regarding the amount ofanthropogenic CO2 stored in coastal and marginal seas and
GLOBAL BIOGEOCHEMICAL CYCLES, VOL. 20, GB4013, doi:10.1029/2005GB002676, 2006ClickHere
for
FullArticle
1School of Environmental Science and Engineering, Pohang Universityof Science and Technology, Pohang, Korea.
2Pacific Oceanological Institute, Far East Division, Russian Academyof Sciences, Vladivostok, Russia.
3Marine Science Institute, University of Texas at Austin, Port Aransas,Texas, USA.
4School of Oceanography, University of Washington, Seattle,Washington, USA.
5Scripps Institution of Oceanography, University of California, SanDiego, La Jolla, California, USA.
6Research Institute of Oceanography, School of Earth and EnvironmentalSciences (BK21), Seoul National University, Seoul, South Korea.
Copyright 2006 by the American Geophysical Union.0886-6236/06/2005GB002676$12.00
GB4013 1 of 13

the mechanisms that underlie the transfer of atmosphericCO2 to coastal and marginal seas and subsequently on tothe open ocean.[3] The East Sea is a marginal sea surrounded by Korea,
Japan, and Russia, and is connected to the North Pacific viathree straits with depths of less than 150 m. In early studiesof the East Sea, Japanese investigators put forward the ideathat waters deeper than �300 m in this sea have uniformphysical and chemical characteristics. This uniform waterbody was originally referred to as the Proper Water [Uda,1934]; however, more recent investigations have revealedthat this uniform water body can be further divided intothree water masses, referred to as Central Water, DeepWater, and Bottom Water [Kim et al., 1996; Kim andKim, 1996]. A key physical feature of the East Sea is deepwater formation at the continental shelf and slope offVladivostok, Russia [Senjyu and Sudo, 1993; Kawamuraand Wu, 1998; Kim et al., 2002; Talley et al., 2003].Another unique feature of the East Sea is weak verticalstability compared to that in the open ocean; for example,
vertical variations in temperature and salinity found in theEast Sea below the seasonal thermocline are one to twoorders of magnitude smaller than those typically found inthe Pacific Ocean [Kim and Kim, 1996; Kim et al., 2001,2002]. Both the deep water formation and weak verticalstability found in the East Sea lead to the formation of anactive deep-convection system that vigorously transferssurface water loaded with anthropogenic CO2 to theinterior of the basin. On the basis of the features describedabove, the East Sea is potentially a significant reservoir foranthropogenic CO2.[4] To verify this possibility, we applied a tracer-based
separation technique [Gruber et al., 1996] to CO2 surveydata collected from the East Sea. In the present paper, wereport the basin-scale distribution of anthropogenic CO2
in the East Sea and the effect of oceanic uptake ofanthropogenic CO2 on the saturation state of seawaterwith respect to biogenic calcium carbonate (CaCO3)particles.
2. Data and Calculation Methods
2.1. Survey Data
[5] The data used in the present study provide a densecoverage of the East Sea and were collected from 24 Juneto 11 August 1999 as part of the Circulation Research ofEast Asian Marginal Seas project and the U.S. Office ofNaval Research’s Japan/East Sea Program. This fieldsurvey was jointly conducted by a multinational team ofinvestigators from United States, Russia, and Korea. In thesouthern part of the East Sea, the survey (hereafter referredto as ‘‘Survey R’’) was conducted on the U.S. R/V RogerRevelle, whereas in the northern part of the sea (referred tohereafter as ‘‘Survey K’’) was carried out by Russianscientists on the Russia R/V Professor Khromov (Figure 1).A total of 203 hydrographic stations were established[Talley et al., 2004]. Salinity, temperature, and nutrientconcentrations were measured in all discrete samples,whereas concentrations of chlorofluorocarbons (CFC-11,CFC-12, and CFC-113) were determined in seawatersamples collected from 110 of the 112 Survey R stationsand 36 of the 91 Survey K stations. The precision of thechlorofluorocarbon measurements was about 0.005 pmol kg�1
[Min and Warner, 2005].[6] Total alkalinity (AT) and potentiometric pH were
measured in nearly all discrete samples. The AT analysisfollowed Bruevich’s method, which utilizes colorimetrictitration by hydrochloric acid in an open system using amixed indicator (methylene blue and methyl red) [Bruevich,1944]. The titrant concentration was monitored daily bytitrating certified reference materials with known valuesof AT and total dissolved inorganic carbon (CT) (preparedand certified by A. Dickson of Scripps Institution ofOceanography,SanDiego,California).ThepHmeasurementswere performed at 25�C in a potential cell without a liquidjunction [Tishchenko et al., 2001] and reported on the totalscale, which considers the interaction of hydrogen ionswith bisulfate ions [Hansson, 1973; Dickson, 1984]. Tocalculate CT from AT and pH measurements using thethermodynamic models, all pH values on the total hydro-
Figure 1. Shaded topography map of the East Seashowing measurements sites. Data were collected by theCirculation Research of East Asian Marginal Seas projectand U.S. Office of Naval Research’s Japan/East SeaProgram from 24 June to 11 August 1999. Open circlesrepresent sampling locations of Survey K conducted on theRussia R/V Khromov, while solid circles are samplinglocations of Survey R conducted on the U.S. R/V RogerRevelle. JB indicates the Japan Basin. The three rectangularareas (S1�3) are discussed in Figure 2.
GB4013 PARK ET AL.: ANTHROPOGENIC CO2 IN THE EAST SEA
2 of 13
GB4013

gen scale (pHT) were converted to the seawater scale(pHSWS) to be consistent with published dissociationconstants of carbonic acid. The two scales are linked bythe following equation:
pHSWS ¼ pHT � log 1þ SO2�4
� �T
.KHSO4
�n
þ F½ �T.KHF
�.1þ SO2�
4
� �T
.KHSO4
� �o;
ð1Þ
where [SO42�] and [F]T are the total concentrations of sulfate
and fluoride in seawater, respectively, and KHSO4 and KHF
are the dissociation constants of sulfate and hydrogenfluoride in seawater, respectively [Dickson and Riley, 1979].[7] The measurement precisions were approximately
±4 mmol kg�1 for AT and ±0.004 units for pH [Talley etal., 2004]. The values of CT used in the calculation ofanthropogenic CO2 concentration were calculated from AT
and pH measurements using the carbonic acid dissociationconstants of Mehrbach et al. [1973] as refitted by Dicksonand Millero [1987]. This set of carbonic acid dissociationconstants provides the best correlation with global carbonmeasurements [Lee et al., 2000; Millero et al., 2002];however, Talley et al. [2004] raised the concern that pHvalues used in the calculation of CT may be biased by asmuch as 0.035 in pH. This bias was found to be themaximum difference in a comparison of two different pHmeasurement techniques (potentiometry versus spectropho-tometry) applied to the same set of samples collected duringthe cruise. According to a comparison study, such a contrastin the two different pH data sets largely reflects unnecessarymeasurement steps associated with the spectrophotometricpH method (see auxiliary material1). These extrameasurement steps were not included in the potentiometricpH measurement protocol. When these unnecessary stepsare eliminated from the spectrophotometric measurementprocedure, spectrophotometric pH values are in betteragreement with potentiometric pH values. Thereforepotentiometric pH values are sufficiently accurate to enablethe calculation of CT. The accuracy of the pH values isaddressed in detail in the auxiliary material.
2.2. Systematic Differences in the Values of CarbonParameters Measured During the Two Cruises
[8] We compared hydrographic and carbon parameterdata obtained during Surveys R and K to assess systematicdiscrepancies between the two surveys. Three regions(labeled S1, S2, and S3 in Figure 1) for which the twosurveys either overlap or collected data at proximate loca-tions were arbitrarily chosen for comparison of the two datasets. Each of the three parameters, AT, CT, and pH, wasplotted against potential density (sq) for each of the threeoverlapping or proximal regions (Figure 2). Comparisons ofthe two sets of survey data from each overlapping orproximal region were undertaken by fitting the data forsq > 27.2 from each survey with a second-order polynomialfunction and then examining the differences between the
two curve fits (Figure 2). This method has been usedpreviously to define systematic errors in global CO2
survey data [Lamb et al., 2002; Sabine et al., 2005].Systematic differences in measured parameters betweenthe two data sets for the three overlap regions are summa-rized in Table 1. Differences in salinity (S), potentialtemperature (q), oxygen concentration (O2), and AT arewithin measurement uncertainties and thus no correctionswere applied to these data; however, the calculated CT
values for Survey K are 4.3 mmol kg�1 higher than thosefor Survey R. This systematic discrepancy is likely toreflect the mean pH difference of 0.014 between the twosurveys. To correct for this difference in CT, 4.3 mmol kg�1
was subtracted from the CT values calculated for Survey K.
2.3. Calculation of Anthropogenic CO2
[9] The concentration of anthropogenic CO2 within agiven parcel of water was determined using a modifiedversion of the DC* approach developed by Gruber et al.[1996]. Modification includes the use of an optimummultiparameter (OMP) analysis to more accurately deter-mine the net air-sea disequilibrium for a given sample[Sabine et al., 2002; Lee et al., 2003]. In this method,anthropogenic CO2 (CANT) is separated out from CT
(CTCAL; calculated from measured pH and AT values using
a thermodynamic model) via the following equation:
CANT ¼ CCALT � C
EQT �DCBIO �DCDISEQ; ð2Þ
where CTEQ is the total dissolved inorganic carbon in
equilibrium with the preindustrial atmospheric CO2 of280 matm for the sample’s potential temperature, salinity,and preformed total alkalinity (AT
o), where ATo represents the
total alkalinity of a water parcel when it was last at theocean surface; DCBIO is the change in total dissolvedinorganic carbon resulting from the oxidation of organicmatter and dissolution of calcium carbonate, which can beestimated from changes in apparent oxygen utilization(saturation O2 � measured O2) and the difference betweenAT and AT
o, respectively; and DCDISEQ is the total dissolvedinorganic carbon arising from disequilibrium of the fugacityof CO2 (fCO2) between the atmosphere and ocean.[10] The AT
o values of subsurface samples were estimatedfrom multilinear regression using salinity and NO (NO =O2 � RO2:N N) [Broecker, 1974]. We chose an RO2:N of�10.625, as given by Anderson and Sarmiento [1994]. Anempirical equation for AT
o was derived using surface waterAT data, including wintertime measurements (n = 1,177)(<100 dbars),
AoT �mol kg�1�
¼ 765:5 þ 43:77 Sþ 0:03147 NO: ð3Þ
The standard deviation (1s) of the ATo value estimated using
equation (3) is ±6.3 mmol kg�1. We found that summer-winter differences in AT are statistically insignificant.[11] The value of CT
EQ was calculated from the ATo
estimated from equation (3) and fCO2 = 280 matm usingthe carbonic acid dissociation constants of Mehrbach et al.[1973], as refitted by Dickson and Millero [1987]. The
1Auxiliary materials are available in the HTML. doi:10.1029/2005GB002676.
GB4013 PARK ET AL.: ANTHROPOGENIC CO2 IN THE EAST SEA
3 of 13
GB4013

calculated CTEQ values were then linearized by a least
squares linear fit, yielding the equation
CEQT ¼ 2063� 8:753 q� 5ð Þ þ 95:64 S� 34ð Þ
�1:474 AoT � 2270
� ;
ð4Þ
with a standard deviation (1s) between the linearized andcalculated CT
EQ of ±0.9 mmol kg�1.[12] The values of air-sea CO2 disequilibrium (DCDISEQ)
were calculated according to the following equation:
DCDISEQ ¼ CCALT �DCBIO � C
EQT T: ð5Þ
CTEQ
T is the total dissolved inorganic carbon in equilibriumwith the corresponding atmospheric fCO2 at the time thatthe water parcel was at the ocean surface (sampling date �pCFC-12 age). The apparent age of the subsurface waterparcel using pCFC-12 is defined as the time differencebetween the measurement year and the year when the waterparcel was last in contact with the atmosphere. However, the
pCFC-12 water age is not necessarily identical to the truewater age because of the nonlinear mixing of waters withdifferent ages and possible undersaturation of CFC-12 at thesurface when the surface water lost contact with theatmosphere during the winter [Min and Warner, 2005;Matsumoto and Gruber, 2005].[13] Mixing between waters ventilated during the period
1960�1990 is expected to result in a relatively small agebias because pCFC-12 in the atmosphere increased approx-
Table 1. Systematic Discrepancies (Survey R–Survey K) in
Parameters Recorded in Regions For Which the Two Surveys
Overlap
Crossovers S q O2 pH AT CT
S1 0.0003 0.0068 �0.45 0.015 1.50 �5.17S2 �0.0018 �0.0263 �1.92 0.020 0.01 �6.98S3 �0.0004 0.0096 �1.11 0.006 1.18 �0.82Average discrepancies �0.0006 �0.0033 �1.16 0.014 0.90 �4.32S.D. 0.0010 0.0199 0.74 0.007 0.78 3.17
Figure 2. Comparison plots of total alkalinity (AT), total dissolved inorganic carbon (CT), and pH forthe regions (S1�S3 in Figure 1) where the two surveys either overlap or collected data at similarlocations. Data collected for Survey R are fitted to a second-order polynomial function and plotted assolid symbols (solid lines), while those collected for Survey K are also fitted to a second-orderpolynomial function and shown as open symbols (dotted lines). Values (D) in shown in the figures denotethe mean differences and standard deviations (1s) between the two curve fits.
GB4013 PARK ET AL.: ANTHROPOGENIC CO2 IN THE EAST SEA
4 of 13
GB4013
imately linearly during this period [Matsumoto and Gruber,2005]. Therefore, in the present study we restricted the useof pCFC-12 based ages to waters younger than 40 yearsold. However, in the northern Japan Basin, in which theformation of deep water occurs, the surface CFC-12concentrations observed during the winter are approximately80% saturated with respect to atmospheric CFC-12 in 2000[Min and Warner, 2005]. This 20% undersaturation ofCFC-12 at the surface yielded resulting pCFC-12 waterages that are 2 to 5 years younger than those that wouldhave resulted if the surface water had been in solubilityequilibrium with respect to the overlying atmosphericpCFC-12. These pCFC-12 age biases result in a 1 to2 mmol kg�1 underestimation of anthropogenic CO2
concentrations. In the present study, we applied thesecorrections only to waters colder than 1�C because CFC-12concentrations were only measured for surface waterscolder than 1�C during the winter. This cold surface wateroccupies most of the interior East Sea that is deeper than600 m and approximately 30% of all waters shallower than600 m.[14] The net air-sea disequilibrium value for any given
seawater sample is expressed as the sum of the disequilib-rium values of different water mass end-members,
DCDISEQ ¼Xni�1
xiDCDISEQ�i; ð6Þ
where xi (Sxi = 1) is the relative contribution of the specificsource water i to the sample and DCDISEQ�i is the unique
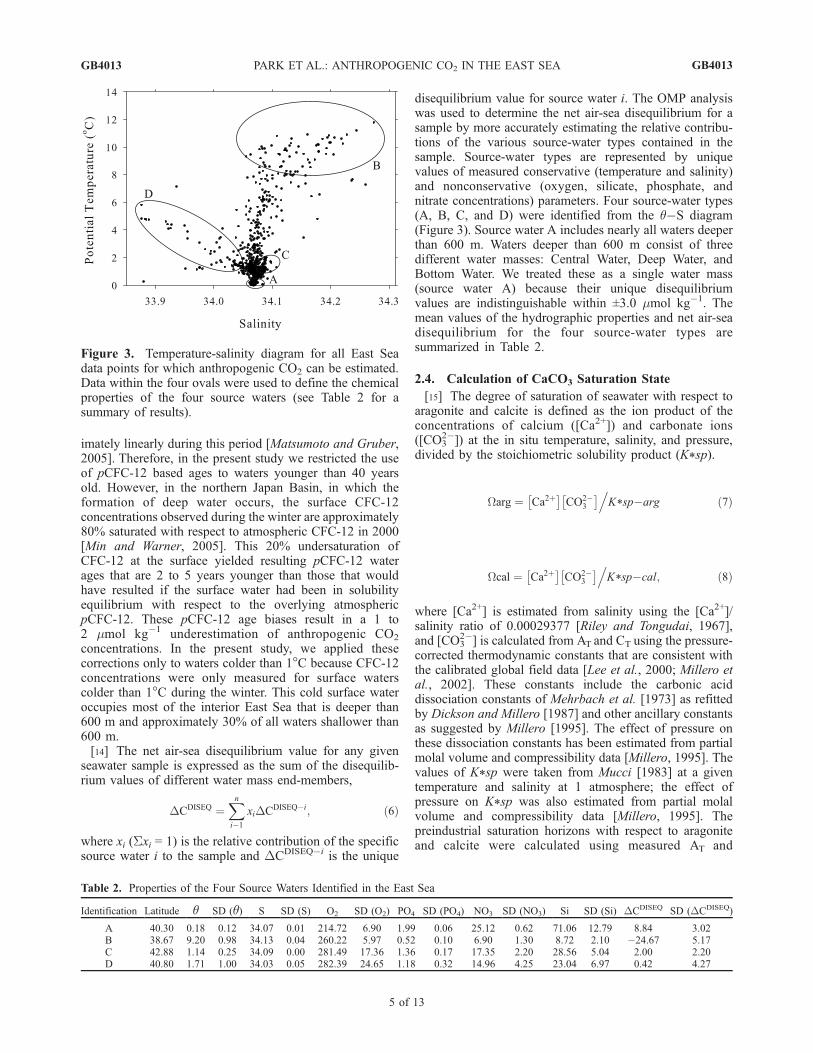
disequilibrium value for source water i. The OMP analysiswas used to determine the net air-sea disequilibrium for asample by more accurately estimating the relative contribu-tions of the various source-water types contained in thesample. Source-water types are represented by uniquevalues of measured conservative (temperature and salinity)and nonconservative (oxygen, silicate, phosphate, andnitrate concentrations) parameters. Four source-water types(A, B, C, and D) were identified from the q�S diagram(Figure 3). Source water A includes nearly all waters deeperthan 600 m. Waters deeper than 600 m consist of threedifferent water masses: Central Water, Deep Water, andBottom Water. We treated these as a single water mass(source water A) because their unique disequilibriumvalues are indistinguishable within ±3.0 mmol kg�1. Themean values of the hydrographic properties and net air-seadisequilibrium for the four source-water types aresummarized in Table 2.
2.4. Calculation of CaCO3 Saturation State
[15] The degree of saturation of seawater with respect toaragonite and calcite is defined as the ion product of theconcentrations of calcium ([Ca2+]) and carbonate ions([CO3
2�]) at the in situ temperature, salinity, and pressure,divided by the stoichiometric solubility product (K*sp).
Warg ¼ Ca2þ� �
CO2�3
� �.K*sp�arg ð7Þ
Wcal ¼ Ca2þ� �
CO2�3
� �.K*sp�cal; ð8Þ
where [Ca2+] is estimated from salinity using the [Ca2+]/salinity ratio of 0.00029377 [Riley and Tongudai, 1967],and [CO3
2�] is calculated from AT and CT using the pressure-corrected thermodynamic constants that are consistent withthe calibrated global field data [Lee et al., 2000; Millero etal., 2002]. These constants include the carbonic aciddissociation constants of Mehrbach et al. [1973] as refittedby Dickson and Millero [1987] and other ancillary constantsas suggested by Millero [1995]. The effect of pressure onthese dissociation constants has been estimated from partialmolal volume and compressibility data [Millero, 1995]. Thevalues of K*sp were taken from Mucci [1983] at a giventemperature and salinity at 1 atmosphere; the effect ofpressure on K*sp was also estimated from partial molalvolume and compressibility data [Millero, 1995]. Thepreindustrial saturation horizons with respect to aragoniteand calcite were calculated using measured AT and
Figure 3. Temperature-salinity diagram for all East Seadata points for which anthropogenic CO2 can be estimated.Data within the four ovals were used to define the chemicalproperties of the four source waters (see Table 2 for asummary of results).
Table 2. Properties of the Four Source Waters Identified in the East Sea
Identification Latitude q SD (q) S SD (S) O2 SD (O2) PO4 SD (PO4) NO3 SD (NO3) Si SD (Si) DCDISEQ SD (DCDISEQ)
A 40.30 0.18 0.12 34.07 0.01 214.72 6.90 1.99 0.06 25.12 0.62 71.06 12.79 8.84 3.02B 38.67 9.20 0.98 34.13 0.04 260.22 5.97 0.52 0.10 6.90 1.30 8.72 2.10 �24.67 5.17C 42.88 1.14 0.25 34.09 0.00 281.49 17.36 1.36 0.17 17.35 2.20 28.56 5.04 2.00 2.20D 40.80 1.71 1.00 34.03 0.05 282.39 24.65 1.18 0.32 14.96 4.25 23.04 6.97 0.42 4.27
GB4013 PARK ET AL.: ANTHROPOGENIC CO2 IN THE EAST SEA
5 of 13
GB4013

preindustrial CT, which was estimated by subtracting CANT
from CTCAL.
3. Results and Discussion
3.1. Distribution of Carbon Parameters (AT, CT, andpH)
[16] Salinity is the dominant factor that affects AT inthe surface mixed layer of the oceans [Millero et al.,1998; Lee et al., 2006]. The highest values of surfacewater AT (�2270 mmol kg�1) are found in the southernEast Sea (36�N�40�N) where salinity maxima as high asS > 34.2 are observed (Figure 4a). These salinity maximaextend to the subarctic polar front (near 40�N), which isformed from the interaction of subpolar water that orig-inates from the northern part of the East Sea andsubtropical water that flows into the East Sea throughthe Korea Strait [e.g., Legeckis, 1978; Kim et al., 2001;
Tishchenko et al., 2003]. From the Korea Strait to thenorthwestern part of the East Sea, salinity and AT
decrease to S = 33.0�34.0 and AT = 2250�2260 mmolkg�1, respectively (Figures 4a and 4c). The surface waterCT concentration is also greatly affected by factors thatinfluence salinity, as is surface water AT [Lee et al.,2000]. Biological activities also generate variations insurface water AT in the East Sea; however, the magnitudeof such biologically induced changes in AT is likely to benegligible [Kim et al., 2006] because calcifying organisms,which are the dominant biological contributors to AT, arerarely found in the East Sea [Kang and Choi, 2002].Biological activities affect CT to a significantly greaterextent than they affect surface water AT.[17] The values of AT and CT (as well as NAT = AT
34.07/S and NCT = CT 34.07/S, S = 34.07 was chosen asthe mean salinity of the East Sea) increase gradually withdepth up to 2500 m and 2000 m, respectively (Figures 4c
Figure 4. Meridional sections of (a) salinity, (b) pH, (c) total alkalinity (AT), (d) total dissolvedinorganic carbon (CT), (e) salinity (S = 34.07)-normalized total alkalinity (NAT = AT 34.07/S), and(f) salinity (S = 34.07)-normalized total dissolved inorganic carbon (NCT = CT 34.07/S) nominallyalong 134�E in the East Sea. Dots indicate locations of measured data. The inset in Figure 4a shows thepath of the cruise track.
GB4013 PARK ET AL.: ANTHROPOGENIC CO2 IN THE EAST SEA
6 of 13
GB4013

and 4d). For waters deeper than these depths, AT and CT
remain almost constant to the ocean floor. To a first orderapproximation, a 15 mmol kg�1 increase in NAT with depthis probably related to the dissolution of CaCO3 particleswithin the water column or from sediments, whereas a90 mmol kg�1 increase in NCT with depth is related to boththe dissolution of CaCO3 and the oxidation of organic matter(Figures 4e and 4f). Thus, given that a 15 mmol kg�1
increase in AT is equivalent to an increase in CT of approx-imately 7.5 mmol kg�1, the relative contribution of organicmatter and biogenic CaCO3 to observed CT increase in theEast Sea is approximately 11:1. This ratio of 11:1 isapproximately consistent with the global rain ratio of organicmatter and CaCO3 at the bottom of the seasonal mixed layer[Lee, 2001; Sarmiento et al., 2002].[18] The pH at 25�C in the East Sea decreases from 7.92
at the surface to 7.45 at 1000 m and then remains approx-imately constant for deeper waters (Figure 4b). Oxidation oforganic matter within the water column is the main controlon the vertical distribution of pH in the East Sea. Theconstant pH observed throughout the water column below1000 m suggests that negligible organic matter is presentbelow this depth and that any decrease in pH related to theoxidation of organic matter buried in the seafloor sedimentis also negligible.
3.2. Air-Sea Disequilibrium (DCDISEQ)
[19] The mean air-sea disequilibrium values for the fourtypes of source water are summarized in Table 2. Sourcewater A probably forms during winter cooling in regions ofrelatively high latitude (40�N�42�N and 132�E�133�E)near Peter the Great Bay off Vladivostok, Russia. Sourcewater A has a positive DCDISEQ value, suggesting that itwas slightly supersaturated with respect to atmosphericfCO2 when it formed at the surface during wintertime. Deepconvective mixing with subsurface waters during winter-time cooling would bring deep CO2-rich waters to thesurface and cause the surface water fCO2 value to increaseabove the atmospheric fCO2 level. During wintertimeobservations of the air-sea difference of fCO2 (DfCO2 =fCO2AIR � fCO2SEA) in the East Sea [Oh et al., 1999;Tishchenko et al., 2003], negative DfCO2 values (which areconsistent with positive DCDISEQ values) were observed offVladivostok in the northern part of the East Sea, wheresource water A probably forms. This positive DCDISEQ
value for source water A in the region of deep waterformation stands in contrast to the negative DCDISEQ valueof �16 mmol kg�1 previously reported for North AtlanticDeep Water [Gruber, 1998; Lee et al., 2003]. This negativevalue ofDCDISEQ implies that the surface waters in the deepwater formation region of the North Atlantic are undersat-urated with respect to atmospheric fCO2.[20] Source water B, which has a DCDISEQ value of
�25 mmol kg�1, is found in the southern part of the EastSea. The negative DCDISEQ value is explained by thefollowing mechanism. A branch of the Tsushima warmcurrent flows into the East Sea through the Korea Straitand then continues northward along the east coast ofKorea as a western boundary current. During its north-ward movement, the warm water continues to interact
with cooler air and consequently cools considerably. Thistemperature decrease causes the fCO2 of the surface waterto drop below the atmospheric fCO2 level, which wouldlikely result in a negative DCDISEQ value for sourcewater B. Active photosynthesis also contributes to therecorded decrease in the surface water fCO2 in this area[Kim et al., 2001; Gamo et al., 2001; Min and Warner,2005]. The other two source waters, C and D, haveapproximately neutral DCDISEQ values. These two sourcewaters probably correspond to the High Salinity IntermediateWater and East Sea Intermediate Water typically found atapproximately 200�300 m depth in the Japan Basin [Kimet al., 2004].
3.3. Distribution of Anthropogenic CO2
[21] Figures 5a and 5b show the meridional and zonaldistributions of anthropogenic CO2 in the East Sea. Thehighest concentrations of anthropogenic CO2 (typically50�60 mmol kg�1) are found in the upper waters of thesouthern East Sea. In the southern East Sea, verticalmixing of surface waters and subsurface waters is limitedby strongly developed stratification that leads to highervalues of anthropogenic CO2 in the upper waters. In thenorthern East Sea, however, surface waters mix to a greatextent with old waters that contain lower concentrations ofanthropogenic CO2, thus lowering the anthropogenic CO2
concentration of the upper waters.[22] Anthropogenic CO2 generally penetrates to the
bottom of the entire basin of the East Sea, and itsconcentration in deep waters near the bottom reachesapproximately 10�15 mmol kg�1. pCFC-12 tracer agesof deep waters that contain 10�15 mmol kg�1 of anthro-pogenic CO2 are approximately 40 years old (dotted linesin Figures 5c and 5d). There is a similarity in themeridional and zonal distributions of anthropogenic CO2
concentration and pCFC-12 (Figures 5a–5d), because bothanthropogenic gases penetrate to deep water levels viadeep water formation. Deep water formation effectivelytransports surface waters loaded with anthropogenic gasesto the interior of the basin during the winter coolingperiod. This transport mechanism is similar to that oper-ating in the North Atlantic, where anthropogenic CO2
reaches depths greater than 3000 m [Lee et al., 2003]. Incontrast, anthropogenic CO2 at the same latitude in the NorthPacific Ocean does not penetrate beyond 1500 m, largelydue to a lack of deep water formation [Sabine et al., 2002].
3.4. Inventory of Anthropogenic CO2
[23] The inventory of anthropogenic CO2 (TOTAL �CANT) for each 2.5� latitude 2.5� longitude grid elementwas determined by integrating the area-weighted meanprofile of CANT (f � CANT) from the surface (SFC) to themean bottom depth (MEAN),
TOTAL� CANT ¼ZMEAN
SFC
A f�CANTdz; ð9Þ
where A (m2) is the area of each 2.5� latitude 2.5�longitude grid element. The estimated inventories for each
GB4013 PARK ET AL.: ANTHROPOGENIC CO2 IN THE EAST SEA
7 of 13
GB4013

of the grid elements were then summed to produce thebasin-wide inventory of anthropogenic CO2. The totalamount of anthropogenic CO2 that has accumulated in theEast Sea between 1800 and 1999 is equal to 0.51 petagramsof carbon (Pg C, Pg = 1015 g), which is just 0.01 Pg C morethan the inventory obtained without correction for pCFC-12age bias related to the 20% undersaturation of CFC-12observed in the wintertime outcrop regions.[24] The highest specific column inventory (TOTAL �
CANT divided by the area of each 2.5� latitude 2.5�longitude grid element; moles of anthropogenic CO2
per m2) is observed in the Japan Basin between 40�N and44�N, and between 131�E and 139�E, with a mean value of80 mol C m�2 (Figure 6). This figure is much higher thanthe 20�30 mol C m�2 observed in the adjacent NorthPacific [Sabine et al., 2002]. The high specific columninventory in the East Sea compared to that at the samelatitude band in the North Pacific can be attributed to thesinking of newly formed water into the interior that containssignificant quantities of anthropogenic CO2. Such deepwater formation was observed south of Vladivostok in thecold winter of 2001 [Kim et al., 2002; Talley et al., 2003].Brine rejection into adjacent waters during the formation ofsea ice resulted in dense surface waters that subsequentlysank into the interior of the basin [Talley et al., 2003].Within the Japan Basin, the specific column inventories inthe central and western areas are lower than those in the
eastern area despite the fact that the deep water formationprocess is more active in the central and western parts of theJapan Basin. This pattern is directly attributable to the lowervolumes of waters in the central and western basins com-pared to the eastern basin.[25] We identified two key sources of systematic errors
that could potentially have biased our estimation of anthro-pogenic CO2 inventory. The first source of error arises frominaccuracies in the assumed value of the constant air-seadisequilibrium used in the DC* approach. This bias resultsin an overestimation of anthropogenic CO2 in the youngerwaters that occupy much of the interior of the East Sea. Wecorrect for this bias in the East Sea using the procedureproposed by Matsumoto and Gruber [2005], whereby theanthropogenic CO2 inventory of 0.51 Pg C should be scaleddown by approximately 14%. The second source of error isa pCFC-12 age bias related to the nonlinear mixing ofwaters of different ages. Although it is not possible toestimate the exact magnitude of this error, various modelingstudies indicate that pCFC-12 based ages are 5�10 yearsyounger than true ages, with the magnitude of the age biasbeing dependent on the degree of mixing in the interior[Matsumoto and Gruber, 2005; Hall et al., 2002, 2004;Waugh et al., 2004]. If this age bias is properly corrected,the revised inventory should be scaled down by approxi-mately 8%. Considering these two corrections together, theinventory should be scaled down to as low as 0.40 Pg.
Figure 5. (a, c) Meridional and (b, d) zonal sections of anthropogenic CO2 and pCFC-12 nominallyalong 134�E and 38�N in the East Sea, respectively. Deep waters near the bottom (�3500 m depth) of theJapan Basin contain approximately 10–15 mmol kg�1 of anthropogenic CO2. Dotted lines representwater masses of approximately 40 years in age. Anthropogenic CO2 concentrations are not scaled downbecause corrections for the key systematic errors (inaccuracies in the assumption of the constant air-seadisequilibrium and the pCFC-12 age bias) differ for different water masses.
GB4013 PARK ET AL.: ANTHROPOGENIC CO2 IN THE EAST SEA
8 of 13
GB4013
[26] There are two additional sources of errors: uncertaintyin the precision of various measurements required for thecalculation of anthropogenic CO2, and uncertainties in theend-member disequilibrium values. The propagationof measurement errors indicates that any anthropogenicCO2 estimate in the East Sea has an uncertainty of±7.3 mmol kg�1; however, this random error should largelycancel out. Approximate upper (or lower) estimates ofDCDISEQ for each data point were calculated by increasing(or decreasing) the mean DCDISEQ value by the standarddeviation of the mean value for each source-water type. Thisanalysis yielded an error of ±0.06 Pg C in anthropogenicCO2 inventory. Lee et al. [2003] applied this error estimationmethod to the Atlantic Ocean.
3.5. Uptake of Anthropogenic CO2 Over the Period1992 to 1999
[27] In conjunction with anthropogenic CO2 results pre-sented in this paper, results estimated from the AT and CT
data sets collected during the Kuroshio Edge ExchangeProcesses-Marginal Sea Studies Expedition in the EastSea (July 28 to August 5, 1992) [Chen et al., 1995] provide
an opportunity to calculate the increase of anthropogenicCO2 inventory over the 7-year period from 1992 to 1999.We used the isopycnal method to calculate the totalanthropogenic CO2 that accumulated in the East Sea overthe 7-year period. This method was used previously todetermine decadal rates of anthropogenic CO2 uptake inthe Indian and Pacific Oceans [Peng et al., 1998, 2003].The method directly compares CT values measured at thesame geographic location at two different times aftercorrecting for CO2 changes related to the oxidation oforganic matter, dissolution of calcium carbonate, andvariations in salinity. The net increase in corrected CT
at a selected isopycnal surface is assumed to represent theamount of anthropogenic CO2 taken up during the timeinterval between the two different measurement dates.[28] We only determined the anthropogenic CO2 taken up
by the East Sea and stored for the 7-year period for theJapan Basin owing to a lack of inorganic carbon datacollected during the 1992 cruise. In comparing the 1992and 1999 data, we found that the 1992 data containssystematic errors of 21 mmol kg�1 in AT, 13 mmol kg�1
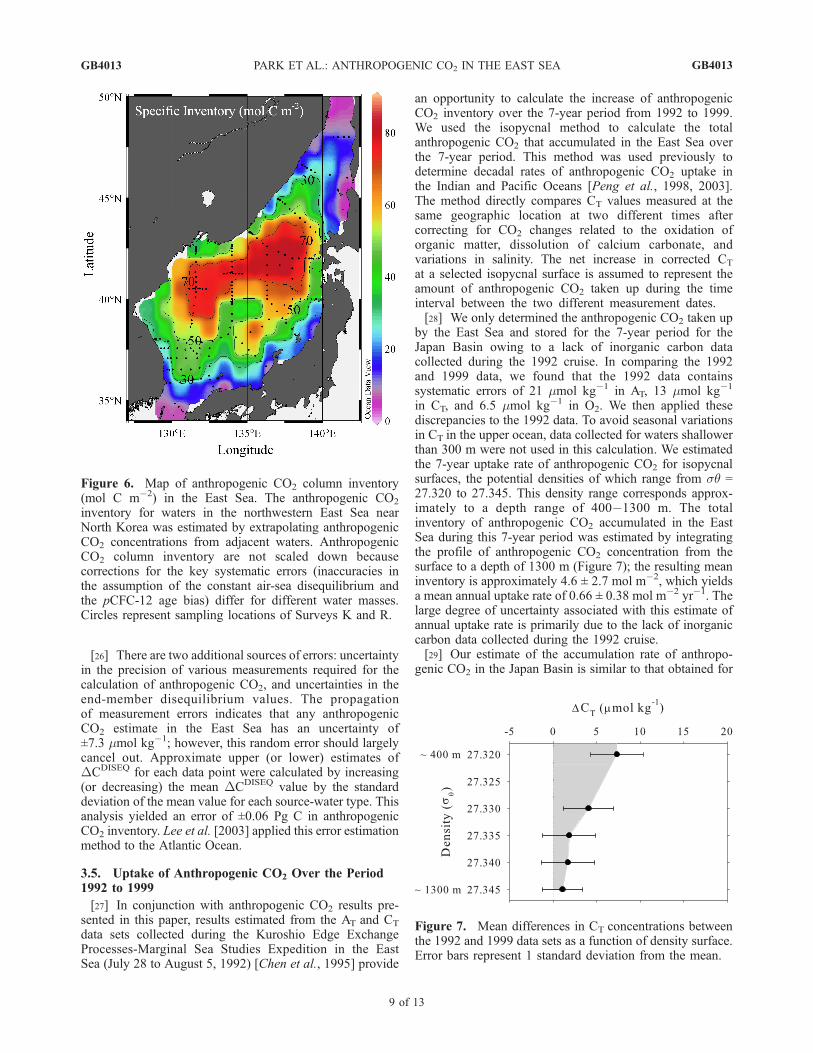
in CT, and 6.5 mmol kg�1 in O2. We then applied thesediscrepancies to the 1992 data. To avoid seasonal variationsin CT in the upper ocean, data collected for waters shallowerthan 300 m were not used in this calculation. We estimatedthe 7-year uptake rate of anthropogenic CO2 for isopycnalsurfaces, the potential densities of which range from sq =27.320 to 27.345. This density range corresponds approx-imately to a depth range of 400�1300 m. The totalinventory of anthropogenic CO2 accumulated in the EastSea during this 7-year period was estimated by integratingthe profile of anthropogenic CO2 concentration from thesurface to a depth of 1300 m (Figure 7); the resulting meaninventory is approximately 4.6 ± 2.7 mol m�2, which yieldsa mean annual uptake rate of 0.66 ± 0.38 mol m�2 yr�1. Thelarge degree of uncertainty associated with this estimate ofannual uptake rate is primarily due to the lack of inorganiccarbon data collected during the 1992 cruise.[29] Our estimate of the accumulation rate of anthropo-
genic CO2 in the Japan Basin is similar to that obtained for
Figure 6. Map of anthropogenic CO2 column inventory(mol C m�2) in the East Sea. The anthropogenic CO2
inventory for waters in the northwestern East Sea nearNorth Korea was estimated by extrapolating anthropogenicCO2 concentrations from adjacent waters. AnthropogenicCO2 column inventory are not scaled down becausecorrections for the key systematic errors (inaccuracies inthe assumption of the constant air-sea disequilibrium andthe pCFC-12 age bias) differ for different water masses.Circles represent sampling locations of Surveys K and R.
Figure 7. Mean differences in CT concentrations betweenthe 1992 and 1999 data sets as a function of density surface.Error bars represent 1 standard deviation from the mean.
GB4013 PARK ET AL.: ANTHROPOGENIC CO2 IN THE EAST SEA
9 of 13
GB4013

the northeast Pacific using the same isopycnal method[Peng et al., 2003], despite the much higher specific columninventory recorded in the East Sea compared to the NorthPacific. This similarity probably reflects a weakening ofdeep water formation in the East Sea during the 1990s.Several previous studies suggest that deep water formationin the East Sea has weakened over the past several decades,resulting in outcrop waters being fed into the intermediatelayer rather than the deep layer [Kim and Kim, 1996; Gamoet al., 2001; Kim et al., 2001, 1999, 2002; Talley et al.,2003]. This weakening, which has been attributed to globalwarming [Kim and Kim, 1996; Gamo et al., 2001], couldlead to reduced efficiency in the transport of anthropogenicCO2 to the interior of the East Sea. A similar decrease in theintensity of bottom water formation has also been observedfor the North Atlantic Ocean [Wood et al., 1999; Hansen etal., 2001]. Such variations in the intensity of deep waterformation and turnover time could potentially affect thesequestration of anthropogenic CO2 by the oceans.
3.6. Comparisons With Other Marginal Seas
[30] Deep water formation occurs in various marginalseas, including the Arctic Ocean, East Sea, Labrador Sea,Mediterranean Sea, Okhotsk Sea, and Weddell Sea. Ofthese, the Sea of Okhotsk is a subpolar marginal sea located
northeast of the East Sea and contains the southernmostregion of sea ice in the Northern Hemisphere. In theOkhotsk Sea, dense water produced as a result of brinerejection during the formation of sea ice is fed into theintermediate layer of the North Pacific [e.g., Talley, 1991;Yasuda, 1997; Shcherbina et al., 2003]. This dense watercarries some of the anthropogenic CO2 taken up by thesurface of the Okhotsk Sea. In contrast, there is only alimited exchange of waters between the East Sea and theNorth Pacific; hence, CO2 taken up by the surface of theEast Sea continuously accumulates at that site. These differ-ences in deep water circulation patterns are the likelyexplanation for the fact that the annual accumulation rateof anthropogenic CO2 in the Okhotsk Sea, which has beenestimated to be 0.78 10�3 Pg C yr�1 [Wakita et al., 2003],is significantly lower than the rate of 1.6 10�3 Pg C yr�1
recorded in the East Sea.[31] In contrast, deep water formation in the abyssal
Weddell Sea is believed to be less important with respectto the accumulation rate of anthropogenic CO2 [Hoppema etal., 2001; Poisson and Chen, 1987]. The concentration ofanthropogenic CO2 in the Weddell Sea falls sharply below5 mmol kg�1 at a depth of about 500 m [Hoppema et al.,2001]. The shallower penetration and lower inventory ofanthropogenic CO2 in this sea is attributed to variousfactors. One of these factors is the limited exchange ofCO2 at the air-sea interface because of the fact that sea-icecovers the surface for much of the year, inhibiting air-seaCO2 exchange and allowing only a short residence time fornewly formed deep waters to absorb anthropogenic CO2
from the atmosphere [Caldeira and Duffy, 2000; Hoppemaet al., 2001]. A second factor is the significant dilution ofanthropogenic CO2 by mixing with old Weddell DeepWater, which is poor in anthropogenic CO2 [Poisson andChen, 1987; Hoppema et al., 2001].[32] Until recently, the Arctic Ocean was believed to be
an insignificant sink of anthropogenic CO2 because much ofthe basin surface is covered with sea ice. However, a recentman-made tracer-based modeling study [Anderson et al.,1998] indicated the active ventilation of intermediate waterin the Arctic Ocean, through which a considerable amountof anthropogenic CO2 is believed to be absorbed. On thebasis of the results of this previous study, the meaninventory of anthropogenic CO2 per unit area of the ArcticOcean in the 1990s was estimated to be approximately360 g C m�2 [Anderson et al., 1998], which is similar tothe value of 400 g C m�2 determined for the East Sea.
3.7. Upward Displacement of the Aragonite andCalcite Saturation Horizons
[33] Because some of the protons generated from thedissolution of anthropogenic CO2 in seawater react withcarbonate ions to form bicarbonate ions, the invasion ofanthropogenic CO2 into the ocean results in a decrease inthe concentration of carbonate ion, which in turn acts toreduce the saturation states of seawater with respect toaragonite and calcite. The saturation horizons (W = 1) foraragonite and calcite in the East Sea for both present(solid lines) and preindustrial (dotted lines) levels areshown in Figure 8. The degree of saturation decreases
Figure 8. Meridional distributions of the degree ofseawater saturation with respect to (a) aragonite and(b) calcite at the present day (solid lines), nominally along134�E in the East Sea. The dotted lines denote the aragoniteand calcite saturation horizons (W = 1) during thepreindustrial era. The inset in Figure 8a shows the path ofthe cruise track.
GB4013 PARK ET AL.: ANTHROPOGENIC CO2 IN THE EAST SEA
10 of 13
GB4013

with depth because the solubility of aragonite and calcitegenerally increases with depth [Mucci, 1983]. The present-day saturation horizons of aragonite and calcite in the EastSea are located at depths of approximately 400 m and1000 m, respectively. The depth of the aragonite saturationhorizon in the East Sea is similar to that in the adjacentPacific Ocean [Feely et al., 2002]. In contrast, the saturationhorizon for calcite is approximately 300�600 m deeper inthe East Sea than that at the same latitude band in the NorthPacific.[34] Since the preindustrial era, the saturation horizons for
aragonite and calcite in the East Sea have moved upward byapproximately 80�220 m and 500�700 m, respectively,across the entire basin (Figure 8). These upward migrationsof the saturation horizons are significantly greater than thoseobserved for the same latitude band of the North Pacific(i.e., 40�50 m for aragonite and 100�150 m for calcite)[Feely et al., 2002, 2004]. The greater upward shift of thesaturation horizons in the East Sea compared to the NorthPacific can be attributed to two main factors: the deeperpenetration of anthropogenic CO2 in the East Sea, and asignificantly smaller vertical gradient in the degree ofaragonite and calcite saturation in the East Sea. The interiorof the East Sea at depths greater than 800 m has almostuniform aragonite and calcite saturation states throughout,with variation in the aragonite saturation state between1000 m and 3500 m depth of slightly more than W = 0.5and equivalent variation for calcite of W = 0.5. As a result, agiven amount of anthropogenic CO2 will have a moreprofoundly affect on the aragonite and calcite saturationstates in the East Sea than on those in the North Pacific. Inthe North Pacific, there is a significant vertical gradient inthe degree of saturation of seawater with aragonite andcalcite. Taken together, the above factors cause thearagonite and calcite saturation horizons in the East Seato migrate upward to a significantly greater extent thanthose observed in other major basins of the global ocean.
4. Conclusions
[35] In this study, we estimated the anthropogenic CO2
inventory in the East Sea using a high-quality inorganiccarbon data set collected during a comprehensive surveyconducted in the summer of 1999. The distribution ofanthropogenic CO2 in the East Sea shows features that areconsistent with the distributions found in other major basinswithin which deep water formation occurs (e.g., the NorthAtlantic); most notably, high column inventories of anthro-pogenic CO2 were observed in the region of deep waterformation near Peter the Great Bay off Vladivostok, Russia.The deep water formation process effectively carries an-thropogenic CO2 into the interior of the East Sea. Inparticular, the specific column inventory of anthropogenicCO2 in the East Sea is two to three times greater than thatin the North Pacific, in which only intermediate waterformation occurs.[36] The substantial accumulation of anthropogenic CO2
in the East Sea has caused a significant change in thecarbonate chemistry of the sea. In particular, the anthropo-genic CO2-induced upward movement of the saturation
horizons for aragonite and calcite is significantly greaterin the East Sea than in other major basins. This notablechange in carbonate chemistry is likely driven by twounique characteristics of the East Sea: a fast turnover time(<100 years), which is directly related to active deep waterformation; and a small dynamic range of temperature andsalinity, which is one to two orders of magnitude smallerthan the ranges found in the major oceans. This smalldegree of vertical variability suggests that the water columnin the East Sea is relatively unstable. As a result, minordisturbances in the global or regional climate system willpotentially change the intensity of deep water formation[Kim and Kim, 1996], which directly affects the uptake ofanthropogenic CO2 by the East Sea. Regular monitoring ofcarbon and hydrographic parameters in the East Sea willtherefore provide information on variations that may occurin the global ocean at much longer time scales. In this way,the East Sea can serve as a site for monitoring decadalvariability in oceanic CO2 uptake.
[37] Acknowledgments. We are indebted to the hard work of thecaptains and crews of the R/V Revelle and Khromov, and scientificpersonnel from SIO/ODF, FEHRHI, and POI. The field work wasfinancially supported by the U.S. Office of Naval Research (LDT), byU.S. National Science Foundation (MW), and by Russia Academy ofScience (PT). The analysis of data and the preparation of the manuscriptwere supported by the National Research Laboratory (NRL) Program ofthe Korean Science and Engineering Foundation (KOSEF). Partial supportwas also provided by the Advanced Environmental Biotechnology Re-search Center (AEBRC) at POSTECH, the Korea Aerospace ResearchInstitute, the Brain Korea 21 project, the KOSEF (R01-2002-000-00549-0,2004), the Ministry of Education and Human Resources Development(MOEHRD) (KRF-2005-070-C00143), the Korea Polar Research Institutethrough a study on Arctic Environmental Characteristics (PE06030), theMinistry of Maritime Affairs and Fisheries (the Korea EAST-1 Program)(K.-R. Kim), and the Korea Meteorological Administration Research andDevelopment Program under grant CATER 2006-4101 (K.-R. Kim).
ReferencesAnderson, L. A., and J. L. Sarmiento (1994), Redfield ratios of reminer-alization determined by nutrient data analysis, Global Biogeochem.Cycles, 8, 65–80.
Anderson, L. G., K. Olsson, E. P. Jones, M. Chierici, and A. Fransson(1998), Anthropogenic carbon dioxide in the Arctic Ocean: Inventoryand sinks, J. Geophys. Res., 103, 27,707–27,716.
Broecker, W. S. (1974), ‘NO’, a conservative water-mass tracer, EarthPlanet. Sci. Lett., 23, 100–107.
Bruevich, S. V. (1944), Determination of alkalinity in small volumes ofseawater by direct titration, in Instruction of Chemical Examination ofSeawater, p. 83, Glavsevmorput, Moscow.
Caldeira, K., and P. B. Duffy (2000), The role of the Southern Ocean inuptake and storage of anthropogenic carbon dioxide, Science, 287, 620–622.
Chen, C.-T. A., S.-L. Wang, and A. S. Bychkov (1995), Carbonate chem-istry of the Sea of Japan, J. Geophys. Res., 100, 13,737–13,745.
Dickson, A. G. (1984), pH scales and proton-transfer reactions inproton-transfer reactions in saline media such as seawater, Geochim.Cosmochim. Acta, 48, 2299–2308.
Dickson, A. G., and F. J. Millero (1987), A comparison of the equilibriumconstants for the dissociation of carbonic acid in seawater media, DeepSea Res., Part I, 34, 1733–1743.
Dickson, A. G., and J. P. Riley (1979), The estimation of acid dissociationconstants in seawater from potentiometric titrations with strong base: II.The dissociation of phosphoric acid, Mar. Chem., 7, 101–109.
Feely, R. A., et al. (2002), In situ calcium carbonate dissolution in thePacific Ocean, Global Biogeochem. Cycles, 16(4), 1144, doi:10.1029/2002GB001866.
Feely, R. A., C. L. Sabine, K. Lee, W. Berelson, J. Kleypas, V. J. Fabry, andF. J. Millero (2004), Impact of anthropogenic CO2 on the CaCO3 systemin the oceans, Science, 305, 362–366.
GB4013 PARK ET AL.: ANTHROPOGENIC CO2 IN THE EAST SEA
11 of 13
GB4013

Gamo, T., N. Momoshima, and S. Tolmachyov (2001), Recent upward shiftof the deep convection system in the Japan Sea, as inferred from thegeochemical tracers tritium, oxygen, and nutrients, Geophys. Res. Lett.,28, 4143–4146.
Gruber, N. (1998), Anthropogenic CO2 in the Atlantic Ocean, GlobalBiogeochem. Cycles, 12, 165–191.
Gruber, N., J. L. Sarmiento, and T. F. Stocker (1996), An improved methodfor detecting anthropogenic CO2 in the oceans, Global Biogeochem.Cycles, 10, 809–837.
Hall, T. M., T. W. N. Haine, and D. W. Waugh (2002), Inferring the con-centration of anthropogenic carbon in the ocean from tracers, GlobalBiogeochem. Cycles, 16(4), 1131, doi:10.1029/2001GB001835.
Hall, T. M., D. W. Waugh, T. W. N. Haine, P. E. Robbins, andS. Khatiwala (2004), Estimates of anthropogenic carbon in the IndianOcean with allowance for mixing and time-varying air-sea CO2
disequilibrium, Global Biogeochem. Cycles, 18, GB1031, doi:10.1029/2003GB002120.
Hansen, B., W. R. Turrell, and S. Osterhus (2001), Decreasing overflowfrom the Nordic seas into the Atlantic Ocean through the Faroe Bankchannel since 1950, Nature, 411, 927–930.
Hansson, I. (1973), A new set of pH-scales and standard buffers for sea-water, Deep Sea Res., 20, 479–491.
Hoppema, M., W. Roether, R. G. J. Bellerby, and H. J. W. d. Baar (2001),Direct measurements reveal insignificant storage of anthropogenic CO2
in the abyssal Weddell Sea, Geophys. Res. Lett., 28, 1747–1750.Kang, Y. S., and J. K. Choi (2002), Ecological characteristics of phyto-plankton communities in the coastal waters of Gori, Wolseong, Uljinand Younggwang II. Distributions of standing crops and environmentalvariables (1992–1996) (in Korean), J. Kor Soc. Oceanogr., 7, 108–128.
Kawamura, H., and P. Wu (1998), Formation mechanism of Japan SeaProper Water in the flux center off Vladivostok, J. Geophys. Res., 103,21,611–21,622.
Kim, H.-C., K. Lee, and W. Choi (2006), Contribution of phytoplanktonand bacterial cells to the measured alkalinity of seawater, Limnol.Oceanogr, 51, 331–338.
Kim, K., et al. (1996), New finding from CREAMS observations:Water masses and eddies in the East Sea, J. Kor. Soc. Oceanogr., 31,155–163.
Kim, K., K.-R. Kim, D.-H. Min, Y. Volkov, J.-H. Yoon, and M. Takematsu(2001), Warming and structural changes in the East (Japan) Sea: A clueto future changes in global oceans?, Geophys. Res. Lett., 28, 3293–3296.
Kim, K., K.-R. Kim, Y.-G. Kim, Y.-K. Cho, D.-J. Kang, M. Takematsu, andY. Volkov (2004), Water masses and decadal variability in the East Sea(Sea of Japan), Prog. Oceanogr., 61, 157–174.
Kim, K.-R., and K. Kim (1996), What is happening in the East Sea (JapanSea)?: Recent chemical observations during CREAMS 93–96, J. Kor.Soc. Oceanogr., 31, 164–172.
Kim, K.-R., K. Kim, D.-J. Kang, S. Y. Park, M.-K. Park, Y.-G. Kim, H. S.Min, and D. Min (1999), The East Sea (Japan Sea) in change: A story ofdissolved oxygen, Mar. Technol. Soc. J., 33, 15–22.
Kim, K.-R., G. Kim, K. Kim, V. Lobanov, V. Ponomarev, and A. Salyuk(2002), A sudden bottom-water formation during the severe winter2000 –2001: The case of the East/Japan Sea, Geophys. Res. Lett.,29(8), 1234, doi:10.1029/2001GL014498.
Lamb, M. F., et al. (2002), Consistency and synthesis of Pacific Ocean CO2
survey data, Deep Sea Res., Part II, 49, 21–58.Lee, K. (2001), Global net community production estimated from annualcycle of surface water total dissolved inorganic carbon, Limnol.Oceanogr., 46, 1287–1297.
Lee, K., F. J. Millero, R. H. Byrne, R. A. Feely, and R. H. Wanninkhof(2000), The recommended dissociation constants of carbonic acid for usein seawater, Geophys. Res. Lett., 27, 229–232.
Lee, K., et al. (2003), An updated anthropogenic CO2 inventory in theAtlantic Ocean, Global Biogeochem. Cycles, 17(4), 1116, doi:10.1029/2003GB002067.
Lee, K., et al. (2006), Global relationships of total alkalinity with salinityand temperature in surface waters of the world’s oceans, Geophys. Res.Lett., 33, L19605, doi:10.1029/2006GL027207.
Legeckis, R. (1978), A survey of worldwide sea surface temperaturefronts detected by environmental satellites, J. Geophys. Res., 83,4501–4512.
Matsumoto, K., and N. Gruber (2005), How accurate is the estimationof anthropogenic carbon in the ocean? An evaluation of the DC*method, Global Biogeochem. Cycles, 19, GB3014, doi:10.1029/2004GB002397.
Mehrbach, C., C. H. Culberson, J. E. Hawley, and R. M. Pytkowicz(1973), Measurement of the apparent dissociation constants of carbo-
nic acid in seawater at atmospheric pressure, Limnol. Oceanogr., 18,897–907.
Millero, F. J. (1995), Thermodynamics of the carbon dioxide system in theoceans, Geochim. Cosmochim. Acta, 59, 661–677.
Millero, F. J., K. Lee, and M. Roche (1998), Distribution of alka-linity in the surface waters of the major oceans, Mar. Chem., 60,111–130.
Millero, F. J., D. Pierrot, K. Lee, R. Wanninkhof, R. A. Feely, C. L. Sabine,R. M. Key, and T. Takahashi (2002), Dissociation constants for carbonicacid determined from field measurements, Deep Sea Res., Part I, 49,1705–1723.
Min, D.-H., and M. J. Warner (2005), Basin-wide circulation and ventila-tion study in the East Sea (Sea of Japan) using chlorofluorocarbon tracers,Deep Sea Res., Part II, 52, 1580–1616.
Mucci, A. (1983), The solubility of calcite and aragonite in seawater atvarious salinities, temperatures and 1 atmosphere total pressure, Am.J. Sci., 238, 780–799.
Oh, D.-C., M.-K. Park, S.-H. Choi, D.-J. Kang, S. Y. Park, J. S. Hwang,A. Andreev, G. H. Hong, and K.-R. Kim (1999), The air-sea exchangeof CO2 in the East Sea (Japan Sea), J. Oceanogr., 55, 157–169.
Peng, T.-H., R. Wanninkhof, J. L. Bullister, R. A. Feely, and T. Takahashi(1998), Quantification of decadal anthropogenic CO2 uptake in theocean based on dissolved inorganic carbon measurements, Nature,396, 560–563.
Peng, T.-H., R. Wanninkhof, and R. A. Feely (2003), Increase of anthro-pogenic CO2 in the Pacific Ocean over the last two decades, Deep SeaRes., Part II, 50, 3065–3082.
Poisson, A., and C.-T. A. Chen (1987), Why is there little anthropogenicCO2 in the Antarctic Bottom Water?, Deep Sea Res., Part A, 34,1255–1275.
Riley, J. P., and M. Tongudai (1967), the major cation/chlorinity ratios insea water, Chem. Geol., 2, 263–269.
Sabine, C. L., et al. (2002), Distribution of anthropogenic CO2 in thePacific Ocean, Global Biogeochem. Cycles, 16(4), 1083, doi:10.1029/2001GB001639.
Sabine, C. L., R. M. Key, A. Kortzinger, R. A. Feely, R. Wanninkhof, F. J.Millero, T.-H. Peng, J. L. Bullister, and K. Lee (2005), Global oceandata analysis project (GLODAP): Results and data, ORNL/CDIAC-145,Carbon Dioxide Inf. Anal. Cent., Oak Ridge Natl. Lab., U.S. Dept. ofEnergy, Oak Ridge, Tenn.
Sarmiento, J. L., J. Dunne, A. Gnanadesikan, R. M. Key, K. Matsumoto,and R. Slater (2002), A new estimate of the CaCO3 to organic carbonexport ratio, Global Biogeochem. Cycles, 16(4), 1107, doi:10.1029/2002GB001919.
Senjyu, T., and H. Sudo (1993), Water characteristics and circulation of theupper portion of the Japan Sea proper water, J. Mar. Syst., 4, 349–362.
Shcherbina, A. Y., L. D. Talley, and D. L. Rudnick (2003), Directobservations of North Pacific ventilation: Brine rejection in the OkhotskSea, Science, 302, 1952–1955.
Talley, L. D. (1991), An Okhotsk Sea water anomaly: Implications forsub-thermocline ventilation in the North Pacific, Deep Sea Res., Part A,38, S171–S190.
Talley, L. D., V. Lobanov, V. Ponomarev, A. Salyuk, P. Tishchenko,and I. Zhabin (2003), Deep convection and brine rejection in theJapan Sea, Geophys. Res. Lett., 30(4), 1159, doi:10.1029/2002GL016451.
Talley, L. D., P. Tishchenko, V. Luchin, A. Nedashkovskiy, S. Sagalaev,D.-J. Kang, M. Warner, and D.-H. Min (2004), Atlas of Japan (East)Sea hydrographic properties in summer, 1999, Prog. Oceanogr., 61,277–348.
Thomas, H., Y. Bozec, K. Elkalay, and H. J. W. de Baar (2004), Enhancedopen ocean storage of CO2 from shelf sea pumping, Science, 304,1005–1008.
Tishchenko, P. Y., C. S. Wong, G. Y. Pavlova, W. K. Johnson, D.-J. Kang,and K.-R. Kim (2001), The measurements of pH values in seawater usinga cell without a liquid junction, Oceanology, 41, 813–822.
Tishchenko, P. Y., et al. (2003), Seasonal variability of the hydrochemicalconditions in the Sea of Japan, Oceanology, 43, 643–655.
Tsunogai, S., S. Watanabe, and T. Sato (1999), Is there a ‘‘continentalshelf pump’’ for the absorption atmospheric CO2?, Tellus, Ser. B, 51,701–712.
Uda, M. (1934), The results of simultaneous oceanographical investigationsin the Japan Sea and its adjacent waters in May and June, 1932 (inJapanese), J. Imp. Fish. Exp. Stn., 5, 57–190.
Wakita, M., Y. W. Watanabe, S. Watanabe, S. Noriki, and M. Wakatsuchi(2003), Oceanic uptake rate of anthropogenic CO2 in a subpolar marginalsea: The Sea of Okhotsk, Geophys. Res. Lett., 30(24), 2252, doi:10.1029/2003GL018057.
GB4013 PARK ET AL.: ANTHROPOGENIC CO2 IN THE EAST SEA
12 of 13
GB4013

Waugh, D. W., T. W. N. Haine, and T. M. Hall (2004), Transport times andanthropogenic carbon in the subpolar North Atlantic Ocean, Deep SeaRes., Part I, 51, 1475–1491.
Wood, R. A., A. B. Keen, J. F. B. Mitchell, and J. M. Gregory (1999),Changing spatial structure of the thermocline circulation in responseto atmospheric CO2 forcing in a climate model, Nature, 399, 572–575.
Yasuda, I. (1997), The origin of the North Pacific Intermediate Water,J. Geophys. Res., 102, 893–909.
�������������������������D.-J. Kang and K.-R. Kim, Research Institute of Oceanography, School
of Earth and Environmental Sciences (BK21), Seoul National University,Seoul, 151-742, South Korea.
K. Lee (corresponding author) and G.-H. Park, School of Environ-mental Science and Engineering, Pohang University of Science andTechnology, San 31, Hyoja-dong, Nam-gu, Pohang, 790-784, Korea.([email protected])D.-H. Min, Marine Science Institute, University of Texas at Austin, Port
Aransas, TX 78373, USA.L. D. Talley, Scripps Institution of Oceanography, University of
California, San Diego,La Jolla, CA 92037, USA.P. Tishchenko, Pacific Oceanological Institute, Far East Division, Russian
Academy of Sciences, Vladivostok, 690041 Russia.M. J. Warner, School of Oceanography, University of Washington,
Seattle, WA 98195, USA.
GB4013 PARK ET AL.: ANTHROPOGENIC CO2 IN THE EAST SEA
13 of 13
GB4013