Embed Size (px)
Citation preview
Laptops and Fourth-Grade Literacy:
Assisting the Jump over the Fourth-Grade Slump
Volume 9, Number 5 · January 2010
A publication of the Technology and Assessment Study CollaborativeCaroline A. & Peter S. Lynch School of Education, Boston College
www.jtla.org
Kurt A. Suhr, David A. Hernandez, Douglas Grimes, & Mark Warschauer
SPECiAL EDiTioN: EDuCATioNAL ouTCoMES & RESEARCH fRoM 1:1 CoMPuTiNG SETTiNGS
The Journal of Technology, Learning, and Assessment
Special Edition: Educational Outcomes and Research from 1:1 Computing Settings
Special Edition Editors: Damian Bebell [email protected] Laura M. O’Dwyer [email protected] Lynch School of Education, Boston College Chestnut Hill, MA 02467
This special issue of the Journal of Technology, Learning, and Assessment focuses on the educational impacts and outcomes of 1:1 computing initiatives and technology-
rich K–12 environments. Despite growing interest in and around 1:1 computing, little published research has focused on teaching and learning in these intensive computing environments. This special issue provides a forum for researchers to present empirical evidence on the effectiveness
of 1:1 computing models for improving teacher and student outcomes, and to discuss the methodological challenges and solutions for assessing the effectiveness of these emerging technology-rich educational settings.
Complete listing of papers published within the JTLA 1:1 Special Edition
Bebell, D. & O’Dwyer, L.M. (2010). Educational Outcomes and Research from 1:1 Computing Settings. Journal of Technology, Learning, and Assessment, 9(1).
Bebell, D. & Kay, R. (2010). One to One Computing: A Summary of the Quantitative Results from the Berkshire Wireless Learning Initiative. Journal of Technology, Learning, and Assessment, 9(2).
Drayton, B., Falk, J.K., Stroud, R., Hobbs, K., & Hammerman, J. (2010). After Installation: Ubiquitous Computing and High School Science in Three Experienced, High-Technology Schools. Journal of Technology, Learning, and Assessment, 9(3).
Shapley, K.S., Sheehan, D., Maloney, C., & Caranikas-Walker, F. (2010). Evaluating the Implementation Fidelity of Technology Immersion and its Relationship with Student Achievement. Journal of Technology, Learning, and Assessment, 9(4).
Suhr, K.A., Hernandez, D.A., Grimes, D., & Warschauer, M. (2010). Laptops and Fourth-Grade Literacy: Assisting the Jump over the Fourth-Grade Slump. Journal of Technology, Learning, and Assessment, 9(5).
Weston, M.E. & Bain, A. (2010). The End of Techno-Critique: The Naked Truth about 1:1 Laptop Initiatives and Educational Change. Journal of Technology, Learning, and Assessment, 9(6).
TO
ComPuTInGsettings
educational outcomes& research from
Volume 9 Number 5
Volume 9 Number 5
Laptops and Fourth-Grade Literacy: Assisting the Jump over the Fourth-Grade Slump
Kurt A. Suhr, David A. Hernandez, Douglas Grimes, & Mark Warschauer
Editor: Michael Russell [email protected] Technology and Assessment Study Collaborative Lynch School of Education, Boston College Chestnut Hill, MA 02467
Copy Editor: Jennifer Higgins Design: Thomas Hoffmann Layout: Aimee Levy
JTLA is a free on-line journal, published by the Technology and Assessment Study Collaborative, Caroline A. & Peter S. Lynch School of Education, Boston College.
Copyright ©2010 by the Journal of Technology, Learning, and Assessment (ISSN 1540-2525). Permission is hereby granted to copy any article provided that the Journal of Technology, Learning, and Assessment is credited and copies are not sold.
Preferred citation:
Suhr, K.A., Hernandez, D.A., Grimes, D., & Warschauer, M. (2010). Laptops and Fourth-Grade Literacy: Assisting the Jump over the Fourth-Grade Slump. Journal of Technology, Learning, and Assessment, 9(5). Retrieved [date] from http://www.jtla.org.
Abstract:
School districts throughout the country are considering how to best integrate technology into instruction. There has been a movement in many districts toward one-to-one laptop instruction, in which all students are provided a laptop computer, but there is concern that these programs may not yield sufficiently improved learning outcomes to justify their substantial cost. And while there has been a great deal of research on the use of laptops in schools, there is little quantitative research systematically investigating the impact of laptop use on test outcomes, and none among students at the fourth-to-fifth grade levels. This study investigated whether a one-to-one laptop program could help improve English language arts (ELA) test scores of upper elementary students, a group that often faces a slowdown of literacy development during the transition from learning to read to reading to learn known as the fourth-grade slump.
We explore these questions by comparing changes in the ELA test scores of a group of students who entered a one-to-one laptop program in the fourth-grade to a similar group of students in a traditional program in the same school district. After two years’ partici-pation in the program, laptop students outperformed non-laptop students on changes in the ELA total score and in the two subtests that correspond most closely to frequent laptop use: writing strategies and literary response and analysis.
Laptops and Fourth-Grade Literacy: Assisting the Jump over the Fourth-Grade Slump
Kurt A. Suhr Newport Heights Elementary School David A. Hernandez Walden University Douglas Grimes Software Consultant and Independent Researcher Mark Warschauer University of California, Irvine
IntroductionA substantial proportion of U.S. students suffer a deceleration in
reading skill development as they transition from the lower to upper grades of elementary school. During the 2003–2004 school year, some 30% of all fourth-grade public school students in the United States failed to attain grade-appropriate levels of reading proficiency on standardized tests (National Center for Educational Statistics, 2004). This fourth-grade slump (Chall & Jacobs, 2003) impairs students’ ability to achieve norms for reading progress through subsequent elementary and secondary school grades. As a consequence, cumulating deficits in academic literacy undercut learning performance across the curriculum.
The phenomenon of the fourth-grade slump is especially prevalent among low socioeconomic status (SES) students, where non-Whites are heavily over-represented. Children of more economically advantaged families score significantly higher on reading performance than their less advantaged peers at all ages, and this disparity between rich and poor students widens substantially in the fourth-grade (Chall & Jacobs, 2003). If, however, adjustments in the instructional program are made, particu-larly as children approach fourth-grade, “the typical slumps found in their reading achievement can be prevented” (Chall, Jacobs, & Baldwin, 1990, p. 149). One such adjustment is increased exposure to written texts that contain academic language children do not normally encounter in con-versational contexts, but which must be learned in order for students to
Laptops and Fourth-Grade Literacy Suhr, Hernandez, Grimes, & Warschauer,
6
J·T·L·A
maximize their cognitive abilities (Cummins, 2008). Cummins suggested computer-based technology can be harnessed to provide exposure to such texts, thus amplifying the development of academic language proficiency and ameliorating the fourth-grade slump.
The assumption that digital technology can serve as a means for enhancing student performance, including progress in reading ability at the start of the upper elementary grades, is widely held. Since 1996, fed-eral, state, and local agencies have invested more than ten billion dollars to acquire and integrate computer-based technologies into public schools (O’Dwyer, Russell, Bebell, & Tucker-Seeley, 2005). But while literally hun-dreds of empirical studies over the past three decades have investigated the impact of classroom computers upon student literacy, “the evalua-tion literature still seems patchy” (Kulik, 2003, p. ix). The purpose of this research, therefore, was to investigate the effects of a technology-intensive intervention – based upon individual student use of laptop computers – on students’ academic achievement in language arts over a two-year period.
In the remainder of this paper, we first present the relevant conceptual background, based on a discussion of the fourth-grade slump, technology and literacy, one-to-one school laptop programs, and standardized tests and student learning. We then present the methodology, findings, and implications of the study.
Fourth-Grade SlumpAmong students in all U.S. public schools, the pace of progress in reading
development slows substantially around the time that children reach the fourth-grade (Chall, 1983). From that point forward, reading development continues to occur, but at a much slower rate. Concurrent with a slump in reading, a parallel slump in student writing skills occurs (Chall et al., 1990). Chall and her colleagues (1990) developed a model for this fourth-grade slump based on her analysis of stages of reading development. The early stages of reading, correspondent to lower elementary grades, contain familiar, high-frequency words, whereas in later stages that begin in upper elementary grades, “the ideas and language become more abstract and more subtle and the vocabulary is less familiar. The change between these stages can be described as a transition from ‘learning to read to reading to learn’” (Chall et al., 1990, p. 11). Through this transition, children enter the “world of knowledge” in printed form, gaining access to “knowledge that can be acquired only if one knows how to read the texts that contain it” (Chall, 1983, p. 70). Thus children’s capacity to comprehend the sub-ject matter from upper elementary school on is heavily conditional upon success in this transition. And low-SES students have the most difficulty in making this transition.

Laptops and Fourth-Grade Literacy Suhr, Hernandez, Grimes, & Warschauer,
7
J·T·L·A
Chall’s model has been supported by her own longitudinal research (Chall et al., 1990) and by subsequent analysis of national data by a panel of prominent reading experts (Snow, Burns, & Griffin, 1998). Though not all reading researchers use the term “fourth-grade slump,” there is general recognition of the slowdown of reading progress in upper elemen-tary grades and the greater deceleration among students from low-SES backgrounds (for example, see Cummins, 2008; Daane, Campbell, Grigg, Goodman, & Oranje, 2005; Gee, 2004; Rand Reading Study Group, 2002). Factors discussed that contribute to this slowdown include an insufficient emphasis on “unconstrained reading skills” such as vocabulary and com-prehension in the early grades (Paris, 2005, p. 194) and lack of sufficient exposure to, and expertise in, academic vocabulary, syntax, and discourse by immigrant and low-SES students (Cummins, 2008; Gee, 2004).
Technology and LiteracyIt is widely believed that new technologies can contribute to improving
literacy instruction in U.S. schools, both in general and in ameliorating the fourth-grade slump (for example, see Cummins, 2008). New digital technologies, if used wisely, are believed to have the potential to expose students to a wide range of academic language; provide scaffolding so that students can comprehend challenging and interesting texts; engage stu-dents in text-based simulations that spark their interests and motivate their learning; and provide a wide range of tools for analyzing texts, brain-storming their ideas, organizing their thoughts, writing, peer editing, and publishing their work (for example, see Brown, Cummins, & Sayers, 2007; Gee, 2003; Warschauer, 2006). Research to date on technology and literacy, however, has been inconclusive. A study of reading tutorial pro-grams found no effect on students’ reading outcomes, due in part to poor implementation of the programs (Dynarski et al., 2007). A meta-analysis confirmed that such tutorial programs have had little effect, and suggests mixed, though generally more positive, results for uses of technology that involve student writing on computers (Kulik, 2003). A study by O’Dwyer and colleagues (2005) of fourth-grade students in nine school districts confirmed the value of computer use for writing. Students who reported greater frequency of technology use at school to edit their papers were likely to have higher total English language arts (ELA) test scores and higher writing scores on the Massachusetts Comprehensive Assessment System ELA test than students who used computers to edit papers less frequently or not at all (O’Dwyer et al., 2005).
Laptops and Fourth-Grade Literacy Suhr, Hernandez, Grimes, & Warschauer,
8
J·T·L·A
Laptops and LiteracyRegular writing and editing by computer, and many other desirable
uses of technology, require more regular access to computers than that afforded in the typical classroom. In recent years, an increasing number of school districts across the country are experimenting with one-to-one laptop programs, in which all the students are provided with individual laptops for use during the school day and, in many cases, at home (for an overview, see Warschauer, 2006). Studies suggest that the most frequent use of laptops in such programs occurs in their language arts classes, where students write papers with laptops, conduct online research, and other-wise use computer-based and online tools to work with texts (see Grimes & Warschauer, 2008; Silvernail & Lane, 2004; Warschauer, 2008).
Much of the initial research on laptop programs has been highly descriptive, explaining how students and teachers make use of laptops in instruction; illuminating the attitudes teachers, students, and parents have toward laptop programs; and portraying case studies of effective or ineffective laptop instruction in particular contexts (Harris & Smith, 2004; Russell, Bebell, & Higgins, 2004; Silvernail & Lane, 2004; Walker, Rockman, & Chessler, 2000; Warschauer, 2006, 2007; Warschauer, Grant, Del Real, & Rousseau, 2004). Many of these studies suggest that laptop use is particu-larly valuable in the language arts classroom, based on reports of students and teachers, amount and types of observed or recorded technology use, and qualitative analysis of student work. For example, based on student surveys, teacher surveys, observational techniques, and simulation tests, Rockman, Chessler, and Walker (1998a, 1998b) investigated the effects of laptop programs on a sample of 144 teachers and 450 middle school and high school students (7th and 10th graders) over a two-year interval and claimed that students with laptops submitted higher quality written compositions, wrote longer essays, revised the writing more frequently, showed greater interest in school, and exhibited enhanced learning and comprehension of instructional content. A study led by Warschauer (2006, 2008) included 650 hours of classroom observation; a survey of more than 900 students and teachers; interviews with 191 teachers, students, par-ents, and staff; and analysis of print and digital documents produced by schools, teachers, and students.
Laptops and Fourth-Grade Literacy Suhr, Hernandez, Grimes, & Warschauer,
9
J·T·L·A
The study concluded that, in laptop classes:
literacy processes became more public, collaborative, authentic, and iterative, with greater amounts of scaffolding and feedback provided. Literacy sources expanded to include a wealth of online materials, more student-collected data, and digital or audio archives of students’ own work. Literacy products extended beyond the essays and PowerPoint presentations that dominate typical schools to include a greater variety of textual and multimedia genres. All of these changes are in line with those often touted by technology enthusiasts but have previously not been regularly achieved through shared uses of educational computers. (Warschauer, 2008, p. 64)
Some recent studies have attempted to analyze the impact of one-to-one laptop use on literacy outcomes and test scores. Working with a sample of sixth- and seventh-grade Canadian students, Jeroski (2003) reported that one-to-one laptop access increased the proportion of students who met national writing performance standards from 70% to 92% in a single year; however, no control group data was reported. In the state of Maine, where all seventh- and eighth-grade students have been provided laptops since 2002, Silvernail and Gritter (2007) reported that statewide eighth-grade writing scores on the Maine Educational Assessment improved by approximately one third of a standard deviation over a three-year period; however, once again no control group was provided and no other possible causes of the improved test scores were analyzed. Reading test scores in Maine over the same period showed no significant change. A study by Gulek and Demirtas (2005) compared a laptop cohort with a demographi-cally similar group of non-laptop students at a California middle school and reported a wide range of positive outcome data for the laptop students in grade point average, writing test scores, and state standardized tests. However, these differences may have been due to students’ self-selection into the laptop program. Lowther, Ross, and Morrison (2003) reported stronger test scores in writing and problem-solving among sixth- and sev-enth-grade laptop students compared to non-laptop students. In this case, though, students not only self-selected into the laptop program, but had to pay a fee to do so, suggesting there may have been differences between the laptop and non-laptop group.
A study by Grimes and Warschauer (2008) used a quasi-experimental approach to compare year-to-year changes in ELA test scores by laptop and non-laptop students in a California school district. The majority of the participating students were at the middle school level, with a smaller number in elementary school. The study found that the non-laptop group performed significantly better in ELA test score change in the first year, but that the laptop group performed significantly better in ELA test score change in the second year. The authors suggested that laptops represent a

Laptops and Fourth-Grade Literacy Suhr, Hernandez, Grimes, & Warschauer,
10
J·T·L·A
disruptive technology, and that it thus may take some time for laptops to have a positive effect on test scores as teachers and students learn how to use them effectively.
In one of the larger and more rigorous studies to date, an evaluation team compared the test score outcomes of students in 21 laptop middle schools in Texas with a control group of 21 non-laptop middle schools (Texas Center for Educational Research, 2008). Three cohorts who partici-pated in the study for three years, two years, and one year, respectively, were examined. For each of the three cohorts, students in the laptop schools had higher baseline to end-of-study improvements overall in the percent of students achieving standard proficiency or higher in the Texas Assessment of Knowledge and Skills reading test. In addition, an analysis via hierarchical linear modeling found that several factors, such as stu-dent economic disadvantage and school poverty concentrations, indicated a trend of greater improvement in reading scores among laptop students, but not at a statistically significant level.
In summary, there is broad consensus in published research that one-to-one laptop programs create a highly favorable environment for stu-dents’ literacy development. Surveys and interviews universally indicate the popularity of these programs with teachers and students, and obser-vations and surveys suggest generally high levels of student engagement. Observation-based studies report students’ involvement in a broader range of authentic literacy practices, such as those involving critical analysis of information or communication with a real audience beyond the teacher, than ordinarily takes place in non-laptop classes. At the same time, there is relatively little research on measurable literacy outcomes following participation in laptop programs, and, as noted by several observers (for example, see discussion in O’Dwyer et al., 2005; Waxman, Lin, & Michko, 2003), much of that research which exists is flawed methodologically. And there is no study to date that focuses on the impact of laptop use on lit-eracy test score outcomes among students who are just entering the crit-ical upper elementary school grades.
Standardized Tests and Student LearningFinally, we should note that several proponents of computers in the
classroom, including McNabb, Hawkes, and Rouk (1999), Russell (2002), and Silvernail (2005) have questioned whether standardized tests aimed primarily at assessing basic skills through fixed-response items are capable of capturing the changes in student learning that may occur through greater computer technology usage. Silvernail (2005), for example, made a convincing argument that much of what is best learned with laptops, such as inquiry and problem solving skills, is not accurately measured by
Laptops and Fourth-Grade Literacy Suhr, Hernandez, Grimes, & Warschauer,
11
J·T·L·A
current versions of standardized test scores. He also claimed that mode of administration affects test score results, and that laptop students are thus at a disadvantage taking paper and pencil tests. This is supported by data from the Maine Educational Assessment, which is delivered in alternate computer-based and pencil-and-paper modes (Silvernail, 2005). A study by Russell and Plati (2002) corroborated Silvernail’s observation; students who were accustomed to writing with computers in the classroom per-formed 0.4 to 1.1 standard deviations lower when they took writing tests by handwriting instead of computer.
More authentic forms of literacy assessment, such as those involving performance and portfolios, are not yet standardized, nor do they have much weight in educational policy and administration decisions. Though standardized tests measure only a portion of the literacy skills of interest, they are highly reliable and have become central to both academic research and public debate on K–12 education.
Research QuestionsThe purpose of this study was to compare longitudinal changes in ELA
achievement of students participating in a one-to-one laptop program (treatment group) with students who did not participate in the program (control group). We asked three closely related research questions:
1. Were there significant differences in the total ELA score changes in the California Standards Test (CST) over the two-year period from third grade to fifth grade between the one-to-one laptop group and the non-laptop group, after controlling for other factors?
2. Were there significant differences in the six subtests used to compute those total ELA scores for the same two groups?
3. Can participation in a one-to-one laptop program be used to predict changes in ELA total and subtest scores over the two-year period from third grade to fifth grade?
Laptops and Fourth-Grade Literacy Suhr, Hernandez, Grimes, & Warschauer,
12
J·T·L·A
Research SettingResearch for this study took place in the Estrella School District (“ESD”;
district name is a pseudonym). ESD is a moderate size suburban school district located in southern California with approximately 14,000 K–8 stu-dents. The average class size in 4th and 5th grades is 31. The ethnic composi-tion of students in the school district is mixed: 47% Hispanic, 28% White, 20% Asian, and 5% other/multi-ethnic/unstated. Economic and linguistic backgrounds are also diverse; 27% of the students are English Language Learners (ELLs), and in spite of pockets of affluence, 40% participate in the free or reduced-price lunch program.
In the fall of 2004 ESD launched one of California’s largest one-to-one laptop programs. District administrators chose two middle schools and two elementary schools for the program. Choice of schools was guided by a desire to test the laptop program at both ends of the economic scale in order to gauge its viability for eventual district-wide implementation. Title I funds financed most of the program cost in a low-income middle school, and parents financed most of the cost in the other schools. This study was part of a larger research effort conducted at the invitation of district administrators (Grimes and Warschauer, 2008; Warschauer, 2006).
At one elementary school in the laptop program, all three fourth-grade classes were in the laptop program. At the other, one mixed third-/fourth-grade class of students in the Gifted and Talented Education (GATE) pro-gram was in the laptop program; other fourth-grade students in the school were not in the laptop program. Over a dozen other elementary schools in the district had no students in the laptop program.
MethodologyWe used a quasi-experimental research design to analyze the effects
of the one-to-one laptop program on CST ELA achievement for students in fourth and fifth grades. We used a longitudinal measure of change in scores. Their CST scores in third grade (Spring, 2004) served as a baseline or pre-test, and their fifth-grade scores (Spring, 2006) served as a post-test. Change in academic achievement was measured by the difference between pre-test and post-test. As described in much greater detail later, we used analysis of variance (ANOVA), multivariate analysis of variance (MANOVA), and multiple regression to address the three research ques-tions.
The CST is a criterion-referenced test designed to show students’ mastery of California academic standards for their grade level. Half the questions are new each year. Since the raw scores are scaled to a normal
Laptops and Fourth-Grade Literacy Suhr, Hernandez, Grimes, & Warschauer,
13
J·T·L·A
distribution in the same range (150 to 600 points total score, with 350 as the threshold for proficient performance), the scaled scores are stable from year to year for students who maintain the same level of mastery of state standards for each advancing grade level. (From this point on, in accord with common practice, we refer only to scaled CST scores, and drop the term “scaled.”) The ELA portion of the CST contains a total of 75 ques-tions in both fourth and fifth grades.
We also surveyed teachers and students, interviewed teachers, observed classes, and collected samples of teacher and student artifacts to supplement the test score analysis with information about how laptops were used for teaching and learning.
As mentioned, participation in the laptop program was determined either by school or by class. Self-selection by students was therefore non-existent, and self-selection by teachers was effectively nil. All of the teachers in the laptop program said they were glad to join it.
Quasi-Experimental DataWe obtained student and school demographic data and CST ELA test
scores from three schools in ESD. During the 2006–07 school year, School 1 had 65 fifth-grade students who were not participating in any laptop program, School 2 had 45 fifth-grade students (12 students who were participating in the laptop program and 33 students who were not), and School 3 had 42 fifth-grade students (all of whom were participants in the laptop program).
Treatment GroupThe treatment group for this study consisted of all 54 fourth-grade
students who participated in the one-to-one laptop program in the 2004–2005 school year (year 1), and the same students as fifth graders in the 2005–2006 school year (year 2). As this study is based on a student-level analysis, treatment group students from the two schools were considered together as one group. In our Discussion, we suggest some school-level fac-tors which could impact our results, and discuss the possibility of school effects confounding them.
Control GroupThe control group consisted of 54 fourth-grade students who were
placed in non-laptop classes in ESD. The pre-intervention CST ELA total and subtest scores were analyzed to identify effects of the following back-ground characteristics: parent education level (a proxy measure for SES), ethnicity, and gender. A fourth background variable, English Language
Laptops and Fourth-Grade Literacy Suhr, Hernandez, Grimes, & Warschauer,
14
J·T·L·A
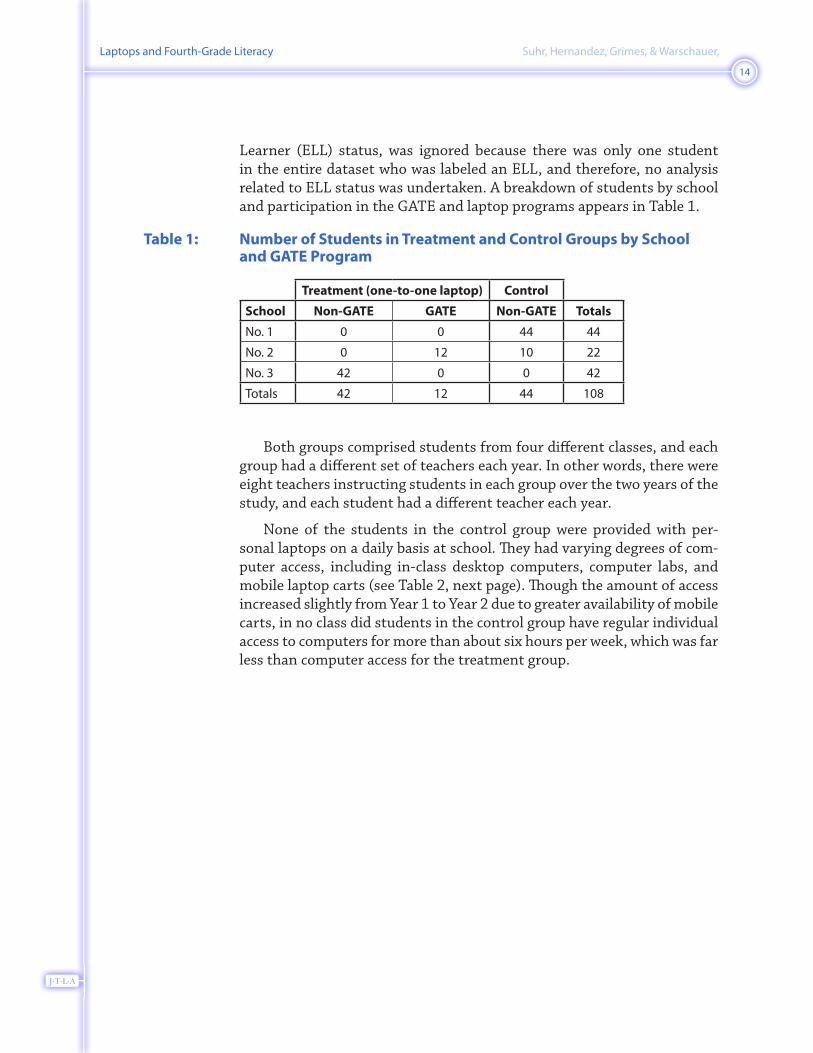
Learner (ELL) status, was ignored because there was only one student in the entire dataset who was labeled an ELL, and therefore, no analysis related to ELL status was undertaken. A breakdown of students by school and participation in the GATE and laptop programs appears in Table 1.
Table 1: Number of Students in Treatment and Control Groups by School and GATE Program
Treatment (one-to-one laptop) Control
School Non-GATE GATE Non-GATE Totals
No. 1 0 0 44 44
No. 2 0 12 10 22
No. 3 42 0 0 42
Totals 42 12 44 108
Both groups comprised students from four different classes, and each group had a different set of teachers each year. In other words, there were eight teachers instructing students in each group over the two years of the study, and each student had a different teacher each year.
None of the students in the control group were provided with per-sonal laptops on a daily basis at school. They had varying degrees of com-puter access, including in-class desktop computers, computer labs, and mobile laptop carts (see Table 2, next page). Though the amount of access increased slightly from Year 1 to Year 2 due to greater availability of mobile carts, in no class did students in the control group have regular individual access to computers for more than about six hours per week, which was far less than computer access for the treatment group.

Laptops and Fourth-Grade Literacy Suhr, Hernandez, Grimes, & Warschauer,
15
J·T·L·A
Table 2: Computer Access by Students in the Control Group
Desktop computers shared by entire class
(~30 students)
Access to mobile laptop cart
(1-to-1)
Access to desktop computer lab
(1-to-1)
Fourth-grade classes in 2004 – 2005
Class 1 2 desktop computers 3 – 6 hours per week —
Class 2 4 desktop computers — 45 minutes per week
Class 3 2 desktop computers — 45 minutes per week
Class 4 2 desktop computers — 45 minutes per week
Fifth-grade classes in 2005 – 2006
Class 5 2 desktop computers 3 – 6 hours per week —
Class 6 2 desktop computers 3 hours per week 45 minutes per week
Class 7 2 desktop computers 3 hours per week 45 minutes per week
Class 8 2 desktop computers 3 hours per week 45 minutes per week
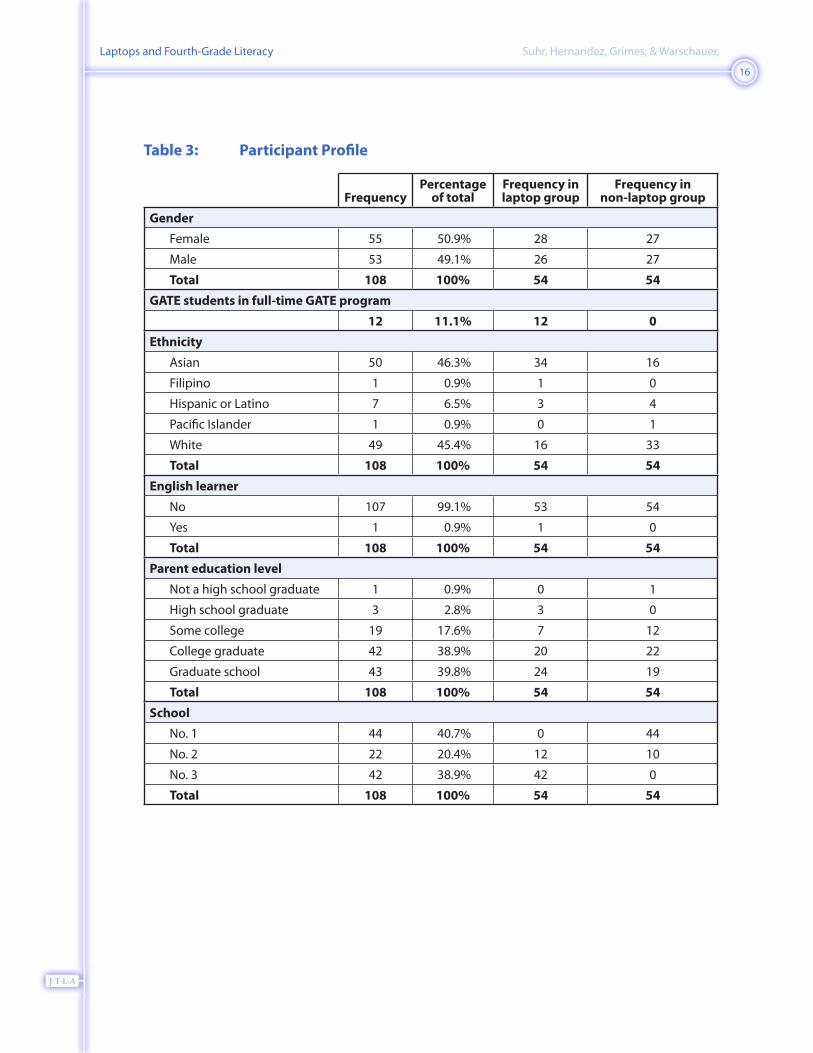
A profile of the 108 participants, which includes both treatment and control groups, is shown in Table 3 (next page). Only the Asian and White ethnicities made up a sizable subgroup in both the laptop and non-laptop groups. In the laptop group, there were over twice as many Asians as Whites, while exactly the opposite is true of the non-laptop group. Results of a 2 × 2 chi-square test indicated a significant association between ethnicity (Asian and White) and participation in the laptop program – χ2(1, N = 99) = 11.00, p < .01 (using Yates’ correction for 2 × 2 tables). The likelihood ratio revealed that, compared to White students, the Asian students were 4.4 more likely to be in the laptop group than the non-laptop group.
Laptops and Fourth-Grade Literacy Suhr, Hernandez, Grimes, & Warschauer,
16
J·T·L·A
Table 3: Participant Profile
FrequencyPercentage
of totalFrequency in laptop group
Frequency in non-laptop group
Gender
Female 55 50.9% 28 27
Male 53 49.1% 26 27
Total 108 100% 54 54
GATE students in full-time GATE program
12 11.1% 12 0
Ethnicity
Asian 50 46.3% 34 16
Filipino 1 0.9% 1 0
Hispanic or Latino 7 6.5% 3 4
Pacific Islander 1 0.9% 0 1
White 49 45.4% 16 33
Total 108 100% 54 54
English learner
No 107 99.1% 53 54
Yes 1 0.9% 1 0
Total 108 100% 54 54
Parent education level
Not a high school graduate 1 0.9% 0 1
High school graduate 3 2.8% 3 0
Some college 19 17.6% 7 12
College graduate 42 38.9% 20 22
Graduate school 43 39.8% 24 19
Total 108 100% 54 54
School
No. 1 44 40.7% 0 44
No. 2 22 20.4% 12 10
No. 3 42 38.9% 42 0
Total 108 100% 54 54

Laptops and Fourth-Grade Literacy Suhr, Hernandez, Grimes, & Warschauer,
17
J·T·L·A
Selection of Control GroupThe number of students in the non-laptop group was reduced from an
initial 98 students to 54 students, the same number of students in the laptop group, to reduce the risk of Type I error in the MANOVA (Bray & Maxwell, 1985; Field, 2005). This was accomplished by using Microsoft® Excel’s random number generator to identify which records from the con-trol (non-laptop) group to remove. We conducted a t test on the ELA total scores comparing the non-laptop students who were eliminated from the study (in order to obtain the “matched” control group of equal size to the treatment group) to those who remained in the study. Any performance difference was not significant, t(96) = –1.52, p = .13.
Additionally, we conducted a one-way MANOVA to test whether there were differences in the ELA subtest scores between the two groups of non-laptop students (eliminated vs. retained in the control group non-laptops students). Pillai’s trace was not significant, F(5, 92) = .86, p = .52, indicating that there were no significant differences between the elimi-nated and retained non-laptop students’ mean scores on any of the ELA subtests.
Background VariablesWe considered four student background variables when evaluating the
baseline (pre-laptop) scores of the two groups: ELL status, parent educa-tion, ethnicity, and gender. ELL status is a dichotomous (yes/no) variable. In California a student whose primary language is not English is consid-ered an ELL until he or she is reclassified as Re-designated Fluent English Proficient. In order to be reclassified, a 4th grade student must obtain a score of 575 or above on the California English Language Development Test. Parent education level is an ordinal variable which is self-reported by the parents. The following values and scores are possible:
0 = none reported, 1 = not high school graduate, 2 = high school graduate, 3 = some college, 4 = college graduate, and 5 = graduate school/post graduate training.
Because no other variables related to SES were available, parent educa-tion level was the only variable which could provide any insight into a student’s family’s SES status. Parents with higher education levels tend to be of higher SES (Reynolds & Ross, 1998). Ethnicity is a nominal vari-able, and we used the ethnicity categories tracked by the California Basic Educational Data System: African American, American Indian, Asian, Filipino, Hispanic, Pacific Islander, White, and decline to state. Gender is a dichotomous variable with two possible values – male or female. A final variable, school, was used to determine whether differences in student test
Laptops and Fourth-Grade Literacy Suhr, Hernandez, Grimes, & Warschauer,
18
J·T·L·A
scores existed in the baseline data that could be attributed to the school which the students attended.
Students were drawn from schools within ESD in order to identify a matched group of students with background characteristics similar to those students in the treatment group. Demographic variables were self-reported by the students’ parents. We conducted a statistical analysis of baseline data to ensure the treatment and control groups were matched statistically.
Statistical MethodsStatistical analysis began with two preparatory steps: (a) diverse sta-
tistical analyses of the baseline data (the students’ CST scores from third grade) to identify factors other than the one-to-one laptop program that might have affected test outcomes, and (b) calculation of correlation coef-ficients among the five CST subtests. Then for the main analyses we con-ducted statistical tests for three time periods: year 1, year 2, and combined. Those tests that did not yield significant findings have been omitted. We discuss three types of statistical tests below.
1. Analyses of variance (ANOVAs, one test for each of the three periods): The purpose of this test was to identify factors (GATE, parent education, and one-to-one laptop program participa-tion) significantly related to differences in changes in ELA total score. Because the ELA total score represents a summary score based on a student’s subtest scores, we analyzed ELA total score results separately from the subtest scores.
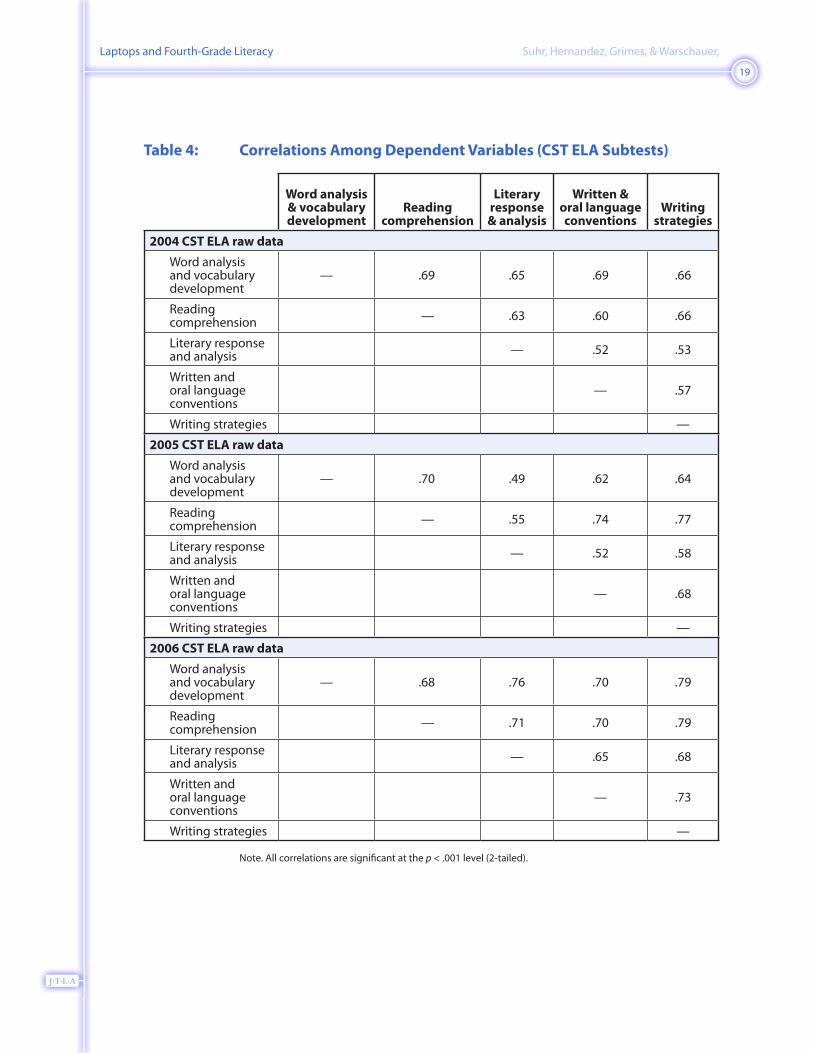
2. Multiple analyses of variance (MANOVAs, one test for each of the three periods): This test identified factors significantly related to all five ELA subtests taken together (the dependent variables). These five subtests essentially measure various aspects of an overall ELA variable, and if analyzed individually using separate ANOVAs increases the risk of making a Type I error (Field, 2005). However, using a MANOVA with uncorre-lated dependent variables is “wasteful” (Tabachnick & Fidell, 2001). As Table 4 (next page) shows, the five CST ELA subtest scores are significantly correlated for all three years of CST data (2004, 2005, and 2006), and thus we proceeded with the use of MANOVA for analyzing ELA subtest data. The independent variables were the same three factors as in the ANOVAs.
Laptops and Fourth-Grade Literacy Suhr, Hernandez, Grimes, & Warschauer,
19
J·T·L·A
Table 4: Correlations Among Dependent Variables (CST ELA Subtests)
Word analysis & vocabulary development
Reading comprehension
Literary response & analysis
Written & oral language conventions
Writing strategies
2004 CST ELA raw data
Word analysis and vocabulary development
— .69 .65 .69 .66
Reading comprehension — .63 .60 .66
Literary response and analysis — .52 .53
Written and oral language conventions
— .57
Writing strategies —
2005 CST ELA raw data
Word analysis and vocabulary development
— .70 .49 .62 .64
Reading comprehension — .55 .74 .77
Literary response and analysis — .52 .58
Written and oral language conventions
— .68
Writing strategies —
2006 CST ELA raw data
Word analysis and vocabulary development
— .68 .76 .70 .79
Reading comprehension — .71 .70 .79
Literary response and analysis — .65 .68
Written and oral language conventions
— .73
Writing strategies —
Note. All correlations are significant at the p < .001 level (2-tailed).

Laptops and Fourth-Grade Literacy Suhr, Hernandez, Grimes, & Warschauer,
20
J·T·L·A
3. Multiple regressions (six tests for each of the three periods): This test allowed us to provisionally predict how ELA scores (total and subtests, i.e., the same dependent variables as in the ANOVAs and MANOVAs) are likely to be affected by one-to-one laptop programs in similar educational settings.
The same three independent variables were used in all three tests: two dichotomous variables, laptop program participation (treatment or control groups) and GATE program participation, and one ordinal vari-able, parent education.
Descriptive DataWe used interviews, observations, surveys, and document analysis to
understand how laptops were used for teaching and learning in the one-to-one laptop classrooms, with a focus on literacy instruction. All eight fourth- and fifth-grade teachers in the laptop program completed an anonymous online survey in 2004–2005 about the ways they made use of laptops and their perceptions of the program. A total of 202 fourth- and fifth-grade students in the laptop program also completed an anonymous online survey about the ways they made use of laptops and their percep-tions of the program during the same year. (The majority of these 202 students are not included in the statistical analysis of this study, either because they were in fifth grade rather than fourth grade in 2004–2005 [110 students], or because they did not complete the entire two years in the same school and program [38 students]. Nevertheless, the responses to the survey present a general idea of how fourth- and fifth-grade stu-dents experienced the laptop program, and their responses matched well with information gathered from teacher surveys, teacher interviews, and classroom observations.) In addition, five of the eight teachers in the laptop classes (including three fourth-grade teachers and two fifth-grade teachers) were chosen to participate in a broader qualitative study. Those five were interviewed for about one hour each, and their classes were observed an average of two times each during the 2004–2005 academic year. Though no observations or surveys were conducted in Year 2 of the study, follow-up phone interviews were held to ask the fifth-grade teachers how they made use of laptops during that year and whether those uses had changed from the previous year.
Teacher interviews were recorded and transcribed, and the interview transcripts and field notes were coded using qualitative data analysis soft-ware (HyperResearch). At our request, the laptop teachers also shared with us electronic or hard copies of documents that could further illuminate how laptops were used in instruction, such as lesson plans, assignments, rubrics, resource materials, or samples of student work, and we examined

Laptops and Fourth-Grade Literacy Suhr, Hernandez, Grimes, & Warschauer,
21
J·T·L·A
these teacher-supplied materials as a way of supplementing and triangu-lating data from the surveys, interviews, and field notes.
FindingsWe first briefly review what we found about how laptops were used
in instruction, and then explain in depth the quantitative results of the study.
Laptop UseLaptops were used in a wide variety of ways for literacy and language
arts instruction in the one-to-one classrooms. All eight laptop teachers responded to a survey on their instructional use of laptops. As Table 5 shows, they reported using laptops an average of 45% of class time.
Table 5: Teacher Survey: Responses to “Approximately how much class time per week do your students actively use their laptops?”
0% – 20% 20% – 40% 40% – 60% 60% – 80% 80% – 100%
Response count 0 3 4 1 0
Note. The average of the midpoints of above intervals is 45%.

Laptops and Fourth-Grade Literacy Suhr, Hernandez, Grimes, & Warschauer,
22
J·T·L·A
Teachers reported that the two most common student uses of laptops in their classes were writing and looking up information on the Internet, using either education-oriented sources such as NetTrekker, or gen-eral search engines, such as Google (see Table 6). All eight teachers also reported that their students regularly created multimedia presentations, using PowerPoint, Keynote, or iMovie.
Table 6: Teacher Survey: Responses to “How often do the students in your class use their laptops to do the following?”
Never (1)
Less than
once a week
(2)
Once a week
(3)
A few times a
week(4)
Once a day(5)
Often during the day
(6)Rating
averageResponse
count
Write 0.0% (0)
0.0% (0)
0.0% (0)
37.5% (3)
37.5% (3)
25.0% (2) 4.88 8
Learn basic use of the laptop or new software
0.0% (0)
0.0% (0)
25.0% (2)
62.5% (5)
0.0% (0)
12.5% (1) 4.00 8
Look up information through general search engines such as Google
0.0% (0)
28.6% (2)
0.0% (0)
28.6% (2)
28.6% (2)
14.3% (1) 4.00 7
Look up information in WebQuests, NetTrekker, or other education-oriented source
0.0% (0)
12.5%(1)
25.0% (2)
50.0% (4)
0.0% (0)
12.5% (1) 3.75 8
Use Keynote or PowerPoint
0.0% (0)
0.0% (0)
62.5% (5)
25.0% (2)
12.5% (1)
0.0% (0) 3.50 8
Do drills for skill development
0.0% (0)
0.0% (0)
50.0% (4)
50.0% (4)
0.0% (0)
0.0%(0) 3.50 8
Use iMovie 0.0% (0)
37.5%(3)
50.0% (4)
12.5% (1)
0.0% (0)
0.0% (0) 2.75 8
Take tests or quizzes that I design
12.5% (1)
62.5%(5)
12.5% (1)
12.5% (1)
0.0% (0)
0.0% (0) 2.25 8
Note. The most frequent response appears in bold.
Laptops and Fourth-Grade Literacy Suhr, Hernandez, Grimes, & Warschauer,
23
J·T·L·A
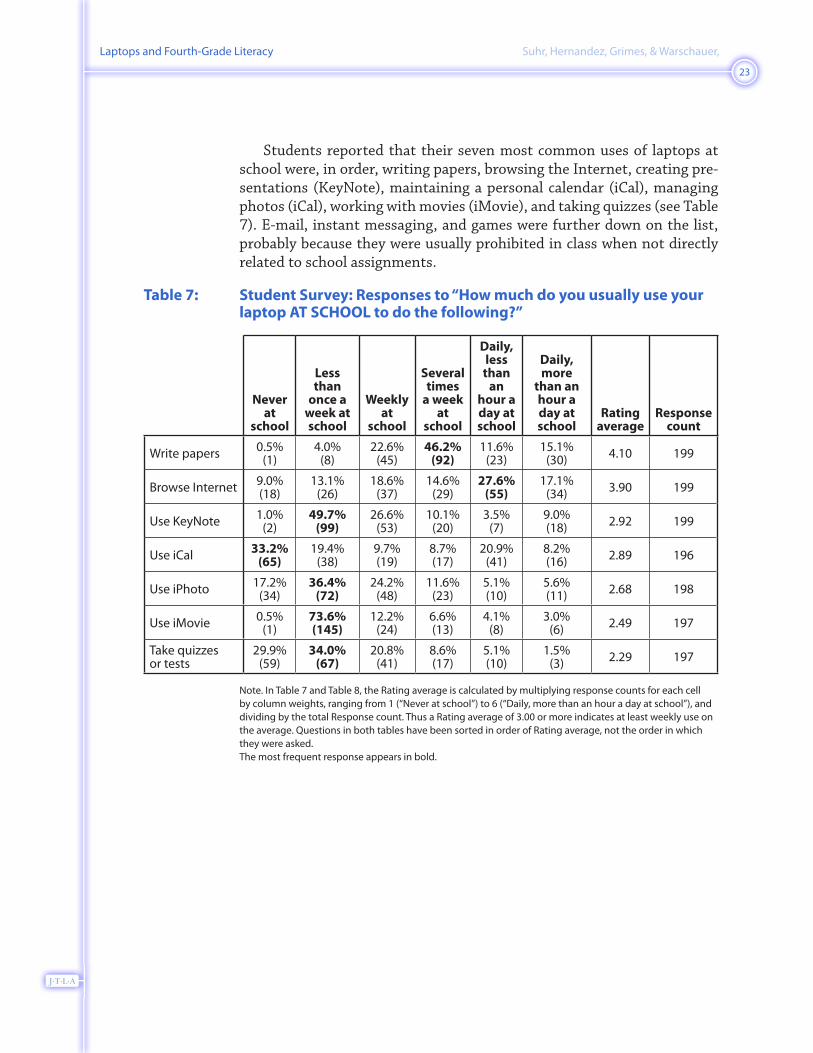
Students reported that their seven most common uses of laptops at school were, in order, writing papers, browsing the Internet, creating pre-sentations (KeyNote), maintaining a personal calendar (iCal), managing photos (iCal), working with movies (iMovie), and taking quizzes (see Table 7). E-mail, instant messaging, and games were further down on the list, probably because they were usually prohibited in class when not directly related to school assignments.
Table 7: Student Survey: Responses to “How much do you usually use your laptop AT SCHOOL to do the following?”
Never at
school
Less than
once a week at school
Weekly at
school
Several times
a week at
school
Daily, less than
an hour a day at school
Daily, more
than an hour a day at school
Ratingaverage
Responsecount
Write papers 0.5% (1)
4.0% (8)
22.6% (45)
46.2% (92)
11.6% (23)
15.1% (30) 4.10 199
Browse Internet 9.0% (18)
13.1% (26)
18.6% (37)
14.6% (29)
27.6% (55)
17.1% (34) 3.90 199
Use KeyNote 1.0% (2)
49.7% (99)
26.6% (53)
10.1% (20)
3.5% (7)
9.0%(18) 2.92 199
Use iCal 33.2% (65)
19.4% (38)
9.7% (19)
8.7% (17)
20.9% (41)
8.2% (16) 2.89 196
Use iPhoto 17.2% (34)
36.4% (72)
24.2% (48)
11.6% (23)
5.1% (10)
5.6% (11) 2.68 198
Use iMovie 0.5% (1)
73.6% (145)
12.2% (24)
6.6% (13)
4.1% (8)
3.0% (6) 2.49 197
Take quizzes or tests
29.9% (59)
34.0% (67)
20.8% (41)
8.6% (17)
5.1% (10)
1.5%(3) 2.29 197
Note. In Table 7 and Table 8, the Rating average is calculated by multiplying response counts for each cell by column weights, ranging from 1 (“Never at school”) to 6 (“Daily, more than an hour a day at school”), and dividing by the total Response count. Thus a Rating average of 3.00 or more indicates at least weekly use on the average. Questions in both tables have been sorted in order of Rating average, not the order in which they were asked. The most frequent response appears in bold.

Laptops and Fourth-Grade Literacy Suhr, Hernandez, Grimes, & Warschauer,
24
J·T·L·A
Students reported using their laptops at home in a variety of home-work-related and entertainment activities. Writing papers again topped the list of most common uses, followed by browsing the Internet, man-aging photos, and playing games (see Table 8). Working with music, instant messaging, and presentations were less popular, but still common.
Table 8: Student Survey: Responses to “How much do you usually use your laptop AT HOME to do the following?”
Never at
home
Less than
once a week at
home
Weekly at
home
Several times
a week at
home
Daily, less than
an hour a day at home
Daily, more
than an hour a day at home
Ratingaverage
Responsecount
Write papers 9.1% (18)
19.3% (38)
21.3% (42)
15.2% (30)
20.8% (41)
14.2% (28) 3.62 197
Browse Internet 24.6% (48)
17.9% (35)
9.2% (18)
11.3% (22)
9.2% (18)
27.7% (54) 3.46 195
Use iPhoto 8.2% (16)
34.4% (67)
19.5% (38)
16.9% (33)
10.3% (20)
10.8% (21) 3.19 195
Play games 22.2% (44)
26.3% (52)
11.1% (22)
11.6% (23)
9.1% (18)
19.7%(39) 3.18 198
Download or listen to music
24.0% (47)
27.6% (54)
12.8% (25)
7.1% (14)
12.2% (24)
16.3%(32) 3.05 196
Use instant messaging
52.3% (102)
11.8% (23)
4.6% (9)
6.2% (12)
8.2% (16)
16.9%(33) 2.57 195
Use KeyNote 17.8% (35)
50.3% (99)
9.6% (19)
14.2% (28)
4.6% (9)
3.6%(7) 2.48 197
Use iMovie 17.9% (35)
52.0% (102)
14.3% (28)
9.2% (18)
3.1% (6)
3.6%(7) 2.38 196
Use iCal 45.3% (86)
26.3% (50)
10.5% (20)
7.4% (14)
5.3% (10)
5.3%(10) 2.17 190
Use E-mail 59.5% (116)
14.9% (29)
5.6% (11)
7.2% (14)
4.1% (8)
8.7%(17) 2.08 195
Note. The most frequent response appears in bold.
These most common uses noted in the survey were confirmed by our observations and interviews. We regularly witnessed students writing and revising their papers on laptops, and using word processing features for formatting their papers and checking spelling. We frequently saw students look up background information online related to topics they were reading or writing about. Students were also observed preparing multimedia pre-sentations.
Laptop activities were often related to analyzing and responding to readings. Several teachers reported that students used graphic organizers

Laptops and Fourth-Grade Literacy Suhr, Hernandez, Grimes, & Warschauer,
25
J·T·L·A
to analyze readings or to map out ideas for papers they were writing. One teacher showed us how she provided students nine analysis or response activities, organized in a tic-tac-toe grid, for students to work on individu-ally or in small groups as a follow-up to each reading assignment; when students completed three activities in a tic-tac-toe row, they received extra credit. The teacher explained that students were highly motivated to work individually with laptops on these kinds of activities, and that this freed up teacher time to support other students individually or in small groups. Finally, one teacher had students interpret poetry by composing music to it, and she believed that this was very helpful in promoting students’ ability to critically interpret what they read.
Computer activities carried out in other subject areas, such as social studies, were also relevant to reading and language development. For example, students in two classes conducted online research about the life of Native Americans in California missions and then used these online materials to help make poster boards and short documentary films about what they had found.
Teachers reported a high level of student engagement in the laptop classroom, and we noted such engagement and enthusiasm among stu-dents in our observations. Teachers reported that students enjoyed using multimedia, searching the Internet, and writing their papers on computer. Teachers also reported that students wrote longer papers than was typ-ical in non-laptop classes, and that the laptop students were better able to revise their papers. We also noted in our observations that the laptops classrooms were very print rich, with student work – sometimes in mul-tiple iterations (e.g., brainstorming charts produced with graphic orga-nizers, first drafts, and final drafts) – filling the walls.
Students’ opinions expressed in the survey confirmed teacher reports and perceptions. A total of 83.8% of students indicated that they preferred to learn with laptops, 79.9% said that schoolwork became more interesting once they received laptops, and 71.5% said that they revised or edited their work more once they had laptops.
In the second year of the study we conducted follow-up phone inter-views with two fifth-grade teachers we had observed and interviewed in the first year of the study. Neither of them reported significant changes in the types of activities they carried out with laptops during the second year of the program. However, both said that implementation was much smoother due to the experience with laptop learning they and their stu-dents gained the previous year. As one teacher explained,
Now that students already have had experience in the laptop program, they already know the applications, so I can focus on teaching the content rather than teaching the tools. For example,

Laptops and Fourth-Grade Literacy Suhr, Hernandez, Grimes, & Warschauer,
26
J·T·L·A
I just took a class onto the Internet to get information about an author we were reading about. Unlike when the program first started, I didn’t have to teach them how to operate the browser, or what a URL was. They could just get right on and get the information so we could focus more on learning.
Analysis of Baseline Data (Pre-laptop)The results of the analysis of baseline data are reported in Table 9. We
analyzed the effects of the five control variables (i.e., gender, ethnicity, parent education, school effects, and GATE participation) on ELA scores separately using two statistical tests: (a) one-way ANOVA for the total ELA scores and (b) one-way MANOVA for the five subtest scores analyzed together. One parent’s highest education level was a 1 (i.e., not a high school graduate). This record was removed from the analysis of parent education because SPSS is unable to run an ANOVA or MANOVA with only one record in a group.
Table 9: Analysis of Baseline (Pre-laptop) ELA Scores
Source of variance df1 df2 F p
Total ELA score (analyzed using ANOVA)
Gender 1 106 1.15 .29
Ethnicity 1 97 1.78 .19
Parent education level 3 103 1.86 .14
School 2 105 1.42 .25
GATE 1 106 7.63 <.01
Subtest scores (analyzed using MANOVA)
Gender 5 102 0.05 .43
Ethnicity 5 93 0.71 .62
Parent education level 15 303 1.12 .34
School 10 204 1.60 .11
GATE 5 102 2.00 .08
Results of the analyses of the effect of the gender, ethnicity, parent education, and school variables on baseline ELA scores suggests that the laptop and non-laptop groups begin on a level playing field before laptops are introduced since these four control variables do not yield significant p values. Only GATE participation had a significant impact on the baseline total ELA scores, and GATE participation will be controlled for in all sub-sequent analyses. Additionally, despite our non-significant findings of the effect of parent education on baseline ELA scores, there is ample evidence
Laptops and Fourth-Grade Literacy Suhr, Hernandez, Grimes, & Warschauer,
27
J·T·L·A
which suggests parent education exerts a moderate to strong effect (Sirin, 2005). We therefore also control for SES, as measured by parent educa-tion.
2004 (pre-laptop) ELA Data
We conducted two final analyses separating the 2004 ELA data into two groups, students who will enter into the laptop program in the 2004–2005 school year and students who will not. A three-way ANOVA was con-ducted comparing the mean ELA total scores for the three fixed factors of parent education, GATE, and treatment (laptop participation). None of the results of the omnibus test for the main effects of parent education, GATE, or treatment were significant – F(4, 97) = 0.76, p = .55; F(1, 97) = 3.13, p = .08; and F(1, 97) = 0.60, p = .44, respectively. In other words, there were no significant differences between the mean ELA total scores for those students who would participate in the one-to-one laptop pro-gram in the following year and those who would not.
Additionally, a three-way MANOVA was conducted to test whether there were differences in the ELA subtest scores related to the three fixed factors of parent education, GATE, and treatment. Pillai’s trace for parent education and GATE were non-significant, F(20, 384) = 1.34, p = .15 and F(5, 93) = 1.43, respectively. Pillai’s trace for treatment was significant, F(5, 93) = 2.56, p < .05. However, there were no significant between-subject effects for any ELA subtest resulting from laptop participation, indicating that the significant difference is related to the linear combination of the subtest scores and not to any specific subtest. The linear combination of subtest scores which was “created” mathematically during the MANOVA effectively exists in the ELA total score, which was analyzed separately using ANOVA.
In conclusion, our analysis of the baseline data indicated no significant differences for any of the control variables. The preceding analyses used only static data from a single year’s CST at a time. The remaining analyses are based on longitudinal data, the change in scores between tests. As pre-viously mentioned, the three periods are from baseline to year 1 (“year 1”), from year 1 to year 2 (“year 2”), and from baseline to year 2 (“combined”).
Laptops and Fourth-Grade Literacy Suhr, Hernandez, Grimes, & Warschauer,
28
J·T·L·A
Analysis of Changes in CST Scores
Overview of Changes in CST ELA Scores
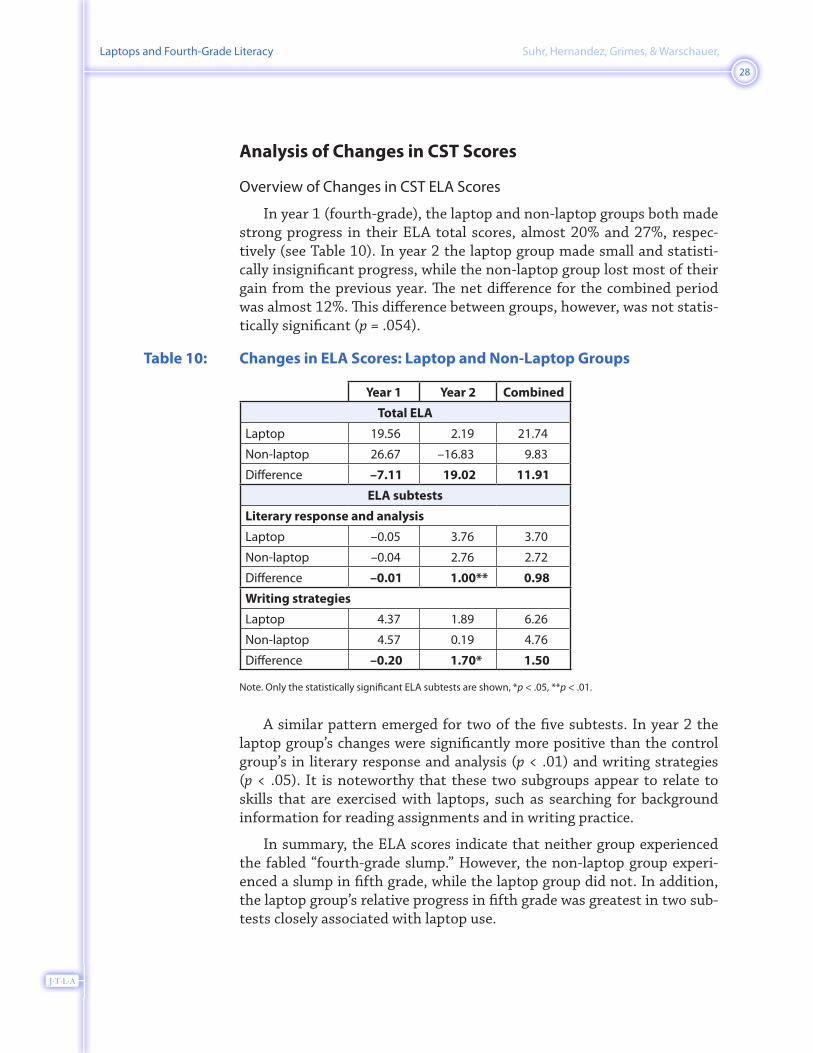
In year 1 (fourth-grade), the laptop and non-laptop groups both made strong progress in their ELA total scores, almost 20% and 27%, respec-tively (see Table 10). In year 2 the laptop group made small and statisti-cally insignificant progress, while the non-laptop group lost most of their gain from the previous year. The net difference for the combined period was almost 12%. This difference between groups, however, was not statis-tically significant (p = .054).
Table 10: Changes in ELA Scores: Laptop and Non-Laptop Groups
Year 1 Year 2 Combined
Total ELA
Laptop 19.56 2.19 21.74
Non-laptop 26.67 –16.83 9.83
Difference –7.11 19.02 11.91
ELA subtests
Literary response and analysis
Laptop –0.05 3.76 3.70
Non-laptop –0.04 2.76 2.72
Difference –0.01 1.00** 0.98
Writing strategies
Laptop 4.37 1.89 6.26
Non-laptop 4.57 0.19 4.76
Difference –0.20 1.70* 1.50
Note. Only the statistically significant ELA subtests are shown, *p < .05, **p < .01.
A similar pattern emerged for two of the five subtests. In year 2 the laptop group’s changes were significantly more positive than the control group’s in literary response and analysis (p < .01) and writing strategies (p < .05). It is noteworthy that these two subgroups appear to relate to skills that are exercised with laptops, such as searching for background information for reading assignments and in writing practice.
In summary, the ELA scores indicate that neither group experienced the fabled “fourth-grade slump.” However, the non-laptop group experi-enced a slump in fifth grade, while the laptop group did not. In addition, the laptop group’s relative progress in fifth grade was greatest in two sub-tests closely associated with laptop use.

Laptops and Fourth-Grade Literacy Suhr, Hernandez, Grimes, & Warschauer,
29
J·T·L·A
ANOVA for Changes in ELA TotalWe conducted three 3-way ANOVAs on the change in ELA total scores
for the three fixed factors of parent education, GATE participation, and treatment – one for each of year 1, year 2, and combined data. None of the results of the omnibus test for the main effects of the parent education, GATE program, or laptop program were significant. Moreover, none of the interaction effects were statistically significant.
MANOVA for Changes in ELA SubtestsWe conducted three 3-way MANOVAs to test for differences in the
means of the change scores on all the ELA subtests for the three fixed factors of parent education, GATE participation, and treatment – one for each of year 1, year 2, and combined data. There were significant findings in each of the years analyzed.
Year 1 results are displayed in Table 11 (next page). The multivariate F (Pillai’s trace) was significant for the main effect of GATE and interaction effects of parent education x treatment. There were no significant between-subject effects for any ELA subtest resulting from GATE, indicating that the significant differences are related to the linear combinations of the subtest scores and not to any specific subtest. Although not significant, the effect of GATE participation on the literary response and analysis sub-test change scores was approaching significance (p = .057). The interaction effects of parent education x treatment were significant for the subtest of literary response and analysis. Students whose parents have more edu-cation and who were in the laptop group had significantly higher change scores than those students whose parents have less education and who were in the non-laptop group.

Laptops and Fourth-Grade Literacy Suhr, Hernandez, Grimes, & Warschauer,
30
J·T·L·A
Table 11: Multivariate Analysis of Variance for Year 1 for ELA Subtest Variables
Source of variancePillai’s trace df1 df2
Multivariate F
Parent education .25 20 384 1.29
GATE .13 5 93 2.67*
Treatment .06 5 93 1.19
Parent education x GATE .17 10 188 1.70
Parent education x treatment .22 10 188 2.30*
Source of variance/Subtest SS df MS F
Between-subject effects for statistically significant multivariate F
For GATE
Word analysis and vocabulary development 8.34 1 8.34 1.98
Reading comprehension 3.03 1 3.03 0.73
Literary response and analysis 8.39 1 8.39 3.72†
Written conventions 1.70 1 1.70 0.28
Writing strategies 17.77 1 17.77 3.49
For parent education x treatment
Word analysis and vocabulary development 1.44 2 0.72 0.17
Reading comprehension 5.85 2 2.93 0.17
Literary response and analysis 21.74 2 10.87 4.82*
Written conventions 2.83 2 1.42 0.23
Writing strategies 20.81 2 10.41 2.05
Note. GATE x treatment and parent education x GATE x treatment could not be calculated since there were no GATE students in the non-laptop group. *p < .05, †p = .057 (approaching significance).
Year 2 results are displayed in Table 12 (next page). The multivariate F was significant for only the main effect of treatment. The between-subject effects were significant for two ELA subtests – literary response and anal-ysis and writing strategies. Students who were in the laptop group had significantly higher change scores than those students who were in the non-laptop group.

Laptops and Fourth-Grade Literacy Suhr, Hernandez, Grimes, & Warschauer,
31
J·T·L·A
Table 12: Multivariate Analysis of Variance for Year 2 for ELA Subtest Variables
Source of variancePillai’s trace df1 df2
Multivariate F
Parent education .14 20 384 0.72
GATE .02 5 93 0.29
Treatment .12 5 93 2.47*
Parent education x GATE .03 10 188 0.25
Parent education x treatment .07 10 188 0.72
Source of variance/Subtest SS df MS F
Between-subject effects for statistically significant multivariate F
For treatment
Word analysis and vocabulary development 3.24 1 3.24 0.68
Reading comprehension 10.63 1 10.63 1.70
Literary response and analysis 29.28 1 29.28 7.67**
Written conventions 6.28 1 6.28 1.18
Writing strategies 35.01 1 35.01 5.40*
Note. GATE x treatment and parent education x GATE x treatment could not be calculated since there were no GATE students in the non-laptop group. *p < .05., **p < .01.
Combined results (year 2 minus baseline) are displayed in Table 13 (next page). The multivariate F was significant for only the main effect of GATE participation. The between-subject effects were significant for writing strategies. Students who participated in the GATE program had significantly higher change scores than those students who did not.

Laptops and Fourth-Grade Literacy Suhr, Hernandez, Grimes, & Warschauer,
32
J·T·L·A
Table 13: Multivariate Analysis of Variance for Combined Scores for ELA Subtest Variables
Source of variancePillai’s trace df1 df2
Multivariate F
Parent education .16 20 384 0.79
GATE .11 5 93 2.32*
Treatment .11 5 93 2.23
Parent education x GATE .13 10 188 1.31
Parent education x treatment .13 10 188 1.30
Source of variance/Subtest SS df MS F
Between-subject effects for statistically significant multivariate F
For treatment
Word analysis and vocabulary development 5.76 1 5.76 0.98
Reading comprehension 15.87 1 15.87 2.30
Literary response and analysis 5.37 1 5.37 1.23
Written conventions 1.08 1 1.08 0.19
Writing strategies 44.53 1 44.53 6.31*
Note. GATE x treatment and parent education x GATE x treatment could not be calculated since there were no GATE students in the non-laptop group. *p < .05.
Multiple RegressionFor the multiple regression analyses, we used the change in total CST
ELA score and the five ELA subtests as the dependent variables for year 1, year 2, and combined data. None of the independent variables (parent education level, GATE participation, or laptop participation) were signifi-cant predictors in any of the six analyses which we conducted for year 1.
Year 2 results are displayed in Table 14 (next page). The results of the six analyses revealed that only three of the tested models yielded sig-nificant predictors for the outcome variables of ELA total score, literary response and analysis, and writing strategies. Consistently, participation in the laptop program had positive effects in the regression analyses that showed significance, namely change in ELA total score, literary response and analysis, and writing strategies.

Laptops and Fourth-Grade Literacy Suhr, Hernandez, Grimes, & Warschauer,
33
J·T·L·A
Table 14: Multiple Linear Regression Analysis for Changes in Total ELA Score, Year 2
Criterion variable/Predictor variable B SE B β tSemi-Partial correlation
Change in ELA total scale score1
Parent education level 5.84 3.40 .16 1.72 .16
GATE 24.27 9.98 .23 2.43* .22
One-to-one laptop participation 12.87 6.29 .20 2.05* .18
Change in word analysis and vocabulary development2
Parent education level 0.14 0.24 .06 0.57 .06
GATE 0.16 0.70 .02 0.23 .02
One-to-one laptop participation 0.35 0.44 .08 0.80 .08
Change in reading comprehension3
Parent education level 0.25 0.27 .09 0.91 .09
GATE 0.88 0.80 .11 1.10 .11
One-to-one laptop participation 0.72 0.50 .15 1.42 .14
Change in literary response and analysis4
Parent education level 0.28 0.22 .12 1.25 .12
GATE 0.61 0.65 .10 0.95 .09
One-to-one laptop participation 0.83 0.41 .20 2.03* .19
Change in written and oral language conventions5
Parent education level 0.24 0.25 .09 0.96 .09
GATE –0.31 0.74 –.04 –0.42 –.04
One-to-one laptop participation –0.52 0.46 –.12 –1.12 –.11
Change in writing strategies6
Parent education level 0.57 0.28 .19 2.07* .19
GATE 0.75 0.81 .09 0.93 .08
One-to-one laptop participation 1.46 0.51 .28 2.86** .26
Note. 1R = .40, R2 = .16, adjusted R2 = .13, F(3, 104) = 6.52, p < .001. 2R = .11, R2 = .01, adjusted R2 = –.02, F(3, 104) = 0.45, p = .72. 3R = .24, R2 = .06, adjusted R2 = .03, F(3, 104) = 2.03, p = .11. 4R = .29, R2 = .08, adjusted R2 = .06, F(3, 104) = 3.13, p < .05. 5R = .16, R2 = .03, adjusted R2 < –.01, F(3, 104) = 0.91, p = .44. 6R = .38, R2 = .15, adjusted R2 = .12, F(3, 104) = 5.99, p = .001. *p < .05, **p < .01.
Laptops and Fourth-Grade Literacy Suhr, Hernandez, Grimes, & Warschauer,
34
J·T·L·A
For change in ELA total scores, participation in a full-time GATE classroom was a significant predictor. Students enrolled in GATE scored approximately 24 points higher in ELA total change scores than non-GATE participants. Additionally, students participating in the one-to-one laptop program achieved approximately 13 more ELA total change score points.
The effect size (ES) of each individual predictor in the regression anal-ysis is calculated by the formula sr2/(1 – R2), where sr is the semi-partial correlation (Cohen, Cohen, West, & Aiken, 2003). Using Cohen (1992) as a guide to interpret ES, the predictor treatment had small effects on the change scores of total ELA (ES = .04) and literary response and analysis (ES = .05), and a small-to-moderate effect on writing strategies (ES = .11).
We found parent education level to have a significant effect on change in writing strategies scores independent of the treatment variable (i.e., the interaction effects found in year 2 MANOVA). The ES was small at .06. If a higher level of education is an indicator of SES, then students from higher SES backgrounds tend to score better on the CST writing strate-gies subtest. We can speculate that parents with more education may have better skills to help their children with writing strategies, or they have the resources to provide them with more opportunities to learn writing strate-gies than parents with less education.
The combined results (year 2 minus baseline) are displayed in Table 15 (next page). The results of the six analyses revealed that only two of the tested models yielded significant predictors for the outcome variables of literary response and analysis and writing strategies. In both cases, par-ticipation in the laptop program had a significant positive, but small effect on literary response and analysis (ES = .05) and writing strategies (ES = .04).

Laptops and Fourth-Grade Literacy Suhr, Hernandez, Grimes, & Warschauer,
35
J·T·L·A
Table 15: Multiple Linear Regression Analysis for Changes in Total ELA Scores, Years 1 and 2 Combined
Criterion variable/Predictor variable B SE B β tSemi-Partial correlation
Change in ELA total scale score1
Parent education level 0.22 4.10 .01 0.53 .01
GATE 14.36 12.03 .12 1.19 .12
One-to-one laptop participation 8.69 7.57 .12 1.15 .11
Change in word analysis and vocabulary development2
Parent education level 0.51 0.27 .18 1.91 .18
GATE –0.83 0.79 –.11 –1.06 –.10
One-to-one laptop participation –0.20 0.49 –.04 –0.40 –.04
Change in reading comprehension3
Parent education level –0.01 0.30 –.03 –0.32 –.03
GATE 1.17 0.87 .14 1.36 .13
One-to-one laptop participation 0.38 0.55 .07 0.70 .07
Change in literary response and analysis4
Parent education level 0.25 0.24 .10 1.06 .10
GATE –0.01 0.70 –.01 –0.09 –.01
One-to-one laptop participation 0.96 0.44 .22 2.18* .21
Change in written and oral language conventions5
Parent education level –0.01 0.26 –.02 –0.21 –.02
GATE 0.46 0.76 .06 0.60 .06
One-to-one laptop participation –0.34 0.48 –.07 –0.70 –.07
Change in writing strategies6
Parent education level 0.30 0.30 .09 1.02 .09
GATE 1.68 0.87 .19 1.95 .18
One-to-one laptop participation 1.09 0.55 .20 2.00* .18
Note. 1R = .20, R2 = .04, adjusted R2 = .01, F(3, 104) = 1.42, p = .24. 2R = .22, R2 = .05, adjusted R2 = .02, F(3, 104) = 1.72, p = .17. 3R = .18, R2 = .03, adjusted R2 < .01, F(3, 104) = 1.15, p = .33. 4R = .25, R2 = .06, adjusted R2 = .03, F(3, 104) = 2.27, p = .09. 5R = .08, R2 = .01, adjusted R2 = –.02, F(3, 104) = 0.23, p = .87. 6R = .34, R2 = .12, adjusted R2 = .09, F(3, 104) = 4.54, p < .01. *p < .05.

Laptops and Fourth-Grade Literacy Suhr, Hernandez, Grimes, & Warschauer,
36
J·T·L·A
DiscussionThe results of the ANOVA and MANOVA analyses showed that after
year 2, laptop students significantly outperformed non-laptop students in their change scores for literary response and analysis (p < .01) and writing strategies (p < .05). For both the laptop and non-laptop students, change scores for reading comprehension were negative (see Table 16), although the drop in reading comprehension scores of laptop students (M = –0.44) was less than for non-laptop students (M = –1.39). This suggests that the fourth-grade slump phenomenon may have followed these students into fifth grade (year 2 of program implementation), and that the use of laptop computers has mitigated the full impact of the phenomenon on laptop-using students, and thus may account for the significantly higher perfor-mance of laptop students in reading comprehension than their non-laptop peers.
Table 16: Means and Standard Deviations of Changes in Laptop and Non-Laptop Students’ CST ELA Total Score and Subtest Scores
Year 1 Year 2 Year 3
ELA test or subtest / Group M SD M SD M SD
Total scale score
Non-laptop 26.67 29.64 –16.83 28.35 9.83 40.41
Laptop 19.56 29.35 2.19 34.33 21.74 32.43
Word analysis and vocabulary development
Non-laptop –1.11 2.23 –3.70 2.59 –4.81 2.84
Laptop –1.83 1.89 –3.30 1.55 –5.13 1.92
Reading comprehension
Non-laptop 1.19 2.49 –1.39 2.51 –0.20 2.74
Laptop 0.87 1.66 –0.44 2.38 0.43 2.54
Literary response and analysis
Non-laptop –0.04 1.48 2.76 2.29 2.72 2.30
Laptop –0.05 1.65 3.76 1.62 3.70 1.95
Written and oral language conventions
Non-laptop 3.85 2.74 0.20 2.18 4.06 2.58
Laptop 4.17 2.08 –0.35 2.28 3.81 1.96
Writing strategies
Non-laptop 4.57 2.20 0.19 2.47 4.76 2.90
Laptop 4.37 2.32 1.89 2.57 6.26 2.44
Laptops and Fourth-Grade Literacy Suhr, Hernandez, Grimes, & Warschauer,
37
J·T·L·A
In the multiple regression analyses for year 2 change data, the treat-ment variable was found to be a significant predictor for changes in ELA total score, literary response and analysis, and writing strategies. The square of the semi-partial correlation (sr2) yields the coefficient of deter-mination for the unique contribution of each predictor. By itself, the treatment variable (i.e., being enrolled in the laptop program) explained approximately 3% of the variation in the change in ELA total scores, 6% of the variation in the change in literary response and analysis scores, and 10% of the variation in the change in writing strategies scores.
According to Cohen (1992), an ES of .02 is small and an ES of .15 is moderate. The treatment effect of being in the laptop program had small to moderate effects on the change scores for which significant predictors were found – ELA total score ES = .04, literary response and analysis ES = .05, and writing strategies ES = .11.
Teacher and student surveys, observations, and interviews all con-firmed that writing and revising was the most common use of the lap-tops in the schools in our study. These benefits are consistent with what has been noted in other case studies of laptop programs which also report increased opportunities to practice diverse writing strategies and criti-cally analyze literature (e.g., Warschauer, 2008; Warschauer et al., 2004). Further large scale research correlating students’ use of laptops with test score outcomes would be necessary to better understand the more specific benefits of laptop use for English language arts instruction.
It is also not surprising to us that the positive effects for laptop use appeared only after the second year and not after the first year. During the first year of the study, there was a steep learning curve as both teachers and students first experienced a one-to-one classroom. But, as the teachers explained in interviews, in the second year they could focus their teaching more on content and learning and less on basic computer skills. This is consistent with what has been found in other research on laptop programs as well (e.g., Silvernail & Gritter, 2007; Grimes & Warschauer, 2008).
Finally, we should briefly discuss the most important limitations to the research that may have affected the findings or the study’s generalizability. First, though we ruled out general school effects by examining the CST scores of each individual school, we were not able to account for specific school characteristics that may be of relevance to students’ academic suc-cess, including such things as funding (e.g., Title I, II, III, and V funds and PTA funding for programs), school size, teacher education level, teacher experience, teacher expectations, and teacher pedagogy. In particular, as the school district did not provide any teacher-level data, we could not investigate the possible role of teacher differences in the study. However, since students in the study were taught by a total of 16 different teachers,

Laptops and Fourth-Grade Literacy Suhr, Hernandez, Grimes, & Warschauer,
38
J·T·L·A
and since no student had the same teacher in both Year 1 and in Year 2, we consider it unlikely that teacher differences played a major role in the study. Second, there was insufficient representation from other ethnic groups (besides White and Asian) to check for differences in performance between the control and treatment groups which might be attributable to ethnicity. Thus, while Latinos, African-Americans, and Native Americans suffer disproportionately low performance in reading, we are not able to draw conclusions specific to those ethnic groups.
Third, although the sample size (54 students in both the treatment and control groups) substantially exceeded the 30 subjects typically con-sidered adequate to reliably represent a population (e.g., Streiner, 2006), a larger sample size would increase the likelihood that differences from the means within each group would cancel out, and could lead to more stable parameter estimates (Smith, 1981; Streiner, 2006). Moreover, the small sample size (108), small effect size of the treatment (one-to-one laptop participation), and the number of variables (five dependent and three fixed factors) used in the MANOVA may have resulted in poor power. This may explain why we found no significant differences in three of the sub-test change scores (word analysis and vocabulary development, reading comprehension, and written and oral language conventions).
Fourth, we did not perform a cost-benefit analysis to compare the pos-sible effects of laptop intervention to those of other interventions. It may be the case that if the sole goal of an intervention is to improve ELA tests scores, then other interventions may prove more cost effective, though we also note that laptop prices are falling rapidly, and that laptop programs are usually undertaken with broader goals in mind.
And fifth, the duration of the study may also have affected the find-ings. Since the positive effect was greater over two years than over one year, we consider it possible that a lengthier study would yield even more positive results as teachers and students continue to learn to make better educational use of laptops. Nevertheless, it is also possible that, in a longer implementation, students with laptops may lose the initial excitement they experienced in early years of laptop use and thus see test score out-comes decline.
39
Laptops and Fourth-Grade Literacy Suhr, Hernandez, Grimes, & Warschauer,
J·T·L·A
ConclusionLaptop programs have a strong allure to educational administrators
seeking to promote the kinds of thinking, learning, and creativity required in the 21st century. However, a major question of many administrators when considering this or any other educational intervention is the effect it may have on standardized test scores.
The modest sample size and small effect sizes of this study make it difficult to draw definitive conclusions. Nevertheless, the study adds to an emerging body of literature suggesting that laptop use over multiple years may have a small positive effect on literacy test score outcomes. Given that the tests themselves are taken on paper, thus potentially disadvantaging students who have done much of their learning via computer (for example, see Russell & Plati, 2002), the actual benefits vis-à-vis knowledge of the material covered on the tests may be understated for laptop students. It also may be the case, as advocates suggest, that much of what is best taught and learned with laptops is not covered on standardized tests at all. Finally, since the upper elementary grades have proven to be a critical turning point at which many students begin a downward trajectory in lit-eracy and learning, even a small upward bump at this grade level could have an important long-term effect.
Laptops are not the magic bullet that will single-handedly overcome unsatisfactory ELA test scores. However, this study suggests that laptops may have a small effect on increasing such scores, with particular bene-fits in the areas of literary response and analysis and writing strategies. Further research, with larger sample sizes, more diverse student demo-graphics, longitudinal evaluation, a wider array of outcome measures (including those taken on both paper and computer and those involving both standardized tests and alternative forms of assessment), and, where possible, random assignment, will help us continue to shed light on the effects of laptop use on literacy and learning.
Laptops and Fourth-Grade Literacy Suhr, Hernandez, Grimes, & Warschauer,
40
J·T·L·A
ReferencesBray, J.H., & Maxwell, S.E. (1985). Multivariate analysis of variance.
Newbury Park, CA: Sage Publications, Inc.
Brown, K.R., Cummins, J., & Sayers, D. (2007). Literacy, technology, and diversity: Teaching for success in changing times. Boston: Allyn & Bacon.
Chall, J.S. (1983). Stages of reading development. New York: McGraw-Hill.
Chall, J.S., & Jacobs, V.A. (2003, Spring). Poor children’s fourth-grade slump [Electronic version]. American Educator. Retrieved June 26, 2005, from http://www.aft.org/pubs-reports/american_educator/spring2003/chall.html.
Chall, J.S., Jacobs, V.A., & Baldwin, L.E. (1990). The reading crisis: Why poor children fall behind. Cambridge, MA: Harvard University Press.
Cohen, J. (1992). A power primer. Psychological Bulletin, 112(1), 155–159.
Cohen, J., Cohen, P., West, S.G., & Aiken, L.S. (2003). Applied multiple regression/correlation analysis for the behavioral sciences (3rd ed.). Hillsdale, NJ: Lawrence Erlbaum Associates.
Cummins, J. (2008). Technology, literacy, and young second language learners: Designing educational futures. In L. L. Parker (Ed.), Technology-mediated learning environments for young English learners: Connections in and out of school (pp. 61–98). New York: Lawrence Erlbaum Associates.
Daane, M.C., Campbell, J.R., Grigg, W.S., Goodman, M.J., & Oranje, A. (2005). Fourth-grade students reading aloud: NAEP 2002 special study of oral reading (NCES 2006-469). Washington, DC: National Center for Education Statistics.
Dynarski, M., Agodini, R., Heaviside, S., Novak, T., Carey, N., Campuzano, L., et al. (2007). Effectiveness of reading and mathematics software products: Findings from the first student cohort. Washington, DC: U.S. Department of Education.
Field, A. (2005). Discovering statistics using SPSS (2nd ed.). Thousand Oaks, CA: Sage Publications, Inc.
Gee, J.P. (2003). What video games have to teach us about learning and literacy. New York: Palgrave Macmillan.
Gee, J.P. (2004). Situated language and learning: A critique of traditional schooling. New York: Routledge.
Grimes, D., & Warschauer, M. (2008). Learning with laptops: A multi-method case study. Journal of Educational Computing Research 38(3), 305–332.
Laptops and Fourth-Grade Literacy Suhr, Hernandez, Grimes, & Warschauer,
41
J·T·L·A
Gulek, J.C., & Demirtas, H. (2005). Learning with technology: The impact of laptop use on student achievement [Electronic Version]. Journal of Technology, Learning, and Assessment, 3(2), 3–38. Retrieved September 22, 2007, from http://escholarship.bc.edu/jtla/vol3/2/.
Harris, W.J., & Smith, L. (2004). Laptop use by seventh grade students with disabilities: Perceptions of special education teachers. Retrieved February 2, 2006, from http://www.usm.maine.edu/cepare/pdf/mlti/MLTI%20Phase%20One%20Evaluation%20Report%202.pdf.
Jeroski, S. (2003). Wireless Writing Project: Research report, phase II (School District No. 60, Peace River North). Vancouver, BC: Horizon Research & Evaluation Inc.
Kulik, J.A. (2003). Effects of using instructional technology in elementary and secondary schools: What controlled evaluation studies say. Arlington, VA: SRI International.
Lowther, D.L., Ross, S.M., & Morrison, G.M. (2003). When each one has one: The influences on teaching strategies and student achievement of using laptops in classrooms. Educational Technology Research & Development, 51(3), 23–44.
McNabb, M., Hawkes, M., & Rouk, U. (1999). Critical issues in evaluating the effectiveness of technology. Washington, DC: United States Department of Education.
National Center for Educational Statistics. (2004). National trends in reading by performance levels, 2004. Washington, DC: U.S. Department of Education. Retrieved July 10, 2005, from http://nces.ed.gov/nationsreportcard/ltt/results2004/nat-reading-perf.asp.
O’Dwyer, L.M., Russell, M., Bebell, D., & Tucker-Seeley, K.R. (2005). Examining the relationship between home and school computer use and students’ English language arts test scores. Journal of Technology, Learning and Assessment, 3(3), 1–46.
Paris, S. (2005). Re-interpreting the development of reading skills. Reading Research Quarterly, 40(2), 184–202.
Rand Reading Study Group. (2002). Reading for understanding: Toward an R & D program in reading comprehension. Report prepared for the Office of Educational Research and Improvement. Santa Monica, CA: Rand.
Reynolds, J.R., & Ross, C.E. (1998). Social stratification and health: Education’s benefit beyond economic status and social origins. Social Problems, 45(2), 221–247.

Laptops and Fourth-Grade Literacy Suhr, Hernandez, Grimes, & Warschauer,
42
J·T·L·A
Rockman, S., Chessler, M., & Walker, L. (1998a). Powerful tools for schooling: Second year study of the laptop program. San Francisco, CA: Anytime Anywhere Learning (Microsoft Corporation Notebooks for Schools by Toshiba America Information Systems).
Rockman, S., Chessler, M., & Walker, L. (1998b). Powerful tools for schooling: Second year study of the laptop program: Executive summary. San Francisco, CA: Anytime Anywhere Learning (Microsoft Corporation Notebooks for Schools by Toshiba America Information Systems).
Russell, M. (2002, Spring). It’s time to upgrade: Tests and administration procedures for the new millennium [Electronic version]. Essays in Education, 1. Retrieved August 8, 2005, from http://www.usca.edu/essays/vol12002/time_to_upgrade_revised.pdf.
Russell, M., & Plati, T. (2002). Does it matter with what I write? Comparing performance on paper, computer, and portable writing devices [Electronic version]. Current Issues in Education, 5(4), 1–25.
Russell, M., Bebell, D., & Higgins, J. (2004). Laptop learning: A comparison of teaching and learning in upper elementary classrooms equipped with shared carts of laptops and permanent 1:1 laptops. Journal of Educational Computing Research, 30(4), 313–330.
Silvernail, D.L. (2005). Does Maine’s middle school laptop program improve learning? A review of evidence to date. Portland, ME: Center for Education Policy, Applied Research, & Evaluation.
Silvernail, D.L., & Gritter, A.K. (2007). Maine’s middle school laptop program: Creating better writers. Retrieved August 6, 2008, from http://www.usm.maine.edu/cepare/Impact_on_Student_Writing_Brief.pdf.
Silvernail, D.L., & Lane, D.M.M. (2004). The impact of Maine’s one-to-one laptop program on middle school teachers and students. Portland: Maine Educational Policy Research Institute, University of Southern Maine Office.
Sirin, S.R. (2005). Socioeconomic status and academic achievement: A meta-analytic review of research. Review of Educational Research, 75(3), 417–453.
Smith, P.L. (1981). Gaining accuracy in generalizability theory: Using multiple designs. Journal of Educational Measurement, 18(3), 147–154.
Snow, C.E., Burns, M.S., & Griffin, P. (Eds.). (1998). Preventing reading difficulties in young children. Washington, DC: National Academy Press.

43
Laptops and Fourth-Grade Literacy Suhr, Hernandez, Grimes, & Warschauer,
J·T·L·A
Streiner, D.L. (2006). Sample size in clinical research: When is enough enough? Journal of Personality Assessment, 87(3), 259–260.
Tabachnick, B.G., & Fidell, L.S. (2001). Using multivariate statistics (4th ed.). Boston: Allyn & Bacon.
Texas Center for Educational Research. (2008). Evaluation of the Texas Technology Immersion Pilot: Outcomes for the third year (2006–2007). Retrieved August 6, 2008, from http://www.tcer.org/research/etxtip/documents/y3_etxtip_quan.pdf.
Walker, L., Rockman, S., & Chessler, M. (2000). A more complex picture: Laptop use and impact in the context of changing home and school access. Retrieved February 2, 2006, from http://www.elob.org/.
Warschauer, M. (2006). Laptops and literacy: Learning in the wireless classroom. New York: Teachers College Press.
Warschauer, M. (2007). Information literacy in the laptop classroom. Teachers College Record, 109(11), 2511–2540.
Warschauer, M. (2008). Laptops and literacy: A multi-site case study. Pedagogies, 3(1), 52–67.
Warschauer, M., Grant, D., Del Real, G., & Rousseau, M. (2004). Promoting academic literacy with technology: Successful laptop programs in K–12 schools. System, 32(4), 525–537.
Waxman, H.C., Lin, M., & Michko, G.M. (2003). A meta-analysis of the effectiveness of teaching and learning with technology on student outcomes. Naperville, IL: Leaning Point Associates.

Laptops and Fourth-Grade Literacy Suhr, Hernandez, Grimes, & Warschauer,
44
J·T·L·A
Author BiographiesKurt A. Suhr is the principal of Newport Heights Elementary School
in the Newport-Mesa Unified School District. He has an Ed.D. in Educational Administration and Instructional Leadership from the joint doctoral program of California State University, Fullerton, and the University of California, Irvine. He is an adjunct faculty member at Pepperdine University, where he teaches Educational Administration and Leadership courses. His research interest is technology use in education with a specific focus on laptop computing in classrooms. He can be contacted at 300 E. 15th Street, Newport Beach, CA 93663, USA, or by e-mail at [email protected].
David A. Hernandez is the lead kindergarten teacher and a Beginning Teacher Support & Assessment (BTSA) program support provider at Newport Heights Elementary School in the Newport-Mesa Unified School District. He is also adjunct faculty at Walden University, where he is a research methodologist supervising doctoral students in Richard W. Riley College of Education and Leadership; at California State University, Fullerton, where he teaches in the School of Education, Department of Educational Leadership, in the Master of Educational Administration program; at the University of California, Irvine, where he teaches in the Department of Education in the Master of Arts in Teaching; and at Northwood University at Cerritos, where he teaches in the Bachelor of Business Administration program. He has a Ph.D. in Executive Management from Claremont Graduate University and an Ed.D. in Educational Administration and Leadership from the joint doctoral program of California State University, Fullerton, and the University of California, Irvine. His research interests are student literacy, technology use in education, effective principal support of teachers new to the profession, and principal impact on student academic achievement. He can be contacted by e-mail at [email protected].
45
Laptops and Fourth-Grade Literacy Suhr, Hernandez, Grimes, & Warschauer,
J·T·L·A
Douglas Grimes is a software consultant and an independent researcher in educational technologies. He holds a B.A. in Economics from Yale, an M.S. in Management Information Systems from the University of Arizona, and a Ph.D in Information and Computer Sciences from the University of California, Irvine. He spent 15 years as a software developer and four years conducting educational research, focusing on one-to-one laptop programs and classroom use of automated writing evaluation software. His primary research interests are technologies for middle school literacy and informal science learning through video games. He can be contacted at [email protected].
Mark Warschauer is professor of education and informatics at the University of California, Irvine, and director of the Digital Learning Lab at the university. He is also director of UCI’s Ph.D. in Education program, which includes a specialization in Language, Literacy, and Technology. His most recent book is Laptops and Literacy: Learning in the Wireless Classroom (Teachers College Press, 2006). He can be contacted via his Website at http://www.gse.uci.edu/markw.
Technology and Assessment Study CollaborativeCaroline A. & Peter S. Lynch School of Education, Boston College
www.jtla.org
Editorial BoardMichael Russell, Editor Boston College
Allan Collins Northwestern University
Cathleen Norris University of North Texas
Edys S. Quellmalz SRI International
Elliot Soloway University of Michigan
George Madaus Boston College
Gerald A. Tindal University of Oregon
James Pellegrino University of Illinois at Chicago
Katerine Bielaczyc Museum of Science, Boston
Larry Cuban Stanford University
Lawrence M. Rudner Graduate Management Admission Council
Marshall S. Smith Stanford University
Paul Holland Educational Testing Service
Randy Elliot Bennett Educational Testing Service
Robert Dolan Pearson Education
Robert J. Mislevy University of Maryland
Ronald H. Stevens UCLA
Seymour A. Papert MIT
Terry P. Vendlinski UCLA
Walt Haney Boston College
Walter F. Heinecke University of Virginia
The Journal of Technology, Learning, and Assessment