Embed Size (px)
Citation preview

LAPPEENRANTA UNIVERSITY OF TECHNOLOGY
School of Business
Master’s Degree Programme in Supply Management
Marcella Anjani
Optimization of Transportation System by Tailored Logistics Network: A Case
Study in Automotive Industry
Supervisor: Professor Veli Matti Virolainen
Professor Katrina Lintukangas
ABSTRACT
Author: Marcella Anjani
Title: Optimization of Transportation System by Tailored Logistics
Network: A Case Study in Automotive Industry
Faculty: School of Business
Major: Supply Management
Year: 2014
Master’s Thesis: Lappeenranta University of Technology
72 pages, 13 figures, 25 tables, 4 appendices
Examiners: Professor Veli Matti Virolainen
Professor Katrina Lintukangas
Keywords: tailored logistics, supply chain, transportation network, direct
shipment, Kanban, milk-run, milk-run via DC, automotive industry
This thesis aims to redesign the supply chain system in an automotive industry in order
to obtain space reduction in the inventory by using tailored logistics network. The
redesigning process by tailored supply chain will combine all possible shipment
methods including direct shipment, milk-run, milk-run via distribution center and
Kanban delivery. The current supply chain system in Nissan goes rather well when the
production volume is in moderate level. However, when the production volume is high,
there is a capacity problem in the warehouse to accommodate all delivered parts from
suppliers. Hence, the optimization of supply chain system is needed in order to obtain
efficient logistics process and effective inventory consumption.
The study will use primary data for both qualitative and quantitative approach as the
research methods. Qualitative data will be collected by conducting interviews with
people related to procurement and inventory control. Quantitative data consists of list
of suppliers with their condition in several parameters which will be evaluated and
analyzed by using scoring method to assign the most suitable transportation network
to each suppliers for improvement of inventory reduction in a cost efficient manner.

ACKNOWLEDGEMENTS
First of all, I would like to express my gratitude to Jesus Christ for His blessing that has
been establishing me to complete this thesis.
I take this opportunity to thank Nissan Motor Indonesia for the opportunity to conduct
this study and for providing material and information support. I also want to thank all
team members of Purchasing and Logistics Department for the support of information,
guidance and discussion through the observation time.
I am highly thankful to my supervisors Professor Veli Matti Virolainen and Professor
Katrina Lintukangas for their guidance and advice to this thesis improvement.
Last but not least, I would also like to deliver my eternal appreciation towards my
beloved fiancé Ivan, my parents, my brother, and all of my family and friends for their
unconditional support and encouragement. Thank you for being understanding.
Through all their support, I proudly present this thesis.
Lappeenranta, 4th of January 2016
Marcella Anjani

TABLE OF CONTENTS
1. INTRODUCTION ................................................................................................... 1
1.1. Background ..................................................................................................... 1
1.2. Research Problems and Objectives ................................................................ 2
1.3. Theoretical Framework ................................................................................... 2
1.4. Definition of Key Terms ................................................................................... 4
1.5. Delimitations ................................................................................................... 5
1.6. Research GAP ................................................................................................ 6
2. SUPPLY CHAIN OPTIMIZATION .......................................................................... 7
2.1. Value Chain and Supply Chain Concept ......................................................... 7
2.2. Inventory Management ................................................................................... 9
2.2.1. ABC Analysis .......................................................................................... 10
2.2.2. Just-in-Time System ............................................................................... 12
2.3. Transportation Network for Competitive Advantage ...................................... 14
3. TYPES OF TRANSPORTATION NETWORK ...................................................... 16
3.1. Direct Shipment ............................................................................................ 16
3.2. Milk Run System ........................................................................................... 17
3.2.1. Direct Milk-run ........................................................................................ 19
3.2.2. Milk-run via Distribution Center .............................................................. 20
3.2.3. The Benefits of Milk-run Implementation ................................................ 21
3.3. Kanban System ............................................................................................. 23
3.3.1. Key success of Kanban system .............................................................. 25
3.3.2. The Advantage of Kanban System ......................................................... 26
3.4. Cross-docking ............................................................................................... 27
3.5. Tailored Network ........................................................................................... 27
3.5.1. Tailored Network in Supply Chains......................................................... 29
3.5.2. Tailored Transportation by Distance and Density ................................... 29
3.5.3. Tailored Transportation by Size .............................................................. 30
3.5.4. Tailored Transportation by Demand and Value ...................................... 31
3.5.5. Tailored Risk Mitigation Strategy ............................................................ 32
4. RESEARCH METHODOLOGY ........................................................................... 36

4.1. Data Collection .............................................................................................. 36
4.2. Methodology ................................................................................................. 37
5. PRESENTATION OF THE CASE COMPANY ..................................................... 40
5.1. Overview of the Company ............................................................................. 40
5.2. Current Supply Chain System ....................................................................... 40
6. ANALYSIS FOR TAILORED NETWORK ............................................................ 43
6.1. Criteria for Network Options .......................................................................... 43
6.1.1. Direct Shipment ...................................................................................... 44
6.1.2. Milk-run ................................................................................................... 44
6.1.3. Milk-run via DC ....................................................................................... 46
6.1.4. Kanban System ...................................................................................... 47
6.1.5. Overall Criteria for Each Network ........................................................... 48
6.2. Parameters Analysis ..................................................................................... 50
6.2.1. Transportation Cost ................................................................................ 50
6.2.2. Level of Demand and Stability ................................................................ 51
6.2.3. Size of the Goods ................................................................................... 54
6.2.4. Suppliers’ Geographic Location .............................................................. 55
6.2.5. Overall Condition of Suppliers ................................................................ 57
6.3. Network Selection ......................................................................................... 58
7. RESULT .............................................................................................................. 62
7.1. Framework of Tailored Network .................................................................... 62
7.1.1. Scenario for Milk-run Networks .............................................................. 62
7.1.2. Final Framework of Tailored Network ..................................................... 66
7.2. Cost Calculation ............................................................................................ 67
8. CONCLUSION ..................................................................................................... 71
REFERENCES ........................................................................................................... 73
APPENDICES
Appendix 1. Data of suppliers’ categories in each parameter
Appendix 2. Suppliers scoring process

Appendix 3. Suppliers’ final score and solution
Appendix 4. Transport cost data
LIST OF FIGURES
Figure 1. Theoretical framework
Figure 2. Typical result of an ABC analysis
Figure 3. Direct shipment
Figure 4. Implemented milk-run
Figure 5. Milk-run with direct shipment
Figure 6. Milk-run with distribution center
Figure 7. Flowchart in a two-card Kanban system
Figure 8. Tailored risk mitigation strategies
Figure 9. Framework of research methodology
Figure 10. Actual condition where parts are placed outside
Figure 11. NMI’s warehouse capacity
Figure 12. Fluctuation of each car model
Figure 13. Scoring category
LIST OF TABLES
Table 1. Classification in ABC analysis
Table 2. Types of transportation network
Table 3. Tailored network based on customers’ distance and density
Table 4. Tailored strategy based on product and value demand

Table 5. Data collection
Table 6. Parameters for assigning delivery method
Table 7. Relationship between parameters and network options
Table 8. Criteria for each network
Table 9. Suppliers’ classification of transportation cost
Table 10. Data of production schedule
Table 11. Calculation of fluctuation
Table 12. Level of demand and stability for each model
Table 13. Number of suppliers in demand and stability parameters
Table 14. Suppliers’ classification based on size of goods
Table 15. Suppliers’ geographic location parameters
Table 16. Suppliers’ classification of each parameter’s category
Table 17. Number of suppliers in each network
Table 18. Suppliers mapping in direct milk-run and milk-run via DC
Table 19. Network selection preference condition
Table 20. Fixed suppliers mapping in direct milk-run and milk-run via DC
Table 21. Final framework of tailored network
Table 22. Fixed number of suppliers of each network
Table 23. Calculation of 3PL service fee
Table 24. Cost calculation for milk-run via DC network
Table 25. Summary of cost calculation

1
1. INTRODUCTION
1.1. Background
The role of supply chain management has been well known in modern business
industries. Furthermore, it is obvious that transportation plays a significant role in the
global supply chains. There are many cases where freight transportation contributes
up to two-thirds of the total logistics cost in many cases (Ghiani, Laporte & Musmanno,
2004). Hence, transportation network becomes an important issue to be taken into
account in managing supply chain system. It is crucial to apply suitable network of
transportation to enhance the value of supply chain and achieve an effective and
efficient supply distribution.
This thesis will take Nissan Motor Indonesia, a Japanese car manufacturing located in
Indonesia, as a case company. The current supply chain in Nissan goes rather well by
direct delivery from suppliers to manufacturing plant in any condition except when the
production volume is high. At a certain level, when the production volume is high and
causes high amount of parts to be delivered from suppliers, Nissan faces a problem of
warehousing the delivered parts before they are taken to production line. The capability
of current warehouse is not enough to accommodate all of those parts. However, due
to unstable level of demand, Nissan does not will to invest for constructing a new
warehouse. Hence, it is better to improve the supply chain system to get more efficient
supply chain process and to save some area in the inventory.
Designing the structure of supply chain network in automotive industry could be a
complex decision-making process as there are plenty of aspects needed to be
considered. Given those information, the company has to decide how to allocate all of
its resources to fulfill supply chain for production process. This thesis deals with figuring
out how company takes collaborative supply chain methods in the way to obtain time
and cost efficiency and warehouse space effectiveness.
In the real condition, suppliers are often located in random area and there are various
delivery quantities depending on the fluctuation level of demands. Hence, in this

2
situation, a combination of different transportation networks can be applied to have
better supply chain system. (Liu, Li & Chan, 2003).
1.2. Research Problems and Objectives
The current condition of inventory in company’s case is often overfilled by upcoming
parts which are still awaits to be transferred to production line. However, due to
inconsistency demands, the company does not intend to make investment in building
a new warehouse. Therefore, it is very good to optimize the transportation network of
parts delivery method from suppliers to the manufacturing plant in order to fulfill the
warehouse capacity even in the condition when the production volume is high.
The main objective of the thesis is to optimize the supply chain operation in delivery
activities in order to reduce inventory consumption while the parts are await to be taken
into production line. The redesigning process will be conducted by assigning the most
appropriate delivery method for each supplier among several options of transportation
network: direct delivery, direct milk-run, milk-run with distribution center, and Kanban
delivery.
The research questions for this thesis are:
i) What is the most suitable division of different delivery methods to reduce
warehouse consumption in a cost-effective manner?
ii) What are the enablers and challenges in applying tailored network concept
as the company’s supply chain strategy?
1.3. Theoretical Framework
The focus of this thesis is to assign tailored network as the transportation method in the
case company. Tailored network is one kind of transportation network which combines
all possible delivery methods where in this thesis the methods taken are direct

3
shipment, direct milk-run, milk-run with distribution center, and Kanban delivery. The
theoretical framework for this study can be described by the following figure, in which
the concept of literature for each type of transportation network will be discussed.
Figure 1. Theoretical framework
The topic of this thesis is related to supply chain optimization with inventory
management as the main problem of the case company. One way to solve the
warehouse problem of the case company is to optimize the transportation network for
its supply chain system. This thesis attempts to apply tailored network as the proposed
transportation framework for reducing warehouse consumption in order to help solving
the inventory problem. Some of network options that will be used as alternative solution
in this study are direct delivery, milk-run network in both direct way and via distribution
center, and Kanban delivery.
The literature review in this thesis will consist of two parts based on theoretical
framework in figure 1. The first part is about supply chain optimization, which is
represented in the left figure, and consist of value chain and supply chain concept,
inventory management including ABC analysis as its supporting tool and Just-in-Time
as its supporting system, and transportation network for competitive advantage in
supply chain. In the second part of literature review, transportation network will be
Supply chain optimization
Inventory management
Transportation network
Transportation network
Direct shipment Milk-run
Direct milk-run Milk-run via DC
Kanban delivery
Tailored network

4
described and discussed, as the right part of the figure. The contents of this section are
types of transportation network. The first type is direct shipment. The second network
is milk-run system including the explanation about direct milk-run, milk-run via
distribution center, and the advantages of milk-run implementation. The third network
is Kanban system which includes key success and some benefits of Kanban system
application. The next one is cross-docking system which is briefly described since it
does not match with the study requirement. Finally, tailored network will be described
including its role in supply chain and its risk mitigation strategy. In tailored network
review, the system’s application will be also explained according to distance and
density, size, and demand and value.
1.4. Definition of Key Terms
The key concepts of this research, which is transportation network and its different
kinds of type, are defined in the following descriptions.
Supply Chains: An advanced logistics system where raw materials are processed to
become finished products and finally distributed to the end users. The process includes
vendors, manufacturing plants, warehouses, distribution centers and retail outlets.
(Ghiani et al., 2004, p. 8)
Inventory Management: The management of store of goods waiting to be assembled,
shipped, or sold. Recently inventory management is considered to be the key issue in
supply chains system planning and control. (Ghiani et al., 2004, p. 6)
Transportation Network: A bundle of transportation modes, locations, and routes
along where products can be delivered to the destination location. The performance of
supply chain in obtaining desired degree of responsiveness at low cost is affected by
the design of transportation network. (Chopra & Meindl, 2007, p. 54 & 395).
Tailored Network: The combination of all possible network options in order to obtain
cost reduction, inventory consumption effectiveness, and responsiveness improvement

5
in the supply chain operation by utilizing the most suitable option in each situation
(Chopra et al., 2007, p. 398).
Direct Shipment: A transportation network where the products are directly shipped
from the seller company to the end-user (i.e. from supplier to manufacturing company).
In direct shipment, lead times are reduced and there is no need of distribution center
facility. (Ghiani et al., 2004, p. 8)
Milk-run: A shipment method where a truck picks up goods from multiple supplier
locations and delivers to one buyer location, or distributes products from one supplier
to several buyer locations. Milk-run network can be applied directly or by using
distribution center. (Chopra et al., 2007, p. 396)
Milk-run with Distribution Center: The application of milk-run system where goods
from several suppliers are collected in DC before then distributed to the buyer location
(Chopra et al., 2007, p. 398).
Kanban delivery: A transportation system where the delivery is made in a certain short
time before the production schedule and the goods must be attached in a full container
while no partially filled container is allowed. Hence, the goods do not take much time in
the inventory since they are immediately transferred into the production line. (Graves,
Rinnooy-Kan & Zipkin, 2003, p. 647-648).
1.5. Delimitations
i) The analysis is conducted only to suppliers that provide transportation cost
data for their parts. All suppliers are required to submit breakdown quotation
for each part which includes material and process cost, and logistics cost.
Logistics cost can be break downed into packaging and transportation cost.
However, not all suppliers provide the detail breakdown of logistics cost and
therefore only suppliers which have transportation cost are taken as objects
for the case study.
6
ii) Each car model is represented by the most production volume of the variety.
For example, Nissan X-trail has three varieties (2.5 and 2.0 automatic
transmission and 2.0 manual transmission) and the data will use 2.5
automatic transmission since it has most volume compared to other varieties.
iii) The assignment criteria are classified into general level (i.e. transportation
cost as low, medium, high) to support the analysis process.
iv) The cost incurred by the final solution, i.e. distribution center cost, third party
logistics cost, etc., will be calculated roughly to be compared with the
transportation cost in current condition with direct delivery. Since the main
purpose of this study is to optimize delivery in the supply chain to reduce
warehouse consumption, not to get cost reduction, the cost calculation is
made only to see whether the proposed solution will arise much additional
cost.
1.6. Research GAP
According to Liu et al. (2003), the utilization of combined delivery methods has less
attention compared to single delivery system. This statement is supported by
Mokhtarinejad, Ahmadi, Karimi & Rahmati (2015), who claim that there are limited
research and less attention of optimization by using a combination of delivery system.
This thesis will try to analyze suppliers’ condition of the case company and use different
kinds of transportation methods by assigning the most suitable delivery network to each
supplier. The proposed tailored network in this case study aims to optimize the supply
chain system and to reduce the level of inventory consumption in the case company.

7
2. SUPPLY CHAIN OPTIMIZATION
2.1. Value Chain and Supply Chain Concept
Supply chain management is mainly representing the way that raw material flow
through several conversion process and finally become finished goods for the
costumers’ use (Robeson & Copacino, 1994). According to Lai & Cheng (2009), supply
chain activities include the process of movement from the source of raw material
acquisition to the result of finished goods. There are four core elements in the logistics
process: customers service, order processing, inventory management and
transportation network. Customers’ service represents the quality of managing the flow
of products and services by utilization of time and place in the seven rights (7R) which
is delivering the right products to the right customers at the right time and right place in
the right quantity and right condition at the right costs. Order processing includes all
activities related to the cycle of orders such as gathering, checking, entering and
transmitting information about the orders. The collected information could be useful
data for market and financial analysis, production planning and supply chain
operations. Inventory management relates to manage inventory as effective as possible
to support the demands in supply chain. Transportation network is about how to transfer
physical items e.g. raw material, semi-assembled products and finished goods,
between suppliers, manufacturing plants, distributors, retailers, and end customers in
the supply chain. (Lai et al, 2009)
The concept of supply chain is commonly classified into two categories: push system
and pull system. In push system, the amount of manufactured product is set based on
the number of customers’ demand. In other words, the production process is conducted
only when there are requested products from customers. This type of system, which is
also called make-to-order (MTO) system, does not require any inventories at the
manufacturer plant. In pull system, which also refers to make-to-stock (MTS) system,
the amount of production units is set based on forecasts and therefore cause
inventories both in company’s warehouses and at retailers’ site. This system is more

8
suitable for either long lead time production and distribution process, low cost products,
or high and stable level of demand. Another alternative is to apply a mixed approach
between both systems which is known as make-to-assemble (MTA) system. Here push
system is used to manufacture components and semi-finished goods while pull system
is applied in producing the final products. Inventories are needed to keep the
components and semi-finished goods before they are used to assemble the final
products. The final assembly stage is conducted immediately after customer’s orders
are received. (Ghiani et al., 2004)
The value chain principle should provide further thoughts on how supply chain can lead
the firms to competitive advantage in terms of cost and service. Originally, there are
two classifications of activities in the terms of value chain which are primary and support
activities. Primary activities includes those actions that are involved in the production
process, marketing and delivery service of the products or services. Support activities
are other primary tasks such as purchase inputs, technology, human resources
management and other necessary infrastructures to support the primary activities. Out
of five primary activities, two are related to logistics activities. The first one is the action
of supplying materials, parts or components, and other needed things for the production
process which is called inbound logistics. The second one is the activity of managing
the flow of finished products from the production line to customers which is called
outbound logistics. However, nowadays there are researches that have pointed out that
logistics also affect the customers’ satisfaction and overall performance of the
companies The impact of logistics performance to the firms’ ability to satisfy their
customers is also linked to customers loyalty and market share. Hence, developing
supply chain capabilities is important for companies in order to achieve cost and service
advantages. (Lai et al., 2009)
Recently, the value of supply chain management in terms of green logistics are also
broadly discussed. According to Vijayuargy & Agarawal (2013), the practices of green
supply chain management (GSCM) involves plenty of activities such as reducing and
recycling the waste which are discharged by the company as well as the waste that are

9
caused by other companies and taken by the companies with the intention of cost
advantage, corporate image, social and environment responsibility assessment.
Recently, the issues related to transportation industry over the impact of fuel usage in
operational cost has been increased. This concerns arise mostly in urban freight
transportation where most logistics and supply chain begins or ends and therefore also
encounters related ineffectiveness. (Arvidsson, 2013). The environmental and
sustainability issues in logistics activities has become a critical factor of business
strategy and competitive advantage (Fichtinger, Ries, Grosse & Baker, 2015). In this
case, managing efficient transportation networks in logistics activities could contribute
some improvements in these environmental and sustainability issues.
2.2. Inventory Management
Inventory is the stockpiles of products which are waiting to be manufactured,
distributed, shipped or sold. There are several typical examples of inventories:
component or semi-finished goods that are waiting to be assembled in manufacturing
plant (work-in-process), goods such as raw material, components and finished products
that are distributed through the logistics process (in-transit inventory), finished products
stored in distribution center waiting for being sold, or finished products stocked by final
users or customers to meet needs in the future. (Ghiani et al., 2004)
Inventory management should be considered as one of the most important concerns
regarding companies’ objectives of cost reduction and waste abolition (Patel & Patel,
2013). The requirement of time and effort for picking up the goods in a warehouse, or
in other words how the goods are retrieved from the shelves and delivered to a place
where they will be loaded into the trucks, is a crucial issue for performance
measurement (Kovacs, 2011). According to Fichtinger et al. (2015), the decision in
warehouse and inventory management including the supply lead times, reorder
quantities and storage equipment have significant impact to costs and emissions. An
optimal inventory management would lead to cost minimization and profit maximization
10
and a company’s performance could be improved through inventory reduction activities
(Koumanakos, 2008).
In inventory theory, the economic impact like a departure could be simulated by using
penalty cost of stock out as the substitute. Each unit of stock out penalty cost is
evaluated to the companies for every customer that the ready inventory cannot meet
the customer’s demand. There are plenty of interpretations on penalty cost such as
accelerated delivery, extra things at substitute retailers, higher cost of alternative, and
so on. Regularly, the penalty cost is meant to indicate the economic impacts about
missing goodwill of customers. Penalty cost is usually hard to forecast, and moreover
it is even more difficult to precisely simulate how the demand process can be affected
by the level of which demands that are not exceeding the stock level. (Olsen & Parker,
2008)
Inventory management involves the coordination of several activities e.g. planning,
organizing, controlling, directing, and with aims to obtain effective purchasing,
transportation, stocking and usage of inbound goods in manufacturing companies
centrally to production process activities. Hence, the inventory management in an
organization should be put into attention for improvement that results less interruption
in production operation and better performance in the process. The degree of available
working capital can also be improved by managing the proper stock level that leads to
more profitability in other sections. All of these goals are more likely possible to be
obtained through suitable integrated approach to inventory management functions.
(Akindipe, 2014)
2.2.1. ABC Analysis
ABC analysis is a common used method for optimizing inventory control by classifying
inventory items into three categories (A, B, C) based on their values. A category
contains items which are the most expensive ones and should be set as priority which
should be handled tightly. B category is the medium ones which need standard effort
of control. C category includes less expensive or the cheapest items that do not need

11
much attention. The principle of Pareto rule is the basis of ABC analysis, which
suggests that 20% of items need 80% of effort for inventory control while the remaining
80% only needs 20% of attention. (Waters, 2009)
The purpose of ABC analysis is to divide inventory items into different category and to
apply different strategy of inventory control to each category. This classification is made
because those items do not have equal value and importance. By listing the items into
three categories based on its level of importance, it can help inventory manager to set
different inventory control policy to each category and to pay more attention to the
critical items rather than all items in the inventory (Ballou, 2004). The process of
classification is based on calculation result of annual consumption value which is driven
by multiplying unit cost with annual demand. The following table shows typical result of
classification by percentage of number of items and items value in each category
(Waters, 2009).
Category Number of
Items
Number of
Values
A 10% 70%
B 30% 20%
C 60% 10%
Table 1. Classification in ABC analysis
According to the table above, ABC approach can be seen as a similar approach to
Pareto’s 80/20 rule principle. Category A has the most valuable items which worth
around 70% of the total consumption value and typically includes only 10% of the total
inventory items. Category B contains moderate valuable items which accounts for
about 30% of total inventory items. Items in category C only worth 10% of annual
consumption value but include around 60% of the total inventory items. On the whole,
10-20% of items, which is category A, approximately cover 70-80% of total value while

12
the rest 20-30% of values come from 80-90% of the total items which cover category B
and C. (Waters, 2009)
Figure 2. Typical result of an ABC analysis (Waters, 2009)
During the past decades, many researcher have been trying to develop the basic ABC
analysis which considers only one criteria for classification which is annual
consumption amount. The traditional ABC classification was considered less
productive for nowadays complex inventory items, since there are many organizations
such as P&G, Lenovo and ZTE which have thousands items in their inventories that
are heterogeneous. To solve such complex inventory items, the traditional ABD
analysis has been developed to be multiple criteria ABC inventory classification which
considers multiple criteria in the classification process (Liu, Liao, Zhao and Yang,
2015).
2.2.2. Just-in-Time System
Japanese manufacturing industries has been drawn attention to competitive success
by their principle of inventory reduction. One of their best known philosophy is just-in-
time system, which has some close synonyms in the global repetitive manufacturing
industrial all over the world such as zero inventory, stockless production, world class
13
manufacturing, etc. (Graves et al., 1993). Just-in-time is a strategy approach of waste
elimination throughout the whole supply chain and manufacturing process which is
represented by low level of inventory and high level of quality and customers’
satisfaction and its implementation could deliver highly significant impact on a
company’s performance and organizational culture (Cristopher, 1992). The principle of
JIT has been proven as an effective way of managing supply chain system in terms of
quality increment, productivity and efficiency improvement, better communication,
waste and cost decrease, and enhanced chances of companies to obtain competitive
advantage through their logistics system (Lai et al., 2009).
In terms of inventory management concerns, the philosophy of JIT can be applied for
identifying waste and service improvement in process such as to assign manpower and
required facilities to satisfy the needs of the distribution, to have less goods introduction
time by improving responsive delivery methods, to enhance service quality by fulling
buyer and seller relationship, etc. For example, bringing high volume of goods due to
lower price offered by suppliers or to avoid stock-out possibilities can be considered as
a waste in the inventory management which could cause additional expense by extra
manpower and space area to accommodate the excess goods. By JIT principle, all
kinds of raw material, semi-processed items or finished goods is only available in the
exact amount of quantity as it is needed. Hence, the application of JIT can be achieved
by eliminating unnecessary inventory and such thing as extra goods in inventory is not
allowed. Another example is when there are delays of information flow among
customers and suppliers which can cause excess stock. JIT system requires simple
and responsive procedures in the ordering process and therefore includes continuous
improvement and application of enabling information system such as Electronic Data
Interchange (EDI) or Value Added Network (VAN) in the procedures of information flow
to decrease the risk of delays which are caused by missing or mislead information. In
this way the supply chain system can have access to the necessary information for
decision making and as a result becomes enabled to responsively satisfy the market
demand. Overall, there are many ways where JIT concept which emphases on waste
14
elimination and service improvement can be implemented to improve the inventory
management. (Lai et al., 2009)
2.3. Transportation Network for Competitive Advantage
Rahman, Sharif and Esa (2013) states that nowadays companies must find the way to
improve their manufacturing operations in order to deal well with uncertain market
change and to stay competitive in global business competition and lean manufacturing
is one way of improving production performance. Supply chain management plays a
critical role in modern business industries, while transportation management is an
important driver of in supply chain since products are most likely not produced and
consumed in the same location (Chopra et al., 2007).
Transportation network plays an important role in nowadays economies as it makes
possibilities to have production process and consumption taking place in faraway
location from each other which causes wider market. Due to this advancement, direct
competitions between manufacturing companies from different countries become
simulated and those companies to utilize economies of scale are driven. In addition,
industries from developed countries might have benefits of less manufacturing
operation salary in developing countries. As a result, perishable products are now
available to be produced and consumed in a global worldwide market area. (Ghiani et
al., 2004)
As transportation cost could contribute up to two of thirds of the total logistics costs, it
becomes even more important in the global supply chains (Ghiani et al., 2004). There
are plenty of big corporations that have optimized their transportation designs in order
to achieve cost reduction and competitive advantage in the global business industries.
For instance, Dell which currently has suppliers in global worldwide area has managed
to sell its products to customers all over the world from few plants only by managing
well the transportation in global network. Another example is Seven-Eleven Japan that
has successfully managed the transportation network to obtain one of its business
goals, which is availability to carry products from the stores to meet the customers

15
demand while the customers are vary either by geographic location or time in a day. In
this case, Seven-Eleven applies a transportation network which is very responsive and
able to reload the stores several times in a day in order to satisfy customers’ needs.
(Chopra el al., 2007)
Transportation management in supply chain also functions to create effective inventory
consumption and operate with less facilities which lead to cost efficiency (Chopra et al.,
2007). There was a research conducted to General Motors assembly plant with the aim
of reducing the supply chain costs by optimizing the transportation network
managements from its warehouses (Cristopher, 1992). Dell manufacturing company
also arranges its transportation network in order to be able to offer customers highly
customized products with such affordable prices. Another case is a web based online
shop Amazon that has successfully managed to improve its package carriers and
transportation system to deliver the products to customers from a centralized
warehouse. (Chopra et al., 2007)

16
3. TYPES OF TRANSPORTATION NETWORK
This chapter describes different kinds of transportation network that will be used as
alternative solutions in this study. According to Du, Wang & Lu (2007), there are
numbers of network solutions for a transportation method including direct shipment,
cross-docking, milk-run and tailored network. The following subchapters provide the
description and explanation about each type of transportation network.
3.1. Direct Shipment
Direct shipment is the most basic and pure transportation method for goods delivery.
In direct shipment, suppliers are independently with their own fleet delivering ordered
products to the manufacturing plant. (Liu et al., 2003) Direct shipment, where products
are directly delivered from the suppliers to the manufacturing plant (Ghiani et al., 2004,
8), is a good option when the shipment satisfies a full truckload. On the other hand,
when the shipments are less than a full truckload, the other types of transportation
network should be taken into consideration (Du et al., 2007). The following figure
illustrates the basic concept of direct shipment network, where each supplier utilizes
their own truck or own service from third party logistics to load their products into the
truck and deliver the goods to the manufacturing plant.
Figure 3. Direct shipment
17
The main benefit of using direct shipment is the simple coordination needed to operate
this system and there is no necessity of transshipment facility or intermediate
warehouse (Chopra et al., 2007). According to Liu et al. (2003), direct shipment can
be an appropriate option if the quantity of order is high or the total lot size in one
shipment is large enough to fulfill the full truck loads in each shipment of goods. This
statement is supported by Mokhtarinejad et al. (2015) who states that in those
conditions, the vehicle cost of transportation is higher than the shipment through cross
docking system. However, when the lot size is small or the demand is not high enough
to meet the full truck load requirement, the other types of delivery network can be
utilized to reduce the transportation cost (Liu et al., 2003). Furthermore, the fully
implementation of direct shipment is not flexible that it might cause delays and lead to
penalty. Therefore, it is necessary to enlarge the design of transportation network by
using mixed delivery methods in order to increase flexibility in the system.
(Mokhtarinejad et al., 2015)
3.2. Milk Run System
Milk-run system, additionally known as cyclic product taking, originates from northern
ancient system for mercantilism milk within the West, wherever the deliveryman
accustomed walk to the customers’ homes along with his horse-cart during a such that
route, put the bottled milk in front of the consumers’ doors, and take back the empty
bottles (Sadjadi, Jafari & Amini, 2009). This system is economical once the loading
volume of every provider is actually less than a truck load and infrequently enforced in
internal plant offer chain system to move raw materials, finished merchandise, and
waste between producing or assembly stations and therefore the warehouse of the
assembly plant (Kovacs, 2011). Milk run supply has been enforced in many various
industries and automotive companies is the main industry that there have been several
automotive manufacturing companies implementing this distribution method (Du et al.,
2007).

18
The pick-up and delivery of components in milk-run distribution network is operated
through defined routes on set schedules, where every route consists of several points
of assembly line stations that have been defined (Patel et al., 2013). The route, type,
time schedule, and also the variety of components are determined where numerous
trucks has to retrieve the goods from some different spots of suppliers and every trucks
has to take the empty pallets back to the demand center (Sadjadi et al., 2009).
Figure 4. Implemented milk-run (Brar et al., 2011)
The first step of implementing milk-run system is to pick out the suppliers for routing
integration. The suppliers’ selection process is made according to supported location,
material specification, and delivery performance. The most effective way to optimize
the transport route potency is to choose a set of suppliers that are aggregately located
near one another in one route, even when their location is not close to the manufactory.
Once the chosen suppliers are obtained, it involves modeling and coming up with route
for the milk-run system. After the route cycles are determined, the next step is to
negotiate the pick-up and delivery service fee per route with the third party logistics.
The third party logistics should provide the trucks to pick up the products from suppliers

19
and take them to the assembly plant according to the schedule that has been set within
the routes cycle. Another major factor is that suppliers should be well-informed in
advance regarding the volumes of the goods and the pick-up schedules for daily milk-
run route transportation system before the full implementation (Brar & Saini, 2011).
3.2.1. Direct Milk-run
According to Chopra et al. (2007), milk run system can be implemented in both direct
and shipment with distribution center. Direct shipment with milk run is a route of goods
delivery either from multiple suppliers to a single buyer or from a single supplier to
multiple buyers. The following figure illustrates the milk-run with direct shipment
distribution system routes in both ways.
Figure 5. Milk-run with direct shipment
Direct milk-run network has an advantage that intermediate warehouse or temporary
distribution center is not necessary so that the transportation cost would be more
effective as milk-run with direct shipment consolidates directly deliveries from or to
multiple suppliers or buyers location on a single vehicle. The lot size replenishment of
each supplier or buyer location might be small and when the lot size is sent directly,

20
LTL shipment is needed. Direct milk-run application sets the shipments from or to
multiple locations by consolidated in a vehicle which makes improvement in trucks
utilization and also cost reduction. The implementation of direct milk-run can
significantly reduce the transportation cost when the small deliveries are frequent
enough on a regular basis and the suppliers or buyers group location are aggregated
in geographic proximity. For example, Japanese automobile industry Toyota applies
milk-run distribution system for parts deliveries from suppliers to support the supply
chain and Just-in-Time manufacturing operation system in Japan and United States. In
Japan, where Toyota has many manufacturing plants, the milk-run deliveries are
implemented from a single supplier to multiple manufacturing plants location. While in
United States the milk-run deliveries are applied from multiple suppliers to the
manufacturing plant. (Chopra et al., 2007)
3.2.2. Milk-run via Distribution Center
In milk-run shipment using distribution center, goods from several suppliers are
collected in DC before then picked up to the manufacturing plant. Milk-run with DC is
good to be applied if the lot sizes of the goods are small and the location of buyers or
suppliers to the manufacturing plant is in long distance (Chopra et al., 2007). The
following figures illustrates the milk-run delivery via distribution center.
Figure 6. Milk-run with distribution center

21
This combination system has been implemented in different kinds of industries such as
the convenience store 7-Eleven Japan, online grocer Peapod, and children’s wear
manufacturer OshKosh B’Gosh. 7-Eleven applies this concept in shipping small
replenishment lots to each of its stores. The fresh food which are delivered from its
suppliers are consolidated in a distribution center before being sent to the retail outlets
by milk-run distribution system. These activities result in transportation cost reduction
as the total shipment to a store from all the vendors cannot fill a full load truck. Peapod
also implements this system for lowering the transportation expense of small shipments
delivery to homes. Furthermore, OshKosh B’Gosh has managed to utilize this system
for cutting LTL shipments from the distribution center to retail stores. (Chopra et al.,
2007)
3.2.3. The Benefits of Milk-run Implementation
The advantages of milk-run application are transportation cost reduction, warehouse
and inventory improvement, and optimization of trucks utilization that can also result to
less CO2 emissions in terms of green supply chain management issue. Arvidsson
(2013) states that recently there are concerns about transportation activities regarding
the usage of fuel which impact to environments issue. Urban freight transportation is
the most case in which this concern happens, where most supply chain transportation
activities begins or ends. Moreover, this condition is also related with inefficiencies. The
major purpose of operating milk-run is to decrease the amount of transportation cost
either by reducing the total distance that have to be passed through the transporting
process or optimizing the number of trucks used (Gyulai, Pfeiffer, Sobottka & Vancza,
2013). A milk-run system was also proposed for an automobile manufacturing industry
in Indonesia by using Differential Evolution algorithm method to optimize the vehicles’
travelled distance to obtain efficient routes and effective truck’s utilization in the
company. The study was applied to 30 suppliers and the proposed network was then
compared to the current system that was applied. The analysis result indicated that the
proposed system might decrease the total distance up to 1,230 km each day or around

22
15.23%, which leads transportation cost reduction up to IDR 10 million or around
25.21%. (Rachman, Dhini & Mustafa, 2009)
Volling, Grunewald & Spengler (2013) stated that milk-run network is one of the most
expansive strategies that can be applied in centrally operating coordinated inbound
logistics which facilitates the regular delivery of less than a full truckload volumes and
therefore contributes towards lead time reduction. This network could bring
consolidated collection of parts necessary to improve the logistics systems, which also
comes up with improvement of the production line in the assembly or manufacturing
process and better Just-in-Time (JIT) products delivery due to the synchronization (Brar
et al., 2011). After observing the warehousing and inventory assignment problems with
milk-run distribution system, Kovacs figured out that the proposed distribution network
might result some advantages compared to the previous system which was operated
based on classification for the solution in related warehouse and inventory problems
(Kovacs, 2011).
Another research done by Kumar and Shilpa’s (2014) showed that milk-run distribution
system is an efficient transportation network for inventory optimization as it optimizes
the loading rates in possible levels and decrease the amount of vehicles and travel
distance. This delivery network can also improve the production line logistics system
particularly in JIT distribution. Nemoto, Hayashi & Hashimoto (2010) stated that milk-
run network has been considered as a standard method of an overseas system of JIT
principle. The schedules and time table of parts pick-up and delivery activity are
arranged and defined according to JIT production system, neither late nor early, where
the full truckload of goods are picked up and delivered to the buffer stock inventory
location in order to support the production process in the assembly line station (Patel
et al., 2013).
Milk-run logistics network also plays a role in green supply chain management issue.
The main problem in global level is the feedback on environmental issues. In this case,
one of the major concerns in logistics field is how to reduce the amount of CO2
generated from the shipping activities. (Nemoto et al., 2010) Milk-run logistics system

23
is aimed to optimize loading rates at possible levels that results to decreased trucks
utilization and travel distance. Therefore, milk-run can be considered to be a good
logistics network that can result less exhaust gas of vehicles. Hence, in terms of
environmental policy, the promotion of milk-run system should be highly evaluated.
(Brar et al., 2011)
A case of Webasto/Schenker’s scheme of suppliers’ delivery method was discussed by
Nemoto (2013). In this case, the vehicles kilometers can be saved up to 30% by using
milk-run network while the rest 70% was caused mostly by modern trucks fleet. Hence,
it can be concluded that about one third of the total environment cost can be saved.
(Nemoto, 2013) Another research was conducted in a Japanese automotive
manufacturing company in Thailand where the logistics operation systems were
compared. In this case, milk-run application can decrease up to 13.6 tons of CO2 gas
emissions each day which is around 53% reduction compared to the distribution system
without milk-run. On the whole, milk-run network can be considered as a big step
towards the achievement of green supply chain management. (Nemoto, 2013)
3.3. Kanban System
Another delivery method is by using Kanban system. Kanban is one of the most
supporting aspects of Just-in-Time system that can achieve inventory efficiency. In
Kanban system, the in-process of inventories is effectively limited and the
transportation of material to production stage is coordinated effectively. (Graves et al.,
1993) This statement is supported by Naufal, Jaffar, Yusoff and Hayati’s (2012) Kanban
research at manufacturing company in Malaysia which concludes that developing
Kanban system could result in reducing lead time and minimizing inventory as well as
optimizing warehouse area. Their study states that Kanban system distributes part in
right amount, right type, right place, and right time and therefore manages to control
smooth material flow in supply chain with minimum level of inventory (Naufal et al.,
2012).

24
Kanban system uses Kanban cards to authorize transportation of goods for production
process which requires clear information of material type and amount, the authorized
material transportation, and the location of material to be stored (Graves et al., 2012).
There are two kinds of Kanban card systems: single-card and two-card Kanban system.
Single-card Kanban system uses one card, which is called Production Instruction
Kanban (PIK), to trigger the upstream productions that are necessary. Two-card
Kanban system also uses PIK card and another card which is called Production
Withdrawal Kanban (PWK). PIK in two-card Kanban system card is used for pulling
what is needed for preceding process and PWK card is used for instructing previous
process to produce necessary things for inventory replenishment. (Naufal et al., 2012)
The following figure illustrates the flow process of information and material in two-card
Kanban system.
Figure 7. Flowchart in a two-card Kanban system (Waters, 2009)

25
3.3.1. Key success of Kanban system
According to Rahman et al., (2013), there are several factors needed in order to
successfully operate Kanban system which are top management’s support and
commitment, suppliers’ participation, good inventory management and quality
improvement.
In nowadays organization situation, employees’ commitment and nice rapport between
staffs and managers are the most necessary in order to maintain good teamwork and
cooperation among organization members to obtain their goals. Active participation of
all workers are needed to the success of the new implemented Kanban network as well
as the organizations succeed in the future. Therefore, it is important for top
management level in supporting their employees by treating them well and fairly so that
they can give total contribution in what they do for the company. (Rahman et al., 2013)
Supplier’s participation are also needed in Kanban delivery provide quick services and
efficient material supply. Since Kanban system should minimize the inventory
consumption where the size of inventories needed should be equal with the size of
goods for production line, supplier’s commitment is very crucial to support the
production process going smoothly and effectively. There are some parameters that
should be considered in selecting suppliers for Kanban implementation: the quality of
suppliers, suppliers’ willingness to cooperate, technical competence, suppliers’
geography location to the manufacturing plant, and products price. As the main
objective of this system is to reduce the consumption in inventory, implementing this
system needs excellent tuning suppliers and production scheduling system so that
inventory level can be minimized by delivering the goods when they are needed to be
immediately taken into the production line and work in progress should be maintained
under monitoring. (Rahman et al., 2013)
In real condition, managing inventory is a complex problem as it deals with many factors
and uncertainty. There are four classifications of inventory issues: raw material
inventory, work in progress inventory, finished goods and maintenance, repairing and
operating inventory. Inventory management becomes more complicated as there are
26
many things involved including storage and holding cost and capacity issue in the
factory. (Rahman et al., 2013) Applying Kanban system will help to reduce space in
inventory and avoid any capacity problem.
Besides inventory reduction, Kanban system can also maintain and control quality
improvement of the finished goods. In traditional time, companies believe that quality
needs more cost, production defects can be occurred due to human error, and it is
enough to have minimum level of quality as long as costumers are still satisfied. While
in companies which have implemented Kanban, they believe that quality can result less
cost, production defects are mostly caused by system, and quality should be
continuously improved with the principle of Kaizen concept. When a company has
successfully applied Kanban system, it will control all delivered goods and make sure
that they meet certain level of quality standard before accepting those goods for the
next operation process or distributed to the customers. Organizations with Kanban
principle will believe that by improving the process they can produce things with
guaranteed good quality and by producing good quality products they can achieve a
competitive advantage. (Rahman et al., 2013)
3.3.2. The Advantage of Kanban System
There are plenty of benefits of Kanban application in operation management and
business industry. Implementing Kanban system could help companies to acquire
productivity improvement and waste reduction in their production process. (Rahman
et al., 2013). Naufal et al. (2015) states that Kanban demonstration is necessary to
ensure that the flow of material in the manufacturing process keeps going smoothly and
applying Kanban with full commitment could also optimize and improve the industry’s
capability of satisfying customers’ demands.
After developing Kanban system in a local manufacturing company, Naufal et al (2015)
found that the company could successfully obtained significant improvement in some
of its sectors. Some of the improved areas are lead time shortened by 40%, reduction
in in-process and finished goods inventory consumption by 23-29%, and finished goods

27
area optimization by 4%. The lead time can be reduced as the production is operated
only according to Kanban card instruction. The principle of Kanban in terms of variety
of product level and mixing could prevent proceeding production of products that are
not demanded which therefore minimizes the consumption of finished goods inventory.
Furthermore, Kanban has several tools that can be used to help decision makers to
determine which types of products are needed to be produced. (Naufal et al., 2015)
3.4. Cross-docking
Cross docking, also known as just-in-time distribution, is a transferal facility where the
goods from incoming shipments are sorted, consolidated with other goods, and then
transferred directly to outgoing trailers without intermediate storage or order picking
(Ghiani et al., 2004). In other words, it will just take a short period of time for the
products to stay in the facility before they are taken into the users. If the products are
placed in the transshipment facility for longer period of time, this can be called
warehousing system. There are four major activities in the warehousing system
according to Ghiani et al. (2004): receiving the incoming products, putting them in
storage, and finally order picking and shipping the products to the next destination.
Hence, the function of storage and order picking could be the most expensive
operations due to the fee of the inventory holding and labor cost. Since cross-docking
is mostly used for distributing products from retailer to customers, this system will not
be considered as an alternative in this study.
3.5. Tailored Network
Tailored network is the combination of both full truckload and less truckload shipment
by shipping high volume orders from suppliers directly to customers and distributing
less truckload shipment orders by using the other distribution systems (Du et al., 2007).
As tailored network utilizes several different kinds of shipment method, the
implementation of this network requires high investment for information infrastructure
for facilitating more advanced coordination. The main purpose of tailored network is to

28
reduce the transportation and inventory cost. The following table shows the advantages
and disadvantages of each transportation network model including tailored logistics
network. (Chopra et al., 2007)
Transportation Network Strength Weakness
Direct shipment No transshipment facility
needed and simple
coordination
High level of inventory
High expense for receiving
Direct milk-run Transportation cost
reduction and lower
inventory level
Increase in coordination
complexity
Milk-run with DC Lower outbound transport
cost for small lots
Further increase in
coordination complexity
Kanban No additional cost required
for operation process
Limited to close suppliers
location and full TL condition
Tailored network Most suitable transportation
option based on needs of
individual product and store
The highest level of
coordination complexity
Table 2. Types of transportation network
There are number of researchers who have been studying the possibility of
implementing different kind of transportation networks. Liu et al. (2003) design a
transportation model with heuristic algorithm in combining direct shipment and hub-
and-spoke with milk-run distribution system. Hosseini, Akbarpourshirazi & Karimi
(2014) propose a transportation network approach with cross-docking system and milk-
run distribution in a consolidation network by using a hybrid of harmony search and
simulated annealing approach. They focus of tailored network simultaneously
implementation in order to reduce the transportation cost in the distribution system
(Hosseini et al., 2014).

29
3.5.1. Tailored Network in Supply Chains
Tailored transportation network utilizes different types of networks based on the
products and customers characteristics. There are plenty of companies that produce
variety of goods and sell them to different segments of customers. The variety of the
products can be in the size, value, and other factors while the variety of customers can
be in their responsiveness, loyalty, amount of their purchase, uncertainty of their orders,
and so on. Due to these differences, those companies should not use the same design
of transportation network to serve all needs. On the contrary, customers need can be
satisfied at a more cost efficiency by implementing tailored transportation network to
use the most suitable network based on the products and customers characteristics.
The design of the transportation for tailored network can be adjusted based on
customers’ density and distance, customers’ size, and products’ demand and value in
order to obtain suitable responsiveness and cost effectiveness. (Chopra et al., 2007)
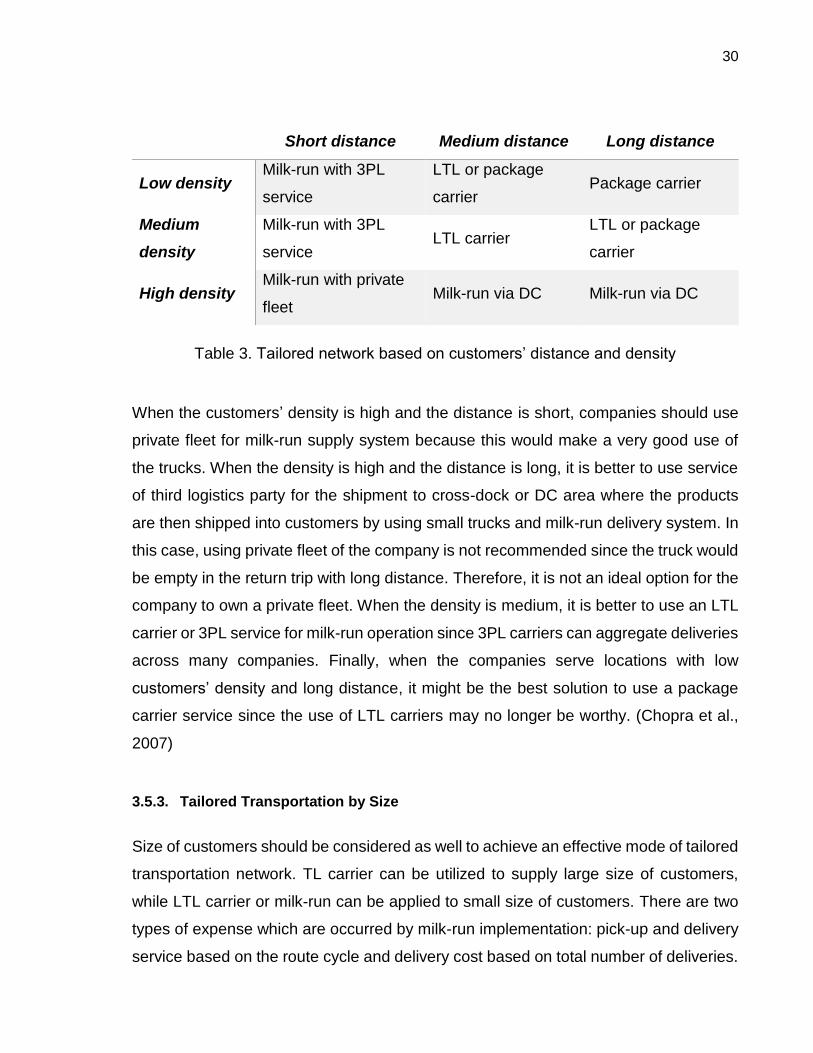
3.5.2. Tailored Transportation by Distance and Density
The density and distance of the customers should be taken into consideration in
designing the logistics methods for tailored transportation network. The condition of
customers’ density and distance are significant factors to degree of provisional
aggregation in delivery to customers. Locations with high customers’ density are more
likely to give adequate transportation’s economies of scale and result provisional
aggregation less valuable. Thus, companies should serve this type of area more
frequently. For locations with low customers’ density, companies should increase the
degree of provisional aggregation in order to save transportation costs. The following
table shows the ideal network for each condition of costumers’ distance and density.
An industrial distributor of office suppliers, Boise Cascade Office Products, has referred
to suggestions based on below table in designing its transportation networks. (Chopra
et al., 2007)
30
Short distance Medium distance Long distance
Low density Milk-run with 3PL
service
LTL or package
carrier Package carrier
Medium
density
Milk-run with 3PL
service LTL carrier
LTL or package
carrier
High density Milk-run with private
fleet Milk-run via DC Milk-run via DC
Table 3. Tailored network based on customers’ distance and density
When the customers’ density is high and the distance is short, companies should use
private fleet for milk-run supply system because this would make a very good use of
the trucks. When the density is high and the distance is long, it is better to use service
of third logistics party for the shipment to cross-dock or DC area where the products
are then shipped into customers by using small trucks and milk-run delivery system. In
this case, using private fleet of the company is not recommended since the truck would
be empty in the return trip with long distance. Therefore, it is not an ideal option for the
company to own a private fleet. When the density is medium, it is better to use an LTL
carrier or 3PL service for milk-run operation since 3PL carriers can aggregate deliveries
across many companies. Finally, when the companies serve locations with low
customers’ density and long distance, it might be the best solution to use a package
carrier service since the use of LTL carriers may no longer be worthy. (Chopra et al.,
2007)
3.5.3. Tailored Transportation by Size
Size of customers should be considered as well to achieve an effective mode of tailored
transportation network. TL carrier can be utilized to supply large size of customers,
while LTL carrier or milk-run can be applied to small size of customers. There are two
types of expense which are occurred by milk-run implementation: pick-up and delivery
service based on the route cycle and delivery cost based on total number of deliveries.
31
Transportation cost for pick-up and delivery service would be equal either for small or
large customers. The transportation cost can be optimized by including some deliveries
to small customers into a delivery to large customers depending on the vehicle capacity
condition. However, as the delivery cost per unit for small customers is higher than for
big customers, it is not efficient to make delivery to small and large customers in the
same frequency with equal cost. There are some options in this situation that the
companies can do. The first solution is to charge more delivery price to small
customers. The other alternative is to arrange the milk-run route to go to large
customers with high level of frequency than to small customers. The customers can be
classified into small (S), medium (M) and large (L) size based on the demand of each
customer. The milk-run route can be optimized by combining small, medium and large
customers in each cycle. For example, delivery to large customers can be made every
milk-run route, delivery to medium customers can be made in every other milk-run route
and delivery to small customers can be made every three milk-run routes. This
combination of tailored sequence gives a benefit that each vehicle would carry almost
the same level of load and deliveries to large customers are made more often than
small customers based on the relative delivery cost. (Chopra et al., 2007)
3.5.4. Tailored Transportation by Demand and Value
In many cases, there are varieties of demand and value in the products that companies
should apply appropriate degree of inventory aggregation and method of transportation
network used in the supply chain system. The following table shows the variety of
suitable network and inventory setting based on products demand and value condition.
(Chopra et al., 2007)

32
Table 4. Tailored strategy based on product value and demand
For products with high value and demand, the inventory cycle should not be aggregated
to optimize the transportation cost since it allows replenishment of orders to be
delivered in lower cost. Fast mode of transportation is allowed to be applied when the
safety inventory, which can be aggregated for inventory reduction, is required to meet
customers demand. For products with high demand and low value, the inventories
should be disaggregated and kept near the customers to lower the transportation costs.
For high value and low demand products, the safety inventories should be aggregated
to reduce the inventory costs. For products with low value and low demand, the safety
inventories can also be aggregated to save the inventory costs and get some
advantages from aggregations. In this kind of products, the cycle inventory should be
held near the customers to reduce transportation costs and therefore can be
replenished by utilizing inexpensive method of transportation network for cost saving.
(Chopra et al., 2007)
3.5.5. Tailored Risk Mitigation Strategy
According to Chopra and Sodhi (2004), there are plenty of factors that drive the risks
in supply chain which can be classified into several categories: delays, disruptions,

33
forecast risks, procurement risk, systems risk, inventory risk, capacity risk, receivables
risk and intellectual property risk,. Each of those risk category might have some driven
factors. Delays might be caused by high capacity utilization at supply source, inflexibility
of supply source, poor quality or yield at supply source. Disruptions can be driven by
natural disaster, war, terrorism, labor disputes, and suppliers’ bankruptcy. Forecast
risks can be driven by inaccurate forecasts due to long lead times, seasonality, product
variety, short life cycles or small customers’ base. Bullwhip effect or information
distortion can also emerge forecast risk. Procurement risk is driven by exchange-rate
risk, fraction purchased from a single source and industry wide capacity utilization.
Systems risk can be caused by information infrastructure breakdown or system
integration or extent of systems being networked. Inventory risk might be driven by rate
of product obsolescence, inventory holding cost, or product value. Capacity risk can be
caused by cost of capacity or capacity flexibility. Receivables risk is caused by number
of customers or customers’ financial strength. The last category, intellectual property
risk might be caused by vertical integration of supply chain or global outsourcing and
markets. (Chopra et al., 2004)
Ghiani et al. (2004) states that tailored transportation network allows management
improvement in the strategic, tactical and operational level. In the strategic level, the
network requires the most suitable vehicle and optimizes number of operators needed.
In the tactical level, it determines the cost for a full truckload shipment. In the
operational level, the network defines crucial strategies related to the flexibility
resources allocation such as trucks, containers, trailers and operators without knowing
the future demands. (Ghiani et al., 2004) The following figure presents the outline of
some the tailored mitigation strategies. (Chopra et al., 2007)

34
Figure 8. Tailored risk mitigation strategies (Chopra et al., 2007)
Chopra et al. (2007) defines the choice of network design as an important role in supply
chain risk mitigation strategy that a good design of mitigation strategies actually brings
significant improvement for supply chain’s ability to cope with risks. For example, using
multiple suppliers could help to mitigate disruption risk rather than having only one
supplier. In March 2000, a plant belonged to Royal Phillips Electronics, which supplies
to Nokia and Ericsson, was catching fire. At that time, Nokia managed to quickly handle
the disruption by utilizing some other supply plants in its network sources. On the

35
contrary, Ericsson which did not have any backup supplier was not able to deal with it
well and caused lost revenues at around $400 million. Some risks such as price, global
demand, and foreign exchange rate fluctuation can also be mitigated by flexibility in
capacity. Hino Trucks plant has a flexible capacity to adjust the level of production
according to various models by shifting workforce between lines. Therefore, Hino
Trucks is able manage to maintain stable workforce in its manufacturing plant although
every production line is adjusted to the level of supply and demand. (Chopra et al.,
2007)
However, each mitigation strategy in supply chain comes at a cost and might increase
other risks as well. For instance, using multiple suppliers might mitigate the disruption
risk but it could increase expenses since each supplier might have problems in
obtaining scale economy. Another example is that inventory increment might mitigates
the delay risk but it could cause obsolescence risk. Therefore, developing tailored
mitigation strategies is very important during network design that it can obtain a good
balance between the level of mitigated risks and the level of cost increment. (Chopra
et al., 2007)

36
4. RESEARCH METHODOLOGY
4.1. Data Collection
The data are collected through direct observation in warehouse area and interview with
members of purchasing and inventory department in the case company. Some
numerical data are also gathered to do the analysis. The types of information gathered
from the case company are listed in the following table.
Source of Information Information
Purchasing Department List of suppliers and car models
Transport cost of each supplier for each car model
Suppliers location
Production schedules
Inventory Section Warehouse condition
Lot sizes of suppliers
Goods delivery system from suppliers
Table 5. Data collection
The data were collected from two departments in the case company which are
purchasing and logistics department particularly in inventory section. There are four
types of data gathered from purchasing department. The first data is the list of suppliers
and the car models which each vendor supplies. There are originally over one hundred
suppliers available. The second data is about the transportation cost that suppliers
charge in the price of each part to the case company. However, not all suppliers provide
this information of transportation cost or logistics cost in their quotations. There are only
63 suppliers giving the information and therefore only those suppliers are taken into
this study. The next data is the location of each supplier which is gathered based on
city area. The last thing is the data of yearly production schedule of each car model

37
which is taken from the last six months production plan. The rest of information which
contains of warehouse and inventory condition, supplier’s goods lot size and current
parte delivery system from suppliers to manufacturing plant were acquired from
logistics department.
4.2. Methodology
Both qualitative and quantitative methods will be used in this thesis. Firstly, a set of
suppliers is selected based on those suppliers which provide delivery cost in their parts’
prices, as has been explained in the limitation section. After selecting number of
suppliers which are taken for being analyzed, each supplier is given category for some
parameters that will influence the decision of which transportation network is the most
suitable for the supplier. The conditions that will be taken into consideration in selecting
proper delivery method are mentioned in the following table.
Table 6. Parameters for assigning delivery method
There are four alternatives of transportation network which will be assigned to each
supplier: direct delivery, direct milk-run, milk-run with distribution center, and Kanban
delivery. By applying other methods than direct delivery, the warehouse consumption
is certainly reduced in quite significant area. After all suppliers are assigned with the
most suitable network among those five options, the cost associated with the final
1 Transportation cost for parts delivery
2 Supplier’s distance from manufacturing plant
3 Suppliers group location
4 Size of goods
5 Level of demands
6 Frequency of changed production schedule
No. Parameter
Involved Factor Related Network
Supplier Car model KanbanDirect
shipment
Direct
milk-run
Milk-run
via DC

38
solution will be calculated and compared with the current expense of transportation cost
in direct delivery. Figure 2 illustrates each step of methodology in this study.
Figure 9. Framework of research methodology
As have been mentioned before, the first thing to do is to sort suppliers database based
on the presence of transportation cost and filter only those which provide transportation
cost in their quotations. The next step is to analyze the relationship between each
network option with each parameter, for example how important the factor of supplier
location for applying milk-run network. Furthermore, for each network must be set a
certain criteria of each parameter (i.e. for milk-run network the suppliers should not be
located in long distance from the manufacturing plant). The third step is to study the
condition of each suppliers based on set of parameters (i.e. supplier location) which will
be the factors of assigning the delivery method. All parameters will be classified into
some categories in general way for each supplier (i.e. short, medium or long distance
from manufacturing plant). As all suppliers have own values for each parameter and
certain level of criteria has been set for each network, the matrix will be analyzed to
decide which transportation mode is the most appropriate for each supplier. For
instance, a suppliers for a car model with stable and high level of demand, with small
Select suppliers
with available transport
cost
Set criteria for each delivery network
Analyze the parameters
for all suppliers
Assign the most suitable
network to each supplier
Calculate the cost emerged
by the new framework of
delivery methods

39
size of goods, aggregated location with some other suppliers, short distance from the
manufacturing plant, and medium transportation cost can be assigned to direct milk-
run delivery network. This assignment process will be conducted by using scoring
method, which will be explained in detail in the analysis part. After each supplier has
its own suitable delivery method, the last step is to calculate the entire cost caused by
the new framework design of transportation network. As an example, suppliers who are
matched with direct milk run will cause cost reduction from cutting transportation cost
in the products prices but arise additional expense to pay the third logistics party for the
goods pick-up and delivery service. The calculation result will be taken into
consideration in proposing the final network solution to be implemented in the case
company.
40
5. PRESENTATION OF THE CASE COMPANY
5.1. Overview of the Company
PT. Nissan Motor Indonesia is one of the branch companies of Nissan Motors. The
company was founded in 1986 with the headquarters located in Jakarta, Indonesia. PT.
Nissan Motor Indonesia was officially operating since 2001 in the areas of sales,
distribution, authorization of Nissan parts and after-sales service in Indonesia. As part
of the Nissan Motor Corporation Ltd., PT. Nissan Motor Indonesia has an important role
on the global business plan of Nissan Power 88, which is designed to continue
enhancement of the brand and its’ sales strength. One of the stated goals of Nissan is
to gain 8 % of global automotive market share. The same plan is meant to continuously
improve company's operating profit. By the end of fiscal year 2016 profit generation is
aimed to be increase by 8 % on average.
PT. Nissan Motor Indonesia presents a series of products that are competitive in the
most complete vehicle segments. Promoted campaign "Innovation that excites"
underlines Nissan's commitment to innovative products with leading technology. There
are two other brands that are associated and run by Nissan. Infiniti is upper segment
or high class vehicle brand that produces performance and luxury oriented cars. Datsun
on the other hand is producing budget or low cost vehicles that are mostly meant to
compete in developing markets and oriented for people with limited income. Currently
PT. Nissan Motor Indonesia has more than 98 dealers spread throughout Indonesia
and an assembly plant located in Purwakarta. This particular plant in West Java, with
targeted production of 100 000 units and actual output of around 96 000 units per year
is one of the most important production plans for Nissan.
5.2. Current Supply Chain System
According to one classification, there are two kinds of supplied parts for production
process: import parts and local parts. Import parts are the original parts that are used
for assembling car models that have been existing in other country. However, in terms

41
of cost efficiency and savings, it is much more beneficial to find local companies that
will produce components although this is not always possible. At the moment there are
over 100 local suppliers that support the company in providing parts for production
process. Most of those suppliers deliver parts to the manufacturing plant in the daily
basis. The current supply chain system at the company goes rather well to support
production process. However, problems arise when there are increasing demands
which requires higher volume of production. This condition will cause higher amount of
order to suppliers and therefore when the parts are delivered, number of stocks in the
inventory is increased. Some parts have to be placed outside while waiting for being
taken to the production line. This is not a good condition since the weather in Indonesia
is mostly filled by blazing sun or heavy rain. The following pictures show the actual
condition when parts were placed outside due to less capacity in the warehouse.
Figure 10. Actual condition where parts are placed outside
The increasing amount of demands does not always happen and therefore it is hard for
Nissan to make investment of adding a new warehouse to fit all goods because in low
amount of production volume, the current warehouse is enough to fit all necessary parts
for production. In this situation, it is better to improve the supply chain system to get
more efficient supply chain process and to save some area in the inventory.
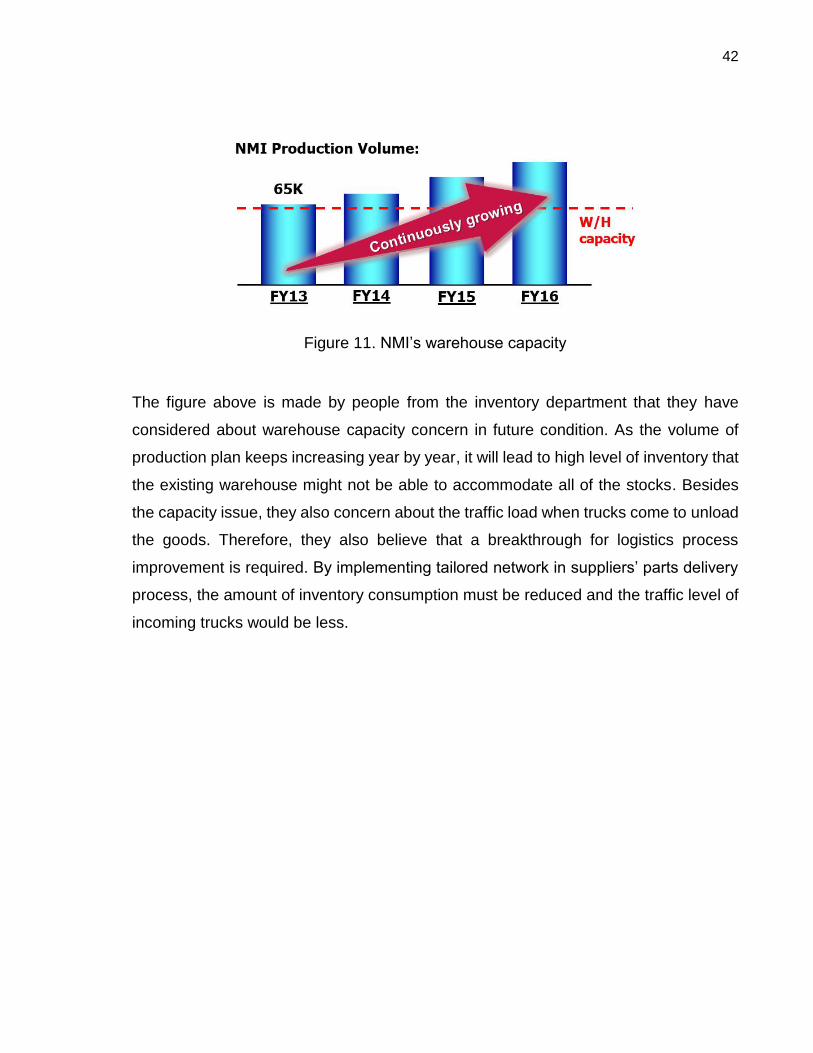
42
Figure 11. NMI’s warehouse capacity
The figure above is made by people from the inventory department that they have
considered about warehouse capacity concern in future condition. As the volume of
production plan keeps increasing year by year, it will lead to high level of inventory that
the existing warehouse might not be able to accommodate all of the stocks. Besides
the capacity issue, they also concern about the traffic load when trucks come to unload
the goods. Therefore, they also believe that a breakthrough for logistics process
improvement is required. By implementing tailored network in suppliers’ parts delivery
process, the amount of inventory consumption must be reduced and the traffic level of
incoming trucks would be less.
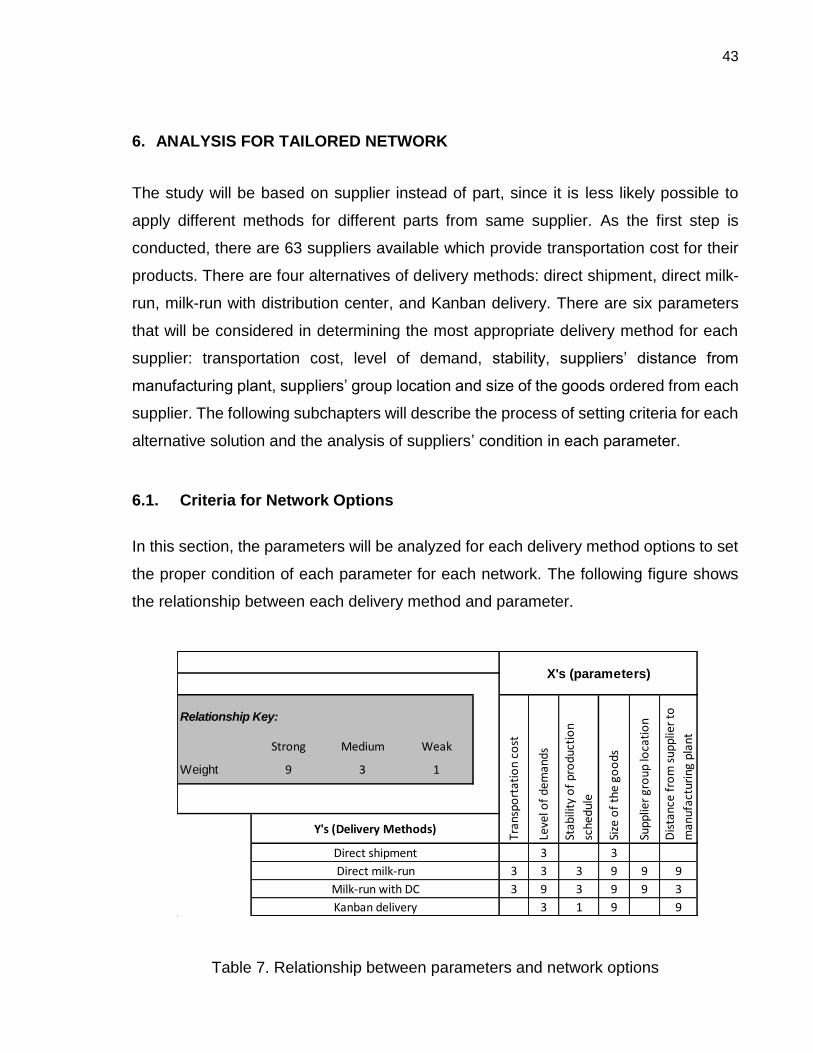
43
6. ANALYSIS FOR TAILORED NETWORK
The study will be based on supplier instead of part, since it is less likely possible to
apply different methods for different parts from same supplier. As the first step is
conducted, there are 63 suppliers available which provide transportation cost for their
products. There are four alternatives of delivery methods: direct shipment, direct milk-
run, milk-run with distribution center, and Kanban delivery. There are six parameters
that will be considered in determining the most appropriate delivery method for each
supplier: transportation cost, level of demand, stability, suppliers’ distance from
manufacturing plant, suppliers’ group location and size of the goods ordered from each
supplier. The following subchapters will describe the process of setting criteria for each
alternative solution and the analysis of suppliers’ condition in each parameter.
6.1. Criteria for Network Options
In this section, the parameters will be analyzed for each delivery method options to set
the proper condition of each parameter for each network. The following figure shows
the relationship between each delivery method and parameter.
Table 7. Relationship between parameters and network options
Relationship Key:
Strong Medium Weak
Weight 9 3 1
3 3
3 3 3 9 9 9
3 9 3 9 9 3
3 1 9 9
Dis
tanc
e fr
om
sup
plie
r to
man
ufac
turi
ng p
lant
Tran
spo
rtat
ion
cost
Direct shipment
Stab
ility
of
pro
duct
ion
sche
dule
Leve
l of
dem
ands
X's (parameters)
Y's (Delivery Methods)
Direct milk-run
Milk-run with DC
Kanban delivery
Size
of
the
goo
ds
Supp
lier
gro
up lo
cati
on

44
In the table above, the level of relationship is classified into three numbers based on
the weight of the relationship between each transportation network and parameter.
Number of nine is given to strong relationship, three is given to medium relationship,
one is given to weak relationship, and blank space or zero is given to those parameters
which do not have any relationship with the transportation networks. The explanation
about reasons behind all given weights of relationships for each delivery network is
described in the following subchapters.
6.1.1. Direct Shipment
There are not many requirements in applying direct shipment since this is the simplest
method of parts delivery. As mentioned in the theoretical part, direct shipment is
suitable if the demand is high or the lot size is large enough to make a full truckload for
shipment. Another theory states that the distance between suppliers and manufacturing
plant for direct shipment should not be too far. However, when the condition of suppliers
do not satisfy the requirement of other networks, direct shipment will be the only option
left for those suppliers to be assigned to. Therefore, the weights of direct shipment’s
parameters are not classified as strong relationships.
6.1.2. Milk-run
The most important factors in applying milk-run distribution system are size of the goods
and suppliers’ geographic location. In milk-run network, parts delivery for one day’s
production is divided into several cycles e.g. four to six delivery in a day. The lot size
must not be too large or otherwise there will not be enough space in the truck capacity
to accommodate the goods from other suppliers. The allowance for size of the goods
in milk-run alternative is ranged between small and medium parts. Since size of goods
has a strong relationship with the milk-run system, this network cannot be applied to
suppliers which do not satisfy the range of this criteria which means there will not be
any possibility to implement milk-run to suppliers that have large size of the goods.

45
Suppliers’ geographic location consists of two parameters: distance from
manufacturing plant and aggregation location among some other suppliers. To
implement milk-run system, suppliers should not be located too far from the
manufacturing plant. In its implementation, the truck for example can have four to six
route each day to pick up the goods from one suppliers location and deliver them to
manufacturing plant. To meet the timetable of production schedule and taken into
account the severe traffic jam in Indonesian road condition, the allowed distance for
milk-run network is between short and medium range. Another crucial thing is the
condition whether there are several numbers of supplier located in same area. For
instance, if there is only one supplier located in a city which is isolated far away from
other cities, milk-run cannot be implemented to that supplier. When there are at least
three suppliers located in same area, milk-run might be applied depends on the quantity
of orders and the lot size if they can fit towards a full truckload. Another possibility also
implies to a supplier which is located in a different area with a condition that the area is
located in somehow the same direction with other area where milk-run is applied, so
that the truck can also come to pick up goods from that supplier without going out of
the route too much.
The other parameters criteria are also required for milk-run implementation in medium
scale of relationship: transportation cost, level of demand and stability. The parameter
of transportation cost is the main reason that the availability of suppliers’ transportation
cost is necessary for this study. In current condition where direct shipment is applied,
suppliers include transportation cost in their products prices. When milk-run is applied
to suppliers, goods are picked up by third party logistics service so that suppliers do
not spend resources for delivery process. Therefore, once milk-run is operated, the
transportation cost in each product’s price should be eliminated. The total amount of
cost reduction from the products’ price does not necessarily have to cover the amount
of additional expense for the third logistics party service, as the main benefit gained
from this change system is the reduction of warehouse consumption. However, the gap
between eliminated transportation cost and additional service cost should not be too
high so that it will be more worthy to apply milk-run to suppliers with available

46
transportation costs which are not too low. For direct milk-run network application in
this study, suppliers should have moderate to high transportation cost to be suitable
being assigned to this system.
The level of demand in milk run concept aims to increase the cycle of pickup and
delivery service in each day. The more cycle that the third party logistics service have,
the lower price of service they can offer. It is not worthy to implement milk-run when the
order is not much enough for making the delivery process separated in some cycles.
Moreover, the inventory consumption will not be reduced that much either. The criteria
set for demand level in milk-run network option is from medium to high. Stability also
has a significant role that has to be taken into consideration to avoid future problem
with the 3PL party. If the production schedule keeps changing overtime, it will be difficult
to manage the route cycle to be in the schedule plan. The allowance for stability
condition in milk-run network is also ranged between high and moderate level.
6.1.3. Milk-run via DC
All parameters are also significant in milk-run via distribution center system. However,
the importance level and category range of each parameter is a bit different with direct
milk-run. Since there will be more additional expense for distribution center rent,
transportation cost is more prioritized to those suppliers with high transportation cost
although the level of importance remains the same with direct milk-run: between high
and medium transportation cost. In addition, there will be extra cost for hiring third party
logistics service that there will be one additional truck needed for the operation. The
normal trucks aim to pick up goods from suppliers and deliver to distribution center,
while the extra truck is needed to carry the goods from distribution center to
manufacturing plant. Hence, it is much more worthy to implement milk-run with DC to
suppliers which provide high transportation cost to help to mitigate the additional cost
for both DC rent and third party logistics service.
Suppliers’ geographic location still play a fundamental role in this system. There has to
be some numbers of supplier which are located in same area. The different criteria for

47
suppliers’ location between direct milk-run and milk-run via DC is the distance between
suppliers and manufacturing plant. In milk-run through DC, suppliers’ distance has
moderate level of importance. While in direct milk-run suppliers should be located close
to manufacturing plant, in milk-run via DC system suppliers should be located far away
from manufacturing plant to make it worthy utilizing the distribution center. The range
of distance allowance for this system is long to medium category.
Demand plays more important role in milk-run with DC system rather than direct milk-
run network. The high importance category for demand level is due to achieve
effectiveness of implementing this system by having high level of demand to make it
worth. In addition, milk-run via DC network is worthy to be applied if only there are at
least two groups of suppliers where the milk-run system can be applied. The level of
stability for milk-run via DC system are also limited to high category and the importance
of both parameters remain the same. The stability level becomes higher to maintain the
smoothness of supply process to support production line, since suppliers which will be
assigned to this network are not located in short distance to be able to give a quick
countermeasure if something goes wrong.
6.1.4. Kanban System
Some factors related to Kanban delivery implementation are size of the goods,
suppliers’ geographic location in term of distance from manufacturing plant, level of
demands and stability of production schedule. There are two possible ways of
implementing Kanban system: suppliers still do the delivery on their own resources or
goods are picked up from suppliers’ site by using third logistics party service. In this
study, the first scenario is used so there will not be any additional cost for 3PL and
there will not be any reduction transportation cost from the parts prices and therefore
transportation cost does not play any role in this network’s criteria.
Size of the goods and suppliers’ distance to manufacturing plant are the most important
roles to apply Kanban delivery system. In this system, goods are supposed to be
delivered just in a certain amount of time before they are needed in the production line.

48
For example, there can be up to eight times delivery in a day if the parts are large
enough to fit a full truckload for one or two lots. Therefore, the criteria set for size of the
goods in Kanban system must be ranged between large and medium size. In terms of
suppliers’ geographic location, suppliers must be located close to the manufacturing
plant to be able to catch the time for continuous delivery activity to maintain the
production supply going smoothly.
The parameter of demand has a moderate level of importance in Kanban delivery
network. This criteria is basically supporting the criteria of lots size in aims of making
the delivery in full truck load. When the lots size are large, the level of demand does
not really matter even if the parts have low demand. When the lots size are medium, it
will be helpful if the level of demand is high to fulfill one full truck load. The factor of
stability does not play an important role in Kanban system although the preferred range
for it is still in high and moderate level. This is due to the suppliers’ location that must
be located close to manufacturing plant so they are able to give quick countermeasure
when there are sudden changes in the production plan schedule.
6.1.5. Overall Criteria for Each Network
The following table summarizes all the criteria needed for each transportation network.
Green symbol indicates the suitable condition that should be satisfied for assigning
suppliers to delivery network alternatives. Red symbol indicates the condition that must
not be existed in selecting delivery method for suppliers because the importance issue
of the parameter to the network option is in strong level. Cells contain parameters that
do now affect the network solution are left blank. Blank cells can also represent the
conditions for network option which are not preferable but still tolerable.

49
Table 8. Criteria for each network
Parameter of transportation cost has effects on direct milk-run and milk-run via
distribution center. High transportation cost is more preferable for both milk-run
networks particularly for milk-run via DC. However, when suppliers have low
transportation cost, it is still possible to apply milk-run networks to those suppliers if the
other parameters condition are satisfied. Parameter of stability has impact on milk-run
networks and Kanban delivery. Again, there is no strict requirement of stability condition
that suppliers must meet. High stability is preferable for milk-run networks and Kanban
delivery, but all of the networks can still be applied to suppliers with low stability level.
In parameter of demand, which has relationship with direct shipment and milk-run
networks, there is one strict condition for milk-run via distribution center as can be seen
there is a red mark in the table. High level of demand is preferable for all related
networks, and suppliers with low level of demand can be assigned to any network
except milk-run via distribution center. Due to a strong relationship key between milk-
run via DC network with level of demand, non-preferred category of the criteria, which
Parameters CriteriaDirect
shipment
Direct
milk-run
Milk-run
with DCKanban
High
Moderate
Low
High
Moderate
Low
High
Moderate
Low
Large
Medium
Small
Aggregated
Non-aggregated
Long
Medium
Short
Location
Distance
Transport
cost
Stability
Demand
Size
50
is low level of demand, is not tolerable for the suppliers to be assigned to the network.
The next parameter, size of the goods, is related to all networks and has strict condition
to milk-run network and Kanban delivery. Large size of goods is not allowed for direct
milk-run and milk-run via DC network. On the contrary, small size of goods is not
allowed for Kanban delivery. The location of suppliers affects strongly to direct milk-run
and milk-run via DC network. Both milk-run networks require aggregated location of
suppliers to be able to apply the networks. The distance between suppliers and
manufacturing plant has moderate effect on milk-run via DC network and strong effect
on direct milk-run and Kanban delivery. Long distance is not allowed for direct milk-run,
while Kanban delivery only tolerates short distance which means there is no chance to
assign Kanban delivery to suppliers which are located in medium and long distance
from the manufacturing plant.
6.2. Parameters Analysis
This subchapter describes the third step of the study which is the analysis of suppliers’
condition based on given parameters and criteria. For each parameter, all suppliers will
be classified into different criteria based on table 6. The suppliers’ classification into
categories for each parameter are taken based into suppliers’ database from the case
company. In the end of each section, there will be results provided about the outline of
suppliers’ condition for each parameter. The summaries are presented in tables
showing number of suppliers in each category of each parameter along with some
hypothesis about the possibilities to assign those suppliers into each related networks.
6.2.1. Transportation Cost
The transportation cost for each supplier is calculated in one year turn over by using
the latest data taken of production plan in FY 2015. The calculation is made by
multiplying the total transport cost for one unit car model with the total amount of
production volume in one year. After the calculation is done for each supplier, the
percentage of each supplier’s cost portion compared to the total cost of all suppliers is

51
calculated. The principle of ABC analysis is used to categorize each supplier into A
category (high cost), B category (moderate cost) and C category (low cost). The
following table shows the final result of transportation cost classification process for all
suppliers.
Category Number of
Suppliers
Percentage
of cost
A (high) 9 79.8%
B (moderate) 23 18.4%
C (low) 31 1.8%
Total 63 100%
Table 9. Suppliers’ classification of transportation cost
According to the table above, there are more suppliers with low transportation cost and
only few suppliers with high transportation cost. This condition is unlikely to support
implementation in direct milk-run and milk-run via DC network, however there is no
strict condition about this parameter to the networks. Both networks can still be applied
to suppliers with low and moderate transportation costs whose categories in other
parameters meet the ideal condition of milk-run networks.
6.2.2. Level of Demand and Stability
In this section, the variety of changed demands for each car model will be analyzed.
The data is taken from the last six months production schedule. The following table
shows the number of units that are planned to be produced in one year, including the
difference number of units between previous and next month.

52
CAR MODEL
Month GAP 1
Month GAP 2
Month GAP 3
Month GAP 4
Month GAP 5
Month
I II III IV V VI
Grand Livina 11,223 -122 11,101 19 11,120 -109 11,011 72 11,083 182 11,265
Serena 2,652 0 2,652 0 2,652 0 2,652 -96 2,556 24 2,580
Juke 8,920 200 9,120 1 9,121 1,314 10,435 -372 10,063 -11 10,052
X-trail 10,825 -85 10,740 0 10,740 84 10,824 0 10,824 -84 10,740
Datsun 40,051 -367 39,684 168 39,852 36 39,888 0 39,888 9 39,897
Table 10. Data of production schedule
The GAP numbers from table 8 are taken in absolute value to see and calculate the
total fluctuation number for each model, as well as the percentage to the amount of unit
production. The total units of fluctuation for each car model in the last six months is
presented in below table.
CAR MODEL
UNIT PERCENTAGE
1 2 3 4 5 TOTAL 1 2 3 4 5 TOTAL
Grand Livina
122 19 109 72 182 504 1% 0% 1% 1% 2% 5%
Serena 0 0 0 96 24 120 0% 0% 0% 4% 1% 5%
Juke 200 1 1,314 372 11 1,898 2% 0% 14% 4% 0% 20%
X-trail 85 0 84 0 84 253 1% 0% 1% 0% 1% 2%
Datsun 367 168 36 0 9 580 1% 0% 0% 0% 0% 1%
Table 11. Calculation of fluctuation
The fluctuation level in both measurement of units, which is the real value, and the total
percentage compared to the total number of production volume from table 9 are taken
and summarized as in below figure.

53
Figure 12. Fluctuation of each car model
From the graph above, Juke is clearly seen as the most fluctuated model in both units
and percentage measurement (20%). Followed by Grand Livina and Serena model with
5% fluctuation to the amount of volume. The most stable car models according to the
graph percentage are X-trail with only 2% and low units of fluctuation and Datsun with
1% volatility although the units of fluctuation seems higher. The summary of demand
and stability level for each car model is listed in below table.
Table 12. Level of demand and stability for each model
5% 5%
20%
2% 1%0%
5%
10%
15%
20%
25%
-500
0
500
1000
1500
GrandLivina
Serena Juke X-trail Datsun
Volume Fluctuation
1 2 3 4 5 Percentage
CAR MODEL DEMAND STABILITY
Grand Livina Moderate Moderate
Serena Low Moderate
Juke Moderate Low
X-trail Moderate High
Datsun High High

54
The information about demand and stability level of each car model are then used to
analyze suppliers’ demand and stability level based on the car models that they supply.
When the suppliers supply for car models with high and moderate demand or stability,
they are classified as high. Suppliers that supply for moderate demand or stability car
models are classified as moderate, as well as if they also supply to low demand or
stability car model. Suppliers that only supply for car model with low demand or stability
are classified as low. The following table shows number of suppliers in each
parameter’s classification.
Demand Stability
High 49 23
Moderate 12 27
Low 2 13
Table 13. Number of suppliers in demand and stability parameters
In parameter of demand, 49 out of 63 suppliers are in high demand level which is likely
to support direct shipment, direct milk-run, and milk-run via DC network
implementation. In parameter of stability, 50 out of 63 suppliers are in high and
moderate stability level which is also likely to support implementation of direct milk-run,
milk-run via DC network, and Kanban delivery. Overall, the condition of suppliers’
demand and stability level is good to support the application of tailored transportation
network.
6.2.3. Size of the Goods
There are over 1,000 kinds of part in total to be order for producing all types of car. The
size of the goods will be determined based on supplier’s standard number of packing
(SNP) for one lot, since the orders are made in lot amount, and then multiplier by the
total amount of lots for the whole year, based on the latest production plan. The
category for the lots size is originally classified into five levels. Those categories are
extra-large, large, medium, small, and extra-small. However, since there is no

55
differentiation between extra-large and large and between extra-small and small in
criteria setting of network options, the category for size of goods was narrowed into
three classifications: large, medium, and small size in order to simplify the analysis
process. Yet the original categories will be presented in the final framework analysis as
consideration to estimate the suppliers grouping for milk-run network and milk-run via
DC system. The following table shows the number of suppliers which are classified into
each category based on their lots size.
Table 14. Suppliers’ classification based on size of goods
From the table above, the category in size of the goods parameter seem to be almost
equally distributed. There are 44 suppliers in the range of large and medium size which
are likely to be assigned to either direct shipment or Kanban delivery. There are 39
suppliers in the range of medium and small size which are likely to be assigned to direct
milk-run or milk-run via DC network. However, there is no possibility to assign both
milk-run networks to 24 suppliers with large size and 19 suppliers with small size cannot
be assigned into Kanban delivery.
6.2.4. Suppliers’ Geographic Location
There are two parameters which are related to geographic location. The first one is
suppliers’ distance from manufacturing plant. The classification of this parameter is
Original
Category
Amount of
Suppliers
Simplified
Category
Amount of
Suppliers
XL 11 Large 24
L 13
M 20 Medium 20
S 8 Small 19
XS 11

56
based on the city that suppliers are located. Those 63 suppliers are located in 10
different cities. Two cities are classified as short distance, three are medium, and 5
cities are categorized as long distance. The other parameter is suppliers’ location in
aggregated area near other suppliers. The classification is made based on suppliers’
location in same city. If there are more than two suppliers in a city, then they are
categorized as aggregated location. Otherwise, when there are less than three
suppliers in a city, they are classified as non-aggregated. The following table shows the
number of suppliers with each category in both parameters.
Parameter Distance Location
Category Short Medium Long Aggregated Non-aggregated
Number of Suppliers 23 23 17 58 5
Table 15. Suppliers’ geographic location parameters
The parameter of suppliers’ distance has impact on direct milk-run, milk-run via
distribution center, and Kanban delivery while the parameter of location is only related
to both milk-run networks. From the table above, there are 23 suppliers which are
located in short distance can be assigned to Kanban delivery, 46 suppliers in the range
of short and medium distance can be assigned to direct milk-run, and 40 suppliers in
the range of medium and long distance can be assigned to milk-run via DC network.
On the other hand, there are 17 suppliers which are located in long distance cannot be
assigned to direct milk-run and 40 suppliers with medium and long distance cannot be
assigned to Kanban delivery. In the parameter of location, there are only five suppliers
which are not located in aggregated area so that they cannot be assigned to neither
direct milk-run nor milk-run via DC center. On the whole, the condition of both suppliers’
distance and location are likely to support the application of tailored network.
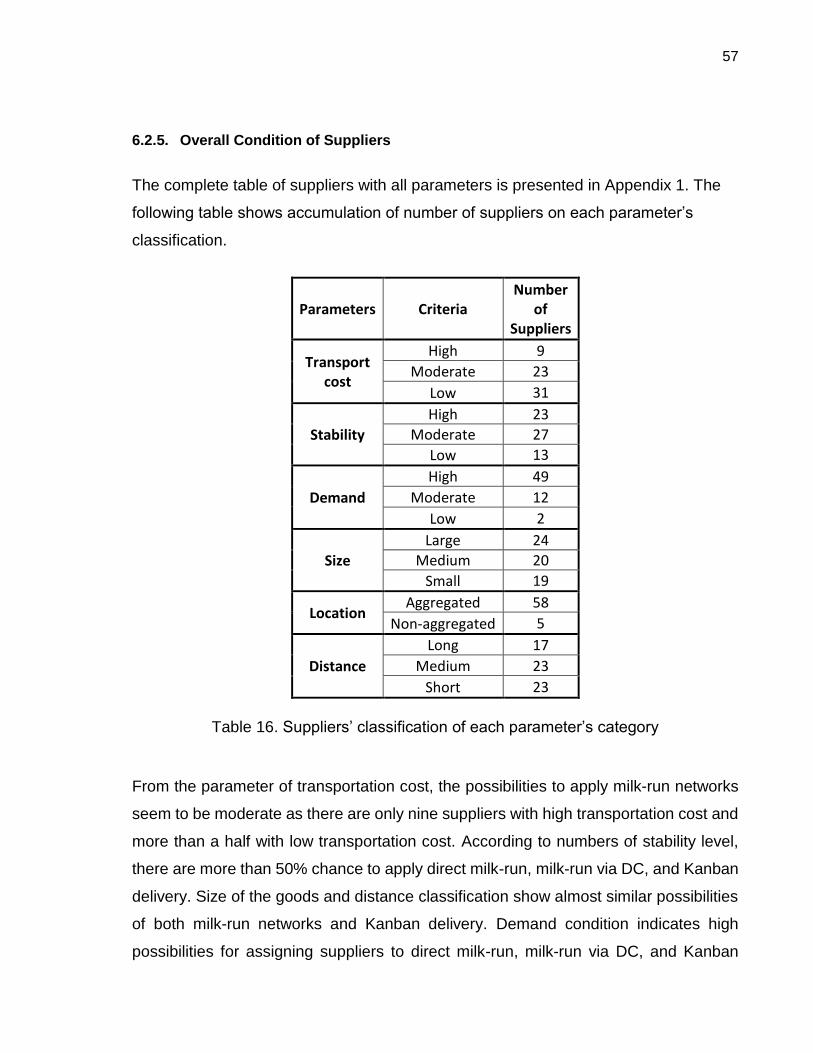
57
6.2.5. Overall Condition of Suppliers
The complete table of suppliers with all parameters is presented in Appendix 1. The
following table shows accumulation of number of suppliers on each parameter’s
classification.
Parameters Criteria Number
of Suppliers
Transport cost
High 9
Moderate 23
Low 31
Stability
High 23
Moderate 27
Low 13
Demand
High 49
Moderate 12
Low 2
Size
Large 24
Medium 20
Small 19
Location Aggregated 58
Non-aggregated 5
Distance
Long 17
Medium 23
Short 23
Table 16. Suppliers’ classification of each parameter’s category
From the parameter of transportation cost, the possibilities to apply milk-run networks
seem to be moderate as there are only nine suppliers with high transportation cost and
more than a half with low transportation cost. According to numbers of stability level,
there are more than 50% chance to apply direct milk-run, milk-run via DC, and Kanban
delivery. Size of the goods and distance classification show almost similar possibilities
of both milk-run networks and Kanban delivery. Demand condition indicates high
possibilities for assigning suppliers to direct milk-run, milk-run via DC, and Kanban

58
delivery system. 92% of suppliers are located in aggregated location which indicates
that there are many suppliers are likely assigned to direct milk-run and milk-run via DC
network. There are 23 suppliers located close to the manufacturing plant which can be
candidates for being assigned to Kanban delivery, 46 suppliers located in the range of
medium and short distance are candidates for milk-run network, and 40 suppliers
located in long and medium distance are candidates for milk-run via distribution center
network. Therefore, in parameter of distance, the possibilities for assigning suppliers to
different networks seem to be evenly distributed.
6.3. Network Selection
The selection process for the most suitable network for each supplier is conducted with
scoring method. The scoring will be given to each parameter for each delivery network.
The first step is to determine the range of scoring value with the remark of each value.
Criteria of each score will depend on network’s parameter’s weight and condition. The
following table lists the score values and explanation related to each score.
Figure 13. Scoring category
4•Most preferred
•Given when the supplier's category meet the most preferred category of a network
3
•Preferred
•Given when the supplier's category satisfies the second preference category (if any) of a network
2
•Neutral
•Given to any category when the parameter does not have relationship with the network
1
•Less preferred
•Given when the supplier's category does not satisfy the ideal category of a network and the parameter has a moderate relationship with the network
0
•Not preferred
•Given when the supplier's category does not satisfy the ideal category of a network while the parameter has a strong relationship with the network

59
The figure above shows the range of scoring number between zero to four based on
the supplier’s condition compared with the ideal condition of each network. The scoring
also takes into account the weight of parameters in the relationship with network
options. For example, milk-run network has a strong relationship with the parameter of
size and moderate relationship with the parameter of demand. In term of size, the most
preferred category for milk-run network is medium size and the second preference is
small size. In term of demand, the most ideal category is high demand and the second
one is moderate level of demand. In the scoring process of size, four will be given when
a supplier has medium size of parts which is the most preference category and three
will be given if the supplier’s parts size is categorized as small which is the second
preference condition of size parameter in milk-run network. The same rule applies to
scoring process of demand. However, when the supplier’s size is large, which does not
satisfy the required condition for milk-run, zero will be the score since size is weighted
as an extremely important for milk-run implementation. Therefore, there is no toleration
if the condition cannot meet the ideal requirement of milk-run network. While in term of
demand, if a supplier has low category, one will be given because the relationship
between milk-run network and parameter of demand is moderate which means that
even if the supplier’s demand category cannot meet the preference condition, milk-run
can still be applied as long as supplier’s condition in other parameters could satisfy the
ideal criteria of milk-run network. The score of two is given when the network is not
significantly correlated to the parameters. For example, direct shipment has almost
nothing to do with the parameter of location. Hence, two will be set as the score for any
condition of supplier’s location in the analysis of direct shipment.
As have been mentioned above, in the data scoring process, the score will be given
based on the suppliers’ condition of each criteria compared to the ideal condition for
the network options. The following table provides the first and second preference for
ideal condition of each parameter in each network solution.
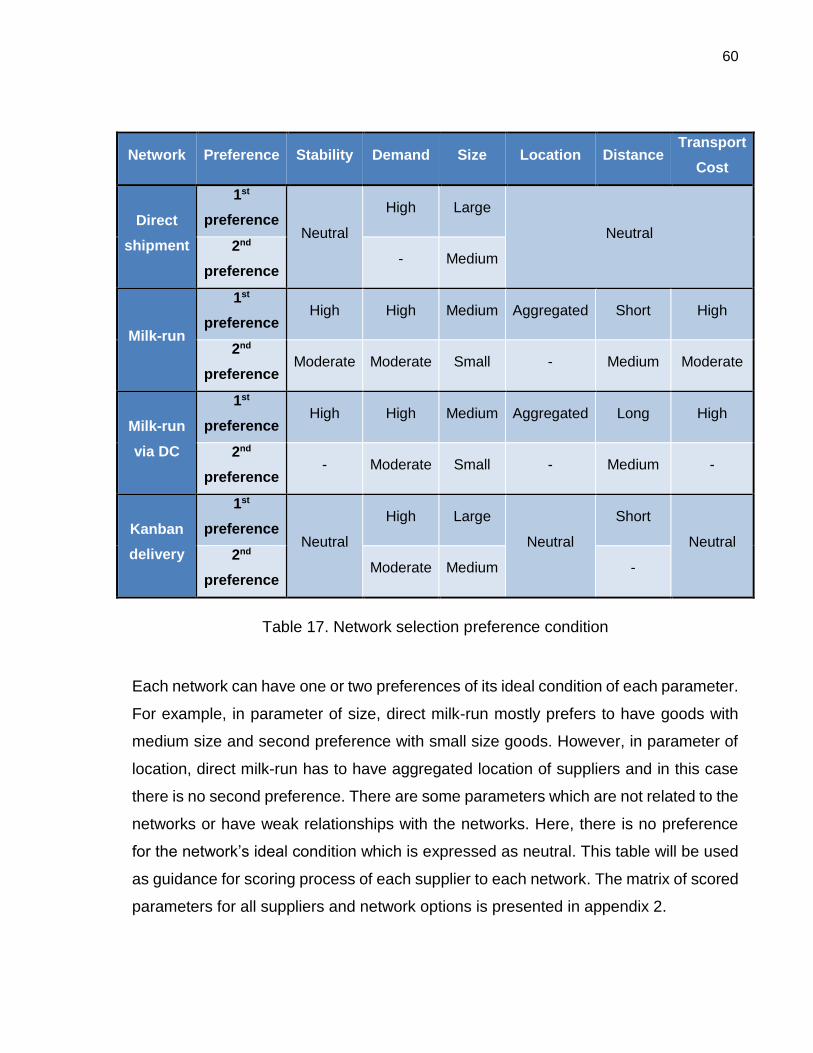
60
Network Preference Stability Demand Size Location Distance Transport
Cost
Direct
shipment
1st
preference Neutral
High Large
Neutral 2nd
preference - Medium
Milk-run
1st
preference High High Medium Aggregated Short High
2nd
preference Moderate Moderate Small - Medium Moderate
Milk-run
via DC
1st
preference High High Medium Aggregated Long High
2nd
preference - Moderate Small - Medium -
Kanban
delivery
1st
preference Neutral
High Large
Neutral
Short
Neutral 2nd
preference Moderate Medium -
Table 17. Network selection preference condition
Each network can have one or two preferences of its ideal condition of each parameter.
For example, in parameter of size, direct milk-run mostly prefers to have goods with
medium size and second preference with small size goods. However, in parameter of
location, direct milk-run has to have aggregated location of suppliers and in this case
there is no second preference. There are some parameters which are not related to the
networks or have weak relationships with the networks. Here, there is no preference
for the network’s ideal condition which is expressed as neutral. This table will be used
as guidance for scoring process of each supplier to each network. The matrix of scored
parameters for all suppliers and network options is presented in appendix 2.
61
After scoring networks’ parameters of all suppliers, the next step is calculating final
score for each network option. The first part of calculation is done by summing the
product of parameters’ scores with parameter’s weights. The numbers of parameters
weight in this calculation are nine, three and zero. Nine is for strong related parameters
to the networks, three is for moderate parameters’ impact to the networks, and one is
for both weak correlation and no correlation of parameters to the networks. This formula
aims to emphasize the scores of strong parameters that meet the ideal criteria of the
network by multiplying the scores with the weights. The next calculation is to multiply
the result of the first calculation with the product of the scores in each supplier. This
formula is intended for eliminating the network, which has any strong parameter that
does not satisfy its ideal criteria, as a solution. Since in that case the given score is
zero, the final calculation result will be zero after being multiplied by each parameter’s
score. The final score is then used to determine the most appropriate network option
for each supplier.
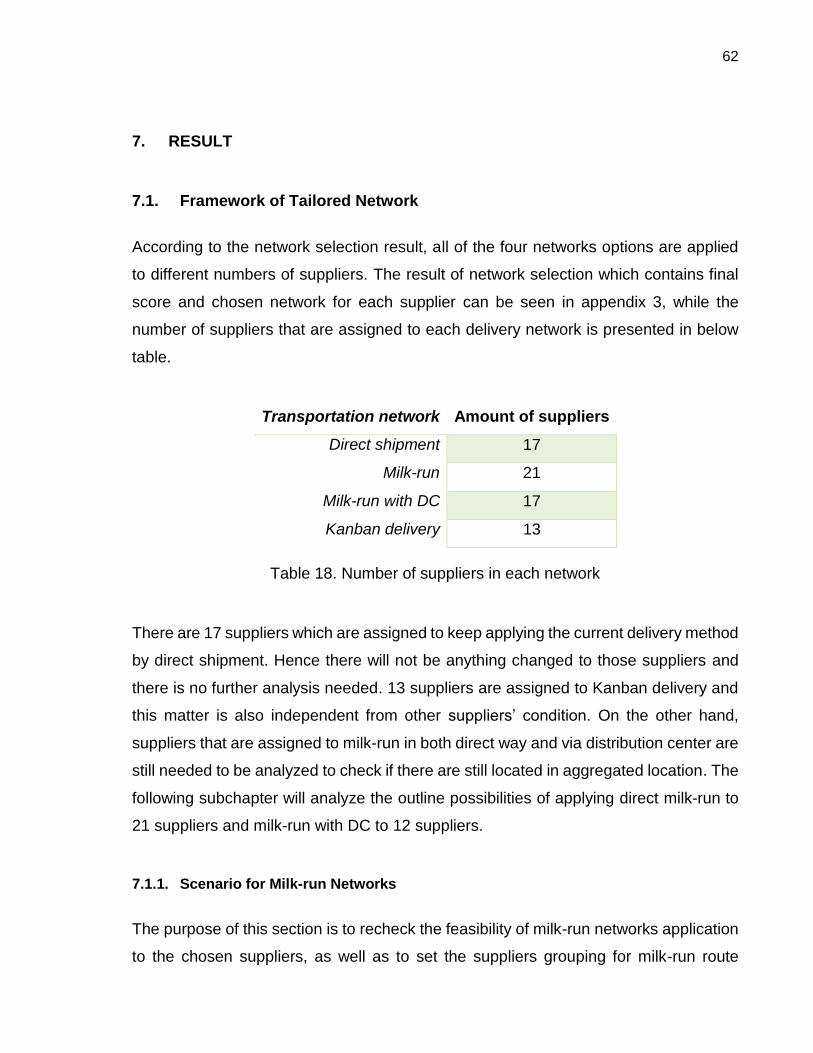
62
7. RESULT
7.1. Framework of Tailored Network
According to the network selection result, all of the four networks options are applied
to different numbers of suppliers. The result of network selection which contains final
score and chosen network for each supplier can be seen in appendix 3, while the
number of suppliers that are assigned to each delivery network is presented in below
table.
Transportation network Amount of suppliers
Direct shipment 17
Milk-run 21
Milk-run with DC 17
Kanban delivery 13
Table 18. Number of suppliers in each network
There are 17 suppliers which are assigned to keep applying the current delivery method
by direct shipment. Hence there will not be anything changed to those suppliers and
there is no further analysis needed. 13 suppliers are assigned to Kanban delivery and
this matter is also independent from other suppliers’ condition. On the other hand,
suppliers that are assigned to milk-run in both direct way and via distribution center are
still needed to be analyzed to check if there are still located in aggregated location. The
following subchapter will analyze the outline possibilities of applying direct milk-run to
21 suppliers and milk-run with DC to 12 suppliers.
7.1.1. Scenario for Milk-run Networks
The purpose of this section is to recheck the feasibility of milk-run networks application
to the chosen suppliers, as well as to set the suppliers grouping for milk-run route

63
cycles. The following table presents the list of suppliers which are assigned to direct
milk-run and milk-run with distribution center, along with their city area and the size of
their parts.
Table 19. Suppliers mapping in direct milk-run and milk-run via DC
Network Supplier Area Size
Direct milk-run S28 A M
Direct milk-run S39 A M
Direct milk-run S37 A S
Direct milk-run S1 A XS
Direct milk-run S2 B M
Direct milk-run S27 B M
Direct milk-run S45 B M
Direct milk-run S48 B M
Direct milk-run S53 B M
Direct milk-run S56 B M
Direct milk-run S41 B XS
Direct milk-run S38 C M
Direct milk-run S47 C M
Direct milk-run S31 C S
Direct milk-run S61 C S
Direct milk-run S16 C XS
Direct milk-run S36 C XS
Direct milk-run S43 C XS
Direct milk-run S49 C XS
Direct milk-run S23 D M
Direct milk-run S60 D M
Milk-run via DC S12 B M
Milk-run via DC S10 B S
Milk-run via DC S33 B S
Milk-run via DC S40 B XS
Milk-run via DC S4 E M
Milk-run via DC S8 E M
Milk-run via DC S21 E M
Milk-run via DC S22 E M
Milk-run via DC S30 E S
Milk-run via DC S44 E S
Milk-run via DC S35 E XS
Milk-run via DC S17 F XS

64
In the table above, data has been sorted in the order of assigned network, area which
represents city location, and size of supplied goods. From the list of area, it can be seen
that most of suppliers are still being in aggregated location as there are more than three
suppliers located in same area. There are two suppliers (S23 and S60) which stand
only in pair in area D and one supplier (S17) which stands alone in area F. Therefore,
these suppliers can be dropped from the milk-run list and moved to other possible
network solutions. From the table of final score, the next suitable solution for S23 and
S60 is Kanban delivery while S17 has only one option left which is direct shipment.
Suppliers that are located in area B are assigned to different method, direct milk-run
(S27, S45, S48, S53, S56, and S41) and milk-run with DC (S12, S10, S33, S40). Out
of four suppliers which are assigned to milk-run with DC network, two have small size
and one has extra small size. Given these conditions, it will be more effective to move
them to direct milk-run network and join with other seven suppliers.
As some little change are made, the next step is to determine how many trucks or
groups needed to facilitate those suppliers with milk-run networks. The division of
groups will be estimated based on the size of goods without detail calculation.
Implementing milk-run will be assumed to pick up and delivery goods for three lots of
production in each route. According to the interview with people from inventory
department, one truck is estimated to fit approximately three lots medium size parts
from four to five suppliers. This information is used as the basis of assigning the
suppliers into groups for the milk-run route cycle. The number of groups needed in each
city area for milk-run implementation is presented in below table. The analysis result
will then be used for calculating the additional cost emerged by the application of milk-
run distribution
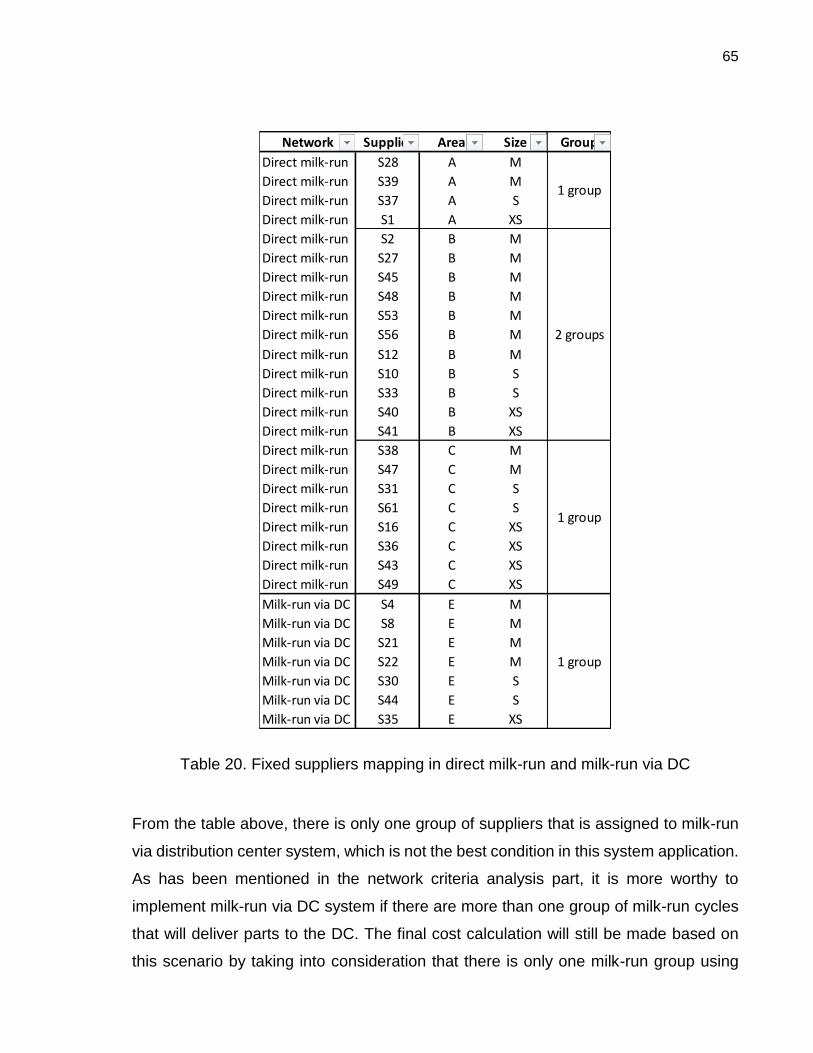
65
Table 20. Fixed suppliers mapping in direct milk-run and milk-run via DC
From the table above, there is only one group of suppliers that is assigned to milk-run
via distribution center system, which is not the best condition in this system application.
As has been mentioned in the network criteria analysis part, it is more worthy to
implement milk-run via DC system if there are more than one group of milk-run cycles
that will deliver parts to the DC. The final cost calculation will still be made based on
this scenario by taking into consideration that there is only one milk-run group using
Network Supplier Area Size Group
Direct milk-run S28 A M
Direct milk-run S39 A M
Direct milk-run S37 A S
Direct milk-run S1 A XS
Direct milk-run S2 B M
Direct milk-run S27 B M
Direct milk-run S45 B M
Direct milk-run S48 B M
Direct milk-run S53 B M
Direct milk-run S56 B M
Direct milk-run S12 B M
Direct milk-run S10 B S
Direct milk-run S33 B S
Direct milk-run S40 B XS
Direct milk-run S41 B XS
Direct milk-run S38 C M
Direct milk-run S47 C M
Direct milk-run S31 C S
Direct milk-run S61 C S
Direct milk-run S16 C XS
Direct milk-run S36 C XS
Direct milk-run S43 C XS
Direct milk-run S49 C XS
Milk-run via DC S4 E M
Milk-run via DC S8 E M
Milk-run via DC S21 E M
Milk-run via DC S22 E M
Milk-run via DC S30 E S
Milk-run via DC S44 E S
Milk-run via DC S35 E XS
1 group
2 groups
1 group
1 group

66
distribution center facility so that it does not require a big distribution center area to
accommodate the parts from those suppliers before taken to the manufacturing plant.
The final conclusion and recommendation for the company will be made based on the
cost calculation result.
7.1.2. Final Framework of Tailored Network
As there are some modifications in milk-run area which also impact to the number of
suppliers in direct shipment and Kanban delivery, hence the final result of network
assignment for each supplier is presented in this section. The following table shows the
list of all 63 suppliers with the selected network option for each of them.
Supplier Network Supplier Network Supplier Network
S1 Milk-run S22 Milk-run via DC S43 Milk-run
S2 Milk-run S23 Kanban S44 Milk-run via DC
S3 Kanban S24 Direct shipment S45 Milk-run
S4 Milk-run via DC S25 Kanban S46 Kanban
S5 Kanban S26 Kanban S47 Milk-run
S6 Kanban S27 Milk-run S48 Milk-run
S7 Direct shipment S28 Milk-run S49 Milk-run
S8 Milk-run via DC S29 Kanban S50 Direct shipment
S9 Kanban S30 Milk-run via DC S51 Direct shipment
S10 Milk-run via DC S31 Milk-run S52 Kanban
S11 Direct shipment S32 Direct shipment S53 Milk-run
S12 Milk-run via DC S33 Milk-run via DC S54 Kanban
S13 Direct shipment S34 Direct shipment S55 Direct shipment
S14 Direct shipment S35 Milk-run via DC S56 Milk-run
S15 Direct shipment S36 Milk-run S57 Direct shipment
S16 Milk-run S37 Milk-run S58 Direct shipment
S17 Direct shipment S38 Milk-run S59 Kanban
S18 Kanban S39 Milk-run S60 Kanban
S19 Direct shipment S40 Milk-run via DC S61 Milk-run
S20 Direct shipment S41 Milk-run S62 Direct shipment
S21 Milk-run via DC S42 Direct shipment S63 Kanban
Table 21. Final framework of tailored network

67
The amount of suppliers that are assigned to each transportation method based on the
final version of tailored network framework are presented in the following table.
Transportation network Amount of suppliers Percentage
Direct shipment 18 29%
Milk-run 23 36%
Milk-run with DC 7 11%
Kanban delivery 15 24%
Total 63 100%
Table 22. Fixed number of suppliers of each network
There are 18 suppliers which cover around 29% of the total number of suppliers that
are not supposed to change their current delivery system by direct shipment network.
23 suppliers are assigned to direct milk-run distribution system while milk-run via DC
network is applied to seven suppliers. Both networks with the basis of milk-run concept
can be implemented to 47% of suppliers which is almost a half of the total suppliers. In
these two networks, some additional costs will be emerged and some transportation
cost will be reduced which will be calculated in the next section. The rest 24% which
consists of 15 suppliers are assigned to Kanban delivery network which does not make
any change in cost.
7.2. Cost Calculation
The last step in this study is to calculate how much the costs will be emerged by
implementing the proposed framework as well as how much the transport cost can be
eliminated from the purchased parts. As have been mentioned in methodology part, the
cost calculation will be measured roughly based on assumptions. Some assumptions
of the calculation are number of lots carried in each cycle (three lots per cycle), number
of cycles in one day (five cycles per day), and a fixed milk-run transportation fee without
considering possibilities of increased fee due to inflation or other economic matters.
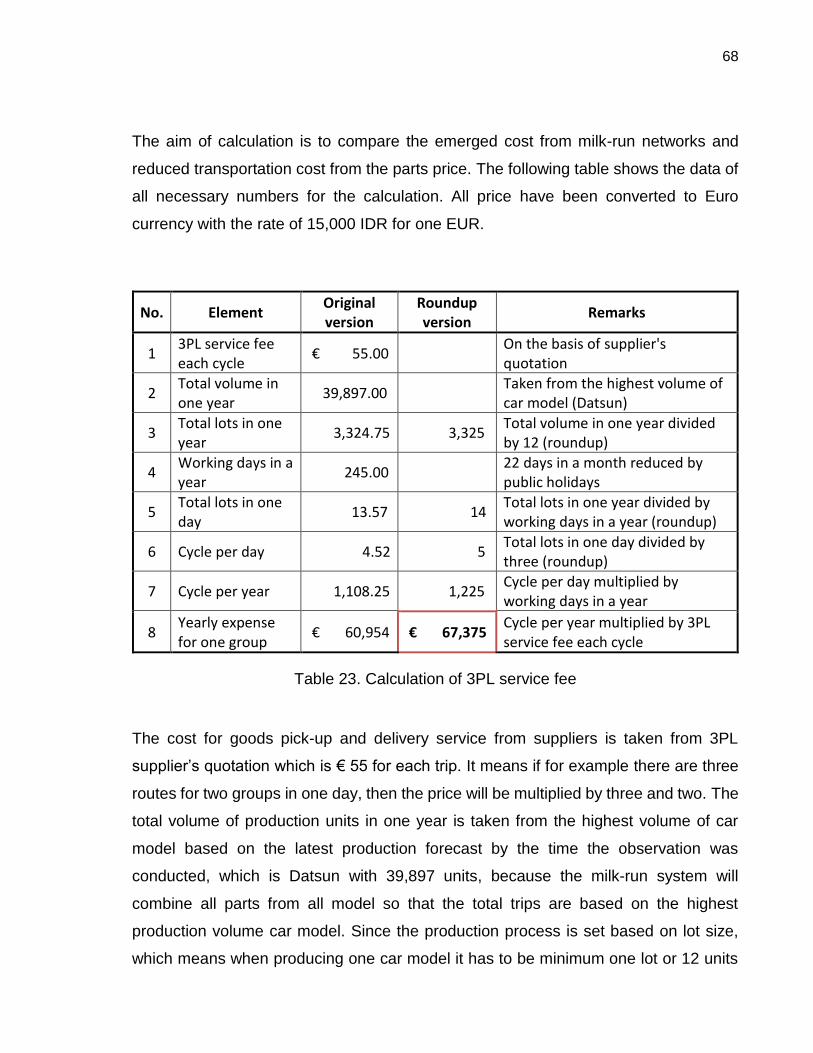
68
The aim of calculation is to compare the emerged cost from milk-run networks and
reduced transportation cost from the parts price. The following table shows the data of
all necessary numbers for the calculation. All price have been converted to Euro
currency with the rate of 15,000 IDR for one EUR.
No. Element Original version
Roundup version
Remarks
1 3PL service fee each cycle
€ 55.00 On the basis of supplier's quotation
2 Total volume in one year
39,897.00 Taken from the highest volume of car model (Datsun)
3 Total lots in one year
3,324.75 3,325 Total volume in one year divided by 12 (roundup)
4 Working days in a year
245.00 22 days in a month reduced by public holidays
5 Total lots in one day
13.57 14 Total lots in one year divided by working days in a year (roundup)
6 Cycle per day 4.52 5 Total lots in one day divided by three (roundup)
7 Cycle per year 1,108.25 1,225 Cycle per day multiplied by working days in a year
8 Yearly expense for one group
€ 60,954 € 67,375 Cycle per year multiplied by 3PL service fee each cycle
Table 23. Calculation of 3PL service fee
The cost for goods pick-up and delivery service from suppliers is taken from 3PL
supplier’s quotation which is € 55 for each trip. It means if for example there are three
routes for two groups in one day, then the price will be multiplied by three and two. The
total volume of production units in one year is taken from the highest volume of car
model based on the latest production forecast by the time the observation was
conducted, which is Datsun with 39,897 units, because the milk-run system will
combine all parts from all model so that the total trips are based on the highest
production volume car model. Since the production process is set based on lot size,
which means when producing one car model it has to be minimum one lot or 12 units

69
of car, the parts order to supplier is also made based on lot quantity. Therefore, the
total lots of the highest car model unite production in one year is the total volume divided
by 12 and results 3,325 lots in roundup version. There are 245 working days in one
year and the amount of lots for one day is the total lots in one year divided by working
days which results around 14 lots per day. The milk-run system is assumed to have
three lots in one cycle so that there are five lots per day and multiplied by working days
per year, there will be 1,225 cycles in one year. Therefore, the total expense for milk-
run pick-up and delivery service is € 55 multiplied by 1,225 cycles and results € 67,375
per year for one group of suppliers location.
Based on the table 20, there are four groups will be set for direct milk-run. Therefore,
the total expense will be the yearly expense for one group multiplied by four which
results € 269,500. After getting the additional expense for direct milk-run system, it will
be compared to the total amount of transportation cost which ideally should be cut from
the products prices. The table of transportation cost of each suppliers which are
assigned to milk-run distribution system can be seen in appendix 4. The total
transportation cost in one year is around € 248,298. Hence, for implementing direct
milk-run system, the company has to spend additional expense around € 21,202 in one
year.
The next calculation if for calculating the additional expense for milk-run via distribution
center system. The calculation for milk-run with DC network is presented in below table.
Element Basic fee Yearly expense Total cost
Milk-run cost € 67,375 / year / group € 67,375
€ 154,363 DC rental cost € 2,400 / month € 28,800
Cycle cost € 47.5 / cycle € 58,188
Table 24. Cost calculation for milk-run via DC network

70
Since there is only one group needed for the milk-run distribution process from
suppliers to the DC, the yearly expense for milk-run service is taken as € 67,375.
Another additional costs are emerged from the DC rental fee and distribution service
from the DC to manufacturing plant. The rental cost for the distribution center is around
€ 2,400 per month which results € 28,800 for one year. The service fee for carrying
goods from DC to manufacturing plant is € 47.5 per cycle. Using the calculation from
table 20, there are approximately 1,225 cycles in one year for the milk-run routing
activities which results 58,188 for parts distribution from the DC to manufacturing plant.
Hence, the total additional expense for implementing milk-run via DC system is €
154,363. From appendix 4, the total transportation cost from suppliers with milk-run via
DC network could be reduced to € 158,233. Therefore, there is surprisingly a
decreasing cost at amount of € 3,871 in milk-run via DC implementation. The final cost
calculation from both networks are then combined as the following table.
Direct milk-run Milk-run via DC
Additional expense + € 269,500 + € 154,363
Eliminated transport cost - € 248,298 - € 158,233
Total + € 21,202 - € 3,871
Combined cost + € 17,331
Table 25. Summary of cost calculation
The table above shows the accumulation of additional and reduced cost in both direct
milk-run and milk-run via DC system. As a result, the total cost that has to be spent by
the company for implementing the proposed framework is around € 17,331 per year or
€ 1,444 per month.
71
8. CONCLUSION
Tailored network is an excellent shipment method to optimize the supply chain system
both from suppliers to manufacturing plant or from distributors to consumers. The
concept of tailored network contains flexibility to assign different shipment method to
suppliers based on some conditions. In this case study, f our different methods are
proposed to be applied to different number of suppliers in order to optimize the logistics
system and reduce the warehouse consumption in the case company. Out of 63
suppliers with direct shipment as their current delivery system, 18 suppliers are
suggested to keep using direct delivery method. 25 suppliers are assigned into milk-
run distribution systems, 18 of them by using direct milk-run network and seven with
milk-run via DC system. Finally, the rest 15 suppliers are assigned to Kanban delivery
system.
One challenge in applying tailored network to the supply chain system is there would
be higher coordination required in the operation, particularly at the beginning of
implementation. Changing current transportation system would involve number of
parties including people from logistics and inventory section, receiving and loading
process, purchasing department and suppliers. However, this system should be simpler
than it sounds at the beginning by the time people are getting used to run it this way.
According to cost calculation result, the company has to spend around € 17,331 in one
year as additional cost for implementing the proposed transportation framework which
is another challenge to adopt this concept of tailored logistics network. However, this
amount of expense is still less than the cost for renting or building another warehouse
and there are some points of beneficial in implementing this framework. The company
should consider about the saving consumption in the current inventory area which is
the main purpose of this study. By applying tailored logistics network, the consumption
of warehouse would be much less and all parts should be accommodated well in the
inventory even when the production volume is high. Another thing that can be taken
into account are the concern about green logistics issues. By implementing tailored
logistics network, particularly direct milk-run system and milk-run via distribution center,

72
the logistics activities could support the concerns of green supply chain management.
The milk run distribution network is designed to improve loading rates at possible levels
which leads to the number of trucks and distance reduction. As a result, it is a very
good transportation system which can reduce the exhaust gas of trucks. Therefore, the
application of milk run logistics can be highly evaluated from the viewpoint of
environmental policy.
One of limitations on this study is the incomplete number of suppliers which are taken
into analysis. When the transportation costs from all suppliers have been completed,
the framework of tailored network would be better with more than one group assigned
to milk-run with distribution center system. And theoretically, implementation of tailored
logistic network should reduce transportation cost if all ideal conditions are satisfied
including support from suppliers, which in this case to provide transportation cost data
in their products prices to be eliminated as they do not conduct the delivery process
anymore in milk-run systems. Another limitation is there is no calculation of reduced
consumption in the warehouse after implementing the proposed framework. Further
study can attempt to complete suppliers’ data for more optimum results and use
appropriate method for measuring the reduction of inventory area to be compared with
the emerged cost from other ways of delivery methods to obtain better evaluation of
the proposed transportation network.

73
REFERENCES
Akindipe, O. S. 2014. Inventory Management: A Tool for Optimal Use of Resources
and Overall Efficiency in Manufacturing SMEs. Journal of Entrepreneurship
Management and Innovation, vol. 10, pp. 93-113.
Arvidsson, N. 2013. The milk run revisited: A load factor paradox with economic and
environmental implications for urban freight transport. Transportation Research part A,
vol. 51, pp. 56-62.
Ballou, R. H. 2004. Business Logistics: Supply Chain Management. Pearson
Education, New Jersey.
Brar, G. S. & Saini, G. 2011. Milk Run Logistics: Literature Review and Directions.
Proceedings of the World Congress on Engineering, vol. 1.
Chopra, S. & Meindl, P. 2007. Supply Chain Management: Strategy, Planning, and
Operation. Pearson Education Inc., New Jersey.
Chopra, S. & Sodhi, M. S. 2004. Managing Risk to Avoid Supply Chain Breakdown.
MIT Sloan Management Review, vol. 46, pp. 53-61.
Christopher, M. 1992. Logistics: The Strategic Issues. Chapman & Hall, London.
Du, T., Wang, F. K. & Lu, P. 2007. A real-time vehicle-dispatching system for
consolidation milk runs. Transportation Research Part E, vol. 43, pp. 565-577.
Fichtinger, J., Ries, J. M., Grosse, E. H. & Baker, P. 2015. Assessing the environmental
impact of integrated inventory and warehouse management. International Journal of
Production Economics, article in press.
Ghiani, G., Laporte, G. & Musmanno, R. 2004. Introduction to Logistics Systems
Planning and Control. John Wiley & Sons Ltd, Sussex.
Graves, S. C., Rinnooy-Kan, A.H.G. & Zipkin, P.H. 2003. Logistics of Production and
Inventory. Elsevier Science Publishers B.V., Amsterdam.

74
Gyulai, D., Pfeiffer, A., Sobottka, T. & Vancza, J. 2013. Milkrun Vehicle Routing
Approach for Shop-floor Logistics. Procedia CIRP, vol. 7, pp. 127-132.
Hosseini, S. D., Akbarpourshirazi, M. & Karimi, B. 2014. Cross-docking and milk run
logistics in a consolidation network: a hybrid of harmony search and simulated
annealing approach. Journal of Manufacturing System, vol. 33, pp. 567-577.
Koumanakos, D. P. 2008. The effect of inventory management on firm performance.
International Journal of Productivity and Performance Management, vol. 57, pp. 355-
369.
Kovacs, Andras. 2011. Optimizing the storage assignment in a warehouse served by
milkrun logistics. International Journal of Production Economics, vol. 133, pp. 312-318.
Kumar, V. & Shilpa, M. 2014. Reduction of Inventory through Implementation of
Milkrun. International Journal of Manufacturing, Industrial & Management Engineering,
vol. 2, pp. 211-217.
Lai, K. & Cheng, T. C. E. 2009. Just-in-time logistics. Gower publishing, Aldershot.
Liu, J., Li, C. L. & Chan, C. Y. 2003. Mixed truck delivery systems with both hub-and-
spoke and direct shipment. Transportation Research, vol. 39, pp. 325-339.
Liu, J., Liao, X., Zhao, W. & Yang, N. 2015. A classification approach based on the
outranking model for multiple criteria ABC analysis. Omega, article in press, correction
proof.
Mokhtarinejad, M., Ahmadi, A., Karimi, B. & Rahmati, S.H.A. 2015. A novel learning
based approach for a new integrated location-routing and scheduling problem within
cross-docking considering direct shipment. Applied Soft Computing, vol. 34, pp. 274-
285.
Naufal, A., Jaffar, A., Yusoff, N. & Hayati, N. 2012. Development of Kanban System at
Local Manufacturing Company in Malaysia. Procedia Engineering, vol. 41, pp. 1721-
1726.

75
Nemoto, T. 2013. Efficient Green Logistics in Urban Areas: Milk Run Logistics in the
Automobile Industry. Sustainable Transport for Chinese Cities, pp. 319-337.
Nemoto, T., Hayashi, K. & Hashimoto, M. 2010. Milk-Run logistics by Japanese
automobile manufactures in Thailand. Procedia Social and Behavioral Sciences, vol.
2, pp. 5980-5989.
Olsen, T. L. & Parker, R. P. 2008. Inventory Management under Market Size Dynamics.
Management Science, vol. 54, pp. 1805-1821.
Patel, D. & Patel, M. B. 2013. Design and development of an internal milk-run material
supply system in automotive industry. International Journal of Application or Innovation
in Engineering and Management, vol. 2, pp. 233-235.
Rachman, A., Dhini, A. & Mustafa, N. 2009. Vehicle Routing Problems with Differential
Evolution Algorithm to Minimize Cost. The 20th National Conference of Australian
Society for Operations Research & the 5th International Logistics System Conference,
pp. 78.1-78.13.
Rahman, N. A. A., Sharif, S. M. & Esa, M. M. 2013. Lean Manufacturing Case Study
with Kanban System Implementation. Procedia Economics and Finance, vol. 7, pp.
174-180.
Robeson, J. F. & Copacino, W. C. 1994. The Logistics Handbook. Macmillan Inc., New
York.
Sadjadi, S.J., Jafari, M. & Amini, T. 2009. A new mathematical modeling and genetic
alogarithm search for milk run problem (an auto industry supply chain case study).
International Journal of Advanced Manufacturing Technology, vol. 44, pp. 194-200.
Vijayuargy, L. & Agarawal, G. 2013. A Comparative Study of Green Supply Chain
Management Practices in Indian, Japanese, and Chinese Companies. Journal of
Supply Chain Management, vol. 10, pp. 7-19.

76
Volling, T., Grunewald, M. & Spengler, T. S. 2013. An Integrated Inventory-
Transportation System with Periodic Pick-Ups and Leveled Replenishment. German
Academic Association for Business Research, vol. 6, pp. 173-194.
Waters, D. 2009. Supply Chain Management: An Introduction to Logistics. Palgrave
Macmillan, Hampshire.

77
Appendix 1. Data of suppliers’ category in each parameter
Datsun X-TrailGrand
LivinaJuke Serena Stability Demand Size Location Distance Cost
S1 Moderate High Small Aggregated Medium Low
S2 High High Medium Aggregated Medium Moderate
S3 High High Large Aggregated Short Moderate
S4 Moderate High Medium Aggregated Long Moderate
S5 Low Moderate Large Aggregated Short Low
S6 Low High Large Aggregated Short Moderate
S7 High High Large Aggregated Medium Moderate
S8 Low High Medium Aggregated Long Low
S9 Low Moderate Large Aggregated Short Low
S10 High High Small Aggregated Medium Low
S11 Low High Large Aggregated Long Low
S12 High High Medium Aggregated Medium Low
S13 Moderate Low Small Aggregated Long Low
S14 High High Medium Aggregated Long Moderate
S15 Moderate High Small Non-aggregated Long Low
S16 High High Small Aggregated Short Moderate
S17 High High Small Aggregated Long Moderate
S18 Moderate Moderate Large Aggregated Short Moderate
S19 Moderate Moderate Large Aggregated Long Low
S20 High High Medium Non-aggregated Long Moderate
S21 High High Medium Aggregated Long Moderate
S22 Moderate High Medium Aggregated Long Low
S23 Moderate High Medium Aggregated Short Moderate
S24 Moderate Moderate Small Non-aggregated Medium Low
S25 Moderate High Large Aggregated Short High
S26 Moderate High Large Aggregated Short Moderate
S27 Moderate High Medium Aggregated Medium High
S28 High High Medium Aggregated Medium Moderate
S29 Low High Large Aggregated Short High
S30 Moderate High Small Aggregated Long High
S31 Moderate High Small Aggregated Short Low
S32 High High Large Aggregated Medium Low
S33 High High Small Aggregated Medium Low
S34 Moderate High Large Non-aggregated Long Low
S35 Moderate High Small Aggregated Long Low
S36 High High Small Aggregated Short Moderate
S37 Low High Small Aggregated Medium Moderate
S38 Low Low Medium Aggregated Short Low
S39 Moderate Moderate Medium Aggregated Medium Low
S40 High High Small Aggregated Medium Low
S41 Moderate High Small Aggregated Medium Low
S42 High High Medium Non-aggregated Long High
S43 Moderate High Small Aggregated Short Low
S44 High High Small Aggregated Long Low
S45 Moderate Moderate Medium Aggregated Medium Low
S46 Moderate High Large Aggregated Short Low
S47 High High Medium Aggregated Short Moderate
S48 Low High Medium Aggregated Medium Moderate
S49 Low Moderate Small Aggregated Short Moderate
S50 Moderate High Large Aggregated Medium High
S51 High High Large Aggregated Medium Low
S52 Low Moderate Large Aggregated Short Moderate
S53 Moderate Moderate Medium Aggregated Medium Low
S54 Low Moderate Large Aggregated Short Low
S55 High High Large Aggregated Medium Moderate
S56 Moderate High Medium Aggregated Medium Low
S57 High High Large Aggregated Medium Low
S58 High High Large Aggregated Long Moderate
S59 High High Large Aggregated Short High
S60 Moderate High Medium Aggregated Short Moderate
S61 Low Moderate Small Aggregated Short Low
S62 Moderate High Large Aggregated Medium High
S63 Moderate High Large Aggregated Short High
SUPPLIER
CAR MODEL PARAMETER

78
Appendix 2. Suppliers scoring process
1 3 3 1 1 1 3 3 9 9 9 3 3 9 9 9 3 3 1 3 9 1 9 1
Stabil
ity
Dema
ndSize
Locati
on
Dista
nceCost
Stabil
ity
Dema
ndSize
Locati
on
Dista
nceCost
Stabil
ity
Dema
ndSize
Locati
on
Dista
nceCost
Stabil
ity
Dema
ndSize
Locati
on
Dista
nceCost
S1 2 4 1 2 2 2 3 4 3 4 3 1 1 4 3 4 3 1 2 4 0 2 0 2
S2 2 4 3 2 2 2 4 4 4 4 3 3 4 4 4 4 3 1 2 4 3 2 0 2
S3 2 4 4 2 2 2 4 4 0 4 4 3 4 4 0 4 1 1 2 4 4 2 4 2
S4 2 4 3 2 2 2 3 4 4 4 0 3 1 4 4 4 4 1 2 4 3 2 0 2
S5 2 1 4 2 2 2 1 3 0 4 4 1 1 3 0 4 1 1 2 3 4 2 4 2
S6 2 4 4 2 2 2 1 4 0 4 4 3 1 4 0 4 1 1 2 4 4 2 4 2
S7 2 4 4 2 2 2 4 4 0 4 3 3 4 4 0 4 3 1 2 4 4 2 0 2
S8 2 4 3 2 2 2 1 4 4 4 0 1 1 4 4 4 4 1 2 4 3 2 0 2
S9 2 1 4 2 2 2 1 3 0 4 4 1 1 3 0 4 1 1 2 3 4 2 4 2
S10 2 4 1 2 2 2 4 4 3 4 3 1 4 4 3 4 3 1 2 4 0 2 0 2
S11 2 4 4 2 2 2 1 4 0 4 0 1 1 4 0 4 4 1 2 4 4 2 0 2
S12 2 4 3 2 2 2 4 4 4 4 3 1 4 4 4 4 3 1 2 4 3 2 0 2
S13 2 1 1 2 2 2 3 1 3 4 0 1 1 0 3 4 4 1 2 1 0 2 0 2
S14 2 4 3 2 2 2 4 4 4 0 0 3 4 4 4 0 4 1 2 4 3 2 0 2
S15 2 4 1 2 2 2 3 4 3 0 0 1 1 4 3 0 4 1 2 4 0 2 0 2
S16 2 4 1 2 2 2 4 4 3 4 4 3 4 4 3 4 1 1 2 4 0 2 4 2
S17 2 4 1 2 2 2 4 4 3 4 0 3 4 4 3 4 4 1 2 4 0 2 0 2
S18 2 1 4 2 2 2 3 3 0 4 4 3 1 3 0 4 1 1 2 3 4 2 4 2
S19 2 1 4 2 2 2 3 3 0 4 0 1 1 3 0 4 4 1 2 3 4 2 0 2
S20 2 4 3 2 2 2 4 4 4 0 0 3 4 4 4 0 4 1 2 4 3 2 0 2
S21 2 4 3 2 2 2 4 4 4 4 0 3 4 4 4 4 4 1 2 4 3 2 0 2
S22 2 4 3 2 2 2 3 4 4 4 0 1 1 4 4 4 4 1 2 4 3 2 0 2
S23 2 4 3 2 2 2 3 4 4 4 4 3 1 4 4 4 1 1 2 4 3 2 4 2
S24 2 1 1 2 2 2 3 3 3 0 3 1 1 3 3 0 3 1 2 3 0 2 0 2
S25 2 4 4 2 2 2 3 4 0 4 4 4 1 4 0 4 1 4 2 4 4 2 4 2
S26 2 4 4 2 2 2 3 4 0 4 4 3 1 4 0 4 1 1 2 4 4 2 4 2
S27 2 4 3 2 2 2 3 4 4 4 3 4 1 4 4 4 3 4 2 4 3 2 0 2
S28 2 4 3 2 2 2 4 4 4 4 3 3 4 4 4 4 3 1 2 4 3 2 0 2
S29 2 4 4 2 2 2 1 4 0 4 4 4 1 4 0 4 1 4 2 4 4 2 4 2
S30 2 4 1 2 2 2 3 4 3 4 0 4 1 4 3 4 4 4 2 4 0 2 0 2
S31 2 4 1 2 2 2 3 4 3 4 4 1 1 4 3 4 1 1 2 4 0 2 4 2
S32 2 4 4 2 2 2 4 4 0 4 3 1 4 4 0 4 3 1 2 4 4 2 0 2
S33 2 4 1 2 2 2 4 4 3 4 3 1 4 4 3 4 3 1 2 4 0 2 0 2
S34 2 4 4 2 2 2 3 4 0 0 0 1 1 4 0 0 4 1 2 4 4 2 0 2
S35 2 4 1 2 2 2 3 4 3 4 0 1 1 4 3 4 4 1 2 4 0 2 0 2
S36 2 4 1 2 2 2 4 4 3 4 4 3 4 4 3 4 1 1 2 4 0 2 4 2
S37 2 4 1 2 2 2 1 4 3 4 3 3 1 4 3 4 3 1 2 4 0 2 0 2
S38 2 1 3 2 2 2 1 1 4 4 4 1 1 0 4 4 1 1 2 1 3 2 4 2
S39 2 1 3 2 2 2 3 3 4 4 3 1 1 3 4 4 3 1 2 3 3 2 0 2
S40 2 4 1 2 2 2 4 4 3 4 3 1 4 4 3 4 3 1 2 4 0 2 0 2
S41 2 4 1 2 2 2 3 4 3 4 3 1 1 4 3 4 3 1 2 4 0 2 0 2
S42 2 4 3 2 2 2 4 4 4 0 0 4 4 4 4 0 4 4 2 4 3 2 0 2
S43 2 4 1 2 2 2 3 4 3 4 4 1 1 4 3 4 1 1 2 4 0 2 4 2
S44 2 4 1 2 2 2 4 4 3 4 0 1 4 4 3 4 4 1 2 4 0 2 0 2
S45 2 1 3 2 2 2 3 3 4 4 3 1 1 3 4 4 3 1 2 3 3 2 0 2
S46 2 4 4 2 2 2 3 4 0 4 4 1 1 4 0 4 1 1 2 4 4 2 4 2
S47 2 4 3 2 2 2 4 4 4 4 4 3 4 4 4 4 1 1 2 4 3 2 4 2
S48 2 4 3 2 2 2 1 4 4 4 3 3 1 4 4 4 3 1 2 4 3 2 0 2
S49 2 1 1 2 2 2 1 3 3 4 4 3 1 3 3 4 1 1 2 3 0 2 4 2
S50 2 4 4 2 2 2 3 4 0 4 3 4 1 4 0 4 3 4 2 4 4 2 0 2
S51 2 4 4 2 2 2 4 4 0 4 3 1 4 4 0 4 3 1 2 4 4 2 0 2
S52 2 1 4 2 2 2 1 3 0 4 4 3 1 3 0 4 1 1 2 3 4 2 4 2
S53 2 1 3 2 2 2 3 3 4 4 3 1 1 3 4 4 3 1 2 3 3 2 0 2
S54 2 1 4 2 2 2 1 3 0 4 4 1 1 3 0 4 1 1 2 3 4 2 4 2
S55 2 4 4 2 2 2 4 4 0 4 3 3 4 4 0 4 3 1 2 4 4 2 0 2
S56 2 4 3 2 2 2 3 4 4 4 3 1 1 4 4 4 3 1 2 4 3 2 0 2
S57 2 4 4 2 2 2 4 4 0 4 3 1 4 4 0 4 3 1 2 4 4 2 0 2
S58 2 4 4 2 2 2 4 4 0 4 0 3 4 4 0 4 4 1 2 4 4 2 0 2
S59 2 4 4 2 2 2 4 4 0 4 4 4 4 4 0 4 1 4 2 4 4 2 4 2
S60 2 4 3 2 2 2 3 4 4 4 4 3 1 4 4 4 1 1 2 4 3 2 4 2
S61 2 1 1 2 2 2 1 3 3 4 4 1 1 3 3 4 1 1 2 3 0 2 4 2
S62 2 4 4 2 2 2 3 4 0 4 3 4 1 4 0 4 3 4 2 4 4 2 0 2
S63 2 4 4 2 2 2 3 4 0 4 4 4 1 4 0 4 1 4 2 4 4 2 4 2
SUPPLIER
Direct Shipment Milk-run Milk-run via DC Kanban
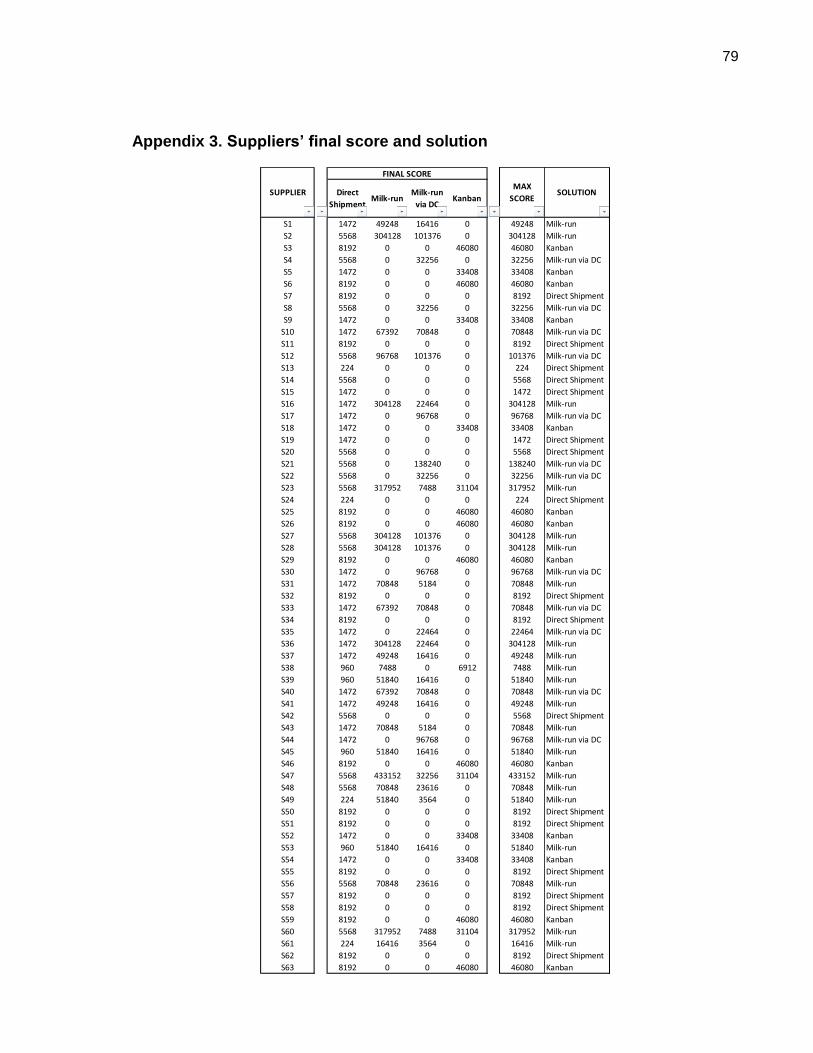
79
Appendix 3. Suppliers’ final score and solution
S1 1472 49248 16416 0 64 49248 Milk-run
S2 5568 304128 101376 0 63 304128 Milk-run
S3 8192 0 0 46080 62 46080 Kanban
S4 5568 0 32256 0 61 32256 Milk-run via DC
S5 1472 0 0 33408 60 33408 Kanban
S6 8192 0 0 46080 59 46080 Kanban
S7 8192 0 0 0 58 8192 Direct Shipment
S8 5568 0 32256 0 57 32256 Milk-run via DC
S9 1472 0 0 33408 56 33408 Kanban
S10 1472 67392 70848 0 55 70848 Milk-run via DC
S11 8192 0 0 0 54 8192 Direct Shipment
S12 5568 96768 101376 0 53 101376 Milk-run via DC
S13 224 0 0 0 52 224 Direct Shipment
S14 5568 0 0 0 51 5568 Direct Shipment
S15 1472 0 0 0 50 1472 Direct Shipment
S16 1472 304128 22464 0 49 304128 Milk-run
S17 1472 0 96768 0 48 96768 Milk-run via DC
S18 1472 0 0 33408 47 33408 Kanban
S19 1472 0 0 0 46 1472 Direct Shipment
S20 5568 0 0 0 45 5568 Direct Shipment
S21 5568 0 138240 0 44 138240 Milk-run via DC
S22 5568 0 32256 0 43 32256 Milk-run via DC
S23 5568 317952 7488 31104 42 317952 Milk-run
S24 224 0 0 0 41 224 Direct Shipment
S25 8192 0 0 46080 40 46080 Kanban
S26 8192 0 0 46080 39 46080 Kanban
S27 5568 304128 101376 0 38 304128 Milk-run
S28 5568 304128 101376 0 37 304128 Milk-run
S29 8192 0 0 46080 36 46080 Kanban
S30 1472 0 96768 0 35 96768 Milk-run via DC
S31 1472 70848 5184 0 34 70848 Milk-run
S32 8192 0 0 0 33 8192 Direct Shipment
S33 1472 67392 70848 0 32 70848 Milk-run via DC
S34 8192 0 0 0 31 8192 Direct Shipment
S35 1472 0 22464 0 30 22464 Milk-run via DC
S36 1472 304128 22464 0 29 304128 Milk-run
S37 1472 49248 16416 0 28 49248 Milk-run
S38 960 7488 0 6912 27 7488 Milk-run
S39 960 51840 16416 0 26 51840 Milk-run
S40 1472 67392 70848 0 25 70848 Milk-run via DC
S41 1472 49248 16416 0 24 49248 Milk-run
S42 5568 0 0 0 23 5568 Direct Shipment
S43 1472 70848 5184 0 22 70848 Milk-run
S44 1472 0 96768 0 21 96768 Milk-run via DC
S45 960 51840 16416 0 20 51840 Milk-run
S46 8192 0 0 46080 19 46080 Kanban
S47 5568 433152 32256 31104 18 433152 Milk-run
S48 5568 70848 23616 0 17 70848 Milk-run
S49 224 51840 3564 0 16 51840 Milk-run
S50 8192 0 0 0 15 8192 Direct Shipment
S51 8192 0 0 0 14 8192 Direct Shipment
S52 1472 0 0 33408 13 33408 Kanban
S53 960 51840 16416 0 12 51840 Milk-run
S54 1472 0 0 33408 11 33408 Kanban
S55 8192 0 0 0 10 8192 Direct Shipment
S56 5568 70848 23616 0 9 70848 Milk-run
S57 8192 0 0 0 8 8192 Direct Shipment
S58 8192 0 0 0 7 8192 Direct Shipment
S59 8192 0 0 46080 6 46080 Kanban
S60 5568 317952 7488 31104 5 317952 Milk-run
S61 224 16416 3564 0 4 16416 Milk-run
S62 8192 0 0 0 3 8192 Direct Shipment
S63 8192 0 0 46080 2 46080 Kanban
FINAL SCORE
MAX
SCORESOLUTIONDirect
ShipmentMilk-run
Milk-run
via DCKanban
SUPPLIER

80
Appendix 4. Transport cost data
Network SupplierTransport
cost (EUR)
Direct milk-run S28 53,196
Direct milk-run S39 4,459
Direct milk-run S37 7,492
Direct milk-run S1 714
Direct milk-run S2 16,110
Direct milk-run S27 73,268
Direct milk-run S45 2,304
Direct milk-run S48 12,923
Direct milk-run S53 430
Direct milk-run S56 3,213
Direct milk-run S12 1,330
Direct milk-run S10 1,013
Direct milk-run S33 209
Direct milk-run S40 27
Direct milk-run S41 19
Direct milk-run S38 541
Direct milk-run S47 8,977
Direct milk-run S31 1,182
Direct milk-run S61 1,140
Direct milk-run S16 5,320
Direct milk-run S36 8,767
Direct milk-run S43 121
Direct milk-run S49 45,545
248,298
Milk-run via DC S4 14,640
Milk-run via DC S8 3,400
Milk-run via DC S21 53,196
Milk-run via DC S22 744
Milk-run via DC S30 83,784
Milk-run via DC S44 1,912
Milk-run via DC S35 558
158,233
Total transport cost for
direct milk-run suppliers
Total transport cost for
milk-run via DC suppliers