Embed Size (px)
Citation preview

LANSA WORKING PAPER SERIES
Volume 2017 No 18
Household Approaches to Factors Affecting Nutrition: a Study of Two Indian Districts Anjali Neelakantan & Lina Sonne August 2017

2
About this paper This paper is part of a project titled FAN Innovation Systems and Institutions: Enabling Alternative Policy Frameworks for Food, Agriculture and Nutrition funded by Leveraging Agriculture for Nutrition in South Asia (LANSA) Research Consortium Programme under the first Responsive Window grant funds. We thank Huma Tariq and Sindhu Prasanna for research assistance, Mohna Dhamankar and Jessica Seddon for advice and our local fieldwork partners BIRDS in Karnataka and SEWA in Gujarat. About LANSA Leveraging Agriculture for Nutrition in South Asia (LANSA) is an international research partnership. LANSA is finding out how agriculture and agri-food systems can be better designed to advance nutrition. LANSA is focused on policies, interventions and strategies that can improve the nutritional status of women and children in South Asia. LANSA is funded by UK aid from the UK government. The views expressed do not necessarily reflect the UK Government's official policies. For more information see www.lansasouthasia.org

3
Contents Contents .............................................................................................................................................................................. 3 Abstract ................................................................................................................................................................................ 4 1 Introduction ..................................................................................................................................................................... 4 2 Literature Review ........................................................................................................................................................... 5 2.1 Factors affecting nutrition and uptake of nutritious food. ................................................................................ 5 2.1.1 Care ............................................................................................................................................................................ 6 2.1.2 Food production, availability and access. ........................................................................................................... 7 2.1.3 Health, water, sanitation and hygiene ................................................................................................................ 7 2.1.4 Women's agency and empowerment. ................................................................................................................ 8 2.2 Framework for study: Women and food, agriculture and nutrition .............................................................. 8 3 Methodology ................................................................................................................................................................. 10 3.1 Research methods .................................................................................................................................................... 10 3.2 State, district and village selection10. .................................................................................................................... 11 4 Setting the Context-District and Village-level Data ............................................................................................. 12 4.1 Bijapur, Karnataka. .................................................................................................................................................... 12 4.1.1 District-level statistics .......................................................................................................................................... 12 4.1.1.1 Socioeconomic indicators ................................................................................................................................ 12 4.1.1.2 Agriculture-related indicators ......................................................................................................................... 13 4.1.1.3 Climatic conditions ............................................................................................................................................ 14 4.1.1.4 Physical infrastructure ....................................................................................................................................... 15 4.1.1.5 Infrastructure for food-agriculture-nutrition ............................................................................................... 15 4.1.2 Context of the villages-Inchegeri and Kanakanala30. ..................................................................................... 16 4.2 Sabarkantha, Gujarat ................................................................................................................................................ 17 4.2.1 District-level statistics .......................................................................................................................................... 17 4.2.1.1 Socioeconomic indicators ................................................................................................................................ 17 4.2.1.2 Agriculture-related indicators ......................................................................................................................... 17 4.2.1.3 Climatic conditions ............................................................................................................................................ 18 4.2.1.4 Physical infrastructure ....................................................................................................................................... 18 4.2.1.5 Infrastructure for food-agriculture-nutrition ............................................................................................... 18 4.2.2 Context of the villages-Sonasan and Ranchodpura36 .................................................................................... 18 5 Households' Approach to Nutrition: Results37 ..................................................................................................... 19 5.1 Care. ............................................................................................................................................................................ 22 5.1.1 Food preparation and consumption practices ................................................................................................ 22 5.1.2 Responsibility for the household, children and elderly ................................................................................ 25 5.2 Agriculture: Food production, food availability and food access .................................................................. 25 5.2.1 Agriculture and food production ....................................................................................................................... 25 5.2.2 Food availability and access ................................................................................................................................. 28 5.3 Health, water, sanitation and hygiene .................................................................................................................. 28 5.3.1 Health44 .................................................................................................................................................................... 28 5.3.2 Water, sanitation and hygiene(WASH)47 ......................................................................................................... 30 5.4 Women's agency and empowerment. ................................................................................................................. 32 5.4.1 Care .......................................................................................................................................................................... 33 5.4.2 Agriculture, food availability and food access ................................................................................................. 33 6. Discussion ..................................................................................................................................................................... 34 7. Conclusion .................................................................................................................................................................... 38 References ......................................................................................................................................................................... 39 Appendix 1 ........................................................................................................................................................................ 42 Appendix 2 ........................................................................................................................................................................ 43

4
Abstract A number of factors affect a household’s nutritional status: food production; access and availability of food; care in the home; health, water, sanitation and hygiene practices; women’s agency and empowerment; and women’s role as primary caregivers. This paper explores these factors at the household level by interviewing 100 women across four rural villages in Bijapur, Karnataka and Sabarkantha, Gujarat. This study seeks to improve our perception of how women and their families understand nutrition and whether some of the factors affecting nutrition are given less importance compared to others. We find that households think of nutrition primarily as healthy food that provides energy for physical work. Access and availability of food depends on climatic conditions, and in both districts, there has been a general decline in agricultural production that has affected the quantity and quality of food consumed. Households recognise the links between food they eat and the subsequent nutrition they derive from it, and hence pursue foods that they think are nutritious. However, there are challenges in terms of poor hygiene, sanitation practices and water purification practices in most households. While lack of supporting physical infrastructure is just one part of the problem, behaviour change campaigns highlighting the importance of good hygiene habits in these villages have not yet taken root, or in some cases have not had the desired result yet. In terms of their role in these communities, women have a key role to play on the family farms and in the household as caregivers. However, their decision-making capacities are limited, more so in Bijapur than in Sabarkantha. For any nutrition intervention to be successful at the household level, it has to incorporate all these factors and ensure that they are aligned and synchronised to meet the nutritional needs of the household. Solving challenges related to any one factor alone is unlikely to create any long-lasting impact on a household’s nutritional status.
1. Introduction A multiplicity of factors affects an individual’s nutritional status1: food access and availability; health, water, sanitation and hygiene practices; and the care given in the home. The better performing the combination of these factors are, the better the overall nutritional status of an individual. In a majority of families, women are the primary caregivers. Hence, they have a crucial role to play in ensuring the high nutritional status of the family (Smith 2003; Quisumbing et al. 1995). Within the home, it is the care and agency of the primary caregiver that can ensure that healthy and hygienic practices and access to nutritious food results in improved nutritional status for the family. It is here that women’s empowerment plays a major role: their agency and ability to take the best decisions in terms of nutrition for the family matters since they are primary caregivers whose responsibilities include cooking, cleaning and raising children. In addition, in rural areas, many women work in agriculture and related activities and are thus part of agricultural production, bringing home income as well as food.
1 For the purpose of this study, improved nutritional status refers to the number of cases of community-recognised malnourishment or undernourishment in a household. While the in-depth interviews did not ask direct questions on the status of malnourishment and undernourishment in households, nor did we have the scope within this study to undertake empirical measurements of height/weight or other physical indicators within the household, the interviews did cover questions on household food habits, IFA tablet consumption by adolescent girls and pregnant women as well as households’ view of whether the children in his/her community are well nourished.

5
This paper reviews the factors (food production, access and availability; care in the home; health, water, sanitation and hygiene; and women’s empowerment) affecting nutritional status, and studies these at the household level. The research questions are:
1. What is the role of women in the household economy in these predominantly agrarian communities?
2. What is households’ understanding of nutrition? In the villages studied, do women see the linkages between agriculture, food and nutrition?
3. How do factors affecting nutrition interact at the household level? This paper is part of a larger project that considers nutrition, agriculture and gender policy at the national and state level, policy implementation and the enabling ecosystem at the district level, as well as the way families (represented by women) approach and handle factors affecting nutrition at the household level. It draws extensively on a K.I.T. toolkit on gendered nutrition and agriculture.2 The paper is part of a LANSA-funded project that looks at food, agriculture, nutrition, and factors affecting them at the national, state, district and household level. The paper is based on primary data collection through a questionnaire administered to 50 women in Sabarkantha district in Gujarat and 50 women in Bijapur3 district, Karnataka as well as a total of six focus group discussions with eight to ten women each across the two districts. The paper begins by reviewing factors affecting nutrition, before detailing the methodology used for data collection. We then provide an overview of the two districts and four villages where we collected data, before discussing food, agriculture and nutrition at the household level. We follow on by discussing the data on factors influencing nutrition and how households deal with these. Finally, we discuss our findings and how these extend existing literature, based on the key questions this paper is focused on.
2. Literature Review 2.1 Factors affecting nutrition and uptake of nutritious food Access to, and availability of - food, health and care affect nutrition (SPRING 2014; Verhart et al. 2016; Lancet 2013). Access to food includes availability of nutritious and healthy food, and the ability to acquire these foods by growing or purchasing them. Health encompasses the health status of an individual and the community, which in turn depends on access to sanitation facilities, clean drinking water, and habits such as hand-washing with soap to avoid disease. Lastly, the care that is given through cooking and feeding children and other family members is also a key factor affecting nutrition (Verhart et al. 2016).
2 See Methodology section.
3 The district and its namesake headquarters also goes by the name of Vijayapura. However, while the government uses this name for official purposes, every stakeholder we spoke to used Bijapur, which is why this is used throughout the paper.!
6
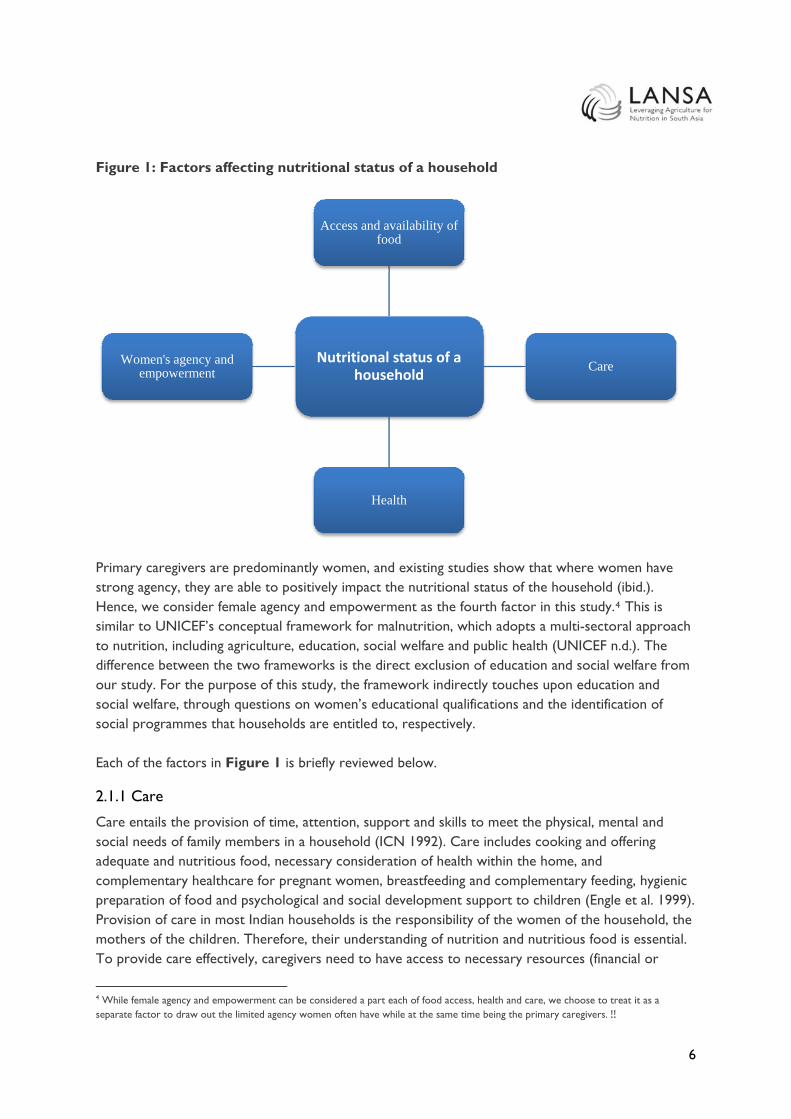
Figure 1: Factors affecting nutritional status of a household
Nutritional status of a household
Access and availability of food
Care
Health
Women's agency and empowerment
Primary caregivers are predominantly women, and existing studies show that where women have strong agency, they are able to positively impact the nutritional status of the household (ibid.). Hence, we consider female agency and empowerment as the fourth factor in this study.4 This is similar to UNICEF’s conceptual framework for malnutrition, which adopts a multi-sectoral approach to nutrition, including agriculture, education, social welfare and public health (UNICEF n.d.). The difference between the two frameworks is the direct exclusion of education and social welfare from our study. For the purpose of this study, the framework indirectly touches upon education and social welfare, through questions on women’s educational qualifications and the identification of social programmes that households are entitled to, respectively. Each of the factors in Figure 1 is briefly reviewed below.
2.1.1 Care
Care entails the provision of time, attention, support and skills to meet the physical, mental and social needs of family members in a household (ICN 1992). Care includes cooking and offering adequate and nutritious food, necessary consideration of health within the home, and complementary healthcare for pregnant women, breastfeeding and complementary feeding, hygienic preparation of food and psychological and social development support to children (Engle et al. 1999). Provision of care in most Indian households is the responsibility of the women of the household, the mothers of the children. Therefore, their understanding of nutrition and nutritious food is essential. To provide care effectively, caregivers need to have access to necessary resources (financial or
4 While female agency and empowerment can be considered a part each of food access, health and care, we choose to treat it as a separate factor to draw out the limited agency women often have while at the same time being the primary caregivers.!!
7
otherwise), knowledge of best practices, and the time and ability to be able to implement good care practices in their homes (ibid.).
2.1.2 Food production, availability and access
For rural households, agriculture plays a key role as it brings income to the family as well as provides access to food. Agriculture provides access to food in two ways — either directly where agricultural households retain a part of their produce for home consumption or indirectly where income earned from sale of agricultural produce is used to purchase food for the household (Verhart et al. 2016). With increased food production since the Green Revolution, there has been a call for considering nutritional requirements of the population, while determining cropping and farming patterns (Swaminathan and Bhavani 2013). The debate on the impact of the Green Revolution is ongoing, especially regarding its effect on hunger alleviation, since it increased the production of cereals like rice and wheat and resulted in less diversified agricultural production and food intake (Freebairn 1995; Swaminathan 2006; Remans et al. 2007, as cited in Burchi et al. 2011). Food availability and access is further determined by access to markets and related supply chain logistics. Here, road connectivity often plays a key role in linking agricultural producers to consumers, even if the consumers produce food for self-consumption.
2.1.3 Health, water, sanitation and hygiene
Health and nutrition share a cyclical relationship, where poor health results in low absorption of nutrients in food, and malnutrition results in poor health conditions of an individual. For this study, household health is determined in terms of nutritional deficiencies: iodine and iron, access to primary healthcare facilities, incidence of illnesses and out-of-pocket expenditure on illnesses. In addition to these, public health, in terms of access to drinking water sources, sanitation and hygiene, also plays a role in ensuring the health of a household and a community at large. Drinking water can often be contaminated with bacteria or polluted with household waste or industrial effluents, resulting in the spread of water-borne diseases like cholera and diarrhoea. The economic burden of poor water quality is estimated to be USD 600 million a year in India (Khurana and Sen 2011). Furthermore, poor sanitation practices have been linked to childhood stunting (Spears et al. 2013). The prospects for improved sanitation may be changing: with national-level initiatives like the Swachh Bharat Abhiyan, there is a growing momentum behind improving sanitation-related practices, both by increasing toilet coverage in the country and by increasing awareness through communication campaigns on behaviour change. While the number of toilets across the country is reported to have increased substantially to 35 million, almost double the 2001 figures, usage remains poor due to limited water supply in these toilets, and cultural preferences, where individuals prefer to defecate in the open rather than in closed spaces (Chauhan 2017). In addition to toilet availability and usage, handwashing is the final component of hygiene. Systematic reviews have indicated that handwashing with soap reduced the risk of diarrhoea by 48 per cent (Dobe et al. 2013). The WASH (water, sanitation and handwashing) sector and nutrition sector are known to have common goals of improving child and maternal health. Experts have recommended integrating the individual sectoral programmes for greater programme effectiveness (Teague 2014).

8
2.1.4 Women’s agency and empowerment
Given women’s prominent role in household functioning, it is not surprising that a number of studies suggest that women’s empowerment5 is a significant pathway by which agricultural (and other) programmes can achieve nutritional impact (LeRoy and Frongillo 2007; Hawkes et al. 2012; Gillespie et al. 2012; as cited in Webb 2013). Women’s empowerment results in: 1) greater influence of women within the household, 2) improved nutritional status of women themselves, and 3) increased agency6 over how they use their time and the trade-offs they make between different kinds of activities (SPRING 2014; Meeker and Haddad 2013). Women’s empowerment affects household nutrition levels in a number of ways: in terms of the role and decision-making abilities women have in food production on the farm; the way women spend income; the way food is utilised (stored, prepared and consumed), as well as the distribution of food within the home; the access women have to good healthcare, water and sanitation facilities, as well as knowledge about these; and care practices and the ability to care for other family members, as well as, caring for themselves, including the need for healthy pregnancies (Verhart et al. 2016:14). A woman’s many roles — as a carer- producer on the farm and consumer of food — can be in conflict with one another. For example, women may have less time to care for children, because they have to work on the farm to ensure food access and income (ibid.). Women’s participation in agricultural activities and their ownership of assets are linked to their influence in intra-household decision-making and allocation of resources to food, health and care (Kadiyala et al. 2014). Women’s participation in agricultural activities affects maternal and child status, and this in turn affects the nutritional outcomes for both (Sarada and Rajani 2012). Female agency is also likely to have a positive impact on health. For example, a study conducted in Andhra Pradesh revealed that women with higher agency and mobility outside the house (those who can go to the market) were significantly less likely to have stunted children (Shroff et al. 2009). In sum, the review of literature highlights the many interconnected factors that affect nutritional outcomes. While much focus in the literature has been on the implementation of policies and programmes, including evaluation of the impact of specific measures on beneficiaries, this paper extends the work by studying how households understand nutrition and the decisions they take to ensure nutritious meals for their family, as well as factors (food production, access and availability; care in the home; health, water, sanitation and hygiene; and women’s empowerment) affecting household nutritional status.
2.2 Framework for study: Women and food, agriculture and nutrition Drawing on the literature, this study considers four factors affecting nutrition and nutritional uptake: 1) care in the home, 2) food production, availability and access, 3) health, water, sanitation and hygiene, and 4) women’s agency and empowerment at the household level. 5 For the purpose of this study, we have used Duflo’s (2012) definition of women’s empowerment. Duflo defines women’s empowerment as “improving the ability of women to access the constituents of development – in particular health, education, earning opportunities, rights and political participation.” 6 Based on Sen’s conceptualisation of agency in which “a person is free to do and achieve in pursuit of whatever goals or values he or she regards as important.” Empowerment is an expansion of agency.!!

9
Table 1: Study framework Factor Details Care • Food habits and preparation
• Care in the home (care for pregnant women, children and elderly, psychological and social support for children)
Food production, availability and access
• Access to food grown on farm and/or bought in the market • Income for buying food • Availability of food locally • Availability of food through government schemes and programmes
Health, water, sanitation and hygiene
• Healthcare o Utilisation and absorption of food o Access to health care provider, and cost of healthcare
• Drinking water o Source of drinking water o Clean drinking water practice
• Sanitation o Construction and usage of toilets
• Hygiene o Handwashing with soap
Women’s agency and empowerment
• Roles in agriculture and household • Decision-making agency • Access to and control over resources • Societal norms and values
The framework draws on the Nutrition and Gender Sensitive Agriculture Toolkit developed by the Royal Tropical Institute (KIT) and SNV, the Netherlands,7 to design nutrition-sensitive agricultural programmes. For this study, we drew on background papers to the toolkit (such as Verhart et al. 2016), as well as the toolkit itself for Phase One — context analysis (overview of national and local context, participatory and stakeholder mapping, key informant interviews, focus group discussions). The toolkit provides questions to understand and review the current situation with respect to factors affecting nutrition. However, we adapted it to this study by undertaking questionnaire-based interviews with women in households, rather than involve an extensive number of focus groups, as the toolkit does. We believe this to be a more suitable approach as we would receive individual descriptions of household habits and approaches to nutrition, and that it would require less time from women respondents. In addition, in-depth interviews will be more able to provide household-level information, which will allow for correlation of demographic characteristics like age, religious group, and education with knowledge, attitude and practices around food, nutrition, agriculture and decision-making. This level of depth in the analysis cannot be gained through focus group discussions alone. The toolkit, which has been extensively tested in Southeast Asia and Africa, is important and appropriate in that it provides sets of questions, and guidance for those questions on factors affecting nutrition, and 7 Nutrition and Gender Sensitive Agriculture Mapping Tool. SNV Netherlands Development Organisation and Royal Tropical Institute (KIT). Retrieved from: http://www.ngsatoolkit.org/home/!!

10
especially linking gender, agriculture and nutrition. Using this framework, we questioned women about each of the four factors as well as their understanding of nutrition to see how these come together within the household.8
3. Methodology This paper is part of a research project that has used a mixed methods approach to data collection, including secondary data and statistics, and primary research such as semi-structured interviews with stakeholders, structured questionnaire-based household interviews, transect walk, focus groups and consultative workshops.9 We did this in two villages in Sabarkantha district in Gujarat, and two villages in Bijapur district in Karnataka.
3.1 Research methods This study considers the following broad questions:
1. What is the role of women in the household economy in these predominantly agrarian communities?
2. What are the households’ understanding of nutrition? Do women see the linkages between agriculture, food and nutrition?
3. How do factors affecting nutrition interact at the household level? We collected available secondary data on states, districts and villages, drawing heavily from secondary data such as Census 2001 and 2011, district statistics collected and disseminated by the zilla panchayat, and relevant journal articles and papers that had data on the districts and villages under consideration. For the purpose of this study, we collected primary data in a number of ways. First, in each village, the researchers conducted a transect walk to understand the distribution of resources (markets, water, sanitation, housing, school, clinics and hospitals) and the landscape of the villages. In Bijapur, this was done together with the anganwadi workers (AWW) of the village. In Sabarkantha, the transect walk was conducted with SEWA researchers, a village resident and a social worker from the village. The transect walk was followed by preliminary interviews with the gram panchayat members of the village to gain preliminary background information on the nature of agricultural practices, food habits, and nutritional and health status of the village. In addition to the transect walk, the researchers also conducted semi-structured stakeholder interviews covering individuals and organisations that constitute a part of the larger nutrition ecosystem in the two districts. The stakeholders included district government officials, Accredited Social Health Activists (ASHA) and anganwadi workers, and NGOs. Interviews were primarily held in English in Karnataka and Gujarat, with the occasional aid of a translator. Information from these stakeholder interviews were coded thematically and analysed for similarities and differences between stakeholder opinions across the identified themes. 8 While in this paper we treat women’s empowerment as a separate factor, while undertaking fieldwork we followed the toolkit’s approach including gender-related questions within each of the other factors. 9 The choice of methodology is based in part on the guidance from the toolkit by KIT on a gendered lens on nutrition. For further detail on the methodology, please see Appendix.!!
11
Second, the researchers conducted structured, qualitative questionnaire-based in-depth interviews with 50 women in each district. The questionnaire was an adaptation of the KIT toolkit, included open-ended questions, and took approximately one hour per household. The questionnaire was developed in English and then translated into Kannada and Gujarati. Before conducting interviews, the research team trained the interviewers with the help of the local partner organisations — Bijapur Integrated Rural Development Society (BIRDS) in Bijapur, and Self-Employed Women’s Association (SEWA) in Gujarat. Vernacular speakers verified the translation of the questionnaires into Kannada and Gujarati, comparing them to the English version to ensure accuracy. Local partners in both states helped gain access to and interview women in the four villages. In Bijapur, collaborator BIRDS engaged local healthcare workers (ASHA and AWW) to conduct the household interviews. In Sabarkantha, SEWA researchers conducted the interviews; these researchers had undertaken prior work in the district and were familiar with the area. The interviews were held in the local language and answers were recorded on the answer sheet by hand. These were then entered into Excel sheets and shared with the Okapi team for analysis and reporting. For details on household selection, please refer to the Appendix. Third, to fill up research gaps, and to glean more information on patterns and trends in the household questionnaire, the researchers conducted two focus group discussions (FGDs) with women in each of the villages in Karnataka and one focus group in each village with women in Sabarkantha. These FGDs allowed us to elicit additional information on food habits in the household, and roles and decision-making powers within the home. Each focus group had approximately eight to ten participants and lasted for 90 minutes. While the researchers conducted these discussions in the local vernacular in Sabarkantha, BIRDS and translators facilitated similar discussions in Bijapur. Finally, two-hour consultative workshops with representatives from local government, civil society, village level panchayats and the local partner organisations were held towards the end of the project. The workshops had 15-20 participants and sought to gain comments on preliminary district-level results that were presented, and to validate the findings from this study.
3.2 State, district and village selection10 We selected states, districts and villages in order to show some variety in geographical regions as well as prosperity, while ensuring that data from the two districts could be compared meaningfully. We used secondary data together with preliminary interviews to shortlist districts and villages.11 Karnataka in the south and Gujarat in west India allows us to cover two geographic areas, and both states have enacted state policies relevant for nutrition, while tackling problems with malnutrition among the population. Additionally, we drew on a policy landscaping paper by LANSA,12 which suggested that Gujarat and Andhra Pradesh had strong institutional environment for agriculture and nutrition compared to other states. Given that Andhra Pradesh has gone through political and border changes, Karnataka with a similar strong policy framework seemed a better choice. 10 For more information and further data on the districts, please see Appendix. 11 See Section 4 for data on districts and villages.!12The following paper: Country Policy Landscape Analysis: a brief review of the agriculture/nutrition policy landscape in India (April, 2014)
12
We chose districts after preliminary interviews with stakeholders at the state level. Sabarkantha in Gujarat has a large range of incomes within the district, and while being located close to the state capital, some villages have good and some others poor access to roads and facilities. Bijapur district is on the border between Karnataka and Maharashtra and has access and good connectivity to larger cities for markets (though at a greater distance than Sabarkantha). However, within the district, there are marked differences between better-off villages and poorer villages. Both districts have problems with malnutrition. It should be noted that unlike Sabarkantha, Bijapur has been severely affected by drought, which has resulted in reduced to no cultivation of land. There has been widespread migration out of Bijapur district, for at least part of the year. Two villages were selected in both districts. Inchegeri and Kanakanala were chosen in the Bijapur district, with Inchegeri having good road connectivity and Kanakanala having no road connectivity. In Sabarkantha, Sonasan (with good road connectivity) and Ranchodpur (with poor road connectivity) were selected for the household survey.13 Road connectivity has been identified as the major differentiator between the two villages in a district. This is because access to roads often enables access to more resources, that is, access to markets, food, and healthcare services. For instance, as a part of the National Rural Health Mission (NRHM), Village Health and Nutrition Days (VHND) was launched as a village-level platform that brings together health, nutrition, and sanitation services at the primary level (Saxena et al. 2015). However, difficult terrains and poor road connectivity repeatedly hamper VHND (ibid.). On the other hand, greater access to roads in Odisha has facilitated healthcare demand-generation and access to care (Kohli et al. 2017).
4. Setting the Context – District and Village-level Data
4.1 Bijapur, Karnataka
4.1.1 District-level statistics
4.1.1.1 Socioeconomic indicators
Bijapur district, located in northern Karnataka has a total land area of 10,498 km2, consisting of 692 villages and 7 statutory towns. It has a total population of 2.17 million (Census 2011). A large percentage of the population (~76.95 per cent) lives in rural areas. In Bijapur, the participation rate of male workers is the lowest in the state at 55.2 per cent. Most of the main and marginal workers are either cultivators or agricultural labour. The per capita income is INR 28,823 (2008-09).14 The Gross District Domestic Product (GDDP) at constant prices (2004-05) was INR 4,666 crore.15 For the year 2008-09 at current prices, the primary, secondary and tertiary sectors contributed
13While selecting the villages, the distance from the main market and state highways were considered, as well as facilities within the villages.!!14 UR Subramanya. (n.d.). District Domestic Product of Karnataka. Government of Karnataka. Retrieved from: http://des.kar.nic.in/sites/Conference%20Files/3%20Consolidated%20-%20All%20Articles%20-%20GDDP.pdf 15 UR Subramanya. (n.d.). District Domestic Product of Karnataka. Government of Karnataka. Retrieved from: http://des.kar.nic.in/sites/Conference%20Files/3%20Consolidated%20-%20All%20Articles%20-%20GDDP.pdf

13
33.29 per cent, 21.28 per cent and 45.43 per cent, respectively, to Bijapur’s GDDP.16 Similar to other growing districts, Bijapur’s tertiary sector’s contribution to the GDDP has been increasing over the years.
4.1.1.2 Agriculture-related indicators
The major crops grown in Bijapur district are jowar, bajra, maize, wheat, pulses, oil seeds and vegetables.17 The total crop area is 844,202 hectares. Both food and cash crops are grown in this region. Table 2: Area under principal crops (in hectares), 2013-14
Crop Area Crop Area
Paddy 52 Ragi 0
Jowar 165,998 Wheat 57,511
Bajra 69,992 Other cereals & minor millets 0
Maize 81,785 Total cereals and minor millets 375,338 Source: Vijayapura District at a glance, 2013-14. Office of the District Statistical Officer, Zilla Panchayat, Vijayapur. Retrieved from: http://www.bijapur.nic.in/PDF/Bijapur_dist_stat13_14.pdf Table 3: Area under commercial crops (in hectares), 2013-14
Cotton 10,419
Sugarcane 71,989
Tobacco 0
Source: Vijayapura District at a glance, 2013-14. Office of the District Statistical Officer, Zilla Panchayat, Vijayapur. Retrieved from: http://www.bijapur.nic.in/PDF/Bijapur_dist_stat13_14.pdf Table 4 provides a breakdown of Bijapur’s geographical area and the different uses for land. Table 4: Classification of total geographical area of the district (2011-12) (Total geographical area is 1,053,471 hectares)
Classification of area Area (in hectares) Area (in percentage)
Forest 1977 0.19
Land put to non-agricultural uses 36068 3.42
16 UR Subramanya. (n.d.). District Domestic Product of Karnataka. Government of Karnataka. Retrieved from: http://des.kar.nic.in/sites/Conference%20Files/3%20Consolidated%20-%20All%20Articles%20-%20GDDP.pdf 17 Groundwater information booklet, Central Ground Water Board, Ministry of Water Resources, Government of India. (July 2008). Retrieved from: http://cgwb.gov.in/District_Profile/karnataka/Bijapur-brochure.pdf!!!

14
Barren and uncultivable land 29059 2.76
Cultivable wasteland 5502 0.52
Permanent pastures and other grazing land 9,575 0.91
Miscellaneous trees, crops & groves 1,316 0.12
Current fallow land 215,485 20.45
Other fallow land 5,685 0.54
Net area sown 748,804 71.08
Source: Annual Season and Crop Report, 2011-12, Directorate of Economics and Statistics, Bangalore. Retrieved from: http://raitamitra.kar.nic.in/stat/3.htm Bijapur has black, red and mixed soils. Only 12 per cent of the geographical area in the district is irrigated. The main source of irrigation varies between different talukas. For instance, in the Indi taluka, dug wells (where the villages for this study are located), canals and borewells are the main sources of irrigation, while in the Bijapur taluka, dug wells and borewells are used. Table 5: Net area irrigated under different sources (in hectares), 2013-14
Source of irrigation Gross irrigated area Net irrigated area
Tube wells 110,775 93,018
Lift 1638 1638
Others 16,922 13,475
Total 356,707 306,826
Source: Vijayapura District at a glance, 2013-14. Office of the District Statistical Officer, Zilla Panchayat, Vijayapur. Retrieved from: http://www.bijapur.nic.in/PDF/Bijapur_dist_stat13_14.pdf
4.1.1.3 Climatic conditions
Bijapur has a semi-arid climate, and is a drought-prone area that also experiences unseasonal rainfall. Bijapur was one of the 12 districts that experienced a state-declared drought during the rabi season for two consecutive years.18 This has been primarily due to insufficient rainfall with the northwest monsoon. Drought was declared even during the kharif season due to insufficient rainfall with the southwest monsoon. A study conducted in 2011 revealed that Bijapur has the highest climatic variability index in the state (0.9294).19 This means that there are high variations in the mean and
18 PTI. (25 March 2016). Karnataka drought: Central team to submit report next week. The Economic Times. Retrieved from: http://articles.economictimes.indiatimes.com/2016-03-25/news/71808482_1_karnataka-drought-north-karnataka-kharif-season 19 Bangalore Climate Change Initiative – Karnataka. (May 2011). Karnataka Climate Change Action Plan. Retrieved from: http://www.lse.ac.uk/asiaResearchCentre/_files/KarnatakaCCactionPlanFinal.pdf

15
other statistics of temperature and rainfall across temporal and spatial scales, occurring due to changes in the climate system or other external forces. Interestingly, the 2016 drought in Maharashtra has affected neighbouring districts in Karnataka since a majority of the rivers (Krishna, Bheema, Manjara and Amaraja) flowing through these regions originates in Maharashtra.20 Bijapur is one of these districts affected by this latest drought. Annually, 5-10 per cent of the population migrates out from Bijapur, but so far in 2016, migration has been an additional 2-3 per cent.21 The district has seen widespread migration out of the district and the state, mostly by adult men, due to poverty, drought and crop failure.22 They migrate to Goa during the busy tourist season or to Bengaluru and Mysuru for construction work. Some have migrated to neighbouring Maharashtra in search of jobs, although the nature of jobs taken up is largely unknown.
4.1.1.4 Physical infrastructure
Bijapur is well connected to roads and railways. The nearest airport is at Belgaum, which is around 200 km from Bijapur city. The nearest ports are Karwar (Karnataka) and Goa. Power generation for Bijapur is provided by Almatti dam, and sometimes is further augmented by other sources like the NTPC Limited’s23 coal-based thermal power plant.24 Bijapur’s sewage network covers about 40 per cent of the Bijapur City Corporation (CMC) area and only half of the total road length. For areas outside the network, individual septic tanks and dry latrines serve as human waste disposal systems.25 While this is the case for Bijapur city, little information is available on the sewage network for the rest of the district.
4.1.1.5 Infrastructure for food-agriculture-nutrition
There are 811 ration shops in Bijapur district, with 87 per cent located in rural areas.26 Storage and warehousing in godowns is particularly important in drought-affected districts where the godowns can help in continuous food supply during times of fluctuation in production. The Karnataka Food and Civil Supplies Corporation Ltd (KFCSC) owns one godown, the Taluka Agricultural Produce Cooperative Marketing Society Ltd (TAPCMS) owns one, two are government godowns, and one is privately owned.27
20 Kulkarni, V. (27 April 2016). Drought – The distress in rural Karnataka. The Hindu Businessline. Retrieved from: http://www.thehindubusinessline.com/specials/drought-the-distress-in-rural-karnataka/article8528948.ece 21 Kulkarni, V. (27 April 2016). Drought – The distress in rural Karnataka. The Hindu Businessline. Retrieved from: http://www.thehindubusinessline.com/specials/drought-the-distress-in-rural-karnataka/article8528948.ece 22 National Dalit Watch of National Campaign on Dalit Human Rights, and Society for Promotion of Wasteland Development. (December 2013). Impact of Climate Change on Life and Livelihood of Dalits. Retrieved from: http://www.ncdhr.org.in/daaa-1/daaa-publication/NCDHR%20Climate%20Change%20(1).pdf 23 Formerly known as National Thermal Power Corporation Limited. 24 Invest Karnataka 2016 website. Retrieved from: http://www.investkarnataka.co.in/district-profiles-bijapur!!!25 Karnataka Urban Infrastructure Development Finance Corporation. (October 2009). India: North Karnataka Urban Sector Investment Program (Tranche 2) – Bijapur CMC. Retrieved from: http://www.adb.org/sites/default/files/project-document/64039/38254-04-ind-iee-06.pdf 26 Vijayapura District at a glance, 2013-14. Office of the District Statistical Officer, Zilla Panchayat, Vijayapur. Retrieved from: http://www.bijapur.nic.in/PDF/Bijapur_dist_stat13_14.pdf!!27 L Venkatachalam. (June 2003). Infrastructure and Agricultural Development in Karnataka State. Retrieved from: http://www.isec.ac.in/AGRL%20DEVELOPMENT.pdf

16
In terms of public health care facilities, there are 60 primary health care centres (PHCs), 299 secondary care centres (SCs), eight community health care centres (CHCs), four first referral unit sub-divisional hospitals (FRU-SDH) — that are all non-functioning — and a single district hospital.28 The average population served by these centres is higher than the suggested norms, indicating that the district is underserved. For instance, while the PHC is meant to serve a population of 20,000 to 30,000, it currently serves almost two and a half times the number (around 52,000 per PHC).29 The in-depth household interviews for this study were conducted in Inchegiri and Kanakanala, both of which are located in the Indi taluka of Bijapur district. The Indi taluka is in the northernmost part of Karnataka, sharing a border with Maharashtra.
4.1.2 Context of the villages — Inchegeri and Kanakanala30
Inchegeri has 604 households and a total population of 3,495, of which 1,854 are male (Census 2001). There are 907 people belonging to the SC population. The village has access to communication facilities and bus services. It has access to power supply facilities, where electricity is available for domestic use, agricultural use and other purposes. There is a total irrigated area of 80.94 hectares, all with tube wells, and 2,171.37 hectares of unirrigated land. Central Inchegeri has a marketplace with petty shops, a primary school and a bus stand. Houses are situated around this central area. Most houses are larger than those in an urban slum settlement, at approximately 300-400 ft2 in size. There is an open sewage system running alongside these houses. Usually, rainfall keeps the sewage moving, but lack of rainfall over the last year has made the region particularly dry, resulting in stagnant sewage and creating a breeding ground for mosquitoes. There are two anganwadi centres in the village, which provide basic healthcare and pre-school activities to combat child hunger and malnutrition. These centres are small cramped spaces (300-400 ft2) with ~30 children each (between one and six years of age). Kanakanala is situated approximately five km from Inchegeri, and in comparison, is quite desolate. Kanakanala has 160 households with a total population of 818, of which 416 are male (Census 2001). There are 210 people who belong to the SC population. They have no access to communication facilities or bus services. However, similar to Inchegeri, they do have access to power supply facilities for all uses. A total area of 40.47 hectares is irrigated using tube wells, while 517.35 hectares remain unirrigated.
28 Bhat, T.N., and James, K.S. (2014) NRHM-PIP monitoring for Bijapur district, Karnataka. Population Research Centre, Institute for Social and Economic Change. [Online] [Accessed 2 May 2016] 29 Bhat, T.N., and James, K.S. (2014) NRHM-PIP monitoring for Bijapur district, Karnataka. Population Research Centre, Institute for Social and Economic Change. [Online] [Accessed 2 May 2016] 30 This section is based on the transect walk, which was conducted by researchers at Okapi along with surveyors from the village, to understand the location and distribution of resources, features, landscape and main land uses of the two villages.!!!

17
4.2 Sabarkantha, Gujarat 4.2.1 District level statistics
4.2.1.1 Socioeconomic indicators
Sabarkantha has a total population of 2.42 million, where ~1.24 million are male (Census 2011). It has a total area of 7,394 km2. The district’s literacy rate is slightly higher than the average for Gujarat state at 75.79 per cent, with an even higher male literacy rate (86.44 per cent), but a comparatively lower female literacy rate (64.69 per cent). Almost 85.02 per cent of the district population lives in rural areas. Six hundred and thirty-eight people belong to the SC category and 65 people to the ST category.
4.2.1.2 Agriculture-related indicators
The net sown area is 445,000 hectares. The major field crops that are grown include maize, cotton, wheat, groundnut, pulses (tur, urad, greengram) and castor. Horticultural fruits and vegetables that are produced include mango, ber, sapota, citrus, aonla, cucurbits, okra, brinjal, tomato, clusterbean and cow peas.
Table 6: Land use pattern (in ‘000 hectares) Land use Area
Geographical area 730
Cultivable area 445
Forest area 126
Land under non-agricultural use 42
Permanent pastures 33
Cultivable wasteland 15
Barren and uncultivable land 35
Current fallows 34
Source: Agriculture Contingency Plan for Sabarkantha District. Retrieved from: http://www.nicra-icar.in/nicrarevised/images/statewiseplans/Gujarat%20(Pdf)/SKDAU,Banasakantha/GUJ%2010-Sabarkantha%2030.04.2011.pdf
Table 7: Irrigation, by source Net irrigated area 163,000 hectares
Rain-fed area 282,000 hectares
Sources of irrigation
Canals 13%
Tanks 0.3%
Open wells 51.2%
Borewells 25.3%
Micro irrigation 10.2% Source: Agriculture Contingency Plan for Sabarkantha District. Retrieved from: http://www.nicra-icar.in/nicrarevised/images/statewiseplans/Gujarat%20(Pdf)/SKDAU,Banasakantha/GUJ%2010-Sabarkantha%2030.04.2011.pdf
18
4.2.1.3 Climatic conditions
In 2014, the average annual rainfall in Sabarkantha was 921 mm. The district is prone to occasional drought and heat waves, but otherwise remains unaffected by floods, cyclones, heat storms, cold waves, frost, seawater intrusion, and pest or disease outbreaks.31
4.2.1.4 Physical infrastructure
In terms of connectivity, Sabarkantha is connected to the rest of the state via National Highway 8.32 There are 24 railway stations in the district that connect it to the rest of the country. The nearest airport is in Ahmedabad, which is 74 km from district headquarters at Himmatnagar.
4.2.1.5 Infrastructure for food-agriculture-nutrition
In 2014, there were seven Agricultural Produce Market Committees (APMCs), seven main yards and seven sub-market yards.33 Sabarkantha is a hub for potato farming and has seen the development of cold storage for potatoes.34 As of 2013-14, the rural areas of Sabarkantha were served by 15 CHCs and 38 PHCs.35 The district has a government ayurvedic hospital and a civil hospital.
4.2.2 Context of the villages — Sonasan and Ranchodpura 36
Of the two villages chosen for this study from Sabarkantha district, Sonasan is the larger one, both in terms of geographic area and population. Sonasan has 964 households and a total population of 4,844 (2,546 are male and 2,298 female). It is about 3 km from National Highway 8, and communication, bus and railways services are easily accessible. Power supply facilities are also available for all purposes. A paved road leads to the entrance of the village with a prominent “Welcome to Sonasan Village” sign. The road that leads from the entrance to the village proper is unpaved with fields on both sides, where mostly vegetables are grown. In total, the village has 950 hectares of irrigated land with tube wells (with electricity), and only 100 hectares of unirrigated land. The most important commodities produced are paddy, groundnut and bajri. Sonasan has a number of local amenities: a sub-post office, a cooperative bank, a library run by the senior citizens’ association, a senior citizens’ “peace” room, a PHC, an ayurvedic clinic that offers free consultations and medication, seven anganwadi centres, a branch of the UCO Bank, a centrally-located temple, a panchayat office, a tailor shop, a barber shop, a beauty parlour and garments shop,
31 Agriculture Contingency Plan for Sabarkantha District. Retrieved from: http://www.nicra-icar.in/nicrarevised/images/statewiseplans/Gujarat%20(Pdf)/SKDAU,Banasakantha/GUJ%2010-Sabarkantha%2030.04.2011.pdf 32 Sabarkantha District Profile. Retrived from: http://www.slideshare.net/ourvibrantgujarat/sabarkantha-district-profile 33!Gujarat Socio-economic review 2014-15 34 BS Reporter. (21 November 2014). Gujarat to focus on cold storages for fruits. Business Standard. [Online]. Retrieved from: http://www.business-standard.com/article/politics/gujarat-to-focus-on-cold-storages-for-fruits-114112100756_1.html!!35!Gujarat Socio-economic review 2014-15!!36 This section is based on the transect walk, which was conducted by researchers at Okapi along with surveyors from the village, to understand the location and distribution of resources, features, lanscape and main land uses of the two villages.!!!

19
a primary school and a high school. Most houses are well constructed with a water connection and toilets, which are often located behind the house. The village has many lanes with people residing in them according to their respective castes. These lanes are called ‘vaas’ and take the name of the caste of the people living there. For example, Patel Vaas is where the Patel caste lives. The dominant caste seems to be the Patels. The Patels own houses that are well maintained, which are larger than the others are, with vehicles parked outside. The Panchal Vaas and Darbars Vaas seemed to be less affluent since the houses on those lanes are smaller, and made of cement and exposed bricks that remain unpainted. Most households have buffaloes, and cows are less common. There are trails of water outside most houses; people have a habit of throwing used water outside their homes. In comparison, Ranchodpura is a smaller village with only 40 households. These households earn less income than Sonasan households do. The village is predominantly inhabited by Darbars, or scheduled castes, who are mostly landless or smallholding farmers. It has poor access to roads and markets. It does not have an approach road; one has to take the Sonasan village road to reach Ranchodpur. It is 10 km from the highway and approximately 3 km from Sonasan. Villagers need to go to Sonasan for almost everything. In terms of amenities, the village has a primary school, an anganwadi centre, and a small shop that sells candies, matchboxes and buttermilk packets. The primary school is located near the entrance to the village, and overlooks the houses. The houses in Ranchodpura look basic: none are painted, the walls are plastered with concrete and roofs made of asbestos sheets. Every household has 1-2 buffaloes tied to a shed outside their homes. The areas outside the houses are not paved. Water accumulation on the roads from drainage has resulted in filth. Every house has a toilet at its entrance. The toilets look newly constructed and have a small water tank on top.
5. Households’ Approach to Nutrition: Results37 This section details results from the questionnaire-based household interviews with women as well as focus group sessions. The section starts with a description of the socio-economic background of the sample households and then discusses how they understand nutrition, before considering the ways in which the households view nutrition and the factors affecting it, that is, food production, access and availability; care in the home; health, water, sanitation and hygiene; and women’s empowerment.
Background characteristics of sample households
For the in-depth interview, female respondents who were available in the household at the time of the survey were interviewed. Of the total female sample respondents in Bijapur, only one was a family head. The one household with a female head was an anomaly, and not the norm in the village. The female respondent’s husband had passed away, so she was the primary breadwinner for her household, supporting her sons who were studying. The remaining female respondents were related
37 The data in this section is primarily based on the structured questionnaire-based household interviews, with some additional input from focus groups.

20
to the male head of the household in some capacity — in most cases as a wife, and in some as a daughter-in-law, or daughter, or sister. The average age of these female respondents was around 40 years, with minimum age being 22 years, and maximum being 70 years. In Sabarkantha, female respondents did not provide details on their relation to the head of the household. Compared to Bijapur households, the average age of the Sabarkantha respondents was higher at 43 years, with minimum age being 17 years, and maximum age being 70 years. In terms of highest education qualification attained, 40 per cent of these respondents were illiterate, 26 per cent had completed varying levels of primary education, 18 per cent had completed secondary education, and the remaining few had completed higher secondary. Only one female respondent had a college degree. In comparison, the literacy rates were marginally higher in Sabarkantha, where only 30 per cent of the sample respondents were illiterate, 26 per cent had completed varying levels of primary education, 30 per cent had completed secondary education, and 8 per cent higher secondary education. Two female respondents held college degrees — one had an undergraduate degree and the other a master’s degree. In terms of the occupations of the sample households in Bijapur and Sabarkantha, the difference between the two districts is stark. In Bijapur, most women (~58 per cent) were engaged in housework, while the remaining were anganwadi workers, ASHA workers, school cooks, coolie workers or tailors. However, in the Sabarkantha households, none of the respondents called themselves “housewives” or “homemakers”. In fact, no one referred to any housework. A total of 92 per cent of the female respondents in Sabarkantha were engaged in agriculture or animal husbandry and related activities. There is social homogeneity in terms of the religious groups in Inchegeri and Kanakanala. Except for one household in Inchegeri, all sampled households were Hindu. Most households (~64 per cent) fell under the Other Backward Castes (OBC) category, followed by Scheduled Castes (SC) (~24 per cent). In Kanakanala, all sample households were Hindu. However, there were variations in caste: 40 per cent of the households fell under the OBC category, followed by SC (~27 per cent) and the remaining belonged to the others/general category. Similar to the villages in Bijapur, all 50 sampled households in Sonasan and Ranchodpura were Hindu. In Sabarkantha, 40 per cent of the households were OBC, 22 per cent of the respondents did not know their caste, 12 per cent belonged to the general category and 10 per cent were SC. In terms of home ownership, 33 households in Inchegeri owned the houses they currently live in. Two household members did not respond. In Kanakanala, the situation is different: all the surveyed household members owned their houses. Similarly, in the Sabarkantha villages, 96 per cent of the sampled households owned their homes, while the remaining few lived in rented homes. Questions around possession of entitlements were also posed to know if the households were accessing the benefits they were entitled to. Approximately 72 per cent of households surveyed in both villages in Bijapur have a ration card, and in most cases, this was a BPL ration card, a BPL Green ration card or a Green ration card. Most households with ration cards availed of rations from designated ration shops. Typically, they purchased wheat and kerosene at subsidised rates. In

21
Sabarkantha, 94 per cent of the sampled households possessed a ration card. Of these, only 32 per cent held BPL cards, while the remaining held APL cards. Of the 35 households surveyed in Inchegeri, 33 possessed an Aadhaar card, while one did not have it and the other did not respond to this question. All surveyed households in Kanakanala had Aadhaar cards. A total of 88 per cent of the sample households in Sabarkantha also had Aadhaar cards. The rapid proliferation of Aadhaar cards in these villages is a welcome trend. With the linking of public subsidy schemes — most of which are direct benefits transfer (DBT) schemes — to the Aadhaar cards, the subsidised amount is directly transferred to a beneficiary’s bank account, thereby ensuring that beneficiaries get what they are entitled to. It is not uncommon for household members in rural areas to be employed under government employment programmes. One of the more popular programmes is the Mahatma Gandhi National Rural Employment Guarantee Act (MGNREGA), which provides “100 days of guaranteed wage employment in a year to every household whose adult members volunteer to do unskilled manual work.” (NREGA Act, 2005) An estimated 82 per cent of the sampled households in both villages had members who were currently employed under MGNREGA. In direct contrast, only three households in Sabarkantha stated that they had members who were employed under MGNREGA. However, no additional details were collected on what kind of work they did under the employment guarantee scheme or the remuneration they receive for their work. In terms of migration from the village to neighbouring villages and towns, only two households in Bijapur had a member who had migrated out of their village: one had migrated out for a 15-day tractor-related work, and another had migrated for 20 days to work in a company. However, the nature of employment and frequency of migration is unknown.
Knowledge, attitude and practice towards food and nutrition
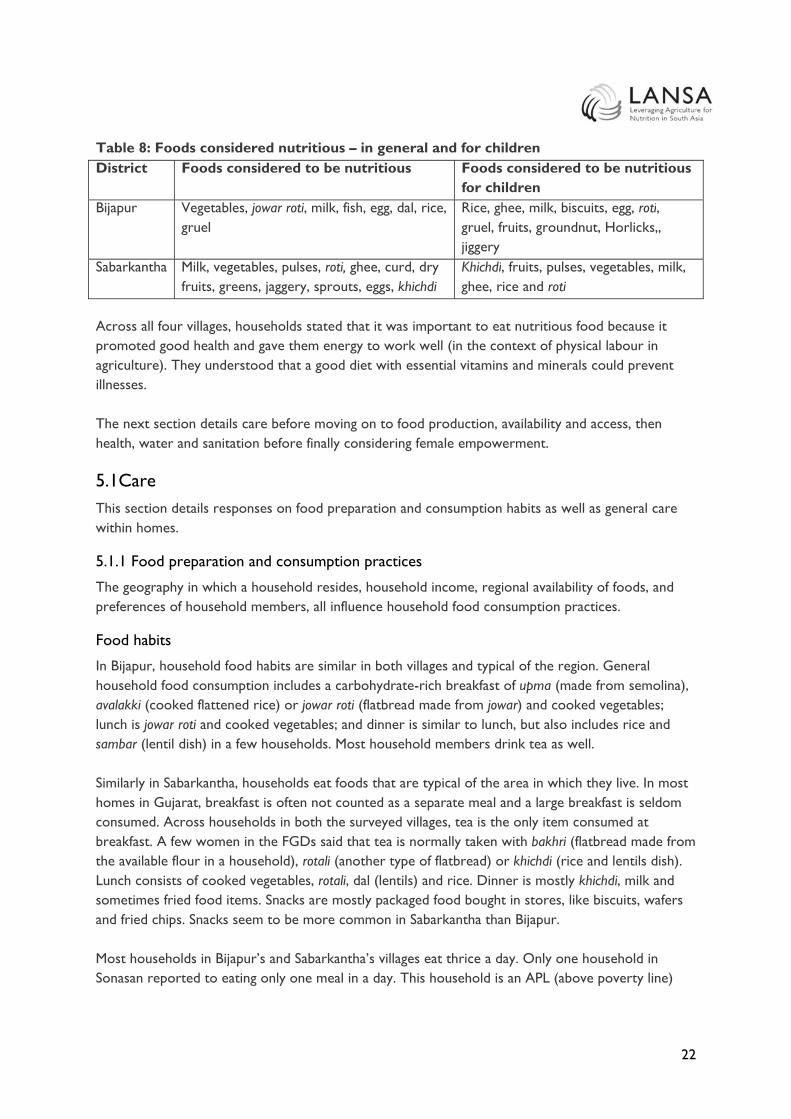
Regional preferences were reflected in what respondents considered nutritious and healthy food. In all four villages, foods that were considered universally nutritious were pulses and vegetables, but common preferences diverged. Households in Bijapur believed that jowar roti, milk, fish, eggs, dal, rice, gruel, groundnuts and jaggery are nutritious foods. Of these, jowar roti, groundnuts and jaggery are locally grown by most households. However, in Sabarkantha, households believed that milk, dry fruits, jaggery, khichdi (a rice and dal dish), rotala and green vegetables were nutritious and are commonly cultivated in these villages. In terms of healthy food for young children, again, milk, vegetables, fruit and pulses were mentioned in both districts. Other foods in Bijapur included eggs, rice, chappati, groundnuts, jaggery and gruel. Households in Sabarkantha stated that fruits, vegetables, pulses and ghee are the most nutritious for their children.
22
Table 8: Foods considered nutritious – in general and for children District Foods considered to be nutritious Foods considered to be nutritious
for children Bijapur Vegetables, jowar roti, milk, fish, egg, dal, rice,
gruel Rice, ghee, milk, biscuits, egg, roti, gruel, fruits, groundnut, Horlicks,, jiggery
Sabarkantha Milk, vegetables, pulses, roti, ghee, curd, dry fruits, greens, jaggery, sprouts, eggs, khichdi
Khichdi, fruits, pulses, vegetables, milk, ghee, rice and roti
Across all four villages, households stated that it was important to eat nutritious food because it promoted good health and gave them energy to work well (in the context of physical labour in agriculture). They understood that a good diet with essential vitamins and minerals could prevent illnesses. The next section details care before moving on to food production, availability and access, then health, water and sanitation before finally considering female empowerment.
5.1Care This section details responses on food preparation and consumption habits as well as general care within homes.
5.1.1 Food preparation and consumption practices
The geography in which a household resides, household income, regional availability of foods, and preferences of household members, all influence household food consumption practices.
Food habits
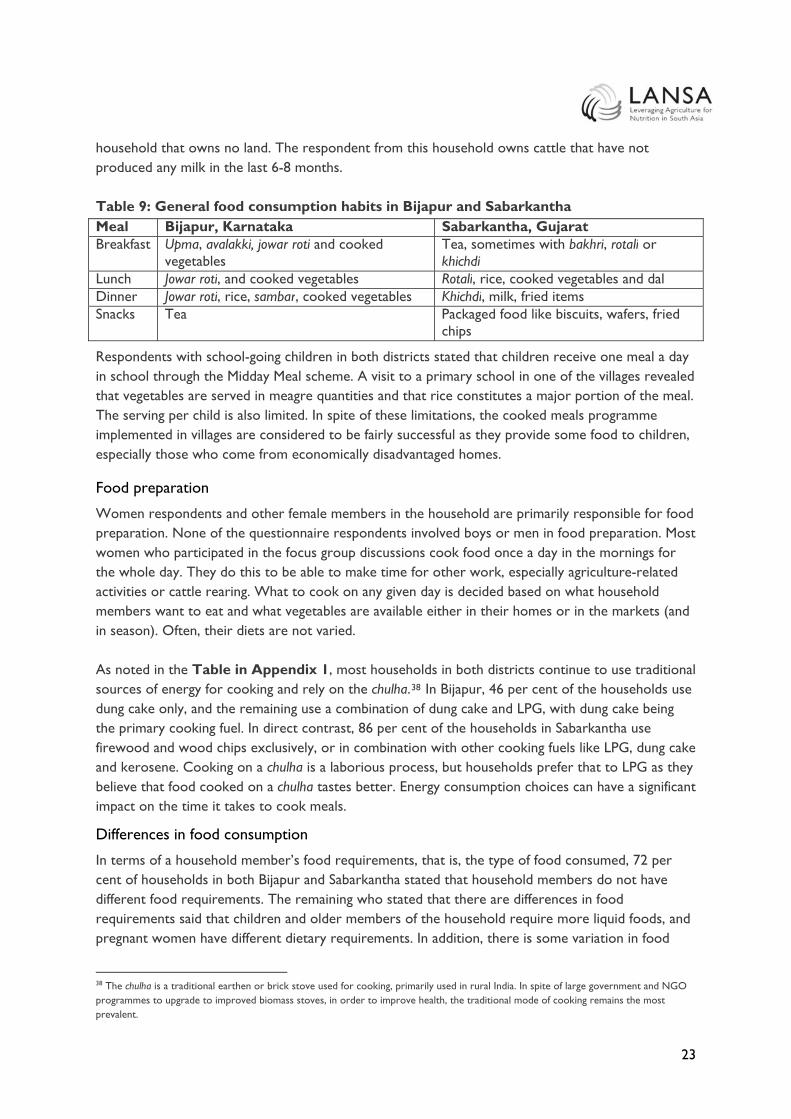
In Bijapur, household food habits are similar in both villages and typical of the region. General household food consumption includes a carbohydrate-rich breakfast of upma (made from semolina), avalakki (cooked flattened rice) or jowar roti (flatbread made from jowar) and cooked vegetables; lunch is jowar roti and cooked vegetables; and dinner is similar to lunch, but also includes rice and sambar (lentil dish) in a few households. Most household members drink tea as well. Similarly in Sabarkantha, households eat foods that are typical of the area in which they live. In most homes in Gujarat, breakfast is often not counted as a separate meal and a large breakfast is seldom consumed. Across households in both the surveyed villages, tea is the only item consumed at breakfast. A few women in the FGDs said that tea is normally taken with bakhri (flatbread made from the available flour in a household), rotali (another type of flatbread) or khichdi (rice and lentils dish). Lunch consists of cooked vegetables, rotali, dal (lentils) and rice. Dinner is mostly khichdi, milk and sometimes fried food items. Snacks are mostly packaged food bought in stores, like biscuits, wafers and fried chips. Snacks seem to be more common in Sabarkantha than Bijapur. Most households in Bijapur’s and Sabarkantha’s villages eat thrice a day. Only one household in Sonasan reported to eating only one meal in a day. This household is an APL (above poverty line)
23
household that owns no land. The respondent from this household owns cattle that have not produced any milk in the last 6-8 months. Table 9: General food consumption habits in Bijapur and Sabarkantha Meal Bijapur, Karnataka Sabarkantha, Gujarat Breakfast Upma, avalakki, jowar roti and cooked
vegetables Tea, sometimes with bakhri, rotali or khichdi
Lunch Jowar roti, and cooked vegetables Rotali, rice, cooked vegetables and dal Dinner Jowar roti, rice, sambar, cooked vegetables Khichdi, milk, fried items Snacks Tea Packaged food like biscuits, wafers, fried
chips
Respondents with school-going children in both districts stated that children receive one meal a day in school through the Midday Meal scheme. A visit to a primary school in one of the villages revealed that vegetables are served in meagre quantities and that rice constitutes a major portion of the meal. The serving per child is also limited. In spite of these limitations, the cooked meals programme implemented in villages are considered to be fairly successful as they provide some food to children, especially those who come from economically disadvantaged homes.
Food preparation
Women respondents and other female members in the household are primarily responsible for food preparation. None of the questionnaire respondents involved boys or men in food preparation. Most women who participated in the focus group discussions cook food once a day in the mornings for the whole day. They do this to be able to make time for other work, especially agriculture-related activities or cattle rearing. What to cook on any given day is decided based on what household members want to eat and what vegetables are available either in their homes or in the markets (and in season). Often, their diets are not varied. As noted in the Table in Appendix 1, most households in both districts continue to use traditional sources of energy for cooking and rely on the chulha.38 In Bijapur, 46 per cent of the households use dung cake only, and the remaining use a combination of dung cake and LPG, with dung cake being the primary cooking fuel. In direct contrast, 86 per cent of the households in Sabarkantha use firewood and wood chips exclusively, or in combination with other cooking fuels like LPG, dung cake and kerosene. Cooking on a chulha is a laborious process, but households prefer that to LPG as they believe that food cooked on a chulha tastes better. Energy consumption choices can have a significant impact on the time it takes to cook meals.
Differences in food consumption
In terms of a household member’s food requirements, that is, the type of food consumed, 72 per cent of households in both Bijapur and Sabarkantha stated that household members do not have different food requirements. The remaining who stated that there are differences in food requirements said that children and older members of the household require more liquid foods, and pregnant women have different dietary requirements. In addition, there is some variation in food
38 The chulha is a traditional earthen or brick stove used for cooking, primarily used in rural India. In spite of large government and NGO programmes to upgrade to improved biomass stoves, in order to improve health, the traditional mode of cooking remains the most prevalent.

24
consumption based on the seasons. For instance, in Sabarkantha, households eat dry fruits during winter, and in Bijapur they eat more jowar roti and bananas during summer. Households in Bijapur stated that all household members eat the same food. The amount of food varies according to age, with younger household members eating more and older household members eating less. More than 75 per cent of households in Sabarkantha noted that there are no significant differences between the food consumed by women and men. Only 5 per cent of the sample households noted that children and men eat more compared to women. One household in Ranchodpura said that when there is shortage of vegetables in the house, female family members would manage the situation, presumably by eating less. Similarly, one household stated that only the male members of the household drink milk. This may be due to religious or other cultural preferences, but the households in our sample were homogenous in terms of their observable characteristics. It could also indicate that women in these households prioritise male members in terms of quantity and quality of food provided when budgets are tight. The order in which household members eat their meals often depends on the order in which they start their workday. While a third of Bijapur’s households said all members eat at the same time, in the remaining households, men eat first since they start work earlier than the rest of the household. Children eat after men, and women are often the last to eat their meals. In Sabarkantha, men and older people in the family eat first, followed by children and women. Dietary habits of lactating mothers are different from other family members. Lactating mothers in Bijapur’s villages consume milk gruel, milk, eggs and vegetables compared to other family members, while lactating mothers in Sabarkantha consume more milk, fruits and khichdi.
Changes in food habits over time
Changes in food habits over the last 10 years have been region-specific and are more limited in Bijapur than in Sabarkantha. In Inchegeri, improved livelihoods for less than 10 per cent of the households have resulted in the increased consumption of vegetables, fruits, eggs and meat. On the other hand, in Kanakanala, drought has resulted in reduced availability of foods locally in the past year as households cannot cultivate their lands and there is no local market in the village. The implication of reduced income is that some household members migrate for part of the year when they eat well, but those staying behind, including small children and the elderly, eat a poor diet.39 In Sabarkantha, around one in ten households have moved from making millet-based rotis to wheat-based rotis. This could be because wheat is distributed by the PDS and is readily available at subsidised rates. One-fourth of the households in Sabarkantha have prospered and have moved from eating rotis and green chillies primarily 40 to eating rotis, rice, dal and vegetables. But there are exceptions: the death of one respondent’s spouse left her household with limited disposable income and a decreased quantity in consumed food. Some 10 per cent of the sample households stated that
39 See section 5.2.1 for more details on migration in Bijapur. 40 A common meal for very poor people in India!

25
there has been no change in their food habits since the work they do requires them to eat the same kind of food. Lastly, one-fourth of the households stated they consume more fried food such as gota, bhajia, papad and lapsi as well as more food from outside the home, such as fast food like Maggi (instant) noodles in Sabarkantha. Asked what they would like to eat more of, households across both districts aspire to drink more milk, and eat more vegetables, fruits and dry fruits. In Bijapur, households would also like to consume more eggs, fish and pulses, while those in Sabarkantha’s villages would like to consume more jaggery and ghee. Additionally, Sabarkantha households would like to eat more sweets, fried items and processed foods. This is likely due to the introduction of fast foods such as Maggi noodles as well increased incomes (and changing lifestyles) leading to more food prepared outside the home being consumed.
5.1.2 Responsibility for the household, children and elderly
Women — mothers and mothers-in-law — are primarily responsible for feeding the household’s children. Women are also the primary caregivers in the households, taking care of children and the elderly, with men having a very limited role. Additionally, women are responsible for cleaning the house. It is unclear if activities like collecting firewood for lighting and cooking and water are jointly shared with the male members of the household. Apart from agricultural activities, a handful of women (less than 5 per cent) are also involved in other remunerative jobs like tailoring, selling stationery, and teaching in a school.
5.2 Agriculture: Food production, food availability and food access 5.2.1 Agriculture and food production
Agriculture serves both as the major source of livelihoods and income (either from owning a farm or working as farm labour) and a source of food as households grow crops for consumption, or access cheap or free sources of food on nearby farms or farms where members of the household work. A majority of households (~95 per cent) interviewed are engaged in agriculture and related activities. Farming households grow crops both for their own consumption and for the local market, and farmers grow crops that are local staple food in both districts. For instance, a typical household in Bijapur grows jowar, and hence, jowar rotis are a part of most meals in Bijapur households.

26
Table 10: Crops produced – home consumption v/s sale District Crop Home
consumption Sale in local market
Sale to other market/ factories
Bijapur Jowar Groundnut Wheat Tur dal Bajra Tomatoes, onion, garlic, chillies, brinjal
Maize Sugarcane
Sabarkantha Wheat Peanuts Castor Millet Rice Grass Okra, potato, pumpkin, capsicum
Tobacco Cotton
Both Inchegeri and Kanakanala in Bijapur grow cereals such as jowar, wheat, maize, bajra, groundnut, pulses like tur dal, vegetables like tomato. Households in Kanakanala also grow other vegetables like onions, green chillies, garlic, brinjal and lemons. Crops such as jowar and wheat are grown entirely for home consumption in 24 per cent of the households, while some other crops, like maize, are grown exclusively for sale. All households in Kanakanala reported that they did not have any agricultural production this year because of poor rains.41 Households in Sabarkantha primarily grow wheat, millet, rice, pulses, and vegetables such as okra, potato and cash crops like cotton, tobacco and peanuts. Unlike in Bijapur, a majority of Sabarkantha households (~78 per cent) keep cattle, such as cows, goats and sheep. A Sabarkantha household typically grows crops to meet household food needs, to gain an income, and for cattle feed. A major portion of the produce is set aside for sale in the markets, although households have not stated how much this typically is. In Sabarkantha, the harvested produce is sold in nearby markets in Himmantnagar, Prantij and Salal. Milk is sold to the Sonasan milk cooperative. In Bijapur, the produce from both villages are primarily sold in the Agricultural Produce Market Committee (APMC) in Chadchan, Horti Market, and a few crops in the markets at Indi taluka and Bijapur.
41 None of the households mentioned owning livestock, however during the transect walk, the researchers observed that there were goats tied to the poles outside of a few homes in Inchegeri.

27
More than half the respondents in Bijapur who are engaged in agricultural activities said that there have been changes in yield over the last decade. In Sabarkantha,42 in 48 per cent of the households this change has meant a reduction in crop yield. Due to shortage of water, a few households (~14 per cent) grow crops only during the monsoon season. Even during the monsoon season, the water available for irrigation is insufficient. These households have stopped growing crops like paddy (rice), which require large quantities of water.43 Other agriculture-related challenges include lack of storage facilities for produce (which means farmers cannot hold on to produce and wait for markets to improve), and the increased cost of production. Both Bijapur and Sabarkantha face similar difficulties, including difficulty in accessing quality seeds at low prices, low availability of water, high price of fertilisers and compost, poor quality of electricity, irrigation, and high cost of transporting inputs and produce. The higher prices have resulted in decreased purchase of inputs. Drought has severely affected Bijapur, and this is especially visible in Kanakanala village where drought has resulted in limited to no yield on the farmland and no available farm work. Instead, villagers migrate to other parts of the state or to bordering states like Maharashtra for farm work for up to half the year. Employment agents typically facilitate this migration by offering work contracts and providing an advance to the family to meet short-term financial needs, such as debt repayment. While families eat well while migrating, those members (usually the elderly and young children) that stay back in the village have fewer resources and have a poor diet often with limited vegetables, as these are not locally available. Figure 2: Drought in Bijapur, resulting in migration
Note: This figure is particularly applicable for Kanakanala, Bijapur.
Likewise, as family members return from migration, they may eat well until money runs out. When they do run out of money, they are again forced to borrow from local moneylenders, and their diet deteriorates as they are unable to grow food on their farmland. Furthermore, migration affects
42 The two households that believed that yield has in fact increased attribute the increase to the use of borewells and improved agricultural materials. 43 On the other hand, in 26% of the households where the yields have increased over the years, the increase comes from increased production of cash crops like peanuts, tobacco and cotton, all of which have boosted the incomes of these households.!

28
healthcare such as regular check-ups and immunisation, as well as schooling, as children are taken out of school to follow their parents.
5.2.2 Food availability and access
During the FGDs, women in both Inchegeri and Kanakanala stated that they buy food items they do not grow in their fields. Food items that are typically grown locally include jowar, bajra, rice and, in a few select households, vegetables. Lack of sufficient irrigation facilities means that crops are heavily reliant upon the rains. Hence, the effect of lack of rains seems to be more pronounced in Kanakanala than in Inchegeri with households in Kanakanala buying most food items from the market, while households in neighbouring villages like Inchegeri continue to eat food items grown in their fields. Kanakanala households purchase vegetables, fruits, pulses and jaggery. A few women from Kanakanala even mentioned that they buy jowar, which is a staple crop of Bijapur. On the other hand, households in Sonasan and Ranchodpura typically grow wheat, peanuts, rice and occasionally millets, with a few households even growing vegetables. Similar to Bijapur, more than three-fourths of the Sabarkantha households also purchase foods like dal, ghee, jaggery, vegetables (cabbage, tomatoes, peas, potatoes), spices and oil from markets. Food purchasing responsibilities within a household vary between the two districts, with women’s involvement in purchasing decisions being higher in Sabarkantha than in Bijapur. So, while the heads of families, including respondent’s husband and father-in-law, were responsible for buying fruits and vegetables in around 68 per cent of households in Inchegeri and Kanakanala, the respondents themselves were responsible for buying fruits and vegetables in 59 per cent of the households in Sabarkantha.
5.3 Health, water, sanitation and hygiene This section provides information on health, water, sanitation and hygiene practices across the four villages.
5.3.1 Health44
Women’s perception of how well nourished their children varied across the districts. While 88 per cent of the respondents from Bijapur noted that, on average, the community’s children are well nourished, this was not the case in Sabarkantha, where only 40 per cent of the respondents believe that their children are sufficiently nourished. This is a surprising outcome, because stakeholder interviews in Sabarkantha revealed that the district health officers have been running awareness campaigns throughout all anganwadi centres in the district about childhood nutrition practices. However, this has not translated into better-informed households in Sabarkantha. Historically, in terms of the status of health, diarrhoea, and iron and iodine deficiencies are common health issues throughout rural India. Iron and iodine deficiencies are the direct result of a household’s food consumption patterns. For example, households that consume plenty of iron-rich foods, such as leafy greens, are less likely to suffer from anaemia than those that do not.
44 To understand the status of health and how households seek healthcare, the interviews covered questions on perceptions of malnutrition, household illnesses, preferred healthcare access and out-of-pocket expenditures.
29
ASHA workers in villages act as depot holders for basic drugs like oral rehydration therapy (ORS), iron folic acid tablets (IFA), disposable delivery kits (DDK), oral pills and condoms. They provide IFA tablets in the villages. The Ministry of Health and Family Welfare, through the weekly iron and folic acid supplementation programme, distributes IFA tablets to adolescent girls and boys to reduce the incidence of anaemia. In Inchegeri, only seven households reported receiving iron supplements from ASHA/anganwadi workers. However, none of the respondents in Kanakanala received iron supplements from ASHA or anganwadi workers.45 In addition, of the 12 pregnant women in both villages, only four stated that they received iron tablets. The situation is similar in Gujarat, where only three households in Sonasan have received iron supplements from ASHA workers, and that excludes the two households with pregnant women. In Ranchodpura, only two households received IFA tablets from ASHA or anganwadi workers, although the women reported not taking the supplements. The questionnaire did not delve into reasons for not consuming the iron supplements, especially when they were readily available. Health-related out-of-pocket expenses across all villages were similar and included general care (children’s health), the treatment of illnesses (diabetes, cholera and colds) and emergency intervention (a bike accident, fractures, births, and neck and leg surgeries). Across all four villages, households have incurred significant expenses to treat various illnesses – 58 per cent in Sabarkantha, and 86 per cent in Bijapur. Healthcare expenses vary widely, and respondents reported that they are often unaffordable when somebody in the household required hospitalisation and surgery. One household, for instance, spent INR 225,000 on heart surgery. While the questionnaire did not cover questions on medical insurance, based on stakeholder interviews and focus group discussions, it is safe to say that households are unlikely to have insurance in any form. Kanakanala and Ranchodpura, the smaller villages in Karnataka and Gujarat, respectively, do not have healthcare facilities in the village, but have to go to Inchegeri and Sonasan, respectively. With no healthcare facilities in Kanakanala and only two buses that travel to the nearest village every day, households find it difficult to seek care, especially during emergencies. It is interesting to note that even in some of the larger villages; healthcare is sought outside the village, despite the availability of a primary healthcare centre in the village. For instance, in Sonasan, 23 of the 40 households sought medical care from private dispensaries, either those in Salal (10 km from Ranchodpura) or in Himmatnagar (district headquarters). One household noted that it first takes medication dispensed by the government hospital, and if that does not work, then seeks care from a private hospital. Households in Ranchodpura seek medical treatment in the same locations.46 In Inchergeri, the sample households have shared information on the type of healthcare provider they seek care from, that is, government hospital versus private dispensaries. However, they have not provided any additional information on the location of these hospitals and dispensaries, i.e., whether it is within or outside the village. Based on interviews with doctors at the primary healthcare centre, it is likely that Inchegeri and Kanakanala households seek care at these PHCs as an immediate recourse to medical emergencies, before moving to the district hospital in Bijapur city.
45 Kanakanala also lacks healthcare facilities within the village 46 Based on household in-depth interviews and notes from the focus group discussions conducted in Sonasan and Ranchodpura on 31 March 2016!
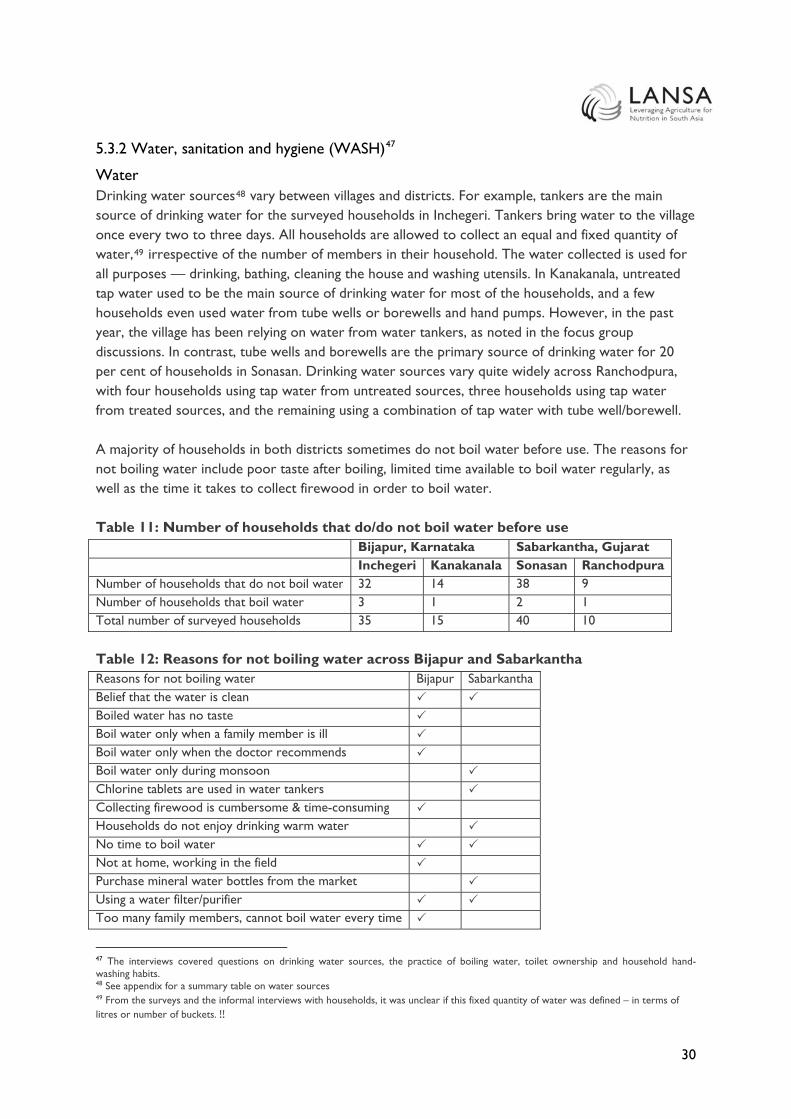
30
5.3.2 Water, sanitation and hygiene (WASH)47
Water Drinking water sources48 vary between villages and districts. For example, tankers are the main source of drinking water for the surveyed households in Inchegeri. Tankers bring water to the village once every two to three days. All households are allowed to collect an equal and fixed quantity of water,49 irrespective of the number of members in their household. The water collected is used for all purposes — drinking, bathing, cleaning the house and washing utensils. In Kanakanala, untreated tap water used to be the main source of drinking water for most of the households, and a few households even used water from tube wells or borewells and hand pumps. However, in the past year, the village has been relying on water from water tankers, as noted in the focus group discussions. In contrast, tube wells and borewells are the primary source of drinking water for 20 per cent of households in Sonasan. Drinking water sources vary quite widely across Ranchodpura, with four households using tap water from untreated sources, three households using tap water from treated sources, and the remaining using a combination of tap water with tube well/borewell. A majority of households in both districts sometimes do not boil water before use. The reasons for not boiling water include poor taste after boiling, limited time available to boil water regularly, as well as the time it takes to collect firewood in order to boil water. Table 11: Number of households that do/do not boil water before use Bijapur, Karnataka Sabarkantha, Gujarat Inchegeri Kanakanala Sonasan Ranchodpura Number of households that do not boil water 32 14 38 9 Number of households that boil water 3 1 2 1 Total number of surveyed households 35 15 40 10 Table 12: Reasons for not boiling water across Bijapur and Sabarkantha Reasons for not boiling water Bijapur Sabarkantha Belief that the water is clean Boiled water has no taste Boil water only when a family member is ill Boil water only when the doctor recommends Boil water only during monsoon Chlorine tablets are used in water tankers Collecting firewood is cumbersome & time-consuming Households do not enjoy drinking warm water No time to boil water Not at home, working in the field Purchase mineral water bottles from the market Using a water filter/purifier Too many family members, cannot boil water every time
47 The interviews covered questions on drinking water sources, the practice of boiling water, toilet ownership and household hand-washing habits. 48 See appendix for a summary table on water sources 49 From the surveys and the informal interviews with households, it was unclear if this fixed quantity of water was defined – in terms of litres or number of buckets.!!
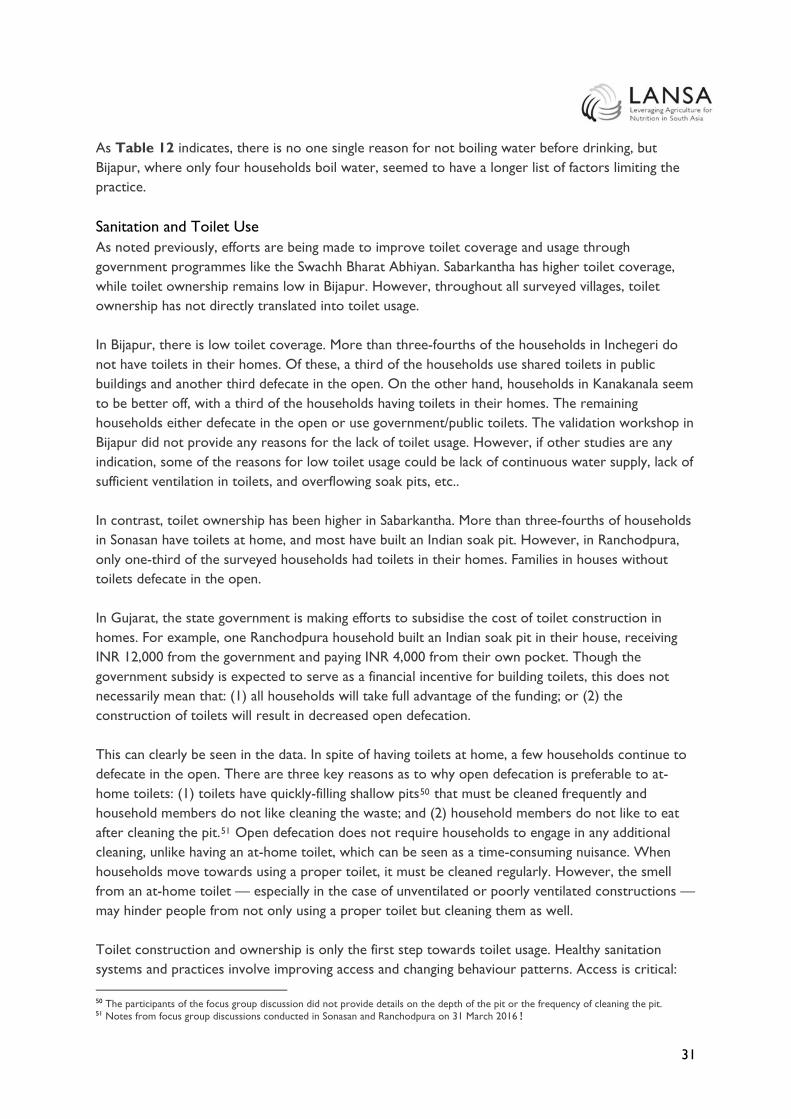
31
As Table 12 indicates, there is no one single reason for not boiling water before drinking, but Bijapur, where only four households boil water, seemed to have a longer list of factors limiting the practice. Sanitation and Toilet Use As noted previously, efforts are being made to improve toilet coverage and usage through government programmes like the Swachh Bharat Abhiyan. Sabarkantha has higher toilet coverage, while toilet ownership remains low in Bijapur. However, throughout all surveyed villages, toilet ownership has not directly translated into toilet usage. In Bijapur, there is low toilet coverage. More than three-fourths of the households in Inchegeri do not have toilets in their homes. Of these, a third of the households use shared toilets in public buildings and another third defecate in the open. On the other hand, households in Kanakanala seem to be better off, with a third of the households having toilets in their homes. The remaining households either defecate in the open or use government/public toilets. The validation workshop in Bijapur did not provide any reasons for the lack of toilet usage. However, if other studies are any indication, some of the reasons for low toilet usage could be lack of continuous water supply, lack of sufficient ventilation in toilets, and overflowing soak pits, etc.. In contrast, toilet ownership has been higher in Sabarkantha. More than three-fourths of households in Sonasan have toilets at home, and most have built an Indian soak pit. However, in Ranchodpura, only one-third of the surveyed households had toilets in their homes. Families in houses without toilets defecate in the open. In Gujarat, the state government is making efforts to subsidise the cost of toilet construction in homes. For example, one Ranchodpura household built an Indian soak pit in their house, receiving INR 12,000 from the government and paying INR 4,000 from their own pocket. Though the government subsidy is expected to serve as a financial incentive for building toilets, this does not necessarily mean that: (1) all households will take full advantage of the funding; or (2) the construction of toilets will result in decreased open defecation. This can clearly be seen in the data. In spite of having toilets at home, a few households continue to defecate in the open. There are three key reasons as to why open defecation is preferable to at-home toilets: (1) toilets have quickly-filling shallow pits50 that must be cleaned frequently and household members do not like cleaning the waste; and (2) household members do not like to eat after cleaning the pit.51 Open defecation does not require households to engage in any additional cleaning, unlike having an at-home toilet, which can be seen as a time-consuming nuisance. When households move towards using a proper toilet, it must be cleaned regularly. However, the smell from an at-home toilet — especially in the case of unventilated or poorly ventilated constructions — may hinder people from not only using a proper toilet but cleaning them as well. Toilet construction and ownership is only the first step towards toilet usage. Healthy sanitation systems and practices involve improving access and changing behaviour patterns. Access is critical: 50 The participants of the focus group discussion did not provide details on the depth of the pit or the frequency of cleaning the pit. 51 Notes from focus group discussions conducted in Sonasan and Ranchodpura on 31 March 2016!
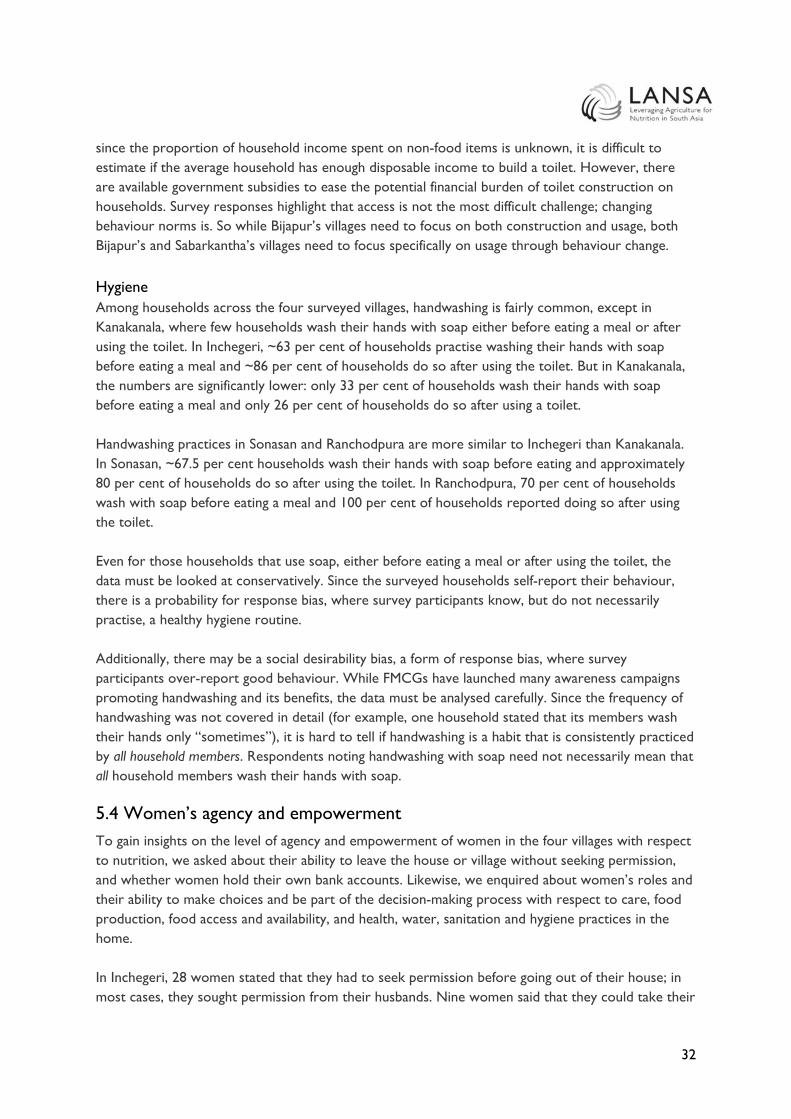
32
since the proportion of household income spent on non-food items is unknown, it is difficult to estimate if the average household has enough disposable income to build a toilet. However, there are available government subsidies to ease the potential financial burden of toilet construction on households. Survey responses highlight that access is not the most difficult challenge; changing behaviour norms is. So while Bijapur’s villages need to focus on both construction and usage, both Bijapur’s and Sabarkantha’s villages need to focus specifically on usage through behaviour change. Hygiene Among households across the four surveyed villages, handwashing is fairly common, except in Kanakanala, where few households wash their hands with soap either before eating a meal or after using the toilet. In Inchegeri, ~63 per cent of households practise washing their hands with soap before eating a meal and ~86 per cent of households do so after using the toilet. But in Kanakanala, the numbers are significantly lower: only 33 per cent of households wash their hands with soap before eating a meal and only 26 per cent of households do so after using a toilet. Handwashing practices in Sonasan and Ranchodpura are more similar to Inchegeri than Kanakanala. In Sonasan, ~67.5 per cent households wash their hands with soap before eating and approximately 80 per cent of households do so after using the toilet. In Ranchodpura, 70 per cent of households wash with soap before eating a meal and 100 per cent of households reported doing so after using the toilet. Even for those households that use soap, either before eating a meal or after using the toilet, the data must be looked at conservatively. Since the surveyed households self-report their behaviour, there is a probability for response bias, where survey participants know, but do not necessarily practise, a healthy hygiene routine. Additionally, there may be a social desirability bias, a form of response bias, where survey participants over-report good behaviour. While FMCGs have launched many awareness campaigns promoting handwashing and its benefits, the data must be analysed carefully. Since the frequency of handwashing was not covered in detail (for example, one household stated that its members wash their hands only “sometimes”), it is hard to tell if handwashing is a habit that is consistently practiced by all household members. Respondents noting handwashing with soap need not necessarily mean that all household members wash their hands with soap.
5.4 Women’s agency and empowerment To gain insights on the level of agency and empowerment of women in the four villages with respect to nutrition, we asked about their ability to leave the house or village without seeking permission, and whether women hold their own bank accounts. Likewise, we enquired about women’s roles and their ability to make choices and be part of the decision-making process with respect to care, food production, food access and availability, and health, water, sanitation and hygiene practices in the home. In Inchegeri, 28 women stated that they had to seek permission before going out of their house; in most cases, they sought permission from their husbands. Nine women said that they could take their

33
own decisions with respect to buying food, cooking, children’s education and purchasing clothes. One respondent said she could not take her own decisions and the remaining 25 households did not talk about decisions they could take on their own. In Kanakanala, nine out of 15 women said that they had to seek permission before going out; one had to seek permission from her mother-in-law and two from their husbands. Only one woman stated that she could not take decisions of her own. Two households did not respond to this question. In direct contrast, 56 per cent of the women in Sabarkantha stated that they can take decisions on their own, and can go out without seeking permission. However, of these women, half of them also added that while they did not have to seek permission to go out, they would have to inform a household member — husband or mother-in-law — of their whereabouts. In the remaining households, women cannot go out without seeking permission; neither can they take their own decisions.
5.4.1 Care
Decisions around what different household members eat vary between the two districts. In Inchegeri and Kanakanala, in a majority of households (~32 per cent), the head of the household — respondents’ husband, father-in-law, or son — makes these decisions. Only in 26 per cent of households do the respondents independently decide what the different household members eat. In a few households (~10 per cent of the sample), the respondent and the head of the household, who is her husband in most cases, jointly make the food consumption decisions. On the other hand, in Sonasan and Ranchodpura, female members of the household make food preparation and consumption. In a quarter of these households, this decision is made either jointly with the respondent’s husband or with all household members. In most cases, whoever prepares food for the day decides what household members eat.
5.4.2 Agriculture, food availability and food access
Women are engaged across all agricultural activities, but not necessarily in financial transactions. This is the case for the Bijapur and Sabarkantha villages. Almost all households (~90 per cent) that are engaged in agricultural activities in Bijapur involve the women of the household in the fields/farms. Women are involved in sowing seeds, harvesting, irrigation, weeding and selling vegetables in the market. They work in the family fields in consultation with the heads of the family, typically their husbands or fathers-in-law. None of the women is engaged in procurement activities and only a handful engage with moneylenders; both these activities are typically restricted to the male members of the household. Table 13: Role of women in agriculture Bijapur Sabarkantha Agricultural activities undertaken • Sowing seeds
• Field work • Harvesting • Dealing with moneylenders • Weeding • Selling vegetables
• Harvesting • Weeding • Irrigating the fields • Spraying pesticides • Animal husbandry • Preparation of food and tea for labourers • Preparation of organic fertilisers

34
In Sabarkantha, women are engaged in agriculture work, but men handle the sale of crops in the markets. In a little more than one-fifth of the households, women are also involved in animal husbandry including, keeping the sheds clean and feeding the cattle. In one household, the respondent stated that she not only managed the agricultural fields, but also sold the produce in the markets and managed the finances from the sale of agricultural produce on her own. Some of the other activities that women are engaged in include weeding, preparing organic fertilisers, reaping and harvesting the crop, irrigating the fields, and storing water for use in the fields. Male family members take decisions related to agricultural production. Around 10 per cent of the female respondents also said that they could take agriculture-related decisions. If these women are involved in decision-making, it is usually jointly with the male members of their households. Likewise in Bijapur, male members of the household take most of the decisions related to agriculture. This included decisions with respect to what should be sold and what should be retained for household consumption. In some rare instances, the mother-in-law is also involved in the decision-making process. Additionally, the head of the household also determines the use of income from sale of agricultural commodities. Households spend the income on agricultural inputs (e.g. fertilizers and seeds) and livestock, healthcare and medicines, children’s schooling (books, uniforms, fees), loan repayment, and festivals, including weddings. In only one household, the husband and wife take these decisions jointly. Decision-making is more collaborative in Sabarkantha, where in a majority of the households (~75 per cent), decisions are taken jointly by the respondent and other members of the households, including the husband, parents-in-law and other male members. However, decisions with respect to income from the sale of agricultural commodities are restricted to male members.
6. Discussion This section considers the results of the data collection in light of the framework and existing literature. To reiterate, the main questions were:
1. What is the role of women in the household economy in these predominantly agrarian communities?
2. What are households’ understanding of nutrition? Do women see the linkages between agriculture, food and nutrition?
3. How do factors affecting nutrition interact at the household level? Households understood nutrition primarily as healthy food that provides energy to undertake work — physical labour such as working in the fields. Malnutrition was understood as a lack of access to food and being underfed. However, there was a limited awareness of nutrition beyond malnutrition. Good food habits in both Sabarkantha and Bijapur entailed primarily eating pulses and vegetables (though there was regional variation in the kind of vegetables preferred). Nobody mentioned sanitation or hygiene practices in relation to nutrition. This is likely to be a result of questionnaire design, which did not ask a direct question on a household’s understanding of the linkages between these factors. The addition of a question such as ‘Do you think [sanitation and hygiene practice X]

35
plays a role in the nutritional status of your household?’ could have potentially helped unravel household knowledge on the linkage. In terms of care, women were the primary caregivers in both districts, undertaking the majority of food preparation, cleaning the house, and taking care of the family. Women prepared food based on what was available at home, or what the head of the household would like to eat primarily (though in some households, the preference of children and parents-in-law were taken into account). Households mentioned that their staple food has little variety over the week, with a majority eating vegetarian food. Most women reported that all family members eat more or less the same kind of food, and eat at the same time, suggesting that women have similar availability to food as men. However, in a couple of instances women noted that when there is limited availability of food, they will eat last, or may choose not to drink milk. Households bought food from local markets, and when available, also relied on their own crops. In Bijapur, it was common practice for women working as farm labour to take some vegetables home from the farm for free. Agriculture and food production was the main activity of a majority of households interviewed. While ~70 per cent of the households across both districts grew crops that they ate, there did not seem to be a preference for food crops over cash crops. At the same time, households were aware that excessive use of pesticides was a problem, but continued with the practice of heavy use. No household reported having a kitchen garden or growing separate crops for their own consumption — something that the literature has highlighted as a common practice. Unlike Sabarkantha, Bijapur has suffered drought in the past two years, resulting in severely reduced cultivation of land. Households in Kalakanala had not been able to cultivate their land this year. Likewise, finding work on farms has been increasingly difficult and families have migrated to farms in Maharashtra for seasonal work. This poses two particular challenges: children of school age are taken out of school and travel with their parents, thus disrupting their education (and there is no re-introduction programme for them when they come back), and because family members of working age all migrate, the village is left with only old people and young children, who often struggle to access good quality food and care since none is available in the village. Government schemes such as the Midday Meal and the Public Distribution System (PDS) were functioning, and accessed, in both districts. However, there were complaints that neither was sufficiently adapted for local tastes. For instance, women in FGDs mentioned that the inclusion of jowar in the PDS would be more suitable for their needs, than rice and wheat. Table 14: Nutrition factors - Overview of results Factor Data Care & food preparation
Women undertake food preparation.They decide what to cook depending on what is available at home and, in some cases, according to the preferences of heads of households. The inability to consume certain foods was due to limited household income, and inability to grow the foods themselves.

36
Most households reported eating at the same time (or when hungry) and eating similar quantitities. Only some households reported that when food is scarce, women eat last, eat less or do not drink milk. Fast food/outside food is increasingly popular in Gujarat. The primary caregivers are women across all households.
Food production, availability and access
Households access free vegetables from own land or from farms where they work, or buy in local markets. Households produce food primarily for themselves and for the local market. Kanakanala has no local vegetable sellers in the village and due to drought has not been able to grow any crops in the past year. Few households grow a kitchen garden – in Gujarat, some claimed neighbours may steal crop or animals may eat it. Households rely on midday meals in schools for feeding children. Problem with the midday meal is the lack of quality. A village in Gujarat (i.e. Sonason) had attempted to grow a kitchen garden to supply vegetables to the school.
Health, water, sanitation and hygiene
According to anganwadi workers, in all the villages there are instances of malnutrition in children (2 to 3 children in every village in the age group 0-6 years). Only households in the larger villages and only a few of them report that ASHA and anganwadi workers visit them or provide them with nutrition supplements. Households in smaller villages have to seek healthcare in neighbouring villages. Out-of-pocket expenditure on health varies greatly and depends on whether there are instances of hospitalisation and surgery in the family. Households cover these expenses themselves. Water – Predominantly, households do not treat the water they receive, especially when coming from water tankers, which they believe is clean. One reason for not boiling water is that it does not taste good. Sanitation – in Gujarat, majority of households have toilets after the Swachh Bharat drive, but a substantial percentage still do not use them. Open defecation continues to be prevalent. In Karnataka, few households have toilets. Hygiene – half of the households washed hands after using the toilet, or before eating.
Female Agency & Empowerment
Women play important roles on farms, including, agricultural production and animal husbandry. Women’s decision-making power in agriculture is limited, with male heads of households taking a majority of the decisions. Women are primary caregivers and as such take care of the household, and prepare food. Many, but not all, women can take everyday decisions within the household; male heads of household take major decisions. Some women cannot move freely outside the home and need to ask permission. Likewise, women have to ask for money.

37
Women across all villages reported limited instances of malnutrition in their locality. This is visible malnutrition, or knowledge of children being treated for malnutrition by anganwadi and ASHA workers. A few women in the larger villages in both districts reported visits from ASHA and anganwadi workers and distribution of iron tablets. However, none of the women said they regularly take iron tablets or other supplements, suggesting that the current approach to supplements for improved nutrition is not effective, and that more awareness is needed. Women in the larger villages had good access to healthcare facilities and used a mixture of private and public providers. The smaller villages however, had poorer access to facilities, especially Kanakanala in Bijapur, which adds to the challenges the village is already facing in terms of reduced crops and migration of working population. The amount of income spent on health-related expenditures varied widely between households, and expenses rose sharply if there was surgery and hospitalisation in the family as households did not have insurance and paid for these out of their own pockets. Health does not only affect nutrition directly as good health enables the body to take up nutrients efficiently, but indirectly too, as increased healthcare expenditures may mean that there is less income to spend on nutritious food. Only half of the women reported washing their hands after using the toilet or before preparing food. Likewise, most households in Sabarkantha had built-in toilets at home because of a recent sanitation drive, but several reported not using them because of the smell, the awkward location or the difficulty of maintaining them. However, women did not appear to understand that poor hygiene and sanitation practices are related to nutrition. This strengthens the suggestion that nutrition is seen merely as a food-related matter. A woman had multiple key roles in the rural home. She was the primary caregiver in all households interviewed. At the same time, most women either worked on their own farms on the fields and in animal husbandry, or as labourers on other farms, bringing in important income. However, most women across all four villages reported that men were in charge of major household decisions and matters related to food production and agriculture. While many women in the FGDs said they had the power to make day-to-day decisions in the home, it still means that as primary caregivers, they do not have agency to take major decisions affecting the care they provide. Likewise, it falls on the women to provide care and there does not seem to be any other option. Only a handful of women across all villages said their husbands shared undertaking care. On the other hand, a notable number of women across the villages had to seek permission to leave the villages, and in some instances to leave the home. As the literature clearly correlates increased empowerment with improved nutrition, that women have limited agency at the same time as they are primary caregivers is a major challenge. Women’s responses as regards their understanding of nutrition suggest that women are not fully informed about the many factors that affect nutritional status. Lastly, that women play key roles on the farm as labourers and are the primary caregivers at home is likely to be challenging in terms of time management, and the quality of care they can provide.
38
However, with their limited decision-making powers, it is unlikely for women to be able to change the status quo. To sum up, the various factors affecting poor nutrition — food access and availability, care, health, water, sanitation and hygiene, as well as women’s agency and empowerment — are all equally important to improve the nutritional status of a household. Each of these factors comes with its own set of challenges. For instance, food access and availability depend on climatic conditions, particularly the monsoons, while hygiene depends on cultural conditioning. Households in all four villages view nutrition as a component derived from food alone, and do not correlate it with other larger changes that are required in their immediate environment.
7. Conclusion This paper reviewed households’ understanding of nutrition and their approach to factors affecting nutrition, across four villages in two districts in Karnataka and Gujarat. Given that women’s role is important, further research could consider how to strengthen women’s agency within the households in order to affect changes in behaviour with respect to sanitation, water and hygiene practices. Likewise, studies on changing the division of labour inside and outside the rural home as also decision-making practices could provide insights into how to strengthen women’s agency in order to make decisions with the best nutritional outcomes for the entire household. Currently, women are key workers on the farm while at the same time being the primary caregivers, but their decision-making powers are limited.

39
References Balagamwala, M., Gazdar, H. and Mallah, H.B., 2015. Women’s Agricultural Work and Nutrition in Pakistan: Findings from Qualitative Research. LANSA Working Paper 2015, 02. Leveraging Agriculture for Nutrition in South Asia. Burchi, F., Franzo, J., and Frison, E., 2011. The role of food and nutrition system approaches in tackling hidden hunger. International Journal of Environmental Research and Public Health, 8(2), pp. 358-373. CFS, 2012. Coming to terms with terminology, food security, nutrition security, food security and nutrition, food and nutrition security. Committee on World Food Security. Food and Agriculture Organization of the United Nations, Rome. Chauhan, C. (14 May 2017). No water in 60% toilets puts question mark over Modi govt’s Swacch Bharat Mission. Hindustan Times. Retrieved from: http://www.hindustantimes.com/india-news/no-water-in-60-toilets-built-under-swachh-bharat-mission/story-3rdu1Hv1UZbabYQhb68OTP.html Dobe, M., Mandal, R.N., and Jha, A. (2013). Social determinants of good hand-washing practice (GHP) among adolescents in a rural Indian community. Family and Community Health. 36(2):172-177 Duflo, E. (2012). Women empowerment and economic development. Journal of Economic Literature. Vol.50, No.4. pp. 1051 – 1079. Engle, P.L., Menon, P. and Haddad, L., 1999. Care and nutrition: concepts and measurement. World Development, 27(8), pp.1309-1337. FAO, 2009. Declaration of the World Summit on Food Security. Rome, Italy: FAO. Freebairn, D.K, 1995. Did the Green Revolution Concentrate Incomes? A Quantitative Study of Research Reports. World Development, 23, 265–279. Gillespie, S., Harris, L., and Kadiyala, S., 2012. The Agriculture-Nutrition Disconnect in India, What Do We Know? Discussion Paper 01187, International Food Policy Research Institute, Washington, D.C. Gopalan, C., 2004. India’s Food Production Policies – Need for Nutrition Orientation. NFI Bulletin: Bulletin of the Nutrition Foundation of India, 25(8). Hawkes, C., Turner, R., and Waage, J., 2012. Current and Planned Research on Agriculture for Improved Nutrition: A Mapping and a Gap Analysis. Report for the Department of International Development (DFID). London: Leverhulme Centre for Integrative Research on Agriculture and Health/University of Aberdeen/Center for Sustainable International Development. Headey, D., Chiu, A. and Kadiyala, S., 2011. Agriculture's role in the Indian enigma: Help or hindrance to the undernutrition crisis? (No. 1085). ICN. (1992). International Conference on Nutrition: World declaration and plan of action for nutrition. Rome, Italy. Kadiyala, S., Harris, J., Headey, D., Yosef, S. and Gillespie, S., 2014. Agriculture and nutrition in India: mapping evidence to pathways. Annals of the New York Academy of Sciences, 1331(1), pp.43-56.

40
Khurana, I. and Sen, R., 2011. Drinking water quality in rural India: issues and approaches. Background Paper, Water Aid. Kohli, N., Avula, R., van den Bold, M., Becker, E., Nisbett, N., Haddad, L., and Menon, P. (March 2017). What will it take to accelerate improvements in nutrition outcomes in Odisha? Learning from the past. Global Food Security. Vol. 12.pp:38-48. https://doi.org/10.1016/j.gfs.2017.01.007 Lancet, 2013. Maternal and Child Nutrition Executive Summary of the Lancet Maternal and Child Nutrition Series. LANSA (2014), Country Policy Landscape Analysis: a brief review of the agriculture/nutrition policy landscape in India. LeRoy, J.L. and Frongillo, E.A., 2007. Can interventions to promote animal production ameliorate undernutrition? The Journal of Nutrition, 137(10), pp.2311-2316. Meeker, J. and Haddad, L., 2013. A state of the art review of agriculture-nutrition linkages. Nandakumar, T., Ganguly, K., Sharma, P. and Gulati, A., 2010. Food and Nutrition Security Status in India. Asian Development Bank Sustainable Development Working Paper Series, (16), pp.1-48. NREGA Act, 2005. Retrieved from: http://nrega.nic.in/amendments_2005_2016.pdf Pelletier, D.L., Frongillo Jr, E.A., Schroeder, D.G. and Habicht, J.P., 1995. The effects of malnutrition on child mortality in developing countries. Bulletin of the World Health Organization, 73(4), p.443. Quisumbing, A.R., Brown, L.R., Feldstein, H.S., Haddad, L., and Pena, C. (1995). Women: The Key to Food Security. Food Policy Report. The International Food Policy Research Institute. Retrieved from: https://core.ac.uk/download/pdf/6289051.pdf Remans, R., Fanzo, J., Palm, C., and DeClerck, F.A., 2011. Human Nutrition as an Ecological Service. In Integrating Ecology into Poverty Alleviation and International Development Efforts: A Practical Guide; De Clerck, FAJ, Ingram, JC, Rio, CR, Eds.; Springer: Heidelberg, Germany; Chapter 2.1.2. Sarada, D. and Rajani, N., 2012. Horticultural nutrition intervention through women's participation: an action research. Journal of Human Ecology-New Delhi, 38(1), p.71. Saxena, V., Kumar, P., Kumari, R., Nath, B., & Pal, R. (2015). Availability of Village Health and Nutrition Day services in Uttarakhand, India. Journal of Family Medicine and Primary Care, 4(2), 251–256. http://doi.org/10.4103/2249-4863.154667 Shroff, M., Griffiths, P., Adair, L., Suchindran, C., and Bentley, M., 2009. Maternal autonomy is inversely related to child stunting in Andhra Pradesh, India. Maternal & Child Nutrition 5, 64–74. Smith, Lisa C. (2003). The Importance of Women’s Status for Child Nutrition in Developing Countries. International Food Policy Research Institute. Spears, D., Ghosh, A. and Cumming, O., 2013. Open defecation and childhood stunting in India: an ecological analysis of new data from 112 districts. PLoS One, 8(9), p.e73784.

41
SPRING, 2014. Understanding the Women’s Empowerment Pathway Brief #4. Improving Nutrition through Agriculture Technical Brief Series. Swaminathan, M.S., 2006. An evergreen revolution. Crop Science, 46, 2293–2303. Swaminathan, M.S., and Bhavani, R.V., 2013. Food production & availability-Essential prerequisites for sustainable food security. The Indian journal of medical research, 138(3), p.383. Teague, J. (2014). Integration of WASH and nutrition: Successes, challenges and best practices. Annals of Global Health. 80(3): 194. UNICEF. (n.d.). Multisectoral approaches to nutrition: Nutrition-specific and nutrition-sensitive interventions to accelerate progress. [Online]. Retrieved from: https://www.unicef.org/eapro/Brief_Nutrition_Overview.pdf Verhart, N., van den Wijngaart, A., Dhamankar, M., and Danielsen, K., 2016. Bringing agriculture and nutrition together using a gender lens. Webb, P., 2013. Impact pathways from agricultural research to improved nutrition and health: literature analysis and research priorities. Rome: Food and Agriculture Organization and Geneva: World Health Organization.

42
Appendix 1 Additional Figures and Tables Primary source(s) of energy for cooking in surveyed households Bijapur, Karnataka Sabarkantha, Gujarat Total Inchegeri Kankanala Sonasan Ranchodpura Firewood & chips - - 3 2 5 Firewood & chips, LPG - - 11 2 13 Firewood & chips, LPG, dung cake - - 4 0 4 Firewood & chips, LPG, kerosene - - 3 0 3 Firewood & chips, dung cake - - 1 2 3 Firewood & chips, dung cake, kerosene - - 2 0 2 Firewood & chips, kerosene - - 9 4 13 LPG - - 4 0 4 LPG, kerosene - - 2 0 2 LPG, dung cake 23 3 - - 26 Gobar gas, dung cake 1 - - - 1 Dung cake, electricity - - 1 0 1 Dung cake 11 12 - - 23 Total 35 15 40 10 100 Source(s) of drinking water in surveyed households Bijapur, Karnataka Sabarkantha, Gujarat Source of drinking water Inchegeri Kanakanala Total Sonasan Ranchodpura Total Tube well/borewell 1 2 3 12 1 13 Tap water from untreated source 0 5 5 6 4 10 Tap water from treated source 0 1 1 7 3 10 Tap water from treated source, borewell/tube well
- - - 6 0 6
Tap water from untreated source, mineral/RO bottles
- - - 2 0 2
Tap water from untreated source, borewell/tube well
- - - 5 2 7
Tap water from untreated source, covered well, borewell/tube well
- - - 1 0 1
Mineral water purifier - - - 1 0 1 Covered well 0 1 1 - - - Uncovered well 0 1 1 - - - Uncovered well, tube well/borewell, tanker
1 0 1 - - -
Hand pump 1 2 3 - - - Hand pump, tube well/borewell 1 0 1 - - - Water tanker 30 3 33 - - - Blanks 1 0 1 - - - Total 35 15 50 40 10 50

43
Appendix 2 Household Questionnaire Consent Statement You have been identified as the most knowledgeable respondent about agricultural, food and nutrition and health status in your household. We would like to interview you. This survey is conducted by the SEWA Academy, in collaboration with OKAPI. This is a research project focused on food, agriculture and nutrition in India, funded by the UK Department for International Development (DfID) through the Leveraging Agriculture for Nutrition in South Asia (LANSA) programme. One of the objectives of this project is to understand the agricultural practices and food consumption patterns of households in Sabarkantha, along with the current nutritional status. Additionally, we would also like to understand how central and state government programmes on food, nutrition and gender are being implemented at the district level. The interview will take approximately 75 minutes. I will ask you questions about:
● Your household’s farm and agriculture activities ● What food you eat, and why/ how you choose to eat that ● Government programmes and schemes that provide support for your household
The information you provide is confidential and will not be shared with anyone. It will only be used for this research. Your name and other personal information will not be used. Instead we will use a code. The Survey Team may contact you again only if it is necessary to complete the information at a later point in time. Your responses will not affect your association with SEWA Academy or its affiliates. Your participation is voluntary and you can stop the survey at any time. You are free to refuse to answer any question. If you have any questions about this survey, you may ask me or contact (name of institution and contact details) or (Principal Investigator at site). Signing this consent indicates that you understand what will be expected of you and are willing to participate in this survey. Thank you. ……………… (Participant’s signature)
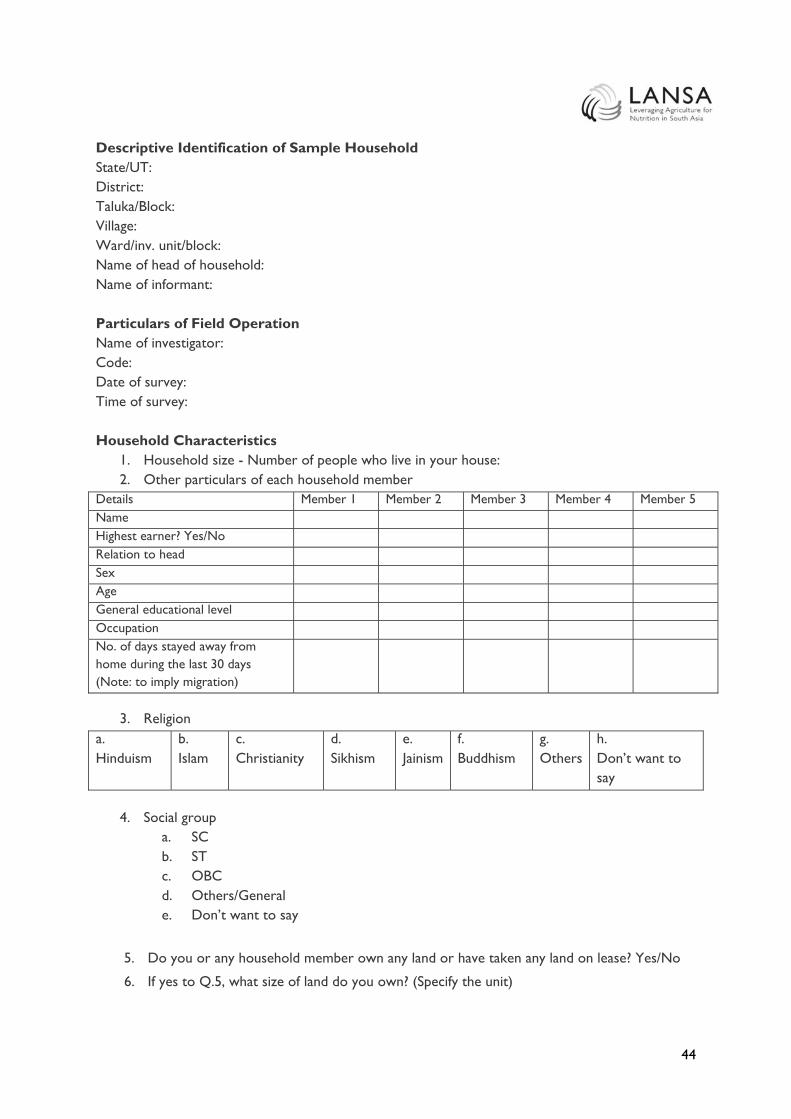
44
Descriptive Identification of Sample Household State/UT: District: Taluka/Block: Village: Ward/inv. unit/block: Name of head of household: Name of informant: Particulars of Field Operation Name of investigator: Code: Date of survey: Time of survey: Household Characteristics
1. Household size - Number of people who live in your house: 2. Other particulars of each household member
Details Member 1 Member 2 Member 3 Member 4 Member 5 Name Highest earner? Yes/No Relation to head Sex Age General educational level Occupation No. of days stayed away from home during the last 30 days (Note: to imply migration)
3. Religion
a. Hinduism
b. Islam
c. Christianity
d. Sikhism
e. Jainism
f. Buddhism
g. Others
h. Don’t want to say
4. Social group
a. SC b. ST c. OBC d. Others/General e. Don’t want to say
5. Do you or any household member own any land or have taken any land on lease? Yes/No
6. If yes to Q.5, what size of land do you own? (Specify the unit)

45
7. Primary source of energy for cooking 8. Primary source of energy for lighting
a. Coke/coal b. Firewood and chips c. LPG d. Gobar gas e. Dung cake f. Charcoal g. Kerosene h. Electricity i. Others j. No cooking arrangements
a. Kerosene b. Other oil c. Gas d. Candle e. Electricity f. Others g. No lighting arrangement
9. What kind of a house do you currently live in?
a. Owned b. Rented c. Others
10. Does the household have a toilet of its own? a. Yes b. No
11. If yes to Q.10, what kind of toilet is it? a. flush/pour flush to piped sewer system b. flush/pour flush to septic tank c. flush/pour flush to pit latrine d. flush/ pour flush to other location e. flush/pour flush to unknown place/not sure f. ventilated improved pit latrine g. pit latrine with slab h. pit latrine without slab / open pit i. composting toilet j. bucket latrine k. hanging toilet/hanging latrine l. No facilities or bush or field m. Others
12. If no to Q. 10, does the household have access to a shared or community toilet? a. None b. Shared in the building/chawl c. Share in an outside building d. Public/government toilet
13. Who decides how the income that is earned by the different household members should be
spent? 14. What is the primary role of women in your household? What decisions can women take on
their own? Can they go outside without asking permission? (Probe if they move freely in the village, Are they part of taking decisions at home? This is to try to understand how independent /empowered they are.)

46
15. Does the household possess a ration card? a. Yes -> what type of a ration card do you own - Antyodaya/BPL/APL/Others (Note:
Check for colour - green, saffron/photo or white) b. No
16. Do any of the members of your household possess an Aadhaar card? a. Yes b. No
17. Is any household member currently employed under MNREGA? a. Yes b. No
18. Over the past 100 days, has any household member been employed under MNREGA? a. Yes b. No
Agriculture Production, Consumption, and Sale
19. What do you produce? (Discuss all commodities (crops, livestock products) with attention to seasonal differences).
Crop Name Reasons for production
How much for home consumption
How much for sale
Markets where this crop is sold: who is it sold to?
20. What are the challenges and opportunities for each of these markets?
21. Who decides what should be produced, in how much quantity and where it should be sold? How do you decide? What are the main reasons for keeping or selling?
(Probe to get a thorough understanding about the dynamics around production- related decision-making in the household. Discuss how the role of men and women varies between households. Discuss what the positive and negative aspects of differences are in the roles of men and women.)
22. Who decides how income through sale of agricultural commodities is used? Why? If not for food, what is the money mainly used for?
23. For which commodities would you like to increase production? Why? What are the barriers for doing so at present?
24. Among the crops that you sell, are there any that you would rather retain for self-consumption? Which crops are they? Why would you rather consume them? And who has the decision-making power to do so?
25. How many people grow more fruit and vegetables in the community? In your opinion why do you think they grow more fruits and vegetables, as compared to others? (Same questions for: fish, chicken/ eggs, goats, cattle.)
26. Have the yields (quantity) for the crops you cultivate changed in the past 10 years? a. No

47
b. Yes -> How much (more or less) and why?
27. What climatic conditions affect your agricultural activities?
28. What do you do to safeguard your fields from adverse climatic conditions?
29. What is the role of women in the household in agriculture? (Probe if they work in the field, if they take decisions on what to grow, what to keep, where to sell. Do they sell in the market? Do they handle money? Do they handle moneylenders and middlemen/wholesalers who come to the village?)
Inputs/Extension
30. What inputs do you use to boost productivity?
31. Where do you procure these inputs from?
32. What are challenges you face in procuring inputs and growing crops?
33. Do you or others in the household interact with gram sevaks and other extension services and farmers groups and cooperatives? If so, how regularly? How useful has it been to be a part of these groups? Who in the household interacts with these groups?
Food and Nutrition Consumption
34. How many meals do you and other family members have in a day?
(Note down figures by each household member.)
35. Do al l household members eat the same amount and same foodIf not, how does it differ? Why does it differ? (Probe to ask about difference in food consumption across different genders and age groups.)
36. What do you eat for each meal? (Include all family members – e.g. home-cooked meals taken by children to school, and midday meals in schools.)
(Probe to ask about pulses like dal, Gujarati kadhi (a dish made of buttermilk and gram flour, grains like rice, jowar, wheat, vegetables, fruits, oils, and spices)
Breakfast Lunch Dinner Snacks Other (Coffee/Tea/Liquor)
What Main ingredients (what cereal, pulses, spices, oils, vegetables)
Eaten in the home or outside? If outside, home prepared or bought?
37. Does everyone in the family eat at the same time? Who eats first in the family? Why?
38. Are there differences between household members in what they eat or how much/often they eat?
a. No

48
b. Yes -> what are the differences, why?
39. How has the way you eat changed in the past 10 years? Why? If not, why not?
40. Who makes decisions in the household about what is eaten and who eats what?
(Probe to get a full understanding of food allocation patterns: who eats more of what, how this is decided and discussed in the group, how this varies between households).
41. Who I s responsible for buying food in the household? What kind of food is mainly bought? Why this food? (Probe to get a full understanding of what the main reasons are that affect people’s food buying choices).
42. What do you grow to eat at home and what do you buy from the market?
43. Who is responsible for preparing food? How is it decided which food is to be prepared? How is it decided how much food is to be cooked? How often is food cooked? How do reactions of (other) household members influence these decisions?
44. Do women receive iron supplements from ASHA/anganwadi workers?
45. Do girls and women in your family eat different / change the way they eat during menstruation?
a. No b. Yes -> If yes, in what way?
46. Are there any pregnant women in your household? a. Yes b. No
47. If yes to Q.47, are their food consumption habits different? If yes, how are they different? 48. Are there any lactating mothers in your household?
a. Yes b. No
49. If yes to Q.49, are their food consumption habits different? If yes, how are they different? 50. What else would you like to eat?
Children’s food consumption habits and practice
51. Who is responsible for feeding the children in the household?
52. Who else is involved of taking care of the children?
53. What do you feed your children? (especially those under 2 years)
54. What would you like to feed your child?
55. What do you think is nutritious for your child?
56. Do you receive any cooked meals from any government programme? a. Cooked meals purchased b. Cooked meals received free in workplace/school c. Cooked meals received as assistance d. Cooked snacks purchased e. Other served processed food f. Don’t receive anything
Knowledge of nutritional requirements
57. Which foods do you consider as good nutritious/ healthy food? Why?

49
58. Why do you think it is important to eat nutritious food?
59. Do you think that people in the household have different needs for food? Who, what kind of food?
60. What are the main reasons for nutritious foods being available / not being available and/or not being consumed?
(Ask probing questions based on earlier answers: Do people sell most of the nutritious food produced? What would be a reason for some people not to sell and instead feed their children? What are main reasons for people to eat fruit and vegetables?)
61. Do you think the children in the community are well-nourished? a. Yes b. No
62. What is good / nutritious in your food and what is lacking? Water, Sanitation, Health Status of health
63. What can be done to improve nutrition? What would help you most to do be able to improve the present nutritional situation in your household?
64. What can be done to improve nutrition? What would help you most to do be able to improve the present nutritional situation in your household?
65. What illness/diseases did any member of household have over the last one year?
66. Over the last one year, how often were your family members taken ill in your household? What kind of illnesses?
67. Does any household member have anaemia? a. Yes b. No
68. Has any female household member had a miscarriage? a. Yes b. No
69. Does any household member have iodine deficiency? a. Yes b. No
70. Does any household member have diarrhoea? a. Yes b. No
71. Who did you go to when you need medical help/care over the past one year? How much did it cost over the past one year?
(government / private versus others) 72. Do you wash your hands with soap before you eat a meal?
a. Yes b. No
73. Do you wash your hands with soap after you use a toilet? a. Yes b. No

50
Drinking water
74. Do what is your source of drinking water? (e.g. tap, hand pump, bought water etc.) a. Tap water from treated source b. Tap water from untreated source c. Covered well d. Uncovered well e. Hand pump f. Tube well / borewell g. Spring h. River/canal i. Tank/pond/lake j. Others
75. Do you boil water before drinking every time? a. Yes b. No
76. If no to Q.76, why do you not boil water?
Beneficiary of Central and State Government Programmes 77. Is any member of your household a beneficiary of any government programmes and
schemes? a. In health? b. In food and nutrition? c. In agriculture? d. In livelihoods? e. For women including SHGs?
78. How have the programmes helped you and/or your household? Please describe the usefulness, and the problems with the programmes/schemes.
Programme(s) Usefulness Problems