Embed Size (px)
Citation preview

Feyisa Demie Andrew Hau
Published by Lambeth Research and Statistics Unit Education and Learning 10th Floor International House Canterbury Crescent London SW9 7QE
© Authors. All rights reserved. June 2016
ISBN: 978‐1‐910428‐13‐9
Language Diversity and Attainment in Primary Schools in England
Contents Page
Section 1: Introduction 2
What does previous research tell us 2
The aims and research methods 3
Section 2: Ethnicity and Attainment in England 4
Ethnicity and Attainment at KS2 5
Section 3: English as an Additional Language and Attainment in England 7
EAL and Attainment at KS2 9
EAL and Attainment at KS2 by Region of England 9
Section 4: Language Diversity and Attainment in England 15
Language Diversity and Attainment at KS2 of Black African Pupils 18
Language Diversity and Attainment at KS2 of White Other Pupils 21
Language Diversity and Attainment at KS2 of Indian Pupils 26
Language Diversity and Attainment at KS2 of Pakistani Pupils 27
Section 5: Fluency in English and Attainment 30
Fluency in English and Attainment at KS2 by Ethnic Background 31
Fluency in English and Attainment at KS2 by Language 33
Section 6: Discussion and Implications for Policy and Practice 37
References 40
Appendix 44

Executive Summary This research aims to examine EAL pupils’ attainment to improve our knowledge about pupils at the end of primary school in England. The findings of the analysis of 544,220 pupils KS2 results in 2014 by language spoken at home and levels of fluency in English suggest that:-
• EAL pupils not fluent in English achieve significantly below the national average compared to monolingual English speakers in English schools.
• There is a wide variation in performance between regions in England with large attainment
gaps between EAL/non-EAL children in the Yorkshire and the Humber, the North East, the North West and the South West regions.
• A further analysis of the EAL data by languages spoken at home suggests 207 languages are
spoken in English schools. Of the Black African language groups, Manding, Lingala, Wolof, Portuguese, Italian and Fula/Fulfulde-Pulaar speakers were the lowest achieving groups while the Igbo, Zulu, Yoruba, Amharic, Ewe and Ga speaking Black African pupils achieved better than White British and the national average. Within the high-achieving Indian EAL language groups, all groups achieved above the national average, the highest performing being Kannada, Telugu and Marathi speakers. In comparison, far fewer Konkani and Panjabi speaking pupils achieved expected outcomes, much closer to the national average. The Pakistani language group is largely an underachieving group, with the lowest performing language groups being Panjabi and Pahari. However, cohorts of Gujarati, Kashmiri, Bengali and English speakers were above the national average. Within the White Other category, there is a large variation in performance depending on the language that is spoken. The highest achieving groups were west European language speakers of Danish, German, Swedish, Dutch, French, English, Greek and Italian, who all out-performed pupils who had English as a first language. The lowest achieving groups tended to be associated with Central and Eastern European countries including Czech, Slovak, Kurdish, Latvian, Hungarian, Lithuanian, Romanian and Polish speaking pupils. Very few Czech and Slovak speaking pupils achieved expected outcomes. Of the larger European language groups in English schools, Polish, Portuguese and Turkish were achieving below the national average.
• An examination of level of fluency in English on pupil performance also confirms that there is a
strong relationship between the stage of fluency in English and educational attainment. The results suggest that the percentage of pupils attaining level 4 or above at KS2 increased as stage of proficiency in English increased. Pupils in the early stages of fluency performed at low levels, while EAL pupils who were fully fluent in English far outstripped those of pupils for whom English was their only language.
Overall the conclusion from this study suggests that language barriers remain the key factor affecting the performance of EAL pupils in English schools. We would argue that the worryingly low achievement of EAL pupils who are not fluent in English has been masked by failure of government statistics to distinguish EAL pupils by stages of fluency in English and languages spoken at home. The recommendations from our findings are that if England is serious about tackling pupil underachievement in schools, policy makers need to recognise the importance of cultural, linguistic diversity. Such data is fundamental in identifying which ethnic and linguistic groups are most at risk of underachievement and to design specific interventions that will be effective in raising pupil achievement, whatever their background.
1

2
Section 1: Introduction
What does previous research tell us?
Language diversity attracts much interest among policy makers and educationists and yet little is known about the performance of pupils who speak different languages in schools in England. There has been a wealth of research undertaken into ethnic background and achievement.The most comprehensive influential policy studies and inquiries into the education of children of ethnic minorities were undertaken by the Rampton Committee (1981), Swann Committee (1985) and Parekh Commission (2000). Each of these appeared to show considerable underachievement of Caribbean and other Black pupils, when compared with the average level of achievement of White and Asian children.
In addition to the studies above, significant overviews of research on ethnic differences in levels of achievement have been published by Ofsted (Gillborn & Gipps 1996; Gillborn & Mirza 2000), the DfE (2009), Bradbury (2011) and Strand (2010, 2012, 2013). The results confirmed the previous research findings, suggesting considerable underachievement of Caribbean and other Black pupils, on average, compared with White and Asian children. This concern has increased in the wake of recent KS1, KS2 and GCSE results which showed the underachievement of Black African and Black Caribbean pupils in both primary and secondary schools (DfE 2006; Demie 2001; Strand 2012). More recently, the Department for Education’s (DfE) National Statistics in 2012 suggested that amongst those ending their compulsory education in the UK, Black Caribbean, White Other and Pakistani pupils were among the lowest performing academically with only 50% of Black Caribbean, 53% of White Other and 54% of Pakistani pupils achieving 5 or more GCSEs at grade A* to C including English and Maths (DfE 2012).
However, we need to exercise caution as ethnicity categorisation has not always been helpful to study achievement of the performance of all pupils in English schools. Research shows that the worryingly low achievement levels of many pupils in British schools are masked by Government statistics that fail to distinguish between different European, African and Asian ethnic groups (Hollingsworth and Mansaray 2012; Demie 2011; Demie and Lewis 2010, 2011). Previous research has noted that the recording of ethnicity in England usually refers, confusingly, to a combination of national boundaries (Indian, Pakistani, Bangladeshi) but also colour (Black, White) and more general geographic distinctions, that supersede national boundaries (Black Caribbean, Black African) (Hollingsworth and Mansaray 2012; Von Ahn et all 2010; Mitton 2011; Demie 2011). Research shows that aggregating groups into White Other makes comparisons problematic as this category contains a range of other European ethnic groups such as Polish, Czech, Portuguese, Spanish, Turkish, Albanian, Russian etc. Similarly the conflation of specifically the Black African, Indian and Pakistani ethnic groups is not helpful as they mask a wide array of different nationalities and cultures. There is therefore a need to unpick the national ethnic categorisations to improve our understanding of the performance of pupils within them.
In the studies where ethnic differences and educational achievement are considered, the importance of language spoken at home by pupils from different ethnic backgrounds is rarely reported. The few recent studies of attainment and language show that there are significant differences within ethnic categories. For example, in a study by Demie and McLean (2007), KS2 and GCSE data analysis of Black African achievement by language spoken confirms that Igbo, Yoruba and Twi‐Fante speaking Black African pupils achieved better than other ethnic groups including Indian and White British at a national level. In contrast, Somali and Lingala speakers tend to have very low attainment compared to other groups. This is further supported by Von Ahn et al (2010:7) analysis of KS2 results that indicated the “Black African group has some of the highest and some of the lowest achieving groups. For example, the three lowest achieving groups – Lingala, French and Somali speakers tend to have low attainment well below that of the lowest attaining ethnic group overall

3
(Black Caribbean), whilst Igbo, Yoruba and English speaking Black Africans achieve as well as the White British group.” These research findings also suggested that “some of the ethnic grouping may be too broad to be useful, and that language data can provide more insight into which pupils may be in need of particular support.” We would argue that there are large attainment gaps in England when data is analysed further by language spoken in addition to ethnic background.
A number of individual research studies have explored the relationship between English fluency and pupils’ attainment and progress. For example, Strand (1999) and Mujitaba and Sammon’s (1999) analyses of large samples of baseline and KS1 data in two London local authorities, suggest that pupils who spoke English as an additional language scored significantly lower than those who spoke English as their first language. Similar findings have been also reported by Demie (2001 and 2011) and Sammons et al (1997) again confirming that pupils who were not fully fluent in English generally perform less well than those who spoke English only, at all key stages. The results of these studies have also revealed that lack of fluency in English is a statistically significant predictor of performance in each of the subject areas of English, mathematics and science.
The aims and research methods
Research questions
This research paper considers empirical evidence from England and examines pupil performance differences among the main ethnic groups, by language spoken at home. Three overarching questions guided this research:
What does the data tell us about ethnic background and EAL attainment?
What does the data tell us about language diversity and EAL attainment?
What impact does fluency in English have on EAL attainment?
The data and method
The data
The strength of the research is its source of data from the National Pupil Database. The National Pupil Database (NPD) is a pupil level database which matches pupil and school data to pupil level attainment. The sample size of the pupils who completed Key Stage 2 at the end of year 6 in 2014 was 550,969. The data on state schools is highly accurate and has a number of key features. Firstly, it is a census dataset containing the population of all pupils in state schools, which is very helpful for a number of different analyses, compared to a dataset based on just a sample of schools. It provides a much richer set of data on school and pupil characteristics. The dataset includes information on language spoken at home, ethnicity, free school meals, gender and results at Key Stage 2.
Measures of pupil background
Pupil Performance ‐ In the English education system, pupils aged 10 to 11 years at the end of Year 6 take the Key Stage 2 tests. These are a series of tests in Reading, Writing (Teacher Assessment) and Maths and for the purposes of this paper, performance is measured by the percentage of pupils achieving level 4 or more at Reading, Writing and Maths combined (expected levels). Underachievement is defined as low attainment which is below the national average or below age‐related expectations. Pupil Language ‐ Recorded from the DfE language list in the School Census, a first language, where it is other than English, is recorded where a pupil was exposed to the language during early development and continues to be exposed to this language in the home or in the community, irrespective of the child’s proficiency in English.

4
Section 2: Ethnicity and Attainment in England
The pupil population in schools in England comprises a wide range of ethnic backgrounds. Nationally, there is a high proportion of White British pupils, reflective of England’s population as a whole. However, when compared with the pupil populations of other European countries, there are also sizeable groups of pupils from Indian, Chinese, Bangladeshi, Pakistani, Black African, Black Caribbean, White Other and Mixed Race backgrounds and lower numbers of other smaller ethnic groups. Those pupils of compulsory school age and above who have been classified as an ethnic group other than White British are defined as being of ethnic minority origin.
The ethnic composition of the pupil population in England has changed in recent years (Fig 1). Pupil numbers across all ethnic categories have increased with the overall rise in the pupil population, but the White British group has seen a fall in its quota, whilst the percentage of pupils from other ethnic backgrounds has risen. In 2005, 78.7% of all primary school pupils in the country were White British, but this has steadily dropped to 69.8% in 2014, with the percentage of ethnic minority pupils correspondingly going up from 19.3% to 29.5% over the same period. There were 372,450 more ethnic minority pupils in primary schools in England in 2014 than there were ten years previously.
Fig 1: Ethnic Minority Pupil Population in Schools* in England 2005‐2014
Source: Schools, Pupils and their Characteristics 2005‐2014, DfE
*State funded primary and secondary schools including all primary academies and free schools, secondary academies and free schools, city technology colleges, university technical colleges and studio schools
11540601214110
1270040
13632101428200
14798001545080
16614401740820
1832995
0
200000
400000
600000
800000
1000000
1200000
1400000
1600000
1800000
2000000
2005 2006 2007 2008 2009 2010 2011 2012 2013 2014
No. of pupils
Primary Secondary

5
Ethnicity and Attainment at Key Stage 2 Table 2 shows that at Key Stage 2 in 2014, the largest ethnic group was White British (71.8%). White Other (4.4%) has superseded Pakistani (4.4%) as the largest ethnic minority group at Key Stage 2, followed by Black African (3.4%) and Indian (2.6%). Since the 2012 analysis, the number of White British pupils has fallen, with the White Other, Pakistani and Black African ethnic groups having seen the biggest rises.
Table 2: Main Ethnic Groups at Key Stage 2 in England 2014
Ethnic Group 2012
Pupil No. 2014
Pupil No. 2014
Pupil %
White British 396851 395787 71.8%
White Other 21638 24303 4.4%
Pakistani 22159 24055 4.4%
Black African 16658 18497 3.4%
Indian 13241 14230 2.6%
Bangladeshi 8971 9991 1.8%
Mixed Other 8327 9339 1.7%
Asian Other 7562 8444 1.5%
Any Other Ethnic Group 7962 8328 1.5%
Black Caribbean 7589 7937 1.4%
Mixed White/Black Caribbean 7096 7735 1.4%
Mixed White/Asian 4836 5871 1.1%
Black Other 3245 3867 0.7%
Mixed White/Black African 2473 3012 0.5%
Chinese 1921 1943 0.4%
White Irish 1645 1707 0.3%
Gypsy Roma 1389 1550 0.3%
Irish Traveller 412 421 0.1%
Total 544220 550969 100.0%
Source: National Pupil Database (NPD), Department for Education, January 2012 & 2014
In terms of attainment, the main findings of the data confirmed that there were substantial differences in performance between different ethnic groups at the end of Key Stage 2 (Table 3). In 2014, Chinese (89.2% achieving level 4 or more at Reading Writing and Maths) and Indian (86.9%) pupils were the highest performing, several percentage points higher than the national average (Fig 2). However, from the larger ethnic groups White Other, Pakistani and Black Caribbean were all underperforming. White Irish Traveller (37.8%) and Gypsy/Roma (32.5%) pupils were by far the lowest achieving groups, albeit with smaller numbers. This is all consistent with the analysis of Key Stage 2 undertaken in 2012 (Table 3).
The achievement of White Other, Pakistani pupils and Black Caribbean pupils are of particular cause for concern. White Other has overtaken Pakistani as the largest ethnic minority group at Key Stage 2, but both are 3.6 percentage points below the national average, meaning a large number of pupils are not achieving expected levels. The achievement of Black Caribbean pupils in England have been a focus of attention amongst policy makers and continue to perform well below expected levels.

6
Table 3: Key Stage 2 Performance in England by Ethnic Group 2014 (2012 for comparison)
2012
2014
Ethnic Group Reading 4+ %
Writing 4+%
Maths 4+%
RWM 4+%
APS (mean)
Reading 4+ %
Writing 4+%
Maths 4+%
RWM 4+%
APS (mean)
Chinese 89.1% 85.8% 94.1% 83.6% 30.69 93.9% 91.0% 95.6% 89.2% 31.56
Indian 90.0% 88.0% 89.6% 82.6% 29.28 92.9% 91.8% 92.2% 86.9% 30.11
Asian Other 85.6% 81.5% 86.7% 76.3% 28.59 91.3% 89.2% 91.4% 84.5% 29.73
Mixed White Asian 89.8% 85.5% 87.6% 80.0% 29.20 91.8% 89.1% 89.3% 83.4% 29.70
White Irish 91.5% 84.9% 88.2% 80.3% 29.24 92.0% 88.6% 89.5% 83.4% 29.56
Mixed Other 88.5% 83.6% 85.3% 77.0% 28.54 91.0% 87.9% 87.8% 81.8% 29.03
Bangladeshi 86.8% 84.8% 84.4% 76.4% 28.02 89.2% 88.3% 87.7% 81.2% 28.61
Mixed White Black African 87.6% 82.2% 82.8% 74.4% 28.23 91.7% 88.4% 86.2% 81.1% 28.77
White British 87.4% 81.7% 84.6% 75.0% 28.30 89.7% 85.8% 86.5% 79.3% 28.63
Black African 85.0% 80.7% 81.4% 72.8% 27.53 88.8% 86.2% 85.6% 78.8% 28.30
Any Other Ethnic Group 79.5% 74.9% 80.8% 68.4% 27.30 86.3% 82.9% 86.6% 76.4% 28.44
Mixed White Black Caribbean 85.2% 79.5% 80.1% 70.4% 27.50 88.1% 83.5% 82.6% 75.4% 27.87
Pakistani 82.4% 78.2% 79.5% 69.2% 27.10 85.4% 83.7% 83.4% 75.3% 27.81
White Other 79.1% 73.7% 81.7% 67.9% 27.51 85.2% 81.3% 86.5% 75.3% 28.35
Black Other 84.3% 78.6% 79.2% 69.8% 27.18 86.6% 84.1% 81.9% 75.2% 27.66
Black Caribbean 84.1% 78.5% 78.0% 68.9% 27.05 86.8% 82.8% 80.6% 73.0% 27.30
Irish Traveller 50.2% 36.4% 46.1% 28.4% 22.28 57.7% 48.9% 55.1% 37.8% 23.67
Gypsy Roma 41.5% 31.0% 38.7% 24.3% 20.74 51.4% 41.7% 47.9% 32.5% 22.36
All pupils 86.5% 81.0% 84.0% 74.3% 28.18 89.1% 85.6% 86.3% 78.9% 28.6%
Source: National Pupil Database (NPD), Department for Education, January 2012 & 2014
Fig 2: Key Stage 2 Reading/Writing/Maths Level 4+ by Ethnic Background in England 2014

7
Various possible explanations were considered for the differences in performance between different ethnic groups. Previous research work has brought the link between deprivation and low performance at school back up the agenda and has confirmed the relative low attainment of pupils who are entitled to free school meals (Cabinet Office 2007; Gillborn and Youdell 2002; Demie 2002). There were striking differences between and within ethnic groups when the national data was analysed by pupils eligible for free school meals. Eligibility for free school meals is strongly associated with low achievement, but significantly more so for White British pupils than any other ethnic groups (Strand 2013; Demie et al 2012). Other studies also provide an alternative explanation for the underachievement of, for example, Black Caribbean pupils, including ‘unintentional’ racism (Rampton,1981 and Swann, 1985); differences in socio‐economic conditions (Swann,1985; Ofsted,1996); prejudice on the part of some teachers; inappropriate curricula and teaching materials; lack of adequate support to schools and teachers from some Caribbean parents; and inadequacy of the understanding of Caribbean and other black children by schools and teachers (Rampton, 1981). A number of recent researchers have attributed ethnic differences in attainment in particular to variations in levels of English fluency between ethnic groups, which will be further explored in the sections to follow. We need to exercise caution, however, as ethnic categorisation has not always been helpful in studying achievement of the performance of all pupils in English schools. Previous research has noted that the recording of ethnicity in England usually refers, confusingly, to a combination of national boundaries (Indian, Pakistani, Bangladeshi) but also colour (Black, White) and more general geographic distinctions, that supersede national boundaries (Black Caribbean, Black African). In particular, the conflation of the White Other, Black African, Indian and Pakistani ethnic groups has limited use as they mask a wide array of different nationalities and cultures. There is therefore a need to unpick the national ethnic categorisations to improve our understanding of the performance of pupils within them.
Section 3: English as an Additional Language and Attainment Previous research has explored the association between ethnicity and language spoken and found them to be closely linked. At KS2 in 2014, 99% of pupils from the indigenous White British ethnic group spoke English as their first language with less than 1% having a first language that was not English. In stark contrast, just 39% of ethnic minority pupils spoke English as a first language, with 61% of pupils being recorded as having English as an additional language (i.e. a first language that was not English). In particular, 95% of Bangladeshi, 87% of Pakistani, 85% of Any Other Ethnic Group, 80% of Chinese, 78% of Indian and 74% of White Other ethnic minority pupils were all speaking English as an additional language. As such, having English as an additional language (EAL) can to a degree be indicative of an ethnic minority origin (An exception to this would be the Black Caribbean ethnic minority group of whom 97% spoke English as their first language). As Strand, Malmberg and
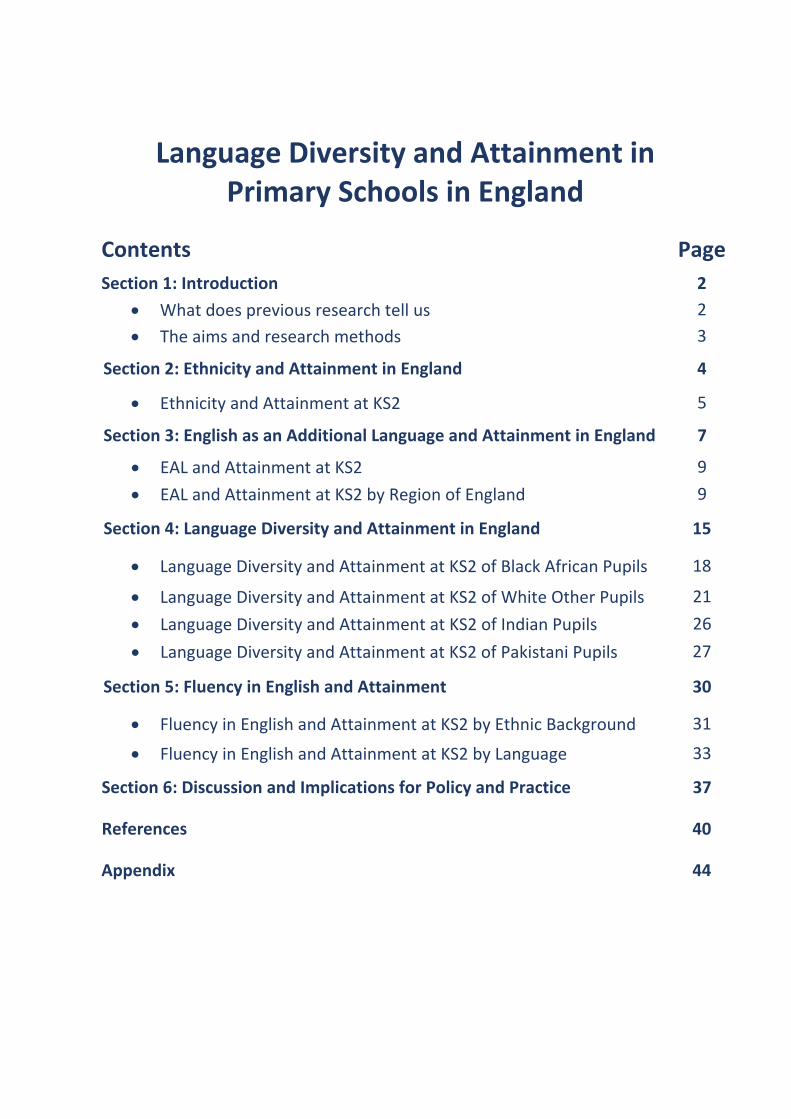
Hall (2015) noted ‘In some ways then EAL acts simply as a proxy for minority ethnicity status, albeit with the notable exception of the Black Caribbean and Mixed White and Black Caribbean groups’. The number of pupils in England with English as an additional language has seen a dramatic increase over the years (Table 4). Across both primary and secondary phases, the number of EAL pupils has more than doubled since 1997, when just 7.8% of primary school pupils and 7.3% of secondary school pupils spoke a language other than English. In 2014, over one million pupils in England (16.6%) were recorded as EAL. This corresponds with the rise in numbers of ethnic minority pupils during this period.
8
Table 4: Primary and Secondary Schools in England: Number and % of EAL Pupils 1997 ‐ 2014
PRIMARY SECONDARY TOTAL
No. of pupils with EAL
% of pupils with EAL
No. of pupils with EAL
% of pupils with EAL
No. of pupils with EAL
% of pupils with EAL
1997 276,200 7.8 222,800 7.3 499,000 7.61998 303,635 8.5 238,532 7.8 542,167 8.21999 301,800 8.4 244,684 7.8 546,484 8.12000 311,512 8.7 255,256 8.0 566,768 8.42001 331,512 9.3 258,893 8.0 590,405 8.72002 350,483 10.0 282,235 8.6 632,718 9.32003 362,690 10.4 291,110 8.8 653,800 9.62004 376,600 11.0 292,890 8.8 669,490 9.92005 395,270 11.6 299,200 9.0 694,470 10.32006 419,600 12.5 314,950 9.5 734,550 11.02007 447,650 13.5 342,140 10.5 789,790 12.02008 470,080 14.4 354,300 10.8 824,380 12.62009 491,340 15.2 362,600 11.1 853,940 13.12010 518,020 16.0 378,210 11.6 896,230 13.82011 547,030 16.8 399,550 12.3 946,580 14.62012 577,555 17.5 417,765 12.9 995,320 15.22013 612,160 18.1 436,150 13.6 1,048,310 15.92014 654,405 18.7 455,205 14.3 1,109,610 16.6
The rapid rise in the number of pupils with EAL in primary schools especially (Fig 3), should be carefully monitored. If having EAL is identified as a factor affecting pupil achievement, then the considerable growth in the EAL school population will have an impact on national attainment.
Fig 3: Number of Primary School Pupils with English as an Additional Language 1997‐2014
Source: Schools, Pupils and Characteristics, Department for Education, 1997 ‐ 2014
276,200
303,635301,800311,512
331,512350,483
362,690376,600
395,270
419,600
447,650470,080
491,340
518,020
547,030
577,555
612,160
654,405
0
100,000
200,000
300,000
400,000
500,000
600,000
700,000
1997 1998 1999 2000 2001 2002 2003 2004 2005 2006 2007 2008 2009 2010 2011 2012 2013 2014

9
EAL and Attainment at Key Stage 2 The 2014 census recorded that schools in England had 550,969 pupils sitting Key Stage 2 tests in Year 6. Of these, 17.6% were recorded as having English as an additional language, whilst 82.4% spoke only English. (Table 5). Table 5: Key Stage 2 Performance of EAL/non‐EAL Pupils in England 2014 (2012 for comparison)
Source: National Pupil Database (NPD), Department for Education, January 2012 & 2014
Nationally at Key Stage 2, pupils with English as an additional language continue to achieve less well at Reading, Writing and Maths than those with English as their first language. This is consistent with previous analysis of 2012 data. However, achievement at Key Stage 2 overall has gone up and the gap in achievement between EAL and non‐EAL speakers across Reading, Writing and Maths appears to be narrowing. The gap is noticeably smaller for Maths (0.3 percentage points), than for Reading (3.2 %) and Writing (1.8%).
EAL and Attainment at Key Stage 2 by Region of England Using the empirical data from the 2014 National Pupil Database (NPD), the achievement of Key Stage 2 EAL pupils was examined by the region of England they live in (Table 6). Table 6: KS2 Performance of EAL Pupils and EAL/Non‐EAL Gap by Region of England 2014
(2012 for comparison)
Region
2012 2014
% Pupils EAL
RWM 4+ % Pupils EAL
RWM 4+
EAL Non‐EAL
EAL/Non‐EAL Gap
EAL Non‐EAL
EAL/Non‐EAL Gap
Inner London 54.4% 74.4% 77.9% ‐3.5% 56.8% 82.6% 81.3% 1.3%
Outer London 39.5% 74.3% 77.7% ‐3.4% 42.4% 81.3% 82.4% ‐1.1%
South East 10.1% 71.2% 74.9% ‐3.7% 11.1% 76.6% 79.9% ‐3.3%
North West 11.9% 69.1% 76.6% ‐7.4% 13.2% 76.0% 80.7% ‐4.7%
South West 4.9% 66.6% 75.0% ‐8.4% 5.6% 74.3% 78.9% ‐4.6%
North East 5.3% 69.8% 75.4% ‐5.6% 5.5% 74.1% 79.7% ‐5.6%
East Midlands 10.5% 66.9% 75.0% ‐8.0% 11.6% 74.0% 78.2% ‐4.2%
West Midlands 18.5% 69.1% 74.4% ‐5.3% 19.8% 73.9% 78.1% ‐4.2%
East 9.9% 69.1% 73.4% ‐4.4% 11.5% 73.8% 78.1% ‐4.3%
Yorkshire & the Humber 14.8% 62.9% 73.2% ‐10.3% 15.5% 69.9% 77.4% ‐7.5%
All England 16.2% 70.6% 75.0% ‐4.4% 17.6% 77.3% 79.3% ‐2.0%
Source: National Pupil Database (NPD), Department for Education, January 2012 & 2014
2012 2014
Pupil No.
Reading 4+%
Writing 4+%
Maths 4+%
RWM 4+%
APS Pupil No.
Reading 4+%
Writing 4+%
Maths 4+%
RWM 4+%
APS
EAL 87805 81.9% 77.8% 81.7% 70.6% 27.52 96873 86.5% 84.1% 86.1% 77.3% 28.38
Non‐EAL 456415 87.4% 81.7% 84.4% 75.0% 28.31 453774 89.7% 85.9% 86.4% 79.3% 28.64
ALL 544220 86.5% 81.0% 84.0% 74.3% 28.18 550969 89.1% 85.6% 86.3% 78.9% 28.59
10
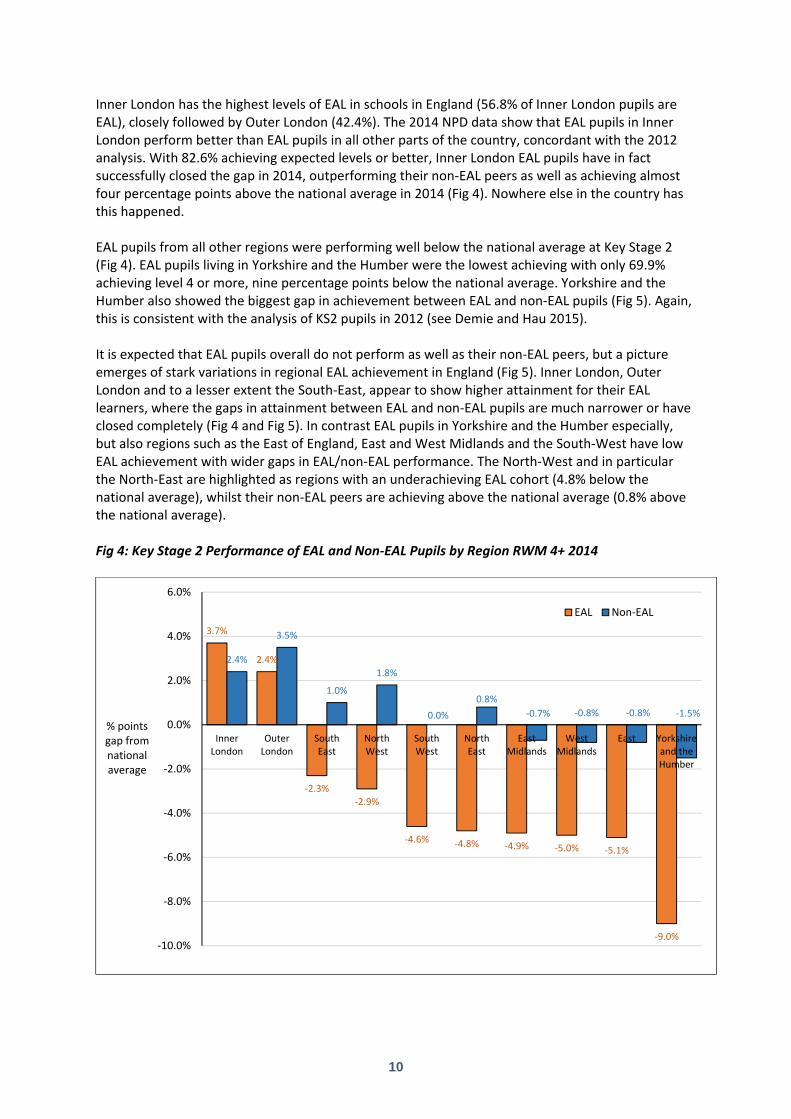
Inner London has the highest levels of EAL in schools in England (56.8% of Inner London pupils are EAL), closely followed by Outer London (42.4%). The 2014 NPD data show that EAL pupils in Inner London perform better than EAL pupils in all other parts of the country, concordant with the 2012 analysis. With 82.6% achieving expected levels or better, Inner London EAL pupils have in fact successfully closed the gap in 2014, outperforming their non‐EAL peers as well as achieving almost four percentage points above the national average in 2014 (Fig 4). Nowhere else in the country has this happened. EAL pupils from all other regions were performing well below the national average at Key Stage 2 (Fig 4). EAL pupils living in Yorkshire and the Humber were the lowest achieving with only 69.9% achieving level 4 or more, nine percentage points below the national average. Yorkshire and the Humber also showed the biggest gap in achievement between EAL and non‐EAL pupils (Fig 5). Again, this is consistent with the analysis of KS2 pupils in 2012 (see Demie and Hau 2015). It is expected that EAL pupils overall do not perform as well as their non‐EAL peers, but a picture emerges of stark variations in regional EAL achievement in England (Fig 5). Inner London, Outer London and to a lesser extent the South‐East, appear to show higher attainment for their EAL learners, where the gaps in attainment between EAL and non‐EAL pupils are much narrower or have closed completely (Fig 4 and Fig 5). In contrast EAL pupils in Yorkshire and the Humber especially, but also regions such as the East of England, East and West Midlands and the South‐West have low EAL achievement with wider gaps in EAL/non‐EAL performance. The North‐West and in particular the North‐East are highlighted as regions with an underachieving EAL cohort (4.8% below the national average), whilst their non‐EAL peers are achieving above the national average (0.8% above the national average). Fig 4: Key Stage 2 Performance of EAL and Non‐EAL Pupils by Region RWM 4+ 2014
3.7%
2.4%
‐2.3%‐2.9%
‐4.6% ‐4.8% ‐4.9% ‐5.0% ‐5.1%
‐9.0%
2.4%
3.5%
1.0%
1.8%
0.0%
0.8%
‐0.7% ‐0.8% ‐0.8% ‐1.5%
‐10.0%
‐8.0%
‐6.0%
‐4.0%
‐2.0%
0.0%
2.0%
4.0%
6.0%
InnerLondon
OuterLondon
SouthEast
NorthWest
SouthWest
NorthEast
EastMidlands
WestMidlands
East Yorkshireand theHumber
% points gap from national average
EAL Non‐EAL

11
Fig 5: Achievement Gap Between EAL and Non‐EAL Pupils by Region at KS2 2014
It is notable that the regions with the largest gaps in EAL attainment have much lower percentages of EAL pupils when compared to Inner and Outer London where the EAL pupil population is much higher (Fig 6 and Fig 7). There does appear to be a correlation between the levels of EAL in the pupil population of a region and their success at Key Stage 2. Regions with the highest proportions of EAL pupils such as Inner and Outer London, but also the South East of England appeared to have a higher percentage of their EAL pupils achieving expected levels, than for example the East, North‐East and South West of England, where EAL numbers were much lower, which subsequently appears to have a negative impact on attainment. Various reasons for this can be suggested. EAL pupils in Inner and Outer London could succeed more than other regions because of good practice and targeted support by those schools with high levels of EAL. Recent case study research of an Inner London local authority with a proven track record in EAL attainment highlighted the reasons for improvement and the high achievement of pupils with EAL in these schools. These include strong and purposeful leadership, high expectations of all pupils and teachers, effective use of data, effective use of a diversified workforce, effective EAL teaching and learning, strong links with the community, a clear commitment to parents’ involvement and good and well‐coordinated targeted support through extensive use of EAL teachers, teaching assistants and learning mentors (Demie and Bellsham‐Revell 2013). These practices meet the needs of EAL learners, strategies which may not be established in schools who historically have had very few pupils with EAL and consequently haven’t supported the specific needs of these pupils. Inner London’s prolonged exposure to EAL pupils, means they may be better equipped to provide a more supportive educational environment to these pupils. London schools are well funded and the extra funding from higher levels of EAL and disadvantaged children in London schools has helped to provide the extra specialist support for pupils with EAL, by recruiting experienced and well trained EAL teachers and EAL support staff. This has helped to improve performance and narrow the achievement gap (Demie 2015).

12
Fig 6: Percentage of EAL Pupils at KS2 across England 2014

13
Fig 7: Percentage of EAL Pupils Achieving Level 4+ RWM at KS2 across England 2014

14
Another reason could be that many EAL pupils in Inner and Outer London may come from more established ethnic minority communities, who have lived in the United Kingdom for longer and the pupils themselves may be second or even third generation, having been born here and may be fully fluent in English. Consequently, language would be less of a barrier to learning than for those EAL pupils who are newer to the country (See Section 5).
Recent research has proposed that London also has one of the larger influxes of EU immigrant families and their children, many of whom do not have English as their first language, but surprisingly do better academically than schools with a pupil population that is predominantly White British with English as a first language. The high educational aspirations of EU immigrant families were identified as a possible reason for this gap in achievement and that ‘the better‐educated and more aspirational immigrant families tend to end up disproportionately in London than in other areas’ (Hannay 2016).
However, it is important to note that using EAL status alone is not necessarily an accurate marker for studying the impact of language on attainment. Knowing that a pupil has English as an additional language has limited use when researching underachieving groups. EAL is a very heterogeneous group made up of pupils from many different ethnic and cultural backgrounds, which are likely to show a wide variation in achievement. We need to be cautious and recognise that ‘EAL is not a precise measure of language proficiency at pupil‐level. ‘First language’ which is used here is the language to which a child was initially exposed during early development and continues to be exposed to in the home or in the community. It does not mean that pupils are necessarily fluent in a language other than English, or that they cannot speak English fluently. Pupils can therefore be identified in the census as EAL when they are bilingual and have no specific need of support to access mainstream education in English.’ (See DfE 2016a:27)
Other researchers have also argued that: ‘The NPD EAL data clearly needs to be interpreted with some caution. It is explicitly not a measure of the pupil’s fluency in English: pupils recorded as EAL may speak no English at all or they may be fully fluent in English. Indeed there is huge heterogeneity within the group coded as EAL. On the one hand, this might include second or third generation ethnic minority students who may be exposed to a language other than English as part of their cultural heritage but use it rarely if at all, using English as their everyday language and being quite fluent in it. At the other extreme it might include new migrants arriving in England who speak no English at all, and may have varying levels of literacy in their previous country of origin’ (Strand et al 2015).
Leedham (2016) also noted that as a result of using EAL status, undifferentiated by levels of English proficiency and language spoken at home, a number of previous researchers and policy makers reinforced a misleading and inaccurate picture of EAL achievement by repeating a familiar narrative that EAL learners outperform their monolingual peers. She argued that meaningful analysis of outcomes of EAL pupils’ achievement is only achieved through data disaggregated by stages of fluency in English, languages and ethnic background.
Researchers have now recognised the weaknesses of using such national data in EAL achievement studies and have argued as unhelpful, information which does not differentiate a pupil’s performance by their proficiency in English or language background (Demie 2015, Von Ahn et al 2011, Demie and Strand 2006). There is a need for more research on languages spoken at home and attainment including the relationship between fluency in English and attainment to improve our knowledge about EAL pupils’ academic performance in schools. Other languages spoken at home and proficiency in English is potentially a powerful predictor of differential attainment among EAL pupils at all key stages and an important factor in pupil achievement. This will be examined in the sections to follow.

15
Section 4: Language Diversity and Attainment The analysis on performance by ethnic group is invaluable in improving our knowledge related to a pupil’s background and achievement, but it is useful to be cautious when using the national School Census ethnic categories. Ethnic categories aggregate a wide range of nationalities, cultures and backgrounds. White Other can include pupils from Western and Eastern Europe as well as other parts of the world. There is a tendency to group all African countries as one homogenous mass but Black African pupils can be from a wide range of countries which are very culturally and sociologically diverse as well as being of British nationality with English spoken as the first language. Studying the languages spoken by pupils may provide greater insight into the broad categorization of ethnic banding, helping to examine attainment and identify underachieving groups. Table 7 shows language spoken for pupils nationally at Key Stage 2. After English speakers (82.3% of KS2 pupils), the most common groups were the Asian languages of Panjabi, Urdu and Bengali respectively. This was followed by sizeable groups of Polish, Somali, Arabic, Gujarati, Tamil, Portuguese, French and Turkish speaking pupils. The 2014 NPD records 207 different languages (including English) spoken by pupils at key stage 2. Of these, 97 languages were spoken by 20 or more pupils. (See Appendix A). Table 7: Main Language Groups (1000 speakers of more) in England at Key Stage 2 2014
Language Main Ethnic Group(s) Reading
4+ Writing
4+ Maths 4+
RWM 4+
APS No.
English White British, Black Caribbean, Black African
89.7% 85.9% 86.4% 79.3% 28.6 453528
Panjabi Indian, Pakistani 85.1% 83.5% 83.9% 75.0% 27.8 11916
Urdu Pakistani 86.8% 85.4% 84.9% 77.3% 28.2 11703
Bengali Bangladeshi 89.2% 88.4% 87.8% 81.4% 28.6 9234
Polish White Other 83.0% 78.1% 87.7% 72.7% 28.0 5578
Somali Black African 87.4% 83.1% 85.4% 76.4% 27.9 4179
Arabic Any Other Group, Black African 86.4% 82.7% 88.0% 77.0% 28.3 3889
Gujarati Indian 92.2% 91.0% 91.5% 85.8% 29.7 3773
Tamil Asian Other 93.2% 92.0% 95.1% 89.2% 31.1 2714
Portuguese White Other, Any Other Group 82.0% 78.2% 79.1% 68.1% 27.1 2464
French White Other, Black African 88.7% 87.1% 86.5% 79.7% 28.6 2381
Turkish White Other 80.6% 79.3% 83.7% 70.8% 27.2 2037
Spanish White Other 89.4% 85.4% 88.7% 79.3% 28.8 1657
Yoruba Black African 93.0% 90.7% 90.3% 84.9% 29.5 1605
Chinese Chinese 93.8% 90.6% 95.3% 88.3% 31.5 1515
Tagalog/Filipino Asian Other 95.0% 92.7% 92.4% 88.7% 29.8 1271
Albanian/Shqip White Other 91.2% 90.2% 89.8% 83.3% 28.8 1220
Lithuanian White Other 78.4% 72.8% 82.8% 65.8% 27.0 1160
Pashto/Pakhto Asian Other 83.2% 81.4% 83.2% 72.8% 27.5 1159
Persian/Farsi Asian Other 87.6% 84.6% 87.9% 78.5% 28.7 1157
Akan/Twi‐Fante Black African 88.4% 88.1% 86.2% 80.2% 28.2 1088
Romanian White Other 74.3% 68.2% 76.7% 62.3% 26.3 1029
National 89.1% 85.6% 86.3% 78.9% 28.6 550969
Source: National Pupil Database (NPD), Department for Education, January 2014

16
It would be prudent when studying language and attainment to note that 82.3% of pupils nationally at KS2 were recorded as having English as a first language (non‐EAL) and this should be considered when comparisons between different language groups are made to the national average.
52 of all the language groups were above the national average for pupils achieving expected levels at Key Stage 2 in 2014 (Fig 8). The highest performing language groups were the Indian languages of Kannada (97.7%) and Telugu (96.3%) who were nearly 18 percentage points higher than the national average. In fact, four of the top five highest achieving language groups were Indian languages. Also achieving well were Urhobo‐Isoko (95.7%), Marathi (93.7%), Malayalam (92.3%), Sinhala (91.8%), Visayan/Bisaya (91.7%) and Hindi (90.8%), all achieving over ten percentage points higher than the national average. Of the more sizeable language groups (Table 7), pupils speaking Tamil (89.2%), Tagalog (88.7%), Chinese (88.3%) and Gujarati (85.8%) achieved well above expected levels. Speakers of Bengali (81.4%), the third largest group of EAL pupils with 9234 speakers were also performing above the national average.
The lowest achieving group was Romani (International) with only 15.2% of a cohort of 46 pupils achieving Level 4 or more. Slovak (30.9%), Czech (38.8%), English Romany (41.7%) and Slovenian (47.6%) speaking pupils, were the next lowest achieving groups with less than half of their pupils achieving expected levels. Also underperforming were Manding/Malinke (60%), Gaelic (61.5%), Latvian (61.7%), Lingala (62.3%), Romanian (65.3%), Hungarian (65.8%) and Lithuanian (67.3%) speaking pupils. It is notable that eight of these twelve languages suggest roots in Eastern Europe. Of the larger language groups, Polish with 5578 speakers had just 72.7% achieving expected levels and Portuguese (68.1%) with 2246 pupils continuing to underperform. The largest EAL language group at KS2, Panjabi, with 11916 speakers were underperforming (75%). Urdu, the second largest EAL language group with 11703 speakers were also underperforming (77.3%) This size of these groups and their underachievement would imply a comparatively large number of pupils from these language groups were not gaining expected levels at KS2.
As discussed in the previous section, monitoring by ethnicity can be imprecise, constrained by categorisation of the official data available at national level. Ethnicity is clearly an important category which is connected to language, though obviously does not map straightforwardly onto it. As Von Ahn et al noted ‘while many languages “attach” to particular ethnic groups … knowing a person’s language does not tell us about their country of origin or ethnic heritage’ (2010, p. 6). However, exploring the language spoken by a pupil helps to unpick the broad ethnic categorization, and mitigate the masking of groups of pupils who may be underperforming.
When analysing language spoken within ethnic categories, the national data suggests that some of the ethnic groups demonstrate a high degree of linguistic homogeneity. For example, 99% of White British and 97% of Black Caribbean children spoke English as a first language. 88% of the Bangladeshi ethnic group, spoke Bengali. To a lesser extent, 67% of the Chinese ethnic group spoke Chinese (with 20% recorded as speaking English).
However other ethnic groups are very linguistically diverse. In particular, the Black African and White Other ethnic categories gloss over enormous linguistic diversity as do the Indian and Pakistani ethnic groups albeit to a lesser extent. With this variation in language may come differences in attainment.

17
Fig 8: Key Stage 2 RWM Level 4+ by First Language Spoken by Pupils in England 2014

18
Language Diversity and Attainment of Black African Pupils Since 2005, primary schools in England have seen a 65% rise in the number of Black African pupils. Since the previous analysis of pupils taking KS2 tests in 2012, there has been an 11% rise in Black African pupils (Table 2). The majority of these pupils live in Inner and Outer London. Black African pupils at KS2 in 2014, were performing close to the national average for achieving expected levels (Table 3).
The Black African ethnic group contains pupils from many backgrounds and speaking a variety of different languages (Table 8). In terms of educational attainment, there are significant differences within the Black African category, when the data is disaggregated by language spoken. The Black African ethnic group contains some of the highest achieving language groups, but also some of the lowest (Fig 9). Table 8: Key Stage 2 Performance of Languages Spoken by Black African Pupils 2014 (30+ speakers)
Language Reading 4+ Writing 4+ Maths 4+ RWM 4+ APS Pupil No. Pupil %
English 90.9% 88.8% 87.2% 82.1% 28.83 5663 30.6%
Somali 87.6% 83.2% 85.5% 76.5% 27.92 4010 21.7%
Yoruba 93.1% 90.9% 90.7% 85.4% 29.49 1477 8.0%
French 84.6% 84.1% 81.0% 73.3% 27.22 1022 5.5%
Akan/Twi‐Fante 88.5% 87.7% 86.1% 80.3% 28.17 948 5.1%
Shona 86.9% 84.2% 79.7% 72.7% 27.52 513 2.8%
Swahili/Kiswahili 87.8% 85.5% 87.0% 79.2% 27.96 491 2.7%
Arabic 89.3% 85.6% 88.8% 78.9% 28.55 375 2.0%
Igbo 93.2% 92.2% 91.4% 87.3% 29.64 370 2.0%
Lingala 82.1% 76.4% 69.8% 60.9% 25.79 368 2.0%
Portuguese 83.5% 80.9% 74.3% 65.7% 26.58 303 1.6%
Tigrinya 87.1% 85.5% 89.4% 80.8% 29.04 255 1.4%
Luganda 88.5% 89.8% 85.4% 80.9% 28.15 157 0.8%
Amharic 91.5% 88.0% 91.5% 84.5% 30.00 142 0.8%
Ndebele 81.5% 85.2% 81.5% 74.1% 26.92 108 0.6%
Dutch/Flemish 87.3% 80.4% 80.4% 71.6% 27.40 102 0.6%
Krio 88.4% 82.1% 82.1% 72.6% 28.17 95 0.5%
Wolof 81.8% 77.3% 69.3% 64.8% 26.25 88 0.5%
Ga 94.3% 88.5% 88.5% 82.8% 29.00 87 0.5%
Italian 80.5% 76.8% 82.9% 68.3% 26.88 82 0.4%
German 92.3% 84.6% 87.7% 78.5% 28.34 65 0.4%
Edo/Bini 90.7% 83.3% 88.9% 79.6% 28.59 54 0.3%
Hausa 89.4% 91.5% 91.5% 78.7% 28.63 47 0.3%
Spanish 90.9% 84.1% 86.4% 81.8% 28.05 44 0.2%
Manding/Malinke 72.1% 65.1% 72.1% 53.5% 25.89 43 0.2%
Zulu 94.6% 94.6% 89.2% 86.5% 28.45 37 0.2%
Fula/Fulfulde‐Pulaar 78.4% 86.5% 81.1% 70.3% 27.83 37 0.2%
Ewe 90.0% 90.0% 86.7% 83.3% 29.84 30 0.2%
All Black African 88.8% 86.2% 85.6% 78.8% 28.30 18497
National 89.1% 85.6% 86.3% 78.9% 28.60 550969
Source: National Pupil Database (NPD), Department for Education, January 2014
19
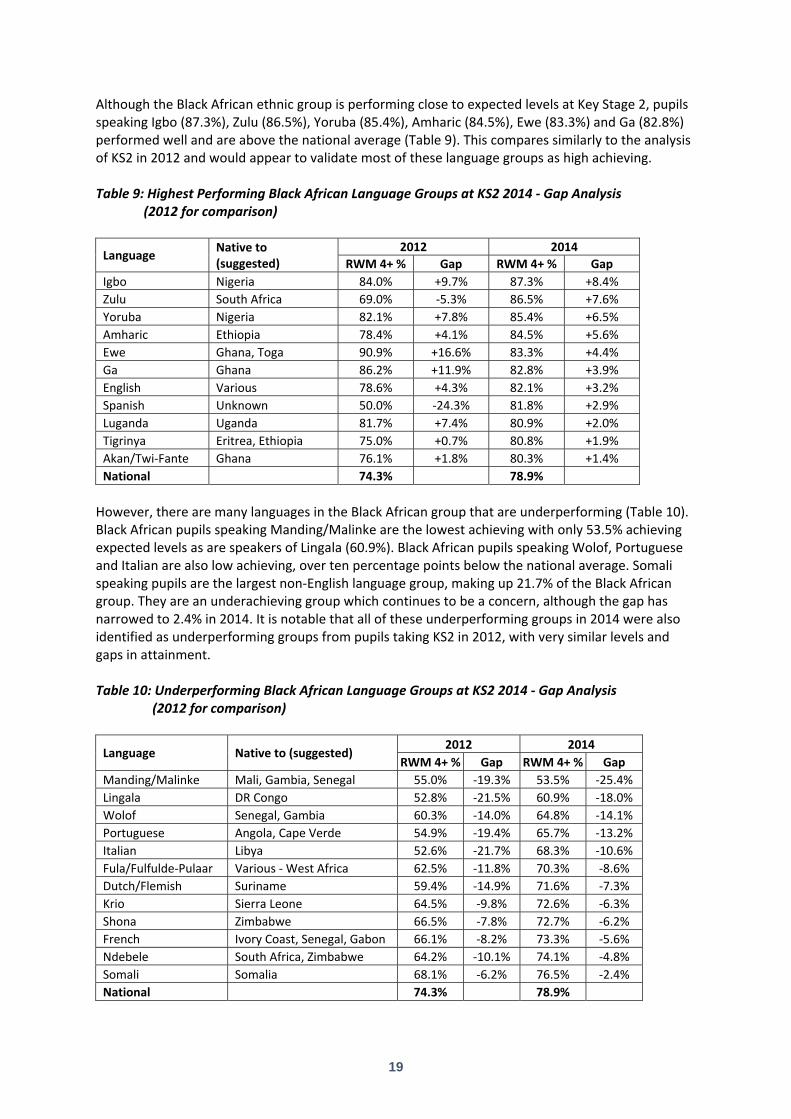
Although the Black African ethnic group is performing close to expected levels at Key Stage 2, pupils speaking Igbo (87.3%), Zulu (86.5%), Yoruba (85.4%), Amharic (84.5%), Ewe (83.3%) and Ga (82.8%) performed well and are above the national average (Table 9). This compares similarly to the analysis of KS2 in 2012 and would appear to validate most of these language groups as high achieving. Table 9: Highest Performing Black African Language Groups at KS2 2014 ‐ Gap Analysis
(2012 for comparison)
Language Native to (suggested)
2012 2014
RWM 4+ % Gap RWM 4+ % Gap
Igbo Nigeria 84.0% +9.7% 87.3% +8.4%
Zulu South Africa 69.0% ‐5.3% 86.5% +7.6%
Yoruba Nigeria 82.1% +7.8% 85.4% +6.5%
Amharic Ethiopia 78.4% +4.1% 84.5% +5.6%
Ewe Ghana, Toga 90.9% +16.6% 83.3% +4.4%
Ga Ghana 86.2% +11.9% 82.8% +3.9%
English Various 78.6% +4.3% 82.1% +3.2%
Spanish Unknown 50.0% ‐24.3% 81.8% +2.9%
Luganda Uganda 81.7% +7.4% 80.9% +2.0%
Tigrinya Eritrea, Ethiopia 75.0% +0.7% 80.8% +1.9%
Akan/Twi‐Fante Ghana 76.1% +1.8% 80.3% +1.4%
National 74.3% 78.9%
However, there are many languages in the Black African group that are underperforming (Table 10). Black African pupils speaking Manding/Malinke are the lowest achieving with only 53.5% achieving expected levels as are speakers of Lingala (60.9%). Black African pupils speaking Wolof, Portuguese and Italian are also low achieving, over ten percentage points below the national average. Somali speaking pupils are the largest non‐English language group, making up 21.7% of the Black African group. They are an underachieving group which continues to be a concern, although the gap has narrowed to 2.4% in 2014. It is notable that all of these underperforming groups in 2014 were also identified as underperforming groups from pupils taking KS2 in 2012, with very similar levels and gaps in attainment. Table 10: Underperforming Black African Language Groups at KS2 2014 ‐ Gap Analysis
(2012 for comparison)
Language Native to (suggested) 2012 2014
RWM 4+ % Gap RWM 4+ % Gap
Manding/Malinke Mali, Gambia, Senegal 55.0% ‐19.3% 53.5% ‐25.4%
Lingala DR Congo 52.8% ‐21.5% 60.9% ‐18.0%
Wolof Senegal, Gambia 60.3% ‐14.0% 64.8% ‐14.1%
Portuguese Angola, Cape Verde 54.9% ‐19.4% 65.7% ‐13.2%
Italian Libya 52.6% ‐21.7% 68.3% ‐10.6%
Fula/Fulfulde‐Pulaar Various ‐ West Africa 62.5% ‐11.8% 70.3% ‐8.6%
Dutch/Flemish Suriname 59.4% ‐14.9% 71.6% ‐7.3%
Krio Sierra Leone 64.5% ‐9.8% 72.6% ‐6.3%
Shona Zimbabwe 66.5% ‐7.8% 72.7% ‐6.2%
French Ivory Coast, Senegal, Gabon 66.1% ‐8.2% 73.3% ‐5.6%
Ndebele South Africa, Zimbabwe 64.2% ‐10.1% 74.1% ‐4.8%
Somali Somalia 68.1% ‐6.2% 76.5% ‐2.4%
National 74.3% 78.9%

20
Fig 9: Key Stage 2 Performance of Languages Spoken by Black African Pupils RWM 4+ 2014 (30+ speakers)
A further examination of the data also suggests that the country to which the language is native, would appear to be influential in the attainment of that language group. The highest achieving Black African language groups have roots suggesting (but not exclusively) East Africa and parts of West Africa, particularly Ghana and Nigeria (Table 9 and Fig 10). Many countries in these regions are part of the Commonwealth and/or have English as an official language, such as Uganda, Ghana and Nigeria. Other countries such as Ethiopia, are not part of the Commonwealth but have English as the main foreign language and is the language used in teaching in secondary schools and universities. The underachieving language groups tended to be associated with African countries which are not part of the Commonwealth and/or may not have English as an official or main foreign language. These countries tend to be in Central Africa, such as the Democratic Republic of the Congo and parts of West Africa where there are clusters of French‐speaking African countries, such as the Ivory Coast and Senegal and also Portuguese colonies, such as Angola, Cape Verde (Table 10 and Fig 10).

21
Fig 10: KS2 Attainment of Language Spoken by Black African Pupils from Commonwealth/ English‐speaking Countries 2014
1. Igbo 8. Spanish 15. Hausa 22. Dutch/Flemish
2. Zulu 9. Luganda 16. German 23. Fula/Fululde‐Pulaar
3. Yoruba 10. Tigrinya 17. Somali 24. Italian
4. Amharic 11. Akan/Twi‐Fante 18. Ndebele 25. Portuguese
5. Ewe 12. Edo/Bini 19. French 26. Wolof
6. Ga 13. Swahili/Kiswahili 20. Shona 27. Lingala
7. English 14. Arabic 21. Krio 28. Manding/Malinke
Previous research has confirmed that EAL pupils from African Commonwealth countries, achieve full fluency in English earlier than those from many other countries. This is not surprising as many of the pupils’ families, particularly from West and East Africa, were exposed to English as the language of government administration and education since the days of the British Empire (Demie and Hau 2013). A family environment that is proficient in English would appear to have a major impact on pupil attainment.
Language Diversity and Attainment of White Other Pupils White Other pupils in primary schools in England have seen a remarkable 131% rise in numbers since 2005, They are the fastest growing ethnic group and are the largest ethnic minority group in schools in England. Since the previous analysis of KS2 pupils in 2012, there has been a 12% rise in White Other pupils sitting Key Stage 2 tests in 2014 (Table 2). White Other pupils are spread throughout the country with the largest numbers in Inner and Outer London, the East and the South‐east of England. White Other pupils at KS2 in 2014 were an underperforming group at 3.6% below the national average (Table 5). Like the Black African ethnic group, the White Other ethnic category demonstrates a wide linguistic diversity (Table 11).
‐30.0%
‐25.0%
‐20.0%
‐15.0%
‐10.0%
‐5.0%
0.0%
5.0%
10.0%
15.0%
1 2 3 4 5 6 7 8 9 10 11 12 13 14 15 16 17 18 19 20 21 22 23 24 25 26 27 28
% pointsgap fromnationalaverage
Native to Commonwealth/English Speaking
Native to non-English Speaking

22
Table 11: Key Stage 2 Performance of Language Spoken by White Other Pupils 2014 (30+ speakers)
Language Reading 4+ Writing 4+ Maths 4+ RWM 4+ APS Pupil No. Pupil %
English 92.0% 89.0% 89.6% 83.9% 29.69 6303 25.9%
Polish 83.3% 78.1% 87.9% 72.8% 28.00 5135 21.1%
Turkish 80.5% 79.1% 83.5% 70.6% 27.16 1626 6.7%
Portuguese 80.4% 76.0% 80.9% 67.6% 27.07 1307 5.4%
Lithuanian 78.7% 73.3% 83.1% 66.0% 27.07 1068 4.4%
Albanian/Shqip 91.6% 90.7% 89.4% 83.6% 28.79 1032 4.2%
Romanian 82.0% 76.0% 83.5% 70.3% 27.21 774 3.2%
Russian 84.0% 78.0% 89.1% 73.5% 28.77 663 2.7%
Spanish 90.3% 85.5% 91.3% 80.3% 29.11 629 2.6%
Italian 90.1% 88.3% 88.5% 81.8% 29.24 494 2.0%
French 93.3% 89.7% 94.0% 87.5% 30.61 447 1.8%
Slovak 47.5% 45.0% 51.4% 37.5% 22.72 440 1.8%
Latvian 78.9% 67.9% 81.3% 62.2% 26.53 418 1.7%
Hungarian 75.4% 71.6% 82.2% 63.9% 27.22 338 1.4%
Bulgarian 83.6% 82.4% 89.7% 74.5% 28.72 329 1.4%
Czech 55.8% 44.8% 53.2% 36.5% 23.15 310 1.3%
German 97.8% 96.3% 97.0% 93.7% 31.84 268 1.1%
Greek 91.8% 90.3% 89.9% 83.5% 29.03 267 1.1%
Arabic 90.6% 86.3% 91.0% 81.2% 29.02 234 1.0%
Serbian/Croatian/Bosnian 87.6% 86.0% 85.5% 79.3% 28.63 193 0.8%
Dutch/Flemish 97.5% 92.5% 94.2% 90.0% 30.67 120 0.5%
Hebrew 95.6% 95.6% 95.6% 92.6% 31.32 68 0.3%
Swedish 96.7% 95.1% 95.1% 93.4% 30.80 61 0.3%
Ukrainian 92.6% 87.0% 94.4% 87.0% 30.58 54 0.2%
Afrikaans 96.0% 94.0% 96.0% 90.0% 30.73 50 0.2%
Danish 100.0% 95.6% 100.0% 95.6% 31.91 45 0.2%
Persian/Farsi 81.4% 81.4% 81.4% 69.8% 28.69 43 0.2%
Kurdish 78.6% 66.7% 78.6% 61.9% 25.50 42 0.2%
All White Other 85.2% 81.3% 86.5% 75.3% 28.35 24303
National 89.1% 85.6% 86.3% 78.9% 28.60 550969
Source: National Pupil Database (NPD), Department for Education, January 2014
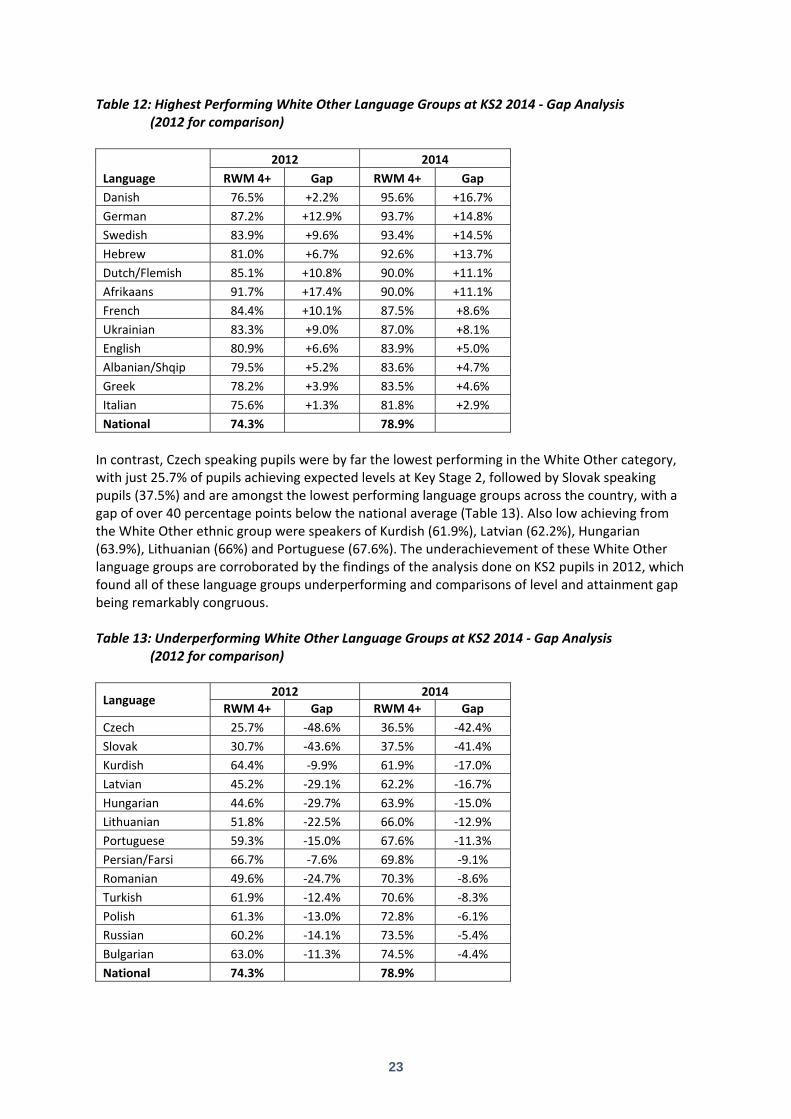
White Other pupils at KS2 are a linguistically diverse group with English being the most commonly spoken (25.9%), closely followed by a large cohort of Polish‐speaking pupils (21.1%). Also with sizeable numbers are pupils speaking Turkish (6.7%), Portuguese (5.4%), Lithuanian (4.4%), Albanian/Shqip (4.2%), Russian (2.7%) and Romanian (3.2%) and Spanish (2.6%) (Table 10). In addition a number of pupils speak Italian, French, Slovak, Latvian, Hungarian, Bulgarian, Czech, German and Greek. In total, 28 different languages were spoken by 30 or more speakers in the White Other ethnic group. There is a wide variation in attainment of different language groups within the White Other ethnic group (Fig 11). White Other overall are considered an underachieving group, but when this is disaggregated by the language spoken by the pupil, there are several language groups that are very high performing. Table 12 shows that within White Other, Danish‐speaking pupils were the highest achieving with 95.6% achieving expected levels. They were closely followed by German speaking pupils (93.7%), then Swedish (93.4%), Hebrew (92.6%), Dutch (90%), Afrikaans (90%) and French (87.5%) who all out‐performed White Other pupils who had English as a first language and were well above the national average at Key Stage 2 (Fig 11). Notably, these highest performing language groups were also high achieving in the 2012 KS2 cohort, with all of them performing above the national average in the 2012 analysis.
23
Table 12: Highest Performing White Other Language Groups at KS2 2014 ‐ Gap Analysis (2012 for comparison)
Language
2012 2014
RWM 4+ Gap RWM 4+ Gap
Danish 76.5% +2.2% 95.6% +16.7%
German 87.2% +12.9% 93.7% +14.8%
Swedish 83.9% +9.6% 93.4% +14.5%
Hebrew 81.0% +6.7% 92.6% +13.7%
Dutch/Flemish 85.1% +10.8% 90.0% +11.1%
Afrikaans 91.7% +17.4% 90.0% +11.1%
French 84.4% +10.1% 87.5% +8.6%
Ukrainian 83.3% +9.0% 87.0% +8.1%
English 80.9% +6.6% 83.9% +5.0%
Albanian/Shqip 79.5% +5.2% 83.6% +4.7%
Greek 78.2% +3.9% 83.5% +4.6%
Italian 75.6% +1.3% 81.8% +2.9%
National 74.3% 78.9%
In contrast, Czech speaking pupils were by far the lowest performing in the White Other category, with just 25.7% of pupils achieving expected levels at Key Stage 2, followed by Slovak speaking pupils (37.5%) and are amongst the lowest performing language groups across the country, with a gap of over 40 percentage points below the national average (Table 13). Also low achieving from the White Other ethnic group were speakers of Kurdish (61.9%), Latvian (62.2%), Hungarian (63.9%), Lithuanian (66%) and Portuguese (67.6%). The underachievement of these White Other language groups are corroborated by the findings of the analysis done on KS2 pupils in 2012, which found all of these language groups underperforming and comparisons of level and attainment gap being remarkably congruous. Table 13: Underperforming White Other Language Groups at KS2 2014 ‐ Gap Analysis
(2012 for comparison)
Language 2012 2014
RWM 4+ Gap RWM 4+ Gap
Czech 25.7% ‐48.6% 36.5% ‐42.4%
Slovak 30.7% ‐43.6% 37.5% ‐41.4%
Kurdish 64.4% ‐9.9% 61.9% ‐17.0%
Latvian 45.2% ‐29.1% 62.2% ‐16.7%
Hungarian 44.6% ‐29.7% 63.9% ‐15.0%
Lithuanian 51.8% ‐22.5% 66.0% ‐12.9%
Portuguese 59.3% ‐15.0% 67.6% ‐11.3%
Persian/Farsi 66.7% ‐7.6% 69.8% ‐9.1%
Romanian 49.6% ‐24.7% 70.3% ‐8.6%
Turkish 61.9% ‐12.4% 70.6% ‐8.3%
Polish 61.3% ‐13.0% 72.8% ‐6.1%
Russian 60.2% ‐14.1% 73.5% ‐5.4%
Bulgarian 63.0% ‐11.3% 74.5% ‐4.4%
National 74.3% 78.9%
24
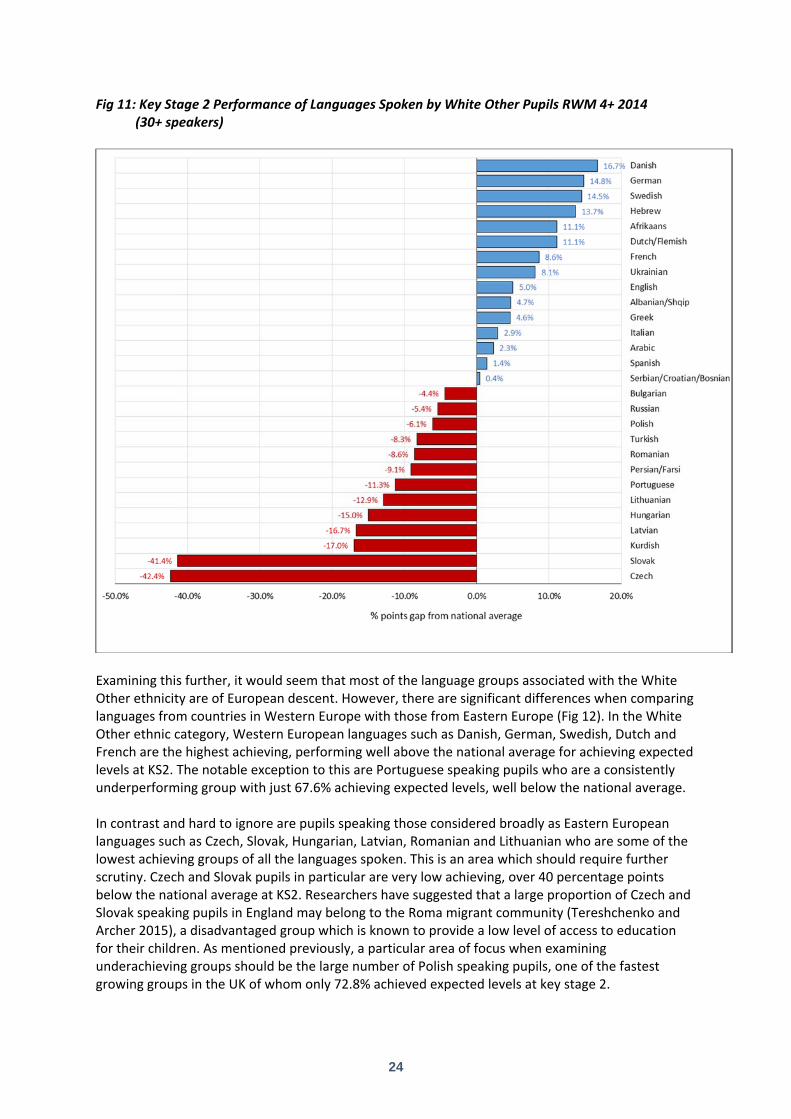
Fig 11: Key Stage 2 Performance of Languages Spoken by White Other Pupils RWM 4+ 2014 (30+ speakers)
Examining this further, it would seem that most of the language groups associated with the White Other ethnicity are of European descent. However, there are significant differences when comparing languages from countries in Western Europe with those from Eastern Europe (Fig 12). In the White Other ethnic category, Western European languages such as Danish, German, Swedish, Dutch and French are the highest achieving, performing well above the national average for achieving expected levels at KS2. The notable exception to this are Portuguese speaking pupils who are a consistently underperforming group with just 67.6% achieving expected levels, well below the national average. In contrast and hard to ignore are pupils speaking those considered broadly as Eastern European languages such as Czech, Slovak, Hungarian, Latvian, Romanian and Lithuanian who are some of the lowest achieving groups of all the languages spoken. This is an area which should require further scrutiny. Czech and Slovak pupils in particular are very low achieving, over 40 percentage points below the national average at KS2. Researchers have suggested that a large proportion of Czech and Slovak speaking pupils in England may belong to the Roma migrant community (Tereshchenko and Archer 2015), a disadvantaged group which is known to provide a low level of access to education for their children. As mentioned previously, a particular area of focus when examining underachieving groups should be the large number of Polish speaking pupils, one of the fastest growing groups in the UK of whom only 72.8% achieved expected levels at key stage 2.

25
Fig 12. Key Stage 2 Performance of Languages Spoken by White Other Pupils RWM 4+ 2014
1. Danish 8. Ukrainian 15. Serbian/Croatian/Bosnian 22. Portuguese
2. German 9. English 16. Bulgarian 23. Lithuanian
3. Swedish 10. Albanian/Shqip 17. Russian 24. Hungarian
4. Hebrew 11. Greek 18. Polish 25. Latvian
5. Dutch/Flemish 12. Italian 19. Turkish 26. Kurdish
6. Afrikaans 13. Arabic 20. Romanian 27. Slovak
7. French 14. Spanish 21. Persian/Farsi 28. Czech
One of the reasons for underachievement by some White Other language groups is the language barrier. Previous research shows that within the White Other ethnic category ‘between 64% and 80% of pupils who are underachieving are not fluent in English, compared to French, Danish, Swedish, Dutch, German, Serb‐Croatian, Afrikaans and Albanian speakers with a significant number of pupils fully fluent in English.’ (See Demie and Hau 2013a, p.17). The rapid rise in the number of pupils of Eastern European descent is a relatively recent phenomenon and there is a suggestion that these pupils are from the families of EU migrants who are newer to the country and may not have been born here. Their proficiency in English and that of their families may be lower than that of other EAL pupils who have settled in England for longer, some of whom may be second or even third generation, with a good knowledge of English and importantly, a home environment that is also proficient in English. This is not true for all Eastern European languages however. Albanian/Shqip speaking pupils appear to do well and further analysis in this area is required before any firm conclusions are made. However, fluency in English would appear to be a pivotal factor in the attainment of these language groups (See Section 5).
Native to Western EuropeNative to Eastern Europe

26
Language Diversity and Attainment of Indian Pupils Indian pupils in primary schools in England have seen a steady 23% rise in numbers since 2005 and are currently the fifth largest ethnic group. Since the previous analysis of pupils taking KS2 tests in 2012, there has been a 7.5% rise in Indian pupils taking KS2 in 2014 (Table 2). Indian pupils are spread throughout the country with the largest numbers in Outer London, the East and West Midlands and the North‐West. The Indian ethnic group is one of the highest performing groups of pupils in England, consistently achieving well above expected levels at KS2. The empirical evidence demonstrates a high level of achievement at KS2 in 2014, performing 8% above the national average (Table 3). Table 14: Key Stage 2 Performance of Languages Spoken by Indian Pupils 2014 (30+ speakers)
Language Reading 4+ Writing 4+ Maths 4+ RWM 4+ APS Pupil No. Pupil % Gujarati 92.1% 91.0% 91.4% 85.7% 29.70 3532 24.8% Panjabi 90.2% 89.4% 89.9% 82.4% 29.15 3528 24.8% English 94.5% 93.7% 93.0% 89.2% 30.57 3116 21.9% Malayalam 95.7% 94.6% 96.8% 92.8% 31.21 878 6.2% Hindi 95.5% 94.6% 95.7% 92.5% 31.90 773 5.4% Urdu 94.6% 90.8% 92.3% 87.5% 29.84 392 2.8% Tamil 93.1% 91.7% 94.2% 89.4% 31.57 360 2.5% Konkani 94.0% 86.8% 92.7% 83.4% 29.29 151 1.1% Telugu 97.4% 98.0% 96.7% 96.7% 32.77 151 1.1% Bengali 95.9% 95.1% 94.3% 92.7% 32.09 123 0.9% Marathi 96.6% 97.7% 96.6% 94.3% 32.40 88 0.6% Katchi 91.8% 93.4% 96.7% 88.5% 29.37 61 0.4% Kannada 97.7% 97.7% 100.0% 97.7% 33.30 43 0.3% All Indian 92.9% 91.8% 92.2% 86.9% 30.11 14230 National 89.1% 85.6% 86.3% 78.9% 28.6 550969 Source: National Pupil Database (NPD), Department for Education, January 2014
The Indian ethnic group is linguistically diverse. Gujarati and Panjabi were the most commonly spoken (both 24.8%), making up half of all Indian pupils. Also with sizeable numbers are pupils speaking Malayalam (6.2%), Hindi (5.4%), Urdu (2.8%) and Tamil (2.5%). (Table 14). In addition a number of pupils speak Konkani, Telugu, Bengali, Marathi, Katchi and Kannada. In total, 13 different languages were spoken by 30 or more speakers in the Indian ethnic category.
Table 15: Key Stage 2 Performance of Languages Spoken by Indian Pupils ‐ Gap Analysis 2014 (2012 for comparison)
Language 2012 2014
RWM 4+ Gap RWM 4+ GapKannada 89.5% 15.2% 97.7% 18.8%Telugu 94.8% 20.5% 96.7% 17.8%Marathi 94.0% 19.7% 94.3% 15.4%Malayalam 86.3% 12.0% 92.8% 13.9%Bengali 82.1% 7.8% 92.7% 13.8%Hindi 86.3% 12.0% 92.5% 13.6%Tamil 85.3% 11.0% 89.4% 10.5%English 87.0% 12.7% 89.2% 10.3%Katchi 77.9% 3.6% 88.5% 9.6%Urdu 83.0% 8.7% 87.5% 8.6%Gujarati 82.7% 8.4% 85.7% 6.8%Konkani 62.7% ‐11.6% 83.4% 4.5%Panjabi 77.5% 3.2% 82.4% 3.5%National 74.3% 78.9%

27
All Indian language groups were high achieving (Table 15). The highest performing were Kannada (97.7%), Telugu (96.7%) and Marathi (94.3%) speaking pupils, achieving well above expected levels. Telugu and Marathi were also the highest attaining language groups at KS2 in 2012. Similarly, Malayalam, Bengali, Hindi and Tamil speakers were over ten percentage points higher than the national average. However, the difference with the national average was substantially smaller for Panjabi and Konkani, the latter of whom were also underachieving at KS2 in 2012 (Fig 13). Fig 13: Key Stage 2 Performance of Languages Spoken by Indian pupils RWM 4+ 2014
Language Diversity and Attainment of Pakistani Pupils Pakistani pupils in primary schools in England have seen a steady 42% rise in numbers since 2005 and are the third largest ethnic group. Since the previous analysis of pupils taking KS2 tests in 2012, there has been an 8.6% rise in Pakistani pupils taking KS2 in 2014 (Table 2). The largest numbers of Pakistani pupils are based in the West Midlands, Yorkshire and the Humber and the North‐west of England. In contrast to Indian pupils, Pakistani pupils are one of the lowest performing ethnic groups of pupils in England. They consistently achieve below expected levels at KS2 and were 3.6% below the national average in 2014 (Table 3). The Pakistani ethnic group is much less linguistically diverse than other ethnic groups, but disaggregated by languages, there are still notable differences. Urdu and Panjabi speakers predominate the group (Table 16) with nearly three quarters of Pakistani pupils speaking one of these languages, but there are also small numbers of pupils speaking Pashto, Pahari, Hindko, Bengali, Arabic, Kashmiri and Gujarati.
3.5%
4.5%
6.8%
8.6%
9.6%
10.3%
10.5%
13.6%
13.8%
13.9%
15.4%
17.8%
18.8%
0.0% 2.0% 4.0% 6.0% 8.0% 10.0% 12.0% 14.0% 16.0% 18.0% 20.0%
Panjabi
Konkani
Gujarati
Urdu
Katchi
English
Tamil
Hindi
Bengali
Malayalam
Marathi
Telugu
Kannada
% points gap from national average

28
Table 16: Key Stage 2 Performance of Languages Spoken by Pakistani Pupils 2014 (30+ speaker)
Language Reading
4+ Writing
4+ Maths 4+
RWM 4+
APS Pupil No.
Pupil %
Urdu 86.5% 85.1% 84.6% 77.0% 28.10 10626 44.2%
Panjabi 82.7% 80.7% 81.1% 71.5% 27.16 7822 32.5%
English 89.8% 87.1% 86.5% 80.3% 28.67 3096 12.9%
Pashto/Pakhto 85.7% 84.8% 83.9% 76.3% 27.69 683 2.8%
Pahari (Pakistan) 80.2% 81.0% 77.7% 68.4% 26.99 247 1.0%
Hindko 87.3% 87.3% 87.3% 75.5% 28.43 110 0.5%
Bengali 91.8% 85.7% 83.7% 81.6% 28.03 49 0.2%
Arabic 84.1% 84.1% 81.8% 72.7% 28.47 44 0.2%
Kashmiri 86.4% 90.9% 86.4% 81.8% 27.84 44 0.2%
Gujarati 94.9% 94.9% 92.3% 89.7% 29.92 39 0.2%
All Pakistani 85.4% 83.7% 83.4% 75.3% 27.81 24055
National 89.1% 85.6% 86.3% 78.9% 28.60 550969 Source: National Pupil Database (NPD), Department for Education, January 2014
In terms of attainment, most language groups were underachieving but Pahari (68.4%) and Panjabi (71.4%) speakers were the lowest attaining. Urdu speakers, the largest language group, also continues to underachieve, 1.9% below the national average. With so many speakers, the low attainment of Panjabi and Urdu speaking pupils is a major determinant of the overall performance of the Pakistani ethnic group.
However, this could mask some language groups who are actually performing very well in this ethnic category. Pakistani pupils speaking Kashmiri (81.8%) and especially Gujarati (89.7%) were performing above the national average (Fig 14). The results of the analysis of KS2 pupils in 2014 appear to be corroborated by the findings of pupils sitting KS2 in 2012, as is the underachievement of the lower performing language groups (Table 17).
Table 17: Key Stage 2 Performance of Languages Spoken by Pakistani pupils ‐ Gap Analysis 2014 (2012 for comparison)
Language 2012 2014
RWM 4+ Gap RWM 4+ Gap
Gujarati 77.8% 3.50% 89.7% 10.8%
Kashmiri 75.6% 1.30% 81.8% 2.9%
Bengali 71.7% ‐2.60% 81.6% 2.7%
English 76.0% 1.70% 80.3% 1.4%
Urdu 70.3% ‐4.00% 77.0% ‐1.9%
Pashto/Pakhto 68.7% ‐5.60% 76.3% ‐2.6%
Hindko 73.8% ‐0.50% 75.5% ‐3.4%
Arabic 73.3% ‐1.00% 72.7% ‐6.2%
Panjabi 66.2% ‐8.10% 71.5% ‐7.4%
Pahari (Pakistan) 63.4% ‐10.90% 68.4% ‐10.5%
National 74.3% 78.9%

29
Fig 14: Key Stage 2 Performance of Languages Spoken by Pakistani Pupils RWM 4+ 2014
Summary Overall the analysis by language category highlights the spread of attainment within ethnic categories and suggests that some of the commonly used ethnic groupings may be too broad to be useful and that language data can provide greater insight into which pupils may be in need of particular support.
The cases of Black African and White Other pupils in particular, where the ethnic categorization masks an exceptionally diverse cluster of backgrounds, nationalities and languages, there appears to be widely differing attainment patterns between different language groups which belong to these ethnic categories. Both of these ethnic groups are underachieving at the national level, but in both cases, several language groups, such as Danish, German and Swedish (in White Other) and Igbo, Zulu and Yoruba (in Black African) were shown to be considerably high performing at KS2.
The high achieving Indian ethnic category also showed linguistic diversity and were performing well across all language groups, but some language groups (Kannada, Telugu) performed extremely well whilst other languages (Konkani, Panjabi) achieved just above expected levels. The underperforming Pakistani ethnic group were less linguistically diverse, but some language groups within Pakistani were achieving higher than the national average (Gujurati, Kashmiri), whilst other groups were several percentage points below national average (Pahari, Panjabi).
These findings are consistent with the analysis of KS2 pupils made in 2012 which appears to corroborate the attainment patterns of the language groups identified in this study. This would suggest that using a pupil’s language to analyse attainment does have considerable merit. The study confirms that the worryingly low achievement of a number of ethnic groups, including Black African and White Other has been masked by Government statistics which have failed to distinguish ethnic groups by language spoken at home.
‐10.5%
‐7.4%
‐6.2%
‐3.4%
‐2.6%
‐1.9%
1.4%
2.7%
2.9%
10.8%
‐15.0% ‐10.0% ‐5.0% 0.0% 5.0% 10.0% 15.0%
Pahari (Pakistan)
Panjabi
Arabic
Hindko
Pashto/Pakhto
Urdu
English
Bengali
Kashmiri
Gujarati
% points gap from national average
30
Section 5: Fluency in English and Attainment
English language proficiency is the major factor influencing the performance of pupils with English as an additional language. With English being the language of instruction, for pupils to fully and effectively access the curriculum, it is clear that they need to be fluent in English.
However, there are relatively few studies that have examined the English proficiency of pupils with EAL and the relationship between stages of English fluency and attainment. There are no national validated scales for assessing English proficiency in England, but studies of a well moderated English fluency model at local authority level confirmed that there is a strong relationship between stage of fluency in English and educational attainment. (see Strand and Demie 2005, 2006; Demie 2011; Demie and Hau 2012). The results suggested that the percentage of pupils attaining level 4 or above at KS2 increased as stage of proficiency in English increased. Pupils in the early stages of fluency in English performed at low levels, while EAL pupils who were fully fluent in English outperformed pupils for whom English was their only language (see Strand 1999; Demie 2013; Demie and Strand 2006 and Strand and Demie 2005).
There is a need to further explore the relationship between proficiency in English of EAL pupils and attainment. As English proficiency data is not currently available at the national level, we can use the local data collected from its schools by an Inner London local authority. The case study authority, Lambeth LA, has a successful track record of collecting reliable data on level of fluency in English and first language of all pupils attending Lambeth schools, as part of an EAL English Fluency Survey undertaken every January since 1990.
The case study LA is one of the most ethnically, linguistically and culturally diverse boroughs in Britain. In common with many other Inner London boroughs, the LA has a high proportion of pupils whose first language is not English. The LA 2014 EAL Language and English Fluency Survey showed that overall, 86.3% of pupils in schools belonged to ethnic minority communities. The variety of pupil languages has increased, with 150 different languages spoken by Lambeth pupils in 2014. Approximately 52% of pupils in primary schools and 43% in secondary schools were classed as bilingual.
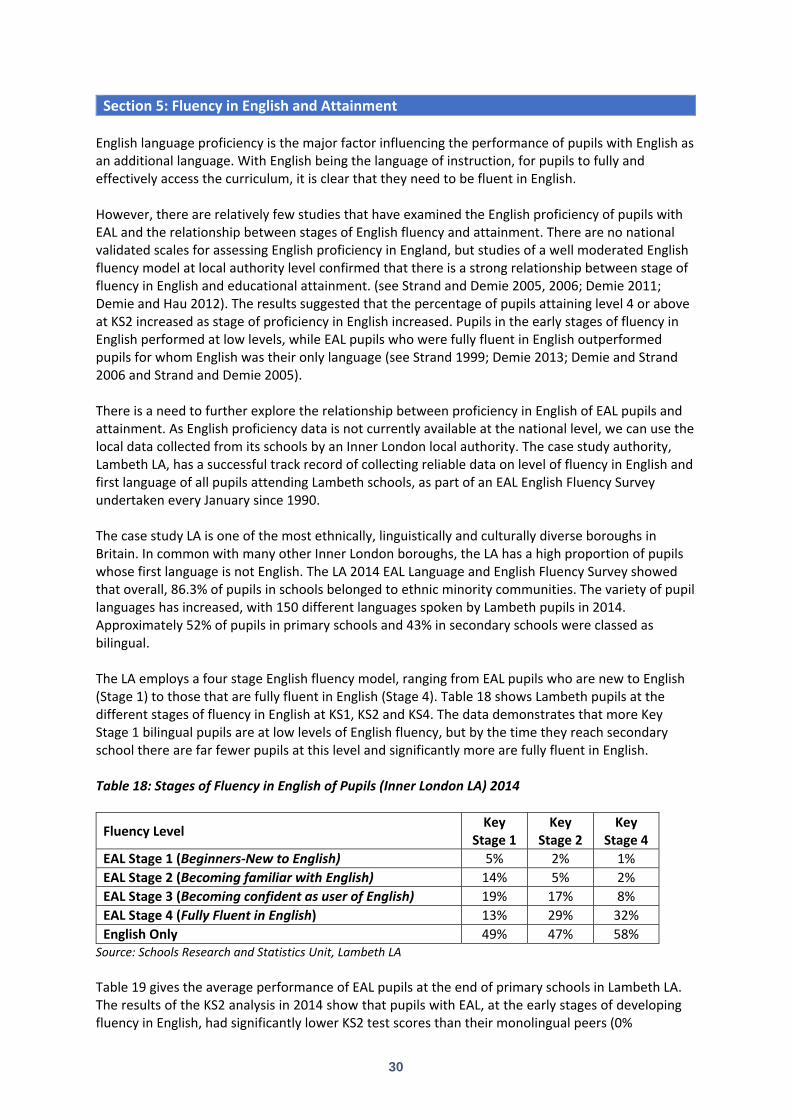
The LA employs a four stage English fluency model, ranging from EAL pupils who are new to English (Stage 1) to those that are fully fluent in English (Stage 4). Table 18 shows Lambeth pupils at the different stages of fluency in English at KS1, KS2 and KS4. The data demonstrates that more Key Stage 1 bilingual pupils are at low levels of English fluency, but by the time they reach secondary school there are far fewer pupils at this level and significantly more are fully fluent in English.
Table 18: Stages of Fluency in English of Pupils (Inner London LA) 2014
Fluency Level Key
Stage 1 Key
Stage 2 Key
Stage 4
EAL Stage 1 (Beginners‐New to English) 5% 2% 1%
EAL Stage 2 (Becoming familiar with English) 14% 5% 2%
EAL Stage 3 (Becoming confident as user of English) 19% 17% 8%
EAL Stage 4 (Fully Fluent in English) 13% 29% 32%
English Only 49% 47% 58% Source: Schools Research and Statistics Unit, Lambeth LA
Table 19 gives the average performance of EAL pupils at the end of primary schools in Lambeth LA. The results of the KS2 analysis in 2014 show that pupils with EAL, at the early stages of developing fluency in English, had significantly lower KS2 test scores than their monolingual peers (0%

31
achieved level 4 or above albeit in a very small cohort). The percentage of pupils achieving expected levels, increased as the stage of proficiency in English increased. Pupils with EAL who were fully fluent in English, achieved significantly higher scores at KS2 (94%) and were more likely to get level 4 or above than even monolingual English‐only speakers (82%). Only 64% of EAL pupils who were not fluent in English (Stages 1 to 3) achieved expected levels at KS2 highlighting them as an underachieving group. Table 19: Key Stage 2 Performance by Stage of Fluency in English (Inner London LA) 2014
Stages of English Acquisition % KS2 pupils % KS2 pupils RWM Level 4+
EAL Stage 1 (Beginners ‐ new to English) 2% 0%
EAL Stage 2 (Becoming familiar with English) 5% 37%
EAL Stage 3 (Becoming confident as user of English) 17% 76%
EAL Stage 4 (Fully fluent in English) 30% 94%
English Only (Monolingual) 46% 82%
EAL Stage 1‐3 (Not Fluent) 24% 64%
EAL Stage 1‐4 (All Bilingual) 54% 80%
All KS2 Pupils 100.0% 81%
Source: Language Diversity in Lambeth Schools 2014, Lambeth Research and Statistics
Thus, EAL national data clearly needs to be interpreted with some caution. Where EAL status is functional in determining whether a pupil is bilingual or speaks only English, it does not measure a pupil’s fluency in English, which the empirical data above shows to be influential in attainment. Pupils recorded as EAL may speak no English at all or they may be fully fluent in English.
The EAL learning needs of pupils vary greatly from beginners to advanced learners. There is a need for more research on the way we assess EAL pupils and on the relationship between stages of fluency in English and attainment to improve our knowledge about EAL pupils and how they might be supported in the classroom. Fluency in English is potentially a powerful predictor of attainment of different groups of EAL pupils at all key stages and an important factor in pupil achievement (Demie 2011).
Ethnicity and Attainment by Fluency in English
The English proficiency of EAL pupils from different ethnic backgrounds and their attainment was explored in the case study LA. Previous studies have confirmed differential attainment between the major pupil ethnic groups and the impact when fluency in English is taken into account may give greater insight into the performance of these ethnic groups.
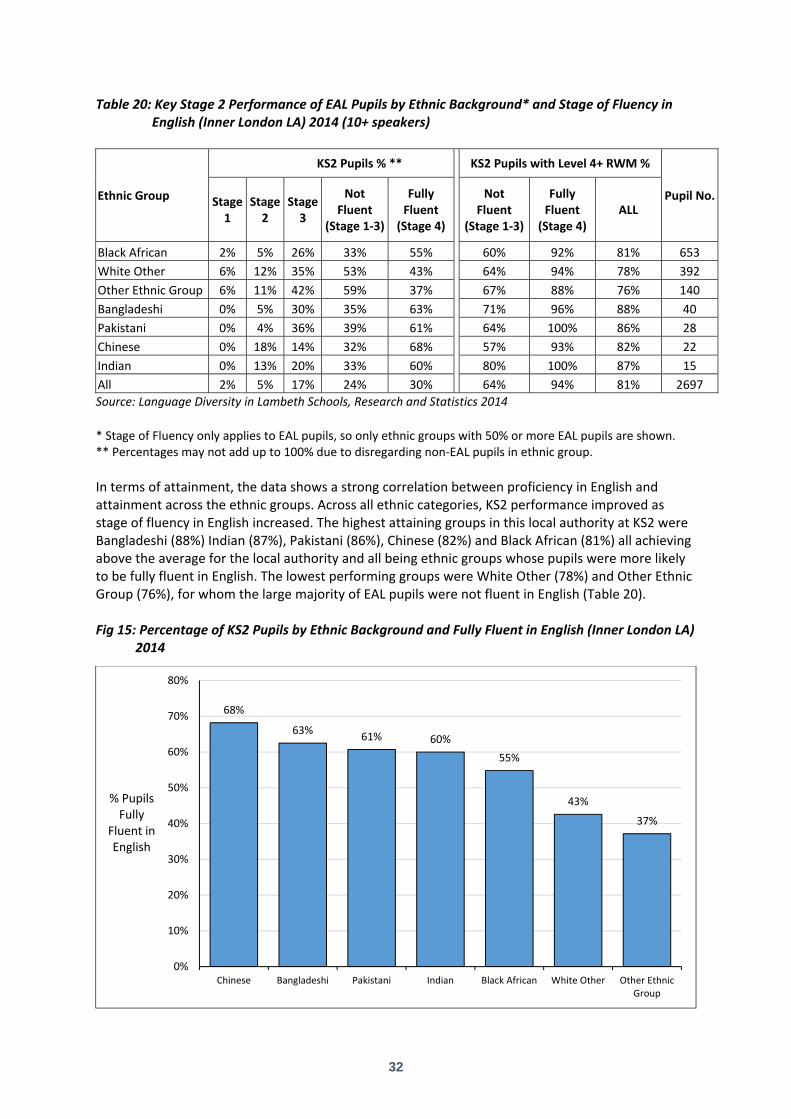
Table 20 shows that EAL pupils from Chinese (68%), Bangladeshi (63%), Pakistani (61%), Indian (60%) and Black African (55%) backgrounds were more likely to be fully fluent in English. than White Other (43%) and Other Ethnic Group (37%) EAL pupils (Fig 15). White Other and Other Ethnic Group had higher numbers of pupils who were new to English (Stage 1) than any of the other ethnic groups.
32
Table 20: Key Stage 2 Performance of EAL Pupils by Ethnic Background* and Stage of Fluency in English (Inner London LA) 2014 (10+ speakers)
Ethnic Group
KS2 Pupils % ** KS2 Pupils with Level 4+ RWM %
Pupil No.Stage 1
Stage 2
Stage 3
Not Fluent
(Stage 1‐3)
Fully Fluent (Stage 4)
Not Fluent
(Stage 1‐3)
Fully Fluent (Stage 4)
ALL
Black African 2% 5% 26% 33% 55% 60% 92% 81% 653
White Other 6% 12% 35% 53% 43% 64% 94% 78% 392
Other Ethnic Group 6% 11% 42% 59% 37% 67% 88% 76% 140
Bangladeshi 0% 5% 30% 35% 63% 71% 96% 88% 40
Pakistani 0% 4% 36% 39% 61% 64% 100% 86% 28
Chinese 0% 18% 14% 32% 68% 57% 93% 82% 22
Indian 0% 13% 20% 33% 60% 80% 100% 87% 15
All 2% 5% 17% 24% 30% 64% 94% 81% 2697
Source: Language Diversity in Lambeth Schools, Research and Statistics 2014
* Stage of Fluency only applies to EAL pupils, so only ethnic groups with 50% or more EAL pupils are shown.** Percentages may not add up to 100% due to disregarding non‐EAL pupils in ethnic group.
In terms of attainment, the data shows a strong correlation between proficiency in English and attainment across the ethnic groups. Across all ethnic categories, KS2 performance improved as stage of fluency in English increased. The highest attaining groups in this local authority at KS2 were Bangladeshi (88%) Indian (87%), Pakistani (86%), Chinese (82%) and Black African (81%) all achieving above the average for the local authority and all being ethnic groups whose pupils were more likely to be fully fluent in English. The lowest performing groups were White Other (78%) and Other Ethnic Group (76%), for whom the large majority of EAL pupils were not fluent in English (Table 20).
Fig 15: Percentage of KS2 Pupils by Ethnic Background and Fully Fluent in English (Inner London LA) 2014
68%
63%61% 60%
55%
43%
37%
0%
10%
20%
30%
40%
50%
60%
70%
80%
Chinese Bangladeshi Pakistani Indian Black African White Other Other EthnicGroup
% Pupils Fully
Fluent in English

33
It is particularly significant that almost all EAL pupils who were fully fluent in English, regardless of which ethnic group they belonged to, achieved expected levels or above. 94% of White Other pupils who were fully fluent in English achieved level 4 or more and were performing to the same levels as Indian (100%), Chinese (93%) and indeed EAL pupils from all other ethnic backgrounds who were also fully fluent in English. This finding offers much encouragement for policymakers and school improvement practitioners. It suggests that once the barrier of language is overcome, it is possible for all pupils to attain high levels of achievement (Fig 16).
Fig 16: Key Stage 2 Performance of Fully Fluent and Not‐Fluent EAL pupils by Ethnic Background (Inner London LA) 2014
There are limitations to this study that should be noted when making comparisons to pupils nationally. The data comes from one local authority with a long history of collecting language data year‐on‐year and who have a high‐achieving EAL pupil population. Some group sizes of pupils at a particular stage of fluency from a particular ethnic group are too small to be statistically reliable. The assessment scale used by the local authority is not universal and nationally used. The ethnic and socio‐economic composition of the EAL population in the local authority is not representative of the whole country and such difference may mean that similar analyses carried out in a different local authority’s schools may show different patterns.
Language Diversity and Attainment by Fluency in English
In the few studies where language differences and educational achievement are considered, the importance of language spoken at home and English language fluency in achievement is very rarely examined, due to the constraint of the categorization used in official statistics and particularly to the lack of national data in fluency in English.
Using data from the case study LA, who collected fluency in English and language data from its pupils with EAL, the variation between pupils who spoke different languages and their proficiency in English was examined (Table 21).
57% 60%64% 64%
67%71%
80%
93% 92%
100%94%
88%
96%100%
0%
10%
20%
30%
40%
50%
60%
70%
80%
90%
100%
Chinese BlackAfrican
Pakistani WhiteOther
OtherEthnicGroup
Bangladeshi Indian
% Pupils RWM 4+
Not Fluent Fully Fluent
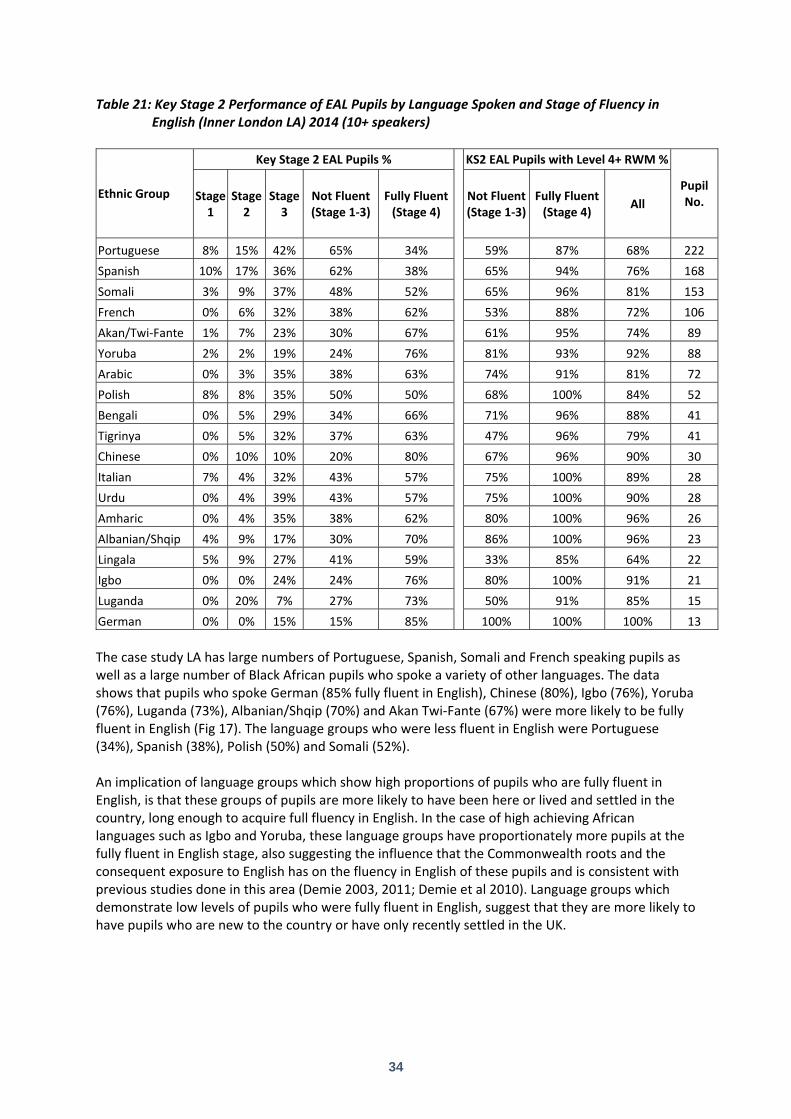
34
Table 21: Key Stage 2 Performance of EAL Pupils by Language Spoken and Stage of Fluency in English (Inner London LA) 2014 (10+ speakers)
Ethnic Group
Key Stage 2 EAL Pupils % KS2 EAL Pupils with Level 4+ RWM %
Pupil No. Stage
1 Stage 2
Stage 3
Not Fluent (Stage 1‐3)
Fully Fluent (Stage 4)
Not Fluent (Stage 1‐3)
Fully Fluent (Stage 4)
All
Portuguese 8% 15% 42% 65% 34% 59% 87% 68% 222
Spanish 10% 17% 36% 62% 38% 65% 94% 76% 168
Somali 3% 9% 37% 48% 52% 65% 96% 81% 153
French 0% 6% 32% 38% 62% 53% 88% 72% 106
Akan/Twi‐Fante 1% 7% 23% 30% 67% 61% 95% 74% 89
Yoruba 2% 2% 19% 24% 76% 81% 93% 92% 88
Arabic 0% 3% 35% 38% 63% 74% 91% 81% 72
Polish 8% 8% 35% 50% 50% 68% 100% 84% 52
Bengali 0% 5% 29% 34% 66% 71% 96% 88% 41
Tigrinya 0% 5% 32% 37% 63% 47% 96% 79% 41
Chinese 0% 10% 10% 20% 80% 67% 96% 90% 30
Italian 7% 4% 32% 43% 57% 75% 100% 89% 28
Urdu 0% 4% 39% 43% 57% 75% 100% 90% 28
Amharic 0% 4% 35% 38% 62% 80% 100% 96% 26
Albanian/Shqip 4% 9% 17% 30% 70% 86% 100% 96% 23
Lingala 5% 9% 27% 41% 59% 33% 85% 64% 22
Igbo 0% 0% 24% 24% 76% 80% 100% 91% 21
Luganda 0% 20% 7% 27% 73% 50% 91% 85% 15
German 0% 0% 15% 15% 85% 100% 100% 100% 13
The case study LA has large numbers of Portuguese, Spanish, Somali and French speaking pupils as well as a large number of Black African pupils who spoke a variety of other languages. The data shows that pupils who spoke German (85% fully fluent in English), Chinese (80%), Igbo (76%), Yoruba (76%), Luganda (73%), Albanian/Shqip (70%) and Akan Twi‐Fante (67%) were more likely to be fully fluent in English (Fig 17). The language groups who were less fluent in English were Portuguese (34%), Spanish (38%), Polish (50%) and Somali (52%). An implication of language groups which show high proportions of pupils who are fully fluent in English, is that these groups of pupils are more likely to have been here or lived and settled in the country, long enough to acquire full fluency in English. In the case of high achieving African languages such as Igbo and Yoruba, these language groups have proportionately more pupils at the fully fluent in English stage, also suggesting the influence that the Commonwealth roots and the consequent exposure to English has on the fluency in English of these pupils and is consistent with previous studies done in this area (Demie 2003, 2011; Demie et al 2010). Language groups which demonstrate low levels of pupils who were fully fluent in English, suggest that they are more likely to have pupils who are new to the country or have only recently settled in the UK.

35
Fig 17: Percentage of KS2 Pupils Fully Fluent in English by Language Spoken (Inner London LA) 2014
In terms of attainment, the data, as with the analysis of ethnic background, once again confirms a strong correlation between proficiency in English and attainment. Across nearly all language groups, KS2 performance improved as stage of fluency in English increased. The highest attaining groups in this local authority at KS2 were German (100% achieving level 4+ reading writing maths), Amharic (96%), Albanian/Shqip (96%), Yoruba (92%), Igbo (91%) and Chinese (90%), all achieving nearly ten percentage points or more above the average for the local authority.
The lowest performing groups were pupils who spoke Lingala (64%), Portuguese (68%) and French (72%). The data suggests that these language groups are less likely to have pupils who are fully fluent in English. For example, 65% of Portuguese pupils were recorded as being not fluent in English. According to the data, only 59% of these Portuguese pupils who were not fluent in English achieved expected levels. However, Portuguese pupils who were fully fluent in English, substantially outperformed those who were not fluent in English, with 87% achieving level 4. This pattern is repeated across all language groups.
This is consistent with the previous findings and again encouragingly confirms that once the barrier of language is overcome, it is possible for all pupils to achieve well. This evidence can be used with schools to demonstrate that the more effective their English language teaching is, the more positive impact it will have on the results of individual EAL pupils and therefore on the results of the whole school (Demie 2015).
34%
38%
50%
52%
57%
57%
59%
62%
62%
63%
63%
66%
67%
70%
73%
76%
76%
80%
85%
0% 10% 20% 30% 40% 50% 60% 70% 80% 90%
Portuguese
Spanish
Polish
Somali
Italian
Urdu
Lingala
Amharic
French
Arabic
Tigrinya
Bengali
Akan/Twi‐Fante
Albanian Shqip
Luganda
Yoruba
Igbo
Chinese
German
% EAL Pupils

36
Fig 18: Key Stage 2 Performance of Fully Fluent and Not‐Fluent in English EAL Pupils by Language Spoken (Inner London LA) 2014
There is consensus from the literature reviews that EAL learners need to gain English proficiency quickly in order to do well in school. There is also solid evidence that most EAL learners who are in the English schools system eventually become proficient in English (see Demie and Strand 2006; Strand and Demie 2005; Demie 2011). Given the apparent importance of fluency in English on attainment, what is perhaps significant is the amount of time it takes for pupils to become fully fluent. Policymakers and mainstream teachers have long been concerned with the best way to help pupils with EAL learn English, yet very little empirical work has examined exactly how long it takes these students to become proficient in English or how the time for proficiency varies for pupils speaking different languages.
A previous study in the case study LA has suggested that it takes about six to eight years on average for pupils with EAL to acquire full academic English proficiency (Demie 2011). This empirical data also suggested that there are differences in the average number of years it takes for pupils to progress from Stage 1 (New to English) to Stage 4 (Fully Fluent) based on the language spoken. Of the larger groups in the local authority, Turkish, Lingala, Spanish, Bengali and Portuguese speakers took a longer time, between six and eight years, compared to French, Yoruba, Somali, Akan Twi‐Fante and Polish speakers who acquired full fluency in English in five to six years.
When examining the language groups of a particular year group at a single local authority, the language cohort sizes become too small to be statistically meaningful. However, there is no reason to think that the findings do not offer suggestions of where attainment gaps exist for different ethnic, language and fluency groups which may prove to be valid on a larger scale. There has been no study at national level due to the lack of a universal and national assessment scale for fluency in English and consequently a lack of national data.
85%
96%91%
88% 87%
95% 94% 96% 96%100%
96%91%
100% 100% 100% 100%
93%
100% 100%
33%
47%50%
53%
59% 61%65% 65% 67% 68%
71%74% 75% 75%
80% 80% 81%86%
100%
0%
10%
20%
30%
40%
50%
60%
70%
80%
90%
100%
% PupilsRWM4+
Fully Fluent Not Fluent

37
Section 6: Discussion and Implications for Policy and Practice
Building on past research, which suggested links between ethnic background and academic achievement, this study demonstrates that Indian, Chinese, Bangladeshi and White British pupils continue to achieve higher results at KS2, on average nationally, than Black Caribbean, Black African, White Other and Pakistani pupils. However, many of these groups are not homogenous. Ethnic categories aggregate a wide range of nationalities, cultures and backgrounds. This study extends the current literature by exploring the potential roles of language data to analyse pupil performance.
The number of pupils in England with English as an additional language has seen a dramatic increase over the years, nearly doubling across the primary and secondary phases. On average, EAL pupils overall do not perform as well as their non‐EAL peers, but individually, they demonstrate a wide diversity of attainment, some very high achieving and some very low achieving. The highest proportions of EAL pupils come from the South‐East particularly Inner London, with levels of EAL pupils much lower in regions such as the North‐East and the South‐West. The highest achieving EAL pupils at KS2 were also in Inner London and the South‐East. In Inner London in 2014, EAL pupils were even outperforming their English‐only peers. In regions with lower concentrations of EAL pupils, the attainment of EAL pupils in that region was also lower.
Studying the languages spoken by EAL pupils may provide greater insight into the broad categorization of ethnic banding, helping to examine attainment and identify underachieving groups. This study focuses on the Black African, White Other, Indian and Pakistani ethnic groups which have the most linguistic diversity. In particular the White Other and the Black African groups revealed the greatest linguistic diversity and attainment patterns. The Black African ethnic group contained a remarkable 34 different language groups of 20 or more speakers. Speakers of Manding/Malinke (mainly spoken in Mali, Gambia and Senegal) and Lingala (Democratic Republic of the Congo), languages that are closely associated with non‐English speaking African countries such as French‐speaking colonies, were performing well below expected levels and had attainment lower than that of Black Caribbean, the lowest attaining major ethnic group. In contrast, pupils speaking Igbo (Nigeria), Yoruba (Nigeria), Amharic (Ethiopia) and Ga (Ghana), native to Commonwealth countries and those that have English as an official language, were achieving better than White British pupils and the national average. The association between African languages and their affiliated country appears to be influential in attainment. Overall, those language groups that had Commonwealth roots, where English is widely spoken, performed significantly better than those that didn’t, particularly former French and Portuguese colonies who do not have English as an official language or used in education or administration. This extends into the family of the pupil, where exposure to a low proficiency in spoken English at home may impact on a pupil’s acquisition of fluency in English.
White Other pupils are largely of European descent and are the largest ethnic minority category in schools in England. Within the category, Polish, Turkish and Portuguese are the three largest language groups and of concern, all are underachieving at KS2, attaining below the lowest performing main ethnic group, Black Caribbean. Many White Other languages suggesting Eastern European origin are notable for their significant underachievement. Pupils who spoke Slovak and Czech are the most underperforming of all language groups with the exception of Romani. Previous studies have alluded to these groups perhaps being of Romani heritage themselves, with a low academic background, but the evidence is anecdotal and further work should be done in this area to identify the reasons for their low performance. Of all the pupils sitting KS2 in 2014, eight of the twelve lowest performing language groups were Eastern European languages, including Kurdish, Latvian, Hungarian, Lithuanian and Romanian. The rapid rise in numbers of White Other pupils could be attributed to East European immigration since the many East European countries’ accession to the EU and may suggest that many of these pupils and their families could be relatively new to the country with low levels of English proficiency.

38
The Indian and Pakistani ethnic groups are less linguistically diverse, but still show variation in achievement when disaggregated by language spoken. Being the best performing ethnic group, unsurprisingly most Indian language groups were some of the highest achieving, with Marathu and Telugu speakers performing the best. The Pakistani ethnic group, in contrast, is a low performing group. However, when analysing the languages that were spoken by Pakistani pupils, Kashmiri, Gujurati and English speakers were actually performing better than pupils nationally, in stark contrast to Pahari and Panjabi speakers who were many percentage points below the national average.
The impact of fluency in English between different ethnic and language groups appears to be a significant factor in the attainment of pupils with EAL and may help to explain the variations in attainment between pupils from different backgrounds. It is reasonable to assert that pupils who are less proficient in English have diminished access to the curriculum, with English being the language of instruction. In the absence of national data for fluency in English, an analysis of KS2 pupils in a case study Inner London LA in 2014 showed that EAL pupils with a low proficiency in English, including those new to the country, had significantly lower KS2 test scores with very few achieving level 4 or better. However, the percentage of pupils achieving expected levels increased as their fluency in English increased. Pupils with EAL who were fully fluent in English were able to fully access the curriculum and achieved high scores at KS2 and were more likely to achieve expected levels or better than even monolingual English‐only speakers. Consequently, language groups that have high proportions of pupils who are fully fluent in English, are more likely to show higher attainment overall and this is broadly demonstrated by the case study data. Some low achieving language groups did have higher proportions of pupils who were fully fluent in English than some groups who were higher attainers and this would suggest that where proficiency in English is clearly influential in pupil attainment, it is not the only determinant and other factors, such as socio‐economic distinctions should also be considered.
Most significantly, those EAL pupils who were fully fluent in English, regardless of their ethnic background or their language spoken, achieved high KS2 scores. For nearly all language groups including those that were identified as low‐achieving such as Lingala and Portuguese, pupils who were recorded as being fully fluent in English exceeded the national average for pupils achieving expected levels at KS2. This finding offers much encouragement for policymakers and school improvement practitioners. It suggests that once the barrier of language is overcome, it is possible for all pupils to attain high levels of achievement.
This research illustrates the diverse nature of current ethnic group categories and calls for a rethink of the categories that we use to understand educational achievement in British schools. Researching the achievement of different ethnic groups in British schools is complicated by the problem of categorisation under groups which are too broadly defined nationally as Black African, White Other, Black Other, Indian, Pakistani, Other Ethnic Group etc. As a result of the lack of detailed ethnically based data, there are limitations to past research of different ethnic groups. The absence of detailed national data which identifies patterns of achievement of ethnic minority children of African, Asian and European heritage in British schools, places serious constraints on effective targeting policies and developments at national and local level. This study is consistent with previous research by Von Ahn et al (2011) and Demie et al (2011) and suggests that language spoken provides a better means to understand the relationship between ethnicity and educational achievement. There is, therefore, a clear requirement for further research into language groups whose needs are obscured in the White Other ethnic category, speaking languages such as Polish, Albanian, German, Spanish, French, Portuguese, Italian, Turkish, Greek, Lithuanian etc. Similarly obscured are the Indian ethnic group who mainly tend to speak Gujarati, Punjabi and Hindi; the Pakistani ethnic group who tend to speak Urdu, Punjabi and the Black African ethnic group which masks the performance of pupils who tend to speak many different languages including English, Yoruba, Somali, Twi‐Fante, French, Igbo, Krio,

39
Tigrinya, Lingala, Arabic, Ga, Swahili, Luganda, Amharic, Portuguese, Shona, German, Fang, Manding, Runyakata, Temne and Zulu etc. to gain a fuller picture of their educational achievements.
There are limitations to this study that should be noted. Previous research suggests that the number of speakers in some of these groups are too small to make any meaningful comparison with other languages (Demie and Hau 2013a; Demie 2012). As a result we have not taken into consideration any language groups with less than 20 speakers. We would argue any conclusions or interpretations drawn from these small cohorts should be made with care, since the performance of a few pupils can significantly weight the overall performance of a group. Despite these limitations, the broad findings of our research are in line with other studies (see Von Ahn et al 2011 and Demie et al 2011, Mitton 2011, Demie and Mclean 2007, Demie and Hau 2012) and offer significant new insight by extending our existing knowledge in the area of ethnicity, language, fluency in English and achievement.
The findings of this study have implications for the collection and use of disaggregated data at national and international level. As highlighted above, the British system of data collection can be considered the most elaborate when it comes to collecting data related to ethnically based statistics. In Britain, census data is considered the most important source of information about schools and is used by Ministers, Parliament, central and local government, pressure groups and the public to monitor government policies and their effectiveness (DfE 2006; Gill and Demie 2011). We have pointed out that accurate and reliable disaggregated ethnic and language data are important to address education inequalities. Such data are important to identify knowledge gaps and develop effective programmes and policies, but the extent to which ethnic and linguistic data is used varies from country to country (Goldscheider 2002; Graves 2011 and Ford 2013). We would argue, as a matter of good practice, government and public institutions need an account of peoples culture, ethnic and linguistic background in formulating national and local policy. While for example some countries such as UK, USA, Australia and Canada recognise the importance of collecting detailed data, many states believe that recognising ethnic and linguistic differences will have a negative and destabilising effect on the country (see Blum 2002, Goldscheider 2002). In some countries, efforts to deny the existence of different ethnic and linguistic groups can stem from the desire to create a homogenised identity in order to maintain national unity (Blum 2002). For example in France ‘it is illegal to include ethnic and language data in official statistics or for Census to include questions about race or origin, ethnic and linguistic background.’ (See Gray 2009:57). But the negative impact of such a policy means some communities are consistently excluded and marginalised with resources remaining in the hands of specific ethnic and linguistic groups. Other researchers highlighted particularly the issues related to the ethnic classification used in census. The census in many countries collects data on ethnicity or language by asking respondents to choose the ethnic group or language they feel best describes them from the list (Gill and Demie 2011). Issues that are hotly debated in the UK and USA include the use of terms such as Black, White, Asian, African, Mixed Race, Other Ethnic Groups and inconsistencies in category descriptions of different communities. Such classification is confusing and inaccurate and hides the real diversities within the country.
There are also other concerns and a growing debate around the need to disaggregate ethnicity and language data. Some governments have been reluctant to detail disaggregated data and have argued a number of reasons related predominately to legal and moral considerations, including privacy of individual data against potential abusers. In countries such as Turkey and France, constitutional provisions and data protection laws have thus been claimed for not articulating data collection on minority groups (Blum 2002, Goldscheider 2002). Furthermore, some governments are reluctant to carry out ethnic and language monitoring to avoiding shedding light on complex problems within the country. Overall, in many countries, there is a lack of relevant disaggregated
40
statistical data which prevents monitoring performance and measuring the effectiveness of government policies.
We would argue that inequality in access in education will not end without detailed disaggregated ethnic and language data and a carefully designed targeted national programme. Detailed disaggregated data by language and ethnic background provides evidence that can be used to design interventions that tackle the root cause of underachievement of different groups in schools. The recommendations from our findings are that if any country is serious about tackling pupil underachievement in schools, they need to recognise first the importance of cultural, ethnic and linguistic diversity. In addition they must collect disaggregated ethnic data and language spoken at home to benefit all groups attending schools. Such data is fundamental in identifying which ethnic and linguistic groups are most at risk of underachievement and to design specific interventions that will be effective in raising achievement, whatever their background.
References
Blum, A. (2002). Resistance to Identity Categorisation in France. In D.I Kertzer and D.Ariel (eds.), Census and Identity: the Politics of Race, Ethnicity, and Language in Censuses (pp. 121‐147). Cambridge, England: Cambridge University press.
Bradbury, A. (2011). Equity, Ethnicity and the Hidden Danger of Contextual Measures of School Performances, Race Ethnicity and Education, Volume 14, Issue 3, March.
Demie, F. and Hau, A. (2013a). The Achievement of Pupils with English as an Additional Language: An empirical study, Research and Statistics Unit, Lambeth LA.
Demie, F. (2013b). English as an Additional Language: How long does it takes to acquire English Fluency, Language and Education, Volume 27, Issue 1.
Demie, F. and Hau, A, Butler, R., Tong, R., Taplin, A. and McDonald, J. (2011). Language Diversity in Schools, Research and Statistics Unit, Lambeth LA.
Demie, F. and Lewis, K. (2011). White Working Class Achievement: An Ethnographic Study of Barriers to Learning in Schools, Educational Studies, Vol. 37 (3), p245‐264.
Demie, F. and Lewis, K. (2010). Raising the Achievement of Portuguese pupils in British schools: a case study of good practice, Educational Studies, Volume 36, Number 1, February 2010 , pp. 95‐109
Demie, F and McLean, C. (2007) The Achievement of African Heritage Pupils: A case study of good practice in British schools, Educational studies, 33:4,45‐434
Demie, F. and Strand, S. (2006). English Language Acquisition and Attainment at the End of Secondary School, Educational Studies, Vol. 32, No. 2, June 2006, pp. 215–231.
Demie, F. (2005). The Achievement of Black Caribbean Pupils in British Schools: Good Practice in Lambeth Schools. British Educational Research Journal, Vol. 31, No. 4, August 2005, pp. 351‐378.
Demie, F. (2003). Using Value‐added Data for School self‐evaluation: A Case Study of Practice in Inner City Schools, School Leadership and Management, Vol. 23, No.4, pp. 445‐467.

41
Demie, F. (2001). Ethnic and Gender Difference in Educational Achievement and Implications for School Improvement Strategies, Educational Research, Vol.43, Number 1, 91‐106.
Demie, F.; Hau, A. (2014). English as an Additional Language in Primary Schools in England Department for Education (DfE 2012). The Statistical First Release: National Curriculum Assessment and GCSE/GNVQ attainment by pupil characteristics, in England, 2012 at http://www.dfes.gov.uk/rsgateway/DB/SFR/s000448/index.shtml Department for Education ( 2011) DfE: Schools, Pupils and their Characteristics, January 2011, http://www.education.gov.uk/rsgateway/DB/SFR/index.shtml Department for Children, Schools and Families (2008a) Raising The Attainment Of Pakistani, Bangladeshi, Somali and Turkish Heritage Pupils: Guidance For Developing Inclusive Practice, (Ref: 00043‐2008BKT‐EN), Nottingham: DCSF. Department for Children, Schools and Families (2008b) Excellence and Enjoyment: Learning and Teaching For Black Children In The Primary Years, (Ref: 00058‐2008BKT‐EN), Nottingham: DCSF. Department for Children, Schools and Families (2009) Breaking the link between special educational needs and low attainment, https://www.education.gov.uk/publications/standard/Specialeducationalneeds/Page1/DCSF‐00213‐2010 Department for Education and Skills (2002) Removing the Barriers: Raising Achievement Levels for Minority Ethnic Pupils Exploring Good Practice, DfES Publications.0001/2002. Department for Education and Skills (2004a) Aim High: Supporting the Use of Ethnic Minority Grant,DfE. Department for Education and Skills (2004b) Aiming High: Understanding the Educational Needs of Minority Ethnic Pupils in Mainly White Schools: A Guide to Good Practice, Nottingham: DfES. Department for Education and Skills (2005) Ethnicity and Education: The Evidence on Minority Ethnic Pupils aged 5‐16, London: DfES. Department for Education and Skills (2006) Ethnicity and Education: The Evidence on Minority Ethnic Pupils aged 5‐16, London: DfES. DfE (2016a). Schools National Funding Formula, March https://consult.education.gov.uk/funding‐policy‐unit/schools‐national‐funding‐formula/supporting_documents/Schools_NFF_consultation.pdf DfE (2016b). National tables: SFR 01/2016’‐ Characteristics Summary https://www.gov.uk/government/statistics/revised‐gcse‐and‐equivalent‐results‐in‐england‐2014‐to‐2015 DfE (2015). ‘National tables: SFR47/2015’‐ Summary https://www.gov.uk/government/statistics/national‐curriculum‐assessments‐at‐key‐stage‐2‐2015‐revised

42
Dustann, C., Machin, S. and Schonberg (2010). Ethnicity and Educational Achievement in Compulsory Schooling, The Economic Journal, 120, F272‐F297.
Ford, M. (2013). Achievement Gaps in Australia: What NAPLAN Reveals about Education Inequality in Australia, Race Ethnicity and Education,Volume 16, Issue 1.
Gillborn, D. (2005) Education as an act of white supremacy: Whiteness, critical race theory and educational reform, Journal of Education Policy, 20 (4): 485‐505.
Gillborn, D. (2002) Education and Institutional Racism, London: Institute of Education.
Gillborn, D. and Youdell, D. (2000). Rationing Education: Policy, Practice, Reform And Equity, Buckinghamshire: Open University Press
Gillborn, D. and Mirza, H. S. (2000). Educational Inequality. Mapping Race, Class and Attainment, London: Ofsted.
Gillborn, D. and Gipps, C. (1996). Recent Research on the achievement of ethnic minority pupils, OFSTED Reviews of Research, HMSO, London.
Gill, B. and Demie, F. (2011). The White Paper Teaching and Learning and Accountability: Implications for data on ethnicity and English as Additional Language, Race Equality Teaching, Spring.
Goldscheider, C. (2002). Ethnic categorisation in censuses: comparative observations from Israel, Canada and the United States. In D.I Kertzer and D.Ariel (eds.), Census and identity: the politics of race, ethnicity, and language in censuses (pp. 71‐91). Cambridge, England: Cambridge University press.
Gray, Z. (2009). The importance of ethnic data for promoting the right for education, in Minority Rights Groups International (eds.) The state of the World’s minorities and indigenous peoples, p.57.
Graves, S. (2011). School and Child Level Predictors of Academic Success for African American Children in Third Grade: Implications for No Child Left Behind, Race Ethnicity and Education, Volume 14, Issue 5, April.
Leedham, D. (2016). EAL Learners in Schools: How the Government could Help, Schools Week, 23 April
http://schoolsweek.co.uk/eal‐learners‐in‐schools‐how‐the‐government‐could‐help/?utm_content=buffer5a4af&utm_medium=social&utm_source=twitter.com&utm_campaign=buffer (accessed 24 April 2016)
Office for Standards in Education (2002a) Achievement of Black Caribbean Pupils: Three Successful Primary Schools, London: Ofsted (HMI447).
Office for Standards in Education (2002b) Achievement of Black Caribbean Pupils: Good Practice in Secondary Schools: Ofsted (HMI448).
Mitton, L (2011) The Languages of Black Africans in England, Journal of Intercultural Studies 32(2), 151‐172.
Mortimore, P. ;Sammons, P.; Stoll, L.; Lewis, D and Ecob, R. (1988). School matters: The Junior Years, Sommerset, Open Books.

43
NALDIC (2011). Language in schools, National Association for Language Development in Curriculum, http://www.naldic.org.uk/research‐and‐information/eal‐statistics/lang
NALDIC (2005) Promoting EAL Teacher Professionalism http://www.naldic.org.uk/Resources/NALDIC/Home/Documents/PromotingEALTeacherProfessionalism.pdf
Parekh, B. (2000). The Future of Multi‐Ethnic Britain: Report of the Commission on the Future of Multi‐Ethnic Britain, Profile Books.
Rampton Report (1981). West Indian Children in our Schools. Interim report of the Committee of Inquiry into the Education of Children from Ethnic Minority Groups. London: Her Majesty's Stationery Office.
Smith, D. and Tomlinson, S. (1989). The School Effect: A study of multi‐social comprehensive, Exter, Policy Studies Institute.
Strand, S., Malmberg, L. and Hall, J. (2015). English as an Additional Language (EAL) and educational achievement in England: An analysis of the National Pupil Database, University of Oxford, Department of Education https://www.unboundphilanthropy.org/sites/default/files/EAL_and_educational_achievement2_0.pdf
Strand, S. (2014). Ethnicity, Gender, Social Class and Achievement Gaps at Age 16: Intersectionality and ‘Getting it’ for the white working class, Research Papers in Education, Vol. 29, No.2, 131‐171.
Strand, S. (2012) ‘The White British‐Black Caribbean Achievement Gap: Tests, tiers and teacher expectations’, British Educational Research Journal. British Educational Research Journal, Vol. 38, 1, p 75‐101.
Strand, S. (2010) ‘Do some schools narrow the gap? Differential school effectiveness by ethnicity, gender, poverty and prior attainment’, School Effectiveness and School Improvement, Vol. 21, No.3, 89–314.
Strand, S and Demie, F. (2005). English Language Acquisition and Attainment at the End of Primary School, Educational Studies, Vol. 13, No.3, 275‐291.
Strand, S. (1999), ‘Ethnic Group, Sex and Economic Disadvantage: Associations with pupils’ educational progress from baseline to the end of Key Stage 1’, British Educational Research Journal, Vol. 25, No. 2, pp. 179–202.
Swann, Lord (1985) Education For All: Final Report Of The Committee Of Inquiry Into The Education Of Children From Ethnic Minority Groups, cmnd 9453, London: HMSO.
Von Ahn, M., Lupton, R., Greenwood, C., & Wiggins, R. (2010). Languages, Ethnicity, Education in London London: Department of Quantitative Social Science, Institute of Education.
Von Ahn, M., Wiggins, R., Sanderson, A., Mayhew, L., & Eversley, J. (2011). Using School Census Language Data to Understand Language Distribution and Links to Ethnicity, Socio‐economic Status and Educational Attainment: a guide for local authority users. London: Department of Quantitative Social Science, Institute of Education.

44
Appendix A
Achievement of Languages Spoken Nationally at KS2 2014
Language No. of pupils
% Pupils Achieving RWM Level 4+
Language No. of pupils
% Pupils Achieving RWM Level 4+
English 453528 79.3% Amharic 182 85.7%Panjabi 11916 75.0% Konkani 168 82.7%Urdu 11703 77.3% Telugu 162 96.3%Bengali 9234 81.4% Korean 142 86.6%Polish 5578 72.7% Swedish 133 87.2%Somali 4179 76.4% Ndebele 130 73.8%Arabic 3889 77.0% Hebrew 125 89.6%Gujarati 3773 85.8% Afrikaans 116 78.4%Tamil 2714 89.2% Malay/Indonesian 116 85.3%Portuguese 2464 68.1% Hindko 115 75.7%French 2381 79.7% Wolof 107 67.3%Turkish 2037 70.8% Krio 107 75.7%Spanish 1657 79.3% Katchi 101 83.2%Yoruba 1605 84.9% Ga 96 81.3%Chinese 1515 88.3% Marathi 95 93.7%Tagalog/Filipino 1271 88.7% Caribbean Creole French 94 78.7%Albanian/Shqip 1220 83.3% Danish 81 88.9%Lithuanian 1160 65.8% Ukrainian 68 88.2%Pashto/Pakhto 1159 72.8% Edo/Bini 59 79.7%Persian/Farsi 1157 78.5% Hausa 58 81.0%Akan/Twi‐Fante 1088 80.2% Ebira 54 77.8%Romanian 1029 62.3% Manding/Malinke 53 56.6%Malayalam 934 92.3% Kashmiri 50 82.0%Italian 905 80.2% Romany/English Romanes 48 41.7%Hindi 881 90.8% Romani (International) 46 15.2%Russian 839 75.4% Fijian 46 67.4%Slovak 794 30.9% Fula/Fulfulde‐Pulaar 45 68.9%Swahili/Kiswahili 658 80.5% Zulu 45 86.7%Nepali 627 86.3% Kannada 43 97.7%German 584 88.7% Mauritian/Seychelles Creole 42 69.0%Shona 578 73.4% Norwegian 39 89.7%Czech 487 38.8% Ewe 37 83.8%Kurdish 475 73.1% Finnish 37 86.5%Latvian 460 61.5% Burmese/Myanma 35 71.4%Lingala 426 61.7% Armenian 29 86.2%Hungarian 415 65.3% Welsh/Cymraeg 29 86.2%Igbo 403 85.6% Chichewa/Nyanja 28 71.4%Bulgarian 383 73.1% Guarani 28 78.6%Greek 367 83.4% Kikuyu/Gikuyu 27 70.4%Dutch/Flemish 365 79.5% Acholi 24 83.3%Vietnamese 300 86.7% Macedonian 24 83.3%Tigrinya 298 79.9% Visayan/Bisaya 24 91.7%Thai 293 67.9% Estonian 23 82.6%Pahari (Pakistan) 283 68.6% Urhobo‐Isoko 23 95.7%Serbian/Croatian/Bosnian 260 78.1% Oromo 22 72.7%Caribbean Creole English 246 74.0% Slovenian 21 47.6%Sinhala 233 91.8% Gaelic/Irish 20 60.0%Japanese 206 88.3% Other/Refused/Unclassified 8620 Luganda 195 80.5% Total 550969

Published by: Schools' Research and Statistics Education and Learning Canterbury Crescent Brixton SW9 7QE
www.lambeth.gov.uk/rsu
© Lambeth Council. All rights reserved. June 2016 ISBN: 978-1-910428-13-9