Embed Size (px)
Citation preview

UMTRI-98-50
LANE MARKINGS IN NIGHT DRIVING:A REVIEW OF PAST RESEARCH
AND OF THE PRESENT SITUATION
Kåre RumarDelbert K. Marsh II
November 1998

LANE MARKINGS IN NIGHT DRIVING:A REVIEW OF PAST RESEARCH AND OF THE PRESENT SITUATION
Kåre RumarDelbert K. Marsh II
The University of MichiganTransportation Research Institute
Ann Arbor, Michigan 48109-2150U.S.A.
Report No. UMTRI-98-50November 1998

i
Technical Report Documentation Page1. Report No.
UMTRI-98-502. Government Accession No. 3. Recipient’s Catalog No.
4. Title and Subtitle
Lane Markings in Night Driving: A Review of Past Research5. Report Date
November 1998and of the Present Situation 6. Performing Organization Code
3027537. Author(s)
Rumar, K. and Marsh, II, D.K.8. Performing Organization Report No.
UMTRI-98-509. Performing Organization Name and Address
The University of Michigan10. Work Unit no. (TRAIS)
Transportation Research Institute2901 Baxter RoadAnn Arbor, Michigan 48109-2150 U.S.A.
11. Contract or Grant No.
12. Sponsoring Agency Name and Address
The University of Michigan13. Type of Report and Period Covered
Industry Affiliation Program forHuman Factors in Transportation Safety
14. Sponsoring Agency Code
15. Supplementary Notes
The Affiliation Program currently includes Adac Plastics, BMW, Bosch, Britax International,Corning, DaimlerChrysler, Denso, Ford, GE, GM NAO Safety Center, Guide Corporation,Hella, Hewlett-Packard, Ichikoh Industries, Koito Manufacturing, LESCOA, Libbey-Owens-Ford, Magneti Marelli, North American Lighting, Osram Sylvania, Philips Lighting, PPGIndustries, Reflexite, Reitter & Schefenacker, Stanley Electric, Stimsonite, TEXTRONAutomotive, Valeo, Visteon, Wagner Lighting, 3M Personal Safety Products, and 3M TrafficControl Materials.Information about the Affiliation Program is available at: http://www.umich.edu/~industry/16. Abstract
One of the basic driver tasks is to follow the road. In daytime driving, when the visibilityof the road in clear weather is unobstructed, this is normally not a problem. However, whendriving at night on dark roads with low beams, it is often quite difficult to see the direction theroad is taking. Indeed, drivers state that poor road guidance is their main problem in nightdriving. To overcome this problem, roads are fitted with retroreflective pavement markings,which are visible in night driving.
This study was conducted to review the role, effects, and functioning of lane marking innight driving. The report consists of five sections. Section 1 details the scope and thelimitations of this report. Section 2 presents a discussion of drivers’ needs for road guidanceby means of pavement markers in general and lane markings in particular. Section 3 reviewsthe voluminous previous research on lane markings, focusing primarily on visibility andphotometric characteristics of lane markings in night driving. Section 4 provides a summary ofthe issues related to lane markings. Section 5 presents the general conclusions and proposalsfor research topics and technical developments.
The overall conclusion is that while drivers need both long-range guidance (a preview timeof at least 5 s) and short-range guidance (a preview time of up to 3 s), present pavementmarkings often offer only short-range road guidance, especially in wet road conditions.Despite the extensive past research on pavement markings, many general and specificquestions remain to be answered.17. Key Words
lane marking, pavement marking, road guidance, safety,driver needs, night visibility, retroreflectance, photometry, wetroads, durability
18. Distribution Statement
Unlimited
19. Security Classification (of this report)
None20. Security Classification (of this page)
None21. No. of Pages
8922. Price

ii
ACKNOWLEDGMENTS
Appreciation is extended to the members of the University of Michigan Industry Affiliation
Program for Human Factors in Transportation Safety for support of this research. The current
members of the Program are:
Adac Plastics
BMW
Bosch
Britax International
Corning
DaimlerChrysler
Denso
Ford
GE
GM NAO Safety Center
Guide Corporation
Hella
Hewlett-Packard
Ichikoh Industries
Koito Manufacturing
LESCOA
Libbey-Owens-Ford
Magneti Marelli
North American Lighting
Osram Sylvania
Philips Lighting
PPG Industries
Reflexite
Reitter & Schefenacker
Stanley Electric
Stimsonite
TEXTRON Automotive
Valeo
Visteon
Wagner Lighting
3M Personal Safety Products
3M Traffic Control Materials

iii
EXECUTIVE SUMMARY
One of the basic driver tasks is to follow the road. In daytime driving, when the visibility of
the road in clear weather is unobstructed, this is normally not a problem. However, when driving at
night on dark roads with low beams, it is often quite difficult to see the direction the road is taking.
Indeed, drivers state that poor road guidance is their main problem in night driving. This view is
supported by accident statistics showing single vehicle accidents (running off the road) to be
overrepresented in night traffic.
To overcome this problem roads are fitted with retroreflective pavement markings, which are
visible in night driving. This study was designed to review the role, effects, and functioning of lane
markings in night driving. Section 1 further details the scope and the limitations of this report.
Drivers’ needs for road guidance should be the basis for the design of pavement markings.
Consequently, in Section 2 the road guidance needs are analyzed based on existing driver models
and on basic driver characteristics. It is concluded that drivers need road guidance and give this
need very high priority. An effective lane marking provides a preview time of at least 5 s, which
corresponds to about 140 m at a speed of 100 km/h. In daytime, both long-range guidance (at least
5 s of preview time) as well as short-range guidance (less than 3 s of preview time) are provided.
Long-range guidance is generally carried out with central vision and it is performed only
intermittently. Short-range guidance is carried out primarily unconsciously, continuously, and by
peripheral vision. In night driving, however, drivers are often forced by poor visibility to forgo
long-range visual guidance, and drive with the use of short-range guidance only. In such
conditions, this sometimes has to be done with central vision, consciously, rather frequently, and
presumably with considerable mental effort.
In Section 3, previous studies on pavement markings are reviewed. Specific attention is
given to the measurement of the photometric properties of pavement markings because the
photometric properties are critical for visibility. Studies of the general impact of lane markings on
road accidents are reviewed. The conclusion is that good lane markings improve road safety.
However, the effects are smaller than expected, except for combinations of marking systems (e.g.,
edgelines with centerlines and side-post delineators), which have substantial accident-reduction
effects.
The presence and nature of lane markings affect drivers’ choice of speed and lateral
position. However, the results concerning speed changes are inconsistent. While some studies
report a reduction, most report a slight increase in speed as a consequence of improved lane
markings. A limited number of well-controlled subjective and objective visibility measurements of
lane markings have been carried out. The results are summarized in tables showing that the
visibility distances in night driving are normally considerably shorter than the safety criterion

iv
chosen (140 m). The worst situation tested involved wet roads. The visibility distance of lane
markings tends to be approximately proportional to the logarithm of the retroreflected luminance.
The effects of other lane-marking characteristics (such as color and width) are also described.
The effects of various road, vehicle, and driver parameters are discussed. Concerning the
road conditions, the main effects come from wear and weather. The effects of vehicle type and
beam pattern on lane-marking visibility have not received much previous attention. There is
evidence that older drivers and impaired drivers would benefit more from improved lane markings
than would the average driver. Finally, durability, maintenance, cost, and photometric requirements
and standards are briefly discussed.
Section 4 summarizes the main issues that have emerged from this review and presents
suggestions for future research. In Section 5, the general conclusions are made, and proposals for
research topics and technical developments are listed.
The overall conclusion is that while drivers need both long-range and short-range road
guidance, present pavement markings often offer only short-range road guidance at night, especially
in wet-road conditions.

v
CONTENTS
ACKNOWLEDGMENTS...............................................................................................................ii
EXECUTIVE SUMMARY..............................................................................................................iii
1. THE MAIN GOAL AND LIMITATIONS OF THIS STUDY...................................................1
2. DRIVER NEEDS—THE PURPOSE OF LANE MARKINGS.................................................2
2.1 Driver models ................................................................................................................32.2 Driver characteristics......................................................................................................62.3 Conclusions...................................................................................................................9
3. REVIEW OF EXISTING STUDIES........................................................................................11
3.1 Pavement marking technology .....................................................................................113.2 Photometric measurements ..........................................................................................12
3.2.1 Measurement of retroreflective properties.....................................................133.2.2 Field measurements of the coefficient of retroreflected luminance................153.2.3 Raised pavement markers..............................................................................17
3.3 General impact of lane markings on safety and other traffic goals...............................183.4 Behavioral effects of lane markings .............................................................................22
3.4.1 Driver behavior changes on straight sections of road....................................233.4.2 Driver behaviorial changes in curves.............................................................253.4.3 Conclusions..................................................................................................26
3.5 Visibility of lane markings...........................................................................................263.5.1 Subjective Evaluations...................................................................................263.5.2 Objective visibility measurements .................................................................283.5.3 Theoretical and laboratory studies, and models.............................................323.5.4 Relationship between photometric values and visibility.................................343.5.5 Conclusions..................................................................................................36
3.6 Design characteristics of lane markings.......................................................................363.6.1 Color of pavement markings.........................................................................373.6.2 Line width.....................................................................................................383.6.3 Solid versus dashed lines..............................................................................393.6.4 Line length and line gap configuration..........................................................393.6.5 Single versus double lines.............................................................................403.6.6 Conclusions..................................................................................................40
3.7 Road and weather conditions .......................................................................................413.7.1 Wear and dirt................................................................................................413.7.2 Rain and water ..............................................................................................423.7.3 Fog and dew .................................................................................................433.7.4 Snow and frost..............................................................................................433.7.5 Conclusions..................................................................................................44
3.8 Vehicle and vehicle lighting..........................................................................................443.9 Driver condition...........................................................................................................46
3.9.1 Older drivers.................................................................................................463.9.2 Driving under the influence...........................................................................473.9.3 Degraded visual performance........................................................................473.9.4 Fatigue and distraction..................................................................................48
3.10 Friction, noise and other performance factors of lane markings.................................483.11 Durability, maintenance, and costs of markings .........................................................483.12 Regulations and standards .........................................................................................51

vi
4. SUMMARY OF MAJOR ISSUES AND SUGGESTIONS FOR FUTURE RESEARCH.....54
4.1 Which criteria should be used to evaluate pavement markings? ...................................544.2 Is there a need for improved visual guidance at night? .................................................554.3 Are there both long- and short-range road guidance?...................................................564.4 The gap between driver visual needs and lane-marking performance ...........................564.5 Difference between dry and wet lane-marking performance.........................................574.6 The relation between retroreflective properties and visibility ........................................584.7 Computational models of marking visibility.................................................................584.8 Minimum reflective performance of lane markings......................................................594.9 Color, dimensions, and configuration of lane markings ...............................................614.10 Combinations of various marking principles..............................................................614.11 Flat versus profiled lane markings .............................................................................624.12 Line versus spot marking of lanes..............................................................................624.13 Lane markings on straight roads and on curves .........................................................634.14 Vehicle aspects of lane markings ...............................................................................634.15 Lane marking for special road-user categories...........................................................644.16 New lane-marking concepts.......................................................................................644.17 Marking durability, maintenance, and costs................................................................654.18 Development of a U.S. standard for photometric requirements..................................654.19 International harmonization of photometric testing and requirements ........................654.20 Conclusions...............................................................................................................65
5. CONCLUSIONS AND RECOMMENDATIONS ..................................................................66
5.1 The present situation and the need for improved lane markings at night ......................665.2 Present standards and recommendations concerning lane markings ............................675.3 The need for further research on pavement markings...................................................68
5.3.1 General research questions and topics concerning pavement markings.........685.3.2 Specific research needs concerning lane markings........................................69
5.4 The need for further technical improvement.................................................................705.4.1 General technical improvement needs ...........................................................705.4.2 Specific technical development needs............................................................70
5.5 Concluding comments .................................................................................................70
REFERENCES...............................................................................................................................71

1
1. THE MAIN GOAL AND LIMITATIONS OF THIS STUDY
The main goal of this study is to review how driver needs for road guidance (to predict the course
of the road, select the appropriate vehicle position on the road, and select adequate speed) are met. This
report deals mostly with permanent, horizontal, lane markings (solid and dashed lines, and raised pavement
markers) in reduced visibility conditions. Urban and illuminated areas are not covered, nor are temporary
markings or roadway signs (except when interacting with permanent horizontal markings). The traffic
control purposes and the symbolic aspects of the pavement markings are also not treated. Additionally,
little attention is given to pavement markings under daylight conditions.
A summary of the major lane-marking issues will be provided. The main problems with present
lane markings in night driving will be pointed out and recommendations for further research on lane
marking will be made.

2
2. DRIVER NEEDS—THE PURPOSE OF LANE MARKINGS
The earliest reported use of painted line markings to divide traffic streams was in Michigan in 1911.
In Wayne County, the commissioner initially painted white centerline markings in curves and bridges. He
later extended their use to the entire highway. Prior to this, white stones had been placed in the center of
the road, which at that time mainly consisted of gravel (OECD, 1975).
In traffic engineering terms the reason for having pavement markings are as follows:
• To guide the driver by indicating the course of the road and marking the road in relation to the
surrounding areas.
• To warn the road users about special or hazardous events or locations related to the course of
the road.
• To restrict the access to certain lanes (e.g., for special purposes only, car-pooling, or
overtaking).
• To supplement and support information given by road signs and signals.
In this report we are mostly concerned with the first of these reasons, to guide the driver. The first
question to be answered should then be: What needs do drivers have that can be helped by means of
pavement markings to ensure accurate perception of the course of the road? The report will address lane
markings in general and then focus on the more specific problems of lane markings in night driving.
In the search for relevant literature, three earlier general reviews have been located (OECD, 1975;
Schreuder, 1986; and CIE, 1988). This report relies extensively on these reviews. However, so much has
happened concerning pavement-marking research and technology during the last ten years that these
reports are, to a large extent, not current with respect to more technical discussions of lane markings.
COST, a European scientific cooperative within the transportation industries has been conducting a series
of studies entitled, “Requirements for Pavement Markings.” This project is planned for completion at the
end of 1998, and the final reports on the various studies are not yet publicly available. However, a number
of interim reports have been provided to us.
Driver needs for lane markings should be based on the tasks they perform and the effort required to
carry out these tasks. Drivers consider the marking of road geometry and lane boundaries to be important
elements that determine the difficulty of night driving (Walraven, 1980; and Padmos, 1985). Driver tasks
traditionally associated with lane delineation and markings of roadway edge boundaries are lateral
positioning, correct heading, and course changes (CIE, 1992). When lane markings fulfill driver needs,
then they serve a purpose. If not, then they are little more than a legal measure intended to protect the
authorities from liability.
This section addresses driver needs on the basis of driver models and specific driver characteristics.
The first part reviews existing relevant driver models. The second part deals with other driver
characteristics of possible relevance to the purpose and effect of lane markings. Finally, a number of
conclusions about driver needs are stated.
3
2.1 Driver models
A useful driver model would make it possible to predict the behavioral effects of various changes in
road, vehicle, and traffic parameters. However, no one model has reached general acceptance. The validity
of existing models is often heavily contingent upon the purpose for which they were developed. Therefore
any behavioral predictions based on existing driver models are risky. We would like to find a model
suitable to describe the behavior of drivers, and in doing so better understand how lane marking can be
used to aid the driver.
The oldest driver-performance model (Gibson and Crooks, 1938) has the distinction of being the
only perceptually based model. It has an appealing simplicity because it integrates the vast number of
driver tasks into two major tasks, instead of dividing the tasks into a large number of subtasks, as most
models have done since then. The two major driver tasks according to Gibson and Crooks are:
• To create an area of safe driving in front of the vehicle.
• To decide upon a minimum stopping distance within this area of safe driving.
Lane markings, according to Gibson’s concept of human orientation in space (Gibson, 1986),
should support and enhance the visual flow over the retina, thereby facilitating perception of one’s position,
course, and speed along the road. During clear daylight the flow over the retina is rich. There are
numerous stimuli extending for long distances in front of the vehicle that indicate the border of the road.
Therefore, in clear daylight conditions, the effect of lane markings on driver orientation and guidance is of
minor importance, as the information presented by lane markings is redundant with other visual stimuli.
During daylight the lane markings are mainly perceived in peripheral vision and are used unconsciously
(Blaauw and Riemersma, 1975).
According to Gibson (1986), the visual flow over the retina is what determines the driver’s course
and lateral position on the road. Riemersma (1985) showed that course selection is determined by the time
derivative of the heading angle, and not by the heading angle or the lateral distance. According to
Schreuder (1986), this means that the information needed to maintain course and lateral position must be
collected centrally, not peripherally. We do not accept that conclusion. Rather, we support the Gibson
theory that the driving course in daytime driving is decided mainly by the visual flow over the retina, which
is accomplished by peripheral vision.
Riemersma (1985) carried out his studies of driver choice of course on a straight road. Curves
represent a different situation. With curves, the main perceptual problem occurs before the curve where the
driver has to predict the curvature and arch length of the curve (Schreuder, 1986). In daytime, lane
markings add little to overcome this perceptual difficulty. When in the curve, the driver’s way of deciding
lateral position is very much the same as on straight roads. Eye fixation studies, however, indicate that,
unlike straight segments of road where information acquisition is accomplished by peripheral visual
processes, in curves drivers rely also on central visual processes (Nygaard, 1977).
On the other hand, in night driving, and in other poor visibility conditions, most of the distant and
peripheral stimuli that would otherwise offer orientation are not visible. Additionally, the visibility of the

4
pavement markings are seriously reduced both ahead and in the periphery. In glare situations, pavement
markings are sometimes the only stimuli the driver has available to guide the vehicle and allow lateral
position to be maintained. As a result, drivers often fixate on the markings, and thus the markings are
perceived in central vision and used consciously. Rockwell, Ernst, and Rulon (1970) showed that at night
with oncoming vehicles, the center of drivers’ fixation patterns move to the near right where the edgelines
are.
Perhaps pavement markings fill the same purpose as handrails do in staircases. Handrails are often
not used except when a person gets into trouble. Then the handrails offer excellent support. Some night
traffic situations are difficult for many drivers. In such cases, available lane markings offer excellent
support comparable to handrails in staircases.
In Gibson’s terms, lane markings should influence drivers’ ability to lay out the area of safe driving
in front of the vehicle and influence driver perception of position on the road, and selections of the course
and speed. For speed perception, dashed markings have advantages over solid markings because they are
superior in providing additional speed cues.
In line with Gibson’s thinking of ecological stimuli, some ideas from Gestalt psychology could be
relevant. An important task of the lane markers is probably to create what the Gestalt psychologists call a
good curve. A good curve does not have to be solid. Indeed, it might be based on a number of spots.
However, the perceived gaps between the elements in the curve must not be too large.
Another driver model was developed by Michon (1971). Michon divided driving tasks into three
levels: strategic, maneuvering, and control. This model was later modified by Janssen (1979) and it has
become the most commonly used driver model. The three task levels were revised as follows:
• Strategic tasks (planning - conscious - minutes)
• Tactical tasks (maneuvering - sometimes conscious, sometimes unconscious - seconds)
• Operational tasks (handling - normally unconscious and automatic - milliseconds)
In terms of this model, lane markings should facilitate primarily the operational tasks, but should
also influence the tactical tasks, especially when the lane markings contain symbolic information, such as a
no-passing line. The transition from daylight to night also means that the task moves from operational to
more conscious and tactical. The more the driver is required to centrally fixate on the lane markings, the
more tactical the task is likely to be.
Rumar (1986) developed a task-oriented driver model along the lines indicated by Michon, but
divided the tactical tasks into a number of separate activities. Another basic concept in Rumar’s model is
the self-paced character of the driving task. The difficulty of the driving task varies for many reasons (e.g.,
road, traffic, and vehicle conditions), and thus the demand on the driver is also continuously changing. The
primary way a driver regulates this varying demand in a given situation is by choice of speed. If the
situation becomes too difficult the driver can decrease speed. Likewise, if the situation is too simple the
driver might increase speed to regulate the cognitive and perceptual demand. That is why the driving task,
as defined by Rumar, is considered to be self-paced. Admittedly, there are other, less efficient, means for

5
drivers to control their mental load (e.g., by increasing headway or by choosing a position closer to the
roadside).
The Rumar model has eight tasks:
• Planning the trip (mode, time, route, etc.). This task is mainly carried out before the trip.
• Navigating to find the planned route.
• Maintaining track along the road and avoiding stationary obstacles.
• Interacting with other road users without collision (overtaking, lane changing, etc.).
• Following the signed and unsigned rules and legislation (speed limits, stop signs, headway, lane
position, etc.).
• Managing nondriving tasks (radio, climate, telephone, etc.).
• Handling the car (steering, braking, accelerating, etc.).
• Choosing a speed as a consequence of the demands from all these tasks.
In terms of this model, the lane markings should reduce the demand from the task to maintain track
along the road. The demand from this task is likely not high in clear, daylight driving. However, at night
and during reduced visibility, the mental load from this task will grow.
From this discussion follows another conclusion. If the lane markings are so effective that they
considerably reduce the mental load and attention required to follow the road smoothly in night driving,
drivers may react by increasing their speed. This type of behavioral adjustment shows up in many driving
situations, and was one of the reasons behind the development of the risk homeostasis theory (Wilde,
1982).
Following a road can be characterized as a tracking task. This is consistent with a driver model
presented by McRuer and Krendel (1959) which focused on the successive organization of perception.
They distinguish between three levels of control (from low to high): compensatory behavior, pursuit
behavior, and precognitive behavior.
Compensatory behavior is an attempt to reduce the errors between desired and actual vehicle
motions, a pattern typically shown by the beginner driver. Drivers will carry out their tasks at a higher
control level as they acquire skills. The higher processes require early information so that veridical
predictions can be made. Thus, during clear daylight driving, experienced drivers follow the road by
pursuit or precognitive behavior. At night, when visibility and road guidance is considerably reduced,
however, they are often forced to regress to only compensatory behavior.
According to Good and Baxter (1985), it is logical to separate short-range delineation (used by
drivers during night and in other reduced visibility conditions) from long-range delineation (used together
with short-range guidance in good visibility conditions). The transition between short-range and long-
range road guidance is not distinct, as it depends on a number of factors (e.g., speed).
Good and Baxter (1985) conducted studies based on the theory of McRuer and Krendel (1959).
They found theoretical and empirical evidence for a fundamental difference between long-range and short-
range road guidance. For example, painted white lines were found to be good for short-range guidance but
not for long-range guidance, while post-mounted delineators were found to be good for long-range

6
guidance but not for short-range guidance. The concept of two separate road-guidance functions should be
further studied.
2.2 Driver characteristics
For the purpose of this section, driver characteristics will refer to the characteristics of driver
behavior that have not been emphasized in the comprehensive models discussed in the previous section. We
will briefly discuss a few characteristics that are believed to be relevant for lane markings.
In common use, information is attributed to objects intended to convey a message (e.g., a road sign
or a pavement marking). However, the formal definition of information is mainly related to the receiver and
not to the source. It is a message that reduces uncertainty for the receiver. In other words, a particular
pavement marking or road sign could contain information that is useful to one driver but not to another.
For instance, a lane marking does not provide information to drivers who are clear about their position, but
it is crucial information to drivers who are not sure about their position. A lane marking in itself is not
necessarily information.
Common sense tells us that the road is important to drivers. There is reason to believe that the road
is a priority element among the number of information sources that are available to drivers. Support for
such an argument is found in the Gibson and Rumar models previously discussed. Experimental evidence
was presented by Johansson and Backlund (1968) in their study of drivers’ capacity to register information
from road signs. They found that as driving conditions were successively degraded (e.g., snow, rain, fog,
slippery road) the drivers missed more and more of the information that was less important to the
immediate driving task of vehicle navigation. For example, first to disappear from driver perception were
general warning signs, then speed limit signs, and then finally warning signs related to the road. Also,
drivers were less likely to notice other road users when driving conditions were degraded. However, the
perception of the road itself was always maintained.
Padmos (1985), Walraven (1980), and Walton (1975) studied what drivers considered to be critical
elements in night driving. All three studies yielded essentially the same results. The elements that drivers
considered to be most critical dealt with the course of the road and other geometrical road characteristics
(e.g., lane and edge boundaries, curb delineation). Because the road is a priority stimulus for drivers, it
should be enhanced by means of pavement markers to provide drivers with information that is considered
important to them.
Feedback is very important for learning and developing skills, such as driving. Drivers should be
informed whether their predictions and behaviors are correct or not. Pavement markings could improve the
feedback to drivers concerning their predictions of the course of the road. Another important concept is
feed forward. Drivers cannot just react to what is happening in their immediate vicinity. To do so would
result in driving that is far from the smooth driving we try to achieve. Drivers have to predict what will
happen in front or behind their vehicles and to behave or prepare their behavior on the basis of such

7
predictions. The richer the stimuli in front of them, the easier it is to make accurate predictions (Gibson,
1986).
Consequently, driver predictions are likely to be more accurate in clear daytime driving than they are
in nighttime driving or in bad visibility conditions. In night traffic the available information sources are
seriously reduced both in quantity and in quality, both ahead and along the sides. At night, adequate
pavement markings should facilitate driver predictions of the course of the road ahead.
In clear daytime driving, experienced drivers tend to fixate several hundred meters in front of the
vehicle, close to the point of infinity. It seems to be an unconscious attempt to reduce the probability of an
unexpected event. In night driving, this fixation pattern has to change. There is nothing visible far away to
fixate upon. Rockwell, Ernst, and Rulon (1970) showed that in night driving the fixation pattern moves
much closer to the vehicle and slightly to the right hand side. This change is forced by the circumstances
and is an illustration of the need for better pavement markings to accommodate drivers at night.
The farther away the route of the road can be recognized, the better are the predictions, thus
resulting in easier driving. Again this should be no problem in clear daytime driving. At night, however, it
poses many problems. Making lane markings visible from long distances in night traffic would facilitate
driver predictions about the course of the road and thereby also facilitate the driving task.
According to Schmidt-Clausen and Damasky (1994), a majority of the pavement markings on two-
lane roads appear between 7° to the left and to the right and about 1° down in the visual field. This is
something that the light distribution of the headlamps should take into account. Pavement-marking
visibility could be additionally enhanced by a vehicle lighting system that is better suited for that purpose.
It is more appropriate to discuss preview requirements in terms of time rather than distance, because
the importance of time is more independent from vehicle speed. Weir and McRuer (1968) found that a
preview time of 5 s offered a smooth and proper anticipatory steering behavior. In a later study Allen,
O’Hanlon, and McRuer (1977) investigated the fixation points of drivers and found that they were 3 to 4 s
ahead of the present position. Helmers (1978) suggests 4 to 10 s preview time for safe travel. Godthelp
and Riemersma (1982) found that a minimum of 5 s of preview time is necessary for safe steering when the
road is not straight. CIE (1988) suggests a 3 to 5 s preview time, but longer when approaching curves.
CIE (1992) suggests a minimum of 5 s for long-range preview time. McGee, Moore, Knapp, and Sander
(1978) found that drivers needed between 6 and 10 s to detect the necessity to change lanes and decide
what course of action was appropriate.
In terms of driver brake reaction time, Johansson and Rumar (1971) found that in surprise
situations a 2 s time is common. In modern traffic engineering literature a 1 s simple reaction time is often
a standard.
These results suggest that a 2 s preview time is too short for road guidance, since it is adequate only
for a simple braking reaction. We are not interested in just simple braking reaction time, because in road
guidance there is uncertainty as to what the adequate response should be. Steering and avoidance
maneuvers require decision time, and drivers need to identify what they see. A more realistic preview time
8
for long-range visual guidance appears to be 5 s, with 3 s as an absolute minimum preview time. At a speed
of 100 km/h, 5 s would yield a preview distance of 140 m and 3 s would yield 84 m.
Andersson and Nilsson (1978) have shown that the risk of a single-vehicle accident (running off
the road) in daytime is independent of the geometric standard of the road (expressed as average sight
distance). However, in night driving, the single-vehicle accident risk increases proportionately with the
decrease of average geometric sight distance. This is an indication of the importance of longer preview
times.
Maximum visibility is the most important requirement of lane markings. However, there should
also be a minimum distance at which the driver should be able to detect and identify pavement markings.
We know that under poor visibility conditions (e.g., heavy fog) drivers use lane markers immediately in
front of the vehicle for road guidance. Thus, it is also necessary for a driver to see pavement markings just
in front of the vehicle. This may vary from a few meters to about 15 meters, depending on the design of the
front of the vehicle and the driver eye position.
In Section 2.1 it was mentioned that tasks on the operational level, and sometimes tasks on the
tactical level, are normally carried out automatically. Rumar (1990) proposed that the transition from
automatic behavior to conscious behavior takes place when drivers’ predictions prove to be incorrect. This
has two important implications. First, one of the main tasks of driver attention and visual search must be to
check whether the predictions made are indeed correct. Second, because prediction is more difficult during
nighttime driving than during daytime, more of the operational and the tactical tasks are carried out
consciously in nighttime traffic than in daytime traffic. In other words, lane markings are used differently
in day and night driving. This reasoning is in accord with other arguments previously discussed.
The human visual system should not be compared to a passive photocell or camera. The visual
system actively searches the visual scene for information to reduce the uncertainty of the driver. Motion in
the visual field attracts attention, and the fixation of the eyes is automatically focused on that event or object.
When drivers have difficulties predicting and following the course of the road, they actively search for
pavement markings in the same way as somebody having problems in a staircase searches for the handrail.
An interesting approach to visual performance in night driving was presented by Leibowitz and his
colleagues (Leibowitz and Owens, 1977; and Leibowitz, Owens and Post, 1982). According to the theory
advanced by these studies, there are two main visual functions in driving. One is concerned with foveal
vision and deals with detection and recognition problems of the driver. The other function deals with
guidance and orientation, and is primarily carried out by peripheral vision. Owens and Andre (1996)
indicated that the recognition function is impaired for all drivers in night traffic conditions. The guidance
function, on the other hand, is less impaired at night for younger drivers than for older drivers (Owens and
Tyrrell, in press). From this point of view, lane markings that could facilitate visual guidance in night
driving should be more important for older drivers than for younger drivers.
Leibowitz and his colleagues (Leibowitz and Owens, 1977; and Leibowitz, Owens and Post, 1982)
hypothesized that drivers are overconfident at night because they are unaware that their visual recognition

9
abilities are selectively degraded while their visual guidance is not. This theory questions whether
improving visual guidance in night traffic is, indeed, helpful for improving safety.
Owens and Tyrrell (in press) and Rumar (1998) express analogous concerns. The self-pacing
characteristics of driving mentioned by Rumar (1986) may be based on visual guidance, which is always
present and provides good feedback. Drivers may overdrive their visibility distance for obstacles and other
road users for which they have no or only limited feedback.
To address the hypothesis of visual guidance in night traffic being too efficient, it is important to
consider the opinions and behaviors of drivers. A Swedish study (SNRA, 1996) showed that only a
minority of drivers (30%) were satisfied with present lane markings. In a number of studies (Johansson
and Backlund, 1968; Padmos 1985; Walraven, 1980; and Walton, 1975) it was shown that drivers believe
that visual guidance is critical for night driving. Furthermore, drivers behave accordingly. In difficult
situations, drivers disregard some information but always attended to the geometric road information. Only
a small number of the respondents indicated that detection and recognition of other road users were critical
problems in nighttime driving. What we do not know from these studies, however, is whether this opinion
is a reflection of the frequency of or the amount of feedback from these targets, or a reflection of the critical
need for visibility.
2.3 Conclusions
The conclusions from this section are as follows:
• The design and performance of lane markings should be based on driver needs for visual
guidance.
• Driver models and knowledge about driver characteristics support the need for good visual
guidance to reduce driver uncertainty, reduce the mental load, and facilitate driver predictions.
• Driving is a self-paced task and visual guidance plays a key role in this process.
• There is evidence for two fairly independent road-guidance functions. One is for long-range
guidance (e.g., post-mounted delineators), and the other one for short-range guidance (e.g.,
painted edgelines).
• According to the driver models cited, during daytime experienced drivers obtain short-range
visual guidance automatically and by means of peripheral vision.
• In clear daytime driving, lane markings contribute little to driver guidance.
• Road guidance at night is drastically worse than road guidance during the day. Rain and wet
roads further increase the nighttime difficulties. Driving on wet roads at night is one of the
more difficult and risky driving situations. Drivers are especially dependent on lane markings
during such adverse and degraded conditions. Drivers consider road guidance to be their main
difficulty in nighttime driving, and only a minority of drivers is satisfied with current lane
markings.
• Drivers need about 5 s of preview time of the road ahead. An absolute minimum is 3 s.

10
• There are two widely separate views on enhancing road guidance. The traditional and
established one states that more information about the road ahead results in smoother and safer
driver behavior. Another view states that drivers’ visual guidance is already better than drivers’
recognition, and that visual guidance should not be further enhanced because that may lead to
higher speeds and overconfidence.

11
3. REVIEW OF EXISTING STUDIES
This section reviews various studies that investigated lane markings. It is divided into twelve
subsections, each covering a somewhat independent lane-marking issue. Emphasis has been placed on
empirical measurements of the effects of lane markings. Additionally, standards and regulations for
pavement-marking technology will also be addressed.
3.1 Pavement marking technology
The use of lane markings as a standard traffic engineering procedure started in Michigan in 1911.
During the 1920s the practice spread across the U.S. and Europe. Typically, the color used for these
markings was white. In Maryland it was noted in 1920 that the black bituminous joint sealer in the center
of concrete roads unexpectedly functioned as a divider between the two streams of traffic (OECD, 1975).
Initially, there were no quality requirements on the paint used for markings. First requirements
were suggested by Mattimore (1926). He was ahead of his time, and, to a great extent, the requirements
today are similar to those he listed. Mattimore had day and night visibility and durability on his list, which
are still the main requirements that need to be addressed (see Section 2.12).
Currently, pavement markings can be produced in various ways (CIE, 1988; and DELTA, 1997):
• By application of paint. The paint may be of a one- or two-component type. Paint may be
applied either cold or hot, depending on the composition. The thickness of the paint
applications typically ranges between 0.2 mm and 0.5 mm.
• By application of plastic materials. There are three basic types of plastic: hot-applied, thick
plastics (thermoplastics), which are applied when heated to high temperatures; sprayed-on
plastics, which are thinner thermoplastics; and scold-applied plastics. The thickness of the
plastic markings are normally between 1 mm and 3 mm. Markings thicker than 3 mm should
be avoided for several reasons (e.g., they may hinder water runoff).
• By application of prefabricated lines. These are fastened to the road surface with adhesives.
(They are typically used for temporary markings.)
• By installation of raised pavement markers. These are made of metal or plastic material and
equipped with directed retroreflectors, composed of glass beads or prismatic reflectors.
• By installation of luminous raised pavement markers. These fairly unusual markers are
sometimes used on especially difficult sections of roadways. They are comparable to the raised
retroreflective pavement markers except that they contain light sources and consequently work
independently of any headlamp illumination.
In the case of paint, plastic materials, or prefabricated lines, the application is normally combined
with the addition of glass beads. Glass beads are used either in the form of premixture, as drop on, or a
combination of these methods. The glass beads are the active retroreflective material in pavement markings
and make the markings appear bright in the illumination of vehicle headlamps. In order to enhance the

12
retroreflective performance of the markings in wet conditions, markings are designed with a textured
surface by using large glass beads or other means to create vertical surfaces that protrude above the water
surface. In order to increase the friction of pavement markings, the paint or plastic material is often used in
combination with materials that enhance friction and offer added visual guidance.
Pavement markings are often referred to as horizontal signing and marking. However, profiled
pavement markings and raised pavement markers are not really horizontal. They belong to an intermediate
group of markings that are applied to the horizontal surface but have the active surfaces vertical.
Most pavement markings are white, but yellow markings are used in some countries (e.g., the U.S.).
Other colors may be used in special cases (e.g., blue bicycle paths).
A small number of experiments have been carried out to develop fluorescent and luminescent
pavement markers (e.g., Hopkins and Marshall, 1974; Lundkvist, 1993). Some produce promising results,
others do not. These types of markings will not be further mentioned because they are still in the
experimental stage, and only a few studies have been conducted.
A number of developments and studies have also been carried out on intelligent roadway-edge-
detection systems. These devices detect when a vehicle is about to cross an edgeline and leave the road, and
then inform the driver (passive systems) or take control of the vehicle (active systems). Special semi-
intelligent, retroreflective, raised pavement markers were recently introduced by Astucia (1998). They are
suitable for both temporary and permanent use, and can sense both moving objects (e.g., vehicles) and other
conditions (e.g., ice). When triggered, they become luminous by means of light emitting diodes with
various colors and flash rates.
3.2 Photometric measurements
The main factors influencing the visibility of pavement markings are their luminance, their
luminance contrast with the road, and their size. To calculate the contrast we need to first measure the
luminance of the road and of the markings. To obtain the luminance of the pavement markings, we need to
use small angles that correspond to realistic traffic situations.
The photometric measurements should simulate a normal driving situation. Unfortunately,
sometimes the symbols used for the various angles involved vary in different publications and different
countries. A major difference is that the observation angle for pavement markings is defined differently in
the U.S. and Europe (see Figure 1).

13
Eyes
Headlamp
Road Road MarkingIllumination angleEU =�Co-entrance angleUS
αEU
αUS
Entrance�angleUS
Observation�angles
���
��
��
Figure 1. Main differences in the U.S. (US) and European (EU) nomenclature.
• In the U.S., the observation angle (α) is the angle between the illumination axis and the
observation (measuring) axis.
• In Europe, the observation angle (α) is the angle between the observation (measuring) axis and
the plane of the road marking.
• The illumination angle in Europe is the same as the co-entrance angle in the U.S. In other
words, adding the U.S. observation angle to the U.S. co-entrance angle will yield the European
observation angle. Conversely, subtracting the European illumination angle from the European
observation angle will yield the U.S. observation angle.
In the text below, we will describe the angles used rather than provide only the symbols. We will
use the U.S. definition of the observation angle, referring to it as αus (versus αEU for the European
observation angle). We will use the European definition of the illumination angle (which corresponds to
the U.S. co-entrance angle).
3.2.1 Measurement of retroreflective properties
The photometric quantity used for assessment of road surfaces in headlamp illumination is the
coefficient of retroreflected luminance (RL). It is defined as the quotient of the luminance of the surface in
the direction of observation and the illuminance at the surface on a plane perpendicular to the incident light,
and it is measured in cd/m2/lux. On the other hand, for point sources (e.g., studs) the relevant photometric
quantity is the coefficient of retroreflected intensity (RI). It is defined as the quotient of the luminous
intensity of the retroreflector in the direction of observation and the illuminance at the retroreflector on a
plane perpendicular to the direction of incident light, and it is measured in cd/lux (CIE, 1988).

14
The measurement geometry has been studied and discussed in several publications (e.g., Lundkvist
and Sorensen, 1980; Hoffmann and Firth, 1985; Attaway, 1989; CEN, 1992; Hedblom, Bradshaw, May,
Jacobs, Szczech, Hodson, and Austin, 1993; and Shah, Nowakowski, and Green, 1998). The following
angles have been found in various national and international proposals and standards (DELTA, 1990; and
Hoffman and Firth, 1985):
• Illumination (co-entrance) angle (the angle between the illumination axis and the horizontal
pavement marking): 4° (US), 3.5° (IRF, France, Italy, Spain, and Austria), 2° (Belgium, and
Germany), 1.24° (Germany), and 0.74° (Denmark, and England).
• Observation angle αus (the angle at the pavement marking between the observation axis and the
and the illumination axis): 1.5° (USA, Austria, and Spain), 1.0° (IRF, France, and Italy), 1.3°
(Germany), 1.05° (Germany), and 0.63° (Denmark, and England)
In comparison, given a headlamp mounting height of 0.62 m and a driver eye position of 1.11 m
above the road (Sivak, Flannagan, Budnik, Flannagan, and Kojima, 1997), the actual illumination angles are
0.71° (at 50 m) and 0.36° (at 100 m), while the actual observation angles are 0.56° (at 50 m) and 0.28° at
(100 m). Consequently, the angles in the above-listed proposals and standards are too large. However,
there are two problems with reducing these angles. First, measurement at realistically small angles is
difficult. Second, in real situations the road is never totally flat but has gentle undulation with a variety of
amplitudes. At small angles such undulations result in large variations in the measurements.
Consequently, the goal has been to scale down the measuring situation by altering the apertures of
light source and the photometers, and by using an instrument that is portable and easily operated by a
single person and is capable of measuring photometric variables in both daytime and nighttime conditions.
The problem with this approach is that the road cannot be scaled down.
The solution to these problems has been to increase the angles as far as possible without distorting
the rank ordering between the results, in order to limit the large variation between the measurements for
various road surfaces and pavement markings. Since the level of light to be measured is very low, it is
important to control any stray light. It is also important to calibrate the instrument frequently because of its
sensitivity to small changes in angles.
The European Standardization Committee (Comite European de Normalization, or CEN) has
chosen as standard geometry for the luminance coefficient under diffuse illumination for the road (Qd ,
measured in mcd/m2/lux) and for the coefficient of retroreflected luminance (RL , measured in mcd/m2/lux)
a situation corresponding to a distance of 30 m between a passenger car and the pavement marking. The
eye height of the observer is 1.2 m and the height of the headlamps is 0.65 m. This yields an observation
angle (αus) of 1.05° and an illumination (co-entrance) angle of 1.24°.
Compact instruments intended for field measurements in practice are called retroreflectometers or
just retrometers. There are presently a limited number of such instruments commercially available. They
use different illumination angles (from 0.74° to 4.0°) and different observation angles (from 0.2° to 1.5°),
and vary in other design respects (Hoffmann and Firth, 1985; Hedbloom et al., 1993; and Shah,

15
Nowakowski, and Green, 1998). Thus, it is customary to calculate conversion factors for each retrometer in
relation to a given standard geometry (see CEN, 1992).
Hoffmann and Firth (1985) report that the correlation between measurements carried out by means
of Eriksen, Ecolux, Optronik, Wallometer, or Zehnter retrometers are all between 0.91 and 0.99. Lundkvist,
Helmers, and Ytterbom (1980) compared the results from the Eriksen instrument with the results from
Norwegian and Swedish experimental retrometers and concluded that it is difficult to compare results from
one instrument with results from another because each have inherently differing characteristics. Hedblom
et al. (1993) reached the same conclusion when they compared the subjective ranking of various marking
products seen from different distances in a passenger car or a truck. The coefficient of retroreflected
luminance as measured with standard retrometers did not relate to the brightness reported by the subjects.
However, when the coefficient of retroreflected luminance in the real geometries was measured, the
correlation between RL and perceived brightness was high.
Unfortunately the results from retrometer measurements show considerable variability. The
variability is especially large for the RL , which is especially sensitive to small angles. Thus, a number of
measurements should be taken on each marking. Another problem is that by sampling a small number of
markers one does not know whether the samples are representative of the population. These issues are
discussed in more detail by Lundkvist (1988a).
Furthermore, measurements may vary as a function of the time of year. Lundkvist (1990a) has
found that the RL winter values are reduced by half from their summer value. By spring the RL values
increase, although not to the same level as before winter. In Sweden, this effect is caused primarily by
studded tires, but other factors also contribute to the decrease (e.g., cold climate and salting). Scheuer et al.
(1997) studied the problem in Michigan and reported that the main factors affecting the decay of lane-
marking retroreflectivity were snowplowing and sanding. The materials used and the type of pavement
were not important factors. Dejaiffe (1987) discussed the possibility of using a retrometer equipped with a
laser light source and a narrow-band filter to block out ambient light.
3.2.2 Field measurements of the coefficient of retroreflected luminance
The following is a sampling of studies dealing with the coefficient of retroreflection (RL) of
pavement markings:
• Rumar and Ost, 1974• Serres, 1981• Nordic Research Cooperation for Night Traffic, 1983• Lundkvist and Nilsson, 1985• Lundkvist, 1986• Lundkvist, 1988a• Lundkvist, 1988b• King and Graham, 1989• Lundkvist, 1990a• Lundkvist, 1990b• Obro, 1990• Helmers and Lundkvist, 1991

16
• Hedblom et al., 1993• Jacobs et al., 1995• Jingryd, 1995• Cotrell, 1996• Scheuer, Maleck, and Lighthiezer, 1997• DELTA, 1997• Herland and Lundkvist, 1997
Several studies compared the performance of pavement markings with different compositions.
Lundkvist (1986) varied the amount of beads, the size of the beads, the material composition of the beads,
and the way the beads were applied (premixed or drop-on). The optimal percentage of premixed beads was
determined to be 20%. If the premixed bead concentration is below 30%, there is no advantage to mixing
small and large beads. For concentration of premixed beads above 50%, there is an advantage in reduced
wear to mixing small and large beads. Plastic beads are durable, but possess poorer retroreflective
performance. A mixture of glass and plastic beads may be optimal. In a later study (Lundkvist, 1988b) it
was found that a mixture of 20% glass beads and 5% plastic beads was optimal for the markings of roads
without street lighting. On roads with street lighting, the percentage of glass beads may be reduced to 10%
to increase durability.
Jacobs, Hedblom, Bradshaw, Hodson, and Austin (1995) compared RL as a function of distance
(measuring geometry), compared visibility in static and dynamic conditions, related visibility to coefficient
of retroreflected luminance, and compared visibility curves for various percentile performances. Hedblom
et al. (1993) also studied the relationship between RL and the measuring geometry by changing distance
and type of vehicle. Their conclusion was that for modern retroreflective materials, measuring RL with only
one standard geometry does not provide valid results.
A series of studies from VTI in Sweden (Lundkvist, 1990b; Helmers and Lundkvist, 1991; and
Jingryd, 1995) focused on wet road conditions. This was important because wet conditions pose one of the
most visually difficult driving situations. It was found that the same measuring geometry could be used for
dry and wet markings. Profiled markings were superior to flat markings, but the difference decreased
slightly with increased wear.
Herland and Lundkvist (1997) studied a large number of various types (e.g., paint, sprayed plastic,
thermoplastic, two-component plastic, and profiled thermoplastic) materials were installed on a stretch of
road and measured regularly over a period of two years. The differences between the types were
considerable. Paint markings were the first to suffer from heavy wear. Next was two-component plastics,
and spray plastics. The materials that performed the best were the thermoplastics. All of the markings
(except paint) met the minimum requirements (RL = 100 mcd/m2/lux) after two years of heavy wear. The
profiled markings suffered more than the flat markings, but were still more reflective in wet conditions.
However, none of the profiled markings reached the requirement in wet conditions (RL = 25 mcd/m2/lux)
after one year. It should be noted that this study was made in Sweden where studded tires are common, so
wear may be more severe there than in other countries.

17
Cottrell (1996) compared profiled (waffled) markings to markings with large beads under wet
conditions and found that they both had disadvantages. He proposed to use raised pavement markers in
combination with traditional markings if the primary need is to increase visibility at night in wet conditions.
DELTA (1997) refers to an unpublished study carried out in Sweden by VTI. This field study
investigated the relationship between visibility and the coefficient of retroreflected luminance (RL) in order
to validate the DELTA model for calculation of pavement marking visibility. The independent variables
included two levels of RL (100 and 400 mcd/m2/lux), four different patterns of lane markers, and three
different levels of headlamp illumination.
3.2.3 Raised pavement markers
ASTM D4280 (1996) and ASTM D4383 (1996) specify how the coefficient of luminous intensity
(RI , measured in mcd/lux) should be measured in laboratory conditions and provides minimum values for
white, yellow, red, green, and blue. ASTM E1696 (1995) specifies how RI should be measured with a
portable retrometer in field conditions. The angles specified correspond to a passenger car at a distance of
300 meters or a truck at a distance of 150 meters. It is not known if there is any commercially available
portable retrometer with these characteristics.
Liptak (1980) investigated the reliability of raised pavement markers (or “studs”). The study
could not establish an effect of studs on accidents. One possibility for this is that the test stretches were
too short. It was concluded that in moderate to heavy rain studs were the only road guidance system that
remained optically functional. The damage to studs caused by snowplows was also studied.
Michaut and Bry (1985) concluded that in the worst condition (rain with oncoming glaring
headlamps) a retroreflecting illuminance of 50 mcd/lux is necessary for the studs to be visible from a
distance of 150 m. Increasing the retroreflecting illuminance to 100 mcd/lux only increased the visibility
distance by another 20 m. The durability of raised pavement markers was also studied by McNees (1987)
and Kidd (1990). These studies compared the durability of various types of studs and application
methods. All markers in these studies lost 95% of their reflectivity within the first six months after
installation. The main cause was believed to be improper installation.
Ullman (1994) studied the reflectivity of 17 types of studs both in the field and in the laboratory. A
prototype portable retrometer had a measuring geometry of 4° illumination angle and 0.2° observation angle
(Ullman and Rhodes, 1996). Field measurements were compared with laboratory measurements, resulting
in a correlation coefficient of 0.93. The coefficients of luminous intensity of the 17 makes of studs, when
new, ranged from 14 to 95 mcd/lux. Many studs lost much of their performance within one week due to
dirt accumulation on the lenses. Later evaluations found that many of the lenses had been damaged by
tires. Only a limited number of studs measured at least 50 mcd/lux (the minimum value) after 54 weeks.
Studs with lenses covered by thin layers of glass yielded the highest readings.

18
3.3 General impact of lane markings on safety and other traffic goals
The two main crash categories that could be influenced by the lane markings are single-vehicle
accidents and multivehicle head-on accidents. In both of these cases at least one driver has left his/her lane
of travel. Angular collisions and collisions between cars and unprotected road users could also be
influenced by the lane markings. In Europe and the U.S., single-vehicle accidents and head-on collisions
account for approximately one-third of all accidents resulting in personal injury.
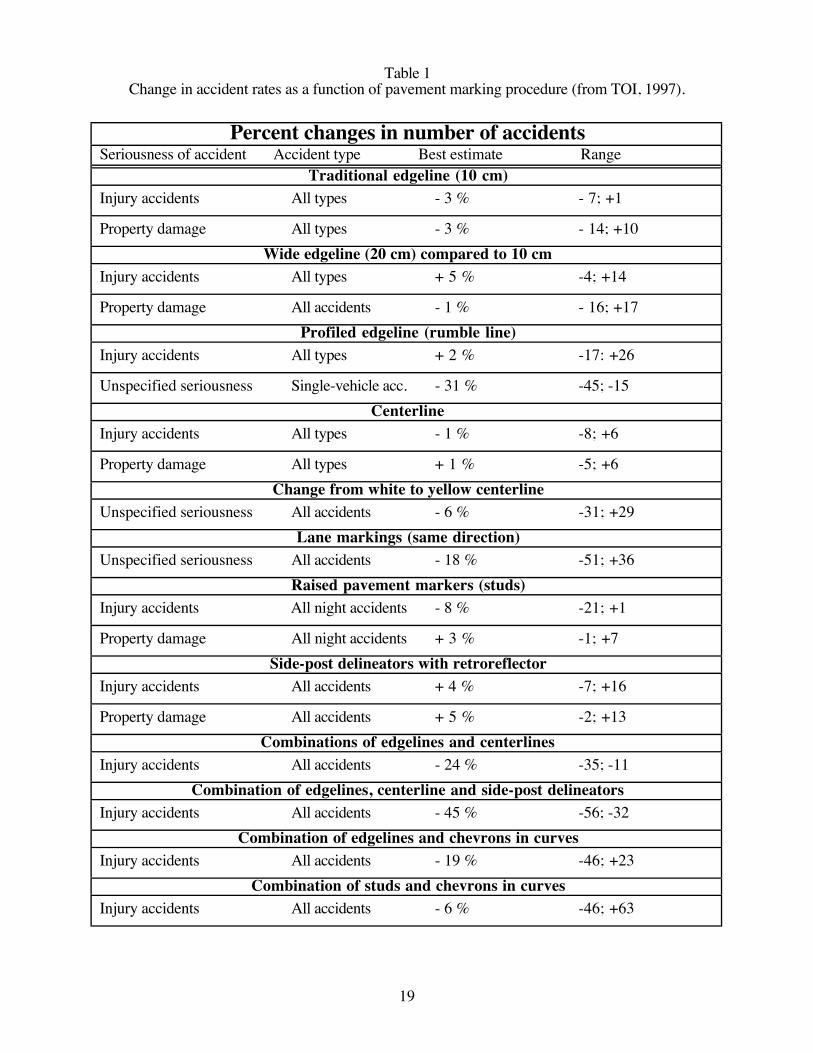
The Norwegian Handbook on Road Safety (TOI, 1997) provides a comprehensive summary of
accident studies, with the results of each study weighted by its methodological quality. The results are
shown in Table 1.
19
Table 1Change in accident rates as a function of pavement marking procedure (from TOI, 1997).
Percent changes in number of accidentsSeriousness of accident Accident type Best estimate Range
Traditional edgeline (10 cm)Injury accidents All types - 3 % - 7; +1
Property damage All types - 3 % - 14; +10
Wide edgeline (20 cm) compared to 10 cmInjury accidents All types + 5 % -4; +14
Property damage All accidents - 1 % - 16; +17
Profiled edgeline (rumble line)Injury accidents All types + 2 % -17: +26
Unspecified seriousness Single-vehicle acc. - 31 % -45; -15
CenterlineInjury accidents All types - 1 % -8; +6
Property damage All types + 1 % -5; +6
Change from white to yellow centerlineUnspecified seriousness All accidents - 6 % -31; +29
Lane markings (same direction)Unspecified seriousness All accidents - 18 % -51; +36
Raised pavement markers (studs)Injury accidents All night accidents - 8 % -21; +1
Property damage All night accidents + 3 % -1; +7
Side-post delineators with retroreflectorInjury accidents All accidents + 4 % -7; +16
Property damage All accidents + 5 % -2; +13
Combinations of edgelines and centerlinesInjury accidents All accidents - 24 % -35; -11
Combination of edgelines, centerline and side-post delineatorsInjury accidents All accidents - 45 % -56; -32
Combination of edgelines and chevrons in curvesInjury accidents All accidents - 19 % -46; +23
Combination of studs and chevrons in curvesInjury accidents All accidents - 6 % -46; +63

20
TOI (1997) based the summary in Table 1 on the following studies:
Edgelines:
• Thomas, 1958
• Musick, 1960
• Willistone, 1960
• Basile, 1962
• Charnock and Chessell, 1978
• McBean, 1982
• Rosbach, 1984
• Willis, Scott, and Barnes, 1984
Profiled edgelines:
• Ligon, Carter, Joost, and Wolman, 1985
• Emerson and West,1986
• Hickey, 1997
Wide edgelines:
• Hall, 1987
• Cottrell,1988
• Lum and Hughes, 1990
Centerlines:
• Johns and Matthias, 1977
• Engel and Thomsen, 1983
• Glennon, 1985
Studs:
• Creasy, Ullman, and Dudek, 1989
• Griffin, 1990
• Wright, Zador, Park, and Karpf, 1982
Side-post delineators:
• Taylor and Foody. 1966
• Daas, 1978
• Johansson, 1986
• Kallberg, 1993
Several types of markings:
• Tamburri, Hammer, Glennon, and Lew, 1968
• Roth, 1970
• Bali, Potts, Fee, Taylor and Glennon, 1978
• Corben, Deery, Newstead, Mullan and Dyte, 1997

21
TOI (1997) did not include a limited number of other existing studies (e.g., Lassarre, 1976;
Baumgartner, 1982; Hughes, McGee, Hussain, and Keegel, 1989; and Lundkvist, Ytterbom, Runersjo, and
Nilsson, 1992). However, these studies produced results that were essentially similar to those in Table 1.
The first impression from Table 1 is that lane and pavement markings appear to have limited effects
on safety. In many cases, the size of the safety effect is within plus or minus 5%, and many of the effects
are not statistically significant. There are, however, some exceptions. Some markings seem to be very
effective at reducing accidents.
Profiled edgelines seem to reduce single-vehicle accidents by about 30%. It is, however, difficult to
tell how much of that effect is visual and how much is auditory or tactile. When tires roll on profiled
edgelines the markers work as rumble strips, warning the driver that the vehicle is about to leave the lane.
Neither is it possible to know to what degree weather conditions (wet or dry) influenced the effects.
Combinations of marking procedures appear more efficient than each single method individually.
Edgelines combined with a centerline reduce the number of injury accidents by almost 25%. Edgelines
combined with a centerline and side-post delineators significantly reduce the number of injury accidents by
about 45%. One way to explain these results may be to refer to Good and Baxter (1985). Earlier it was
suggested that drivers use two distinct, but complementary, road guidance functions, long-range and short-
range guidance. Side-post delineators may provide long-range guidance, and the painted lane markers may
support short-range guidance.
Only a few studies have focused on the nighttime effects of pavement markings. Based on the
earlier discussion, it could be expected that the effects of pavement markings on safety are stronger at night
than during the day. But the findings from the available limited number of studies are not consistent.
No good studies of the safety effects of pavement markings in reduced visibility conditions other
than darkness (e.g., fog) have been found. Another issue that does not receive much research attention
relates to the influence of weather on the safety effects of lane-marking systems. It is likely that under
adverse weather conditions, profiled systems, such as raised pavement markers and profiled rumble lines,
would be superior to traditional painted markings.
A similar issue relates to special roadway situations, such as curves. While the overall impact of
lane markings might be limited, there may be specific situations (e.g., on curves) where the impact might be
substantial. However, the existing studies do not provide information on roadway-specific benefits of
different types of systems.
In several studies many variables are varied simultaneously, thus making it difficult to determine the
specific effect of each variable. For instance, in one study the lane markings on a number of roads were
altered, while other roads that have not been modified served as controls. However, the modifications were
made simultaneously in such a way that the lane width was increased, the edgeline was made three times as
wide, and the edgeline was changed from a dashed line to a solid line. In other words, three variables
changed simultaneously, and it is impossible to determine the effects of each individual variable.
Furthermore, many of the studies have not adequately controlled for possible confounding factors, such as
the statistical effect of regression to the mean or the behavioral compensation effect. The regression to the
22
mean problem, which yields effects of a treatment that are artificially large, could be controlled by certain
statistical measures. Driver compensatory behavior reduces the safety effect of a treatment, and thus
requires control of the possible compensatory behavior.
Several British and U.S. studies have controlled speed before and after the introduction of pavement
marking measures (Thomas, 1958; Williston, 1960; Stimson, McGee, Kittelson, and Ruddy, 1977;
Mullowney, 1982; Willis, Scott, and Barnes, 1984; and Cottrell, 1988). The results indicate that when
pavement markings are introduced, speed increases by about 10%. However, after frequent travelers of the
roadway get accustomed to the new markings, the speed tends to go down again, although rarely back to the
original level.
The increase in speed as a consequence of improved pavement markings indicates that the potential
compensation effects discussed earlier are real, but not as strong as feared. For side-post delineators such
compensation effects are stronger. In fact, on roads with relatively low geometrical standards, introduction
of retroreflective side-post delineators appears to have a negative effect on safety as a result of the
considerable increase in speed (Kallberg, 1993). This is difficult to accept for those who experience the
improved visual guidance and the positive reactions from drivers.
Measuring driving speeds before and after an introduction or modification of lane markings may
also indicate changes in traffic flow and a higher level of mobility.
Pavement markings have limited impact on the environment. Rumble lines (profiled markings) and
studs may cause additional noise. This is, however, their very purpose, and the only individuals for whom
this may be disturbing are those living along the road. The only air pollution effects of pavement markings
are those that may relate to road workers (e.g., from liquid paint solvents, plastic or color particles, or
pigments).
3.4 Behavioral effects of lane markings
It is always difficult to measure safety effects using accident analyses. One reason is that accidents
are, fortunately, rare events. Therefore, they are sensitive to random variation if investigating only limited
areas or time periods. In other words, the reliability of accident effects is limited. Therefore another
approach has been tried. Instead of measuring accidents directly, efforts are made to find behavioral
measures that correlate with accidents. Driver behavior is always present and can be readily measured.
However, the validity of such indirect safety measures is limited. In other words, one must choose between
high validity and limited reliability (direct safety measures, such as accidents) and limited validity and high
reliability (indirect behavioral measures, such as speed).
The behavioral effects of lane markings that could be strongly related to safety are few. The
primary variable used is driver speed. As discussed above, driving is a self-paced task and when the task to
follow the road becomes easier the speed will increase. However, is this self-pacing based on road
geometry, road standard, or visibility? The relation between speed and safety under normal driving
conditions is well established (Nilsson, 1984). Several studies (and real life accidents) show that drivers’

23
choice of lower speeds when conditions worsen (e.g., in fog) is, usually, an incomplete regression towards
a condition of constant safety (Harms, 1992). That is to say, speed is not reduced as much as it should be
if safety is to be kept constant.
Drivers often undercompensate in a degraded situation. Another question is whether drivers
overcompensate (increase their speed too much) in an improved situation (e.g., with highly effective road
guidance) so that safety is ultimately decreased. This potential effect was discussed in Section 2 and in
Section 3.3.
Another behavioral performance indicator is lateral position and variability on the road. These
variables are easy to measure (high reliability) but their relation to safety is not as clear as that for speed
(low validity). Correlations between 0.7 and 0.8 for vehicle position or position variability and accidents
have been obtained (Stimson, McGee, Kittelson, and Ruddy, 1977). A combination of speed and position
would likely provide the most comprehensive indicator of driver performance.
Another behavioral performance indicator is the number of overtakings. If lane markings reduce
the number of overtakings, safety should improve. However, there are no studies on the relationship
between this variable and accidents, and therefore its validity is unknown.
Finally, driver opinions concerning lane markings should not be overlooked as a possible indirect
measure of safety. However, the relationship between this subjective evaluation and accidents is not known.
It can be assumed though, that subjective evaluation is highly correlated with driver behavior. When a
marking is perceived as good then there is a high probability that behavior is influenced. Subjective
evaluation is also a measure of comfort.
Visibility is a common variable in subjective evaluation studies. It is unknown whether there is a
difference between subjective evaluation of lane marker visibility and general evaluation of how “good” a
lane marking is. It is likely that these two subjective measures are highly correlated, and that they measure,
to a great extent, the same thing.
3.4.1 Driver behavior changes on straight sections of road
Table 2 summarizes the findings concerning behavioral changes on straight sections of road. Table
2 is based on the following studies:
• Taragin, 1958
• Thomas and Taylor, 1960
• Hubbell and Taylor, 1968
• Cottrell, 1985
• Lundkvist, Ytterbom, and Runersjo, 1990
• Lundkvist, Helmers, Nilsson, Ytterbom, Runersjo, and Lauridsen, 1990
• Lundkvist, Ytterbom, Runersjo, and Nilsson, 1992
• Carlsson and Lundkvist, 1992

24
Table 2 Summary of results from studies of lateral vehicle edge-to-edge clearance between oncoming passenger cars at night as a function of edge delineation. In all studies there was a centerline.
No line 10 cm dashedwhite
10 cm dashedyellow
5 cm solidwhite
10 cm solidwhite
10 cm solidyellow
20 cm solidwhite
0.5 – 1.7 m 4.3 –7.4 m 3.7 – 7.0 m 3.4 m 2.6 – 4.6 m 3.6 – 7.0 m 2.1 m
A certain degree of caution is warranted when comparing and interpreting the effects of the
treatments listed in Table 2. Due to the measuring and metric conversions some error may be introduced,
and differences inherent in the studies (e.g., lane width, traffic volume, and roadway complexity) may
influence the results. The ranges given represent the lowest and highest averages from each study. If only
one number is given, there was only one relevant study. Overall, it is evident that pavement markings
influence driver behavior when measured by lateral position.
For the no-edgeline control it is consistently found that drivers tend to position their vehicles close
to the centerline. One reason for this behavior is that drivers tend to stay closer to the line on the side of the
steering wheel. This was observed when Sweden changed from left-hand to right-hand traffic. Another
reason may be that without clear demarcation of the edge, the driver is uncertain about the roadway width
and where the pavement ends. Therefore, there is a tendency to drive closer to the centerline because it is a
clearly defined reference line. Such behavior, while reducing the chances of roadway excursions, results in
a higher probability of head-on collisions.
While the exact effect for the edgeline delineation practices is unclear, the general results are that
dashed lines tend to yield greater separation between oncoming vehicles (that is, drivers position their
vehicles closer to the edgeline). It may be that a solid line is more imposing and causes drivers to shy away
from the edge (as supported by the evidence from the widest (20 cm) conditions). However, additional
research is needed before any recommendations could be made concerning desirable delineation practices
because the differences between the treatments were small, and because line type provides additional
symbolic information which may counteract lane-position measures.
Lundkvist, Ytterbom, and Runersjo (1990) evaluated driver behavior before and after a new edgeline
marking procedure was implemented in Sweden. Edgeline delineation of roadways 9 m wide had
previously been marked with 10-cm-wide dashed lines; this was compared against a novel treatment using a
20-cm-wide solid line placed closer to the roadway edge. After implementation it was determined that
drivers laterally positioned their vehicle farther from the centerline, resulting in greater lateral distances
between oncoming traffic. This treatment also yielded more variability in the lateral position, which was
seen as a favorable outcome in order to minimize the formation of longitudinal ruts. Additionally, speeds
were reduced after implementation of the new edgeline treatment.

25
In later studies driver behavior was monitored before and after edgeline treatments for roads that
were 13 m wide (Lundkvist, Helmers, Nilsson, Ytterbom, Runersjo, and Lauridsen, 1990; Lundkvist,
Ytterbom, Runersjo, and Nilsson, 1992; and Carlsson and Lundkvist, 1992). Edgeline delineations had
previously been 10-cm-wide dashed lines placed 2.6 m from the road’s edge; this was tested against a new
treatment of 30-cm-wide solid lines placed 1.0 m from the road’s edge. As had been found for roads that
were 9 m wide, the new edgeline treatment resulted in greater lateral separation between oncoming vehicles,
and the lateral position was more variable. Contrary to the previous findings, however, there was no change
in speeds.
The general conclusion from these studies is that wider solid edgelines that are closer to the road’s
edge (thereby increasing lane width) result in greater lateral separation between vehicles with a potential for
reducing accident frequency and severity.
3.4.2 Driver behavioral changes in curves
Shinar, Rockwell, and Malecki (1980) studied the effect of edgelines on speeds in curves. Speeds
were found to be the slowest for the no-edgeline control. The increased speeds with edgeline delineation
were considered positive by the authors because the speeds were still slower than during the daytime, and
because the increase in speed to closer mimic daytime behavior was an “indication of increased confidence
by drivers in their judgment.”
Agent and Creasey (1986) evaluated the use of raised pavement markings, transverse lines, rumble
strips, side-post delineators, and chevrons on slowing vehicle speeds in curves. Also tested was a treatment
involving a visual illusion. Specifically by using post delineators where the reflector is placed at an
increasing height, the perceived sharpness of the curve is increased. In general, the treatments had no
effects on speeds, but there were effects on lane positions consistent with a reduction in the number and
severity of lane encroachments. The use of chevron signs significantly reduced the approach speeds to
curves.
Zador, Stein, Wright, and Hall (1987) found that when chevrons were used, drivers tended to
navigate closer to the edge, while when post delineators were used, drivers drove closer to the centerline; in
both conditions speed increased. There were no differences between the two treatments, and thus either
could be used effectively to warn drivers of an approaching curve. Consistent with the conclusion of
Shinar et al. (1980), Zador et al. (1987) suggested that the increase in speed with delineation was a
consequence of drivers having more information and a better understanding of their environment.
Zwahlen (1993) evaluated multiple configurations of delineation treatments including chevrons,
arrow signs, side-post delineators, guardrail reflectors, and object reflectors on vehicle approach and curve-
center speeds. Since no significant change-of-speed results could be found among the treatments, Zwahlen
concluded that all treatments performed equally well in alerting drivers to the presence of a curve. A no-
delineation control was not used.

26
A recent study by Retting and Farmer (1998) evaluated the use of pavement markers and found a
7% decrease in vehicle speeds. The authors were encouraged that this was an indication that delineation
would result in slower curve speeds, yet commented that more control than they could attain was desired in
future studies.
3.4.3 Conclusions
The results on the effects of lane delineation on speeds (whether on straight roadways or on
curves), while inconsistent, tend to suggest that delineation may slightly increase speeds. The changes in
speeds, along with the lateral-position data imply that delineation enhances the visual information
concerning the future path of the road. While a better understanding of the roadway environment generally
advances safety, future studies should evaluate the long-term effect of treatments, and the potential
consequences of the possible overconfidence. Relevant to this is the finding of Zwahlen and Schnell
(1997b) that longitudinal eye-fixation distance increased when higher-visibility pavement markings were
used. In other words, as the richness of the information about the roadway ahead increased, drivers tended
to fixate farther down the road.
3.5 Visibility of lane markings
The main factors influencing the visibility of traditional (painted) pavement markings are the
luminance contrast with the road, their luminance, and their size. For retroreflective markers, as well as
luminous, raised pavement markers (which may be treated as point sources), the main factor for their
visibility is the illuminance reaching the observer. The threshold depends on the surrounding luminance.
A number of studies have been carried out to establish visibility requirements and detection
distances for various types of pavement markings under varying conditions. In the discussion below, we
will differentiate between studies employing subjective versus objective techniques to measure visibility
differences, and between field versus laboratory or theoretical studies.
3.5.1 Subjective Evaluations
Past studies on the visibility of pavement markings have predominantly involved subjective field
evaluations. Early tests were often performed by a single traffic engineer who compared pavement marking
products that were, typically, transverse lines across the roadway surface. Such evaluations consisted of
viewing the markings (without control for observation angle) to determine subjectively which lines
“seemed brightest.”
Later studies attempted to improve upon this technique by soliciting the responses of impartial
volunteers. The observations were made sometimes directly in a field setting, but more often involved

27
viewing photographs of test sites. Regrettably, even the field studies were often undertaken without
adequate controls for such factors as angles of observation. On the other hand, the studies utilizing
photographs, while more controlled, were plagued with the inadequacy of photographic equipment, which
was incapable of accurately representing the retroreflective materials as the human eye would see them.
Despite these general problems, several well-controlled studies have been performed. A brief
review of the notable articles is provided. A tabular summary was not attempted because making direct
comparisons between studies that used different subjective scales and stimulus presentation techniques
would be difficult and potentially misleading.
Ritter (1973) varied bead size gradations, flotation coatings, refractive indices, and quantities (kg/l)
to evaluate wet and dry nighttime visibility of beaded painted lines. Double yellow lines were painted along
a test stretch of rural road; the left line was always a standard application reference line, and the right line
was a test stripe of varying experimental specifications. Subjective ratings supported the use of the
standard reference line. Croteau (1977) found that uniform gradation floating beads, applied at a standard
flow rate of 0.5 kg/l, were to be recommended.
McNees (1987) addressed the wear effects on visibility of pavement marking. Chronological
photos were taken of a test site that had suffered a loss of beads over time. The results indicate that
pavement markings became semi-effective as guidance aids when only 75% of the beads remained, and
ineffective when only 50% of the beads remained. McNees recommended painting maintenance when bead
concentrations fall below 75%.
Ethen and Woltman (1986) used beads of various refractive indices and concentrations to
manipulate reflectance in order to determine a suggested minimum reflectance standard. The results indicate
a replacement value of 100 mcd/m2/lux, based on a rating of “minimally acceptable” at a viewing distance
of 58 m.
Graham and King (1991) evaluated pavement-marking reflectance to determine a minimum
recommended level. The viewing distance was 30 m. Based on the results, Graham and King
recommended a minimum reflectance level of 93 mcd/m2/lux for safe nighttime travel.
Jingryd (1995) evaluated the subjective visibility of flat and profiled markings both in daylight and
at night. Jingryd obtained a rank correlation of 0.81 between Qd and subjective visibility in daylight, and a
rank correlation of 0.61 between RL and subjective night visibility. A weak, but significant, positive relation
was found between RL readings in dry and wet conditions. Profiled markings were significantly better than
flat markings, but the difference became smaller the more the markings were subject to wear.

28
3.5.2 Objective visibility measurements
While subjective evaluations are generally made at suprathreshold levels, visibility or detection
measurements are made at thresholds. Visibility studies determine a maximum distance that observers
manage to achieve under full attention and controlled conditions. Zwahlen (1989) showed that when
reflective targets appear in the periphery of the eye, the reflectivity of the target needs to be increased in
order to ensure timely recognition. Zwahlen found that at a peripheral angle of 10° the detection distance of
a target is approximately half of the corresponding foveal (central) detection distance.
However, should pavement markings be treated as peripheral or central targets? One way to
approach this question is using the concept of conspicuity. Conspicuity refers to the attention value of an
object, its capacity to be noticed in the visual field. There are however, two types of conspicuity, one
concerning unexpected targets (e.g., vehicles) and another one concerning expected targets (e.g., pavement
markings). The latter one needs considerably lower contrast and luminance to be detected (Jenkins and
Cole, 1986). According to this point of view, we need not treat pavement markings as peripheral targets.
Section 1 concluded that about 5 s would be suitable as minimum preview although shorter times (3
to 4 s) could reluctantly be accepted. Considering speeds of about 100 km/h, 5 s preview would result in a
preferred minimum detection distance of 140 m, and a 3 s preview time would result in an absolute
minimum visibility distance of 84 m. We will now turn our attention to literature that evaluates how well
present lane-marking systems meet these criteria. The reviewed studies include the following:
Field studies, daytime
• Forsberg, Dahlstedt, and Laurell, 1977
Field studies, nighttime
• Rowan, 1963
• Dierks and Runhage, 1983
• Michaut and Bry, 1985
• Helmers and Lundkvist, 1991
• Jacobs, Hedblom, Bradshaw, Hodson, and Austin, 1995
• Zwahlen and Schnell, 1995
• Zwahlen, Hagiwara, and Schnell, 1995
• Zwahlen, Schnell, and Hagiwara, 1995
• Zwahlen and Schnell, 1996
• Zwahlen and Schnell, 1997a,b
Field studies day and night
• Rumar and Ost, 1974
Laboratory and theoretical studies, nighttime
• Blaauw and Padmos, 1982
• Gorkum, 1982

29
Theoretical and field studies, nighttime
• Zwahlen, Miller, Khan, and Dunn, 1988
• Obro, 1990
• Schnell and Zwahlen, 1996
• DELTA, 1997
Daytime. We found two relevant studies. In neither of them were the illumination level and the
retroreflected luminance well controlled. In one of them (Rumar and Ost, 1974) the effect of wear and dirt
level on dry and wet road surfaces was used as the dependent variables. Night retroreflectance was used as
criterion of performance also in daylight. This is inappropriate because the fewer active pearls in a marking
the brighter the marking looks in daylight. Therefore, their data for degraded markings in daylight were not
included in the summaries.
Forsberg, Dahlstedt, and Laurell (1977) studied the impact of road brightness and sun angle as the
dependent variables. Specifically, this study measured luminance levels of road surfaces and of lane
markings. The measurements were made at an angle of 5.7°, which does not correspond to any of the
presently used or proposed angles. However, for brightness measurements in diffuse illumination this
angle should not be critical. Using the luminance readings, contrasts between lane marking and road
surface were calculated. Table 3 summarizes the visibility distances obtained by Rumar and Ost (1974)
and Forsberg et al. (1977).
In Table 3, as well as in Tables 4 through 7, the variability listed is the range between the means
obtained in the different studies. All studies that were included have carried out measurement of visibility
in an acceptable way. Therefore all studies enter the tables with the same weight although the studies used
different numbers of observations. What differs between the studies is the control of the independent
variables, such as level of illumination, luminance factor of the road, and coefficient of retroreflection.
The reviewed studies are for many reasons not completely comparable, and they have not studied
exactly the same conditions. Therefore not all studies are included in all cells for a given summary table
(Tables 3 through 7). Consequently the cells are not always comparable. However, they still provide a
representative level of visibility for each condition, which is the primary goal here.
Table 3Daytime visibility of painted, plastic, and prefabricated lane markings (center and edgelines).
The data are from field studies, and they are for new and dry markings.
Ambient light or sun behind observer 100 - 300 m
Sun facing the observer 55 - 140 m
The influence of the sun angle proved to be substantial. The contrasts between the markings and
the road varied between 0.9 (road surface brighter) to 22.3 as a function of the sun angle. The color and

30
brightness of the pavement markings is very important for contrast and visibility in ambient illumination or
when the sun is behind the observer. When the sun is facing the observer, other factors, such as texture, are
more important for contrast and visibility.
From a safety point of view, the maximum visibility levels in Table 3 are acceptable, while the lower
levels of visibility are not. This finding is of some concern, because the markings were new and their
visibility would degrade further with age and wear. However, lane markings are probably not as important
in daytime traffic as in nighttime traffic. In daytime, there are other stimuli offering long- and short-range
guidance information.
High beams. The visibility of lane markings under high-beam illumination has been the subject of
several studies. Rumar and Ost (1974) primarily examined the effects of wear and dirt on the performance
of lane markings in wet and dry conditions. However, the obtained light measurements are insufficient for
a detailed analysis. Helmers and Lundkvist (1991) varied headlighting by changing the aiming angle of
low-beam headlamps. Retroreflective coefficient (RL) was varied by changing the percentage of glass beads
in the markings. The effect of dry and damp conditions on marking visibility was also investigated.
DELTA (1997) refers to another study by VTI in Sweden that evaluated two levels of retroreflective power
(RL = 100 and 400 mcd/m2/lux), three levels of vehicle illumination, line type (dashed or solid) and lane
width (10 cm and 30 cm). Table 4 summarizes the results.
Table 4Nighttime visibility (m) of painted and thermoplastic lane markings (center and edgelines) illuminated by
vehicle high-beam headlamps under varying conditions as measured in field studies.
Condition of pavement markings New Old
Condition of the road Dry Wet Dry Wet
Detection distance 55 - 172m 40 - 90m 30 - 136m 28 - 36m
When compared against the criteria discussed in Section 2 (84 to 140 m), only the high-end values
for new, dry pavement markings meet the preferred minimum visibility level (140 m). Furthermore, the data
in Table 4 are based on average values. Consequently, a substantial number of individual visibility
distances were substantially shorter than the visibility levels presented here.
Low beams. Most visibility studies are performed for low beams, with or without oncoming
(glaring) low beams. Nine studies have been found dealing with various aspects of lane-marking visibility
in low-beam headlamps. The first well-controlled study was made by Rowan (1963). Of interest in this
study was visibility in dry and wet conditions, with and without glaring lights. However, the markings were
significantly different in size and form from normal lane markings, and therefore the data from this study
are not used in the summary below. Dierks and Runhage (1983) studied detection distance as a function of
the coefficient of retroreflection on dry and wet surfaces in three experiments. Michaut and Bry (1985)

31
investigated raised pavement markers and post-mounted retroreflective delineators. Zwahlen, Miller, Khan,
and Dunn (1988) performed both theoretical and field studies of optimal distance between side-post
delineators. Rumar and Ost (1974) and Helmers and Lundquist (1991) have already been discussed
briefly above.
Zwahlen and his collaborators (Zwahlen and Schnell, 1995; Zwahlen and Schnell, 1996; Zwahlen,
Hagiwara, and Schnell, 1995; Zwahlen, Schnell, and Hagiwara, 1995; and Zwahlen and Schnell, 1997a,b)
have carried out a large number of field studies. Of interest in these studies were variables such as
retroreflectance, line color (white versus yellow), centerlines versus edgelines, narrow versus wide lines,
dashed versus solid lines, single solid lines versus double solid lines, distance between double solid lines,
detection of beginning versus end of a line, and, a detection of a curved line. A model was also developed
for calculation of detection distances to lane markings (Zwahlen and Schnell, 1996). Obro (1990) and
DELTA (1997) also developed models for calculation of visibility distances. An attempt was also made to
validate these models against field measurements of visibility performed by VTI in Sweden. Jacobs,
Hedblom, Bradshaw, Hudson, and Austin (1995) compared the visibility of six pavement-marking products
that differed primarily in retroreflective properties. Table 5 summarizes the visibility results of these field
studies.
Table 5Nighttime visibility of painted and thermoplastic centerline and edgeline markings under low-beam
illumination.
Condition of markings New Old
Condition of the road Dry Wet Dry Wet
No oncoming glare 50 – 87 m 34 – 38 m 30 – 65 m 27 – 33 m
Oncoming low-beam glare 50 – 77 m 40 – 50 m 30 – 40 m 30 – 40 m
Although the data across the cells are not completely comparable, they still serve to demonstrate the
inadequacy of the visibility distances provided. None of the average visibility distances met the minimum
acceptable distance of 140 m.
Two types of markings are not included in Table 5—profiled pavement markings and raised
pavement markers—because no suitable field studies have been identified. An exception is a study by
Michaut and Bry (1985) on raised pavement markers, but it was only available in a summary version.
Michaut and Bry concluded that a coefficient of luminous intensity of 50 mcd/lux is required to reach a
minimum visibility of 150 m. Doubling the coefficient of luminous intensity (to 100 mcd/lux) increased
visibility only to 170 m.
While there is a lack of visibility studies concerned with profiled pavement markings and raised
pavement markers, there are studies that measured luminance under various conditions. We will return to
these later.

32
The following paragraph provides a summary of findings concerning the color, configuration, and
wear sensitivity. This summary is based primarily on the research by Zwahlen and his collaborators, and is
elaborated in more depth in Sections 3.6 and 3.7.
The visibility of the end of a line is 10 - 50% longer than the visibility of the beginning of the line.
Edgelines are detected earlier than centerlines, but the differences are small and statistically not significant.
Results for the effect of color are not consistent. Solid double lines are detected at distances significantly
farther than dashed lines. Because the visibility under ideal conditions is frequently only marginal,
obliteration of markings could be critical. No significant differences were found between detection
distances for a 10 cm and a 20 cm line width, except in curves. DELTA (1997) described an unpublished
Swedish study that claimed a significant difference in detection distance between lines 10 cm wide and lines
30 cm wide. Rumar and Ost (1974) found that one-week accumulation of dirt reduced the visibility of lane
marking by 60% on high beams and 30% on low beams. However, these data are from Sweden where
studded tires are used extensively, resulting in high levels of dirt.
3.5.3 Theoretical and laboratory studies, and models
Theoretical studies are often based on photometric measurements of pavement markings or on
laboratory studies addressing the contrast sensitivity of the human eye (Blackwell, 1946; and Adrian,
1989). The model of Blauuw and Padmos (1982) is the most general of these visibility models. Zwahlen,
Miller, Khan, and Dunn (1988) addressed post-mounted delineators, while Schnell and Zwahlen (1996)
began to develop a visibility model for pavement markings. Obro (1990) describes an early Danish attempt
to formulate a visibility model for pavement markings. DELTA (1997) includes a more mature Danish
visibility model that includes field validations.
Two theoretical studies present results that make it possible to compare field measurements with
theoretically calculated predictions. Those studies are Blaauw and Padmos (1982) and DELTA (1997).
The Blaauw and Padmos study is the more comprehensive of the two. It addressed visibility distances for
new and old markings under both wet and dry conditions. The findings of Blaauw and Padmos are
summarized in Table 6.
Table 6Comparisons between empirical and calculated visibility distances for painted and thermoplastic lane
markings under low-beam illumination without oncoming vehicles.
Condition of markings New Old
Condition of the road Dry Wet Dry Wet
Field Studies 50 – 87 m 34 – 38 m 30 – 65 m 27 – 33 m
Calculated Visibility 40 – 75 m 70 – 80 m 60 – 95 m 20 – 70 m

33
Calculated visibility distances are generally longer and have wider ranges than real-life detection
distances. (One pattern in Table 6 is somewhat puzzling: The calculated lower range of visibility for new,
wet markings is longer than for new, dry markings.) Later models (Schnell and Zwahlen, 1996; and
DELTA, 1997) produce predictions that are more consistent with empirical data.
We have not found any extensive studies of visibility of either profiled pavement markings or raised
pavement markers (studs). Therefore the calculated visibility distances for these two types of lane
markings (as presented by Blaauw and Padmos (1982)) are listed in Table 7.
Table 7Calculated nighttime visibility (m) for profiled pavement markings and raised pavement markers
(studs) by low-beam headlamps under varying conditions.
Condition of markings New Old
Condition of the road Dry Wet Dry Wet
Profiled pavement markings 110 – 120 m 90 – 100 m 80 – 90 m 75 – 80 m
Raised pavement markers 150 – 250 m 110 – 200 m 75 – 125 m 80 – 135 m
The data in Table 7 should be handled with care, however. Both of these types of lane markings
appear to be superior to traditional markings, especially on wet roads. However, whether profiled lane
markings are superior for short-range road guidance in daylight has not been determined.
Raised pavement markers exhibit superior visibility over other types of markings, especially in rainy
and wet conditions. An interesting effect observed in empirical studies is that wet conditions increase the
photometric performance of some raised pavement markers. Whether this is related to a self-cleaning
process, more light reflected towards the markers in wet conditions, or both, is unknown. One reason why
studs are not used frequently in parts of the world where snow is common is that it is hard to design them
in such a way that they can withstand damage from snow plows. Recessed (snowplowable) markers have
been specially designed for use in areas where damage would otherwise result to typical raised pavement
markers.
The differences between empirical visibility measurements and calculated visibility have been
mentioned previously. Both are necessary because practical considerations (e.g., expense and time)
sometimes prevent field measurements. Thus, it is vital to know the relationship between real world
visibility and photometric performance so that visibility can be predicted with acceptable precision.
Field measurements of visibility do not always correspond to true values in real traffic where drivers
are not equally prepared and focused, and where their headlamps are not well maintained. The true values
are certainly shorter. Roper and Howard (1938) calculated an attention factor of two to transform
experimental visibility distances to real traffic visibility. That is to say, in real traffic situations detection
distances are often only half as long as those distances obtained in experimental situations.

34
3.5.4 Relationship between photometric values and visibility
Photometric measurements are taken as a substitute for visibility measurements for various reasons.
They are simple and inexpensive to carry out. However, in order for them to be meaningful, it is necessary
to know their relationship to visibility. In this section we will compare subjective and objective visibility
data with corresponding photometric values. The goal is to determine whether it is possible to recommend
specific photometric values for minimum safe visibility.
Interest has been focused on the variability of the photometric measurements. This variability
reflects the reliability of photometry. Unfortunately, few studies have been conducted on the relation
between physical and behavioral results. Such a relationship would indicate the degree of validity of
photometric measurements.
Blackwell (1946) reported a series of studies on visibility as a function of object size, ambient
luminance, and contrast. Results from this report have been used to calculate the visibility of pavement
markings (Allen, O’Hanlon, and McRuer, 1977; and Blauuw and Padmos, 1982). However, such
calculations need to be validated.
Subjective visibility
Croteau (1977), unfortunately, used a relatively crude method to measure photometric properties,
and therefore his data were not used here.
Serres (1981) related the coefficient of retroreflected luminance (RL) to the evaluation obtained from
a number of subjects whose task was to say whether the brightness was acceptable or not. The RL values
varied from 70 to 300 mcd/m2/lux. The report concludes that the minimum coefficient of retroreflected
luminance for replacement of the markings should be 100 mcd/m2/lux, and that a value below 150
mcd/m2/lux is not acceptable to the average observer. Both values seem low. Requirements are always a
compromise between what is needed and what is technically possible. It is pointless to write requirements
that no marking can reach. Today new technologies make it possible to reach higher values than previously
obtainable.
Ethen and Woltman (1986) used the same measuring geometry (Ecolux) as Serres to study
subjective visibility in seven steps under ideal conditions. They mention the need to simulate more real
conditions such as oncoming glare, curves, rain, misaimed headlamps, and impaired drivers, which are
normal in real traffic. The RL values varied between 20 and 1,100 mcd/m2/lux. They summarized their
results by reporting the relationship between subjective visibility and the coefficient of retroreflected
luminance for dark roads with low beams, and dark roads with low beams and street lighting in terms of
two regression equations. Both indicated that visibility is related to the log-value of RL , with a correlation
of 0.93. Ethen and Woltman (1986) concur with Serres’ recommendation of 100 mcd/m2/lux for
replacement of markings. However, they argue that the acceptable RL value for new materials should be
higher: at least 400 mcd/m2/lux on dark roads, and at least 300 mcd/m2/lux on lighted roads.

35
Graham and King (1991) used pavement markings with RL values between 17 and 371 mcd/m2/lux.
Young subjects rated the visibility in three steps (less than adequate, adequate, and more than adequate).
They concluded that 100 mcd/m2/lux was an adequate performance. They suggest, however, that under
more realistic conditions higher values are needed. Consistent with the findings of Ethen and Woltman
(1986), visibility was found to be related to the log value of RL, with a correlation of 0.89.
Hedblom et al. (1993) studied suprathreshold visibility. They found that measuring RL by using
standard geometries did not correlate well with subjective evaluations. However, when they modified the
photometric measurements to better agree with the actual situation, the correlation improved greatly.
Jingryd (1995) found that the correlation between subjective visibility in daylight and the respective
Qd was 0.81, while between subjective night visibility and the respective RL was 0.61.
Objective visibility
Rumar and Ost (1974) obtained visibility distances of 250 m in daylight, 110 m using high beam,
and 50 m using low beams. (This study, however, did not fully control all relevant photometric variables.)
Dierks and Runhage (1983) conducted three well-controlled experiments on a real road or a closed track.
The level of retroreflection (as measured by an Eriksen retrometer) was varied by changing the bead
concentration. The main conclusion was that visibility was related to the log value of RL, with a correlation
coefficient of 0.89.
In a pilot study, Helmers and Lundkvist (1991) also varied the RL values by changing the bead
concentration in the markings. Both dry and wet road conditions were used, under both low- and high-
beam illumination. The relationships between the coefficient of retroreflected luminance RL (as measured
by an LTM 800 retrometer) and visibility distance to the pavement marking in a variety of conditions were
reasonably well described by log functions (with correlation coefficients between 0.73 and 0.85).
The above studies are consistent in finding that visibility is related to the log of the coefficient of
retroreflected luminance. However, what also needs to be established is the relationship between
photometric (or visibility) performance and safety. Lee, Maleck, and Taylor (1998) attempted to address
that issue. Pavement markings in four areas of Michigan were monitored for retroreflective performance.
Parallel to this, data on night accidents relevant to pavement markings were also collected. No correlation
was found between the retroreflection measurement (as measured by a Mirolux-12 retrometer) and accident
rates. However, all markings passed the Michigan minimum retroreflectivity level for repainting (100
mcd/m2/lux) during the duration of the study, possibly accounting for the lack of correlation.
The one referenced study on raised pavement markers (Michaut and Bry, 1985) provides two points
only. A coefficient of luminous intensity of 50 mcd/lux yielded a visibility distance of 150 m, and a
coefficient of luminous intensity of 100 mcd/lux yielded 170 m. That indicates that the visibility of studs
could also be related to the logarithm of the retroreflected performance.
Jacobs et al. (1995) studied a number of pavement-marking products, which varied in their level of
retroreflectance. Their RL values ranged from 70 to 300 mcd/m2/lux. Detection distances were measured
under both static and dynamic conditions. However, no regression equations between visibility and the log

36
RL were calculated. The dynamic detection distances were considerably lower than the static ones (by 30 to
40%). Finally, their data were compared against the data from Zwahlen (1997). The comparison indicated
a high degree of correspondence in the relationship between visibility and RL in each study.
Sorensen (1998) developed a visibility model for pavement markings based on a number of basic
variables, such as luminance and size of the marking, veiling luminance, and the age of driver. On the basis
of these variables, he calculated a “visibility level.” A comparison was made between the results of
calculations with this model with the visibility distances obtained in an empirical study. This comparison
demonstrated that the model worked quite well.
Schnell and Zwahlen (1996) have developed a computer model for estimating pavement visibility.
The model, CARVE (Computer Aided Road-marking Visibility Evaluator), has been calibrated and
validated in a number of studies. In the latest study (Zwahlen and Schnell, 1998), driver age was
investigated in order to include that variable in the CARVE model. Age proved important because the
visibility level of the older drivers (average age 68 years) was 45% less than the visibility levels obtained for
the younger group (average age 23 years).
3.5.5 Conclusions
To conclude, the visibility offered by present lane markings at night is too short from a safety point
of view. Indeed, visibility would need to be doubled in dry conditions and tripled in wet conditions to reach
minimum levels considered “safe.”
Visibility of traditional pavement markings is related to the log of the coefficient of retroreflected
luminance (RL) expressed in mcd/m2/lux and measured with the standard measuring geometry. Higher
correlations are achieved when the pavement markings are measured using real traffic geometry.
3.6 Design characteristics of lane markings
Design characteristics refer to properties of the lane markings that do not directly relate to their
retroreflective characteristics. The main characteristics are color of pavement marking, line width, solid
versus dashed lines, length of line/length of gap ratio for dashed lines, and single versus double lines.
These characteristics have been touched upon several times in the preceding sections. Here we will only
summarize the main findings, and add what has not been discussed earlier.
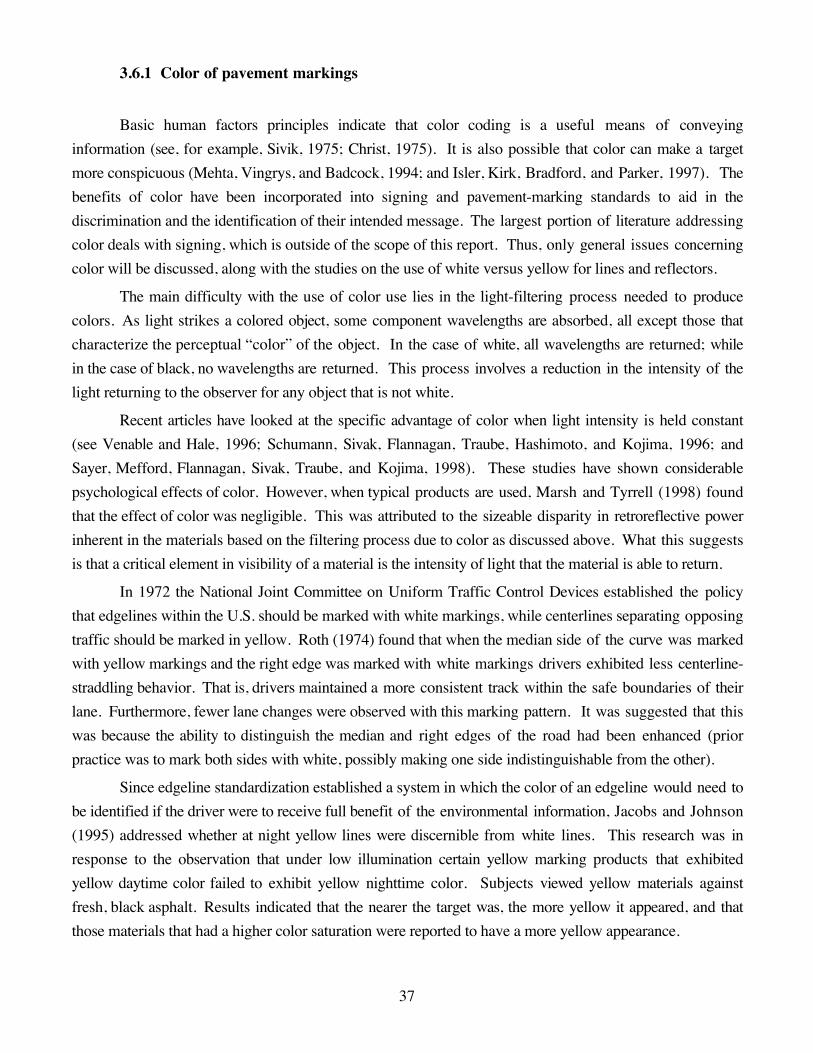
37
3.6.1 Color of pavement markings
Basic human factors principles indicate that color coding is a useful means of conveying
information (see, for example, Sivik, 1975; Christ, 1975). It is also possible that color can make a target
more conspicuous (Mehta, Vingrys, and Badcock, 1994; and Isler, Kirk, Bradford, and Parker, 1997). The
benefits of color have been incorporated into signing and pavement-marking standards to aid in the
discrimination and the identification of their intended message. The largest portion of literature addressing
color deals with signing, which is outside of the scope of this report. Thus, only general issues concerning
color will be discussed, along with the studies on the use of white versus yellow for lines and reflectors.
The main difficulty with the use of color use lies in the light-filtering process needed to produce
colors. As light strikes a colored object, some component wavelengths are absorbed, all except those that
characterize the perceptual “color” of the object. In the case of white, all wavelengths are returned; while
in the case of black, no wavelengths are returned. This process involves a reduction in the intensity of the
light returning to the observer for any object that is not white.
Recent articles have looked at the specific advantage of color when light intensity is held constant
(see Venable and Hale, 1996; Schumann, Sivak, Flannagan, Traube, Hashimoto, and Kojima, 1996; and
Sayer, Mefford, Flannagan, Sivak, Traube, and Kojima, 1998). These studies have shown considerable
psychological effects of color. However, when typical products are used, Marsh and Tyrrell (1998) found
that the effect of color was negligible. This was attributed to the sizeable disparity in retroreflective power
inherent in the materials based on the filtering process due to color as discussed above. What this suggests
is that a critical element in visibility of a material is the intensity of light that the material is able to return.
In 1972 the National Joint Committee on Uniform Traffic Control Devices established the policy
that edgelines within the U.S. should be marked with white markings, while centerlines separating opposing
traffic should be marked in yellow. Roth (1974) found that when the median side of the curve was marked
with yellow markings and the right edge was marked with white markings drivers exhibited less centerline-
straddling behavior. That is, drivers maintained a more consistent track within the safe boundaries of their
lane. Furthermore, fewer lane changes were observed with this marking pattern. It was suggested that this
was because the ability to distinguish the median and right edges of the road had been enhanced (prior
practice was to mark both sides with white, possibly making one side indistinguishable from the other).
Since edgeline standardization established a system in which the color of an edgeline would need to
be identified if the driver were to receive full benefit of the environmental information, Jacobs and Johnson
(1995) addressed whether at night yellow lines were discernible from white lines. This research was in
response to the observation that under low illumination certain yellow marking products that exhibited
yellow daytime color failed to exhibit yellow nighttime color. Subjects viewed yellow materials against
fresh, black asphalt. Results indicated that the nearer the target was, the more yellow it appeared, and that
those materials that had a higher color saturation were reported to have a more yellow appearance.

38
Zwahlen, Hagiwara, and Schnell (1995) studied the visibility of yellow pavement markings when
certain percentages of their reflective material had been removed, thus reducing the total reflective surface
area. This approach to reducing luminance was taken because a reliable method for introducing consistent
material wear could not be found. Results indicated that the original centerline marking treatments provided
barely adequate visibility performance, and could thus only sustain a loss of 5 to 10% before the visibility
performance of the system fell below acceptable levels.
Zwahlen and Schnell (1995) studied the effect of line width and color (white and yellow). Although
they did not aim to compare the effect of color, it is possible to do so from their data since the effect of the
line widths they studied was very small. From their data it could be concluded that the detection distances
for the yellow lines are approximately 20% shorter. Based on the general color discussion above
concerning the real-world relationship between color and the intensity of light, this finding is not
surprising. Yellow provides less retroreflected light than white under otherwise constant conditions. Thus,
one would expect it to have a shorter visibility distance.
Zwahlen and Schnell (1996) asked subjects to indicate end detection (when the lane marking stops).
High-retroreflectivity white yielded the farthest detection, followed by high-retroreflectivity yellow and
medium-retroreflectivity white, which performed equally well. Both yellow and white low-retroreflectivity
materials resulted in the shortest detection distances. No statistically significant effect for color was found
in this study, so no change in the existing policy of yellow median edgelines and white right edgelines were
recommended. There was, however, a large, significant effect for retroreflectivity. It was noted that even the
most visible material, high-retroreflectivity white, would allow only a 2.5 s preview time (when traveling at
90km/h). To lengthen detection distance and enhance safety, a recommendation was therefore made to
explore materials that produce higher retroreflectivity values.
3.6.2 Line width
In general, line width has an effect on driver behavior. Specifically, the lateral distance from the
edge of the road tends to be positively correlated with line width. In other words, as the width of the
edgeline increases, so does the distance from that line. However, an apparent discrepancy in the literature
was seen in the series of studies done by Lundkvist and his colleagues in Sweden (Lundkvist, Ytterbom,
and Runersjo, 1990; Lundkvist, Helmers, Nilsson, Ytterbom, and Runersjo, 1990; Lundkvist, Ytterbom,
Runersjo, and Nilsson, 1992; and Carlsson and Lundkvist, 1992). In these studies new line patterns that
were both wider and solid (versus dashed) were tested, and it was found that drivers positioned themselves
farther from the centerline. While, superficially, this is contrary to the findings of existing literature, it must
be acknowledged that the lane and shoulder widths were also changed simultaneously. Because the lanes
were much wider in the experimental condition, it could very well be that the vehicle positioning change was
more a function of the lane width than the line width or style.

39
Line width should have an effect on lane-marking visibility, because a wider line contains more
retroreflective material and should therefore provide more light to the driver. In a series of studies, Zwahlen
and colleagues (Zwahlen, Hagiwara, and Schnell, 1995; Zwahlen and Schnell, 1995; Zwahlen, Hagiwara,
and Schnell, 1995; Zwahlen and Schnell, 1997a) varied the width of the lines from 5 cm to 20 cm. The
results showed a tendency for longer visibility distances with increasing line widths, and in most of the
studies the differences were statistically significant. DELTA (1997) described an unpublished Swedish
study that showed a statistically significant difference in detection distances between 10-cm wide lines and
30-cm-wide lines. Overall, the wider lines were detected approximately 30% sooner than the narrower
lines.
3.6.3 Solid versus dashed lines
As indicated in Table 2, vehicle lateral edge-to-edge separations were found to be closer when
edgelines were solid as opposed to dashed. It may be that a solid line is more imposing and thus it causes
drivers to shy away from it. However, as indicated earlier, these differences were small and any improved
vehicle positioning performance may be negated by symbolic information that is provided by line type.
This is a subject for further study.
In a series of studies, Zwahlen and his colleagues (Zwahlen, Hagiwara, and Schnell, 1995; Zwahlen
and Schnell, 1995; Zwahlen, Hagiwara, and Schnell, 1995; Zwahlen and Schnell, 1997a) studied detection
distances for solid and dashed lines. They concluded that solid lines are detected significantly earlier than
dashed lines. The differences ranged from 10 to 50%, with wider lines increasing the differences.
3.6.4 Line length and line gap configuration
The question of line length and line gap configuration in pavement markings is one that is at the
very heart of the decision-making process concerning pavement markings: What is the least expensive
alternative that still conveys vital guidance information to the drivers? The shorter the lines and the larger
the gaps, the less expensive the material is. However, to be effective and worth the cost of installation, the
marking pattern must still serve its fundamental purpose: to be detectable and safely guide the driver.
Oliver (1977) tested a new configuration of 3-m lines with 9.1-m gaps against the standard at that
time of 4.6-m lines with 7.6-m gaps. No significant difference was found. Therefore, it was recommended
to implement the new configuration in an effort to minimize the cost.
Dudek, Huchingson, and Woods (1980) conducted an extensive investigation of ten line-to-gap
configurations, with line lengths ranging from 0.3 to 2.4 m and gap lengths ranging from 5.5 m to 14.6 m.
There were no significant differences in speed among the ten conditions studied. However, there were
significant differences in vehicle positioning. Patterns with short line lengths separated by extensive gaps
were associated with missed curves and wide lateral position deviations from the centerline during daytime
tests. Furthermore, subjects rated these short line-to-long gap ratios as difficult to track. At night, no

40
significant performance differences were found, but subjects rated the 2.4 m/9.8 m configuration the best,
and the 0.6 m/11.6 m configuration as the worst.
Dudek, Huchingson, Creasey, and Pendleton (1988) studied the effects of lane-marking
configurations on driver behavior in work zones. Areas were marked with the following line/gap
configurations: 0.3 m/11.9 m, 0.6 m/11.6 m, and 1.2 m/11.0 m. Performance and ratings indicated that all
configurations performed equally well under the test conditions (relatively flat, two-lane, two-way, high-
speed roadways), but the authors cautioned against generalization to roadway conditions not represented in
the study.
Harkey, Mera, and Byington (1993) compared driver performance in work zones when marked with
three types of line/gap configurations: 0.6 m/11.6 m, 1.2 m/11.0 m, and 3.0 m/9.1 m. Significant
differences were found in driver performance. Specifically, drivers drove faster and positioned their
vehicles closer to the centerline in the 3.0 m/9.1 m condition than in either of the other two conditions.
Additionally, lateral position variability (consistency of track) and the number of lane encroachments both
decreased as line length increased. The differences were magnified during periods of adverse weather (rain,
wet roads).
The visibility of line/gap configurations of 3.0 m/9.1 m and 1.2 m/11.0 m have been studied by
Zwahlen and his colleagues (Zwahlen, Hagiwara, and Schnell, 1995; Zwahlen and Schnell, 1995; Zwahlen,
Hagiwara, and Schnell, 1995; Zwahlen and Schnell, 1997a). As expected, there was a clear tendency for
farther visibility distances for the lines with longer lines and more narrow gaps. However, the overall
differences failed to reach statistical significance. It was concluded that increasing the amount of pavement
marking material by means of increasing the line length and decreasing the gaps does not pay off
proportionally in increased visibility. (It should be pointed out, however, that when the visibility is too short
there may be a payoff anyway.)
3.6.5 Single versus double lines
The data from Zwahlen and his colleagues (Zwahlen, Hagiwara, and Schnell, 1995; Zwahlen and
Schnell, 1995; Zwahlen, Hagiwara, and Schnell, 1995; Zwahlen and Schnell, 1997a) indicate that the main
factor that influences visibility is the amount of retroreflective material. Whether this is accomplished with
one wide line or two narrow lines was not important. No effect was found for the lateral separation
distance between double lines.
3.6.6 Conclusions
Color has been used sparingly as a method to distinguish pavement markings (much less than in
traffic signs). In the U.S., yellow separates lanes of opposing traffic, while white separates lanes with same
direction of travel and marks the roadway edge. However, using color reduces the amount of light reflected
to the driver and thus the visibility of the marker. With recent advances in retroreflection technology it may

41
soon be the case that inexpensive materials with high retroreflective power are available in a wide array of
colors. At that time, research should investigate the potential for use in the roadway environment given the
advantages of symbolic coding and conspicuity. Until then, however, color use should remain limited.
Edgeline width has been shown to influence drivers’ lateral positioning. As the width increases,
drivers track on a course that is farther from the edge of the road (closer to the centerline). This may be of
use to traffic engineers. For example, in areas where there are hazards along the road (e.g., ditches, rocky
terrain, bridges, curves, etc.), or narrow or no shoulders, it may be advantageous to use wider edgelines that
have greater visibility and thus minimize the chances of dangerous roadway excursions. In areas where
there is a smaller danger should a vehicle momentarily leave the road, narrower edgelines could be used to
maximize lateral separation of oncoming vehicles and thereby minimize chances of head-on collisions.
Standard edgeline delineation practices in the U.S. and many European nations involve the use of
solid lines. The goal of edgeline marking is to delineate the roadway and enhance driver knowledge of the
environment. It follows that as drivers’ knowledge of the roadway increases, roadway excursions and
accidents decrease. To that end, solid edgeline markings have an advantage over dashed lines because they
are more visible, and they tend to move drivers farther away from the edge.
The results on the effects of line-to-gap ratio for dashed lines are not consistent. In general, those
that find an effect, be it driver performance or rating, indicate that longer lines are preferable over shorter
lines. If an error is to be made, it is better to side with caution. To that end, ratios consisting of short lines
with long gaps should be avoided pending evidence to the contrary.
Finally, the question of the superiority of single or double lines seems largely unresolved. The
issue, stripped of the value of symbolic coding, seems more fundamentally linked with the visibility of the
materials. This can usually be summed up with the phrase, “there is never too much of a good thing.”
That is, the greater the visibility the better the marker will delineate the roadway and guide the driver.
3.7 Road and weather conditions
There are several road and weather conditions that influence the visibility of lane markings. They
include wear, dirt, rain, fog, frost, and snow. Except in the case of rain and wet pavement markings, very
few studies exist that evaluate the influence of these conditions on pavement-marking effectiveness.
3.7.1 Wear and dirt
Wear removes parts of the markings, particularly the retroreflective parts (e.g., the beads). Wear is
especially severe in areas where there is snowfall. Damage resulting from the use of snowplows and tire
studs or chains forces these areas to replace or repair the markings every spring in order to return the
materials back to their effective condition. Damage caused by plows and traction aids may be reduced with
the implementation of recessed pavement markers or durable, high-quality, raised markers (see, for
example, Epstein, Grieser, Preston, and Moeller, 1975).

42
The effects of dirt on Swedish roads has been studied by Rumar and Ost (1974). Dirt primarily
covers the markings at a relatively rapid rate. Rumar and Ost (1974) found that pavement markings may
lose up to 75% of their retroreflected luminance, from a one-week accumulation of dirt. The effect on
daytime visibility was limited. In nighttime, on the other hand, there was a visibility loss of about 30%
when using low beams, and about 50% when using high beams. While pavement markings are partly self-
cleaning (probably due to rain and wear), pavement markings get dirty together with headlamps.
Consequently, the combined effect of dirt on visibility may be substantial. In the study by Rumar and Ost,
only the markings were dirty.
3.7.2 Rain and water
Rain is probably the most common adverse condition. When roads become wet, a thin layer of
water covers the retroreflective material surface, thereby making most horizontal materials optically
ineffective. The smoother the road is, the more sensitive to water the painted markings are. Therefore
rough road surfaces offer better visibility for painted pavement markings than smooth road surfaces. One
method for combating the deleterious effects of rain is to use larger glass beads in the paint, because the
larger beads are tall enough to stand above the thin layer of water. The disadvantage of this approach is that
larger beads are also more susceptible to damage and high rates of loss, making them economically
unattractive (see Ritter, 1978; Kalchbrenner, 1989; and O’Brien, 1989).
Other methods of raising pavement markers above the water level have also been developed.
Profiled markings with vertical parts are less sensitive to the effects of standing water, but have the
disadvantage of being vulnerable to snowplow blades (Jingryd, 1995). Raised pavement markers are
relatively insensitive to water, with one exception. Some types of snowplowable raised pavement markers
are placed in grooves cut into the pavement. As these grooves fill with water, light from the headlamps is
reflected off the surface of the water and never reaches the retroreflector, thus the pavement marker ceases
to be a visual aid to the driver. Tooke and Hurst (1975) comprehensively evaluated the field performance
of a variety of pavement markings available at that time. There was a dramatic decrease in retroreflective
performance when the marking became wet, except for prismatic buttons and rod buttons. Indeed, water
actually enhanced the retroreflective performance of these two latter materials. King and Graham (1989)
produced similar results when measuring nighttime wet and dry performance of 15 different materials.
Again, while some materials faltered with the presence of water, others actually improved as water volume
increased.
Lee, Hostetter, and Leibowitz (1991) also addressed the potential of enhancing night guidance in
wet conditions by manipulating the size, shape, and spacing of such markers. Their study found the best
performance for large rectangular edgeline post markers, spaced at intervals consistent with the
recommendations in the Manual for Uniform Traffic Control Devices. However, these results are to be
regarded with caution, because the method involved recognition of road paths for simulated, digitally altered
scenes that may or may not have represented actual situations.

43
3.7.3 Fog and dew
When light from the headlamps, as well as from the retroreflective materials, passes through fog, it
is deflected and filtered. Consequently, the retroreflective performance of the materials is reduced. Also, in
fog situations, dew is often able to get between the lens and the retroreflective materials, further reducing
their retroreflective performance. Dew can form in any moist condition and will have an adverse effect with
or without any fog present.
Potash and Brown (1988) evaluated the problem of road delineation and visibility difficulties and
suggested the following standards regarding color and placement of raised retroreflective markers: (1) To
delineate lanes, use yellow markers on the left and white markers on the right and place at 30 m intervals.
(2) To delineate same-direction multilane roads using white markers simulating standard dashed line
segments (with 30 m lines, 90 m gaps), place one reflector at the beginning, middle, and end of each line
segment. Hagiwara, Yagi, and Seo (1996) attempted to create a delineation treatment that would function
well in fog conditions. Visibility was evaluated for a novel laser-beam delineation method in a laboratory-
simulated fog. Results showed promise, but the use of the system was not recommended until the practical
consideration of developing ways of shielding the system to prevent drivers from looking directly at the
beam (while retaining beam visibility).
Blauuw and Padmos (1982) calculated the effects of fog and dew on pavement-marking visibility.
They report that a slight fog (sight distance of 1km) reduces visibility of most pavement markings by about
10%, except for dry, raised, reflectorized pavement markings, which are affected more. Heavy fog (sight
distance of 0.2 km) results in substantially larger losses in visibility (of about 50%). According to the
calculations of Blauuw and Padmos, which are based on extensive light measurements, dew influences are
strongest for raised retroreflective pavement markers. They may, in some cases, lose as much as 95% of
their retroreflective power when exposed to dew.
3.7.4 Snow and frost
Snow, like dirt, covers retroreflective materials. However, snow has a high luminance factor and is
easily visible in automobile headlamps, allowing it to contrast against the darker roads, thus maintaining
edge delineation. What is lost is not the lane demarcation effect of markings (except in thick, recently
fallen snow, when the lane may be totally lost in a uniform white snowfield), but rather the sign and
message components.
Frost is thought to be detrimental to retroreflective markings, but no controlled studies have been
found. However, the effect of the frost crystals is to distort the optical properties of the retroreflective
materials so that they become inefficient.

44
3.7.5 Conclusions
Adverse road and weather conditions constitute the “worst case scenarios” for the visibility of
pavement markings and are thus deserving of attention. Wear causes loss of and/or damage to the
markings, reducing their reflective properties. Advances in durability of materials have decreased this effect
to some degree, but pavement-marker damage continues to be a serious issue in areas where markers are
vulnerable, such as in cold climates that require the use of plows and/or tire traction aids. Dirt covers the
materials, and thus prevents light from entering (and thus from being returned). Markers generally self-
clean during rain, but in areas of high roadway dust or low rainfall, additional cleaning measures or
considerations of alternative marking approaches (e.g., side-post delineators) may be required. Water
blankets the pavement markings with a thin mirror-like sheet that also prevents light from entering the
marking, and, instead, reflects the light away from the driver. Profiled materials with a marked vertical
relief, which are able to penetrate and rise above the layer of water, have demonstrated remarkable wet
visibility. This is especially the case for prismatic and rod buttons. The height of such markers, however,
makes them susceptible to damage.
Fog scatters and filters light both heading toward and returning from reflective pavement markers,
and may thus reduce visibility. The reductions vary from slight to serious, depending on the thickness of
the fog. A new attempt to use laser delineation has shown promise, but it is still in its infancy and many
improvements and field validation tests are required prior to implementation. Dew affects the visibility of
markers by seeping into the marker and obstructing light as it enters. This can be counteracted with careful
assembly and installation of the markers, and the use of sealants with greater durability. Snow covers the
markings and prevents them from being seen. Additionally, it alters the visual contrast between the road
and the shoulder. This can be partially rectified by more efficient snow-removal. Ironically, it is the snow-
removal methods that result in an indirect problem associated with snow—wear and loss of markers
because of the use of snow plows and tire traction aids. Efforts to protect the markers with guards that
permit plow blades to safely pass over the marker have been effective; protecting them by placing them in
recessed grooves is discouraged as these grooves fill with water and limit wet visibility.
3.8 Vehicle and vehicle lighting
Viewing and illumination angles for drivers of heavy trucks and other large vehicles are larger than
for drivers of passenger cars, often twice as large. This difference has two effects. It is generally easier to
see horizontal markings when you are sitting high above the road. However, the difference between the
viewing angle and the illumination angle (the observation angle) is larger and a drawback when it comes to
retroreflection. Retroreflectors have their highest performance in situations where this angular difference
(the observation angle) is zero. Retroreflective efficiency is reduced as the angular difference increases.
These two effects counter one another such that at long distances the retroreflected luminance and
the visibility are approximately equal for drivers of passenger cars and larger vehicles. At shorter distances

45
drivers of large vehicles lose luminance but gain visual angle. Sivak, Flannagan, and Gellatly (1993)
studied road signs and found that truck drivers have nearly the same detection distance to signs as drivers
of passenger cars. However, the ability of heavy-vehicle operators to read signs will be worse because the
amount of reflected light at distances shorter than 150 m may be less than 25% of the retroreflected light
reaching the eyes of a driver of a passenger car at the same distance. The effect of vehicle type on the
visibility of pavement markings is not yet known. On one hand the distances are shorter than for road
signs, and therefore the retroreflected light difference will be larger. On the other hand, the viewing angle is
larger, and therefore the perceived area of the pavement marking should be larger. This problem needs
further study.
A change in the illumination from headlamps will change the luminance and the consequent
visibility of the pavement markings. This relationship is logarithmic. Consequently a reduction of light
intensity by 50% (which is not uncommon due to dirt, corrosion, voltage drop, aging, etc.) is likely to
results in approximately a 20% decrease in marking visibility. Most cars have two low-beam headlamps.
The incandescent and halogen light sources in the headlamps have a limited lifetime. It is common that
only one of the two headlamps is working. A recent study by Sivak, Flannagan, and Miyokawa (1998)
indicated that a loss of one headlamp was the second most import factor in real-world headlamp
performance, second only to vertical aim.
There are two basic low-beam patterns in use—the U.S. and the European beam patterns. The U.S.
low beams provide approximately twice as much light 100 m ahead along the right edgeline (Sivak,
Flannagan, and Miyokawa, 1998). According to Helmers and Lundkvist (1991) a four-fold increase in
headlamp illumination results in approximately a 40% increase of marking visibility. Consequently, the
visibility distance of lane markings using U.S. low beams with no oncoming cars is likely to be about 20%
longer than for European low beams. However, U.S. low beams produce approximately twice the amount
of glare for oncoming cars (at 50 m). Flannagan, Sivak, Traube, and Kojima (1996) have shown that
increasing the seeing illumination by the same proportion as the glare illumination results in a net benefit
for seeing. Consequently, there should be a net advantage for U.S. low beams in terms of visibility of road
markings.
The low-beam systems are asymmetric. Both U.S. and European low-beam patterns project more
light towards the right-hand side than towards the left-hand side. This asymmetry is more pronounced for
the U.S. system than for the European system. Consequently, drivers should be able to see lane markings
farther on the right-hand side than on the left-hand side (in right-hand traffic). Zwahlen and Schnell (1995)
found that in situations with oncoming traffic this difference in visibility is increased because the angle
between the target and oncoming glare is larger on the right-hand side.
Pavement markings tend to appear below horizontal and from seven degrees to the left to seven
degrees to the right in the visual field. This should be taken into account in the design of the headlamps,
because any possible means to enhance pavement-marking visibility should be explored. Projecting more
light from the high- and low-beam light distributions in the direction indicated is one such approach to
enhance visibility.
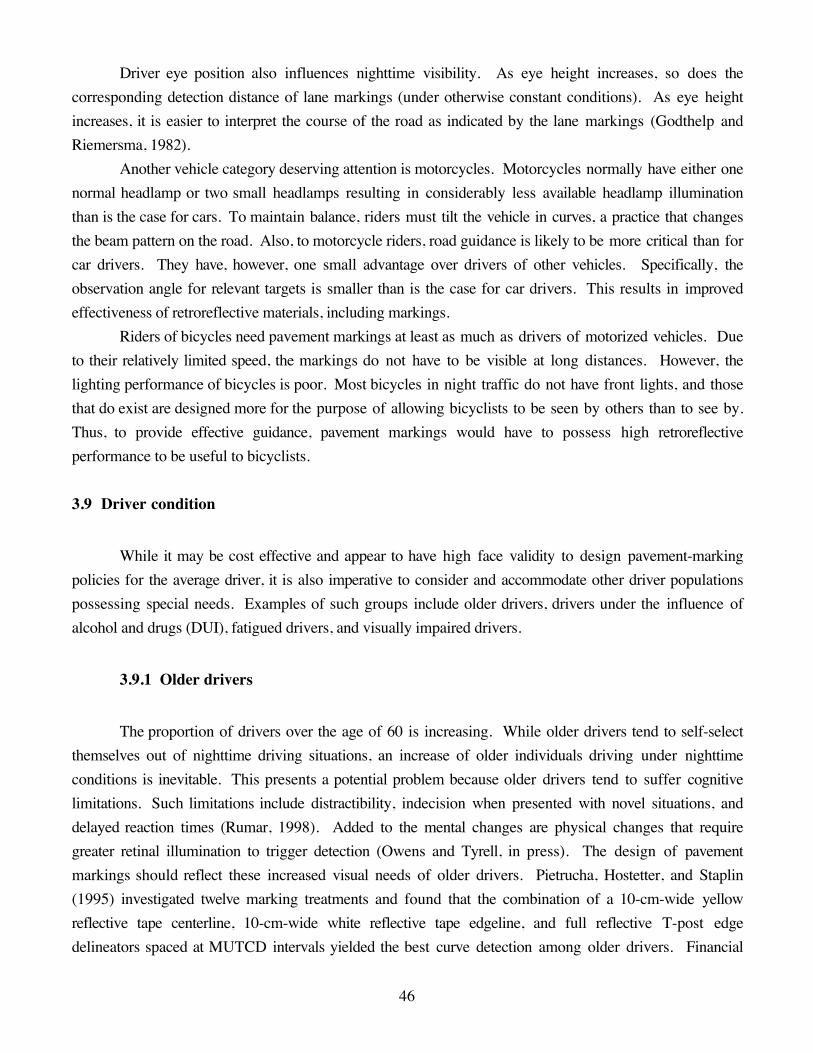
46
Driver eye position also influences nighttime visibility. As eye height increases, so does the
corresponding detection distance of lane markings (under otherwise constant conditions). As eye height
increases, it is easier to interpret the course of the road as indicated by the lane markings (Godthelp and
Riemersma, 1982).
Another vehicle category deserving attention is motorcycles. Motorcycles normally have either one
normal headlamp or two small headlamps resulting in considerably less available headlamp illumination
than is the case for cars. To maintain balance, riders must tilt the vehicle in curves, a practice that changes
the beam pattern on the road. Also, to motorcycle riders, road guidance is likely to be more critical than for
car drivers. They have, however, one small advantage over drivers of other vehicles. Specifically, the
observation angle for relevant targets is smaller than is the case for car drivers. This results in improved
effectiveness of retroreflective materials, including markings.
Riders of bicycles need pavement markings at least as much as drivers of motorized vehicles. Due
to their relatively limited speed, the markings do not have to be visible at long distances. However, the
lighting performance of bicycles is poor. Most bicycles in night traffic do not have front lights, and those
that do exist are designed more for the purpose of allowing bicyclists to be seen by others than to see by.
Thus, to provide effective guidance, pavement markings would have to possess high retroreflective
performance to be useful to bicyclists.
3.9 Driver condition
While it may be cost effective and appear to have high face validity to design pavement-marking
policies for the average driver, it is also imperative to consider and accommodate other driver populations
possessing special needs. Examples of such groups include older drivers, drivers under the influence of
alcohol and drugs (DUI), fatigued drivers, and visually impaired drivers.
3.9.1 Older drivers
The proportion of drivers over the age of 60 is increasing. While older drivers tend to self-select
themselves out of nighttime driving situations, an increase of older individuals driving under nighttime
conditions is inevitable. This presents a potential problem because older drivers tend to suffer cognitive
limitations. Such limitations include distractibility, indecision when presented with novel situations, and
delayed reaction times (Rumar, 1998). Added to the mental changes are physical changes that require
greater retinal illumination to trigger detection (Owens and Tyrell, in press). The design of pavement
markings should reflect these increased visual needs of older drivers. Pietrucha, Hostetter, and Staplin
(1995) investigated twelve marking treatments and found that the combination of a 10-cm-wide yellow
reflective tape centerline, 10-cm-wide white reflective tape edgeline, and full reflective T-post edge
delineators spaced at MUTCD intervals yielded the best curve detection among older drivers. Financial

47
concerns, however, prompted them to recommend a similar system but without the 10-cm-wide white
reflective tape edgeline.
In their study of lane-marking visibility, Zwahlen and Schnell (1996) found that the detection
distances for senior drivers were 45% shorter than those for young drivers. Graham, Harrold, and King
(1996) performed a study investigating the visibility and reflectance needs of the older driver. They found
that a minimum reflectance level subjectively deemed adequate by older participants was 100 mcd/m2/lux.
Recognizing that the test evaluation occurred during relatively good conditions, the authors recommended
that the reflectance level should be increased by 21% to overcome such factors as dirt or fog on the
headlamp lens covers or the windshield. Thus a minimum reflectance level of 121 mcd/m2/lux was
recommended.
3.9.2 Driving under the influence
Alcohol reduces cognitive, perceptual, and motor abilities resulting in improper judgements, missed
detections, and slower reactions. A publication by Potters Industries, Inc. (1981) reported research
conducted to evaluate the use of wide edgelines as an aid for visual guidance of alcohol-impaired drivers.
The results indicate that as edgeline width increased (from 10 cm to 20 cm), drivers maintained a more
consistent lateral distance from the edgeline marking.
Johnston (1983) investigated curve negotiation of drinking drivers as a function of roadway
delineation treatments. It was found that alcohol-impaired drivers initiated a higher rate of corner-cutting
techniques. These driving tactics were initiated too drastically (overcompensation) and too late into the
curve, resulting in a higher incidence of lane departures. It was suggested that these maneuvers were
initiated because the direction and radius of the curve were realized late. In general, addition of increased
pavement-marking navigation aids resulted in a lower speed at the entrance end of the curve, suggesting
earlier detection of the curve characteristics. The use of chevron post delineators was found to result in
higher curve-entrance speeds and more drastic curve-cutting procedures. A hypothesis was presented
suggesting that the chevron alone gave a false sense of security based on knowledge of the direction of the
curve, but the drastic maneuvers were later required because the drivers lacked planning knowledge for the
radius of the curve. Best performance was achieved when chevron signs and wide edgeline-delineation
treatments were combined.
Earlier in this report an analogy was made between handrails and lane markings. This analogy may
be appropriate for drunk drivers in night driving as well. Impaired drivers are more common in night traffic
and they are likely more dependent on good lane markings than other drivers are.
3.9.3 Degraded visual performance
Many additional factors alter an individual’s ability to see well at night. Impaired visual capabilities
may come, for example, in the form of reduced contrast sensitivity (degradation in one’s ability to detect

48
and/or distinguish elements in the environment), or night myopia (nearsightedness exhibited in low-
illumination environments). (See Allen (1984) for a general discussion of such visual deficits.) However,
no studies exist on the effects of such deficits on nighttime driving performance or visual requirements of
pavement markings. Consequently, proper scientific inquiry should be conducted in this area.
3.9.4 Fatigue and distraction
Other special-needs drivers are those with reduced attention, such as physically or mentally fatigued
drivers, or drivers distracted by other tasks. Physical and mental fatigue interferes with the ability to detect,
process, and act upon information critical to navigation and obstacle avoidance. Task diversion is of
growing concern in the current technological age. Increased complexity of driver information systems
(electric navigation aids, etc.), the use of communication equipment (cellular phones, etc.), and eating and
drinking are common during driving. Each works to reduce the attention resources available to the driver,
possibly resulting in missing environmental cues vital to safe travel. Research evaluating the nighttime
visual needs of these drivers is markedly absent. Given the suspected high proportion of drivers at night
that suffer some degree of attention reduction, it is recommended that studies should be carried out to
investigate how such driver populations could best benefit from improved lane-marking systems.
3.10 Friction, noise and other performance factors of lane markings
A safety-relevant aspect of pavement markings that is often overlooked is that most of the pavement
markings reduce friction. This is of limited interest to cars and drivers, which always have at least one pair
of wheels not on a marking, but may be of substantial importance for two-wheelers, such as bicycles and
motorcycles. In wet conditions, the reduced friction may affect the stability of two-wheelers. Many
pavement-marking regulations and standards have requirements for friction, but no studies of this problem
have been located.
Profiled lane markers have been mentioned several times, especially in connection with their
comparatively good performance in wet conditions. However, they also have another good property. They
cause noise when they are driven on. Some standards even mention suitable noise levels for such profiled,
rumbling markings.
3.11 Durability, maintenance, and costs of markings
The durability of pavement markings is well documented in the literature; in fact, a large portion of
studies performed prior to 1980 that compared materials used effective longevity and cost effectiveness as
primary criteria for recommendations. While the durability and wear/damage resistance have direct impact
upon the reflectance, and therefore the visual guidance, offered by the materials, these aspects were
considered of lesser relevance to the overall scope of this report. As a result, such considerations are

49
treated only briefly. Table 8 provides a summary, based on the following publications: McGrath, 1981;
Agent and Pigman, 1983; McNees and Noel, 1986; Tielking and Noel, 1989; Paniati and Schwab, 1991;
Miller, 1992; Chapman, 1994; Migletz, Fish, and Graham, 1994; and Perrin, Martin, and Hansen, 1997.
The earliest and most common form of roadway delineation involved painted lines. This approach
is well suited for daytime road delineation. A problem with typical traffic paint is that it offers very poor
nighttime visibility. This is greatly enhanced with the application of glass beads, but beads are susceptible
to loss and wear, severely deteriorating visual performance. Additionally, when wet water collects on top of
the paint, visibility of the line is partly or completely lost. While paint offers low initial costs, frequent
maintenance quickly increases its overall cost.
Thermoplastics have gained in popularity because of increased life compared with that of traditional
paint, and they offer good night visibility and better visibility than painted lines in wet conditions. The
thickness of the material keeps it above shallow standing water, which normally renders painted lines
invisible. Thermoplastics, however, are susceptible to damage from snowplows.
Preformed tape lines have the same benefit of thermoplastics in that they are thick enough to stand
above shallow water, and thus possess better wet visibility than painted lines. Unlike thermoplastics, they
conform better to the pavement, and are thus less likely to be damaged by plows. This advantage comes at
a price. It has been noted that in areas of high traffic volume, or where high rates of lane changes are
prevalent (e.g., near an exit ramp), the material may tend to shift.
Epoxies are typically used in areas where cold weather makes other treatments difficult to use
because of the potential for plow damage. Reflectance tests indicate that they still remain effective after a
year of wear and plow use. Costs of routine maintenance, long curing times, and installation procedures
that are unforgiving of errors are the negative factors associated with the use of epoxies.
Polyesters are of relatively low cost and have consistent performance over many years of service.
Additionally, they can be easily applied on top of existing markings with little or no pavement preparation.
However, they require long drying times, and the chemical catalyst used during application is toxic and
must be handled with extreme care.
Epoflex is the name given to the epoxy-thermoplastic hybrid material. It has remarkably short dry
time (about 5 s). This property, while making it attractive for quick installation and for minimizing traffic
disruption by work crews, also makes it difficult to time the application of drop-on beads for reflectivity. If
the material is too dry when the beads are added, they will not adhere to the surface and the treatment
reflectivity will suffer greatly from bead loss.

50
Table 8Comparison of major pavement marking techniques.
MarkingMaterial
Life span UnitCosts*
Advantages Disadvantages
Paint •1-3 yrs. cold 1 •Easy installation•Low initial cost
•Short life span•Poor wet-nightvisibility•Year-round delineationin severe weather areasmay be impossible
Thermo-plastic
•1 yr. cold•10 yrs. warm
10 •Good dry visibility•Long life span (warm)
•Short life span (cold)•Sensitive installation
Preformedtape
•2 yr. cold•8 yrs. warm
13-20 •Easy installation•Long life span (warm)•High reflectance•Long color life•Short traffic disruption•Easy to repair
•May shift under hightraffic volumes
Epoxy •1-5 yrs. 8 •Less energy to apply•Effective 12 mo. reflectance(lasts winter)
•Long cure time•Very unforgivinginstallation•Special equipmentrequired
Polyester •3-4 yrs. 5 •Consistent performance•Low cost•Applies over existingmarkings
•Long dry times•Abrasion/bond failureproblems•Careful handling ofcatalyst•Mixture of componentsmust be set precisely
Epoflex •2 yrs. cold•10 yrs. warm
1 •Low cost•Minimal traffic disruption•Quick dry•Can be applied in low temp•Long life span•Good reflectance
•High installation temp.•Requires new equip.•Short time window forbead application toensure good bonding
Raisedmarkers(studs)
•1-20+ yrs. ? •Potential long life span•Excellent night visibility•Excellent wet visibility
•Poor day delineation•Only spot delineation•Vulnerable to plows•Higher initial cost
*Unit costs were employed due to the changing nature of monetary values. Estimates in U.S. dollars perlength collected from several articles were used to calculate the relative relationship among the treatments.Numbers represent multiples of cost; a rating of 5 indicates a relative cost being five times the cost of aproduct rated as 1.

51
Raised pavement markers have gained widespread popularity primarily in warmer climates due to
their excellent nighttime and wet visibility. Their high profile allows them to retain reflectivity in deeper
water than other treatments. This characteristic, however, is their downfall in colder climates where damage
from plows severely affects the retention rates and reflective abilities. To counteract this, ceramic or metal
shields have been used to allow the plow blade to pass safely over the reflector without damaging it. Loss
in this case comes primarily from pavement fault as the pavement the shield is attached to breaks away.
Attempts have also been made to protect the markers by inserting them into the pavement. While this
protects them from plow damage, placing them in grooves negates their wet visibility as the grooves fill with
water. Shape influences marker loss; round markers are found to be retained longer. Cost for this
treatment was not entered into the above table because raised markers are primarily used for spot
delineation in combination with other treatments (partly to create a system that is visible during both day
and night) and not solid or long-dash markings. While it is not directly comparable to cost measures for
other products, each individual marker may cost anywhere from 50 to 2,500 times that of 30 cm of paint.
This seemingly overwhelming cost is often made up for by comparatively excellent visibility and a near
limitless life span when properly protected.
3.12 Regulations and standards
This section is based on the most up-to-date regulations found in the literature, and on the proposed
European standard for pavement markings, which is expected to be adopted shortly.
There are three levels of standards concerning pavement markings. The first step consists of
specifying the design, dimensions, and color of pavement markings for different purposes. The road users
should always be able to trust that a specific marking has the same meaning. The goal is to reach
uniformity. The second step involves introducing technical specifications for the materials. The goal here
is to facilitate laying out the markings and to guarantee a minimum level of durability. The third step
consists of specifying photometric and other road-safety requirements. The goal is to make certain that the
markings fulfill certain minimum road-safety standards.
The desirable dimensions of various pavement markings in a variety of situations are discussed by
Freedman, Staplin, Gilfillan, and Byrnes (1988) and ECTM (1975). These documents cover such topics as
lane width, stroke length, gap interval, thickness and color for edgelines, centerlines, and lane markings on
various types of roads.
The European standard also contains a number of technical performance requirements (CEN,
1996). For example, it addresses types of beads, resistance to wear, deformation characteristics, softening
points, alkali resistance, cold impact, heat stability, UV aging, and adhesion properties of various types of
pavement markings on different types of roads. The compliance of 21 thermoplastic materials with these
physical requirements was tested by Edwards and Astrom (1997). None of the spray plastic markings
passed all tests, and only three of the extruded plastic markings passed all tests. The corresponding U.S.
technical standards are specified in various ASTM documents.

52
Most European national standards and regulations require minimum performance of the pavement
markings concerning these aspects:
• luminance coefficient under diffuse illumination (Qd)
• coefficient of retroreflected luminance (RL)
• skid resistance
• functional life
• luminance factor (β) and color coordinates (when relevant)
The almost completed European Union Standard (CEN, 1997) was produced by the Technical
Committee CEN/TC 226. When it becomes a European standard, it will be compulsory for the 18 CEN
members (the 15 members of the European Union, plus Norway, Iceland, and Switzerland). This standard
specifies the performance of white and yellow pavement markings, as expressed by their reflection in
daylight and under road lighting, retroreflection in vehicle headlamp illumination, their color, and skid
resistance.
The following four parameters are the main variables specified in the European standard:
Luminance coefficient under diffuse illumination (Qd) expressed in mcd/m2/lux. Qd is the quotient
of the luminance of the pavement marking and the illuminance on the pavement marking. Qd represents the
brightness of a pavement marking as seen by a driver in typical daylight or street lighting conditions. The
observation angle is 1.05° and the pavement marking has an area of at least 50 cm2. The measuring
condition is supposed to simulate an observer distance of 30 m and a driver eye height of 1.2 m above the
ground. A simplified way to measure the brightness of the pavement marking is to measure the luminance
factor of the marking (β) when illuminated in an angle of 45° (±5°) and measured at an angle of 0° (±10°).
Coefficient of retroreflected luminance (RL) expressed in mcd/m2/lux. RL is the quotient between
the luminance of the pavement marking in the direction of observation and the illuminance at the pavement
marking on a plane perpendicular to the direction of the incident light. RL represents the brightness of a
pavement marking as seen by a driver at night when the pavement marking is illuminated by standard
headlamps. The (U.S.) observation angle is 1.05° (the European observation angle is 2.29°), and the
illumination (co-entrance) angle is 1.24°. The size of the pavement marking is at least 50 cm2. The
measuring condition simulates an observation distance of 30 m with the eye height of the driver 1.2 m
above the ground and the headlamp mounting height of 0.65 m.
Skid resistance of the pavement marking. The skid resistance is measured on wet pavement
markings by the friction of a rubber slider with the surface. The equipment used is a British Skid
Resistance Tester (SRT) (RRL, 1960).
Functional life of the pavement marking. The functional life is defined as the period during which
the marking fulfills all requirements initially specified by the responsible road authority.
Minimum Qd values are specified for white and yellow markings on two classes for asphalt and
concrete roads. The values for dry markings range from 80 to 160 mcd/m2/lux.
53
The minimum values for the luminance factor (β) range from 0.2 to 0.6. White and yellow colors
are specified by corner points of their chromaticity regions. There are two specifications for yellow
(permanent and temporary).
Minimum RL values are specified for white and yellow when used with one of four classes of
asphalt and concrete roads, and for three classes for temporary markings. In dry conditions the minimum
values range from 80 to 300 mcd/m2/lux. In wet conditions (1 minute after flooding) and in rainy
conditions, the coefficient of retroreflected luminance values range from 25 to 50 mcd/m2/lux.
The friction values are specified for six classes of markings and range from 45 to 65 SRT.
Various ASTM documents specify how photometric measurements of pavement markers (both
lines and raised markers) should be carried out. Although the definitions are somewhat different, the
ASTM specifications look similar to the European specifications. However, as of yet, there are no U.S.
federal photometric standards for lane markings. Many states have, however, implemented such
requirements independently.
Europe is approaching a standardization on photometric measurements and requirements for
pavement markings. Should there be activities towards international harmonization of standards before any
regional requirements are set? Or are the differences between roads, vehicles, and traffic so large that it
would be unrealistic to come up with the same sets of requirements? Regardless of the answer to this
question, it would be worthwhile to agree on the definition of the parameters, the testing procedures, and the
type of suitable requirements.

54
4. SUMMARY OF MAJOR ISSUES AND SUGGESTIONS FOR FUTURERESEARCH
This section will summarize the previous material and will suggest topics for future lane-marking
research. Because this section will cover literature previously surveyed, the appropriate references will,
generally, not be repeated.
4.1 Which criteria should be used to evaluate pavement markings?
Previous studies employed many different criteria for evaluating lane markings. One of the most
frequently used criteria was accident rate. In spite of a large number of studies, the results are not
conclusive. The problem may lie in the complexity of accident causation and/or the complexity of the
effects of pavement markings.
Efforts to evaluate various lane-marking designs using behavioral variables (e.g., speed, lateral
position on the road, and the number of overtakings) have met with little success, because the results are
conflicting and the interpretation of the results is often subjective. Also, the relationship between visibility
and behavioral measures is unclear.
Subjective evaluations have yielded better results. However, no direct comparisons between
subjective and objective visibility have been made. Also, it is difficult to say what the subjective evaluations
are based upon. Perhaps it is a weighted function of perceived comfort and visibility. However, comfort
and visibility estimations may be based both on long-range and short-range visibility, or on a combination
thereof. The uncertainty concerning this issue creates a problem for subjective evaluations of pavement
markings.
In this review we have chosen visibility, as determined by detection distance, as our main criterion
for the evaluation of lane markings. This was done for several reasons. First, our belief is that poor
visibility of lane markings is their main weakness. Marker visibility is not acceptable in normal night
driving, and even worse in degraded conditions. Second, visibility determined by detection distance is
comparatively objective and insensitive to confounding factors. Third, visibility is closely related to the
retroreflective performance of the lane markings. Fourth, because of this relationship between photometric
properties and visibility, it is possible to develop useful visibility models.
Detection distance is probably the most important aspect of visibility, but it is a threshold measure.
Another type of visibility is suprathreshold visibility. This refers to the visibility of the markings within the
detection distance range. This may be of interest if there are two types of road guidance (i.e., short-range
and long-range).
The qualitative question of suitable criteria to evaluate pavement markings needs to be further
studied. The quantitative question of minimum retroreflective performance is discussed in Section 4.8.

55
4.2 Is there a need for improved visual guidance at night?
Section 2 concluded by stating that there are two views regarding the need for improved visual
(road) guidance in night traffic: for it and against it. The literature did not provide any clear-cut answers,
only arguments defending the respective positions. These positions can be summarized as follows.
Arguments for the need to improve visual guidance
• Visual guidance at night is considerably less effective than during the day.
• Driver models suggest that the perception of the road is critical for driver performance because
it is a prerequisite for driver predictions. (This conclusion is supported by results from studies
of driver behavior.)
• Drivers list impaired road guidance as the main problem they face in night traffic.
• Results from studies of driver eye movements show that drivers’ attention and visual fixation
move closer to the vehicle in night driving relative to day driving.
• Accident reductions as a consequence of pavement markings appear primarily in night traffic.
• The rate of single-vehicle accidents (running off the road) at night is between two and three
times higher than during the day.
• This difference in accident rate increases when the visibility of the road degrades.
Arguments against the need to improve visual guidance
• One of the factors behind the higher accident rate at night is that recognition visibility is more
impaired in night driving than is guidance visibility. (This is based on the hypothesis that there
are two visual functions in driving—guidance and recognition.) Overconfidence would become
even worse if guidance were improved.
• The self-pacing character of driving at night is primarily governed by road guidance, not the
level of recognition. Indeed, a number of studies show that speed is increased when guidance at
night is improved.
• According to a single Finnish study, accidents increase when guidance at night is improved by
the use of retroreflective post-mounted delineators.
Both positions have valid arguments, and both acknowledge that road guidance and recognition are
seriously impaired at night. The fact that the need for improved recognition visibility is greater is an
argument for such improving recognition, not an argument against improving road guidance. It is not that
road guidance systems are too effective, but rather that recognition conditions are too poor. Thus, the
recommended course of action is to work towards improvements in both recognition and guidance.

56
4.3 Are there both long- and short-range road guidance?
Theoretical arguments and empirical results indicate that drivers make use of two complementary
road-guidance functions, involving short-range and long-range guidance. Long-range guidance requires
more than 5 s of preview time, while short-range guidance requires less than 3 s.
When drivers use only the short-range road guidance, it is because the long-range road guidance is
unavailable. The most common such situation involves night driving on dark roads. From a road-guidance
point of view, a more difficult driving situation is driving in thick fog. In low-visibility conditions, the task
of the driver is not to predict the course of the road, but rather to properly navigate within the roadway
boundaries. In such situations the driver needs to see the road in order to maintain safe guidance. A
transition from combined long-range and short-range guidance to short-range guidance alone results in
using the nearby lane markings in central vision (frequently and consciously). This is demanding and
requires additional mental resources.
The purpose of the long-range visual guidance function is primarily to make it possible for the
driver to predict the route of the road and to drive smoothly without too much demand on mental resources.
Long-range visual guidance enables the driver to predict the road consciously in central vision, to see what
will happen far in advance, and to avoid time-pressure situations. The driver can follow the road, to a great
extent, by the use of peripheral vision and without engaging higher-order cognitive centers. This is easy
during daytime, but difficult at night.
The existence of two complementary road guidance functions could explain why combinations of
several marking systems (e.g., pavement markings and side-post delineators) are more successful in
reducing accidents (see Table 1). Such combinations supply both long-range and short-range road
guidance at night.
4.4 The gap between driver visual needs and lane-marking performance
Comparing drivers’ road-guidance needs with the visibility provided by present lane-marking
systems indicates that current road delineation systems are not sufficient. It is concluded that drivers need
about 5 s visibility in order to drive smoothly and not be surprised. A preview time of 5 s corresponds to a
distance of 140 m at a speed of 100 km/h.
In many daylight conditions this desired visibility level is not always reached (see Table 3). In
other words, even under the best visibility conditions (daylight) the safety criterion is not reached. In less
favorable daytime visibility conditions (e.g., with glare from the sun) performance will be worse. However,
it may be argued that lane-marking visibility is critical not during the day, but rather during darkness and
other low-visibility conditions.
Let us turn our attention to Tables 4 and 5, which present typical nighttime visibility distances for
lane markings obtained in field studies. Because they are obtained experimentally they are likely to be
longer than visibility distances in actual traffic. On the other hand, many of the studies used dashed lines

57
as targets and that might have shortened the detection distances. Table 4 indicates that under high-beam
conditions, the safety criterion is sometimes reached. But, in general, the visibility distances provided with
high beams are still too short to be considered safe.
The situation for low beams, as presented in Table 5, is of even more concern. Visibility distances
of only one-third of the minimum safety criterion are provided to the drivers. Driving on low beams is, by
far, the most common driving situation at night. The glare effect of oncoming low beams is limited. The
detection occurs well within the high-intensity area of the low beams, making it fairly independent of glare.
It is sometimes questionable whether low beams offer even short-range road guidance.
Many of the pavement markings used in these studies reach the existing photometric requirements.
However, it appears that in the past requirements have been set with consideration of the existing
technologies. Specifically, requirements have been specified to be well within obtainable limits. Also, the
regulations are often obsolete as soon as they are published due to the delays in coming to agreement.
Given existing improved retroreflecting technologies, it might be timely to eliminate or at least reduce this
gap between demand (needs) and supply concerning visibility of pavement markings.
4.5 Difference between dry and wet lane-marking performance
One of the most critical and most difficult situations in night driving involves rain. The road itself
loses visibility because water covers it, causing light from the headlamps to be reflected away. Glare from
oncoming cars is multiplied by the reflection of the light from the wet road surface. In such situations,
drivers have more need than ever for good road guidance by means of lane markings. However, it is
precisely in such situations that the existing pavement markings generally exhibit their worst performance.
Tables 4 and 5 demonstrate the decrease in lane-marking visibility that occurs as an effect of wet
road surfaces. Rain further reduces driver visibility due to water drops on the windshields, on the
headlamps, and in the atmosphere. The gap between visibility needs and visibility supply is even more
pronounced in wet conditions.
Efforts have been made to meet the need for improved road guidance at night in wet conditions by
designing lane markings that are profiled, and that have retroreflective elements that protrude above the
mirroring water surface on the road. The results from the existing limited field trials indicate that the
markers work well and that it is possible to maintain high visibility levels in both dry and wet conditions
(see Table 7). However, Table 6 also indicates that profiled lane markings are more sensitive to wear than
flat pavement markings. Even so, they maintain their superiority in wet conditions after considerable wear.
Calculations concerning raised pavement markers indicate that they are superior to profiled
markings in wet conditions (see Table 7). Other studies point out that the performance of studs often
improves in wet conditions (possibly because water cleans the lenses). However, studs are also sensitive to
wear. A particular durability problem for studs is snowplows.

58
This difference between visibility of lane markings in dry and wet conditions should be eliminated
or at least reduced. There are some new promising technological solutions, but more research and technical
advances are needed.
Additional wet conditions include fog, dew, and frost. However, there is only a limited amount of
existing research on the functioning, visibility, and usage of lane markings in such situations. Fog is
believed to be a condition in which drivers have a great need for good road guidance, and thus lane
markings could be especially helpful in such situations.
4.6 The relation between retroreflective properties and visibility
Results from a variety of studies consistently show that the visibility of pavement markings is
related to the logarithm of their retroreflective performance. This pattern was obtained for studies of
objective as well as subjective visibility, in dry and wet conditions.
Correlation coefficients between log retroreflected luminance and visibility ranged from 0.70 to
0.95. These results are based on measurements of retroreflective performance corresponding to the
standard geometry. Furthermore, evidence suggests that the correlation might be even stronger if
retroreflective performance were measured in a geometry corresponding to actual detection distances.
However, it is not clear whether there is a specific logarithmic relationship for each special situation.
4.7 Computational models of marking visibility
There are at least three computational models for estimating the visibility distance of pavement
markings. The CIE model (CIE, 1988) appears inadequate, judging from the comparisons in Table 6. The
CARVE model (Schnell and Zwahlen, 1997) has been calibrated and validated. According to the authors, it
is now quite effective, but it is presently not available for general use.
A widely available model has been developed by Sorensen from the Danish Lighting Institute
(DELTA) within a European cooperative research program called COST (Sorensen, 1998). It is a modular
model, consisting of modules related to the driver, vehicle, glare, road geometry, headlamp illumination,
coefficient of retroreflected luminance (RL), daylight/street lighting, and the luminance coefficient in diffuse
illumination. In each module it is possible to enter various alternatives. This model has been validated
against field measurements of visibility carried out at the Swedish Road and Transport Research Institute
(VTI) with very promising results. However, like all models, it contains a number of simplifications. For
instance, the headlamp model only considers European beam patterns, and the representation of the pattern
is fairly simplistic.
We have used this model to calculate visibility distances in a number of situations corresponding to
the conditions used by studies referenced in Section 3. We also varied the coefficient of retroreflected
luminance (RL = 50, 100, 200, 400, and 800 mcd/m2/lux) measured in the standard geometry. The
following parameters were used:

59
• driver age: 30 years
• traffic: right hand
• vehicle: passenger car
• headlamps: European low beams and high beams, intensity 1.00
• glare: no
• road: straight, flat, no lighting, 4 m lane width
• RL of road surface: 15 mcd/m2/lux
• marking: right edge and centerline, 0.1 m wide, dashed, 10 m long, 5 m gaps
The results are shown in Table 9. The obtained distances are longer than one might expect, but are
consistent with the empirical field data on visibility as presented for new markings in Tables 4 and 5.
Table 9Visibility distances as obtained using the visibility model presented by Sorensen (1998) for centerlines
and edgelines with high beams and low beams. (See the text for other parameters used.)
Coefficient of retroreflectedluminance RL (mcd/m2/lux)
Low beams Low beams High beams High beams
Edgeline Centerline Edgeline Centerline
50 63 m 53 m 66 m 66 m
100 81 m 58 m 90 m 90 m
200 93 m 64 m 114 m 114 m
400 104 m 78 m 142 m 142 m
800 114 m 97 m 172 m 172 m
The three models mentioned have many common features, but they were developed and calibrated in
different ways and thus provide different results. No impartial comparison of the three models exists.
There are many properties of these models that deserve to be studied. Of primary interest is their
validity. However, the validity may be expected to change depending on the situation. One model may be
better for one condition, or situation, while another model better for a different situation. This would
depend on how sensitive the respective models are to changes in various variables. Additional research is
needed before we can start using any of these models in applied situations.
4.8 Minimum reflective performance of lane markings
As was discussed above, the process of developing regulations and standards of pavement markings
has gone through three phases. The first phase deals with the uniformity of the designs and the messages.
The second phase concerns the minimum physical quality of the markings to ensure acceptable durability

60
and reasonable costs. In the third phase, which is still in progress in most countries, the goal is to set
standards for safety.
This means that requirements are specified primarily in terms of the photometric characteristics of
pavement markings. The most important lane-marking property for safety in night traffic is retroreflective
performance. In technical terms, that means the coefficient of retroreflected luminance for pavement
markings (RL) and the coefficient of luminous intensity (RI) for raised pavement markers. But, despite
considerable research there are still no generally accepted minimum levels of retroreflective performance.
Ideally the retroreflective performance of lane markings should be based on driver needs. In
Section 3.5.4. it was stated that a minimum visibility distance to achieve smooth and safe drive behavior,
and to adequately detect the route ahead, is 140 m. This distance should be the same for most driving
conditions and, preferably, it should be longer in degraded or especially difficult situations. Unfortunately,
the existing pavement markers do not reach these requirements under good conditions and are even worse
in degraded conditions, such as rain. Other, less important, properties for pavement marker performance in
night traffic are brightness, or luminance factor, and friction.
Present standards accept the existing technical difficulties and specify lower retroreflective values
for wet pavement markings. This is a compromise between demand and supply. The corresponding type
of compromise is evident when comparing new and old proposals for minimum retroreflective
performance. The initial proposals, dating back to the 1970s (Allen, O’Hanlon, and McRuer, 1977)
involved a minimum coefficient of retroreflected luminance for new materials of about 90 mcd/m2/lux. In
the early 1980s (Serres, 1981) the recommended minimum reflectance in the same situation was 150
mcd/m2/lux. In the late 1980s (Ethen and Woltman, 1986) the recommended minimum value for new
materials was 400 mcd/m2/lux. In the proposed present European standard (CEN, 1997) the recommended
value is 300 mcd/m2/lux. However, that value refers to the replacement value (see below).
Durability is one of the main pavement-marker problems. Therefore, while it is important to have
requirements for new markings, it may be even more important to also have requirements for worn
markings. Serres (1981) proposed a minimum for replacement of 100 mcd/m2/lux. Ethen and Woltman
(1988) agreed. But, as indicated above, in the present European proposal (CEN, 1997) this value is raised
to 300 mcd/m2/lux for the highest class of markings.
The requirements for wet pavement markings followed a different trend. Serres (1981) proposed
60 mcd/m2/lux. In the current European proposal (CEN, 1997) this value is generally lower—between 25
and 50 mcd/m2/lux. However, for safety considerations, instead of being lower the wet requirements
should be higher.
Another problem is that the standard measuring geometry that is now emerging corresponds to a
distance of 30 m to the marking. This will favor markings that give high values at that short distance. That
is unfortunate because it should be an advantage if the retroreflective properties of markings could be
tailored in such a way that their performance increases with increased distance from the vehicle.
Even if headlamp beam patterns and traffic conditions in general vary between countries and
continents, international agreement on minimum requirements for pavement-marking retroreflectance

61
characteristics would be desirable. Drivers would meet the same lane-marking characteristics regardless of
where they drive. Additionally, pavement-marking companies that sell their products worldwide would
benefit from uniform requirements.
From a safety point of view (visibility beyond 140 m using low beams with oncoming low beams)
the presently proposed values are too low. Lane markings reaching 300 mcd/m2/lux may be visible at the
absolute minimum (84 m), but we cannot be satisfied with a situation where the standard is at the absolute
minimum level. That would require all elements (marking, driver, vehicle, weather, etc.) to be in ideal
conditions—a situation not obtainable in the real world! Rather than 300 mcd/m2/lux, the minimum should
be at least 1000 mcd/m2/lux for high-class markings to allow a reasonable margin for variation and
degradation. The requirements in wet conditions should be even higher than in dry conditions.
4.9 Color, dimensions, and configuration of lane markings
The design of the pavement markings has one obvious purpose—to transmit a message to the
users. However, the design characteristics also influence the visibility of the markings and the general
behavior of drivers. One problem is that the meaning of the various design characteristics are not
internationally standardized. There might have been reasons for national differences at one time, but it is
now time to reduce the differences. The situation resembles that of road signs. However, changes to
pavement markings would be easier, because their shorter life span could allow these changes to be
implemented incrementally as a part of normal maintenance and replacement programs.
Color coding undoubtedly affects drivers’ behavior by transmitting a specific message to the road
user. However, every color returns less light than the corresponding white. Secondly, when luminances are
reduced as distances increase, the driver’s ability to recognize various colors is also reduced. Finally, some
road users are color-deficient and their ability to understand the message of some colors may be reduced.
Therefore we must not rely too much on color coding.
The use of solid and dashed lines, or a combination of line configurations, may also be used to
transmit messages to users. The problem is that because the angles at which drivers of passenger cars see
the lines are small (< 1°) it is difficult to perceive differences in line configuration at distances that would
allow drivers to plan for changes in the road ahead.
For line visibility in night driving, the amount of light reflected back to the driver is critical. The
amount of reflected light may be influenced by the type of retroreflective material, by the width of the
marking, number of lines, color, and other characteristics. The configuration is of a lesser importance.
4.10 Combinations of various marking principles
The accident studies (see Table 1) clearly show that combinations of markings are more effective
than any component marking system alone. However, it is not known which markings work well together
and what are the optimal combinations for different purposes and conditions.

62
It was suggested above that the reason for further accident reduction with the combination of lane-
marking systems is that they offer both short-range and long-range road guidance, and thus the drivers are
supported in both good and poor visual conditions. Another possibility is that combinations of systems
increase the stimulus intensity and that the effect is quantitative rather than qualitative. A large number of
combinations are possible. The potential elements include traditional lane markings, profiled line markings,
raised pavement markers, chevrons, and a large number of various road signs.
4.11 Flat versus profiled lane markings
The visibility of lane markings in wet conditions is one of the weakest points of lane-marking
performance. One possible remedy involves the use of raised pavement markers, which often offer better
visibility in rain than flat markings. They have, however, several drawbacks such as high price, vulnerability
to snowplows and traction aids in winter conditions, and offer poorer short-range road guidance.
Another way of reducing this problem could involve the use of profiled pavement markings.
Profiled pavement markings are normal plastic lines, which are modified to have a relief. The relief may be
created by stamping a pattern in the line, by equipping the lines with special vertical elements, or by adding
an intermittent marking to the outside edge of the line. The vertical element protrudes above the water
surface and maintains higher retroreflective performance in wet conditions.
The profiled lane markings work well in wet and dry conditions when new. However, they are more
vulnerable to wear than flat lane markings. After a number of seasons, their superiority in wet conditions is
reduced and, in some cases, nonexistent. Additional technical development is required to enhance their
resistance to damage and wear.
4.12 Line versus spot marking of lanes
There are two major types of lane markings for night traffic, traditional retroreflective lines and
retroreflective point sources. The point sources are usually called raised pavement markers or studs. Studs
are positioned horizontally on the road surface, but project above it and have a retroreflective surface that is
mounted at an angle of about 45°. Conceptually, raised pavement markers lie between traditional markings
and side-post delineators. They offer better long-range road guidance than traditional lines and superior
wet visibility. Their main drawbacks are durability and cost.
Often spot marking and line marking are combined. This makes sense because line markings can
be used to provide short-range guidance and good delineation during the day, and raised markers offer
better long-range guidance and wet delineation. However, no studies exist on the best combinations.
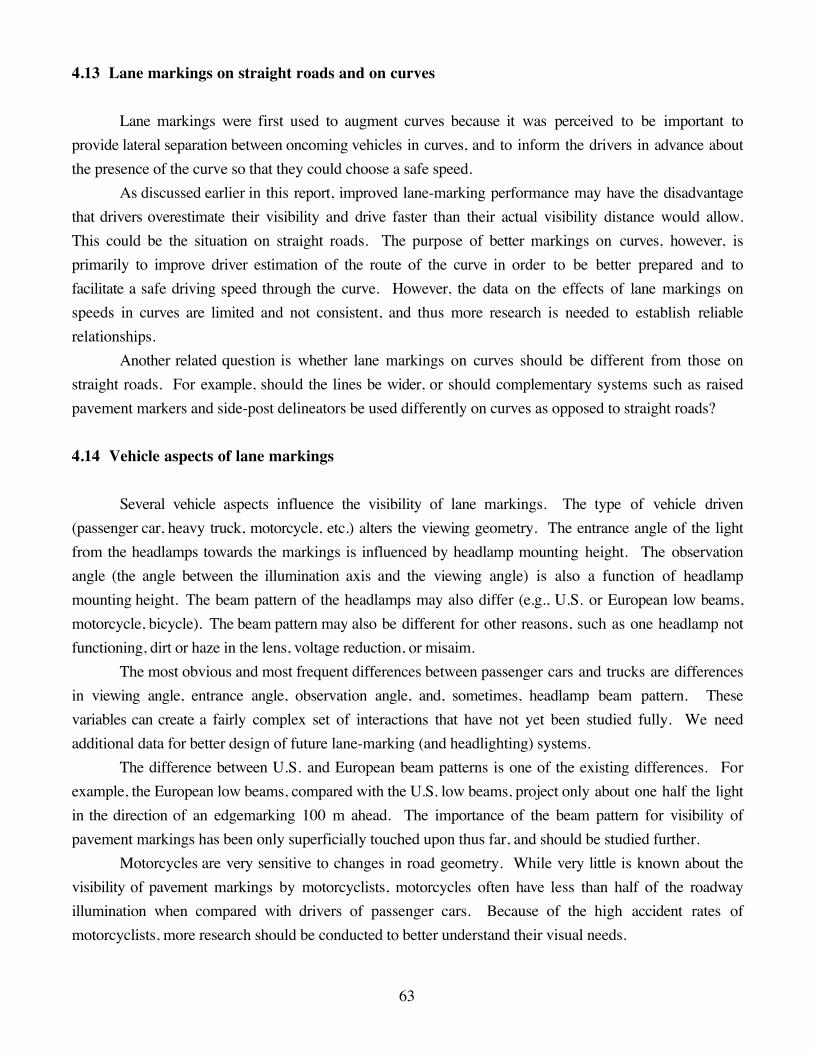
63
4.13 Lane markings on straight roads and on curves
Lane markings were first used to augment curves because it was perceived to be important to
provide lateral separation between oncoming vehicles in curves, and to inform the drivers in advance about
the presence of the curve so that they could choose a safe speed.
As discussed earlier in this report, improved lane-marking performance may have the disadvantage
that drivers overestimate their visibility and drive faster than their actual visibility distance would allow.
This could be the situation on straight roads. The purpose of better markings on curves, however, is
primarily to improve driver estimation of the route of the curve in order to be better prepared and to
facilitate a safe driving speed through the curve. However, the data on the effects of lane markings on
speeds in curves are limited and not consistent, and thus more research is needed to establish reliable
relationships.
Another related question is whether lane markings on curves should be different from those on
straight roads. For example, should the lines be wider, or should complementary systems such as raised
pavement markers and side-post delineators be used differently on curves as opposed to straight roads?
4.14 Vehicle aspects of lane markings
Several vehicle aspects influence the visibility of lane markings. The type of vehicle driven
(passenger car, heavy truck, motorcycle, etc.) alters the viewing geometry. The entrance angle of the light
from the headlamps towards the markings is influenced by headlamp mounting height. The observation
angle (the angle between the illumination axis and the viewing angle) is also a function of headlamp
mounting height. The beam pattern of the headlamps may also differ (e.g., U.S. or European low beams,
motorcycle, bicycle). The beam pattern may also be different for other reasons, such as one headlamp not
functioning, dirt or haze in the lens, voltage reduction, or misaim.
The most obvious and most frequent differences between passenger cars and trucks are differences
in viewing angle, entrance angle, observation angle, and, sometimes, headlamp beam pattern. These
variables can create a fairly complex set of interactions that have not yet been studied fully. We need
additional data for better design of future lane-marking (and headlighting) systems.
The difference between U.S. and European beam patterns is one of the existing differences. For
example, the European low beams, compared with the U.S. low beams, project only about one half the light
in the direction of an edgemarking 100 m ahead. The importance of the beam pattern for visibility of
pavement markings has been only superficially touched upon thus far, and should be studied further.
Motorcycles are very sensitive to changes in road geometry. While very little is known about the
visibility of pavement markings by motorcyclists, motorcycles often have less than half of the roadway
illumination when compared with drivers of passenger cars. Because of the high accident rates of
motorcyclists, more research should be conducted to better understand their visual needs.

64
Bicycling is likely to increase in the future, but current bicycle lighting is poor. This presents a
problem because bicycle paths often have unpredictable curves or other dangerous obstructions. Bicyclists
have a need to see the route of the bicycle path because they are very sensitive to slight misjudgments.
Because bicycle illumination is too weak to make the surface of the bicycle path visible, cyclists are in
critical need of a high-performance lane-marking system.
4.15 Lane marking for special road-user categories
One of the primary goals of human factors is to design the environment to facilitate human
activities. This principle should not only apply to typical road users, but to drivers with special visual needs
as well. There are many groups of road users that might need support by improved or special lane
markings (e.g., older drivers, tired drivers, visually impaired drivers, and drunk drivers). Furthermore,
making lane markings better for these road-user groups would benefit all road users. However, few studies
have been found that investigate visual requirements of special needs drivers under adverse conditions, such
as rain or fog.
The role fatigue plays in accidents in night traffic is difficult to establish. Tired drivers are,
however, a substantial problem for safety as they are overrepresented in single-vehicle accidents at night.
Improved lane-marking systems may reduce this trend, but no studies have been found that address this
problem, nor have there been any studies that investigate the effects of lane markings on drivers with
degraded vision (except for older drivers).
4.16 New lane-marking concepts
There are few new developments in the lane-marking area. Profiled lane markings are fairly new in
practice, but the technology has been around for more than ten years. Luminous raised pavement markers
have been in use at most large airports for decades. In Sweden, experiments are in progress to use them in
difficult and changing situations, such as car-ferry loading and unloading. In the U.K., a semi-intelligent
luminous raised pavement marker has recently been introduced, primarily for temporary and difficult
situations. It can sense road users and other conditions, and activates only when needed. Consequently, it
does not have to be lighted all the time.
In Sweden and the U.S., studies are in progress to develop fluorescent pavement markings that
would outperform standard markings not only in ultraviolet illumination, but also in incandescent
illumination. Some promising preliminary results have been obtained already.
With retroreflective lane markings, illumination from a vehicle primarily benefits the driver of that
vehicle. There is very limited help from other drivers. With fluorescent lane markings and ultraviolet
headlighting, the markings become generally visible to everybody. Every driver helps other drivers in the
scene to see the lane markings better. Another existing technology that has not yet been implemented

65
involves luminescent lane markings that are “charged” by each passing vehicle so that the markings
becomes luminous for a certain period of time. This is an intriguing concept deserving further study.
4.17 Marking durability, maintenance, and costs
One of the primary practical problems facing pavement markings is how to increase their durability
in a cost-effective way. Paint markings have low initial costs, but quickly lose their performance and
require maintenance or replacement, costing money and time. Furthermore, the frequent maintenance
repeatedly places workers in repeated dangerous situations. Raised pavement markings that have high
photometric performance and heightened durability over long periods have been developed. They do not
require repeated maintenance or frequent replacement, but have high initial costs. These two extremes
involve large differences in cost and performance. What can be done to alleviate the need to trade one
factor (cost) against the other (performance)? This is probably more a question for technical development
of materials than for research on effectiveness of materials, but there are a number of research questions as
well. For example: Could we replace line markings with raised pavement markings, or are these two types
complementary? Is it better to have profiled line markings than to have flat lines complemented with raised
pavement markers? Or is it better to have flat markings and replace them more often?
4.18 Development of a U.S. standard for photometric requirements
Most European countries have photometric performance requirements on pavement markings. The
U.S. (at least at the federal level) is lagging behind. Concerted efforts should be made to rectify this void in
requirements of pavement markings.
4.19 International harmonization of photometric testing and requirements
Europe is now in the process of developing a uniform photometric standard for pavement marking.
However, before requirements are finalized, efforts should be made to find international consensus.
4.20 Conclusions
Lane markings for night traffic in use today do not meet acceptable levels of visibility and safety.
Drivers need both long-range and short-range road guidance to be able to drive comfortably and safely. In
many night-driving situations, present pavement markings do not provide sufficient long-range guidance.
Either the pavement markings will have to be improved or the long-range visual guidance at night must be
offered by some other road guidance system.

66
5. CONCLUSIONS AND RECOMMENDATIONS
The focus of this report was on the functioning of lane markings in night driving on dark roads.
This section summarizes the main conclusions reached and offers proposals for future research.
5.1 The present situation and the need for improved lane markings at night
Section 2 concluded that drivers have a basic need for visual-guidance information in order to make
accurate predictions about the future course of the road. Such enhanced knowledge should reduce
uncertainty and errors in vehicle guidance.
Pavement markings enhance the configuration of the road and are likely used for both long-range
and short-range road guidance. In daylight and in good-visibility conditions, drivers use lane markings for
short-range guidance, and they are relied upon unconsciously and by means of peripheral vision. If lane
markings are used for long-range guidance, they are probably used intermittently and by means of foveal
vision.
Accident analyses show that pavement-marking systems have beneficial effects on accidents (see
Section 2.3). These effects, however, are smaller than expected (on the average a few percent) except for
combined marking systems, for which the effects are larger than expected (20 to 45%). There are a number
of technical problems with some of these studies, such as combining day and night accidents.
Experienced drivers try to obtain long-range information about the course of the road to increase
predictability. This is normally easy during the day, except for special situations such as fog, narrow
curves, or intersections. However, during darkness, long-range scanning is often impossible. Drivers’
ability to see the road when using low beams (the most common nighttime situation) is very limited; the
visibility of the road surface is no more than about 30 m. This is insufficient considering normal speeds of
100 km/h.
Retroreflective lane markings or other retroreflective marking systems could play an important role,
offering drivers road guidance far ahead of the vehicle. Luminous guidance systems are superior to
retroreflective systems, but can seldom be used because of their prohibitive cost.
Studies have shown that the visibility of lane markings in difficult situations is approximately 60 m,
about twice the visibility of the road itself. Lane markings with such limited visibility can primarily be used
only with central vision and need to be processed consciously. Such processes make substantial demands
on the driver’s cognitive capacity, and can be used for short-range guidance only.
Both theoretical and empirical data indicate that drivers may use two complementary road-guidance
functions—one for short-range and one for long-range guidance. When visibility for long-range guidance
is reduced, drivers are forced to restrict themselves to the use of short-range guidance. The transition
between these forms of guidance is determined by speed and other traffic variables. In general, however,
the long-range guidance refers to distances greater than about 140 m, while the short-range guidance refers

67
to distances smaller than about 85 m. This is consistent with the estimate that drivers need about 5 s of
preview time in order to be able to prepare for coming events (about 140 m at 100 km/h).
Another hypothesis is that drivers have two visual functions—one for guidance and one for
recognition of objects. Studies show that both are degraded at night, but the performance of the recognition
function tends to be impaired more. On the basis of this finding, some experts caution that if road
guidance is substantially improved drivers may overdrive their recognition visibility and accidents may
increase. There are studies indicating that this might happen in some situations. In the study most often
cited (Kallberg, 1993), a road was equipped with side-post delineators (long-range visual guidance). On
roads with relatively low geometric standards (but not for those with relatively high geometric standards)
the average speed increased, as did the accident rates. It could be that guidance and recognition visibility
should be improved together.
To draw the conclusion that road guidance at night should not be improved, however, would not be
justified. Such a conclusion would suggest that we should not improve road guidance at night because it is
better than object recognition at night. It is inconsistent with the results from studies of driver opinion,
which indicate that better road guidance in night driving should be a high priority. It is also called into
question by the overrepresentation of single-vehicle accidents in night traffic. Consequently, it is
recommended that research and technical developments in the two areas—object recognition (and thus
short-range guidance) and long-range guidance proceed in tandem.
5.2 Present standards and recommendations concerning lane markings
National and regional requirements on pavement-marking dimensions, colors, configurations, and
meanings have existed for many years. Most of the major characteristics are approximately the same, but
unfortunately there are still some important differences. There is also fairly wide agreement concerning the
requirements for the materials used for pavement markings, but these requirements are not as well
coordinated as for the dimensions and symbolic meaning of various lane-marking configurations.
The most recent standards concern photometric requirements. The brightness of pavement
markings in daylight or within road-lighted areas have been measured for some time. However, not until
recently has there been any systematic research on photometric requirements for nighttime retroreflective
pavement markers. One problem has been the choice of the measuring geometry, involving a compromise
between validity, flexibility, and reliability. The Europeans have taken the lead in this area. Their proposed
standard measuring geometry corresponds to a driver in a passenger car (the driver eye height of 1.2 m, and
the headlamp mounting height of 0.65 m) at a distance of 30 m from the markings.
The first step toward international harmonization should be to agree on a measuring standard. This
would simplify comparisons between materials and between research results obtained in various studies. It
is not clear whether the proposed European standard measuring geometry should be the one. That question
could benefit from further research. For instance, the proposed geometry favors very short-range guidance
and disfavors markings that are tailored to increase retroreflective performance at longer distances (long-

68
range guidance). There is validity to the argument that there should be more than one measuring point.
Headlamps, for example, are not characterized by photometry at a single point. International cooperation in
this area of research could prove to be very fruitful.
The present requirements seem to be a compromise between what is presently feasible (technically
and practically) and what the drivers need. There is a fair consensus that the minimum photometric level
for replacement of pavement markers should be 100 mcd/m2/lux, and that the preferred level for high
classes of roads and markings be 300 to 400 mcd/m2/lux (using standard geometry). However, if these
values of retroreflective performance are compared with the values needed to reach safe visibility distances
(see Sections 3.5, 4.7, and 4.8), it is obvious that they are too low for even short-range guidance. It is no
surprise that only a minority of drivers are satisfied with current lane markings. The performance of
markers would need to be tripled to exceed the short-range guidance and reach minimally acceptable
visibility for long-range guidance.
If it proves technically unfeasible to make traditional lane markings (lines) with such photometric
performance, then it would be necessary to use alternative marking systems that can provide long-range
guidance. Possible alternatives to supplement traditional lane markings are raised pavement markers and
side-post delineators.
5.3 The need for further research on pavement markings
One of the main tasks of applied research in road safety is to offer a basis for improved decision
making among various groups, including manufacturers, drivers, and governmental bodies.
In this section the research needs that have appeared in the previous text are briefly listed, along
with the section(s) where that topic was treated in greater depth. Most of these proposals follow as a direct
consequence of discussion in Section 4.
5.3.1 General research questions and topics concerning pavement markings
• What are drivers’ road guidance needs in day and night traffic? (2.1, 4.2)
• Are there two separate functions for road guidance—short range and long range? (2, 4.3)
• When is short-range or long-range guidance used? (2, 4.3)
• Do the guidance functions work together or separately? (2, 4.3)
• Which criteria should be used to evaluate pavement markings? (4.1)
• What is the relationship between subjective and objective visibility? (3.5, 4.1)
• Do drivers need suprathreshold visibility within the visibility distance? (3.5, 4.4)
• What is the relationship between visibility and various behavioral measures (e.g., speed, lateral
position)? (3.4, 3.5, 4.4)
• Study the changes of the coefficient of retroreflected luminance (RL) in real geometry as a
function of increasing the viewing distance. (3.2, 3.5, 4.6)

69
• Compare and test the validity of the models developed to calculate visibility of pavement
markings. (3.5, 4.7)
• Establish regression equations and correlations between visibility and retroreflected luminance
in a number of situations and for various detection percentiles. (3.5, 4.6)
• How can special-needs drivers (e.g., fatigued, old) be helped by modified lane markings? (2,
3.9, 4.15)
5.3.2 Specific research needs concerning lane markings
• Should lane-marking lines be complemented by some other system to offer drivers long-range
guidance as well as short-range guidance? (2, 3.1, 3.3, 3.5, 3.7, 4.4, 4.5)
• How should pavement-marking systems be combined to achieve the best results? (2, 3.1, 3.3,
4.10)
• Compare the effects of changes in eye height and headlamp mounting height (passenger cars
and trucks) on pavement-marking visibility and photometry. (3.2, 3.8, 4.14)
• Study the visibility of flat and profiled lane markings in various situations, with special
emphasis on wet conditions. (3.3, 3.5, 3.7, 4.5)
• Compare the visibility and driver perception of traditional lines, profiled lines, and raised
pavement markings in various situations, with special emphasis on wet conditions. (3.1, 3.4,
3.5, 4.12)
• Develop measuring methods, standards, and requirements for raised pavement markers. (3.1,
3.2, 3.5, 4.12)
• Study driver perception of lane markings on curves. (2, 3.4, 3.5, 4.13)
• Study driver use of lane markings in fog under day and night-driving conditions. (2, 3.5, 3.7,
4.5)
• Study lane-marking performance with frost. (3.2, 3.5, 3.7, 4.5)
• Study cyclists’ needs for lane markings at night. (3.8, 4.15)
• Study the potential of luminescent pavement markings that are charged to be luminous for a
period by the light from a passing vehicle. (3.1, 4.16)
• Perform research aiming at an international harmonization of photometric requirements for
pavement markings. (3.2, 3.5, 3.6, 3.12, 4.8, 4.18, 4.19)

70
5.4 The need for further technical improvement
Technical development is normally based on research. Research here is used to indicate visibility or
human factors research, not materials research.
5.4.1 General technical improvement needs
• The main technical development needs exist in the area of durability, maintenance, and cost.
(3.5, 3.7, 3.11, 4.5, 4.11, 4.17).
5.4.2 Specific technical development needs
• Improved durability and performance of profiled lane markings. (3.5, 3.7, 4.5, 4.11, 4.17)
• Improved durability of raised pavement markers. (3.5, 3.7, 4.5, 4.12, 4.17)
• Development of pavement markings in which the coefficient of retroreflected luminance
increases as the distance from the vehicle increases. (3.2, 3.5, 4.8, 4.19)
• Development of a portable and reliable retroreflectometer for field testing of raised pavement
markers. (3.2, 3.5, 4.8, 4.19)
• Development of special lane markings for bicycle paths. (3.8, 4.14, 4.15)
• Development of lane markings that maintain their performance in frost. (3.7)
• Development of luminescent pavement markings. (3.1, 4.16)
5.5 Concluding comments
There is evidence that drivers make use of two separate, but complementary, road guidance
functions—long-range and short-range guidance. Normally, both functions are used to create a complete
representation of the roadway environment for proper road guidance. Long-range guidance is probably
provided intermittently by central vision for prediction purposes, and short-range guidance is provided
continuously by peripheral vision. But, in situations of degraded visibility, drivers are forced to rely on
only short-range guidance (because the long-range guidance information is no longer available). When
this happens, short-range guidance often has to be carried out centrally and intermittently.
Drivers’ needs for nighttime visual guidance well ahead of the vehicle are still not fully met by the
current marking practice. The visibility of lane markings in many nighttime situations is such that the
markings can only be used for short-range guidance. Drivers fall back on this system because the primary
system (long-range guidance) is not possible. Pavement markings offer much better road guidance than
the road itself, but this is insufficient from the points of view of traffic safety and driver comfort.

71
REFERENCES
Adrian, W. (1989). Visibility of targets: Model for calculation. Lighting Research & Technology, 21,
181-188.
Agent, K.R. and Creasy, T. (1986). Delineation of horizontal curves (Report No. UKTRP-86-4).
Lexington, KY: Kentucky Transportation Research Program.
Agent, K.R. and Pigman, J.G. (1983). Performance evaluation of experimental paint-stripe beads (Report
No. UKTRP-83-27). Lexington, KY: Kentucky Transportation Research Program.
Allen, M. (1984). Vision and roadway delineation. Bloomington, IN: Prepared for the Potters Industries
Inc. Internal Seminar, Jan. 24, 1984.
Allen, R.W., O’Hanlon, J.F., and McRuer, D.T. (1977). Driver’s visibility requirements for roadway
delineation. Volume 1: Effects of contrast and configuration on driver performance and behavior
(Report No. FHWA-RD-77-165). Washington, D.C.: Department of Transportation, Federal
Highway Administration.
Andersson, K., and Nilsson, G. (1978). Modeller for beskrivning av samband mellan olyckor och vagens
geometriska utformning[Models describing the relationship between accidents and road
geometry] (VTI Report No. 153). Linkoping, Sweden: Swedish Road and Traffic Research
Institute.
ASTM E1696-95b. (1995). Standard test method for field measurement of raised retroreflective
pavement markers using a portable retroreflectometer. West Conshohocken, PA: American
Society for Testing and Materials.
ASTM D4280-96. (1995). Standard specification for extended life type, nonplowable, prismatic, raised,
retroreflective pavement markers. West Conshohocken, PA: American Society for Testing and
Materials.
ASTM D4283-96. (1995). Standard specification for plowable, raised retroreflective pavement markers.
West Conshohocken, PA: American Society for Testing and Materials.
Astucia. (1998). Intelligent road studs (Product Model Brochure). Nottinghamshire, UK: Astucia Ltd.
Attaway, R.W. (1989). In-service evaluation of thermoplastic and tape pavement markings using a portable
retroreflectometer. Transportation Research Record, 1230, 45-55.
Bali, S., Potts, R., Fee, J.A., Taylor, J.I., and Glennon, J. (1978). Cost-effectiveness and safety of alternative
roadway delineation treatments for rural two-lane highways (Report FHWA-RD-78-54).
Washington, D.C.: Department of Transportation, Federal Highway Administration.
Basile, A.J. (1962). Effect of pavement edge markings on traffic accidents in Kansas. Highway Research
Board Bulletin, 308, 80-86.
Baumgaertner, W.E. (1982). Effectiveness of safety improvements—Pavement markings. Institute of
Transportation Engineers, Technical Notes 7(3), 10-12.

72
Blaauw, G.J., and Padmos, P. (1981). De zichtbaarheid ‘s nachts van wegmarkeringen op droge en natte
wegdekken [Nighttime visibility of roadway delineation of dry and wet roads] (Report No. IZF
1981-C20). Soesterberg, Netherlands: Institute for Perception TNO.
Blaauw, G.J., and Padmos, P. (1982). Nighttime visibility of various types of pavement markings: A study
on durability, including conditions of rain, fog, and dew (SAE Technical Paper Series No.
820412). Warrendale, PA: Society of Automotive Engineers.
Blaauw, G.J., and Riemersma, J.B.J. (1975). Interpretation of roadway design by an analysis of drivers’
visual scanning and driving behaviour on straight and curved roadway sections (Rapport No. IZF
1975-C5). Soesterberg, Netherlands: Institute for Perception TNO.
Blackwell, H.R. (1946). Contrast thresholds of the human eye. Journal of the Optical Society of America,
36, 642-643.
Carlsson, A., and Lundkvist, S. (1992). Breda Korfalt pa motortrafikled: Trafikanteffekter vid alternativ
vagbanemanlning pa motortrafikled [Wide lanes on a major road: Road user effects of alternative
roadway painting on a major road] (VTI Report No. 687). Linkoping, Sweden: Swedish Road
and Traffic Research Institute.
CEN. (1992). Horizontal pavement markings applied on the roads (Project No. TC226 WG2). Brussels,
Belgium: Comité Européen de Normalisation.
CEN. (1996). Pavement marking materials - Physical properties (Report No. prEN 1871). Brussels,
Belgium: Comité Européen de Normalisation.
CEN. (1997). Pavement marking materials - Pavement marking performance for road users (Report No.
prEN 1436). Brussels, Belgium: Comité Européen de Normalisation.
Chapman, B. (1994). Cost-effective marking and delineation materials (Report No. FHWA/CA/TL-
94/06). California Department of Transportation.
Charnock, D.B., and Chessell, B.A. (1978). Carrigeway edgelining and the effects on road safety. Traffic
Engineering and Control, 19, 4-7, 13.
Christ, R. E. (1975). Review and analysis of color coding research for visual displays. Human Factors,
17, 542-570.
CIE. (1988). Visual aspects of pavement markings (Publication CIE 73). Paris, France: Commission
Internationale de l’Eclairage.
CIE. (1992). Fundamentals of the visual task of night driving (Publication CIE 100). Paris, France:
Commission Internationale de l’Eclairage.
Corben, B.F., Deery, H.A., Newstead, S.V., Mullan, N.G., and Dyte, D.S. (1997). An evaluation of the
general effectiveness of countermeasures designed for crashes into fixed roadside objects. Paper
submitted to Accident Prevention and Analysis.
Cottrell, Jr., B.H. (1985). The effects of wide edgelines on lateral placement and speed on two-lane rural
roads. Charlottesville, VA: Prepared for the Transportation Research Board 65th Annual Meeting.
Cottrell, Jr., B.H. (1988). The effects of wide edgelines on two-lane rural roads. Transportation Research
Record, 1160, 35-44.

73
Cottrell, Jr., B.H. (1996). Evaluation of pavement markings for improved visibility during wet night
conditions (Report No. VTRC-96-R33). Charlottesville, VA: Virginia Transportation Research
Council.
Creasey, F.T., Ullman, G.L., and Dudek, C.L. (1989). Delineation of urban freeway gore area crash
cushions in Texas. Transportation Research Record, 1233, 28-33.
Croteau, J. (1977). Follow-up study: Floating glass beads for traffic stripes (Report No. 77-007-7771).
Trenton, NJ: New Jersey Department of Transportation.
Daas, H.R. (1978). Effektundersokelse av kantstolper pa veger av hoy standard og mye trafikk [Studies
on the effectiveness of side-post delineators on roads with high standards and high traffic volume]
(TOI Report No. 408). Oslo, Norway: Institute of Transport Economics.
Dejaiffe, R. (1987). Measuring wet-night delineation reflectivity. Transportation Research Record, 1149,
46-49.
DELTA. (1990). First proposal for performance requirements for pavement markings (Report No. 9).
Lyngby, Denmark: Lys & Optik.
DELTA. (1997). Model for sybsafstande til vejstriber [Requirements for pavement markings] (Report
No. 58, COST 331). Lyngby, Denmark: Lys and Optik.
Dierks, B., and Runhage, M. (1983). Samband mellan retroreflektion och synbarhet hos vagmarkering i
morker [Relationship between retroreflectivity and visibility for road markings in night driving]
(Examensarbete 1983:2). Chalmers, Sweden: Chalmers Technical University.
Dudek, C.L., Huchingson, R.D., Creasey, F.T., and Pendleton, O. (1988). Field studies of temporary
pavement markings at overlay project work zones on two-lane, two-way rural highways.
Transportation Research Record, 1160, 22-34.
Dudek, C.L., Huchingson, R.D., and Woods, D.L. (1980). Evaluation of temporary marking patterns for
work zones. Transportation Research Record, 1086, 12-20.
ECMT. (1974). European rules concerning road traffic, signs and signals. Paris, France: European
Conference of Ministers of Transport.
Edwards, Y., and Astrom, S. (1997). Vagmarkeringsmassa: Provfalt pa Rv 35 vid fillinge. Labora-
torieprovning enligt VAG 94 och CEN-metodik [Road marking materials: Test area on road Rv
35 at Fillinge. Laboratory testing according to VAG 94 and CEN] (VTI Report No. 9-1997).
Linkoping, Sweden: Swedish Road and Traffic Research Institute.
Emerson, J.W., and West, L.B. (1986). Shoulder rumble strips at narrow bridges. In Carney, III, J.F.
(Ed.): Effectiveness of highway safety improvements (pp. 207-217). New York: American Society
of Civil Engineers.
Engel, U., and Thomsen, L. (1983). Trafiksanering paa Osterbro [Traffic replanning in Osterbro]
(Report No. 1). Lyngby, Denmark: Radet for Trafiksikkerhedsforskning.
Epstein, M.M., Grieser, D.R., Preston, J.R., and Moeller, C. E. (1975). A snowplowable highway lane
delineator for wet-night visibility. Public Roads, 39(3), 111-117.

74
Ethen, J.L., and Woltman, H.L. (1986). Minimum retroreflectance for nighttime visibility of pavement
markings. Transportation Research Record, 1093, 43-47.
Flannagan, M.J., Sivak, M., Traube, E.C., and Kojima, S. (1996). Effects of overall low-beam intensity on
seeing distance in the presence of glare (Report No. UMTRI-96-26). Ann Arbor: The University
of Michigan Transportation Research Institute.
Forsberg, A., Dahlstedt, and Laurell, H. (1977). Vagbelaggningars effekt pa siktstrackan till vagmarkering
i solljus [The influence of road surface on road marking visibility in sunshine] (VTI Report No.
34). Linkoping, Sweden: Swedish Road and Traffic Research Institute.
Freedman, M., Staplin, L.K., Gilfillan, D.P., and Byrnes, A.M. (1988). Noticeability requirements for
delineation on nonilluminated highways (Report No. FHWA/RD-88/028). Washington, D.C.:
U.S. Department of Transportation, Federal Highway Administration.
Gibson, J.J. (1986). The ecological approach to visual perception. Hillsdale, NJ: Lawrence Erlbaum.
Gibson, J.J., and Crooks, L.E. (1938). A theoretical field-analysis of automobile driving. American
Journal of Psychology, 51, 453-471.
Glennon, J.C. (1985). Accident effects of centerline markings on low-volume rural roads. Transportation
Research Record, 1027, 7-13.
Godthelp, J., and Riemersma, J. B. J. (1982). Vehicle guidance in road-work zones. Ergonomics, 25, 909-
916.
Good, M.C., and Baxter, G.L. (1985). Evaluation of short-range roadway delineation (Internal Report
No. AIR 381-1). Melbourne, Australia: Australian Research Board.
Gorkum, D.F. (1982). Night-time visibility of seven pavement marking materials. Traffic Engineering and
Control, 25(4), 176-181.
Graham, J.R., and King, L.E. (1991). Retroreflectivity requirements for pavement markings.
Transportation Research Record, 1316, 18-23.
Graham, J.R., Harrold, J.K., and King, L.E. (1996). Pavement making retroreflectivity requirements for
older drivers. Transportation Research Record, 1529, 65-70.
Griffin, III, L.I. (1990). Using the before-and-after design with yoked comparisons to estimate the
effectiveness of accident countermeasures implemented at multiple treatment locations (preliminary
draft). College Station, TX: Texas Transportation Institute.
Hagiwara, T., Yagi, M., and Seo, T. (1996). Visibility of laser beams and illuminated delineators as
function of fog density. Transportation Research Record, 1553, 59-65.
Hall, J.W. (1987). Evaluation of wide edgelines. Transportation Research Record, 1114, 21-30.
Harkey, D.L., Mera, R., and Byington, S.R. (1993). Effect of nonpermanent pavement markings on driver
performance. Transportation Research Record, 1409, 52-61.
Harms, L. (1992). The influence of sight distance on subjects' lateral control: A study of simulated driving
in fog. In Gale, A., et al. (Eds.), Proceedings of the 4th Conference on Vision in Vehicles (109-
119). North Holland.

75
Hedblom, T.P., Bradshaw, T.I., May, D.C., Jacobs, G.F., Szczech, T.J., Hodson, N.A., and Austin, R.L.
(1993). Correlation of the nighttime visibility of pavement marking tapes with photometric
measurement. Transportation Research Record, 1409, 69-75.
Helmers, G. (1978). Vagen visuella ledning i morker [Visual road guidance in night driving] (VTI Report
No. 115). Linkoping, Sweden: Swedish Road and Traffic Research Institute.
Helmers, G., and Lundkvist, S., (1991). Siktstracka till vagmarkering i fordonsbelysning [Visibility
distances to pavement markings in headlight illumination] (VTI Report No. 657). Linkoping,
Sweden: Swedish Road and Traffic Research Institute.
Herland, L., and Lundkvist, S., (1997). Provfalt med vagmarkeringar pa Rv 35 [Test area with road
markings on road Rv 35] (VTI Report No. 3-1997). Linkoping, Sweden: Swedish Road and
Traffic Research Institute.
Hickey, J.J. (1997). Shoulder rumble strip effectiveness: Drift-off-road accident reductions on the
Pennsylvania Turnpike (Paper No. 970624). Transportation Research Board 76th Annual Meeting.
Hoffman, A.G., and Firth, B.W. (1985). State-of-the-practice retro-reflective measurement devices for
pavement markings (Report No. FHWA-TS-84-222). Washington, D.C.: US Department of
Transportation, Federal Highway Administration.
Hopkins, T.A., and Marshall, B.R. (1974). Feasibility study of luminescent pavement markers - A study of
seven luminescent systems for wet-night visibility. Interim report (Report No. FHWA-RD-74-26).
Washington, D.C.: U.S. Department of Transportation, Federal Highway Administration.
Hughes, W.E., McGee, H.W., Hussain, S., and Keegel, J. (1989). Field evaluation of edgeline widths
(Report No. FHWA-RD-89-111). Washington, D.C.: U.S. Department of Transportation, Federal
Highway Administration.
Hubbell, J.S., and Taylor, W.C. (1968). Evaluation of pavement marking to designate direction of travel
and degree of safety. Highway Research Record, 221, 23-40.
Isler, R., Kirk, P., Bradford, S. J., and Parker, R. (1997). Testing the relative conspicuity of safety garments
for New Zealand forestry workers. Applied Ergonomics, 28(5/6), 323-329.
Jacobs, G.F., Hedblom, T.P., Bradshaw, T.I., Hodson, N.A., and Austin, R.L. (1995). Detectability of
pavement markings under stationary and dynamic conditions as a function of retroreflective
brightness. Transportation Research Record, 1495, 68-76.
Jacobs, G.F., and Johnson, N.L. (1995). Yellow pavement markings with yellow nighttime color.
Transportation Research Record, 1495, 147-155.
Janssen, W.H. (1979). Routeplanning: A literature study (Report No. IZF 1979 C-13). Soesterberg,
Netherlands: Institute for Perception TNO.
Jenkins, S.E. and Cole, B.L. (1986). Daytime conspicuity of road traffic control devices. Transportation
Research Record, 1093, 74-80.
Jingryd, K. (1995). Vagmarkeringars funktion i vata [The function of pavement markings during wet
conditions] (VTI Report No. 769). Linkoping, Sweden: Swedish Road and Traffic Research
Institute.

76
Johansson, O. (1986). Trafikksakerhetseffekten av kantstolpar pa smala vagar [Road safety effects of
side-post delineators on narrow roads] (Publication No. 84). Borlange, Sweden: National
Swedish Road Administration, Development Section.
Johansson, G., and Backlund, F. (1968). Drivers and road signs II (Report No. 50). Uppsala, Sweden:
Swedish State Board for Traffic Safety.
Johansson, G., and Rumar, K. (1971). Drivers' brake reaction times. Human Factors, 13, 23-27.
Johns, R.C., and Matthias, J.S. (1977). Relationship of the highway center-line stripe color to the accident
rate in Arizona. Presented at the Transportation Research Board 56th Annual Meeting, Washington,
D.C.
Johnston, I.R. (1983). The effects of roadway delineation on curve negotiation by both sober and drinking
drivers (Research Report No. ARR 128). Melbourne, Australia: Australian Road Research Board.
Kalchbrenner, J. (1989). Large beads for pavement markings. Transportation Research Record, 1230, 28-
36.
Kallberg, V.P. (1993). Reflector posts—Signs of danger? Transportation Research Record, 1403, 57-66.
Kidd, S.Q. (1990). An evaluation of reflective markers (Report No. MSHD-RD-90-67-4). Jackson, MS:
Mississippi State Highway Department.
King, L.E., and Graham, J.R. (1989). Evaluation of pavement marking material for wet night conditions:
Final report (Report No. FHWA/NC/89-003). Raleigh, NC: North Carolina Department of
Transportation.
Lassarre, S. (1976). Etude experimentale de l’efficacite des delineateurs [Experimental studies on the
effectiveness of raised pavement markers] (No. 75.400.12). Paris: SETRA & ONSER.
Lee, Jr., R.L., Hostetter, R.S., and Leibowitz, H.W. (1991). Driver visibility under wet pavement
conditions: Size, shape, and spacing of object markers/delineators (Report No. FHWA-RD-91-
016). Washington, D.C.: U.S. Department of Transportation, Federal Highway Administration.
Lee, J.T., Maleck, T.L., and Taylor, W.C. (1998). Analysis of the correlation between pavement marking
visibility and night-time accidents. Presented at the Transportation Research Board 77th Annual
Meeting.
Leibowitz, H.W., and Owens, D.A. (1977). Nighttime driving accidents and selective visual degradation.
Science, 197, 422-423.
Leibowitz, H.W., Owens, D.A., and Post, R.B. (1982). Nighttime driving and visual degradation (SAE
Technical Paper Series, No. 820414). Warrendale, PA: Society of Automotive Engineers.
Ligon, C.M., Carter, E.C., Joost, D.B., and Wolman, W.W. (1985). Effects of shoulder textured treatments
on safety (Report No. FHWA/RD-85/027). Washington, D.C.: Department of Transportation,
Federal Highway Administration.
Liptak, R.E. (1980). Raised pavement markers at hazardous locations (Report No. 495-F-80-16).
Wethersfield, CT: Connecticut Department of Transportation.
Lum, H.S., and Hughes, W.E. (1990). Edgeline widths and traffic accidents. Public Roads, 54(1), 153-
159.

77
Lundkvist, S. (1986). Vagmarkeringars retroreflekterande egenskaper [Reflection properties of
thermoplastic pavement marking compounds] (VTI Report No. 510). Linkoping, Sweden:
Swedish Road and Traffic Research Institute.
Lundkvist, S. (1988a). Undersokning av olika vagmarkeringstyper med avseende pa retroreflexion och
slitage [A study of different types of pavement markings relating to retro-reflectivity and wear]
(VTI Report No. 517). Linkoping, Sweden: Swedish Road and Traffic Research Institute.
Lundkvist, S. (1988b). Variation i torra vagmarkeringars specifika luminans over arstid [The variation
of the specific luminance of dry pavement markings during one year] (VTI Report No. 556).
Linkoping, Sweden: Swedish Road and Traffic Research Institute.
Lundkvist, S. (1988c). Forslag till standardmetod for utvardering av vagmarkeringars specifika
luminans [Proposal for a standard method for evaluation of the specific luminance of pavement
markings] (VTI Report No. 566). Linkoping, Sweden: Swedish Road and Traffic Research
Institute.
Lundkvist, S. (1990a). Torra vagmarkeringars specifika luminans under olika arstider [The specific
luminance of dry pavement markings during different seasons] (VTI Report No. 624).
Linkoping, Sweden: Swedish Road and Traffic Research Institute.
Lundkvist, S. (1990b). Vata vagmarkeringar - Validering av matmetod samt funktionstest [Wet pavement
markings - Measurement method and functional test] (VTI Report No. 356). Linkoping, Sweden:
Swedish Road and Traffic Research Institute.
Lundkvist, S. (1993). Effekter av UV-ljus i morkertrafik [Effects of UV lighting in night driving] (VTI
Report No. 3-93). Linkoping, Sweden: Swedish Road and Traffic Research Institute.
Lundkvist, S., Helmers, G., Nilsson, B., Ytterbom, U., Runersjo, L., and Lauridsen, R. (1990). Heldragen
kantlinje pa motortrafikled [Continuous edgelines on major road] (VTI Report No. 644).
Linkoping, Sweden: Swedish Road and Traffic Research Institute.
Lundkvist, S., Helmers, G., and Ytterbom, U. (1980). Specific luminance measurements of pavement
markings and road surfaces in the field: Comparisons between instruments (VTI Report No.
188A). Linkoping, Sweden: Swedish Road and Traffic Research Institute.
Lundkvist, S., and Nilsson, B. (1985). Vagmarkeringars specifika luminans - variation med arstid [The
specific luminance of pavement markings - variation depending on season] (VTI Report No. 467).
Linkoping, Sweden: Swedish Road and Traffic Research Institute.
Lundkvist, S., and Sorensen, K. (1980). Reflection properties of pavement markings in vehicle headlight
illumination (VTI Report No. 189A). Linkoping, Sweden: Swedish Road and Traffic Research
Institute
Lundkvist, S., Ytterbom, U., and Runersjo, L. (1990). Heldragen kantlinje pa 9 m bred tvafaltsvag
[Continuous edgeline on nine-meter-wide two-lane roads] (VTI Report No. 635). Linkoping,
Sweden: Swedish Road and Traffic Research Institute.

78
Lundkvist, S., Ytterbom, U., Runersjo, L., and Nilsson, B. (1992). Effekt av heldragen kantlinje pa tre
vagtyper [Effects of a continuous edgeline applied on three types of roads] (VTI Report No. 673).
Linkoping, Sweden: Vag-och Trafik-Institutet.
Marsh, D.K., II, and Tyrrell, R.A. (1998). Detectability and perceived brightness of commercially available
colored retroreflective materials at night. In, Proceedings of the Human Factors and Ergonomics
Society 42nd Annual Meeting (p. 1633). Santa Monica, CA: Human Factors and Ergonomics
Society.
Mattimore, H.S. (1926). Highway traffic line (zone) paint suggestions concerning physical test for traffic
paints. Highway Research Board Proceedings, Vol. 5, Pt. 1.
McBean, P.A. (1982). The influence of road geometry at a sample of accident sites (TRRL Report No.
1053). Crowthorne, England: Transport and Road Research Laboratory.
McGee, H.W., Moore, W., Knapp, B.G., and Sander, J.H. (1978). Decision sight distance for highway
design and traffic control requirements (Report No. FHWA-RD-78-78). Washington, D.C.: U.S.
Department of Transportation, Federal Highway Administration.
McGrath, M.A. (1981). Durable pavement marking materials: Summary Report of 1981 Workshops
(Report No. FHWA-TS-81-221). Washington, D.C.: U.S. Department of Transportation, Federal
Highway Administration.
McNees, R.W. (1987). Establishing a minimum functional reflectance for raised pavement markers.
Transportation Research Record, 1149, 66-72.
McNees, R.W. and Noel, J.S. (1986). Reflectivity retention of raised pavement markers (Research Report
No. 322-2). College Station, TX: Texas A&M University System, Texas Transportation Institute.
McRuer, D.T., and Krendel, E.S. (1959). The human operator as a servo system element. Journal of the
Franklin Institute, 267, 381-403, 511-536.
Mehta, A. B., Vingrys, A. J., and Badcock, D. R. (1994). Detection and discrimination of moving stimuli:
The effects of color, luminance, and eccentricity. Journal of the Optical Society of America, 11,
1697-1709.
Michaut, M., and Bry, M. (1985). Visibility thresholds in night driving conditions. Transportation
Research Circular , 297, 23-25.
Michon, J. (1971). Psychonomie onderweeg [Progress in psychology] (Inaugural lecture). Groningen,
The Netherlands: Wolters-Noordhoff.
Migletz, J., Fish, J.K., and Graham, J.L. (1994). Roadway delineation practices handbook. (Publication
No. FHWA-SA-93-001). Washington, D.C.: U.S. Department of Transportation, Federal
Highway Administration.
Miller, T.R. (1992). Benefit-cost analysis of lane markings. Transportation Research Record, 1334, 38-
45.
Mullowney, W. L. (1982). The effect of raised pavement markers on traffic performance (Publication No.
FHWA-NJ-83-001). Trenton, NJ: New Jersey Department of Transportation.

79
Musick, J.V. (1960). Effect of pavement edge marking on two-lane rural state highways in Ohio. Highway
Research Board Bulletin, 266, 1-7.
Nilsson, G. (1984). Hastigheter, olycksrisker och personskadekonsekvenser i olika vaegmiljoeer [Speeds,
accident rates and personal injury consequences for different road types] (Report No. 277).
Linkoping, Sweden: Swedish Road and Traffic Research Institute
Nygaard, B. (1977). The use of eye movement recordings in road traffic (Report No. 1). Copenhagen,
Denmark: The Danish Council for Road Safety Research.
Nordic Research Cooperation for Night Traffic. (1983). Reflection properties of pavement markings in
headlight illumination: Dependence on measuring geometry (Report No. 6). Linkoping:
Morkertrafik.
O’Brien, J. (1989). Embedment and retroreflectivity of drop-on glass spheres in thermoplastic markings.
Transportation Research Record, 1230, 37-44.
Obro, P. (1990). Forsog med synlighed af vejmarkeringer i billygtebelysning [Visibility studies of road
markings in vehicle illumination] (Report No. 12). Lyngby, Denmark: Lys & Optik.
OECD. (1975). Pavement marking and delineation. Paris, France: Organization for Economic Co-
Operation and Development.
Oliver, W.E. (1977). An evaluation of the 10:30 centerline marking pattern (Report No. VHTRC 78-R3).
Charlottesville, VA: Virginia Highway and Transportation Research Council.
Olsen, R.A. (1972). Evaluation of the visibility of reflective devices. National Cooperative Highway
Research Program, 130, 219-228.
Owens, D.A., and Andre, J.T. (1996). Selective visual degradation and the older driver. International
Association of Traffic and Safety Sciences Research, 20(1), 57-66.
Owens, D.A., and Tyrrell, R.A. (In press). Effects of luminance, blur, and age on nighttime visual
guidance: A test of the selective degradation hypothesis. Journal of Experimental Psychology:
Applied, 1998.
Padmos, P. (1985). Visually critical elements in night driving: In relation to public lighting, providing
visibility and visual guidance to the road user. Transportation Research Circular , 297, 8-9.
Paniati, J.F., and Schwab, R.N. (1991). Research on the end of life for retroreflective materials: A progress
report. Transportation Research Record, 1316, 13-17.
Perrin, J., Martin, P.T. Hansen, B.G. (1997). A comparative analysis of pavement marking materials.
Presented at the Transportation Research Board 76th Annual Meeting, Washington, D.C.
Pietrucha, M.T., Hostetter, R.S., and Staplin, L. (1995). Markings and delineation for older drivers. 1995
Compendium of Technical Papers, Institute of Transportation engineers 65th Annual Meeting,
614-618.
Potash, C.B., and Brown, J.R. (1988). Fog mitigation update: Fog mitigation measures as applied to
highway bridge structures. Transportation Research Record, 1172, 74-77.
Potters Industries, Inc. (1981). Pavement markings as an alcohol countermeasure in traffic safety: a field
test of standard and wide edgelines. Hasbrouck Heights, NJ: Potters Industries, Inc.

80
Retting, R.A., and Farmer, C.M. (1998). Use of pavement markings to reduce excessive traffic speeds on
hazardous curves. Presented at the Transportation Research Board 78th Annual Meeting,
Washington, D.C.
Riemersma, J.B.J. (1985). Koershouden op de rechte weg [Course holding on straight roads].
Verkeerskunde, 36, 367-372.
Ritter, J.R. (1973). A unique approach to evaluating road stripe material on two-lane rural roads. Highway
Research Record, 447, 1-7.
Ritter, J.R. (1978). Glass beads for highway paint stripes (Report No. FHWA-TS-78-213). Washington,
D.C.: U.S. Department of Transportation, Federal Highway Administration.
Rockwell, T.H., Ernst, R.L. and Rulon, M.J. (1970). Visual requirements in night driving (Report No. 99).
Washington, D.C.: National Cooperative Highway Research Program.
Roper, V.J., and Howard, E.A. (1938). Seeing with motor car headlamps. Transactions of the Illuminating
Engineering Society, 33(5), 417-438.
Rosbach, O. (1984). Kantlinjer forbedrer bade bilisters og cyklisters sikkerhed [Edgelines improve safety
for both drivers and cyclists] (Report No. 10). Copenhagen: Danish Road Journal.
Roth, W.J. (1970). Interchange ramp color delineation and marking study. Highway Research Record,
325, 36-50.
Roth, W.J. (1974). Color coding study for freeway markings: Median delineation phase (Report No.
TSD-231-73). Lansing, MI: Michigan Department of State Highways and Transportation.
Rowan, N.J. (1963). Marking the approach-ends of channelization (Bulletin No. 25). College Station, TX:
Texas Transportation Institute.
RRL. (1960). Instructions for using the portable skid resistance tester (Road Report No. 27).
Harmondsworth, England: Road Research Laboratory.
Rumar, K. (1986). In-vehicle information systems. In Proceedings of the IAVD Congress on Vehicle
Design and Components, D, 33-42.
Rumar, K. (1990). The basic driver error: Late detection. Ergonomics, 33, 215-229.
Rumar, K. (1998). Vehicle lighting and the aging population (Report No. UMTRI-98-9). Ann Arbor, MI:
The University of Michigan Transportation Research Institute.
Rumar, K., and Ost, A. (1974). Nedsmutsning av vagmarkeringar: Forekmost ock synbarhetseffekter
[Dirt on road markings: existence and effects on visibility] (Report No. 1974-05-31). Uppsala,
Sweden: Department of Psychology.
Sayer, J.R., Mefford, M.L., Flannagan, M.J., Sivak, M., Traube, E.C., and Kojima, S. (1998). Effects of
retroreflective marking color on pedestrian detection distance (Report No. UMTRI-98-8). Ann
Arbor, MI: The University of Michigan Transportation Research Institute.
Scheuer, M., Maleck, T.L., and Lighthizer, D.R. (1997). Paint-line retroreflectivity over time.
Transportation Research Record, 1585, 53-63.

81
Schmidt-Clausen, H.J., and Damasky, J. (1994). The field of vision of drivers during nighttime (Paper No.
94-S2-O-05). In Proceedings of the 14th International Conference on Enhanced Safety of Vehicles,
Munich, Germany. Washington, D.C.: U.S. Department of Transportation
Schnell, T. and Zwahlen, H.T. (1996). The development of CARVE: A Computer Aided Road-Marking
Visibility Evaluator. Presented at the Transportation Research Board Visibility Committee
Symposium on Night Visibility and Driver Behavior, Iowa City, Iowa.
Schreuder, D.A. (1986) The function of pavement markings in relation to driver’s visual needs (Report R-
86-29). Leidschendam, Netherlands: Institute for Road Safety Research SWOV.
Schumann, J., Sivak, M., Flannagan, M.J., Traube, E.C., Hashimoto, H. and Kojima, S. (1996). Brightness
of colored retroreflective materials (Report No. UMTRI-96-33). Ann Arbor, MI: The University
of Michigan Transportation Research Institute.
Serres, A.M. (1981). La visibilite des marques routieres [Visibility of road markings]. Paris, France:
Bulletine liaison Laboratoire de Ponts et Chaussees, 114, 27-40.
Shaw, R., Nowakowski, C., and Green, P. (1998). U.S. highway attributes relevant to lane tracking.
(Report No. UMTRI-98-34). Ann Arbor, MI: The University of Michigan Transportation
Research Institute.
Shinar, D., Rockwell, T., and Mallecki, J. (1980). The effects of changes in driver perception on rural curve
negotiation. Ergonomics, 23, 263-275.
Sivak, M., Flannagan, M., and Gellatly, A.W. (1993). Influence of truck driver eye position on
effectiveness of retroreflective traffic signs. Lighting Research Technology, 25(1), 31-36.
Sivak, M., Flannagan, M.J., Budnik, E.A., Flannagan, C.C., and Kojima, S. (1997). The locations of
headlamps and driver eye positions in vehicles sold in the U.S. Ergonomics, 40, 872-878.
Sivak, M., Flannagan, M.J., and Miyokawa, T. (1998). Quantitative comparison of factors influencing the
performance of low-beam headlamps (Report No. UMTRI-98-42). Ann Arbor, MI: The
University of Michigan Transportation Research Institute.
Sivik, L. (1975). Studies of color meaning. Man Environment Systems, 5(3), 155-160.
SNRA. (1996). Trafikantbetyg yrkeschaufforer [Professional driver evaluation]. Vagverket Publication
No. 1996:50.
Sorensen, K. (1998). Model for the visibility of pavement markings (COST Subtask 300A). Lyngby,
Denmark: DELTA Lys & Optik.
Stimson, W.A., McGee, H.W., Kittelson, W.K., and Ruddy, R.H. (1977). Field evaluation of selected
delineation treatments on two-lane rural highways (Report No. FHWA-RD-77-118.).
Washington, D.C.: U.S. Department of Transportation, Federal Highway Administration.
Tamburri, T.N., Hammer, C.J., Glennon, J.C., and Lew, A. (1968). Evaluation of minor improvements.
Highway Research Record, 257, 34-39.
Taragin, A. (1958). Driver behavior as related to shoulder type and width of two-lane highways. Highway
Research Board, Bulletin, 170, 54-76.

82
Taylor, W.C., and Foody, T.J. (1966). Ohio’s curve delineation program—An analysis. Traffic
Engineering, 36(9), 41-45.
Thomas, Jr., I.L. (1958). Pavement edge lines on twenty-four foot surfaces in Louisiana. Highway
Research Board Bulletin, 178, 12-20.
Thomas, Jr., I.L., and Taylor, W.T., Jr. (1960). Effect of edge striping on traffic operations. Highway
Research Board, Bulletin, 244, 11-15.
Tielking, J.T., and Noel, J.S. (1989). Research on raised pavement markers. Transportation Research
Record, 1230, 56-66.
TOI. (1997). Norwegian Trafikksikkerhetshandbok [Norwegian Road safety handbook]. Oslo, Norway:
TOI.
Tooke, Jr., W.R., and Hurst, D.R. 1975. Wet night visibility study (GDOT Research Project No. 6701).
Atlanta, GA: Georgia Department of Transportation.
Ullman, G.L. (1994). Retroreflective raised pavement marker field testing: Results of the first year
evaluation (Report No. TTI 7-1946). College Station, TX: Texas Transportation Institute.
Ullman, G.L., and Rhodes, Jr., L.R. (1996). Field test of a portable retroreflectometer for retroreflective
raised pavement markers. Transportation Research Record, 1529, 71-75.
Venable, W. H., and Hale, W. N. (1996). Color and nighttime pedestrian safety markings. Color
Research and Application, 21, 305-309.
Walraven, J. (1980). Visueel-critische elementen bij het nachtrijden: Een verkennend onderzoek [Visually
critical elements in night driving: A pilot study] (Report No. IZF 1980 C-22). Soesterberg,
Netherlands: Institute for Perception TNO.
Walton, N.E. (1975). Fixed illumination as a function of driver needs: Driver visual needs in night
driving. Transportation Research Board Special Report No. 156, 101-111.
Weir, D. H., and McRuer, D. T. (1968). A theory for driver steering control of motor vehicles. Highway
Research Record, 247, 7-28.
Wilde, G.J.S. (1982). The theory of risk homeostasis: Implications for safety and health. Risk Analysis,
2, 209-225.
Willis, P.A., Scott, P.P., and Barnes, J.W. (1984). Road edgelining and accidents: An experiment in
South-West England (TRRL Report 1117). Crowthorne, England: Transport and Road Research
Laboratory.
Williston, R. M. (1960). Effect of pavement edge markings on operator behavior. Highway Research
Board Bulletin 266, 8-27.
Wright, P.H., Zador, P.L., Park, C.Y., and Karpf, R.S. (1982). Effect of pavement markers on nighttime
crashes in Georgia. Atlanta, GA: Georgia Institute of Technology.
Zador, P., Stein, H.S., Wright, P., and Hall, J. (1987). Effects of chevrons, post-mounted delineators, and
raised pavement markers on driver behavior at roadway curves. Transportation Research Record,
1114, 1-10.

83
Zwahlen, H.T. (1989). Conspicuity of suprathreshold reflective targets in a driver’s peripheral visual field
at night. Transportation Research Record, 1213, 35-46.
Zwahlen, H.T. (1993). Optimal application and placement of roadside reflective devices for curves on
two-lane rural highways (Report No. FHWA/OH-94/011). Athens, OH: Ohio Department of
Transportation.
Zwahlen, H.T., Hagiwara, T., and Schnell, T. (1995). Visibility of new yellow center stripes as a function of
obliteration. Transportation Research Record,1495, 77-86.
Zwahlen, H.T., Miller, M.E., Khan, M., and Dunn, R. (1988). Optimization of post delineator placement
from a visibility point of view. Transportation Research Record,1172, 78-87.
Zwahlen, H.T., and Schnell, T. (1995). Visibility of new pavement markings at night under low-beam
illumination. Transportation Research Record, 1495, 117-127.
Zwahlen, H.T., and Schnell, T. (1996). Visibility of new dashed yellow and white center stripes as a
function of material retroreflectivity. Transportation Research Record, 1553, 73-80.
Zwahlen, H.T., and Schnell, T. (1997a). Visibility of new centerline and edge line pavement markings.
Transportation Research Record, 1605, 49-61.
Zwahlen, H.T., and Schnell, T. (1997b). Driver eye-scanning behavior as function of pavement marking
configuration. Transportation Research Record, 1605, 62-72.
Zwahlen, H.T., and Schnell, T. (1998). The visibility of pavement markings as a function of age, retro-
reflectivity under low-beam and high-beam illumination at night. Washington, D.C.: Presented at
the Transportation Research Board 77th Annual Meeting.
Zwahlen, H.T., Schnell, T., and Hagiwara, T. (1995). Effects of lateral separation between double center-
stripe pavement markings on visibility under nighttime driving conditions. Transportation
Research Record, 1495, 87-98.