Embed Size (px)
Citation preview

LR
BU
a
ARRA
KLLNEC
1
bniatstctcVcm
s
h1
Ecological Indicators 43 (2014) 143–153
Contents lists available at ScienceDirect
Ecological Indicators
j o ur na l ho me page: www.elsev ier .com/ locate /eco l ind
andscape structure versus the effectiveness of nature conservation:oztocze region case study (Poland)
arbara Natalia Sowinska-Swierkosz ∗, Dawid Soszynski1
niversity of Life Science in Lublin, Department of Landscape Ecology and Nature Conservation, Dobrzanskiego, 37, 20-267 Lublin, Lubelskie, Poland
r t i c l e i n f o
rticle history:eceived 6 November 2013eceived in revised form 27 January 2014ccepted 18 February 2014
eywords:andscape patternsandscape metricsature conservationfficient managementomparative studies
a b s t r a c t
The objective of the study was to examine the extent to which landscape metrics could be used as an indi-cator of efficient management of protection areas. The selected sampling areas were natural–landscapeunits distinguished within the Roztocze Region located in the central-east Poland. Among 446 units, thoserepresenting three typological groups determined by three factors were selected. The factors included (1)the area of the unit; (2) the dominant or characteristic type of ecosystem; and (3) the form of protection.Subsequently, thirteen landscape metrics were calculated with the application of the Fragstats software.The analysis revealed high correlation between the form of nature protection and the majority of the cal-culated indexes. National park units show the highest landscape diversity and stability of various types ofecosystems. This suggests high conservation efficiency. Landscape park units are distinguished by frag-mented patchy composition, and spatial structure even less stable than that of the non-protected areas.The study results show that landscape metrics could be used as an indicator of efficient management of
different forms of nature protection. They provide an insight into the structure and functioning of theenvironment at various levels of its organisation. We particularly found diversity metrics to be useful forindicating whether nature conservation goals are archived, and the size and density metric for measuringhuman interference in the landscape. The selection and interpretation of indexes should be determinedby the specific character of a given area.© 2014 Elsevier Ltd. All rights reserved.
. Introduction
The efficiency of nature conservation at the landscape level haseen discussed along with its various aspects both at global andational level. Many factors of successful protection have been
dentified for each stage of protective measures: planning, man-gement, monitoring, and funding (Quan et al., 2010). Accordingo Margules and Pressey (2000), the extent to which a protectedite fulfils its role depends on whether the objectives of represen-ativeness and persistence have been met. In consequence, efficientonservation is the outcome of the ecological basis of the pro-ected area’s delineation, the durability of its existence, and theontinuity of application of protective measures. Papageorgiou and
ogiatzakis (2006) treated public involvement and inter-sectoraloordination as major procedural elements of effective manage-ent of nature. The authors emphasise that the political culture∗ Corresponding author. Tel.: +48 814592506.E-mail addresses: [email protected] (B.N. Sowinska-Swierkosz),
[email protected] (D. Soszynski).1 Tel.: +48 814592506.
ttp://dx.doi.org/10.1016/j.ecolind.2014.02.018470-160X/© 2014 Elsevier Ltd. All rights reserved.
of each country, determining legal frameworks, regulations, andland ownership, highly influences its nature policy output. Ana-logically, Pchałek et al. (2011) state that the effectiveness of natureconservation depends directly on a coherent legal system, i.e. on theselection, implementation, and enforcement of legislative tools of agiven authority. Therefore, the efficiency of a given nature conser-vation law may be measured by accurately formulated regulations,efficient executive system, and consistent enforcement (Sommer,2005). A number of authors (Jones and Stenseke, 2011; Kasprzyket al., 2007; Trakolis et al., 2000) link successful nature conser-vation with the issue of public interest. According to the authors,lack of communication between scientists and managers, and poorlevel of public participation are among the largest obstacles for theefficiency of protection measures. Others (Brody et al., 2003; Nossand Scott, 1997) emphasise the importance of the considered scale.Factors causing ecosystem disturbances at the local level, such aswater level decrease, may result from regional or even nationalconditions. The issue of conservation effectiveness goes beyond the
borders of a given protected site and it should be discussed not onlyin reference to its management and protection systems, but witha more global and comprehensive approach. Effective protectioncannot be executed solely by taking selective action addressing a
1 i / Eco
gln2
rtasaantuC
itydtibpeqapamgotoTapcTfne
nclmd2caeeudpomsqTt(wea
44 B.N. Sowinska-Swierkosz, D. Soszynsk
iven landscape component of a selected area. The incorporation ofandscape issues into spatial planning at each stage of land use plan-ing is required (Beatley, 2000; Chmielewski, 2012; Majchrowska,011).
As briefly outlined above, effective protection of a given areaequires consideration of a number of methodological, organisa-ional, and sociological issues. The issues are interconnected in such
way that the approach adopted at the designation level may affectuccessful protection. For example, the delineation of the bound-ries of a protected area based on landscape forms may hinder thedministrative process. On the other hand, it facilitates the defi-ition of protection goals regarding each landscape unit, becausehey are coherent in terms of abiotic and biotic elements and land-se (Brody et al., 2003; Roe and Van Eeten, 2001; Sowinska andhmielewski, 2011).
The effectiveness of nature conservation at the landscape levels primarily analysed by means of two different techniques. One ofhem is called the analytical approach. The subject of such an anal-sis is the estimation of efficiency of law regulations in reference toifferent levels: legislative (orders and bans), procedural (the sys-em of norms’ implementation), and organisational (institutionalnfrastructure) (Pchałek et al., 2011). A critical outlook is providedy a thorough analysis of legislative documentation, protectionlans, organisational framework, sources of funding, etc. (Brodyt al., 2003; Papageorgiou and Vogiatzakis, 2006). Interviews anduestionnaires addressed to different groups of stakeholders, suchs nature reserve staff members, local authorities, and land owners,ermit the identification of conflicts negatively affecting the man-gement system efficiency (Kistowski, 2004). The multi-aspect andulti-level character of the approach allow for the determination of
aps between the legislatively declared aims and the existing statef protection, and therefore the identification of the weakest link inhe chain. The analytical approach has been standardised and rec-mmended by the World Commission on Protected Areas (WCPA).he assessment of the management effectiveness of protected areasnd protected area systems is based on six standard elements ofrotected area management, namely: context, planning, input, pro-ess, output, and outcomes (Hockings, 2000; Hockings et al., 2002).he method permits the evaluation of management effectivenessrom four perspectives: management base, management mecha-isms, management behaviour, and management effectiveness (Het al., 2012; Quan et al., 2010).
The second approach is based on the application of the GIS tech-ique. Remote sensing permits a shift of the discussion on natureonservation effectiveness from the ecosystem to the landscapeevel. This tool is primarily used to map, measure, analyse, and
onitor the mosaic of the existing ecosystem, and to define theirections of changes and state of its transformation (Coppin et al.,004; Shijo et al., 2009; Khalyania et al., 2013). Based on the above,onclusions are determined regarding the efficiency of protectionctions and elements of the protection system requiring strength-ning in order to maintain or enrich the values of the protectedcosystems. Remote sensing is also used to map the spatial config-ration of protected areas. This visual presentation tool permits theetermination of the degree of coverage for single and aggregatedolicies across diverse types of ecosystems, and the identificationf areas that should be covered by future plans in order to obtain aore consistent management framework (Brody et al., 2003). Land-
cape metrics representing the spatial structure of landscapes in auantitative manner are also used to assess conservation efficiency.he patchy structure reflected by a set of adequate indices may bereated as an indicator of the functioning of different ecosystems
Aragon et al., 2011; Ferguson, 1996; Yeha and Huang, 2009), asell as ecological stability and diversity (Hess et al., 2006; Lombardt al., 2003; Saveraid et al., 2001; Wiersma et al., 2004). The number,rea, shape, and edge metrics suggest the level of anthropogenic
logical Indicators 43 (2014) 143–153
transformation. They indirectly determine whether one of the mainobjectives of nature conservation, namely maintaining the naturalstate of environment, is met (Chmielewski, 2012). Landscape struc-ture also provides information on conflict fields. Therefore, it maybe used as an indicator of coherent landscape management (Lenzand Stary, 1995). Landscape metrics are calculated for both admin-istrative borders (Hassett et al., 2012; Moser et al., 2007) and fordifferent kinds of natural units (Lausch and Herzog, 2002; Liu et al.,2003; Syrbe and Walz, 2012; Troyer, 2002; Uuemaa et al., 2005).However, in the case of nature conservation effectiveness analysisthe second type of area based on landscape borders seems to bemore proper.
The approach adopted in the present study is coherent withthe technical approach. The objective of the study was to examinethe extent to which commonly used and easily obtained landscapemetrics could be used as an indicator of efficient nature conser-vation at the landscape level. The Roztocze region (231,400 ha),located in the central-east Poland near the Ukraine border, wasselected as the study area. Due to the region’s outstanding naturaland cultural values, the main elements of the system of protectedareas here include one national park (surrounded by a vast bufferzone of 38,000 ha) and three landscape parks. The study area alsoincludes 16 natural reserves. Almost the entire region is coveredby the Natura 2000 network. The Roztocze National Park (8482 ha)covers the most valuable forest ecosystems, particularly fir woodsand the Carpathian beech complexes, as well as peat-bog ecosys-tems in a semi-natural state. The Szczebrzeszynski landscape park(20,209 ha) was established for the purpose of maintaining theunique historical field mosaic structure of the upland areas, andthe dense mosaic of loess ravines. Elements typical of the Krasno-brodzki landscape park (9390 ha) are sand dunes and dry valleyscovered by pine and fir forests. The South Roztocze landscape park(20,256 ha) includes numerous limestone outlines constituting thehighest elevations of the Roztocze region.
2. Methods
The first stage of the study involved the delineation of elemen-tary spatial units, called as natural–landscape units, based on themethod elaborated by Chmielewski and Solon (1996) and mod-ified by Sowinska and Chmielewski (2008). The system of unitswas defined using spatial overlapping of different kinds of land-scape borders and with the application of the ArcGis 10.0 software.They were: (1) main tectonic structures; (2) main geomorphologicstructures; (3) water divisions; (4) soil types; (5) main complexesof phytocoenosis; (6) built-up areas; (7) landscape interiors andview openings. A series of digital maps was used for this purpose:(1) map of tectonic blocks and trenches (1:50,000); (2) geomor-phologic map (1:50,000); (3) atlas of water division (1:50,000); (4)detailed geological map (1:50,000); (5) numeric terrain (verticalaccuracy 0.6 m, horizontal accuracy 15/15 m or 30/30 m); (6) soilmap (1:25,000); (7) topographic map (1:25,000); (8) orthophotomap (pixel cell size of 0.25 m, 2009); (9) forestry maps (1: 25,000).The natural–landscape units are recognised as the most suitablefor the analysis of the correlation between landscape structure andnature conservation effectiveness due to a number of reasons. Theyare relatively homogeneous in terms of several features affect-ing the landscape structure. Previous studies also revealed theirpotential usefulness for the process of delineation of protectedareas, and management of environmentally and culturally valuableareas (Chmielewski and Solon, 1996; Sowinska and Chmielewski,
2011). Finally, landscape units are particularly relevant, because themajority of decisions regarding resource management and conser-vation are made at this particular scale of landscape (Aragon et al.,2011). By aligning management actions, policies, and plans with
B.N. Sowinska-Swierkosz, D. Soszynski / Eco
Table 1The description of selected vectors of differentiation of units.
Vector Range Reason
1. Area of unit a. 1–500 hab. 501–1000 hac. 1001–1500 had. 1501–2000 hae. 2001–2500 haf. 2501–3000 hag. 3001–3500 hah. 3501–4000 hai. 4001–4500 haj. 4501–5000 ha
Division of units byarea was essential,because certainlandscape metrics,such as NP, PRD, SHDI,and SHEI largelydepend on the spatialscale considered(Hassett et al., 2012;Wu et al., 2002).
2. Dominant orcharacteristictype of landcover
a. Water-peatbogb. Forestc. Fieldd. Build-up arease. Mosaic ofdifferent types ofland cover
Determination ofpotential differences inthe effectiveness ofmanagement of areascovered by differenttypes of ecosystems.
3. Form of natureprotection
a. National parkwith buffer zoneb. Landscape parkc. Non-protectedarea
The management ofprotected natural areasmust consider both thecontent (what is in thepark) and the context
ai(ba(
ce(sClscfptartwbp
TS
(what surrounds thepark) (Hassett et al.,2012).
coherent ecologically defined spatial unit, the structure, stabil-ty, and diversity of a given area can be protected more effectivelyBrody et al., 2003). Each natural–landscape unit was distinguishedy three vectors: (1) the area of the unit; (2) the dominant or char-cteristic type of land cover, and (3) the form of nature protectionTable 1).
The next stage involved the application of the hierarchicallustering method. This approach permitted grouping units delin-ated in various parts of the study area into so-called “clusters”typological groups) with a maximum possible similarity of theelected vectors (Chmielewski and Iwanicka, 2004; Sowinska andhmielewski, 2012). This operation aimed at selecting from a very
arge set of various units, study areas with common high land-cape heterogeneity reflected in: the unit’s area, character of abioticomponents, dominant type of ecosystem, percentage share of dif-erent types of land cover, presence/lack of build-up areas, andresence/lack of wetlands. Landscape metrics were calculated forhe selected units with the application of the Fragstats softwarend the moving window method (McGarigal and Marks, 1995). Theesolution of the raster used as an input to software was 1 m. Thir-
een classes of land cover were taken into consideration: stagnantaters, coniferous forests, deciduous forests, mixed forests, peat-ogs, meadows, clearings, fields, plantations, belt-type tree stands,atch-type tree stands, compact settlements, and farms. Minimum
able 2pearman rank correlations calculated for pairs of landscape metrics (n = 24, p < 0.05, valu
TA MPS NP PD MTE ED SHAP
TA 1.0MPS 0.49 1.0NP 0.43 −0.51 1.0PD −0.56 −0.93 0.37 1.0MTE 0.41 0.91 −0.64 −0.86 1.0ED −0.57 −0.85 0.28 0.81 −0.60 1.0SHAPE MN 0.09 −0.04 0.04 0.08 0.16 0.24 1.0FRAC 0.02 −0.13 0.16 0.21 −0.01 0.25 0.92CONTAG −0.13 −0.03 0.02 0.12 −0.18 −0.20 −0.20PR 0.27 −0.12 0.20 0.10 −0.13 0.08 −0.01PRD −0.63 −0.63 −0.26 0.66 −0.41 0.68 −0.05SHDI 0.30 0.05 0.06 −0.13 0.21 0.17 0.19SHEI 0.05 −0.00 −0.09 −0.10 0.22 0.27 0.27MPI 0.35 −0.13 0.42 0.13 −0.07 0.22 0.50
logical Indicators 43 (2014) 143–153 145
mapping unit was 0.1 ha. A review of literature concerning theapplication of landscape metrics (Arnot et al., 2004; BotequilhaLeitao and Ahern, 2002; Colson et al., 2011; Egbert et al., 2002;Hargis et al., 1998; Ritters et al., 1995) was performed to select aset of indices reflecting the structure of different types of ecosys-tems in the most comprehensive manner. Next, in order to reducethe number of indices to a manageable level, the smallest set ofindices was selected, still adequately reflecting major landscapeproperties, but avoiding doubling-up. The Spearman rank corre-lation (p = 0.05) was calculated for each pair of indices (Table 2).When the obtained absolute correlation coefficient amounted to0.9 or more, only one of the two metrics was retained. The excep-tion was Mean Total Area. In spite of a strong correlation with twoother metrics, it was calculated as an important indicator of land-scape structure. As the result, thirteen key landscape metrics wereselected, important for a number of ecological processes (Table 3).The Spearman rank correlation (p = 0.05) was also used to deter-mine whether any of the landscape metric was highly correlatedwith the size of natural–landscape units belonging to each of thesize groups. The result suggests no significant correlation.
The final stage of the study involved investigating the correla-tion between landscape metrics calculated for selected units andtheir form of nature protection. Based on the above, the analysisof landscape conservation effectiveness was performed. Becausethe level and detailed objectives of nature protection differ amongnational parks and landscape parks, the analysis was conducted inaddition to the general objectives of nature conservation in Poland.These include (Nature Conservation Act, 2004: Article 2.2): (1)maintenance of ecological processes and stability of ecosystems;(2) maintenance of diversity; (3) provision of continuity of exist-ence of fauna, flora, and fungus species together with their habitatsby their maintenance or restoration to the proper state of protec-tion; and (4) protection of landscape values.
3. Results
3.1. Typological diversity of natural–landscape units set
As a result of the first stage of the study, 446 natural–landscapeunits were delineated within the Roztocze macroregion (Sowinskaand Chmielewski, 2012). The area of the selected units varies from9 to 4817 ha, averaging 516 ha with a standard deviation of 575 ha.The majority of the natural–landscape units (62%) have an area ofless than 500 ha. Only approximately 8% of the units have an areaof more than 1500 ha.
The main types of dominant ecosystems, which occupied morethan 70% of unit area, are fields or forests, predominating in 32% and31% of units, respectively (Fig. 1). Units characterised by the 10% orhigher share of water-peatbog ecosystems constitute almost 7% of
es marked with bold are significant correlations at the level of 0.9 or more).
E MN FRAC CONTAG PR PRD SHDI SHEI MPI
1.0 0.02 1.0 0.01 −0.21 1.0 −0.02 0.09 0.16 1.0
0.05 −0.76 0.65 −0.03 1.0 0.08 −0.89 0.26 0.02 0.79 1.0
−0.40 −0.23 0.19 −0.21 0.34 0.27 1.0

146 B.N. Sowinska-Swierkosz, D. Soszynski / Ecological Indicators 43 (2014) 143–153
Table 3List of landscape metrics used in the study (based on McGarigal et al., 2002).
Mean patch size (MPS) The sum of the area of all patches in the landscape divided by the number of patchesCharacteristic class(es) area proportion
(CAP)Proportion of landscape area occupied by the characteristic class(es)
Number of patches (NP) Number of patches in the landscapePatch density (PD) The number of patches per unit areaMean total edge (MTE) The sum of the lengths (m) of all edge segments in the landscape divided by the number of patchesEdge density (ED) The total length of all edge segments per ha for the landscape of consideration (unit: m/ha)
Mean Shape Index (SHAPE MN) A patch-level shape index averaged over all patches in landscape: SHAPE MN =∑m
i=1
∑n
j=1(Pij/ 2
√aij )
N
where Pij is the perimeter, aij is the area of patch ij and N is the total number of patches in the landscape
Contagion Index (CONTAG) Indicates the aggregation of patches: CONTAG =[
1 +∑m
i=1
∑m
k=1Pi∗[(
gik/∑m
k=1gik
)]∗[
ln(
Pi∗(
gik/∑m
k=1gik
))]2 ln (m)
]100
where Pi is the proportion of the landscape occupied by patch type i; gik is the number of adjacencies between pixelsof patch types (classes) i and k based on the double-count method; and m is the number of patch types (classes) in thelandscape, including the landscape border if present
Patch richness (PR) Number of patch types (classes) present in the landscapePatch richness density (PRD) The number of patch types per unit area (unit: patches per 100 ha)
Shannon’s Diversity Index (SHDI) Indicates the patch diversity in the landscape: SHDI = −∑m
i=1(Pi ∗ ln Pi)
where Pi is the proportion of landscape occupied by patch type i
Shannon’s Evenness Index (SHEI) Indicates the patch diversity in the landscape: SHEI =−∑m
i=1(Pi∗ln Pi )
ln mwhere Pi is the proportion of landscape occupied by patch type i and number of patch types (classes) present in thelandscape
Mean Proximity Index (MPI) Provides an index of patch isolation within a specified neighbourhood of the patch analysed:
MPI =∑n
j=1
∑n
s=1(aijs/h2
ijs)
ni
where aijs is the area of patch i of patch type j within specified distance s of patch ij (the focal patch); hijs is the distancebetween patch ijs and the focal patch (based on patch edge-to-edge distance, computed from cell centre to cellcentre); and ni is the total number of patches in class i.
Fig. 1. Study area: location, borders of protected areas, system of natural–landscape units, and dominant type of land cover.
B.N. Sowinska-Swierkosz, D. Soszynski / Ecological Indicators 43 (2014) 143–153 147
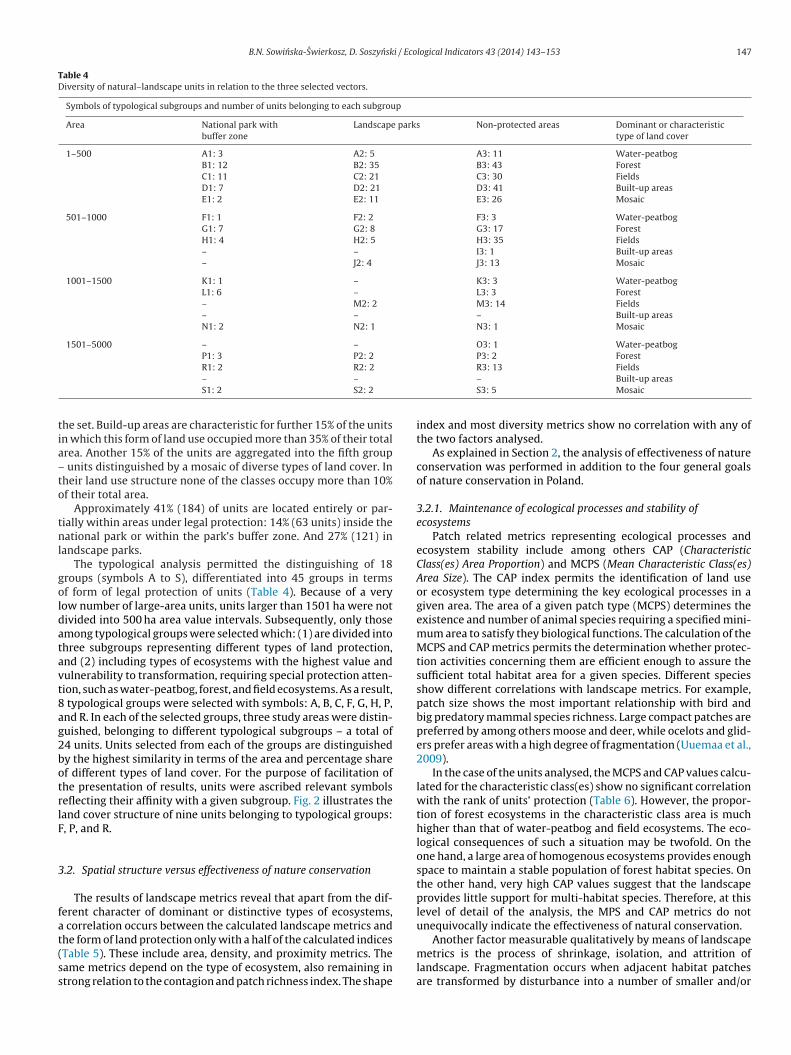
Table 4Diversity of natural–landscape units in relation to the three selected vectors.
Symbols of typological subgroups and number of units belonging to each subgroup
Area National park withbuffer zone
Landscape parks Non-protected areas Dominant or characteristictype of land cover
1–500 A1: 3 A2: 5 A3: 11 Water-peatbogB1: 12 B2: 35 B3: 43 ForestC1: 11 C2: 21 C3: 30 FieldsD1: 7 D2: 21 D3: 41 Built-up areasE1: 2 E2: 11 E3: 26 Mosaic
501–1000 F1: 1 F2: 2 F3: 3 Water-peatbogG1: 7 G2: 8 G3: 17 ForestH1: 4 H2: 5 H3: 35 Fields– – I3: 1 Built-up areas– J2: 4 J3: 13 Mosaic
1001–1500 K1: 1 – K3: 3 Water-peatbogL1: 6 – L3: 3 Forest– M2: 2 M3: 14 Fields– – – Built-up areasN1: 2 N2: 1 N3: 1 Mosaic
1501–5000 – – O3: 1 Water-peatbogP1: 3 P2: 2 P3: 2 Forest
tia–to
tnl
goldatavt8ag2botrlF
3
fat(ss
R1: 2 R2: 2
– –
S1: 2 S2: 2
he set. Build-up areas are characteristic for further 15% of the unitsn which this form of land use occupied more than 35% of their totalrea. Another 15% of the units are aggregated into the fifth group
units distinguished by a mosaic of diverse types of land cover. Inheir land use structure none of the classes occupy more than 10%f their total area.
Approximately 41% (184) of units are located entirely or par-ially within areas under legal protection: 14% (63 units) inside theational park or within the park’s buffer zone. And 27% (121) in
andscape parks.The typological analysis permitted the distinguishing of 18
roups (symbols A to S), differentiated into 45 groups in termsf form of legal protection of units (Table 4). Because of a veryow number of large-area units, units larger than 1501 ha were notivided into 500 ha area value intervals. Subsequently, only thosemong typological groups were selected which: (1) are divided intohree subgroups representing different types of land protection,nd (2) including types of ecosystems with the highest value andulnerability to transformation, requiring special protection atten-ion, such as water-peatbog, forest, and field ecosystems. As a result,
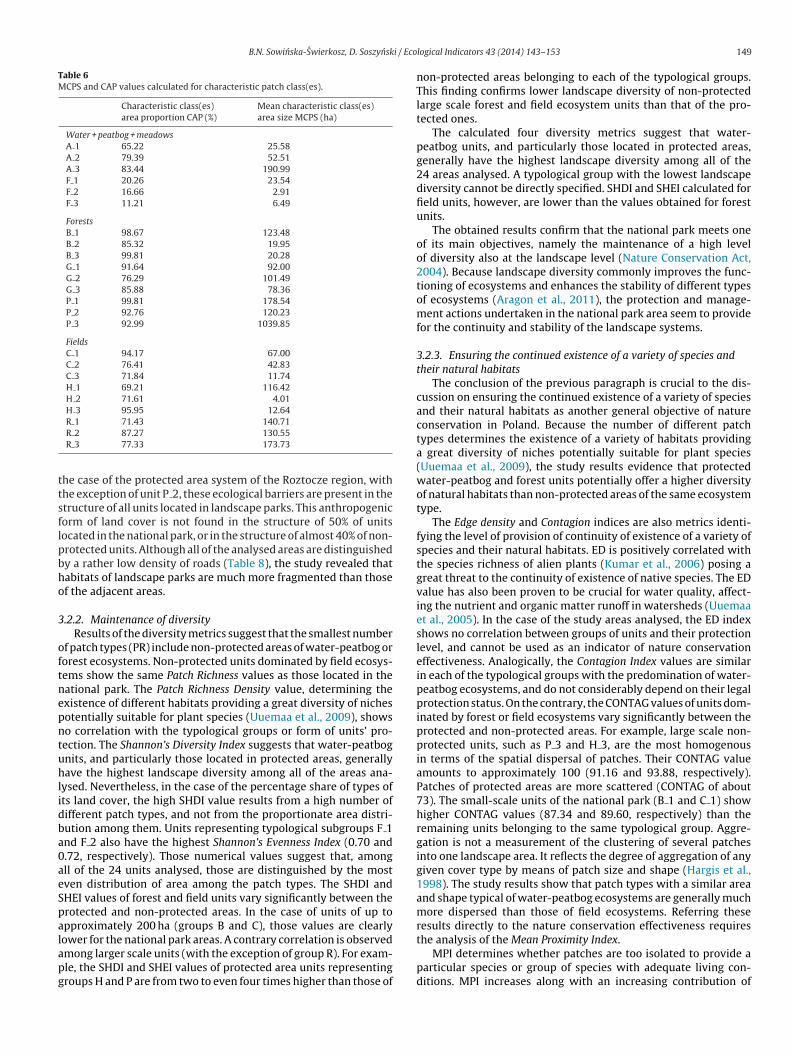
typological groups were selected with symbols: A, B, C, F, G, H, P,nd R. In each of the selected groups, three study areas were distin-uished, belonging to different typological subgroups – a total of4 units. Units selected from each of the groups are distinguishedy the highest similarity in terms of the area and percentage sharef different types of land cover. For the purpose of facilitation ofhe presentation of results, units were ascribed relevant symbolseflecting their affinity with a given subgroup. Fig. 2 illustrates theand cover structure of nine units belonging to typological groups:, P, and R.
.2. Spatial structure versus effectiveness of nature conservation
The results of landscape metrics reveal that apart from the dif-erent character of dominant or distinctive types of ecosystems,
correlation occurs between the calculated landscape metrics and
he form of land protection only with a half of the calculated indicesTable 5). These include area, density, and proximity metrics. Theame metrics depend on the type of ecosystem, also remaining introng relation to the contagion and patch richness index. The shapeR3: 13 Fields– Built-up areasS3: 5 Mosaic
index and most diversity metrics show no correlation with any ofthe two factors analysed.
As explained in Section 2, the analysis of effectiveness of natureconservation was performed in addition to the four general goalsof nature conservation in Poland.
3.2.1. Maintenance of ecological processes and stability ofecosystems
Patch related metrics representing ecological processes andecosystem stability include among others CAP (CharacteristicClass(es) Area Proportion) and MCPS (Mean Characteristic Class(es)Area Size). The CAP index permits the identification of land useor ecosystem type determining the key ecological processes in agiven area. The area of a given patch type (MCPS) determines theexistence and number of animal species requiring a specified mini-mum area to satisfy they biological functions. The calculation of theMCPS and CAP metrics permits the determination whether protec-tion activities concerning them are efficient enough to assure thesufficient total habitat area for a given species. Different speciesshow different correlations with landscape metrics. For example,patch size shows the most important relationship with bird andbig predatory mammal species richness. Large compact patches arepreferred by among others moose and deer, while ocelots and glid-ers prefer areas with a high degree of fragmentation (Uuemaa et al.,2009).
In the case of the units analysed, the MCPS and CAP values calcu-lated for the characteristic class(es) show no significant correlationwith the rank of units’ protection (Table 6). However, the propor-tion of forest ecosystems in the characteristic class area is muchhigher than that of water-peatbog and field ecosystems. The eco-logical consequences of such a situation may be twofold. On theone hand, a large area of homogenous ecosystems provides enoughspace to maintain a stable population of forest habitat species. Onthe other hand, very high CAP values suggest that the landscapeprovides little support for multi-habitat species. Therefore, at thislevel of detail of the analysis, the MPS and CAP metrics do notunequivocally indicate the effectiveness of natural conservation.
Another factor measurable qualitatively by means of landscapemetrics is the process of shrinkage, isolation, and attrition oflandscape. Fragmentation occurs when adjacent habitat patchesare transformed by disturbance into a number of smaller and/or

148 B.N. Sowinska-Swierkosz, D. Soszynski / Ecological Indicators 43 (2014) 143–153
elong
seaetAisat
TCa
Fig. 2. Land cover structure of units b
eparate patches. It can be indicated by among others the area anddge metrics (McGarigal and Marks, 1995). The Mean Patch Sizend Mean Total Edge indexes are substantially higher (in some unitsven double or triple) in units located in the national park than inhose located in landscape parks and non-protected areas (Table 7).nalogically, the Patch Density of units located in the national park
s much lower than that of non-protected units located in land-cape parks (with the exception of group C). The indexes mentionedbove correspond to the Number of Patches, which is considerablyhe lowest in the units covered by the national park, and the highest
able 5orrelations between the calculated landscape metrics and the following factors: type ofnd goodness-of-fit ( = 0.5).
Type of metrics Type of protectionDegrees of freedom: 14
�2 Correlation Cramer ind
MPS 55.55 + 0.19
NP 124.87 + 0.22
PD 95.68 + 0.42
MTE 1031.64 + 0.10
ED 202.14 + 0.21
SHAPE MN 0.55 − –
CONTAG 11.2 − –
PR 2.17 − –
PRD 0.43 − –
SHDI 1.75 − –
SHEI 0.91 − –
MPI 53,453.36 + 0.50
ing to typological groups: F, P, and R.
in the units covered by landscape parks. Habitat fragmentation pri-marily results in an increase in the number of small-size patches(Hargis et al., 1998). It is effectively quantified with the MTE, NP, andED metrics clearly indicating the fragmented spatial structure of ananalysed landscape park unit. The land-use structure of the nationalpark units is much more stable, and distinguished by a small num-
ber of large area patches. High NP and low MPS values regardinglandscape park units also emphasise landscape fragmentation.Another factor determining the level of landscape fragmenta-tion is the density of roads, and particularly hard surface roads. In
unit protection and type of ecosystem, based on Chi-square tests of independence
Type of ecosystemDegrees of freedom: 16
ex �2 Correlation Cramer index
177.03 + 0.34264.05 + 0.32
51.96 + 0.319556.22 + 0.31
340.60 + 0.276.08 − –
210.47 + –27.20 + –
1.65 − –5.05 − –2.28 − –
86,834.94 + 0.64
B.N. Sowinska-Swierkosz, D. Soszynski / Eco
Table 6MCPS and CAP values calculated for characteristic patch class(es).
Characteristic class(es)area proportion CAP (%)
Mean characteristic class(es)area size MCPS (ha)
Water + peatbog + meadowsA 1 65.22 25.58A 2 79.39 52.51A 3 83.44 190.99F 1 20.26 23.54F 2 16.66 2.91F 3 11.21 6.49
ForestsB 1 98.67 123.48B 2 85.32 19.95B 3 99.81 20.28G 1 91.64 92.00G 2 76.29 101.49G 3 85.88 78.36P 1 99.81 178.54P 2 92.76 120.23P 3 92.99 1039.85
FieldsC 1 94.17 67.00C 2 76.41 42.83C 3 71.84 11.74H 1 69.21 116.42H 2 71.61 4.01H 3 95.95 12.64
ttsflpbho
3
oftnepntuhlidba0aeSpalapg
R 1 71.43 140.71R 2 87.27 130.55R 3 77.33 173.73
he case of the protected area system of the Roztocze region, withhe exception of unit P 2, these ecological barriers are present in thetructure of all units located in landscape parks. This anthropogenicorm of land cover is not found in the structure of 50% of unitsocated in the national park, or in the structure of almost 40% of non-rotected units. Although all of the analysed areas are distinguishedy a rather low density of roads (Table 8), the study revealed thatabitats of landscape parks are much more fragmented than thosef the adjacent areas.
.2.2. Maintenance of diversityResults of the diversity metrics suggest that the smallest number
f patch types (PR) include non-protected areas of water-peatbog ororest ecosystems. Non-protected units dominated by field ecosys-ems show the same Patch Richness values as those located in theational park. The Patch Richness Density value, determining thexistence of different habitats providing a great diversity of nichesotentially suitable for plant species (Uuemaa et al., 2009), showso correlation with the typological groups or form of units’ pro-ection. The Shannon’s Diversity Index suggests that water-peatbognits, and particularly those located in protected areas, generallyave the highest landscape diversity among all of the areas ana-
ysed. Nevertheless, in the case of the percentage share of types ofts land cover, the high SHDI value results from a high number ofifferent patch types, and not from the proportionate area distri-ution among them. Units representing typological subgroups F 1nd F 2 also have the highest Shannon’s Evenness Index (0.70 and.72, respectively). Those numerical values suggest that, amongll of the 24 units analysed, those are distinguished by the mostven distribution of area among the patch types. The SHDI andHEI values of forest and field units vary significantly between therotected and non-protected areas. In the case of units of up topproximately 200 ha (groups B and C), those values are clearly
ower for the national park areas. A contrary correlation is observedmong larger scale units (with the exception of group R). For exam-le, the SHDI and SHEI values of protected area units representingroups H and P are from two to even four times higher than those oflogical Indicators 43 (2014) 143–153 149
non-protected areas belonging to each of the typological groups.This finding confirms lower landscape diversity of non-protectedlarge scale forest and field ecosystem units than that of the pro-tected ones.
The calculated four diversity metrics suggest that water-peatbog units, and particularly those located in protected areas,generally have the highest landscape diversity among all of the24 areas analysed. A typological group with the lowest landscapediversity cannot be directly specified. SHDI and SHEI calculated forfield units, however, are lower than the values obtained for forestunits.
The obtained results confirm that the national park meets oneof its main objectives, namely the maintenance of a high levelof diversity also at the landscape level (Nature Conservation Act,2004). Because landscape diversity commonly improves the func-tioning of ecosystems and enhances the stability of different typesof ecosystems (Aragon et al., 2011), the protection and manage-ment actions undertaken in the national park area seem to providefor the continuity and stability of the landscape systems.
3.2.3. Ensuring the continued existence of a variety of species andtheir natural habitats
The conclusion of the previous paragraph is crucial to the dis-cussion on ensuring the continued existence of a variety of speciesand their natural habitats as another general objective of natureconservation in Poland. Because the number of different patchtypes determines the existence of a variety of habitats providinga great diversity of niches potentially suitable for plant species(Uuemaa et al., 2009), the study results evidence that protectedwater-peatbog and forest units potentially offer a higher diversityof natural habitats than non-protected areas of the same ecosystemtype.
The Edge density and Contagion indices are also metrics identi-fying the level of provision of continuity of existence of a variety ofspecies and their natural habitats. ED is positively correlated withthe species richness of alien plants (Kumar et al., 2006) posing agreat threat to the continuity of existence of native species. The EDvalue has also been proven to be crucial for water quality, affect-ing the nutrient and organic matter runoff in watersheds (Uuemaaet al., 2005). In the case of the study areas analysed, the ED indexshows no correlation between groups of units and their protectionlevel, and cannot be used as an indicator of nature conservationeffectiveness. Analogically, the Contagion Index values are similarin each of the typological groups with the predomination of water-peatbog ecosystems, and do not considerably depend on their legalprotection status. On the contrary, the CONTAG values of units dom-inated by forest or field ecosystems vary significantly between theprotected and non-protected areas. For example, large scale non-protected units, such as P 3 and H 3, are the most homogenousin terms of the spatial dispersal of patches. Their CONTAG valueamounts to approximately 100 (91.16 and 93.88, respectively).Patches of protected areas are more scattered (CONTAG of about73). The small-scale units of the national park (B 1 and C 1) showhigher CONTAG values (87.34 and 89.60, respectively) than theremaining units belonging to the same typological group. Aggre-gation is not a measurement of the clustering of several patchesinto one landscape area. It reflects the degree of aggregation of anygiven cover type by means of patch size and shape (Hargis et al.,1998). The study results show that patch types with a similar areaand shape typical of water-peatbog ecosystems are generally muchmore dispersed than those of field ecosystems. Referring theseresults directly to the nature conservation effectiveness requires
the analysis of the Mean Proximity Index.MPI determines whether patches are too isolated to provide aparticular species or group of species with adequate living con-ditions. MPI increases along with an increasing contribution of

150 B.N. Sowinska-Swierkosz, D. Soszynski / Ecological Indicators 43 (2014) 143–153
Table 7Landscape metrics calculated for selected natural–landscape units.
pdtaooaauiweucs
TD
atches of the same type in the neighbourhood area, and decreasingistance and growing contiguity among such patches. Therefore,he proximity index measures both the degree of patch isolationnd the degree of fragmentation within a specified neighbourhoodf the patch analysed (McGarigal and Marks, 1995). In the casef the study units, MPI values vary considerably among the studyreas. The water-peatbog units of the national park have consider-bly higher MPI that other units of the type, and landscape parksnits have slightly higher MPI that non-protected units. Units dom-
nated by forest and field ecosystems show no strong correlationith MPI values. The analysis of all of the typological groups, how-
ver, reveals the highest MPI values in the case of landscape parksnits. Unit P 2 constitutes an exception, because here 4 out of 9lass types are represented by single patches. To sum up, MPI valueshow that in the case of water-peatbog units located in the national
able 8ensity of hard surface roads in selected natural–landscape units.
Unit location Density of hard surface roads (km/ha)
Water-peatbog ecosystems Forest ecosystems
National park A 1: 0.004 F 1: 0.001 B 1: 0 GLandscape parks A 2: 0.004 F 2: 0.005 B 2: 0.001 GNon-protected areas A 3: 0.008 F 3: 0.021 B 3: 0 G
park, and forest and fields units located in landscape parks, patchesof the same class are located closer to each other. This suggests thattheir spatial configuration provides favourable habitat conditionsproviding stepping stones for migrant bird species and corridors formovement of other species (Botequilha Leitao and Ahern, 2002). Itis of particular importance for the discussion on the conservationefforts regarding endangered species. They should be aimed at pro-viding a spatial structure distinguished by high proximity betweensubpopulations of the same species. The study results confirm theaccuracy of the protection actions for ensuring the continued exist-ence of a variety of species.
3.2.4. Protection of landscape valuesLandscape values are associated with aesthetic landscape val-
ues, such as naturalness and harmony. Among pattern metrics,
Field ecosystems
1: 0 P 1: 0 C 1: 0 H 1: 0.005 R 1: 0.003 2:0.002 P 2: 0 C 2: 0.006 H 2: 0.008 R 2: 0.006 3: 0.018 P 3: 0 C 3: 0 H 3: 0.006 R 3: 0.005

B.N. Sowinska-Swierkosz, D. Soszynski / Ecological Indicators 43 (2014) 143–153 151
Table 9Level of implementation of the general objectives of nature conservation at a three-stage scale.
General objectives of nature conservation National park Landscape parks Type of units
A. Maintenance of ecological processes and ecosystemstability (area, density, fragmentation metrics)
+++ + Water-peatbog+++ + Forest+++ + Fields
B. Maintenance of diversity (diversity metrics) +++ +++ Water-peatbog++ ++ Forest+ + Fields
C. Ensuring the continued existence of a variety of species and theirnatural habitats (proximity, diversity, density metrics)
+++ ++ Water-peatbog++ +++ Forest++ +++ Fields
sMcpigutci(s
SammFoabiep
3
tam(eefNtttosoatthte
l
D. Protection of landscape values (shape and diversitymetrics)
hape index have a crucial impact on those landscape features. Theean Shape Index values reflect the most irregular shape in the
ase of patches located in the national park units. The most com-act shape is observed for water-peatbog and forest units located
n landscape parks. Exceptions are units representing typologicalroups B and H. In the first case, this results from the fact thatnit B1 (SHAPE MN = 1.58) covers the economically used forest dis-inguished by sharp borders, whereas unit B2 (SHAPE MN = 2.05)overs a forest with peat-bog patches distinguished by natural,rregular shape. In the case of unit H2, very high shape index valuesSHAPE MN = 2.70) result from the high number of irregular andmall-sized patches of forest covering the loess ravines.
Square or almost square patches, represented by value “1” ofHAPE MN, are not found in the landscape structure of the areasnalysed. Because human-made structures are generally muchore compact and solid than natural types of land cover havingore irregular shape and softer boundaries (Chmielewski, 2012;
orman, 1995), the relatively high Mean Shape Index values for allf the selected units (mean = 2.8) indirectly suggest a low level ofnthropogenic transformation of the entire region analysed. Sceniceauty is also strongly correlated with the Shannon’s diversity
ndex (Franco et al., 2003). As discussed in subsection B, the high-st SDI values occur in the case of water-peatbog units located inrotected areas.
.2.5. Overall analysis of effectiveness of nature conservationThe general objectives of nature protection in Poland include
he maintenance of ecological processes and ecosystem stabilitynd diversity (Nature Conservation Act, 2004). The national parkeets those objectives, and landscape parks do so only partially
Table 9). The differences are observed in the case of the first gen-ral objective of nature conservation, namely the maintenance ofcological processes and ecosystem stability. The area, density, andragmentation metrics calculated for all types of units located in theational Park clearly show an appropriate level of nature conserva-
ion. The diversity metrics illustrate a more lenient policy regardinghe conversion of agricultural land to wetlands in the case of both ofhe types of protected areas. The level of implementation of anotherbjective, namely ensuring the continued existence of a variety ofpecies and their natural habitats, slightly differs among the typesf units and level of their protection, but is generally satisfactory,lthough slightly better in the case of landscape parks. In relation tohe discussion on the effectiveness of nature conservation in addi-ion to the protection of landscape values, the study results show aigh level of protection only in the case of water-peatbog ecosys-
ems of the national park, and a low level of protection of forestcosystems located in landscape parks.Considering the above, the national park units show the highestandscape diversity and stability of a variety of ecosystems. This
+++ ++ Water-peatbog++ + Forest++ ++ Fields
suggests high conservation efficiency. Landscape park unit are dis-tinguished by fragmented, patchy composition and unstable spatialstructure to an even higher degree than the non-protected areas.
4. Discussion
4.1. Landscape metrics as an indicator of efficient management
The application of landscape metrics as an indicator of efficientmanagement permits data presentation in numerical values. Suchdata are easier to analyse, compare, and monitor than qualitativemeasures. Metrics can be used to analyse efficiency at two levels ofland management. Landscape metrics can be applied in the case ofnature and landscape management for the purpose of evaluation ofthe efficiency of related actions undertaken in a given area. Based onnumerical data, changes in the spatial structure of protected areascan be analysed, and the effect of protective actions on the func-tioning of the environment can be verified (Khalyania et al., 2013).Moreover, landscape metrics permit the identification of trends anddisruptions not resulting from the management system or indepen-dent from it (natural processes). They are helpful in the estimationof the potential of landscapes to provide ecosystem services (Franket al., 2012). This allows for drawing conclusions on what was donewrong, what was done insufficiently, or what should be done. Forexample, the analysis of metrics describing the size and spatial con-figuration of patches is crucial to the determination of whethergiven habitat conditions provide stepping stones for migrant birdspecies and corridors for movement of other species. It also iden-tifies potential needs of planning and implementing actions aimedat improving the situation. Moreover, transformations of landscapestructure result in changes in the landscape functioning and viceversa. Numerical indices help to understand the dynamic interac-tions between the structure and function (Botequilha Leitao andAhern, 2002). There are many complex ecological consequences ofspatial arrangement of ecosystems, habitats, or communities reg-ulated by dynamics occurring simultaneously at different spatialscales (Ricotta, 2000). Metrics calculated at the patch, class, andlandscape level enable managers to define which level of environ-mental organisation requires improved management in order tomeet conservation goals.
At a higher level of management, national authorities coulduse landscape metrics as a tool for the verification of generalnature conservation policies. For example, a comparison of resultsof metrics obtained for protected and adjacent non-protected areascan lead to conclusions regarding national law regulations (prohibi-
tions, orders, guidelines, manners of management). The presentedexample of the Roztocze region shows that the current manage-ment of landscape parks is insufficient to retain the values oflandscape parks. Efficient nature conservation requires changes
1 i / Eco
irf
ceadcfLRsrhseioIitiktlbant(istbwtbi
aeedthta2
4
tfgtinccn(ttd
52 B.N. Sowinska-Swierkosz, D. Soszynsk
n the law, involving the introduction of accurately formulatedegulations, extension of the executive system, and consistent rein-orcement (Sommer, 2005).
Obtaining a full image of landscape structure requires the cal-ulation of a set of landscape metrics (Cushman et al., 2008; Pengt al., 2010). As suggested by the study results, not all of the metricsnalysed are good indicators of efficient management. Size andensity metrics such as MPS, MCPS, NP, MTE, and ED seem to berucial for the analysis. They clearly specify the level of landscaperagmentation, as also evidenced by previous studies (Botequilhaeitao and Ahern, 2002; Hargis et al., 1998; Sundell-Turner andodewald, 2008). In the analysis of the efficiency of nature con-ervation, however, MPS and CAP values should be interpreted ineference to the specific character of a given area. In some areas,igh values of those indices suggest high efficiency, because somepecies need a vast area to maintain a stable population. In oth-rs, a mosaic of varied ecosystems attracting multi-habitat speciess more favourable. Among the diversity metrics, the calculationf PR, PRD, and SHDI was sufficient to meet the study objective.t is important to remember, however, that high values of thosendices do not always suggest the proper state of landscape func-ioning. The type of numerically dominant classes is important,.e. whether they are natural or semi-natural forms, or differentinds of build up areas. The SHAPE index seems not to be sufficiento accurately analyse the efficiency of protection of physiognomicandscape values. A numerical description of patch shapes cannote used directly to evaluate the naturalness and harmony of a givenrea. This requires more analyses outside of the scope of GIS tech-iques. The SHAPE index, however, is helpful in analyses aiming athe description of landscape physiognomy from the bird’s eye viewFrank et al., 2012). In reference to the usefulness of the CONTAGndex, it is crucial that its value is strongly correlated with the unitize. Therefore, when analysed separately, it is not a good indica-or of nature protection efficiency. To serve this function, it shoulde calculated together with other proximity indices, such as MPI, asas done in the study. The study results are partially coherent with
he research by Botequilha Leitao and Ahern (2002), where nineasic metrics for suitable landscape planning were determined,
ncluding PR, CAP, PD, SHAPE MN, MPI, and CONTAG.The study results show that relatively easily and widely avail-
ble landscape metrics can be a useful tool of conservationfficiency analysis at the landscape level. The study particularlyvidenced the usefulness of application of diversity metrics for theetermination of the degree of meeting nature conservation objec-ives, and the application of area and shape metrics for measuringuman interference in the landscape. The choice and interpreta-ion of indices, however, must depend on the specific character of
given area (Cushman et al., 2008; Frank et al., 2012; Peng et al.,010).
.2. Limitations
The primary limitation of using landscape indicators to assesshe effectiveness of management of nature protection areas derivesrom the fact that different forms of nature conservation have otheroals as well as the same kinds of nature conservation areas pro-ects other kind of natural resources. Comparing most of landscapendicators for mountain parks, sea parks or typical forest parks doesot make sense. That is why the analysed units were divided intoategories reflecting their dominant or characteristic type of landover and the level of implementation of the general objectives ofature conservation was specify in the relation to those categories
see Table 8). Moreover, the analysis was performed in addition tohe four general goals of nature conservation in Poland, which arehe same for the national parks and landscape parks. Such approachoes not give answer if a particular kind of natural resource islogical Indicators 43 (2014) 143–153
protect it the proper way but allowed to indicate the general levelof nature conservation effectiveness. However, such approach donot eliminate all the problems connected to the discuss issue.
The second limitation of the adopted approach is the vari-ability of the spatial composition of natural–landscape units notonly across different subgroups, but also within them. Therefore,our primary intention was to reduce to a minimum the effectof independent fluctuations between units on the overall results.This involved the analysis of units with similarly high landscapeheterogeneity expressed in: the unit’s area, character of abioticcomponents, percentage share of different types of land cover, pres-ence/lack of build-up areas, and presence/lack of wetlands. Suchan approach permitted the reduction of the effect of those fea-tures on the manner of response of landscape units to changingenvironmental conditions (Adler et al., 2001; Aragon et al., 2011).As a consequence, it can be generally assumed that the selectedstudy areas reflect the structure of the majority of units belongingto each of the typological subgroups (Chmielewski and Sowinska,2010). This assumption could be verified by conducting the analy-sis for a higher number of study areas. Nonetheless, the importanceof the study lies in the fact that it is the first one to apply thespatial structure of spatial units as an indicator of nature conserva-tion effectiveness in Poland at the landscape level. The study alsoprovides a new insight into the relationships between landscapestructure and legal forms of its protection, as well as informationuseful for the improvement of management practices in the Roz-tocze region.
Finally, it is needed to emphasise that spatial patch compositionis an effect of a number of interrelated and time-shifted factorsnot necessarily resulting from the management system (Colsonet al., 2011). Some of those important factors, such as historicalconditions or land ownership structure, were not taken into con-sideration in the conducted study. Moreover, the spatial structureof a particular unit does not exclusively result from actions refer-ring to that area. It is also a derivative of changes occurring in thesurrounding countryside (Brody et al., 2003; Khalyania et al., 2013;Papageorgiou and Vogiatzakis, 2006). The author is aware of thefact that the multitude and spatial arrangement of the impact fac-tors poses a major challenge to the development of the methodpresented herein.
References
Adler, P.B., Raff, D.A., Lauenroth, W.K., 2001. The effect of grazing on the spatialheterogeneity of vegetation. Oecologia 128, 465–479.
Aragon, R., Oesterheld, M., Irisarri, G., Texeira, M., 2011. Stability of ecosystem func-tioning and diversity of grasslands at the landscape scale. Landsc. Ecol. 26,1011–1022.
Arnot, C., Fisher, P.F., Wadsworth, R., Wellens, J., 2004. Landscape metrics with eco-tones: pattern under uncertainty. Landsc. Ecol. 19, 181–195.
Beatley, T., 2000. Preserving biodiversity: challenges for planning. Am. Plan. Assoc.J. 66, 5–20.
Brody, S.D., Carrasco, V., Highfield, W., 2003. Evaluating ecosystem managementcapabilities at the local level in Florida: identification policy gaps using geo-graphic information systems. Environ. Manage. 32, 661–681.
Botequilha Leitao, A., Ahern, J., 2002. Applying landscape ecological concepts andmetrics in sustainable landscape planning. Landsc. Plan. 59, 65–93.
Chmielewski, T.J., Solon, J., 1996. Basic natural spatial units of the KampinoskiNational Park: rules of delineation and ways of protection (in Polish). ProblemsLandsc. Ecol. 2, 130–142.
Chmielewski, T.J., Iwanicka, K., 2004. Typological analysis of Natura 2000 sites andmethodological problems of management of the natural resources (in Polish). In:Chmielewski, T.J. (Ed.), The problems of management and functioning of Natura2000 habitat sites in Poland. Polish Academy of Science, Man and EnvironmentalCommittee, Warsaw, Lublin, pp. 91–108.
Chmielewski, T.J., Sowinska, B., 2010. The method of landscape quality objectiveidentification. Arch. Comm. Protect. Formation Nat. Environ. 6, 16–34.
Chmielewski, T.J., 2012. Landscape Systems: Structure-Functioning-Planning (inPolish). PWN Press, Warsaw, pp. 1–408.
Colson, F., Bogaert, J., Ceulemans, R., 2011. Fragmentation in the Legal Amazon,Brazil: can landscape metrics indicate agricultural policy differences? Ecol. Indic.11, 1467–1471.
i / Eco
C
C
E
F
F
F
F
H
H
H
H
H
H
J
K
K
K
K
L
L
L
L
M
M
M
B.N. Sowinska-Swierkosz, D. Soszynsk
oppin, P., Jonckhere, I., Nackarts, K., Muys, B., 2004. Digital change detec-tion methods in ecosystem monitoring: a review. Int. J. Remote Sens. 25,1565–1596.
ushman, S.A., McGarigal, K., Neel, M.C., 2008. Parsimony in landscape metrics:strength, universality, and consistency. Ecol. Indic. 8 (5), 691–703.
gbert, S.L., Park, S., Price, K.P., Lee, R., Wu, J., Nellis, D., 2002. Using conservationreserve program maps derived from satellite imagery to characterize landscapestructure. Comput. Electron. Agric. 37, 141–156.
erguson, B.K., 1996. The maintenance of landscape health in the midst of land usechange. J. Environ. Manage. 48, 387–395.
orman, R., 1995. Land Mosaics: The Ecology of Landscapes and Regions. CambridgeUniversity Press, New York.
ranco, D., Franco, D., Mannino, I., Zanetto, G., 2003. The impact of agroforestrynetworks on scenic beauty estimation: the role of a landscape ecological net-work on a socio-cultural process. Landsc. Urban Plan. 62 (3), 119–138.
rank, S., Fürst, Ch., Koschke, L., Makeschin, F., 2012. A contribution towards a trans-fer of the ecosystem services concept to landscape planning using landscapemetrics. Ecol. Indic. 21, 30–38.
argis, Ch.D., Bissonette, J.A., David, J.L., 1998. The behaviour of landscape metricscommonly used in the study of habitat fragmentation. Landsc. Ecol. 13,167–186.
assett, E.M., Stehman, S.V., Wickham, J.D., 2012. Estimating landscape patternmetrics from a sample of land cover. Landsc. Ecol. 27, 133–149.
e, W.J., Cui, B.S., Hua, Y.Y., Fan, X.Y., 2012. Assessment of management effectivenessfor the National Nature Reserve in the Yellow River Delta. Proc. Environ. Sci. 13,362–2373.
ess, G.R., Koch, F.H., Rubino, M.J., Eschelbach, K.A., Drew, C.A., Favreau, J.M., 2006.Comparing the potential effectiveness of conservation planning approaches incentral North Carolina, USA. Biol. Conserv. 128, 358–368.
ockings, M., 2000. Evaluating Nature Reserve Management: A Review of System forAssessing Management Effectiveness of Nature Reserves. University of Queens-land, School of Natural and Rural System Management, Lawes, Australia.
ockings, M., Stolton, S., Dudley, N., 2002. Evaluating Effectiveness. A Summary forPark Managers and Policy Makers. WWF and IUCN, Switzerland.
ones, M., Stenseke, M., 2011. The issue of public participation in the EuropeanLandscape Convention. Landsc. Series 13, 1–23.
asprzyk, M., Kupper, D., Kiejzik-Głowinska, M., Machinska, H., Pchałek, M., Roggen-buck, A., Serwecinska, D., Struminska, M., Trojanowska, K., Wisniewska, M.,2007. The Quality of Public Participation in Poland: National Practice and LawConditionings (in Polish). WWF Poland, Warsaw, pp. 1–115.
halyania, A.H., Mayer, A.L., Webster, Ch.R., Falkowski, M.J., 2013. Ecological indica-tors for protection impact assessment at two scales in the Bozin and Marakhilprotected area. Iran. Ecol. Indic. 25, 99–107.
istowski, M., 2004. The influence of landscape parks’ management model on effec-tiveness of nature and landscape protection (in Polish). In: Michalczyk, Z. (Ed.),Geographic Researches in Environment Recognition. University of Maria Curie-Sklodowska Press, Lublin, pp. 61–67.
umar, S., Stohlgren, T.J., Chong, G.W., 2006. Spatial heterogeneity influences nativeand nonnative plant species richness. Ecology 87 (12), 3186–3199.
ausch, A., Herzog, F., 2002. Applicability of landscape metrics for the monitoring oflandscape change: issues of scale, resolution and interpretability. Ecol. Indic. 2,3–15.
enz, R.J.M., Stary, R., 1995. Landscape diversity and land use planning: a case inBavaria. Landsc. Urban Plan. 31, 387–398.
iu, Y., Soichi, N., Kusaka, T., 2003. Examining landscape dynamics at a watershedscale using LandsatTM Imagery for detection of wintering hooded crane declinein Yashiro, Japan. Environ. Manage. 31, 365–376.
ombard, A.T., Cowling, R.M., Pressey, R.L., Rebelo, A.G., 2003. Effectiveness of landclasses as surrogates for species in conservation planning for the Cape FloristicRegion. Biol. Conserv. 112, 45–62.
ajchrowska, A., 2011. The Implementation of European Landscape Conven-tion in Poland. In: Jones, M., Stenseke, M. (Eds.), The European LandscapeConvention: Challenges of Participation. Landscape Series, vol. 13, pp. 81–98.
argules, C.R., Pressey, R.L., 2000. Systematic conservation planning. Nature 405,
243–253.cGarigal, K., Marks, B.J., 1995. FRAGSTATS Spatial Pattern Analysis Pro-gram for Quantifying Landscape Structure Version 2. Forest ScienceDepartment, Oregon States University, pp. 1–134, http://www.umass.edu/landeco/research/fragstats/fragstats.html
logical Indicators 43 (2014) 143–153 153
McGarigal, K., Cushman, S.A., Ene, E., 2002. FRAGSTATS v3: Spatial PatternAnalysis Program for Categorical and Continuous Maps, Computer software pro-gram produced by the authors at the University of Massachusetts, Amherst.http://www.umass.edu/landeco/research/fragstats/fragstats.html
Moser, B.C., Jaeger, J.A.G., Tappeiner, U., Tasser, E., Eiselt, B., 2007. Modification ofthe effective mesh size for measuring landscape fragmentation to solve theboundary problem. Landsc. Ecol. 22, 447–459.
Nature Conservation Act 2004. 16 April 2004, Journal of Laws 2004 No. 292 Pos. 880.Noss, R., Scott, M., 1997. Ecosystem protection and restoration: the core of ecosystem
management. In: Boyce, M., Hanley, A. (Eds.), Ecosystem Management: Applica-tion for Sustainable Forest and Wildlife Resources. Yale University Press, NewHaven, pp. 239–264.
Papageorgiou, K., Vogiatzakis, I.N., 2006. Nature protection in Greece: an appraisal ofthe factors shaping integrative conservation and policy effectiveness. Environ.Sci. Policy 9, 476–486.
Pchałek, M., Kupczyk, P., Matyjasiak, P., Juchnik, A., 2011. Effectiveness of Protectionof Ecological Corridors. Concept of Legislative Changes (in Polish). WWF Polska,Warszawa, pp. 1–155.
Peng, J., Wang, Y., Zhang, Y., Wu, J., Li, W., Li, Y., 2010. Evaluating the effectiveness oflandscape metrics in quantifying spatial patterns. Ecol. Indic. 10 (2), 217–223.
Quan, J., Ouyang, Z.Y., Xu, W.H., Miao, H., 2010. Comparison and applications ofmethodologies for management effectiveness assessment of nature reserves.Biodivers. Sci. 18, 90–99.
Ricotta, C., 2000. From theoretical ecology to statistical physics and back: self-similarlandscape metrics as a synthesis of ecological diversity and geometrical com-plexity. Ecol. Model. 125, 245–253.
Ritters, K.H., O’Nell, R.V., Hunsaker, C.T., Wickham, J.D., Yankee, D.H., Timmins, S.P.,Jones, K.B., Jackson, B.L., 1995. A factor analysis of landscape pattern and struc-ture metrics. Landsc. Ecol. 10, 23–39.
Roe, E., Van Eeten, M., 2001. Threshold-based resource management: a frameworkfor comprehensive ecosystem management. Environ. Manage. 27, 195–214.
Saveraid, E.H., Debinski, D.M., Kindscher, K., Jakubauskas, M.E., 2001. A comparisonof satellite data and landscape variables in predicting bird species occurrencesin the Greater Yellowstone Ecosystem, USA. Landsc. Ecol. 16, 71–83.
Shijo, J., Blackburn, G.A., Biswadip, G., Sudhakar, S., Thomas, A.P., Murthy, M.S.R.,2009. Monitoring conservation effectiveness in a global biodiversity hotspot:the contribution of land cover change assessment. Environ. Monit. Assess. 158,169–217.
Sommer, J., 2005. The Efficiency of Nature Protection Law – Problems of the StructureAdroitness (in Polish). In: Wrocław. Environmental Protection Law, pp. 1–299.
Sowinska, B., Chmielewski, T.J., 2008. The method of delimitation and typologi-cal diversity of natural–landscape units of Roztocze and Biłgoraj plain regions.Problems Landsc. Ecol. 22, 93–108.
Sowinska, B., Chmielewski, T.J., 2011. Research on historical agriculture landscapefor the design and management of a biosphere reserve. Ekológia (Bratislava)302, 133–140.
Sowinska, B., Chmielewski, T.J., 2012. Local landscapes: delineation, diagnosis,design guidelines. Problems Landsc. Ecol. 33, 277–290.
Sundell-Turner, N.M., Rodewald, A.D., 2008. A comparison of landscape metrics forconservation planning. Landsc. Urban Plan. 86, 219–225.
Syrbe, R.-U., Walz, U., 2012. Spatial indicators for the assessment of ecosystem ser-vices: providing, benefiting and connecting areas and landscape metrics. Ecol.Indic. 21, 80–88.
Trakolis, D., Platis, M., Meliadis, I., 2000. Biodiversity and conservation actions onMount Voras, Greece. Environ. Manage. 26, 145–151.
Troyer, M., 2002. A spatial approach for integrating and analyzing indicators ofecological and human condition. Ecol. Indic. 2, 211–220.
Uuemaa, E., Roosaare, J., Mander, U., 2005. Scale dependence of landscape metricsand their indicatory value for nutrient and organic matter losses from catch-ments. Ecol. Indic. 5, 350–369.
Uuemaa, E., Antrop, M., Roosaare, J., Marja, R., Mander, U., 2009. Landscape metricsand indices: an overview of their use in landscape research. Living Rev. Landsc.Res., 3.
Wiersma, Y.F., Nudds, T.D., Rivard, D.H., 2004. Models to distinguish effects of land-scape patterns and human population pressures associated with species loss in
Canadian national parks. Landsc. Ecol. 19, 773–786.Wu, J., Shen, W., Sun, W., Tueller, P.T., 2002. Empirical patterns of the effects ofchanging scale on landscape metrics. Landsc. Ecol. 17, 761–782.
Yeha, Ch.T., Huang, S.L., 2009. Investigating spatiotemporal patterns of landscapediversity in response to urbanization. Landsc. Urban Plan. 93, 151–162.