Embed Size (px)
Citation preview

Seediscussions,stats,andauthorprofilesforthispublicationat:https://www.researchgate.net/publication/310815630
Landscape-gradientassessmentofthermokarstlakehydrologyusingwaterisotopetracers
Article·November2016
DOI:10.1016/j.jhydrol.2016.11.028
CITATIONS
0
5authors,including:
Someoftheauthorsofthispublicationarealsoworkingontheserelatedprojects:
LacSt-Charles,QuébecViewproject
BiljanaNarancic
LavalUniversity
11PUBLICATIONS6CITATIONS
SEEPROFILE
AllcontentfollowingthispagewasuploadedbyBiljanaNarancicon26November2016.
Theuserhasrequestedenhancementofthedownloadedfile.Allin-textreferencesunderlinedinbluearelinkedtopublicationsonResearchGate,lettingyouaccessandreadthemimmediately.

Accepted Manuscript
Research papers
Landscape-gradient assessment of thermokarst lake hydrology using water iso-
tope tracers
Biljana Narancic, Brent B. Wolfe, Reinhard Pienitz, Hanno Meyer, Daniel
Lamhonwah
PII: S0022-1694(16)30734-X
DOI: http://dx.doi.org/10.1016/j.jhydrol.2016.11.028
Reference: HYDROL 21642
To appear in: Journal of Hydrology
Received Date: 19 May 2016
Revised Date: 11 November 2016
Accepted Date: 14 November 2016
Please cite this article as: Narancic, B., Wolfe, B.B., Pienitz, R., Meyer, H., Lamhonwah, D., Landscape-gradient
assessment of thermokarst lake hydrology using water isotope tracers, Journal of Hydrology (2016), doi: http://
dx.doi.org/10.1016/j.jhydrol.2016.11.028
This is a PDF file of an unedited manuscript that has been accepted for publication. As a service to our customers
we are providing this early version of the manuscript. The manuscript will undergo copyediting, typesetting, and
review of the resulting proof before it is published in its final form. Please note that during the production process
errors may be discovered which could affect the content, and all legal disclaimers that apply to the journal pertain.

1
Landscape-gradient assessment of thermokarst lake hydrology using water isotope
tracers
Biljana Narancic1, Brent B. Wolfe2, Reinhard Pienitz1
Hanno Meyer3 and Daniel Lamhonwah4
1Laboratoire de paléoécologie aquatique, Centre d’études nordiques, Département de
géographie, Université Laval, QC, G1V 0A6, Canada
2Department of Geography and Environmental Studies, Wilfrid Laurier University, Waterloo, ON,
N2L 3C5, Canada
3Alfred Wegener Institute (AWI) Helmholtz Centre for Polar and Marine Research, Research
Unit Potsdam, 14473 Potsdam, Germany
4Department of Geography and Planning, Queen’s University, Kingston, ON, K7L 3N6, Canada

2
HIGHLIGHTS:
- Water isotopes are used to characterize thermokarst lake hydrology in Nunavik,
Canada.
- Rainfall and/or permafrost meltwater are the main lake water sources.
- Maritime climate enhances the hydrological resiliency of thermokarst lakes.
- Terrestrial carbon inputs from surface runoff are likely to increase in the future.
- Thermokarst lakes will persist and methane emissions are likely to increase.

3
ABSTRACT
Thermokarst lakes are widespread in arctic and subarctic regions. In subarctic
Québec (Nunavik), they have grown in number and size since the mid-20th century.
Recent studies have identified that these lakes are important sources of greenhouse
gases. This is mainly due to the supply of catchment-derived dissolved organic carbon
that generates anoxic conditions leading to methane production. To assess the potential
role of climate-driven changes in hydrological processes to influence greenhouse-gas
emissions, we utilized water isotope tracers to characterize the water balance of
thermokarst lakes in Nunavik during three consecutive mid- to late summer seasons
(2012-2014). Lake distribution stretches from shrub-tundra overlying discontinuous
permafrost in the north to spruce-lichen woodland with sporadic permafrost in the south.
Calculation of lake-specific input water isotope compositions (I) and lake-specific
evaporation-to-inflow (E/I) ratios based on an isotope-mass balance model reveal a
narrow hydrological gradient regardless of diversity in regional landscape
characteristics. Nearly all lakes sampled were predominantly fed by rainfall and/or
permafrost meltwater, which suppressed the effects of evaporative loss. Only a few
lakes in one of the southern sampling locations, which overly highly degraded sporadic
permafrost terrain, appear to be susceptible to evaporative lake-level drawdown. We
attribute this lake hydrological resiliency to the strong maritime climate in coastal regions
of Nunavik. Predicted climate-driven increases in precipitation and permafrost
degradation will likely contribute to persistence and expansion of thermokarst lakes
throughout the region. If coupled with an increase in terrestrial carbon inputs to
thermokarst lakes from surface runoff, conditions favorable for mineralization and
4
emission of methane, these water bodies may become even more important sources of
greenhouse gases.
Keywords: Nunavik; thermokarst lakes; water isotope tracers; permafrost; water
balance; maritime climate
1. INTRODUCTION
Numerous shallow thermokarst or ‘thaw’ lakes develop as a result of rapid
permafrost degradation throughout the Arctic and subarctic regions of northern North
America (Allard and Séguin, 1987; Payette et al., 2004; Bouchard et al., 2013) and
Eurasia (Agafonov et al., 2004). The prerequisite for their formation is the presence and
thaw of ground ice. When the depth of seasonal thawing (active layer) exceeds the
depth at which ice-rich permafrost occurs, thawing of the perennial frozen layers
(permafrost) begins followed by local ground subsidence and water collects in a
depression (Pienitz et al., 2008). The latent heat of the water body may further thaw the
underlying ground ice, leading to subsidence and deepening of the lake basin.
Permafrost landscapes cover more than 50 % of Canada including 30 % of
subarctic Québec (Nunavik; Bouchard et al., 2011). Rapid degradation of permafrost
since the mid-20th century along the eastern coast of Hudson Bay has contributed to an
increase in the number of shallow thermokarst lakes (Payette et al., 2004). Thermokarst
lakes constitute an important landscape feature and recent studies have documented
the global implications of these aquatic ecosystems as a potential source of greenhouse
gases, especially methane (Laurion et al., 2010; Comte et al., 2015; Crevecoeur et al.,
2015; Deshpande et al., 2015; Przytulska et al., 2015). They are rich in dissolved

5
organic carbon (DOC), most of which originates from thawing permafrost. Laurion et al.
(2010) found that some lakes demonstrate strong thermal stratification due to high DOC
concentrations. As a result, most of the lakes have anoxic bottom waters despite their
shallow depth (< 5 m). This chemical gradient of oxygen, with an upper oxic and bottom
anoxic layer, represents an ideal environment for anaerobic processes such as methane
production (Laurion et al., 2010; Deshpande et al., 2015; Matveev et al., 2016). During
water column mixing, methane is released to the atmosphere. Consequently,
thermokarst lakes (and their influence on atmospheric methane concentrations) are
expected to play a major role in future climate change (Wik et al., 2016).
Based on the Canadian Regional Climate Model (CRCM), Nunavik is expected to
experience 3 °C warming in winter air temperature and 1.5 °C warming in summer air
temperature, along with a 25 % increase in total annual precipitation by 2050 (Brown et
al., 2012). Changes in temperature and precipitation, combined with permafrost thaw,
may increase soil-derived DOC supply via runoff and enhanced hydrological
connectivity, possibly further promoting stratification and greenhouse-gas production in
thermokarst lakes. Hydrological changes induced by climate change might have
additional influence on limnological properties and biogeochemical cycling of these
lakes, yet little is known about the hydrological processes that influence thermokarst
lake water balance conditions in this region. Recent isotope-based studies from the
western Hudson Bay Lowlands (Wolfe et al., 2011, Bouchard et al., 2013), Old Crow
Flats (Tondu et al., 2013; Turner et al., 2010, 2014), Yukon Flats (Anderson et al., 2013)
and northern Alberta (Gibson et al., 2015, 2016a) concluded that shallow thermokarst
lakes are hydrologically dynamic systems yielding a great diversity of lake water balance
6
conditions, variably influenced by hydrological processes (snowmelt, rainfall, permafrost
meltwater, evaporation) and catchment features (vegetation, topography; Table 1). The
stable isotope mass balance approach has also been used to characterize the influence
of hydrological processes on non-thermokarst northern lakes (Gibson and Reid, 2014;
Gibson et al., 2015; Gibson et al., 2016b) and on lakes elsewhere (Steinman et al.,
2013; Jones et al., 2016).
<Table 1 here please>
In this study, our aim is to identify and quantify the diversity of hydrological
processes that control thermokarst lake water balances in Nunavik. Our approach was
to sample lakes with different physical characteristics (color, depth, size, catchment
vegetation) across vast landscape gradients from subarctic to arctic environments
during a three-year sampling campaign (2012-2014) to capture the range of hydrological
conditions. The main objectives of the study were to apply an isotope-mass balance
model to: 1) determine lake-specific input water isotope compositions (I) to identify the
roles of primary source waters (e.g., rainfall, snowmelt and permafrost meltwater); and
2) calculate lake-specific evaporation-to-inflow (E/I) ratios to evaluate the influence of
vapor loss. Results obtained provide the basis to anticipate hydrological responses and
their influence on greenhouse gas behavior of thermokarst lakes to rapidly changing
climate at the regional scale.
2. STUDY REGION
The study region is located on the eastern coast of Hudson Bay, Canada, and
7
comprises four distinctive sites (Fig. 1). The two northern sites are located near the
Umiujaq village: Nastapoka River valley (NAS; 56°55.423'N, 76°22.750'W) and
Sheldrake River valley (BGR; 56°36.652' N, 76°12.912' W). Two southern sites are
located near the village of Whapmagoostui-Kuujjuarapik (W-K): Kwakwabtanikapistikw
River valley (KWK; 55°19.853’ N, 77°30.166’ W) and Sasapimakwananisikw River valley
(SAS; 55°13.228', N 77°42.444' W). The bedrock geology of the area includes
Precambrian granites and gneisses overlain by Quaternary glacial, glaciofluvial and
marine deposits. The region was submerged by the postglacial Tyrrell Sea until ca. 6000
cal. BP following the last regional deglaciation ca. 8000 cal. BP (Pienitz et al., 1991;
Saulnier-Talbot et al., 2007) that left thick deposits of marine silts and clays in valleys.
These poorly-drained valley floors covered with marine clay induced the development of
wetlands with peat plateaus supporting trees and shrubs (ca. 5000 cal. BP). Climate
cooling during the Neoglacial period (~3200 BP) led to a decrease in peat accumulation
and drying of the soil surface due to growth of ground ice (Allard and K.-Seguin, 1987).
During the cold and dry climate of the Little Ice Age, permafrost reached its maximum
extent (~500 BP; Allard and K.-Séguin, 1987; Calmels et al., 2008). Presence of
permafrost is easily assessed in this landscape as it forms mounds of organic-rich
palsas and mineral lithalsas that coexist within a few tens of meters of each other.
Climate warming during recent decades has led to increasingly rapid thawing of
permafrost mounds and transformation of the landscape into a mosaic of colorful
shallow thermokarst lakes (Payette et al., 2004; Fig. 2). The color variability originates
from permafrost thaw in surrounding soils and ranges from white to green in lakes with
high concentrations of suspended fine clay particles, to brown and black in lakes rich in
DOC (Laurion et al., 2010; Comte et al., 2015; Crevecoeur et al., 2015; Przytulska et al.,

8
2015).
<Figure 1 and 2 here please>
The study lakes are distributed along a north–south latitudinal, vegetation and
permafrost gradient (Fig.1 and 2). Lakes in the northern sites, NAS and BGR, are
situated in the transitional boreal/arctic tundra zone dominated by shrub tundra
vegetation and scattered forest overlying discontinuous permafrost and marine silts of
low permeability. The arctic tundra zone has almost no trees; sheltered locations contain
mainly Betula glandulosa shrubs. The dominant vegetation in the boreal-subarctic zone
includes spruce trees (Picea mariana, P. glauca), tall shrubs (Betula glandulosa, Salix
planifolia), mosses (Sphagnum spp.) and herbaceous plants (Carex spp). At the time of
field work, sampled lakes at BGR where distinctly colored and unlikely to have been
influenced recently by the nearby river (Fig. 2). The southern KWK and SAS are situated
in the boreal-subarctic zone within spruce-lichen woodland overlying sporadic
permafrost. Lakes at KWK are located on postglacial marine clay soils of low
permeability covered with dense forest and shrub vegetation where local permafrost is
at an advanced stage of degradation (Bouchard et al., 2011). The elevation of the lakes
at KWK are well above the nearby creek shown in Figure 2. Lakes at SAS are located in
peatlands within rapidly degrading permafrost mounds (Bhiry and Robert, 2006). The
landscape is relatively flat at SAS and BGR, whereas slight topographic relief exists at
NAS and KWK sites owing to rocky hills and steep trenches. Low permeability of fine-
grained substrate, presence of permafrost and generally low relief likely restrict
hydrological surface and subsurface connectivity between lakes.

9
The climate is influenced by the proximity of Hudson Bay. The farthest inland site
(BGR) is located approximately 20 km from Hudson Bay. Once the bay freezes, the
climate becomes dry continental with low temperatures (Dec-Feb = -19.5 °C mean) and
when ice retreats, maritime conditions with frequent dense fogs occur in the summer
(Jun-Aug = 9.5 °C mean). Mean annual temperature and total precipitation for the three-
year sampling period were above the 55-year regional long-term means (Table 2). There
were some seasonal differences with more rainfall in 2014 than during the previous two
years whereas snowfall was less than the long-term mean during 2012 and similar to the
2013 and 2014 means. The summer relative humidity for 2012-2014 ranged from 77.2
% to 80.4 %, close to the 55-year regional mean (80 %; Environment Canada, 2015)
< Table 2 here please >.
3. MATERIALS AND METHODS
3.1. Field sampling and analysis
To address the objectives, water samples were collected from precipitation,
permafrost cores and lakes. As the Global Network of Isotopes in Precipitation (GNIP)
has no station in the Nunavik region, there was a need for year-round precipitation
sampling for isotope analysis which was performed at the Centre for Northern Studies
(CEN) station in W-K. In total, forty precipitation samples were collected from September
2013 to August 2014 on a per precipitation-event. Rainwater was collected in a plastic
pan attached to a laundry line until enough was gathered to fill a 30-ml high-density
polyethylene bottle. This took less than 6 hours. Snow samples were collected in Ziploc
bags shortly after it fell and once completely melted, the meltwater was transferred to
30-ml high-density polyethylene bottles. Precipitation samples were analyzed for oxygen

10
and hydrogen isotope composition at the Alfred-Wegener Institute for Polar and Marine
Research in Potsdam (Germany) following the methods outlined in Meyer et al. (2000).
Four permafrost cores (BGR-A [2.4 m], BGR-B [2.3 m], SAS-A [2.3 m] and SAS-B
[2.4 m] obtained in August 2013 were sectioned (~10 cm long segments) in the freezer
room (-15 to -13 °C) at CEN (Université Laval) using a mitre saw. Cores were split in two
using an ice chisel, and subsamples were taken from the interior of each core. A razor
was used to remove the exterior of each subsample (~5 mm) to prevent contamination.
In total, six ice samples from cores BGR-A and SAS-B, eight ice samples from core
BGR-B and five ice samples from core SAS-A were placed in conical tubes and spun in
a centrifuge at 3300 RPM to separate water from sediment, and then filtered with a 0.22
micrometer PVDF syringe filter. The oxygen and hydrogen isotope compositions on
water were measured by laser absorption technology using a Los Gatos Research liquid
water isotope analyzer at Queen’s University (Kingston, Ontario).
Surface lake water samples were collected in 30-ml high-density polyethylene
bottles close to the center of each lake for isotope analysis. In total, 17 lakes were
sampled from all four sites in 2012 (25-30 August; 5 at NAS and 4 at BGR, KWK and
SAS), 86 in 2013 (30 July-6 August; 12 at NAS, 17 at BGR, 35 at KWK and 22 at SAS)
and 82 in 2014 (25-30 August; 12 at NAS, 15 at BGR, 33 at KWK and 22 at SAS). Due
to the small number of lakes sampled in 2012, we focus mainly on results obtained for
the last two sampling years. Due to logistical constraints in the field, four lakes were not
sampled in 2014 (BGR HELIP., BGR O, KWK 17 and KWK 38/39).

11
Samples were stored at 4 °C prior to analysis at the University of Waterloo
Environmental Isotope Laboratory for oxygen and hydrogen isotope composition.
Samples collected in 2012 and 2013 were analyzed by continuous flow isotope ratio
mass spectrometry using conventional techniques (Epstein and Mayeda, 1953; Morrison
et al., 2001), whereas samples collected in 2014 were analyzed by laser absorption
technology using a Los Gatos Research liquid water isotope analyzer.
Isotope compositions are expressed as -values relative to Vienna Standard
Mean Ocean Water (VSMOW) in per mil (‰), such that sample = (Rsample - RVSMOW) /
RVSMOW x 1000 where R is the ratio 18O/16O or D/1H in the sample and VSMOW. Results
of 18O and D analysis are normalized to -55.5 ‰ and -428 ‰, respectively, for
Standard Light Antarctic Precipitation (SLAP; Coplen, 1996). Analytical uncertainties are
±0.2 ‰ for 18O and ±2.0 for D for lake water samples analyzed by continuous flow
mass spectrometry (2012 and 2013) and ±0.2 ‰ for 18O and ±0.8 ‰ for D for those
analyzed by laser absorption (2014). Precipitation isotope compositions have an
analytical precision of ±0.1 ‰ for 18O and ±0.8 ‰ for D, and permafrost isotope
compositions have an analytical precision of ±0.2 ‰ for 18O and ±0.8 ‰ for D.
3.2. Stable isotope mass-balance modelling
Lake hydrological conditions were evaluated using a reference isotope framework
in 18O – D space consisting of the Global Meteoric Water Line (GMWL) and the Local
Evaporation Line (LEL). The GMWL (D = 818O + 10) expresses the linear relationship
between the oxygen and hydrogen isotope compositions of precipitation globally (Craig,
12
1961). The 18O and D values for precipitation fall along the GMWL, and their position
reflects variability in spatial and seasonal trajectory of the atmospheric vapor
contributing to local precipitation (Rozanski et al., 1993). This leads to isotopically-
depleted winter precipitation and isotopically-enriched summer precipitation (Dansgaard,
1964). Lake surface water, as any other open water body undergoing evaporation, will
deviate isotopically from the GMWL owing to mass-dependent fractionation. The LEL
diverges from the GMWL on a slope typically between 4 and 6 depending on the local
atmospheric conditions, including relative humidity (rh), temperature (T) and isotope
composition of the summer atmospheric moisture (AS; Yi et al., 2008). The LEL for a
given region generally represents the expected linear trajectory of evaporative isotopic
enrichment of a lake fed by the weighted average annual isotope composition of local
precipitation (P). Here we differentiate and utilize the ‘predicted’ LEL based on the
linear resistance model of Craig and Gordon (1965) and used elsewhere (e.g., Wolfe et
al., 2011; Turner et al., 2014), from the more commonly applied ‘empirically-defined’ LEL
for a given region based on linear regression through a series of lake water isotope
compositions. The advantage of the former is that it permits lake water isotope
compositions to be interpreted independently. Thus, we interpret deviation of lake water
isotope composition from the predicted LEL to be due to the differing relative influence
of source waters such as rainfall, snowmelt and permafrost meltwater. The location of
the lake water isotope composition along the predicted LEL reflects the degree of
evaporation.

13
To quantitatively assess components of the lake water balances, we used lake
water isotope compositions (L) to calculate lake-specific input water (I) and
evaporation-to-inflow (E/I) ratios for each lake at the time of sampling (see Appendix).
These metrics provide information regarding the nature of source water (rainfall,
snowmelt, permafrost meltwater) and the intensity of evaporation for each lake at the
time of sampling. We derived these metrics utilizing the coupled-isotope tracer method
of Yi et al. (2008). This method is based on the linear resistant model of Craig and
Gordon (1965) and has previously been utilized by Tondu et al. (2013) and Turner et al.
(2010, 2014) in water balance studies of thermokarst lakes. The I value for each lake
water isotope composition was estimated by calculating a lake-specific LEL and
identifying its intersection with the GMWL. The lake-specific LEL extends between
measured L and the evaporated flux from the individual lake (E) calculated using Craig
and Gordon (1965) model (See Appendix, Eq. A10). E lies on the extension of the lake-
specific LEL to the left of the GMWL. The relative importance of lake source water
origin, rainfall and permafrost meltwater (isotopically-enriched) and/or snowmelt
(isotopically-depleted) as reported below, was estimated by the I position on the GMWL
relative to P such that I > P is isotopically-enriched and I < P isotopically-depleted.
The E/I ratio for each lake at the time of sampling was calculated (Eq. A9) assuming
isotopic and hydrologic steady-state conditions.
4. RESULTS
4.1. Development of isotope framework
Forty precipitation samples from W-K yield a maximum 18O value of -7.9 ‰ and
14
-62.3 ‰ for D (recorded August 27th, 2014), a minimum 18O value of -39.3 ‰ and
-295.4 ‰ for D (January 1st, 2014), and a non-weighted mean annual isotope
composition (P) of -17.1 ‰ for δ18O and -126.8 ‰ for D (Fig. 3, Table 3). The isotope
composition of snow ranges from -39.3 ‰ to -9.9 ‰ for 18O (-295.5 ‰ to -70.0 ‰ for
D), whereas rain ranges from -15.8 ‰ to -7.9 ‰ for 18O (-122.6 ‰ to -62.3 ‰ for D).
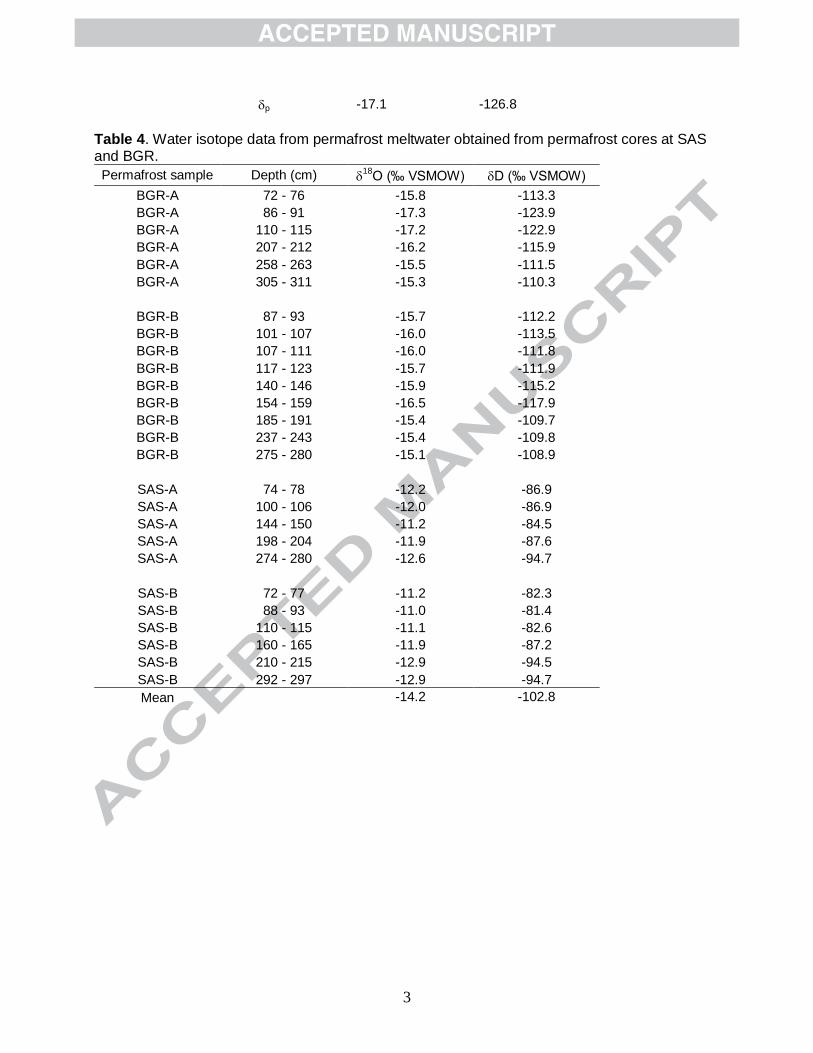
The isotope composition of permafrost meltwater ranges from -17.4 ‰ to -10.9 ‰ for
18O (-123.9 ‰ to -81.4 ‰ for D) with mean values of -14.2 ‰ for 18O and -120.8 ‰
for D (Table 4). As expected, the snow samples plot along an isotopically-depleted
portion of the GMWL relative to rain. The permafrost meltwater isotope compositions
overlap with rain isotope compositions on the GMWL, suggesting permafrost meltwaters
are largely sourced by infiltration of rainfall. Overall, the isotope compositions of all
precipitation and permafrost samples fall along the GMWL, as expected for water that
has not undergone secondary evaporative enrichment. Thus, the GMWL offers a
reasonable representation for isotope composition of precipitation in the study region,
and justifies using the GMWL as a baseline for determining source water isotope
compositions (I) to lakes.
<Figure 3 here please> and <Tables 3 and 4 here please>
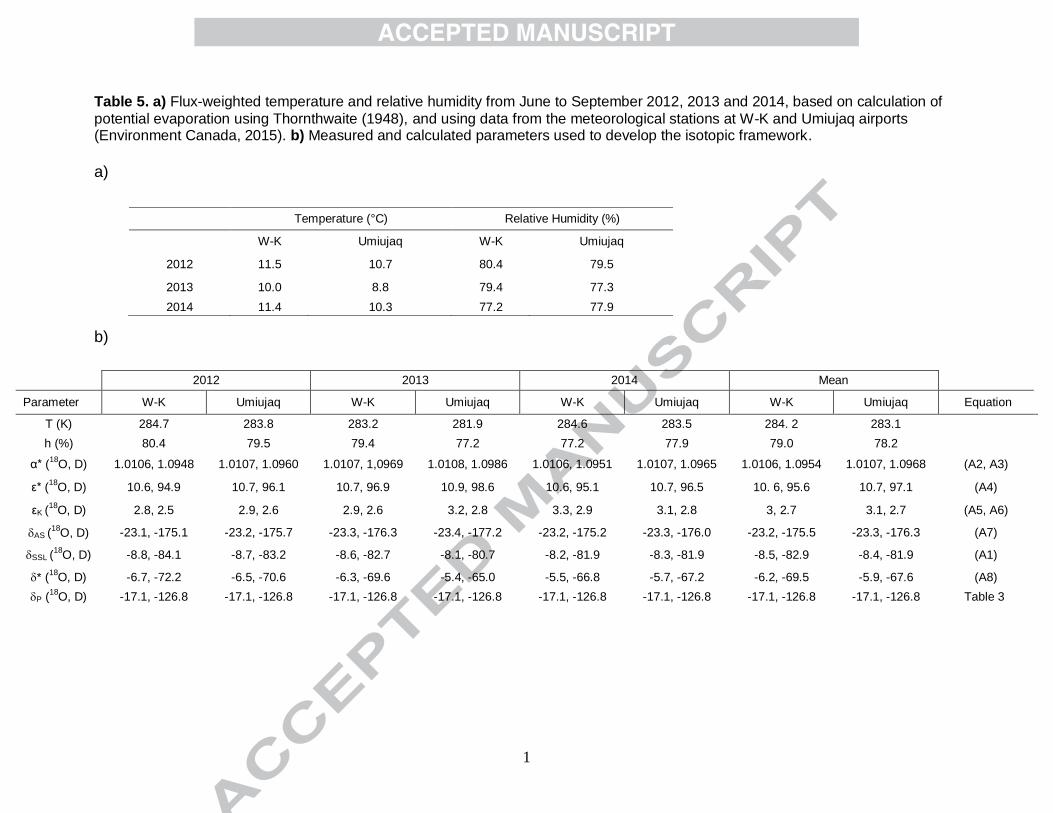
Two predicted LELs were developed as study sites are located in different
biogeographical and climate zones (Fig. 4, Table 5). The Umiujaq LEL was developed
for the northern sites (BGR and NAS) and the W-K LEL for the southern sites (SAS and
KWK). Both LELs are anchored to the GMWL at P = -17.1 ‰ for 18O (-126.8 ‰ for D),
derived from the non-weighted mean of year-round precipitation samples from W-K. The
15
other reference points along the LELs include the limiting steady-state isotope
composition (SSL) where inflow equals evaporation (I=E), as well as the theoretical
limiting isotopic enrichment (*) that marks extreme non-steady-state behavior and which
depends entirely on local atmospheric conditions (see Appendix; Table 5). Given the
consistency of flux-weighted temperature and relative humidity during the three-year
period (Table 5a), a three-year mean of all parameters was used to define the predicted
LELs (Umiujaq LEL: D = 5.218O - 38.9; W-K LEL: D = 5.118O - 39.1). Both predicted
LELs are nearly identical, thus, L values from all four sites are superimposed on the
predicted three-year mean W-K LEL.
<Figure 4 here please> and <Table 5 here please>
4.2. Lake water isotope compositions
Lake water isotope compositions (L) from each site and from each sampling
period are superimposed on the isotope framework to identify inter-annual and site-
specific variability in hydrological conditions (Fig. 5, Table S1). The isotope compositions
of NAS lakes extend along a rather weak linear trend compared to the other sites (r2 =
0.70; -13.8 ‰ to -9.5 ‰ for 18O and -104.2 ‰ to -82.7 ‰ for D), and several cluster
close to the GMWL (Fig. 5a). The isotope compositions of BGR lakes extend along a
strong linear trend (r2 = 0.98; -13.9 ‰ to -9.1 ‰ for 18O and -107.1 ‰ to -80.7 ‰ for D)
above the predicted LEL (Fig 5b). The isotope compositions of BGR lakes span a
considerable range along the predicted LEL, indicating varying evaporative isotopic
enrichment, although none of the lakes plot beyond SSL. The isotope compositions of
KWK extend along a linear trend (r2 = 0.82; -12.9 ‰ to -7.8 ‰ for 18O and -97.6 ‰ to -
16
72.5 ‰ for D) above and generally further along the predicted LEL compared to lakes
from the other sites, indicating greater evaporative enrichment with some lakes plotting
beyond SSL (Fig. 5c). Only one lake, KWK 14 (2014), falls below the predicted LEL. The
isotope compositions of SAS lakes plot along a linear trend (mean r2 = 0.80; -13.5 ‰ to -
9.7 ‰ for 18O and -102.1 ‰ to -80.9 ‰ for D) extending to the right from the GMWL
and above the predicted LEL (Fig. 5d). Many SAS lakes cluster close to the GMWL.
Although a few lakes suggest more substantial lake water evaporative isotopic
enrichment, none of the lakes plot beyond SSL. Considering all sites, there are no
substantial inter-annual fluctuations in the isotope composition of lake waters as
expected due to the similar meteorological conditions. Nearly all L values plot above the
predicted LEL revealing predominantly rainfall and/or permafrost meltwater influence on
water balances. Many of the lakes cluster close to or directly on the GMWL, indicating a
small degree of evaporative isotopic enrichment although this appears greatest for KWK
lakes. Lake-specific source waters and the degree of evaporative isotopic enrichment
are characterized further with calculation of I and E/I values, as reported in the next
section.
<Figure 5 here please>
4.3. Water-balance metrics
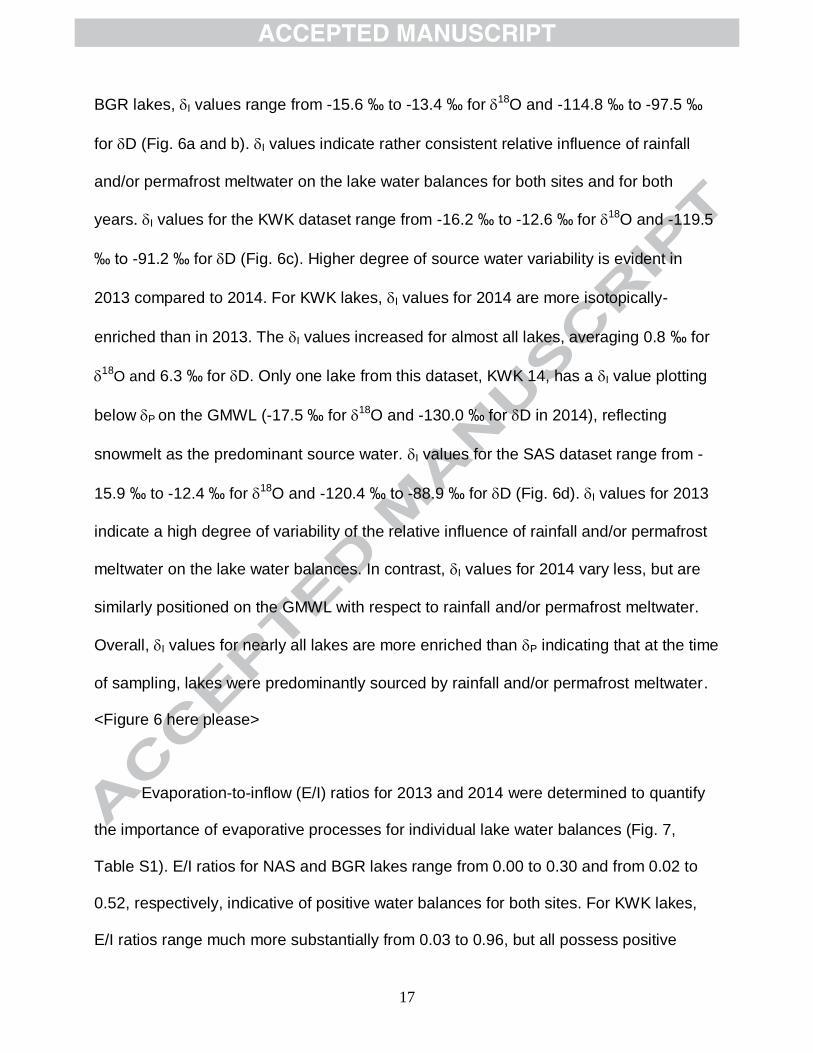
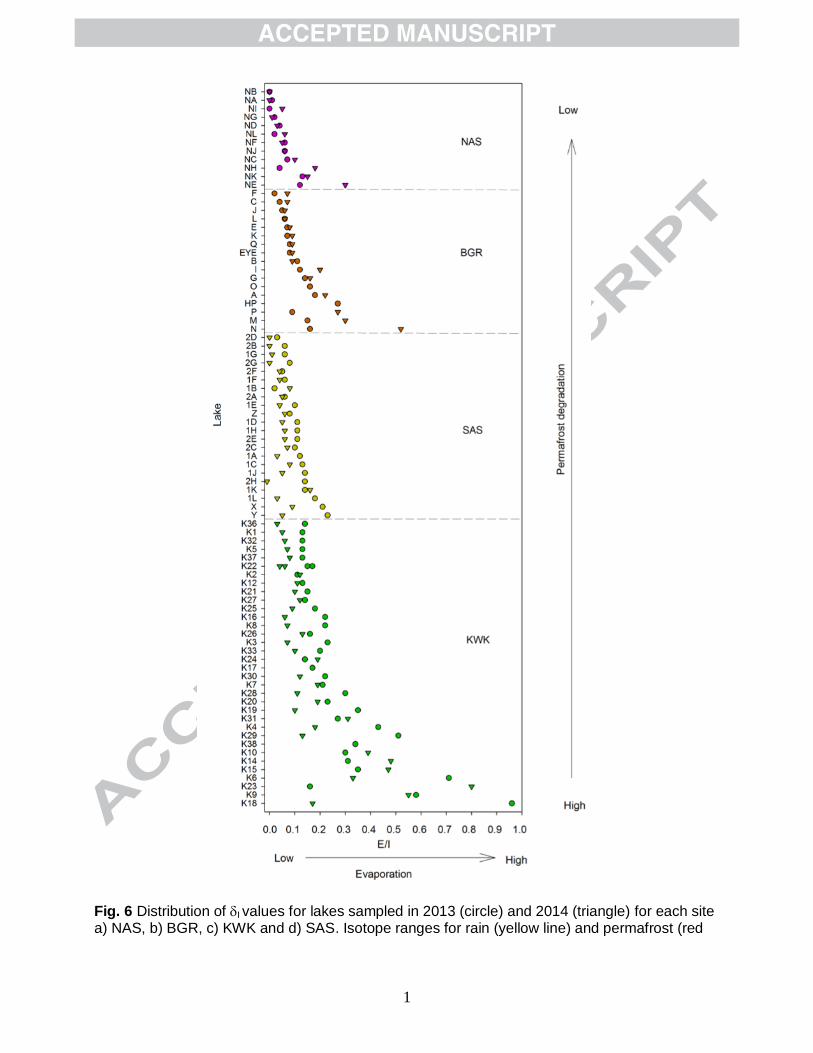
Lake-specific input water isotope compositions (I) were calculated for 2013 and
2014 to quantitatively evaluate the relative role of rainfall, snowmelt and permafrost
meltwater on lake hydrological conditions (Fig. 6, Table S1). For the NAS lakes, I
values range from -15.5‰ to -12.5 ‰ for 18O and -113.8 ‰ to -90.0 ‰ for D and for
17
BGR lakes, I values range from -15.6 ‰ to -13.4 ‰ for 18O and -114.8 ‰ to -97.5 ‰
for D (Fig. 6a and b). I values indicate rather consistent relative influence of rainfall
and/or permafrost meltwater on the lake water balances for both sites and for both
years. I values for the KWK dataset range from -16.2 ‰ to -12.6 ‰ for 18O and -119.5
‰ to -91.2 ‰ for D (Fig. 6c). Higher degree of source water variability is evident in
2013 compared to 2014. For KWK lakes, I values for 2014 are more isotopically-
enriched than in 2013. The I values increased for almost all lakes, averaging 0.8 ‰ for
18
O and 6.3 ‰ for D. Only one lake from this dataset, KWK 14, has a I value plotting
below P on the GMWL (-17.5 ‰ for 18O and -130.0 ‰ for D in 2014), reflecting
snowmelt as the predominant source water. I values for the SAS dataset range from -
15.9 ‰ to -12.4 ‰ for 18O and -120.4 ‰ to -88.9 ‰ for D (Fig. 6d). I values for 2013
indicate a high degree of variability of the relative influence of rainfall and/or permafrost
meltwater on the lake water balances. In contrast, I values for 2014 vary less, but are
similarly positioned on the GMWL with respect to rainfall and/or permafrost meltwater.
Overall, I values for nearly all lakes are more enriched than P indicating that at the time
of sampling, lakes were predominantly sourced by rainfall and/or permafrost meltwater.
<Figure 6 here please>
Evaporation-to-inflow (E/I) ratios for 2013 and 2014 were determined to quantify
the importance of evaporative processes for individual lake water balances (Fig. 7,
Table S1). E/I ratios for NAS and BGR lakes range from 0.00 to 0.30 and from 0.02 to
0.52, respectively, indicative of positive water balances for both sites. For KWK lakes,
E/I ratios range much more substantially from 0.03 to 0.96, but all possess positive

18
water balances. Three lakes have particularly high E/I ratios: KWK 6 (0.71), 23 (0.80)
and 18 (0.96). E/I ratios for the SAS site range from 0.00 to 0.23 indicating strongly
positive water balances for this site as well. For all sites, E/I ratios are similar for the two
years, although several E/I ratios are slightly to substantially higher for KWK and SAS in
2013. Overall, E/I ratios are the highest for KWK and BGR lakes and lowest for SAS and
NAS lakes. Based on E/I ratios, the majority of sampled lakes have rather low
evaporative influence (E/I < 0.5), except for a few lakes at KWK.
<Figure 7 here please>
5. DISCUSSION
Mid- to late summer snapshots of lake water isotope compositions, and derived I
and E/I values, provide insights into hydrological processes that influence individual
thermokarst lake water balances across large latitudinal, vegetation and permafrost
gradients. Remarkably, despite these large gradients, lakes span a comparatively
narrow range of isotope composition and display a mostly consistent low degree of
evaporative enrichment. Furthermore, the isotope compositions of lakes consistently
plotted above the regional predicted LEL, corresponding to relatively high I values,
reflecting the relative importance of rainfall and/or permafrost meltwater on their water
balances (Fig. 5). Since the rainfall and permafrost-meltwater isotope compositions
overlap on the GMWL (Fig. 3), we are unable to determine the relative contributions of
these two lake water sources based on these data alone. Similarly, isotope analyses in
Yukon Flats, Alaska, were unable to distinguish the influence of permafrost meltwater
from snowmelt for a small group of lakes that plotted on a distinctly lower LEL compared
19
to most other lakes sampled (Anderson et al., 2013). In contrast to other studies (e.g.,
Turner et al., 2010, 2014; Tondu et al., 2013), we did not observe that lakes situated in
catchments with high proportions of woodland/forest and tall shrub vegetation receive
substantial snowmelt inputs. Seasonal observations from automated time-lapse
cameras of lake ice and snow cover reveal that lakes and surrounding catchments are
free of ice and snow cover approximately at the same time (in first two weeks of June)
regardless of their latitudinal position (Pienitz et al., 2016). Thus, we suggest that
substantial mid-summer rainfall in 2013 and 2014 (Table 2), and timing of mid- to late
summer sampling, led to the strong influence of rainfall on lake water isotope
compositions, which overwhelmed ability to detect the effects of snowmelt runoff.
Quantitative estimation of evaporation-to-inflow (E/I) ratios indicates that evaporation
tends to be a small component of lake water balances for a majority of the thermokarst
lakes (mean E/I for all sampled lakes = 0.150.1 SD). Consistent with these results,
there were no signs of thermokarst lake desiccation during mid-summer as observed in
the northwestern Hudson Bay Lowlands (northern Manitoba, Canada; Bouchard et al.,
2013) and Old Crow Flats (Yukon Territory, Canada; Turner et al., 2010). An isotope-
based synthesis of thermokarst lake water balances (MacDonald et al., accepted)
underscores the resilience of Nunavik thermokarst lakes to evaporation in relation to
other permafrost landscapes in northern North America that have abundant thermokarst
lakes. Low influence of evaporation on thermokarst lakes in Nunavik is likely due to the
maritime climate in coastal regions during summer months that results in regular and
evenly dispersed precipitation. Similarly, in Greenland, maritime climate ensures low

20
rates of evaporation in coastal regions compared to inland lakes (Leng et al., 2003).
Based on Table 2, considerable mid-summer rainfall likely further dampened the effects
of evaporation on the lake water balances, although apparently less so for KWK and
SAS in 2013 consistent with less rainfall during this year compared to 2014.
Although I results alone cannot readily distinguish the influence of rainfall versus
permafrost meltwaters on lake water balances, there appears to be some
correspondence between E/I among the study sites and degree of permafrost
degradation (Fig. 7). KWK lakes possessed the highest E/I ratios, and among the four
study sites, KWK is the only one with highly degraded permafrost; in fact, there is almost
no permafrost left at this site (M. Allard, pers. comm.). As a result, KWK lakes are
potentially most vulnerable to become evaporation-dominated if permafrost meltwaters
no longer provide an additional source of water to offset evaporation. Such conjecture is
supported by Gibson et al. (2015), who identified that water isotope composition of
thermokarst lakes that receive permafrost meltwater tend to be less evaporatively
enriched. Perhaps the few lakes that have high E/I ratios are at the leading edge of this
potential hydrological transition, which may have been suppressed during the years in
which we conducted our study based on the high rainfall and timing of our sampling.
Although lakes from other sites still potentially receive water inputs from permafrost
meltwaters and undoubtedly from rainfall, permafrost degradation and loss of this water
input could enhance the effects of evaporation. However, expected climate projections
for the Nunavik region include a 25 % increase in annual precipitation (Brown et al.,
2012), which will in all likelihood buffer any potential lake evaporation effects due to the
21
decrease in permafrost meltwater inputs and increase the persistence of these lakes in
the region. Such changes may already be occurring in western Siberia. Agafonov et al.
(2004) suggested that expansion of thermokarst lakes during the past 50 years is largely
a result of increasing precipitation.
Our assessment of thermokarst lake hydrological conditions and forecast of future
hydrological trajectories assumes the basins are hydrologically-closed, which is
reasonable given the low relief, fine-grained substrate and varying presence of
permafrost that likely limits surface and subsurface hydrological connectivity. In the
western Hudson Bay Lowlands, diverging hydrological responses of shallow thermokarst
lakes to recent climate change has been largely attributed to the degree of hydrological
connectivity (Wolfe et al., 2011; Bouchard et al., 2013). In Nunavik, permafrost thaw
may induce greater subsurface hydrological connectivity, which would most likely serve
to further enhance the dominance of lake inflow versus evaporation and lake
persistence that is evident in our results. However, strong evaporative isotopic
enrichment at some thermokarst lakes in the permafrost-degraded KWK site would
seem to suggest that, for at least this location, increased hydrological connectivity may
not be an outcome of permafrost thaw owing to postglacial marine clay substrate of low
permeability.
Catchment-derived water from rainfall and permafrost-thaw are rich in dissolved and
particulate substances that promote chemical stratification in thermokarst lakes in
Nunavik (Laurion et al., 2010; Matveev, et al., 2016). Given future projected increases in
precipitation, additional terrestrial input associated with accelerated permafrost

22
degradation may consequently enhance the potential for methane production in anoxic
bottom waters of these thermokarst lakes (Matveev et al., 2016). Thus, methane
production and emission from Nunavik lakes may become even more substantial than
current estimates (Wik et al., 2016). More extensive intra- and inter-annual hydrological,
limnological and biogeochemical sampling and analysis should shed further light on
these relations.
6. CONCLUSION
Water isotope analyses of thermokarst lakes across large latitudinal, vegetation
and permafrost gradients in Nunavik, supplemented by isotope analyses of precipitation
and permafrost meltwater, reveal a narrow range of lake water balance conditions.
Calculation of water balance metrics, including the isotope composition of input water
and evaporation-to-inflow ratios, indicate that most lakes, at the time of sampling, were
sourced by rainfall and/or permafrost meltwater and had experienced low degree of
evaporation. We attribute these results to the maritime climate in the coastal region of
Nunavik, which plays an over-riding influence on lake hydrology, evidently dampening
potential hydrological influence stemming from differences in catchment vegetation and
permafrost condition. Consequently, the maritime climate renders these thermokarst
lakes to be resilient to the effects of evaporation. Given future increases in precipitation,
we expect thermokarst lakes to be even less influenced by evaporation and perhaps
grow in number and water body size, occupying an increasingly significant surface area,
with the exception of landscapes where permafrost has almost disappeared (e.g., KWK).
If projected increases in precipitation coupled with accelerated permafrost degradation
in the region yield greater transport and supply of DOC to lakes, this may enhance the

23
role of these lakes as greenhouse-gas emitters.
ACKNOWLEDGEMENTS
This work is part of a Ph.D. research project by B. Narancic funded through a Discovery
Research grant awarded to R. Pienitz from the Natural Sciences and Engineering
Research Council (NSERC) of Canada, the Arctic Development and Adaptation to
Permafrost in Transition (ADAPT), the NSERC-CREATE EnviroNord training program in
Northern Environmental Sciences, as well as logistic support from Center for Northern
Studies (CEN). We would like to express our gratitude to Claude Tremblay of the CEN
Research Station in W-K for his dedicated work in precipitation sampling. We would also
like to thank Frédéric Bouchard, Valentin Proult and Denis Sarrazin for their assistance
in the field. We are grateful to Émilie Saulnier-Talbot for inspiring discussions and
Claudia Zimmermann for help in the laboratory. We thank laboratory personnel of the
University of Waterloo – Environmental Isotope Laboratory and from Alfred Wegener
Institute (AWI) for their support in lake water sample analysis. We would also like to
thank two anonymous reviewers, as well as the associate editor and editor, whose
comments have led to many improvements.

24
APPENDIX
Calculation of SSL and *:
SSL represents the isotope composition of a terminal basin, where evaporation is equal
to inflow, and was determined using the expression from Gonfiantini (1986):
SSL = *I (1 – h + k) + *hAS + *k + * (A1)
In equation (A1), * is the equilibrium liquid–vapor isotopic fractionation calculated from
equations given by Horita and Wesolowski (1994):
[18O]: 1000ln* = –7.685 + 6.7123(103/T) – 1.6664 (106/T2) + 0.35041(109/T3) (A2)
[D]: 1000ln* = 1158.8(T3/109) – 1620.1(T2/106) + 794.84(T/103) – 161.04 +
2.9992(109/T3) (A3)
In (A2) and (A3), T represents the interface temperature in Kelvin (K). The equilibrium
(*) and kinetic (K) separation factors between liquid and vapor phases are given by
Gonfiantini (1986):
* = * – 1 (A4)
[18O]: K = 0.0142(1 – h)

25
(A5)
[D ]: K = 0.0125(1 – h) (A6)
Atmospheric vapor during the ice-free season (AS) is calculated assuming it is in
isotopic equilibrium with local precipitation (PS) during the ice-free season:
AS = (PS – *) / * (A7)
The non-steady state isotope composition of a water body close to complete desiccation
(*) was calculated from the equation given by Gonfiantini (1986):
* = (hAS + K + */*) / (h – K – */*) (A8)
Calculation of E/I ratios
Evaporation/inflow ratios (E/I) were calculated from the following equation as derived by
Gibson and Edwards (2002) and others:
E/I = (I – L) / (E – L) (A9)
In (A9), L is the measured isotope composition of the surface lake water, I is the
calculated lake-specific water source composition and E is the isotope composition of
the associated evaporation flux, calculated by the formula:

26
E = ((L – *) / * – hAS – K) / (1 – h + K ) (Gonfiantini, 1986) (A10)
27
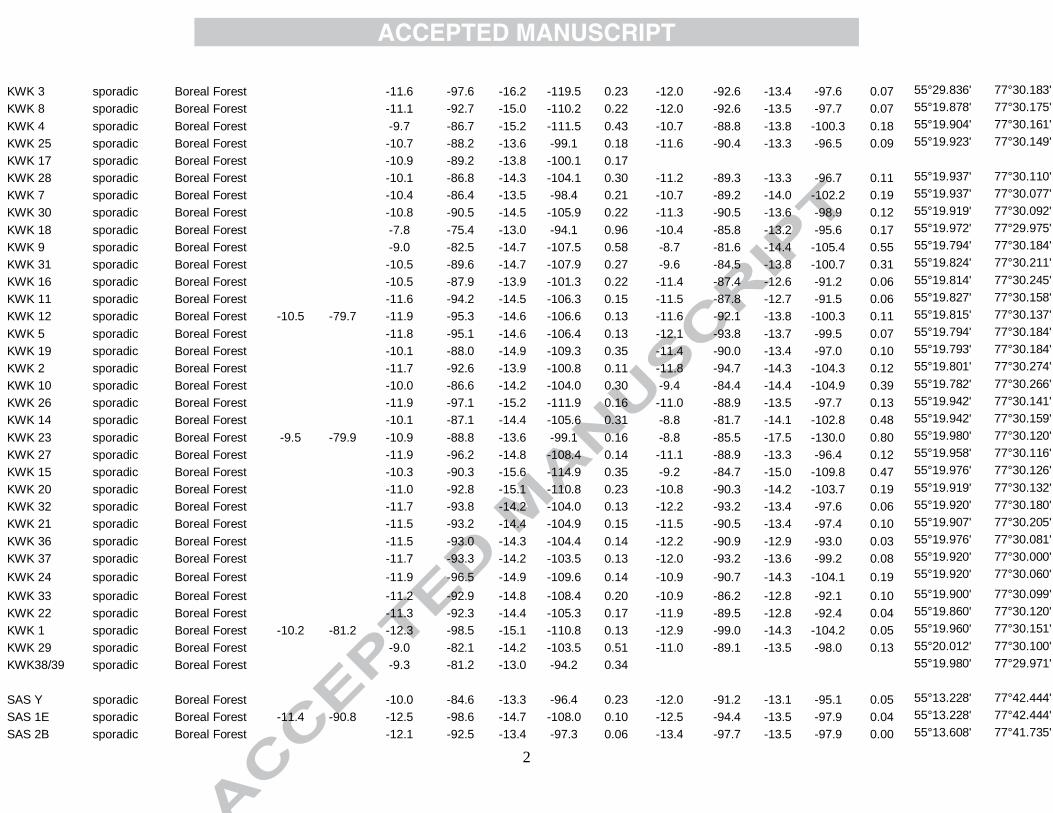
SUPPLEMENTARY MATERIAL
Table S1. Measured isotope composition of lake water (L), calculated lake-specific
input water isotope composition (I), and evaporation-to-inflow (E/I) ratios, as well as
permafrost and vegetation types specific to each site and individual lake.

1
2012 2013 2014
Lake permafrost Vegetation L(18
O) L(D) L(18
O) L(D) I(18
O) I(D) E/I L(18
O) L(D) I(18
O) I(D) E/I Lat (˚N) Long (˚W)
NAS H discontinuous Forest-Tundra -11.9 -87.0 -13.1 -99.1 -14.1 -103.1 0.04 -11.8 -97.3 -15.5 -113.8 0.18 56°36.518' 76°13.030'
NAS E discontinuous Forest-Tundra
-10.6 -84.2 -12.6 -91.1 0.12 -9.5 -82.7 -13.4 -97.0 0.30 56°36.638' 76°12.854'
NAS C discontinuous Forest-Tundra
-11.7 -89.9 -13.1 -94.9 0.07 -11.6 -91.3 -13.6 -98.6 0.10 56°55.429' 76°22.655'
NAS K discontinuous Forest-Tundra
-11.2 -89.4 -13.6 -98.6 0.13 -10.5 -85.3 -12.9 -93.5 0.15 56°55.423' 76°22.750'
NAS F discontinuous Forest-Tundra
-12.9 -99.3 -14.5 -105.7 0.06 -11.8 -89.5 -12.8 -92.7 0.05 56°55.360' 76°22.790'
NAS A discontinuous Forest-Tundra -12.4 -87.3 -12.7 -93.0 -13.0 -94.2 0.01 -13.6 -99.1 -13.6 -99.1 0.00 56°55.360' 76°22.790'
NAS D discontinuous Forest-Tundra
-13.8 -104.2 -14.8 -108.3 0.04 -13.1 -97.4 -13.7 -99.8 0.03 56°55.450' 76°22.657'
NAS L discontinuous Forest-Tundra
-13.3 -98.5 -13.8 -100.3 0.02 -13.1 -100.6 -14.5 -106.4 0.06 56°55.409' 76°22.792'
NAS G discontinuous Forest-Tundra
-13.8 -102.7 -14.3 -104.7 0.02 -13.5 -99.1 -13.7 -99.7 0.01 56°55.432' 76°22.798'
NAS J discontinuous Forest-Tundra -11.2 -78.3 -12.5 -95.2 -13.8 -100.4 0.06 -12.3 -94.6 -13.7 -100.0 0.06 56°55.452' 76°22.636'
NAS B discontinuous Forest-Tundra -12.2 -86.9 -13.5 -97.4 -13.4 -96.9 0.00 -13.3 -97.1 -13.4 -97.5 0.00 56°55.429' 76°22.655'
NAS I discontinuous Forest-Tundra
-13.2 -92.1 -12.5 -90.0 -0.03 -12.5 -94.6 -13.6 -98.7 0.05 56°55.402' 76°22.753'
BGR B discontinuous Forest-Tundra -11.1 -84.4 -12.7 -100.4 -15.2 -111.4 0.11 -12.3 -96.7 -14.4 -105.0 0.09 56°36.652' 76°12.912'
BGR A discontinuous Forest-Tundra -10.5 -82.3 -10.8 -89.2 -14.0 -101.9 0.18 -10.6 -88.9 -14.2 -103.3 0.22 56°36.632' 76°12.937'
BGR F discontinuous Forest-Tundra -12.3 -87.9 -14.4 -107.7 -15.1 -110.6 0.02 -13.4 -103.9 -15.2 -111.4 0.07 56°36.609' 76°12.872'
BGR K discontinuous Forest-Tundra
-13.8 -106.7 -15.6 -115.0 0.07 -13.1 -102.7 -15.3 -112.4 0.09 56°36.638' 76°12.854'
BGR I discontinuous Forest-Tundra
-11.6 -92.4 -14.0 -102.2 0.12 -11.1 -92.7 -14.8 -108.4 0.20 56°36.503' 76°13.014'
BGR C discontinuous Forest-Tundra
-13.6 -102.9 -14.6 -107.2 0.04 -13.0 -100.4 -14.7 -107.3 0.07 56°36.518' 76°13.030'
BGR J discontinuous Forest-Tundra
-13.8 -105.7 -15.2 -111.5 0.05 -13.5 -103.4 -14.9 -109.6 0.06 56°36.613' 76°12.821'
BGR L discontinuous Forest-Tundra
-13.9 -107.1 -15.6 -114.5 0.06 -13.1 -101.0 -14.7 -107.8 0.06 56°36.592' 76°12.728'
BGR G discontinuous Forest-Tundra -10.2 -80.7 -10.9 -87.9 -13.4 -97.5 0.14 -11.2 -91.3 -14.1 -103.0 0.16 56°36.557' 76°12.754'
BGR E discontinuous Forest-Tundra
-13.2 -102.8 -15.1 -111.1 0.07 -12.6 -99.0 -14.7 -107.2 0.08 56°36.573' 76°12.773'
BGR Q discontinuous Forest-Tundra
-12.8 -99.7 -14.8 -108.2 0.08 -12.9 -101.9 -15.2 -111.8 0.09 56°36.524' 76°13.040'
BGR M discontinuous Forest-Tundra
-11.4 -92.1 -14.2 -103.6 0.15 -10.6 -92.1 -15.6 -114.8 0.30 56°36.512' 76°13.070'
BGR EYE discontinuous Forest-Tundra
-12.4 -96.6 -14.2 -103.8 0.08 -12.1 -94.2 -13.9 -101.3 0.09 56°36.503' 76°13.071'
BGR N discontinuous Forest-Tundra
-11.8 -96.3 -15.1 -110.5 0.15 -9.1 -84.2 -15.2 -111.2 0.52 56°36.483' 76°13.003'
BGR P discontinuous Forest-Tundra
-12.2 -95.5 -14.2 -103.3 0.09 -10.3 -88.3 -14.5 -106.1 0.27 56°36.481' 76°12.962'
BGR HELI.
discontinuous Forest-Tundra
-9.9 -84.7 -13.8 -100.3 0.27
56°36.483' 76°13.003'
BGR O discontinuous Forest-Tundra
-10.9 -89.0 -13.8 -100.2 0.16
56°36.483' 76°13.003'
KWK 6 sporadic Boreal Forest -8.0 -72.5 -8.5 -79.7 -14.2 -103.9 0.71 -9.1 -80.7 -13.0 -94.2 0.33 55°19.853' 77°30.166'
2
KWK 3 sporadic Boreal Forest
-11.6 -97.6 -16.2 -119.5 0.23 -12.0 -92.6 -13.4 -97.6 0.07 55°29.836' 77°30.183'
KWK 8 sporadic Boreal Forest
-11.1 -92.7 -15.0 -110.2 0.22 -12.0 -92.6 -13.5 -97.7 0.07 55°19.878' 77°30.175'
KWK 4 sporadic Boreal Forest
-9.7 -86.7 -15.2 -111.5 0.43 -10.7 -88.8 -13.8 -100.3 0.18 55°19.904' 77°30.161'
KWK 25 sporadic Boreal Forest
-10.7 -88.2 -13.6 -99.1 0.18 -11.6 -90.4 -13.3 -96.5 0.09 55°19.923' 77°30.149'
KWK 17 sporadic Boreal Forest
-10.9 -89.2 -13.8 -100.1 0.17
KWK 28 sporadic Boreal Forest
-10.1 -86.8 -14.3 -104.1 0.30 -11.2 -89.3 -13.3 -96.7 0.11 55°19.937' 77°30.110'
KWK 7 sporadic Boreal Forest
-10.4 -86.4 -13.5 -98.4 0.21 -10.7 -89.2 -14.0 -102.2 0.19 55°19.937' 77°30.077'
KWK 30 sporadic Boreal Forest
-10.8 -90.5 -14.5 -105.9 0.22 -11.3 -90.5 -13.6 -98.9 0.12 55°19.919' 77°30.092'
KWK 18 sporadic Boreal Forest
-7.8 -75.4 -13.0 -94.1 0.96 -10.4 -85.8 -13.2 -95.6 0.17 55°19.972' 77°29.975'
KWK 9 sporadic Boreal Forest
-9.0 -82.5 -14.7 -107.5 0.58 -8.7 -81.6 -14.4 -105.4 0.55 55°19.794' 77°30.184'
KWK 31 sporadic Boreal Forest
-10.5 -89.6 -14.7 -107.9 0.27 -9.6 -84.5 -13.8 -100.7 0.31 55°19.824' 77°30.211'
KWK 16 sporadic Boreal Forest
-10.5 -87.9 -13.9 -101.3 0.22 -11.4 -87.4 -12.6 -91.2 0.06 55°19.814' 77°30.245'
KWK 11 sporadic Boreal Forest
-11.6 -94.2 -14.5 -106.3 0.15 -11.5 -87.8 -12.7 -91.5 0.06 55°19.827' 77°30.158'
KWK 12 sporadic Boreal Forest -10.5 -79.7 -11.9 -95.3 -14.6 -106.6 0.13 -11.6 -92.1 -13.8 -100.3 0.11 55°19.815' 77°30.137'
KWK 5 sporadic Boreal Forest
-11.8 -95.1 -14.6 -106.4 0.13 -12.1 -93.8 -13.7 -99.5 0.07 55°19.794' 77°30.184'
KWK 19 sporadic Boreal Forest
-10.1 -88.0 -14.9 -109.3 0.35 -11.4 -90.0 -13.4 -97.0 0.10 55°19.793' 77°30.184'
KWK 2 sporadic Boreal Forest
-11.7 -92.6 -13.9 -100.8 0.11 -11.8 -94.7 -14.3 -104.3 0.12 55°19.801' 77°30.274'
KWK 10 sporadic Boreal Forest
-10.0 -86.6 -14.2 -104.0 0.30 -9.4 -84.4 -14.4 -104.9 0.39 55°19.782' 77°30.266'
KWK 26 sporadic Boreal Forest
-11.9 -97.1 -15.2 -111.9 0.16 -11.0 -88.9 -13.5 -97.7 0.13 55°19.942' 77°30.141'
KWK 14 sporadic Boreal Forest
-10.1 -87.1 -14.4 -105.6 0.31 -8.8 -81.7 -14.1 -102.8 0.48 55°19.942' 77°30.159'
KWK 23 sporadic Boreal Forest -9.5 -79.9 -10.9 -88.8 -13.6 -99.1 0.16 -8.8 -85.5 -17.5 -130.0 0.80 55°19.980' 77°30.120'
KWK 27 sporadic Boreal Forest
-11.9 -96.2 -14.8 -108.4 0.14 -11.1 -88.9 -13.3 -96.4 0.12 55°19.958' 77°30.116'
KWK 15 sporadic Boreal Forest
-10.3 -90.3 -15.6 -114.9 0.35 -9.2 -84.7 -15.0 -109.8 0.47 55°19.976' 77°30.126'
KWK 20 sporadic Boreal Forest
-11.0 -92.8 -15.1 -110.8 0.23 -10.8 -90.3 -14.2 -103.7 0.19 55°19.919' 77°30.132'
KWK 32 sporadic Boreal Forest
-11.7 -93.8 -14.2 -104.0 0.13 -12.2 -93.2 -13.4 -97.6 0.06 55°19.920' 77°30.180'
KWK 21 sporadic Boreal Forest
-11.5 -93.2 -14.4 -104.9 0.15 -11.5 -90.5 -13.4 -97.4 0.10 55°19.907' 77°30.205'
KWK 36 sporadic Boreal Forest
-11.5 -93.0 -14.3 -104.4 0.14 -12.2 -90.9 -12.9 -93.0 0.03 55°19.976' 77°30.081'
KWK 37 sporadic Boreal Forest
-11.7 -93.3 -14.2 -103.5 0.13 -12.0 -93.2 -13.6 -99.2 0.08 55°19.920' 77°30.000'
KWK 24 sporadic Boreal Forest
-11.9 -96.5 -14.9 -109.6 0.14 -10.9 -90.7 -14.3 -104.1 0.19 55°19.920' 77°30.060'
KWK 33 sporadic Boreal Forest
-11.2 -92.9 -14.8 -108.4 0.20 -10.9 -86.2 -12.8 -92.1 0.10 55°19.900' 77°30.099'
KWK 22 sporadic Boreal Forest
-11.3 -92.3 -14.4 -105.3 0.17 -11.9 -89.5 -12.8 -92.4 0.04 55°19.860' 77°30.120'
KWK 1 sporadic Boreal Forest -10.2 -81.2 -12.3 -98.5 -15.1 -110.8 0.13 -12.9 -99.0 -14.3 -104.2 0.05 55°19.960' 77°30.151'
KWK 29 sporadic Boreal Forest
-9.0 -82.1 -14.2 -103.5 0.51 -11.0 -89.1 -13.5 -98.0 0.13 55°20.012' 77°30.100'
KWK38/39 sporadic Boreal Forest
-9.3 -81.2 -13.0 -94.2 0.34
55°19.980' 77°29.971'
SAS Y sporadic Boreal Forest
-10.0 -84.6 -13.3 -96.4 0.23 -12.0 -91.2 -13.1 -95.1 0.05 55°13.228' 77°42.444'
SAS 1E sporadic Boreal Forest -11.4 -90.8 -12.5 -98.6 -14.7 -108.0 0.10 -12.5 -94.4 -13.5 -97.9 0.04 55°13.228' 77°42.444'
SAS 2B sporadic Boreal Forest
-12.1 -92.5 -13.4 -97.3 0.06 -13.4 -97.7 -13.5 -97.9 0.00 55°13.608' 77°41.735'

3
SAS 2D sporadic Boreal Forest
-12.2 -90.6 -12.8 -92.8 0.03 -13.3 -96.4 -13.3 -96.5 0.00 55°13.595' 77°41.857'
SAS 2G sporadic Boreal Forest
-12.3 -95.4 -14.0 -102.0 0.08 -13.3 -96.1 -13.2 -95.8 0.00 55°13.589' 77°41.879'
SAS 2C sporadic Boreal Forest
-11.5 -90.5 -13.5 -97.6 0.10 -11.8 -91.3 -13.3 -96.5 0.07 55°13.610' 77°41.854'
SAS 1F sporadic Boreal Forest -10.6 -85.7 -12.9 -99.3 -14.4 -105.2 0.06 -12.7 -95.4 -13.5 -98.4 0.04 55°13.599' 77°41.896'
SAS 1D sporadic Boreal Forest
-11.9 -94.8 -14.3 -104.2 0.11 -12.8 -97.8 -14.1 -102.6 0.05 55°13.621' 77°41.760'
SAS X sporadic Boreal Forest
-9.7 -80.9 -12.4 -88.9 0.21 -11.1 -87.1 -12.8 -92.6 0.09 55°13.380' 77°42.360'
SAS Z sporadic Boreal Forest
-11.2 -86.6 -12.7 -91.4 0.08 -11.9 -90.8 -13.1 -94.8 0.06 55°13.382' 77°42.360'
SAS 1H sporadic Boreal Forest
-11.9 -94.7 -14.3 -104.4 0.11 -12.0 -92.4 -13.4 -97.2 0.06 55°13.387' 77°42.360'
SAS 1C sporadic Boreal Forest
-12.5 -100.1 -15.4 -113.1 0.13 -12.4 -96.6 -14.2 -103.4 0.08 55°13.591' 77°41.815'
SAS 2F sporadic Boreal Forest
-12.7 -96.8 -13.9 -101.3 0.05 -12.4 -94.2 -13.5 -97.8 0.04 55°13.600' 77°41.806'
SAS 2E sporadic Boreal Forest
-11.7 -92.7 -13.9 -101.6 0.11 -12.2 -93.6 -13.6 -98.6 0.06 55°13.608' 77°41.735'
SAS 1B sporadic Boreal Forest
-13.4 -99.7 -14.0 -101.9 0.02 -12.2 -95.3 -14.0 -102.3 0.08 55°13.595' 77°41.857'
SAS 1K sporadic Boreal Forest
-12.6 -102.1 -15.9 -117.6 0.14 -11.1 -91.1 -14.1 -102.9 0.16 55°13.589' 77°41.879'
SAS 2A sporadic Boreal Forest -11.6 -90.8 -12.3 -93.7 -13.6 -98.4 0.06 -12.9 -98.0 -14.1 -102.6 0.05 55°13.610' 77°41.854'
SAS 1J sporadic Boreal Forest
-12.3 -99.9 -15.6 -114.4 0.14 -12.5 -94.9 -13.6 -99.0 0.05 55°13.599' 77°41.896'
SAS 1L sporadic Boreal Forest
-12.3 -101.3 -16.3 -120.4 0.18 -12.6 -93.8 -13.2 -96.0 0.03 55°13.621' 77°41.760'
SAS 1G sporadic Boreal Forest
-13.1 -100.2 -14.5 -106.2 0.06 -13.4 -98.0 -13.6 -98.8 0.01 55°13.342' 77°42.348'
SAS 2H sporadic Boreal Forest
-11.9 -96.2 -14.8 -108.6 0.14 -13.5 -97.1 -13.3 -96.3 0.00 55°13.342' 77°42.348'
SAS 1A sporadic Boreal Forest -11.2 -89.0 -12.4 -99.0 -15.2 -111.2 0.12 -13.0 -97.4 -13.8 -100.4 0.03 55°13.342' 77°42.348'

1
REFERENCES
ACIA, 2004. Impact of a Warming Arctic: Arctic Climate Impact Assessment, Cambridge
University Press.
Agafonov, L., Strunk, H., Nuber, T., 2004. Thermokarst dynamics in Western Siberia: Insights
from dendrochronological research. Palaeogeogr. Palaeoclimatol. Palaeoecol. 209, 183–
196. doi:10.1016/j.palaeo.2004.02.024
Allard, M., K.-Seguin, M., 1987. Le pergélisol au Québec nordique : bilan et perspectives.
Géographie Phys. Quat. 41, 141. doi:10.7202/032671ar
Anderson, L., Birks, J., Rover, J., Guldager, N., 2013. Controls on recent Alaskan lake changes
identified from water isotopes and remote sensing. Geophys. Res. Lett. 40, 3413–3418.
doi:10.1002/grl.50672
Bhiry, N., Robert, É.C., 2006. Reconstruction of changes in vegetation and trophic conditions of
a palsa in a permafrost peatland, subarctic Québec, Canada. Ecoscience 13, 56–65.
doi:10.2980/1195-6860(2006)13[56:ROCIVA]2.0.CO;2
Bouchard, F., Francus, P., Pienitz, R., Laurion, I., 2011. Sedimentology and geochemistry of
thermokarst ponds in discontinuous permafrost, subarctic Quebec, Canada. J. Geophys.
Res. Biogeosciences 116, 1–14. doi:10.1029/2011JG001675
Bouchard, F., Francus, P., Pienitz, R., Laurion, I., Feyte, S., 2014. Subarctic thermokarst ponds:
investigating recent landscape evolution and sediment dynamics in thawed permafrost of
northern Québec (Canada). Arctic, Antarct. Alp. Res. 46, 251–271. doi:10.1657/1938-4246-
46.1.251
Bouchard, F., Pienitz, R., Ortiz, J.D., Francus, P., Laurion, I., 2013. Palaeolimnological
conditions inferred from fossil diatom assemblages and derivative spectral properties of
sediments in thermokarst ponds of subarctic Quebec, Canada. Boreas 42, 575–595.
doi:10.1111/bor.12000
Brown, R., Lemay, M., Allard, M., Barrand, N.E., Barrette, C., Bégin, Y., Bell, T., Bernier, M.,

2
Bleau, S., Chaumont, D., Dibike, Y., Frigon, A., Leblanc, P., Paquin, D., Sharp, M.J., Way,
R., 2012. Climate variability and change in the Canadian Eastern Subarctic IRIS region
(Nunavut and Nunatsiavut). Pages 57-113 dans Allard, M., Lemay, M. (Éditeurs). Nunavik
and Nunatsiavut: From science to policy. An Integrated Regional Impact Study (IRIS)
of climate change and modernization. ArcticNet Inc. Québec, Québec, Canada.
Calmels, F., Allard, M., Delisle, G., 2008. Development and decay of a lithalsa in Northern
Québec : A geomorphological history 97, 287–299. doi:10.1016/j.geomorph.2007.08.013
Comte, J., Monier, A., Crevecoeur, S., Lovejoy, C., Vincent, W.F., 2015. Microbial biogeography
of permafrost thaw ponds across the changing northern landscape. Ecography (Cop.). n/a-
n/a. doi:10.1111/ecog.01667
Craig, H., Gordon, L.I., 1965. Deuterium and oxygen 18 variations in the ocean and the
marine atmosphere. In: Tongiorgi, E. (Ed.), Stable Isotope in Oceanographic Studies
and Paleotemperatures. Laboratorio di Geologia Nucleare, Pisa, Italy, pp. 570 9–130.
Crevecoeur, S., Vincent, W.F., Comte, J., Lovejoy, C., 2015. Bacterial community structure
across environmental gradients in permafrost thaw ponds: methanotroph-rich ecosystems.
Front. Microbiol. 6, 1–15. doi:10.3389/fmicb.2015.00192
Dansgaard, W., 1964. Stable isotopes in precipitation. Tellus A. doi:10.3402/tellusa.v16i4.8993
Deshpande, B.N., MacIntyre, S., Matveev, A., Vincent, W.F., 2015. Oxygen dynamics in
permafrost thaw lakes: Anaerobic bioreactors in the Canadian subarctic. Limnol. Oceanogr.
60, 1656–1670. doi:10.1002/lno.10126
Environment Canada, 2015. National Climate Data and Information Archive.
<httpp://www.weather.gc.ca/climateData>.
Epstein, S., Mayeda, T., 1953. Variation of O-18 content of waters from natural sources.
Geochemica Cosmochim. Acta 4, 213–224. doi:10.1016/0016-7037(53)90051-9
Gonfiantini, R., 1986. Environmental isotopes in lake studies. In: Fritz, P., Fontes, J.- C. (Eds.),
Handbook of Environmental Isotope Geochemistry, The Terrestrial Environment, vol.

3
2. 26 Elsevier, New York, pp. 113–168.
Horita, J., Wesolowski, D., 1994. Liquid–vapour fractionation of oxygen and hydrogen isotopes
of water from the freezing to the critical temperature. Geochimica et Cosmochimica Acta
58, 3425–3437.
Gibson, J.J., Edwards, T.W.D., 2002. Regional water balance trends and evaporative
transpiration partitioning from a stable isotope survey of lakes in northern Canada. Global
Biogeochemical Cycles 16. doi:10.1029/2001GB001839.
Gibson, J.J., Reid, R., 2014. Water balance along a chain of tundra lakes: A 20-year isotopic
perspective. J. Hydrol. 519, 2148–2164. doi:10.1016/j.jhydrol.2014.10.011
Gibson, J.J., Birks, S.J., Yi, Y., Vitt, D.H., 2015. Runoff to boreal lakes linked to land cover,
watershed morphology and permafrost thaw: A 9-year isotope mass balance assessment.
Hydrol. Process. 3861, 3848–3861. doi:10.1002/hyp.10502
Gibson, J.J., Birks, S.J., Yi, Y., 2016a. Higher tritium concentrations measured in permafrost
thaw lakes in northern Alberta. Hydrol. Process. 30, 245–249. doi:10.1002/hyp.10599
Gibson, J.J., Birks, S.J., Yi, Y., 2016b. Stable isotope mass balance of lakes: A contemporary
perspective. Quat. Sci. Rev. 131, 316–328. doi:10.1016/j.quascirev.2015.04.013
Gonfiantini, R., 1986. Environmental isotopes in lake studies. In: Fritz, P., Fontes, J.- C. (Eds.),
Handbook of Environmental Isotope Geochemistry, The Terrestrial Environment, vol. 2.
Elsevier, New York, pp. 113–168.
Jones, M.D., Cuthbert, M.O., Leng, M.J., McGowan, S., Mariethoz, G., Arrowsmith, C., Sloane,
H.J., Humphrey, K.K., Cross, I., 2016. Comparisons of observed and modelled lake 18O
variability. Quat. Sci. Rev. 131, 329–340. doi:10.1016/j.quascirev.2015.09.012
Laurion, I., Vincent, W.F., MacIntyre, S., Retamal, L., Dupont, C., Francus, P., Pienitz, R., 2010.
Variability in greenhouse gas emissions from permafrost thaw ponds. Limnol. Oceanogr.
55, 115–133. doi:10.4319/lo.2010.55.1.0115
Leng, M.J., Anderson, J.N., 2003. Isotopic variation in modern lake waters from

4
western Greenland. The Holocene 13, 605–611. doi: 10.1191/0959683603hl620rr
MacDonald, L.A., Turner, K.W., Balasubramaniam, A.M., Wolfe, B.B., Hall, R.I., Sweetman, J.N.,
2012. Tracking hydrological responses of a thermokarst lake in the Old Crow Flats (Yukon
Territory, Canada) to recent climate variability using aerial photographs and
paleolimnological methods. Hydrol. Process. 26, 117–129. doi:10.1002/hyp.8116
MacDonald, L.A., Wolfe, B.B, Turner, K.W, Anderson, L., Arp, C.D, Birks,S.J., Bouchard, F.,
Edwards, T.W.D, Farquharson, N., Hall R.I., McDonald, I., Narancic, B., Ouimet, C.,
Pienitz, R., Tondu, J. and White, H., accepted. A synthesis of thermokarst lake water
balance in high-latitude regions of North America from isotope tracers. Arctic Science
Matveev, A., Laurion, I., Deshpande, B.N., Bhiry, N., Vincent, W.F., 2016. High methane
emissions from thermokarst lakes in subarctic peatlands. Limnol. Oceanogr.
doi:10.1002/lno.10311
Meyer, H., Sch¨onicke, L., Wand, U., Hubberten, H. W., and Friedrichsen, H., 2000. Isotope
studies of hydrogen and oxygen in ground ice – experiences with the equilibration
technique. Isot. Environm. Heal. S., 36, 133–149. doi:10.1080/10256010008032939
Morrison, J., Brockwell, T., Merren, T., Fourel, F., Phillips, a M., 2001. On-line high precision
stable hydrogen isotopic analyses on nanoliter water samples. Anal. Chem. 73, 3570–3575.
Payette, S., Delwaide, A., Caccianiga, M., Beauchemin, M., 2004. Accelerated thawing of
subarctic peatland permafrost over the last 50 years. Geophys. Res. Lett. 31, 1–4.
doi:10.1029/2004GL020358
Pienitz, R., Lortie, G., Allard, M., 1991. Isolation of lacustrine basins and marine regression in
the Kuujjuaq area, northern Québec, as inferred from diatom analysis. Géographie Phys.
Quat. 45, 155. doi:10.7202/032858ar
Pienitz, R., Doran, P.T., Lamoureux, S., 2008. Origin and geomorphology of lakes in the polar
regions. In: Vincent, W.F. & Laybourn-Parry, J. (eds), Polar lakes and rivers – Limnology of
Arctic and Antarctic aquatic ecosystems, pp. 25-41.
5
Pienitz, R., Bouchard, F., Narancic, B., Vincent, W.F., Sarrazin, D. 2016. Seasonal ice cover and
catchment changes at northern thermokarst ponds in Nunavik: Observations from
automated time-lapse cameras, v. 1.0 (2014-2015). Nordicana D24. doi: 10.5885/45418AD-
AF6A8064C702444B.
Prairie, Y., Breton, J., Vallières, C., Laurion, I., 2009. Limnological properties of permafrost thaw
ponds in northeastern Canada. Can. J. Fish. Aquat. Sci. 66, 1635–1648. doi:10.1139/F09-
108
Przytulska, A., Comte, J., Crevecoeur, S., Lovejoy, C., Laurion, I., Vincent, W.F., 2015.
Phototrophic pigment diversity and picophytoplankton abundance in permafrost thaw lakes,
Biogeosciences Discussions. doi:10.5194/bgd-12-12121-2015
Rozanski, K, Araguas-Araguas, L, Gonfiantini, R., 1993. Isotope patterns in modern global
precipitation. Science (80-.). 258, 981–985.
Saulnier-Talbot, É., Leng, M.J., Pienitz, R., 2007. Recent climate and stable isotopes in modern
surface waters of northernmost Ungava Peninsula, Canada. Can. J. Earth Sci. 44, 171–
180. doi:10.1139/e06-089
Steinman, B.A., Abbott, M.B., Nelson, D.B., Stansell, N.D., Finney, B.P., Bain, D.J., Rosenmeier,
M.F., 2013. Isotopic and hydrologic responses of small, closed lakes to climate variability:
Comparison of measured and modeled lake level and sediment core oxygen isotope
records. Geochim. Cosmochim. Acta 105, 455–471. doi:10.1016/j.gca.2012.11.026
Thornthwaite, C.,1948. An approach toward a rational classification of climate. The
Geographical Review, 38, 1–94.
Tondu, J.M.E., Turner, K.W., Wolfe, B.B., Hall, R.I., Edwards, T.W.D., McDonald, I., 2013. Using
water isotope tracers to develop the hydrological component of a long-term aquatic
ecosystem monitoring program for a northern lake-rich landscape. Arctic, Antarct. Alp. Res.
45, 594–614. doi:10.1657/1938-4246-45.4.594
Turner, K.W., Wolfe, B.B., Edwards, T.W.D., 2010. Characterizing the role of hydrological

6
processes on lake water balances in the Old Crow Flats, Yukon Territory, Canada, using
water isotope tracers. J. Hydrol. 386, 103–117. doi:10.1016/j.jhydrol.2010.03.012
Turner, K.W., Wolfe, B.B., Edwards, T.W.D., Lantz, T.C., Hall, R.I., Larocque, G., 2014. Controls
on water balance of shallow thermokarst lakes and their relations with catchment
characteristics: A multi-year, landscape-scale assessment based on water isotope tracers
and remote sensing in Old Crow Flats, Yukon (Canada). Glob. Chang. Biol. 1585–1603.
doi:10.1111/gcb.12465
Watanabe, S., Laurion, I., Chokmani, K., Pienitz, R., Vincent, W.F., 2011. Optical diversity of
thaw ponds in discontinuous permafrost: A model system for water color analysis. J.
Geophys. Res. Biogeosciences 116, 1–17. doi:10.1029/2010JG001380
Wik, M., Varner, R.K., Anthony, K.W., MacIntyre, S., Bastviken, D., 2016. Climate-sensitive
northern lakes and ponds are critical components of methane release. Nat. Geosci.
advance on. doi:10.1038/ngeo2578
Wolfe, B.B., Light, E.M., Macrae, M.L., Hall, R.I., Eichel, K., Jasechko, S., White, J., Fishback,
L., Edwards, T.W.D., 2011. Divergent hydrological responses to 20th century climate
change in shallow tundra ponds, western Hudson Bay Lowlands. Geophys. Res. Lett. 38,
1–6. doi:10.1029/2011GL049766
Yi, Y., Brock, B.E., Falcone, M.D., Wolfe, B.B., Edwards, T.W.D., 2008. A coupled isotope tracer
method to characterize input water to lakes. J. Hydrol. 350, 1–13.
doi:10.1016/j.jhydrol.2007.11.008

7
Fig. 1 Geographic location of the Nunavik sampling sites. Permafrost distribution was taken from
Allard and Lemay (2012).

8
Fig. 2 Thermokarst lakes in Nunavik along north–south latitudinal, vegetation and permafrost gradients.
BGR NAS
SAS KWK
No
rth
Um
iuja
q
Sou
th W
-K
Dis
co
ntin
uo
us p
erm
afr
ost
Fo
rest-
tun
dra
Sp
ora
dic
perm
afr
ost
Bore
al fo
rest

9
Fig. 3 Isotope
compositions of snow, rain and permafrost relative to GMWL (D = 8180 + 10, Craig 1961).
Fig. 4 Isotope frameworks for Nunavik lakes based on 3-year mean values of SSL and *. The
two predicted LELs (W-K and Umiujaq) are anchored at p, calculated from data presented in Table 5.

10
Fig. 5 Isotope composition of lakes sampled in 2012 (square), 2013 (circle) and 2014 (triangle) for each site a) NAS, b) BGR, c) KWK and d) SAS, superimposed on the 3-year mean W-K isotope framework (Fig. 4). The red diamond on the GMWL is the mean permafrost isotope
composition (-14.20 ‰ for 18O, -103.59 ‰ for D), and the yellow diamond represents the
mean summer rain isotope composition (-12.77 ‰ for 18O, -92.16 ‰ for D).

11
1
Fig. 6 Distribution of I values for lakes sampled in 2013 (circle) and 2014 (triangle) for each site a) NAS, b) BGR, c) KWK and d) SAS. Isotope ranges for rain (yellow line) and permafrost (red

2
line) are also shown. These ranges lie on the GMWL (Fig. 3), but are offset here for graphic purposes only.

3
Fig. 7 Calculated E/I ratios for all lakes in 2013 (circle) and 2014 (triangle). Vertical and
horizontal arrows illustrate gradient in permafrost degradation and water loss through evaporation, respectively.

1
Table 1. Examples of recent studies incorporating stable isotope mass balance of thermokarst
lakes, including present study.
Study Data
Location/landscape
Key results
1. Anderson et al., 2013
remote imagery /
18
Olake water / hydroclimatic parameters
Yukon Flats (Alaska, USA) / discontinuous permafrost
1. Rainfall, snowfall, river and groundwater are the water sources for most YF lakes; some lakes are sourced by snowmelt and/or permafrost thaw. 2. Lake reductions are due to moisture deficits and greater evaporation.
2. Bouchard et al., 2013
18
Olake water and 18
Ocellulose / lake surface sediments / catchment vegetation gradient
Old Crow Flats (Yukon, Canada) Hudson Bay Lowlands (Manitoba, Canada) / continuous permafrost
1. Shallow lakes located in low-relief, open tundra terrain are susceptible to desiccation by evaporation when snowmelt runoff is low. 2. Recent extremely dry conditions may be unprecedented in the past ~200 years.
3. Gibson et al., 2015
18
Olake water and Dlake water / land cover distribution / lake and watershed area
Northeastern Alberta (Canada) / continuous and discontinuous permafrost
1. Bog cover and permafrost thaw are dominant hydrologic drivers. 2. Thawing of permafrost is a main driver of differences in the hydrologic conditions between study sites.
4. Turner et al., 2014
18
Olake water and Dlake water / land cover distribution
Old Crow Flats (Yukon, Canada) / continuous permafrost
1. Lake hydrological conditions are strongly influenced by catchment vegetation and physiography. 2. Future lake hydrological responses are varied.
5. Wolfe et al., 2011 18
Olake water and 18
Ocellulose / lake sediment cores
Hudson Bay Lowlands (Manitoba, Canada) / continuous permafrost
1. Diverse hydrological responses of shallow lakes to 20
th century
climate change. 2. Hydrological connectivity is key feature influencing lake hydrological response.
6. This study
18Olake water and Dlake water
Nunavik (Québec, Canada) / continuous, discontinuous and sporadic permafrost
1. Rainfall and/or permafrost thaw are principal lake water input sources 2. Maritime climate suppresses evaporative lake-level drawdown.

2
Table 2. Meteorological data for 1960-2014 (i.e., long-term mean) and the three-year sampling
period from the station at Whapmagoostui-Kuujjuarapik (W-K) airport (Environment Canada, 2015).
Year Temperature
(°C) Rain (mm)
Snow (mm)*
Total precipitation (mm)
Relative humidity (%)
1960-2014 -5.6 405.2 234.0 633.2 W-K Umiujaq**
2012 -2.3 476.3 201.3 678.3 80.4 79.5
2013 -3.1 391.6 247.1 642.1 79.4 77.2
2014 -3.4 575.2 228.0 803.2 77.2 77.9
* Snow water equivalent **Umiujaq airport (Environment Canada, 2015)
Table 3. Water isotope data from precipitation collected at CEN station in W-K. The date format
is DD/MM/YY where two-digit numeric codes are provided for days, months and years, respectively.
Date Precipitation 18
O (‰ VSMOW) D (‰ VSMOW)
09/09/13 Rain -13.8 -102.0
13/10/13 Rain -11.0 -80.6
19/10/13 Rain -10.8 -79.3
01/11/13 Snow -9.9 -67.0
17/11/13 Snow -16.5 -119.0
09/12/13 Snow -15.9 -107.8
13/12/13 Snow -20.9 -142.1
25/12/13 Snow -17.5 -123.7
06/01/14 Snow -24.5 -180.0
13/01/14 Snow -32.4 -247.1
23/01/14 Snow -39.3 -295.4
05/02/14 Snow -33.4 -256.1
12/02/14 Snow -32.0 -248.4
21/02/14 Snow -26.2 -206.0
18/02/14 Snow -33.3 -256.0
19/02/14 Snow -28.5 -222.4
07/03/14 Snow -27.8 -210.0
30/04/14 Snow -13.5 -99.5
09/05/14 Rain -15.8 -122.4
10/05/14 Rain -14.3 -112.0
01/07/14 Rain -13.3 -99.0
02/07/14 Rain -13.3 -99.1
03/07/14 Rain -13.2 -99.4
01/08/14 Rain -13.7 -98.8
02/08/14 Rain -13.6 -100.1
13/08/14 Rain -12.4 -96.4
25/08/14 Rain -11.4 -78.3
26/08/14 Rain -11.3 -77.8
27/08/14 Rain -7.9 -62.3
Mean Rain -12.5 -93.4
Mean Snow -25.6 -185.6
3
p -17.1 -126.8
Table 4. Water isotope data from permafrost meltwater obtained from permafrost cores at SAS and BGR.
Permafrost sample Depth (cm) 18
O (‰ VSMOW) D (‰ VSMOW)
BGR-A 72 - 76 -15.8 -113.3
BGR-A 86 - 91 -17.3 -123.9
BGR-A 110 - 115 -17.2 -122.9
BGR-A 207 - 212 -16.2 -115.9
BGR-A 258 - 263 -15.5 -111.5
BGR-A 305 - 311 -15.3 -110.3
BGR-B 87 - 93 -15.7 -112.2
BGR-B 101 - 107 -16.0 -113.5
BGR-B 107 - 111 -16.0 -111.8
BGR-B 117 - 123 -15.7 -111.9
BGR-B 140 - 146 -15.9 -115.2
BGR-B 154 - 159 -16.5 -117.9
BGR-B 185 - 191 -15.4 -109.7
BGR-B 237 - 243 -15.4 -109.8
BGR-B 275 - 280 -15.1 -108.9
SAS-A 74 - 78 -12.2 -86.9
SAS-A 100 - 106 -12.0 -86.9
SAS-A 144 - 150 -11.2 -84.5
SAS-A 198 - 204 -11.9 -87.6
SAS-A 274 - 280 -12.6 -94.7
SAS-B 72 - 77 -11.2 -82.3
SAS-B 88 - 93 -11.0 -81.4
SAS-B 110 - 115 -11.1 -82.6
SAS-B 160 - 165 -11.9 -87.2
SAS-B 210 - 215 -12.9 -94.5
SAS-B 292 - 297 -12.9 -94.7
Mean -14.2 -102.8
1
Table 5. a) Flux-weighted temperature and relative humidity from June to September 2012, 2013 and 2014, based on calculation of
potential evaporation using Thornthwaite (1948), and using data from the meteorological stations at W-K and Umiujaq airports (Environment Canada, 2015). b) Measured and calculated parameters used to develop the isotopic framework.
a)
b)
Temperature (°C) Relative Humidity (%)
W-K Umiujaq W-K Umiujaq
2012 11.5 10.7 80.4 79.5
2013 10.0 8.8 79.4 77.3
2014 11.4 10.3 77.2 77.9
2012 2013 2014 Mean
Parameter W-K Umiujaq W-K Umiujaq W-K Umiujaq W-K Umiujaq Equation
T (K) 284.7 283.8 283.2 281.9 284.6 283.5 284. 2 283.1
h (%) 80.4 79.5 79.4 77.2 77.2 77.9 79.0 78.2
α* (18
O, D) 1.0106, 1.0948 1.0107, 1.0960 1.0107, 1,0969 1.0108, 1.0986 1.0106, 1.0951 1.0107, 1.0965 1.0106, 1.0954 1.0107, 1.0968 (A2, A3)
ε* (18
O, D) 10.6, 94.9 10.7, 96.1 10.7, 96.9 10.9, 98.6 10.6, 95.1 10.7, 96.5 10. 6, 95.6 10.7, 97.1 (A4)
εK (18
O, D) 2.8, 2.5 2.9, 2.6 2.9, 2.6 3.2, 2.8 3.3, 2.9 3.1, 2.8 3, 2.7 3.1, 2.7 (A5, A6)
AS (18
O, D) -23.1, -175.1 -23.2, -175.7 -23.3, -176.3 -23.4, -177.2 -23.2, -175.2 -23.3, -176.0 -23.2, -175.5 -23.3, -176.3 (A7)
SSL (18
O, D) -8.8, -84.1 -8.7, -83.2 -8.6, -82.7 -8.1, -80.7 -8.2, -81.9 -8.3, -81.9 -8.5, -82.9 -8.4, -81.9 (A1)
* (18
O, D) -6.7, -72.2 -6.5, -70.6 -6.3, -69.6 -5.4, -65.0 -5.5, -66.8 -5.7, -67.2 -6.2, -69.5 -5.9, -67.6 (A8)
P (18
O, D) -17.1, -126.8 -17.1, -126.8 -17.1, -126.8 -17.1, -126.8 -17.1, -126.8 -17.1, -126.8 -17.1, -126.8 -17.1, -126.8 Table 3

1
HIGHLIGHTS:
- Water isotopes are used to characterize thermokarst lake hydrology in Nunavik, Canada.
- Rainfall and/or permafrost meltwater are the main lake water sources.
- Maritime climate enhances the hydrological resiliency of thermokarst lakes.
- Terrestrial carbon inputs from surface runoff are likely to increase in the future.
- Thermokarst lakes will persist and methane emissions are likely to increase.


![[Hydrology] Groundwater Hydrology - David K. Todd (2005)](https://img.dokumen.tips/doc/110x75/548ce7beb47959e2288b45f9/hydrology-groundwater-hydrology-david-k-todd-2005.jpg)


![[hydrology] groundwater hydrology - david k. todd (2005).pdf](https://img.dokumen.tips/doc/110x75/577c77961a28abe0548cb0b1/hydrology-groundwater-hydrology-david-k-todd-2005pdf.jpg)
![[Hydrology] groundwater hydrology david k. todd (2005)](https://img.dokumen.tips/doc/110x75/55a8e6001a28ab6c2f8b4687/hydrology-groundwater-hydrology-david-k-todd-2005-55b0d9a792c06.jpg)