Embed Size (px)
Citation preview

Andrew TaylorManaging Director
Cape Advanced Engineering (Pty) Ltd
Landfill2015
Bio-gas power generationin the South African context
Overview of RE and bio-gas
in South Africa
• the SA reality w.r.t. electricity demand and capacity
• the 2003 Renewable Energy White Paper
• the NERSA REFIT programme
• the DOE REIPP programme – for wind and solar
• the cost of wind and solar power in SA
• bio-gas power in Germany
• bio-gas & landfill gas in South Africa
• the opportunity for bio-gas in South Africa
September 2015Conference & Exhibition Landfill2015

The South African Realityfrom the 2003 RE White Paper
September 2015Conference & Exhibition Landfill2015

The South African RealitySummer vs winter demand profile
September 2015Conference & Exhibition Landfill2015

The South African RealityTypical winter profile - 2015
September 2015Conference & Exhibition Landfill2015

The 2003 RE White Paper• an Energy Policy is a Constitutional requirement !
• the stated problems problems not emphasised
– coal dependence - water issues ?
– greenhouse gasses - unemployment ?
– energy security - food cost & food security ?
• acknowledged “local entrepreneurship & innovativeness”
• 10-year target “10 000 GW.hr generated by 2013” and 1.7
GW operational in 2013.
• “early win” targets included bio-mass combustion (sugar
and wood) and solar water heating
• bio-mass was prominent (combustion prominent ?)
• technology development ! September 2015Conference & Exhibition Landfill2015

the NERSA REFIT programme• 2nd quarter 2009 REFIT I announced
• 4th quarter 2009 REFIT II announced – incl. bio-gas
• 31 December 2009 – REFIT Gazetted
but without any provision for bio-gas ?
• 1st quarter of 2011 – REFIT disbanded
• August 2011 – REIPPP initiated
• 5 November 2012 – Financial closure on 1st round of
wind and solar projects
September 2015Conference & Exhibition Landfill2015

the DOE REIPPP Round 1• RSA REIPPP programme involved 28 projects
• 1,416 MW for a total investment of US$ 5.97 billion
• 18 PV technology – installed capacity of 632 MW
• 2 CSP technology – installed capacity of 150 MW
• 8 wind technology – installed capacity of 634 MW
• average cost of each project = R 2.763 billion per
project
• average cost of installed capacity = R 54.6 million per
MW installed
September 2015Conference & Exhibition Landfill2015
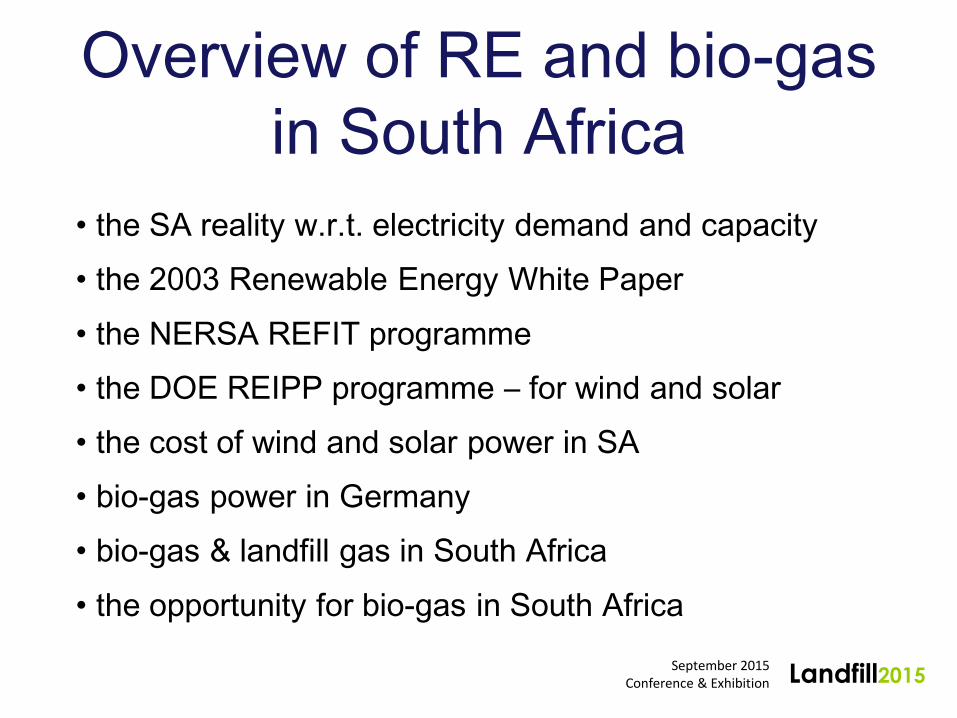
the DOE REIPPP Round 1• average cost of installed capacity = R 54.6 million per
MW installed
• if solar PV projects yield of 20% of installed capacity,
and if wind projects yield of 30%
• then average yield of round 1 ~ 24.5%
• then actual cost of solar PV & wind = R223 million per
MW generated (effective capacity)
September 2015Conference & Exhibition Landfill2015

bio-gas power in Germany
September 2015Conference & Exhibition Landfill2015

bio-gas power in Europe (2013)
September 2015Conference & Exhibition Landfill2015

RE in Germany
September 2015Conference & Exhibition Landfill2015

RE in Germany (2012)
September 2015Conference & Exhibition Landfill2015

RE in Germany
September 2015Conference & Exhibition Landfill2015
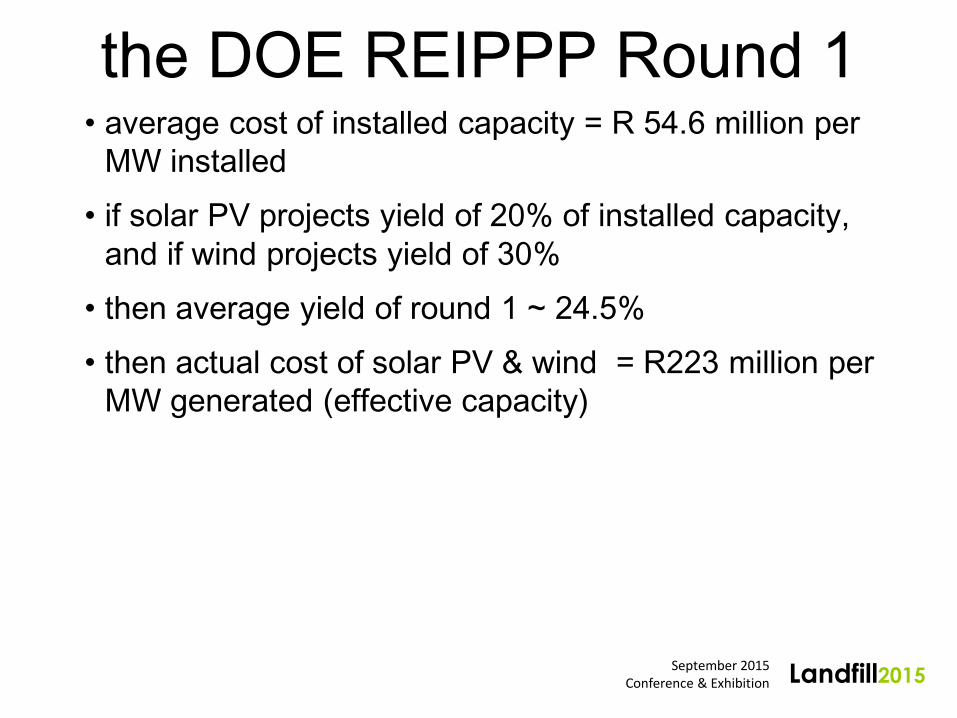
bio-gas & landfill gas in SA
• projects denied access to the national grid – REIPPP
• Durban landfill project – highly successful
• Johannnesburg Water – bio-gas from sewerage
• City of Windhoek – operational
• CAE Darling project – technical success @ <50%
utilisation
• Proven capital cost
– < R20 million per MW for landfill projects R1.35 / kW.hr
– < R30 million per MW for bio-gas projects R1.65 / kW.hrSeptember 2015
Conference & Exhibition Landfill2015
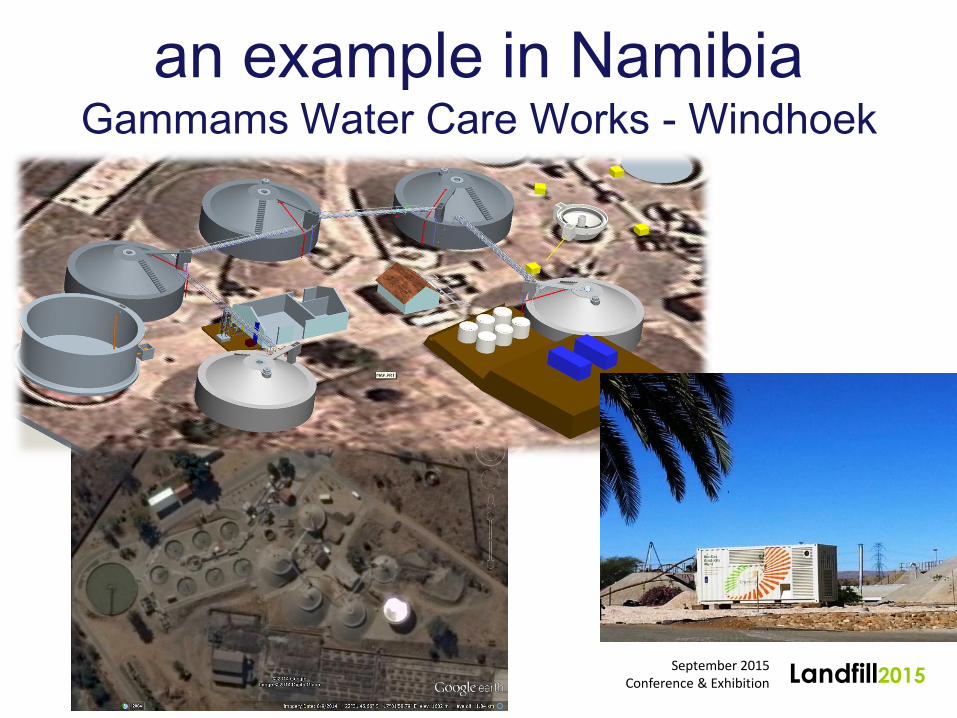
an example in NamibiaGammams Water Care Works - Windhoek
September 2015Conference & Exhibition Landfill2015

an example in NamibiaGammams Water Care Works - Windhoek
September 2015Conference & Exhibition Landfill2015

an example in Namibia
September 2015Conference & Exhibition Landfill2015

an example in NamibiaGammams Water Care Works - Windhoek
September 2015Conference & Exhibition Landfill2015

bio-gas CHP units
September 2015Conference & Exhibition Landfill2015
Developed and
Manufactured in
South Africa

bio-gas CHP units
Developed and
Manufactured in
South Africa

bio-gas CHP units
September 2015Conference & Exhibition Landfill2015
Developed and
Manufactured in
South Africa
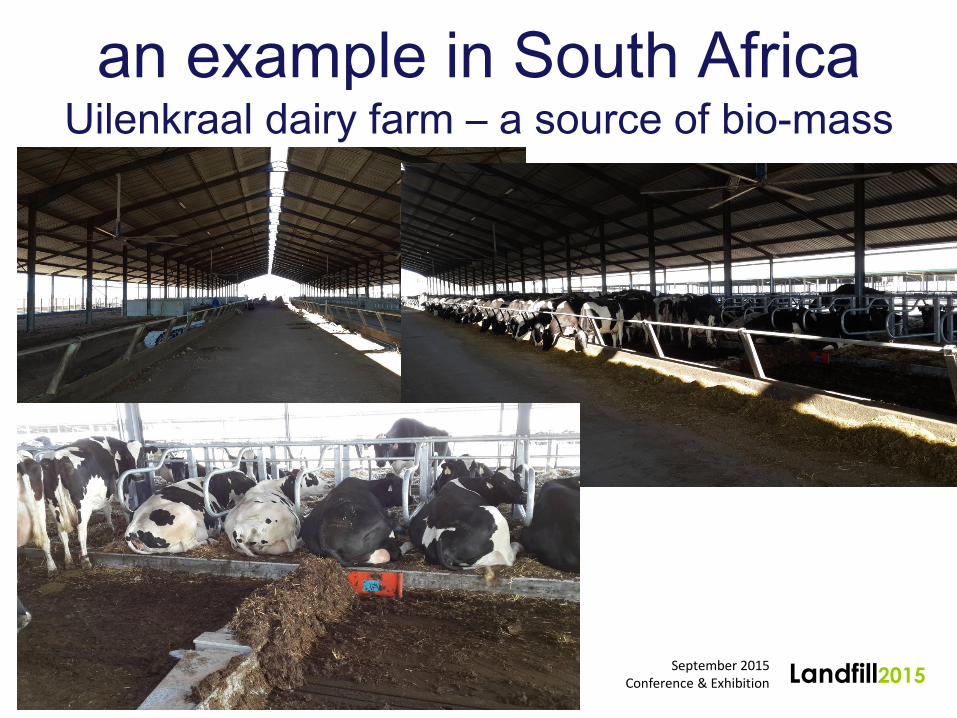
an example in South AfricaUilenkraal dairy farm – a source of bio-mass
September 2015Conference & Exhibition Landfill2015

power offtake is critical• commercial animal feed mill
September 2015Conference & Exhibition Landfill2015

local technology and design
September 2015Conference & Exhibition Landfill2015
Developed and
Manufactured in
South Africa
• Hybrid, mixed and heated plug flow
• Locally built bio-gas engines

bio-digester construction

The bio-gas & fertiliser plant

Anaerobic
bio-digester
Manure & waste
water mixing
Scraped manure collection Bio-Gas Generator (CHP)
Liquid bio-fertiliser storage
for land applicationSolids separator
FlareHeat to bio-
digester
Biogas to
generator
Biogas
to Flare
Electricity
Out
Bio-fertiliser
outCattle bedding
or bio-fertiliser
Solids
Liquid
Manure
& waste water slurry
in
Process heat out
for food processing
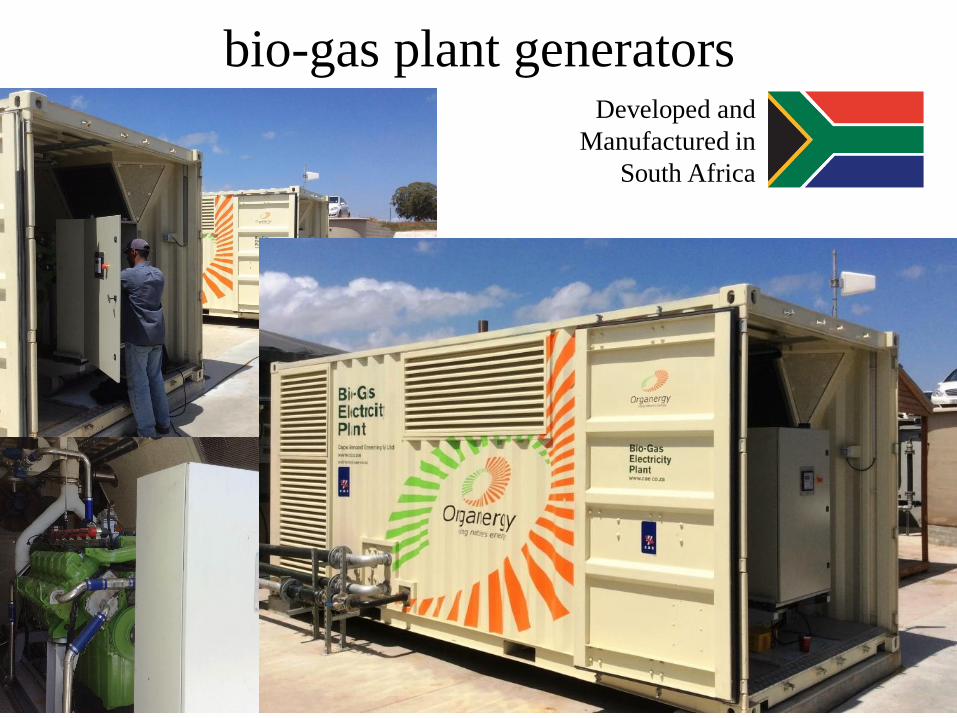
bio-gas plant generatorsDeveloped and
Manufactured in
South Africa

bio-gas plant generators

bio-gas plant electrical systems
Developed and
Manufactured in
South Africa

September 2015Conference & Exhibition Landfill2015
Jan and Feb 2015 – 2 generatorsNB: min. set to 5 kW, peak hourly demand = 406 kW (briefly 455 kW)
0
50
100
150
200
250
300
350
400
1 2 3 4 5 6 7 8 9 10 11 12 13 14 15 16 17 18 19 20 21 22 23 24
Po
we
r [k
W]
Time of Day
Uilenkraal Bio-Gas January and February
V12007 V12008 Eskom Bio-Gas TOTAL

bio-fertiliser – solid & liquid

the opportunity for bio-gas in SA
• piggeries – assume all pork is produced in modern pull-
plug piggery housing (23 MW)
• dairies – assume all dairies adopt TMR operations (125
MW)
• beef – assume all animals are finished in feedlots (56
MW)
• Total = 204 MW
September 2015Conference & Exhibition Landfill2015
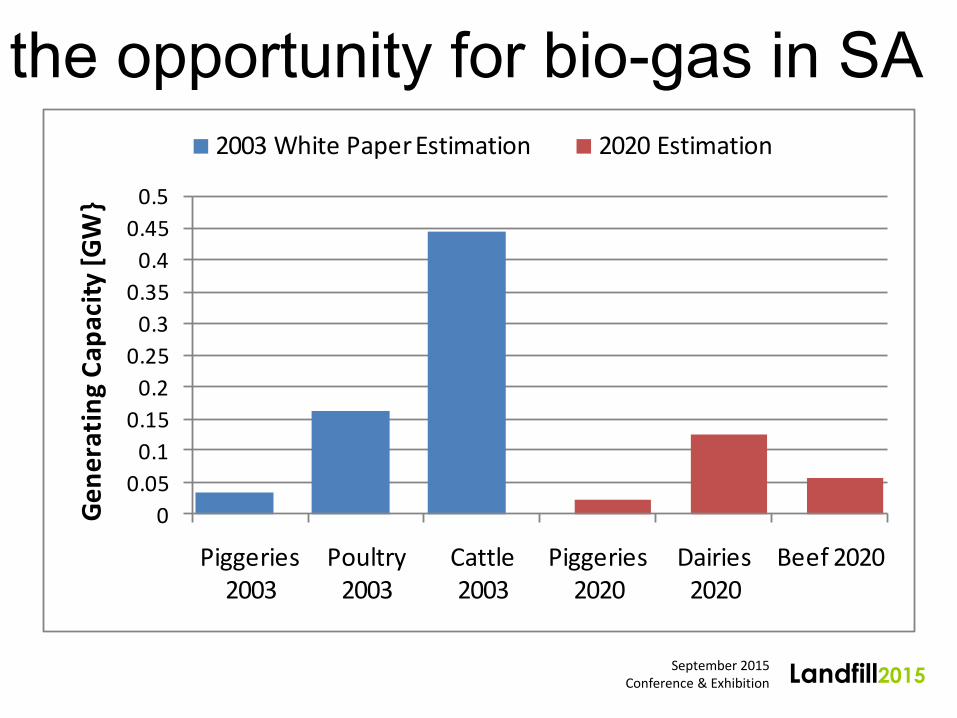
the opportunity for bio-gas in SA
September 2015Conference & Exhibition Landfill2015
0
0.05
0.1
0.15
0.2
0.25
0.3
0.35
0.4
0.45
0.5
Piggeries 2003
Poultry 2003
Cattle 2003
Piggeries 2020
Dairies 2020
Beef 2020
Ge
ne
rati
ng
Cap
acit
y [G
W}
2003 White Paper Estimation 2020 Estimation
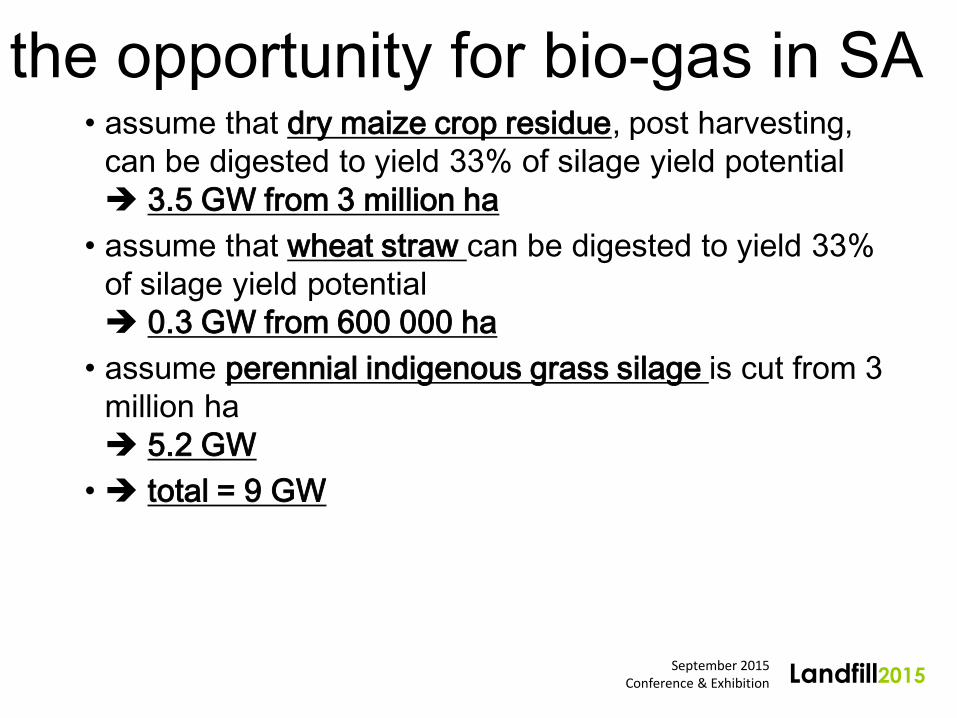
the opportunity for bio-gas in SA• assume that dry maize crop residue, post harvesting,
can be digested to yield 33% of silage yield potential
3.5 GW from 3 million ha
• assume that wheat straw can be digested to yield 33%
of silage yield potential
0.3 GW from 600 000 ha
• assume perennial indigenous grass silage is cut from 3
million ha
5.2 GW
• total = 9 GW
September 2015Conference & Exhibition Landfill2015

the opportunity for bio-gas in SA
September 2015Conference & Exhibition Landfill2015
0
1
2
3
4
5
6
Ge
ne
rati
ng
Cap
acit
y [G
W}
2003 White Paper Estimation 2020 Estimation

Landfill2015
Thank you for your attention. Any questions?
Andrew TaylorManaging Director
Cape Advanced Engineering (Pty) Ltd