Embed Size (px)
Citation preview

Land Value Capture Potential of the Lisbon Subway: Estimation and Integration with the Current Fiscal System
MARTINEZ, Luis Miguel; VIEGAS, José Manuel
12th WCTR, July 11-15, 2010 – Lisbon, Portugal
1
LAND VALUE CAPTURE POTENTIAL OF THE LISBON SUBWAY: ESTIMATION AND INTEGRATION
WITH THE CURRENT FISCAL SYSTEM
L. Miguel Martínez, CESUR, Department of Civil Engineering, Instituto Superior Técnico, Technical University of Lisbon ([email protected])
José Manuel Viegas, CESUR, Department of Civil Engineering, Instituto Superior Técnico, Technical University of Lisbon ([email protected])
ABSTRACT
The aim of this paper is to estimate the value capture potential of the Lisbon subway (Metro)
and examine its integration with the current fiscal system in order to develop a new financing
scheme for the infrastructure development. This study was developed for the Lisbon
Metropolitan Area (LMA) as part of a broader study that intends to develop new land value
capture financing schemes for public transportation in the LMA. The paper focuses on the
municipality of Lisbon where the subway system mainly operates, although new
developments of the system reach other municipalities (Amadora and Odivelas).
The paper tries to measure, using spatial hedonic pricing models developed in previous
stages of the study, the extent to which access to transportation infrastructure currently is
capitalized into house prices market and into the commercial and offices market.
A Monte Carlo simulation procedure is used to estimate the market composition of the
residential, commercial and office sectors from the census aggregated statistical data
available at city block level, leading to an estimate of the value capture potential of the
subway in the Lisbon municipality. The potential value capture estimate is then used to
estimate an annual tax that could be charged, which is compared with the annual financial
cost of the Subway infrastructure. Finally, the estimated tax is compared with the existing
municipal land value tax in order to analyze the viability of its integration with the current
fiscal system.
The results suggest that there is a significant potential of the use of this instrument to finance
the Subway infrastructure.
Keywords: Value Capture, Transport Financing, Fiscal Simulation, real estate, hedonic price
models, Lisbon’ subway.

Land Value Capture Potential of the Lisbon Subway: Estimation and Integration with the Current Fiscal System
MARTINEZ, Luis Miguel; VIEGAS, José Manuel
12th WCTR, July 11-15, 2010 – Lisbon, Portugal
2
INTRODUCTION
Most of the cities across the world are facing today the challenge of financing public
transport. For several decades now, Urban Public Transport (UPT) has been unable to
collect from its clients revenues enough to cover its production costs. The fact that this is
seen as an indispensable service in all medium and large cities, accompanied by the
operating constraints and the multiple, partially conflicting, objectives under which it
performs, have largely prevented radical political moves to force the sector to operate at
levels of cost coverage more in line with the normal market economy (Viegas, 2005).
In parallel with these financial difficulties, the service provided by UPT, even with younger
fleets and more comfortable vehicles, has not been attractive enough to resist to the higher
availability and comfort provided by the private car, and the long term market share of UPT
has been declining in all cities, with only a few recent short term exceptions. So, the
financing problem of UPT, partly explained by this loss of competitiveness and patronage, is
accompanied by a problem of generally low quality and sustainability of Urban Mobility
(Viegas, 2005).
Simultaneously, accessibility to desired destinations tends to play a major role in location
decisions of activities as well as in households residential location, which uplifts value of land
in highly accessible locations. The monetary value of this accessibility is reflected in the
value of a home or a business, in addition to the value of other features such as the specific
physical attributes of the building and neighbourhood characteristics (Lari, Levinson et al.,
2009).
Value capture then arises as the process whereby a funding agency (e.g. the city, the region
or the state) attempts to recover a share of the value added to property resulting from any
infrastructure development (Hass-Klau, 2006).
This paper examines the value capture potential of the Lisbon‟s Subway and looks at its
integration with the current fiscal system in order to develop a new financing scheme for the
infrastructure development. The paper focuses on the municipality of Lisbon were the
subway system mainly operates, although new developments of the system reach other
municipalities (Amadora and Odivelas).
This study uses a Monte Carlo simulation procedure in order to estimate the market
composition of the residential, commercial and offices sectors from the aggregated statistical
data available at city block level, leading to an estimate of the value capture potential of the
subway in the Lisbon municipality. The potential value capture estimate is then analyzed in
order to extract an annual tax for dwellings and commercial areas that could be charged as a
Special Assessment (SA) tax. This annual potential revenue is compared with the annual
financial cost of the subway infrastructure development, allowing a first insight on the value
capture impact on the financial infrastructure development. Finally, the estimated tax is

Land Value Capture Potential of the Lisbon Subway: Estimation and Integration with the Current Fiscal System
MARTINEZ, Luis Miguel; VIEGAS, José Manuel
12th WCTR, July 11-15, 2010 – Lisbon, Portugal
3
compared with the existing municipal Land Value Tax (LVT) in order to analyze the viability
of its integration with the current fiscal system.
LITERATURE REVIEW
The funding of transport projects in most developed countries has become increasingly
complex since the Second World War. In the early post-war period transport infrastructure
projects were primarily funded through national government, with contributions sought by
users either directly or indirectly (e.g. fares, petrol taxes, vehicle registration duty etc). The
focus of such investment was more inclined to road and airport schemes, rather than railway
and non-mechanized forms of transport (GVA Grimley, 2004).
Over the last 20 years there has been an increasing shift towards deregulation of public
transport, allied with encouragement of private sector involvement in transport project
funding, and indeed, even design, construction and operation (Vivier, 1999; Worsey, 2000).
The main forms of direct private sector involvement in terms of funding transport schemes
has been through PFI/PPP contracts, Design, Build, Finance and Operate (DBFO) contracts,
and direct equity funding. In addition, support can be gained from government for the
promoters of schemes through grants, as well as from the European Union, as well as other
funding streams set up by the European Commission (Faber, 2000).
In addition, the private sector can be involved in funding transport measures through various
indirect methods (Lichfield and Connellan, 2000; Hack, 2002). This includes:
Statutory undertakers providing infrastructure (e.g. water and sewerage) and passing
these costs on to the developer, who in turn may pass them on to the eventual
consumer of the property or to the selling landlord.
Environmental and public health factors can require infrastructure to be funded on the
basis of the polluter pays principle. In other words, developers may be required to
provide new infrastructure to ameliorate adverse impacts of a development.
Related to this is the imposition, as part of planning permission approval, to seek
new, but related, infrastructure, such as road improvements.
Public investment in transportation infrastructure is under pressure due to the increasing
financial needs for other social obligations of Governments, which have looked to various
alternative sources of funding to supplement government financing for transport, or even
replace it (Berry and Sims, 1999; Simon, 1999; Godier, 2002; Ubbels and Nijkamp, 2002).
Under this context, some public transport alternative funding methods that have been
introduced in some countries. Some of the alternative methods are focused on the
implementation of a land value capture mechanism, which can be addressed with different
approaches.

Land Value Capture Potential of the Lisbon Subway: Estimation and Integration with the Current Fiscal System
MARTINEZ, Luis Miguel; VIEGAS, José Manuel
12th WCTR, July 11-15, 2010 – Lisbon, Portugal
4
A number of published studies have investigated the concept of value capture to fund transit
considering that property values enhancements were only within public transport corridors
(i.e. within about 500 meters of a public transport stop or station, that is, the distance that
people are typically willing to walk). Borhart (1994) states that this perspective
underestimates the full impact. A greater capital improvements revenue base would be
available to transit agencies if rising land values within an entire region were appropriated
through a general land-based property tax.
There are many examples of potential or successful land value capture to fund transit like
Hong Kong‟s land leasing mechanism (Hong, 1996). Rybeck (2004) has also estimated the
added land values sequential to the development of Washington D.C.‟s Metro, and found a
surplus of incremental value that could be charged. Riley (2001) found that the Jubilee Line
extension of the London tube had generated surplus values enough to finance all the
infrastructure costs.
A substantial portion of the capital costs associated with constructing public transit facilities is
land acquisition. This cost could be effectively reduced if ground rents were collected. That
is, when the public sector captures incremental land values through the general property tax
and through special levies on land holdings in transit corridors, less value remains for private
owners to capitalize into price. This dampening of land prices helps to reduce land
acquisition costs (Smith and Gihring, 2006).
Other possible revenue sources include joint-development, and the leasing of sites near
stations (Urban Land Institute and Associates, 1979; Roeseler and Vondosky, 1991;
Scheurer, Newman et al., 2000). This can provide a direct source of income towards the
installation of the service while guaranteeing superior accessibility and a certain volume of
potential customers frequenting the site (Scheurer, Newman et al., 2000). It also assures
some degree of ridership for the transport project.
In the past, private developers often built transit systems to urban fringe neighborhoods and
recouped the capital costs from the sales of developed sites (i.e. Japan) (Tsukada and
Kuranami, 1990). Such profits from land residuals are commonplace in the private sector, but
could reasonably be extended to the public domain, where local government covers the
financial risk and the cost of building transit systems.
Cervero, et. al. (2004) conclude that a central element of joint-development is the profit
sharing between private developers, benefiting from transit accessibility capitalized into
higher rents and occupancy rates, and transit agencies, whose capital funding is enhanced
through cost sharing mechanisms.
Localities can also adopt other forms of green taxation such as congestion pricing and
vehicle emission permit fees to help fund transit systems. For example, London recently
introduced a congestion charge for driving downtown, and many cities use parking revenue
to help fund local transportation services (Glaister and Graham, 2005).

Land Value Capture Potential of the Lisbon Subway: Estimation and Integration with the Current Fiscal System
MARTINEZ, Luis Miguel; VIEGAS, José Manuel
12th WCTR, July 11-15, 2010 – Lisbon, Portugal
5
To date, most studies of value capture financing for transit focus on cities in developed
countries, where low density development and auto-dependency predominate. Studies have
begun to emerge from developing countries, where denser cities and a more even modal
split can be found, like Jakarta (Cervero and Susantono, 1999), Bogota (Rodriguez and
Targa, 2004), Uruguay (Prest, 1969), and studies for several developing countries at once
(Tsukada and Kuranami, 1990; Nakagawa and Matsunaka, 1997). Some of these authors
have noted that while progressive legislation may exist, the practical means of capturing site
values for transit projects is hampered by inadequate land registration records and lagging
assessments.
Table I presents a summary of value capture techniques that have been applied in some
countries, were the main advantages and disadvantages of each mechanism is analyzed
based on a RICS report about London‟s transport funding (GVA Grimley, 2004) among other
studies.
Table I – Innovative funding methods for transport infrastructure
Funding Method
Focus Funding Source
Advantaged Disadvantages
Land Value Taxation
(LVT)/Site Value Rating
Beneficiary pays
Land/Property Property-related
taxes
Encourages appropriate development. Landowners who see a fall in value are
compensated
Regular valuations required. Initial data collection. Requires
primary legislation
Case Studies: Most general type of value capture policy applied widely around the world for
general public goods provision (variations: split rate property tax) (Lari, Levinson et al., 2009)
Tax Incremental Financing
(TIF)/LRTP
Development based
Beneficiary pays
Land/Property Property-related
taxes
Defers payment from businesses. Can stimulate
new development. Does not require primary legislation
Cannot guarantee development. Funding can also be slow to
come forward
Case Studies: Widespread adoption in many US states. In Chicago, TIF districts have been
established to support the construction of subway/elevated stations near the CBD (McGreal, Berry et al., 2002). Portland, Oregon has also promoted TIF districts to support the streetcar and light rail development (Dueker and Bianco, 1999). Adoption in other cities for urban regeneration processes not related to transport (e.g. Dublin) (McGreal, Berry et al., 2002)
Special Assessments (SA)/Business Improvement
Districts (BIDs)
Development based
Beneficiary Pays
Land/Property Property-related
taxes
Does not require primary legislation. Can increase public-private cooperation
Difficult boundary definition and business inclusion. Payment
levels can be difficult to structure. Seen as an extra tax
Case Studies: Created in the United States and Canada (Hass-Klau, 2006). In Los Angeles a
variation of this tax knows as „Special Assessment Districts‟ was introduced. This tax feeds a share of the increase in property values associated with a newly established rail line on sites typically within 400-800 m of the stations back into funding the transit system (Doherty, 2004)
Transportation Utility Fees
Beneficiary Pays
Transportation seen as a
utility/Transport demand related
Potentially efficient to finance local transport by
shifting cost burden to residents and commercial and industrial properties. Stable source of funding
Regular valuations required based on trip generation rates
for different properties (e.g. Trip Generation Handbook). Initial
data collection. Requires primary legislation
Case Studies: US examples in Colorado, Oregon, and Texas (Lari, Levinson et al., 2009)
Development Impact Fees
Beneficiary Pays
One time charges
Improve efficiency in resource allocation in local
governments
Narrow revenue capabilities. Problems with the ability-to-pay
in low income locations
Case Studies: There are several examples throughout the US, especially in fast growing areas
such as California, Florida and Texas (Doherty, 2004)

Land Value Capture Potential of the Lisbon Subway: Estimation and Integration with the Current Fiscal System
MARTINEZ, Luis Miguel; VIEGAS, José Manuel
12th WCTR, July 11-15, 2010 – Lisbon, Portugal
6
Funding Method
Focus Funding Source
Advantaged Disadvantages
Joined Development
Beneficiary Pays
Land/Property Development land charges
Seen as a „proactive‟ tool in which those who are
prepared to invest see increased opportunity to
obtain benefits
May only secure relatively small levels of revenue. Would require
changes to Local Plans/UDPs
Case Studies: Applied in the spatially coincidental developments of transport facilities and
private real estate development (Lari, Levinson et al., 2009)
Business rate levy
Beneficiary Pays
Land/Property Property-related
taxes
Difficult to avoid, and business rating list is
regularly updated. Value changes are self-adjusted
changes
Tenants charged twice effectively. Payers do not see
any direct benefit in land values, unless an owner occupier
Case Studies: Applied in London Crossrail to fund the operation (Lari, Levinson et al., 2009)
Greenfield Development
Tax
Beneficiary Pays
Land/Property Property-related
taxes
Encourages development in more sustainable locations.
The tax-service the development link
May be difficult to define „Greenfield‟ sites. May
encourage development activity to other areas/regions.
Would require legislation in some form
Case Studies: Several US cities have applied this tax to control urban sprawl (GVA Grimley,
2003)
Betterment Levy/Freehold
Levy
Beneficiary Pays
Land/Property Development land charges
Charges based on sale price are easy to collect.
Concept simple to understand
Would penalize those who lost value as a result of the scheme.
Would require legislation
Case Studies: A levy on freehold property in a specific area. The levy is applied to the uplift in
property values as a one-off charge. Applied in UK cities (GVA Grimley, 2003; Lari, Levinson et al., 2009)
Planning Gain/Tariffs
Beneficiary Pays
Land/Property Development land charges
Difficult to avoid as development requires
planning consent. Relatively straightforward
and understood
Section 106 agreements would happen anyway. Restricting use of funds to transport schemes
Case Studies: This mechanism was introduced due to the lack of funds in German cities at the
end of the 1980s to pay infrastructure costs generated by the designation of urban land use (Hold, 2004). Other examples are Section 106 in the UK and the Section 94 in Australia (Hass-Klau, Crampton et al., 2004; Glaister and Graham, 2005)
Employer tax (Versement Transport)
General Taxation
Employers (value capture)
Very successful in France. Large revenues generated, and funds easily related to
transport improvements
Increases overall tax burden. Could lead to loss of
employment or activities re-location
Case Studies: In France, every employer (private or public) with more than 9 employees who is
located within the area managed by a transport authority may be asked to pay between 0.15-1.80% of its total payroll as a transport tax to the authority (Hass-Klau, 2006). This financing mechanism has been only copied in Portland (Hass-Klau, 2006)
DATA DESCRIPTION
In order to develop a simulation on the value capture potential for the Lisbon municipality a
large set of data was collected. The data requirements resulted from the spatial hedonic
pricing models developed in previous stages of the study that are used in this study to
estimate individual property value. The variables required for each property are classified into
three types: structural attributes of the properties (e.g. number of bedrooms, age and

Land Value Capture Potential of the Lisbon Subway: Estimation and Integration with the Current Fiscal System
MARTINEZ, Luis Miguel; VIEGAS, José Manuel
12th WCTR, July 11-15, 2010 – Lisbon, Portugal
7
existence of off-street parking facilities inside the property), neighbourhood attributes, which
include some indicators that characterise the vicinity of the property and measures their
influence in the property price (e.g. education level indicator, or land use mixture indicator),
and accessibility attributes that measure the influence of the proximity of different types of
transport infrastructures in property prices. These models use a semi logarithmic
specification with a spatial lag term as presented in (1). The specification of the attributes of
the models and their resulting coefficients are presented in Table II.
iin
'
n2i
'
21i
'
10)P(Lni X...XXW)P(Lni
),0(~ 2IN (1)
Table II – Summary of the hedonic price models used for property value estimation
Summary of the residential hedonic price model used for the LMA (Martínez and Viegas, 2009)
Variables Coef.
Std. Error
SP_LAG_LOGPRICE 0.3561 *** 0.0085
Constant 6.9089 *** 0.0999
Structural attributes
Bedrooms 0.0427 *** 0.0030
House 0.1685 *** 0.0154
Floor 0.0155 *** 0.0009
Area 0.0064 *** 0.0001
Age2 -0.1034 *** 0.0063
Age3 -0.0729 *** 0.0068
Garage 0.1126 *** 0.0059
Neighbourhood attributes
Educational Index1 0.4160 *** 0.0225
Entropy Index2 0.2312 *** 0.0234
Accessibility Attributes
2MAccess 0.0916 *** 0.0133
1Maccess 0.0652 *** 0.0084
Network1 -0.0732 *** 0.0069
Network2 0.0458 *** 0.0064
Network3 -0.0380 *** 0.0060
Sintra -0.0614 *** 0.0134
Cascais 0.1517 *** 0.0259
Pseudo R2 0.795
LM statistic 1154.496 ***
Log likelihood 236.608
Summary of the commercial and offices hedonic price model used for the LMA (Martínez, 2009)
Variables Coef.
Std. Error
SP_LAG_LOGPRICE 0.0394 *** 0.0088
Constant 10.2640 *** 0.1143
Structural attributes
Store 0.4147 *** 0.0446
Office 0.3892 *** 0.0530
Floor 0.0227 ** 0.0108
Area1 0.0079 *** 0.0002
Area2 0.0018 *** 0.0001
Area3 0.0005 *** 0.0001
Age2 -0.1775 *** 0.0281
Age3 -0.1560 *** 0.0263
Garage 0.1316 *** 0.0344
Neighbourhood attributes
Educational Index 0.9892 *** 0.0939
Shopping Centre 0.2308
0.1518
Accessibility Attributes
2MAccess 0.2163 *** 0.0466
1Maccess 0.0918 ** 0.0357
Network1 -0.1270 *** 0.0360
Network2 0.1029 *** 0.0302
Pseudo R2 0.760
LM statistic 19.940 ***
Log likelihood -693.486
***,
**, and
*
denote coefficient significantly different from zero at the 1%, 5%, and 10% level of significance, respectively.
1 Household income proxy indicator measured by the number of undergraduate persons/Population
over 20 years old (500 meters radius). 2 Land use mixture indicator based on Cervero, R. and K. Kockelman (1997). Travel demand and the
3Ds: Density, diversity, and design. Transportation Research Part D-Transport and Environment Vol.2, No.3, pp. 199-219. and Potoglou, D. and P. S. Kanaroglou (2008). Modelling car ownership in urban areas: a case study of Hamilton, Canada. Journal of Transport Geography Vol.16, No.1, pp. 42-54.

Land Value Capture Potential of the Lisbon Subway: Estimation and Integration with the Current Fiscal System
MARTINEZ, Luis Miguel; VIEGAS, José Manuel
12th WCTR, July 11-15, 2010 – Lisbon, Portugal
8
The data required was then collected from three data sources available:
Census data on building and dwelling characteristics at city census block level for the
characterization of the residential market.
Land use data on activities (offices, retail and warehouses) for Lisbon municipality
collected from the Portuguese Yellow Pages (http://www.pai.pt). This database
contains all the activities that present affixed phone number registered, which might
exclude some activities that rely only on mobile phone services. Nevertheless, this
sample was used to characterize the commercial, offices and warehouses market
due to the lack of better data.
A real estate cross-sectional database of 2007 from an online realtor‟s database
(Imokapa Vector) for Lisbon, Portugal. This database presents the asking price of
residential properties on sale during February of 2007 with a total of 8,742 complete
records and 1,165 complete records on commercial, offices and warehouses
properties. The real estate data contained information on their asking sale price,
structural attributes and address.
Residential Market
The census data allowed the definition of statistical distributions for the different structural
property attributes of properties inside a census block and at the same time control the total
number of properties that exist at each census block. The neighbourhood properties and the
local accessibility attributes were computed considering as reference the centroid of each
census block (normally smaller than 1 ha). In order to compute the spatial lag term it was
used the real estate data available for Lisbon city considering a 500 threshold distance as in
the model previously defined.
Commercial, Offices and Warehouses Market
The land use data available was considered as a census of all existent activities in the city,
and was used for the definition of statistical distributions for the different structural property
attributes of properties inside a census block and to control the total number of properties
that exist at each census block. The neighbourhood properties and the local accessibility
attributes were computed for each property available from the database. In order to compute
the spatial lag term it was used the real estate data available for Lisbon city considering a
500 threshold distance as in the model previously defined.
VALUE CAPTURE POTENTIAL SIMULATION MODELS
In order to estimate the value capture potential of the Lisbon‟s Subway it were developed two
simulation procedures (one for residential market and other for commerce, offices and

Land Value Capture Potential of the Lisbon Subway: Estimation and Integration with the Current Fiscal System
MARTINEZ, Luis Miguel; VIEGAS, José Manuel
12th WCTR, July 11-15, 2010 – Lisbon, Portugal
9
warehouses). Figure I presents a flowchart of the simulation model for the residential market,
presenting the similar structure for the non-residential market simulation model.
For each iteration, the model generates a synthetic population of residential properties for the
city of Lisbon based on the statistical distributions available of the census block. All the
structural attributes that generated from the statistical census data are considered as
independent variables with the exception of the Area, which depends of the number of
bedrooms generated. This simplification assumption reduces significantly the complexity on
the interrelation between the different attributes; however it might lead in some low
probability cases to some unreliable configurations (i.e. a dwelling in the 20th floor of a XIX
century building with parking lot inside the building).
Figure I – Flowchart of Value Capture Simulation Model
Simulation (N=100)
Structural Attributes Generation
GarageBedrooms House Floor Area Age2 Age3
0,37%
7,33%
31,87%
39,01%
14,29%
5,31%
1,47%
0,37%
0 1 2 3 4 5 6 7
1
0.3530
Generate Random Number Select Case
Neighborhood and Accessibility Attributes
Generation
Network3
Education
Index
Entropy
Index
2MAccess
1MAccess
Network1
Network2
Compute Property Price
)X...XXWexp(P in
'
n2i
'
21i
'
10)P(Lni i
Estimated Property
Lisbon Municipality
Census Block
Market Value Estimate Lisbon
iPueMarket Val
Spatial Lag Computation
N
)P(Ln
W
N
1
i
)P(Ln i
Land Value Capture Potential of the Lisbon Subway: Estimation and Integration with the Current Fiscal System
MARTINEZ, Luis Miguel; VIEGAS, José Manuel
12th WCTR, July 11-15, 2010 – Lisbon, Portugal
10
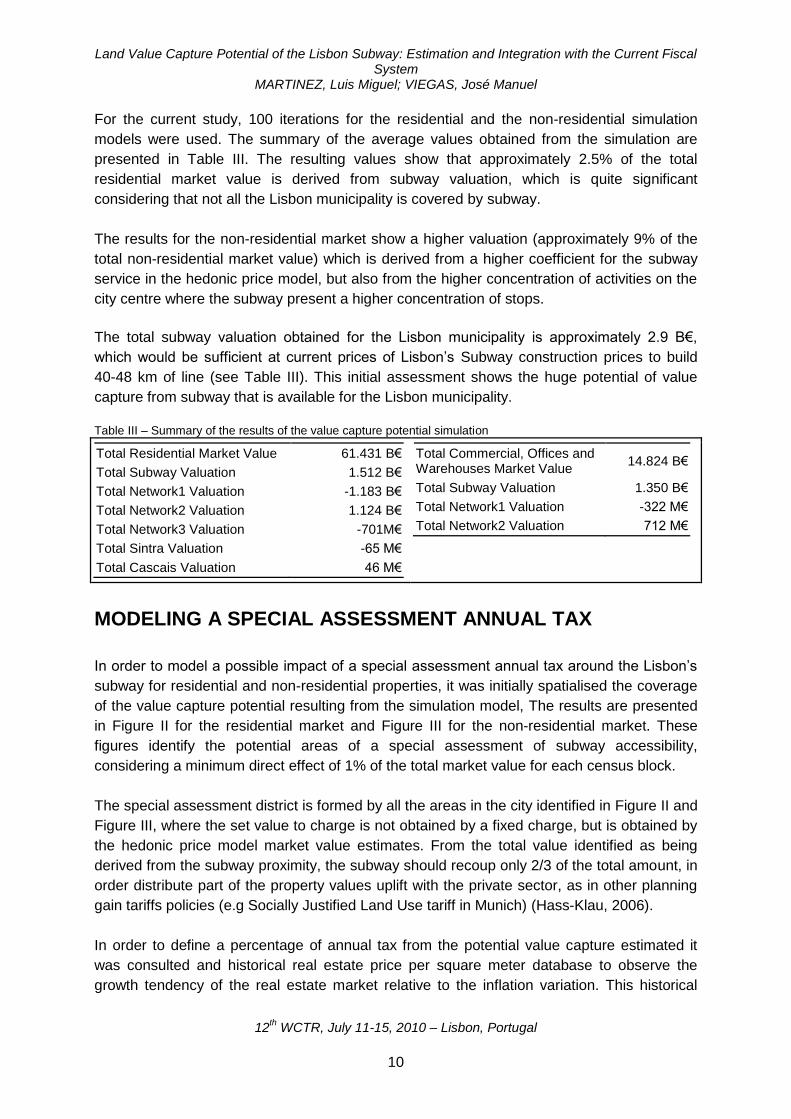
For the current study, 100 iterations for the residential and the non-residential simulation
models were used. The summary of the average values obtained from the simulation are
presented in Table III. The resulting values show that approximately 2.5% of the total
residential market value is derived from subway valuation, which is quite significant
considering that not all the Lisbon municipality is covered by subway.
The results for the non-residential market show a higher valuation (approximately 9% of the
total non-residential market value) which is derived from a higher coefficient for the subway
service in the hedonic price model, but also from the higher concentration of activities on the
city centre where the subway present a higher concentration of stops.
The total subway valuation obtained for the Lisbon municipality is approximately 2.9 B€,
which would be sufficient at current prices of Lisbon‟s Subway construction prices to build
40-48 km of line (see Table III). This initial assessment shows the huge potential of value
capture from subway that is available for the Lisbon municipality.
Table III – Summary of the results of the value capture potential simulation
Total Residential Market Value 61.431 B€
Total Subway Valuation 1.512 B€
Total Network1 Valuation -1.183 B€
Total Network2 Valuation 1.124 B€
Total Network3 Valuation -701M€
Total Sintra Valuation -65 M€
Total Cascais Valuation 46 M€
Total Commercial, Offices and Warehouses Market Value
14.824 B€
Total Subway Valuation 1.350 B€
Total Network1 Valuation -322 M€
Total Network2 Valuation 712 M€
MODELING A SPECIAL ASSESSMENT ANNUAL TAX
In order to model a possible impact of a special assessment annual tax around the Lisbon‟s
subway for residential and non-residential properties, it was initially spatialised the coverage
of the value capture potential resulting from the simulation model, The results are presented
in Figure II for the residential market and Figure III for the non-residential market. These
figures identify the potential areas of a special assessment of subway accessibility,
considering a minimum direct effect of 1% of the total market value for each census block.
The special assessment district is formed by all the areas in the city identified in Figure II and
Figure III, where the set value to charge is not obtained by a fixed charge, but is obtained by
the hedonic price model market value estimates. From the total value identified as being
derived from the subway proximity, the subway should recoup only 2/3 of the total amount, in
order distribute part of the property values uplift with the private sector, as in other planning
gain tariffs policies (e.g Socially Justified Land Use tariff in Munich) (Hass-Klau, 2006).
In order to define a percentage of annual tax from the potential value capture estimated it
was consulted and historical real estate price per square meter database to observe the
growth tendency of the real estate market relative to the inflation variation. This historical

Land Value Capture Potential of the Lisbon Subway: Estimation and Integration with the Current Fiscal System
MARTINEZ, Luis Miguel; VIEGAS, José Manuel
12th WCTR, July 11-15, 2010 – Lisbon, Portugal
11
database from the company Confidencial Imobiliário evidences a strong growth rate of the
market prices since 1988 to 2004 (189%), which is considerably higher than the inflation
rates from the same period. Nonetheless in recent years, this tendency of high growth of the
real estate prices in the municipality of Lisbon has been stabilising, presenting average
values on the five last years of 3.40% per year. The inflation rate for the same period has
been approximately 2.50% accordingly to Statistics of Portugal data, which reveals a net
annual growth of the real estate prices of approximately 0.90%
Figure II – Residential market value capture potential map
Using this information, we will consider for our analysis a time horizon of 20 years for
property fruition, which will translate the subway valuation for the next owner and a yearly
update of 0.90% growth of the real estate market over the inflation rate.
The total annual special assessment tax for the Lisbon municipality resulted in 17.078 M€
(25.617 M€ if instead of 2/3 it would be completely charged). This annual value would be
sufficient at current prices of Lisbon‟s Subway construction prices to build 285 m of subway
line per year (approximately 36% of the current average construction pace of the subway) or
to pay 24% of the annual operational deficit of the subway (2007 subway operational deficit
values).
The estimated tax revenue would have a significant impact on the costs coverage of the
subway and enhance the subway network development with this new annual stream of
financial resources.

Land Value Capture Potential of the Lisbon Subway: Estimation and Integration with the Current Fiscal System
MARTINEZ, Luis Miguel; VIEGAS, José Manuel
12th WCTR, July 11-15, 2010 – Lisbon, Portugal
12
Figure III – Non-residential market value capture potential map
The problem of this taxing policy relies on the increase of the tax burden to property owners
without any improvement of the current public transport service or amenities close to the
property location easily perceived. Apart from the improvement of the service in other
location that may increase the public transport network and improve the general accessibility,
is hard for the tax payer to link the service improvement with the significant increase in
taxation. There are several studies in the literature that illustrate that a tax burden increased
that is not linked with an improvement in urban amenities and services can lead to property
values decrease and welfare losses in the medium and long run (Oates, 1969; Oates, 1973).
This tax increment would lead to an average tax burden increase for residential properties of
16.62% and 22.03% for non-residential properties. This value represents an average tax
increment of 18€ for residential properties and 59€ for non-residential properties. The spatial
distribution of the combined tax burden increase (residential and non-residential) is
presented in Figure VI.
The obtained results suggest that this increase would be more significant for the non-
residential sector, mainly for properties located in the city centre and some high activity
density poles inside Lisbon (see Figure IV). This fact could generate a considerable number
of relocation of activities that want to reduce their cost and may affect the job distribution
within the municipality and even the Lisbon Metropolitan Area. From a transport and land use

Land Value Capture Potential of the Lisbon Subway: Estimation and Integration with the Current Fiscal System
MARTINEZ, Luis Miguel; VIEGAS, José Manuel
12th WCTR, July 11-15, 2010 – Lisbon, Portugal
13
planning perspective, this could generate significant unbalances creating relocations to less
accessibility public transport areas affecting the overall region sustainability.
Figure IV – Spatial distribution of the tax burden increase with the Special Assessment tax
LAND VALUE TAX INTEGRATION
Land Value Tax Estimation
The current land value taxation in Portugal was reformed in 2003 with the introduction of a
new Code: the Municipal Tax on Immovable Property (IMI). This tax presents a configuration
of land and property values taxation merged into a single tax, including buildings,
improvements, and personal property rather than land value, being more close to a real
estate taxation principle.
Nevertheless, this is the current form of property ownership taxation in Portugal and we will
estimate the land value tax for the synthetic population of residential and non-residential
properties in the municipality of Lisbon as in the value capture simulation model.
The IMI tax is calculated as a tax rate that is applied to an estimated real estate value of a
property. This tax rate must be set by each municipality and should range between 0.2% and

Land Value Capture Potential of the Lisbon Subway: Estimation and Integration with the Current Fiscal System
MARTINEZ, Luis Miguel; VIEGAS, José Manuel
12th WCTR, July 11-15, 2010 – Lisbon, Portugal
14
0.5% (0.5% in the case of Lisbon municipality). The real estate value is computed using a
reference equation defined as:
Cv× Cq× Cl× Ca×A × Vc= Vt (2)
where Vt is the real estate estimated value (Patrimonial value), Vc is a base construction
value per sq. meter established by each municipality (615 €/sq. m in the case of Lisbon
municipality), A is the equivalent area of the property in square meters, Ca is a area function
coefficient, Cl a location coefficient, Cq is a quality and comfort coefficient, and Cv is an age
correction coefficient
The equivalent area (A) is a new factor in urban property valuation which aggregates building
construction area and the exceeding area resulting from constructions implantation (see
equation 3).
Ad 0.005 Ac 0.025Caj ) Ab 0.3 (Aa A (3)
where Aa is the private area (area referring to the principal function of the autonomous
fraction), Ab is the dependent area (e.g. parking space, laundry, animal facility, attic,
basement floor), Caj is the area adjustment coefficient, Ac is the proximity area (vacant land
area: limited to two times the constructions implantation area), and Ad is the distant area
(vacant land area: the exceeding area of two times the constructions implantation area).
The area adjustment coefficient is defined by a table in the Code, function of the Ab 0.3 Aa
value and the type of use of the property (residential, commercial or services or industrial).
The area function coefficient (Ca) depends on the type of activity developed in the property
or that is intended to the property following the value presented in Table IV. Area function Ca Table IV – Area function coefficients for IMI calculation (adapted from Taxation Code 2003)
Area function Ca
Commerce 1.20
Office building 1.10
Dwelling 1.00
Controlled cost dwelling 0.70
Industry and warehouse 0.60
Commerce and offices in warehouse buildings 0.80
Covered and enclosed parking lots 0.40
Covered and opened parking lots 0.15
Opened parking lots 0,08 0.08
Buildings without construction permit 0,45 0.45
Storage facilities 0,35 0.35
The location coefficient (Cl) depends on the type of activity developed (housing, commerce,
industry or services) and on the kind of urban property (construction or land for construction)
subject to this valuation procedure. The range of values for this coefficient varies between
Land Value Capture Potential of the Lisbon Subway: Estimation and Integration with the Current Fiscal System
MARTINEZ, Luis Miguel; VIEGAS, José Manuel
12th WCTR, July 11-15, 2010 – Lisbon, Portugal
15
0.35 and 3.00, whether is a dispersed building in rural area or in a raised real estate market
value zone. The factors influencing this coefficient are accessibility (quality and variety),
proximity to public equipments (e.g. schools, hospital, and commerce), public transportation
systems and real estate market value.
This coefficient should be in theory highly correlated with the value capture estimation for
each city block previously estimated due to the inclusion of public transport proximity as one
of the main factors that determines this coefficient.
The quality and comfort coefficient (Cq) is a correction factor to the Vc value in order to
incorporate the value of improvements and specific quality attributes of a property or the
decrease o0f value by lack of some ordinary services (e.g. water and gas supply and
availability of kitchen and bathroom in the property), as presenting parking facilities inside the
property or a swimming pool. The coefficient should present a minimum value of 0.5 and a
maximum value of 1.7.
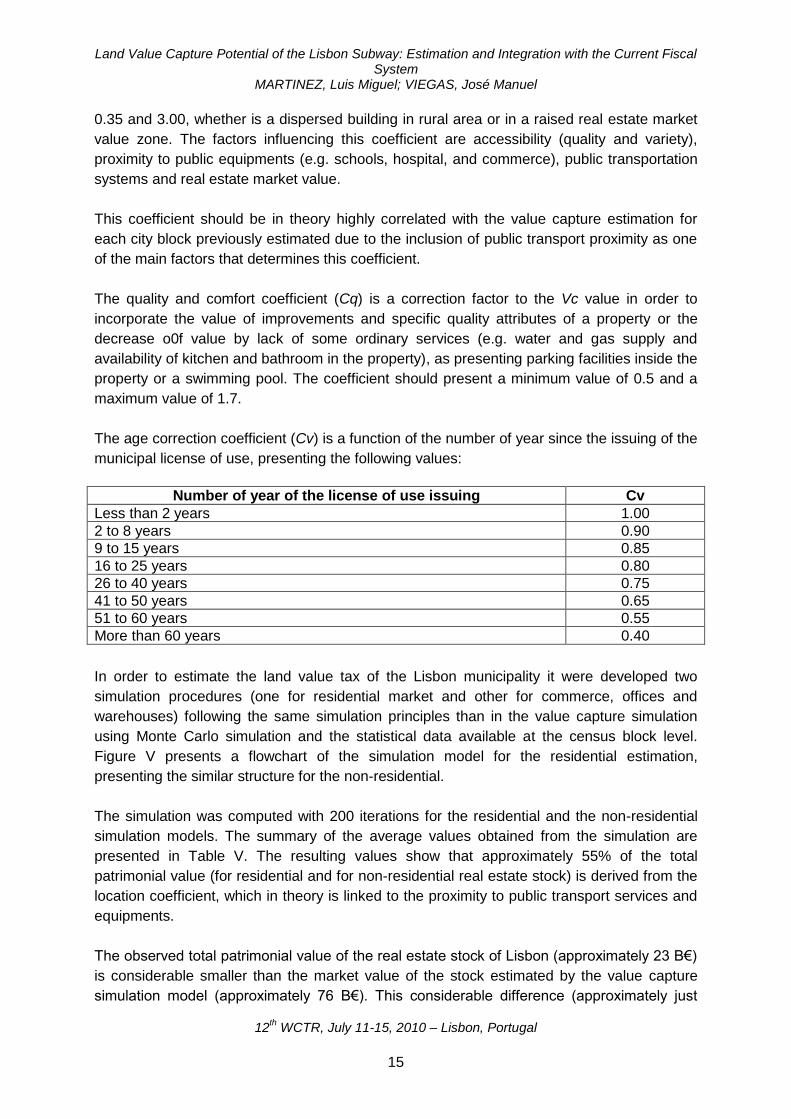
The age correction coefficient (Cv) is a function of the number of year since the issuing of the
municipal license of use, presenting the following values:
Number of year of the license of use issuing Cv
Less than 2 years 1.00
2 to 8 years 0.90
9 to 15 years 0.85
16 to 25 years 0.80
26 to 40 years 0.75
41 to 50 years 0.65
51 to 60 years 0.55
More than 60 years 0.40
In order to estimate the land value tax of the Lisbon municipality it were developed two
simulation procedures (one for residential market and other for commerce, offices and
warehouses) following the same simulation principles than in the value capture simulation
using Monte Carlo simulation and the statistical data available at the census block level.
Figure V presents a flowchart of the simulation model for the residential estimation,
presenting the similar structure for the non-residential.
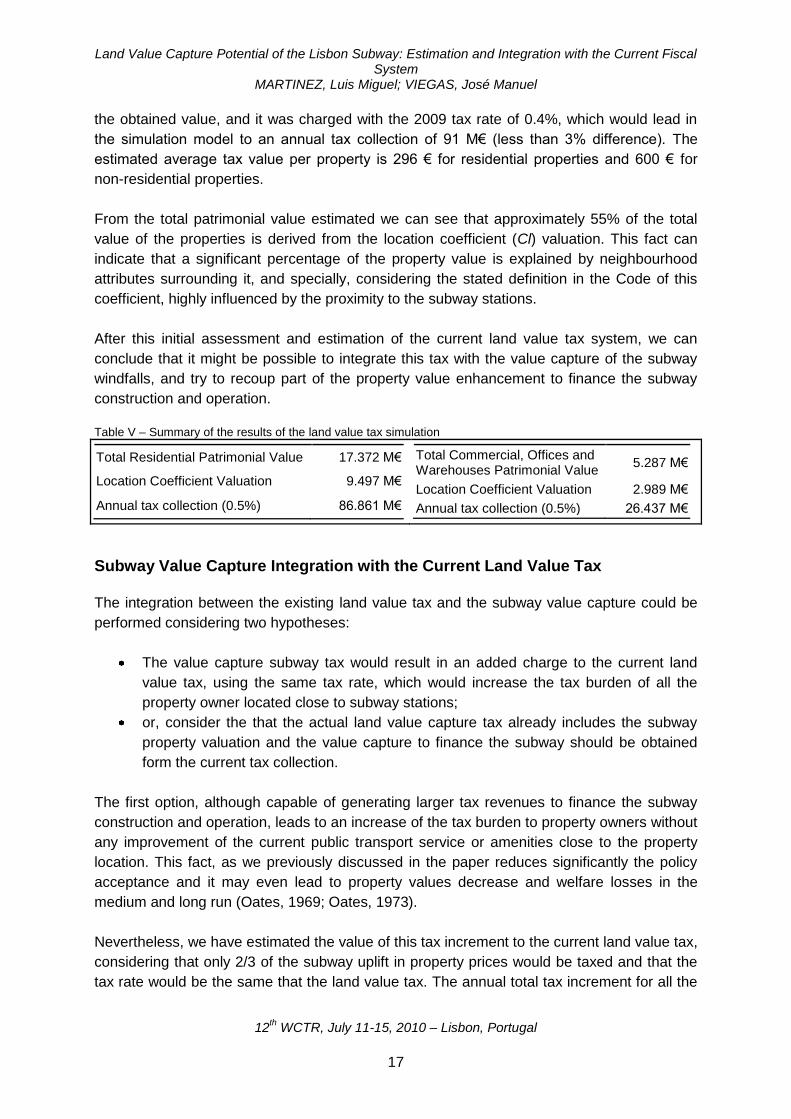
The simulation was computed with 200 iterations for the residential and the non-residential
simulation models. The summary of the average values obtained from the simulation are
presented in Table V. The resulting values show that approximately 55% of the total
patrimonial value (for residential and for non-residential real estate stock) is derived from the
location coefficient, which in theory is linked to the proximity to public transport services and
equipments.
The observed total patrimonial value of the real estate stock of Lisbon (approximately 23 B€)
is considerable smaller than the market value of the stock estimated by the value capture
simulation model (approximately 76 B€). This considerable difference (approximately just

Land Value Capture Potential of the Lisbon Subway: Estimation and Integration with the Current Fiscal System
MARTINEZ, Luis Miguel; VIEGAS, José Manuel
12th WCTR, July 11-15, 2010 – Lisbon, Portugal
16
30% of the estimated market value) can be explained by the considerable penalty introduced
by the age correction coefficient (Cv), that in a considerable part of the building stock of the
city with more than 60 years reduces the property values to 40% of the original value.
This degradation of value with the age of the property (see Table II), although also observed
in the market, does not present a so significant elasticity as in the fiscal estimation of the
market value. The reason behind this considerable difference is the “political” choice of
reduce the tax burden to old building owners, that due to the rent control legislation that
allowed until recently very low rent prices for old tenants, might not have enough financial
resources to maintain their buildings and pay the property ownership taxes.
Figure V – Flowchart of Land Value Tax Simulation Model
The total annual tax collection estimated would be of approximately 113 M€. The amount of
tax collected in 2009 by the municipality of Lisbon was 88 M€ that is considerably close to
Land Value Capture Potential of the Lisbon Subway: Estimation and Integration with the Current Fiscal System
MARTINEZ, Luis Miguel; VIEGAS, José Manuel
12th WCTR, July 11-15, 2010 – Lisbon, Portugal
17
the obtained value, and it was charged with the 2009 tax rate of 0.4%, which would lead in
the simulation model to an annual tax collection of 91 M€ (less than 3% difference). The
estimated average tax value per property is 296 € for residential properties and 600 € for
non-residential properties.
From the total patrimonial value estimated we can see that approximately 55% of the total
value of the properties is derived from the location coefficient (Cl) valuation. This fact can
indicate that a significant percentage of the property value is explained by neighbourhood
attributes surrounding it, and specially, considering the stated definition in the Code of this
coefficient, highly influenced by the proximity to the subway stations.
After this initial assessment and estimation of the current land value tax system, we can
conclude that it might be possible to integrate this tax with the value capture of the subway
windfalls, and try to recoup part of the property value enhancement to finance the subway
construction and operation.
Table V – Summary of the results of the land value tax simulation
Total Residential Patrimonial Value 17.372 M€
Location Coefficient Valuation 9.497 M€
Annual tax collection (0.5%) 86.861 M€
Total Commercial, Offices and Warehouses Patrimonial Value
5.287 M€
Location Coefficient Valuation 2.989 M€
Annual tax collection (0.5%) 26.437 M€
Subway Value Capture Integration with the Current Land Value Tax
The integration between the existing land value tax and the subway value capture could be
performed considering two hypotheses:
The value capture subway tax would result in an added charge to the current land
value tax, using the same tax rate, which would increase the tax burden of all the
property owner located close to subway stations;
or, consider the that the actual land value capture tax already includes the subway
property valuation and the value capture to finance the subway should be obtained
form the current tax collection.
The first option, although capable of generating larger tax revenues to finance the subway
construction and operation, leads to an increase of the tax burden to property owners without
any improvement of the current public transport service or amenities close to the property
location. This fact, as we previously discussed in the paper reduces significantly the policy
acceptance and it may even lead to property values decrease and welfare losses in the
medium and long run (Oates, 1969; Oates, 1973).
Nevertheless, we have estimated the value of this tax increment to the current land value tax,
considering that only 2/3 of the subway uplift in property prices would be taxed and that the
tax rate would be the same that the land value tax. The annual total tax increment for all the
Land Value Capture Potential of the Lisbon Subway: Estimation and Integration with the Current Fiscal System
MARTINEZ, Luis Miguel; VIEGAS, José Manuel
12th WCTR, July 11-15, 2010 – Lisbon, Portugal
18
municipality of Lisbon would be 9.542 M€ (14.313 M€ if instead of 2/3 it would be completely
charged). This annual value would be sufficient at current prices of Lisbon‟s Subway
construction prices to build 159 m of subway line per year (the current average construction
pace of the subway is 800 m per year) or to pay 14% of the annual operational deficit of the
subway (2007 subway operational deficit values).
Although the value capture revenue estimated might be insufficient to cover all annual costs
of the subway, it might help to reduce the gap between operational costs and revenues and
boost the enlargement of the subway network within the Lisbon municipality and also to the
surrounding municipalities.
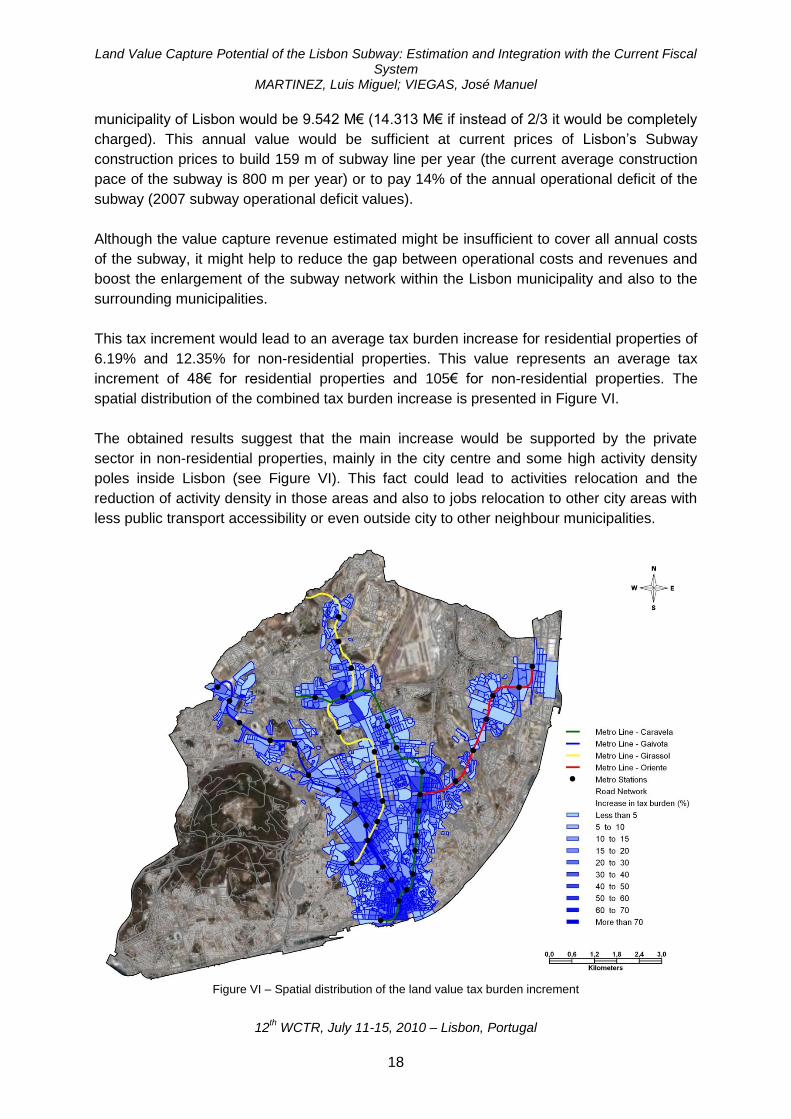
This tax increment would lead to an average tax burden increase for residential properties of
6.19% and 12.35% for non-residential properties. This value represents an average tax
increment of 48€ for residential properties and 105€ for non-residential properties. The
spatial distribution of the combined tax burden increase is presented in Figure VI.
The obtained results suggest that the main increase would be supported by the private
sector in non-residential properties, mainly in the city centre and some high activity density
poles inside Lisbon (see Figure VI). This fact could lead to activities relocation and the
reduction of activity density in those areas and also to jobs relocation to other city areas with
less public transport accessibility or even outside city to other neighbour municipalities.
Figure VI – Spatial distribution of the land value tax burden increment

Land Value Capture Potential of the Lisbon Subway: Estimation and Integration with the Current Fiscal System
MARTINEZ, Luis Miguel; VIEGAS, José Manuel
12th WCTR, July 11-15, 2010 – Lisbon, Portugal
19
The second option of integration of the subway value capture with the current land value tax
is the consideration that the current tax does already contain the premium of proximity to the
subway stations. This approach encloses a tax revenue re-assignment of part of the land
value tax from the municipality budget to the subway operation company – Metropolitano de
Lisboa.
The transfer of part of the land value tax revenues to the subway company would lead in this
case to a political blind alley because subway is controlled directly by Central Government
and its funds are assigned directly from the general national taxation system. The link
between the local authority and this state owned company is negligible, which would
complicate its application and raise issues about the local financing system.
Yet, we have estimated the value from the general taxation system that should be transferred
to the subway operation company in case of application of this policy. This value is computed
considering that the relation between market value of a property and the subway value
capture potential remain unaltered with the taxation patrimonial value of a property.
The annual total tax shift from the current land value tax charged by the municipality to the
subway operation company would be 3.843 M€ (2.007 M€ from the residential sector and
1.836 M€ from the non-residential sector). This tax revenue would be sufficient at current
prices of Lisbon‟s Subway construction prices to build 64 m of subway line per year
(approximately 8% of the current average construction pace of the subway) or to pay 6% of
the annual operational deficit of the subway (2007 subway operational deficit values).
The obtained tax revenues to finance the subway for this approach are considerably smaller
than for the first approach of an increment to the current tax (approximately 40%).
Nevertheless, the application of this policy would lead to some contribution the costs of the
subway development and operation and reduce by only 3% to revenues of the municipality,
without increasing the tax burden of property owners that could produce relocation effects as
previously mentioned.
CONCLUSIONS
This paper presents an assessment of the land value capture potential of the Lisbon subway
and estimates the financial outcome of the creation of a special assessment tax in the
municipality of Lisbon and the integration of the subway real estate windfalls in the current
land value taxation system.
A Monte Carlo simulation procedure is used to estimate the market composition of the
residential, commercial and office sectors from the census aggregated statistical data
available at city block level, leading to an estimate of the value capture potential of the
subway in the Lisbon municipality, using spatial hedonic pricing models developed in
previous stages of the study to estimate the extent to which access to transportation
infrastructure currently is capitalized into property prices. The potential value capture
Land Value Capture Potential of the Lisbon Subway: Estimation and Integration with the Current Fiscal System
MARTINEZ, Luis Miguel; VIEGAS, José Manuel
12th WCTR, July 11-15, 2010 – Lisbon, Portugal
20
estimate is then used to estimate an annual Special Assessment tax and the integration of
subway value capture with the current land value tax.
The results obtained show that these value capture policies could represent a significant
boost to the subway network construction pace and to reduce the operational deficit of the
subway company. Nevertheless, tax burden issues can emerge that can lead to residential
and firms relocations within the Lisbon municipality or even at metropolitan scale.
REFERENCES
Berry, J. and L. Sims (1999). North American Examples of Innovative Funding for Public Transport. UITP.
Borhart, R. J. (1994). Corridor Reservation - Implications for Recouping a Portion of the "Unearned Increment" Arising From Construction of Transporation Facilities. Report VTRC 94-Rl5. Virginia Transportation Research Council, Charlottesville, Virginia.
Cervero, R. and K. Kockelman (1997). Travel demand and the 3Ds: Density, diversity, and design. Transportation Research Part D-Transport and Environment Vol.2, No.3, pp. 199-219.
Cervero, R., S. Murphy, C. Ferrell, N. Goguts, T. Yu-Hsin, A. G. B., B. John, J. Smith-Heimer, R. Golem, P. Peninger, E. Nakajima, E. Chui, R. Dunphy, M. Myers, S. Mckay and N. Witenstein (2004). Transit-Oriented Development in the United States: Experiences, Challenges, and Prospects. TCRP Report 102. Transit Cooperative Research Program - The Federal Transit Administration, Washington D.C.
Cervero, R. and B. Susantono (1999). Rent Capitalization and Transportation Infrastructure Development in Jakarta. Review of Urban and Regional Development Studies Vol.11, No.1, pp. 11-23.
Doherty, M. (2004). Funding Public Transport Development Through Land Value Capture Programs. Ecotransit.
Dueker, K. J. and M. J. Bianco (1999). Light-Rail-Transit Impacts in Portland. The First Ten Years. Transportation Research Record - Transportation Planning, Programming, Public Participation, and Land Use Vol.1685.
Faber, O. (2000). Fair and Efficient Pricing in Transport - The Role of changes and Taxes European Commission DG TREN.
Glaister, S. and D. J. Graham (2005). An evaluation of national road user charging in England. Transportation Research Part a-Policy and Practice Vol.39, No.7-9, pp. 632-650.
Godier, P. (2002). Securing Finance for a Complex Urban Rail System. London Underground.
GVA Grimley (2003). Funding London's transport needs. Royal Institution of Chartered Surveyors (RICS).
GVA Grimley (2004). Developing a Methodology to Capture Land Value Uplift around Transport Facilities. Scottish Executive.
Hack, J. (2002). Regeneration and Spatial Development: a Review of Research and Current Practice. IBI Group, Toronto.
Hass-Klau, C. (2006). Capture of Land Value Premiums as a Source of Funding for Public Transport: Evidence and Practice in selected European Metropolitan Areas. European Metropolitan Transport Authorities (EMTA).
Hass-Klau, C., G. Crampton and R. Benjari (2004). Economic Impact of Light Rail: The Results of 15 Urban Areas in France, Germany, UK and North America. Environmental & Transport Planning.

Land Value Capture Potential of the Lisbon Subway: Estimation and Integration with the Current Fiscal System
MARTINEZ, Luis Miguel; VIEGAS, José Manuel
12th WCTR, July 11-15, 2010 – Lisbon, Portugal
21
Hold, J. (2004). Greenfield Development Without Sprawl: The Role of Planned Communities. ULI Catalog Number: 664A. Urban Land Institute, Washington D.C.
Hong, Y.-H. (1996). Can Leasing Public Land Be An Alternative Source of Local Public Finance? Working Paper WP96YH2. Lincoln Institute of Land Policy.
Lari, A., D. Levinson, Z. J. Zhao, M. Iacono, S. Aultman, K. V. Das, J. Junge, K. Larson and M. Scharenbroich (2009). Value Capture for Transportation Finance: Technical Research Report. CTS 09-18. Center for Transportation Studies, University of Minnesota.
Lichfield, N. and O. Connellan (2000). Land Value and Community Betterment Taxation in Britain: Proposals for Legislation and Practice. Working Paper WP00NL1. Lincoln Institute of Land Policy.
Martínez, L. M. (2009). Metropolitan Transportation Systems Financing Using the Value Capture Concept. Doctoral, Civil Engineering Department, IST- Technical Universty of Lisbon.
Martínez, L. M. and J. M. Viegas (2009). Effects of Transportation Accessibility on Residential Property Values: A Hedonic Price Model in the Lisbon Metropolitan Area. 88nd Annual Meeting of the Transportation Research Board, Washington, D.C.
McGreal, S., J. Berry, G. Lloyd and J. McCarthy (2002). Tax-based mechanisms in urban regeneration: Dublin and Chicago models. Urban Studies Vol.39, No.10, pp. 1819-1831.
Nakagawa, D. and R. Matsunaka (1997). Funding Transport Systems: A Comparison Among Developed Countries: Pergamon.
Oates, W. E. (1969). Effects of Property Taxes and Local Public Spending on Property Values - Empirical Study of Tax Capitalization and Tiebout Hypothesis. Journal of Political Economy Vol.77, No.6, pp. 957-971.
Oates, W. E. (1973). Effects of Property Taxes and Local Public Spending on Property Values - Reply and yet Further Results. Journal of Political Economy Vol.81, No.4, pp. 1004-1008.
Potoglou, D. and P. S. Kanaroglou (2008). Modelling car ownership in urban areas: a case study of Hamilton, Canada. Journal of Transport Geography Vol.16, No.1, pp. 42-54.
Prest, A. P. (1969). Transport Economics in Developing Countries: Praeger. Riley, D. (2001). Taken for a Ride: Trains, Taxpayers and the Treasury: Centre for Land
Policy Studies. Rodriguez, D. A. and F. Targa (2004). Value of accessibility to Bogota's bus rapid transit
system. Transport Reviews Vol.24, No.5, pp. 587-610. Roeseler, W. G. and D. Vondosky (1991). Joint Development in Urban-Transportation - a
Practical Approach to Modern Growth Management. Landscape and Urban Planning Vol.20, No.4, pp. 325-346.
Rybeck, R. (2004). Using Value Capture to Finance Infrastructure & Encourage Compact Development. Public Works Management Policy Vol.8, pp. 249-260.
Scheurer, J., P. Newman, J. Kenworthy and T. Gallagher (2000). Can Rail Pay? Light Rail Transit and Urban Redevelopment with Value Capture Funding and Joint Development Mechanisms. Institute for Science and Technology Policy.
Simon, O. (1999). Briefing: The Private Finance Initiative - An Introduction. The Institution of Civil Engineers.
Smith, J. J. and T. A. Gihring (2006). Financing Transit Systems Through Value Capture. An Annotated Bibliography. American Journal of Economics and Sociology Vol.65, No.3, pp. 751-786.
Tsukada, S. and C. Kuranami (1990). Value Capture with Integrated Urban Rail and Land Development: The Japanese Experience and Its Applicability to Developing Countries. Seminar M, PTRC Transport and Planning Annual Meeting, University of Sussex, England.

Land Value Capture Potential of the Lisbon Subway: Estimation and Integration with the Current Fiscal System
MARTINEZ, Luis Miguel; VIEGAS, José Manuel
12th WCTR, July 11-15, 2010 – Lisbon, Portugal
22
Ubbels, B. and P. Nijkamp (2002). Unconventional funding of urban public transport. Transportation Research Part D-Transport and Environment Vol.7, No.5, pp. 317-329.
Urban Land Institute and G. Associates (1979). Joint Development: Making the Real Estate-Transit Connection: Urban Land Institute.
Viegas, J. (2005). Organisation and Financing of Public Transport. European Conference of Ministers of Transport (ECMT) 2005 - Sustainable Urban Travel.
Vivier, J. (1999). Urban Transport Pricing. Public Transport International Vol.Vol. 48, Nº5, pp. 28-35.
Worsey, S. (2000). Funding Public Transport Infrastructure in the UK: Private Finance and Risk Tranfer. Allens Arthur Robinson.