Embed Size (px)
Citation preview

Land Utilisation in Special Economic Zones in India: A Macro and
Micro ScenarioSURYA TEWARI*
ABSTRACT
The present article examines the issue of utilisation of land in Special Economic Zones (SEZs) in India. A significant proportion of land is lying vacant in SEZs. Low proportion of operational SEZs—with the addition of only few new—together with denotification are co-existing. Since India is a land-starved country, any under utilisation of land is a colossal waste of the scarce resources. The article, therefore focuses on understanding the land aspect of the SEZs at macro and micro level. The macro level analysis is carried out at an all-India level using secondary data while micro level at the level of particular SEZ using primary data generated from the field survey conducted in two SEZs located at Jaipur. Much of the analysis is based on cross tabulation and GIS mapping technique. The analysis reveals level of utilisation of SEZ land to be about 37 per cent at the national level. Within processing area around 45 per cent land is lying vacant. The issue is visible at micro level as well. The setting up of new units in already existing SEZs and linking incentives and conditions to quantum of exports, investment achieved, and location of those zones in unproductive lands appears to be the best possible strategy to ensure land utilisation.
Keywords: Land Utilisation, Processing Area, SEZ and Land Monestisation, Denotification
INTRODUCTION
The policy of Special Economic Zones (SEZ) came into inception in April 2000 with the objectives of enhancing export led growth,
foreign investment and infrastructure development. In 2005, the Parliament enacted SEZ Act so as to create an environment of confidence
*Assistant Professor, Institute for Studies in Industrial Development, Delhi-110070. Email: [email protected]

68 / NAGARLOK VOL. LII, Part 4, October-December 2020
and stability in setting of SEZs in the country. Accordingly, by November 2006, 235 SEZs were given formal approval by the government (Rediff.com, February 21, 2007).
With the setting up of SEZs, many issues and controversies also came to the fore. Some of them were related to location of SEZs, land use conversion from agriculture to non-agricultural uses, land utilisation under SEZs, price of land, problems of displacement, rehabilitation and compensation to the affected people, misuse of allotted land for the real estate activities, relocation of industrial units, loss of revenue and SEZs as instrument of capital accumulation (Gill, 2007; Sharma, 2007; Gopalkrishnan 2007; Levien 2011; Bannerjee-Guha, 2008, 2017).
In many cases SEZs proposals caused displacement which led to the protest and opposition from political parties, civil society organisations and local people. The case of Nandigram in West Bengal is an important example where huge backlash led to the termination and shifting of ongoing project. The major protests were for the return of unused land acquired for SEZs development (The Hindu, October 1, 2018a). The problem of unused land is in highlight along with issues of low level of operationalisation, few additions and denotifications (The Indian Express, July 26, 2017).
It is pertinent to mention here that the only requirement to apply for SEZ is to have minimum quantum of land which is specified by the government. Moreover, the land for developing these SEZs has basically been obtained from the government (GOI, 2014a). In such a scenario, interest in the SEZs could also be due to the promoters’ (or developer, used interchangeably) interest in the land rather than in manufacturing or services. The allowance for non-processing use (residential, recreational, social and commercial infrastructure) together with normal activity of processing (manufacturing of goods or rendering of services) may also be in the direction of igniting the interest of investors in manufacturing via capitalizing on land. While specifying the size of SEZs, no consideration was laid on the quality of the land. The only emphasis was to ensure that SEZs do not fall in reserved or ecologically fragile areas. It was only in the year 2010 that in a guideline it was laid down that first preference for setting up of SEZs should be on land which is waste and barren in nature. But the guideline does not restrict use of cultivated land as it states that in the absence of sufficient land the cultivated area could also be taken (GOI, 2010).
Available literature dealing with SEZs focus on issues like employment, export, investment, FDI, incentives, backward and

LAND UTILISATION IN SPECIAL ECONOMIC ZONES IN INDIA /69 SURYA TEWARI
forward linkages, sale to domestic tariff area, land acquisition, and compensation. See for example research works of Aggarwal, 2007; Sharma, 2007; Gill, 2007; Sampat, 2008; Sharma, 2009; Rawat, Mamidi, and Surepally, 2011; Pratap, 2012; Aggarwal, 2012; Khurud, 2013; Shah, 2013; Cook, Bhatta, and Dinker, 2013; Chakraborty, Gudimeda, and Kathuria, 2017; and Mukherjee et al., 2016. Land as a factor of production has not been adequately explored in these publications.
In view of scarce nature of land and declining per capita availability together with the challenge of industrialisation in the country, the analysis of following issues in the article are very important.
• Level of utilisation of land in SEZs.
• Number of SEZs being added over the years and number being denotified during the same period.
• Time taken by notified SEZs to become operational.
• Differences in the level of land utilization in a private and state government SEZ.
The first three analyses are undertaken at macro level(all India level) and the last one at micro level (at the level of selected SEZs). Macro analysis is based on secondary data while micro analysis is based on primary data generated through field survey conducted in two SEZs in Jaipur.
The paper is divided into seven sections. Besides this Introduction part of Section one, Section two, explains the analytical framework of the study. Section three analyses the utilisation of land in SEZs by state, developer and sector at all India level. Section four investigates the additions and denotifications. Section five examines the difference in level of operationalisation of existing SEZs notified in different years. Sections six covers the comparative analysis of field data on SEZs. Section seven concludes the article.
Analytical FrameworkThe macro analysis is carried out using secondary data pertaining
to SEZs as existing on January 23, 2014 and December 01, 2017. Data was extracted from the website of the Government of India. Data relating to January 2014 are used for analysing the level of land utilisation. This was the only data available on land information, viz. notified, utilised, and extent of vacant land in processing area of each notified SEZ at the time of commencement of the work. In January 2014, eighteen states and two UTs had approved SEZs. From this list, the SEZs in Telangana have

70 / NAGARLOK VOL. LII, Part 4, October-December 2020
been separated from those in Andhra Pradesh (Telangana was formed on June 2, 2014). For analysing additions and de-notification, notified and operationalised data relating to December 2017 have been used. The total number of SEZs considered includes Export Processing Zones (EPZs)/SEZs rechristened or set up respectively, before the introduction of SEZ Act 2005.1
The micro analysis is based on field data generated from the field work conducted in Jaipur during January–February 2019 in two SEZs: Jaipur SEZ (of state government) and Mahindra World City SEZ (of private sector, hereinafter Mahindra SEZ). Mahindra’s had five different SEZs which had been merged into one in April 2018. As of now Mahindra and Jaipur are the only operational SEZs in the state of Rajasthan.2
The choice of Jaipur for field work was guided by the fact that the city is the capital of the state of Rajasthan, one of the million-plus cities with location close to Delhi NCR and houses both the state and privately developed SEZs. Furthermore, private SEZ is one of the earliest large-sized zone which got land allocation of 3000 acres at a time when people vehemently opposed such big projects (Levien, 2011).
Field work was based on questionnaire survey with both closed- and open-ended questions. The questionnaire was canvassed both with the developer and the operational units in the month of January and February 2019. Efforts were made to cover as many units as possible. In all, there were 56 units in Mahindra SEZ, of which 51 units were on developer’s land (44 allotted and 7 rented) and five on co-developer’s land. Out of these 56 units, 34 were operational units, five were under construction, and 17 were under different stages of implementation. Of the 34 operational units, 25 units were covered in the field survey. These 25 units included four units on co-developers land as well. In Jaipur SEZ there were 145 operational units as on June 7, 2018. But door-to-door effort to establish contacts with the units revealed that there were only 59 units which were operational. Rest of the units were found closed. Of these 59 operational units, contact had been established with 28 units. The representativeness of these 28 units could be understood from the fact that these units account for 50 per cent of the total area under the 59 units.
Distribution of Land and its Utilisation Figure 1 records the distribution of SEZs by state across 21 states/
Union Territories (UTs) of India. Following features stand out from the figure: (1) Majority of SEZs are located in Maharashtra, Telangana and

LAND UTILISATION IN SPECIAL ECONOMIC ZONES IN INDIA /71 SURYA TEWARI
Fig. 1: Distribution of SEZs by Developers (as on January 23, 2014)
Source: Constructed from the data extracted from Zone Wise Notified Land Area Details as on January 23, 2014 (GOI, 2014b). Accessed on April 26, 2018.

72 / NAGARLOK VOL. LII, Part 4, October-December 2020
Tamil Nadu. (2) The SEZs are mainly promoted by the private sector. In many of the states, the share of private sector is high, reaching up to 100 per cent as in Punjab, Haryana, Uttarakhand, Chhattisgarh, Jharkhand, Nagaland, and Goa. However, except Haryana (having 29 SEZs), the number of SEZs is low in all these states. (3) In three states—Kerala, Madhya Pradesh, and Odisha—the state government share is comparable with that of private SEZs. In Kerala, most of the SEZs (72 per cent) have been developed by the state government. This may be due to the fact that the state has categorically specified that it is not going to make land available to private enterprises or undertake acquisition on behalf of the private entity (Government of Kerala, 2008). The state also demands the processing area to be 70 per cent (remaining 30 per cent as non-processing) of the notified land, plus it permits implementation of all prevailing labour related Acts in the SEZs.
A study of Figure 2 brings out firstly, that the physical size of SEZs varies significantly across states—smallest aggregate size being less than 100 ha to the biggest size of about 13,000 ha. The area in the biggest size bracket is in Gujarat and Andhra Pradesh. Both the states have the highest number of multi-product SEZs in the country. Secondly, northern states have smaller SEZs in comparison to the southern states. Thirdly, in the southern states of Kerala, Karnataka, and Telangana, the size of the SEZ is comparatively small due to the fact that these are mainly in the IT/ITES sector. The minimum area requirement for this sector was 10 ha, a condition that was dispensed with subsequently. And, fourthly, since the share of private SEZs is generally more in each state, the area under private SEZs is also more. Privately developed SEZs account for about 76 per cent in terms of numbers and about 73 per cent in terms of area.
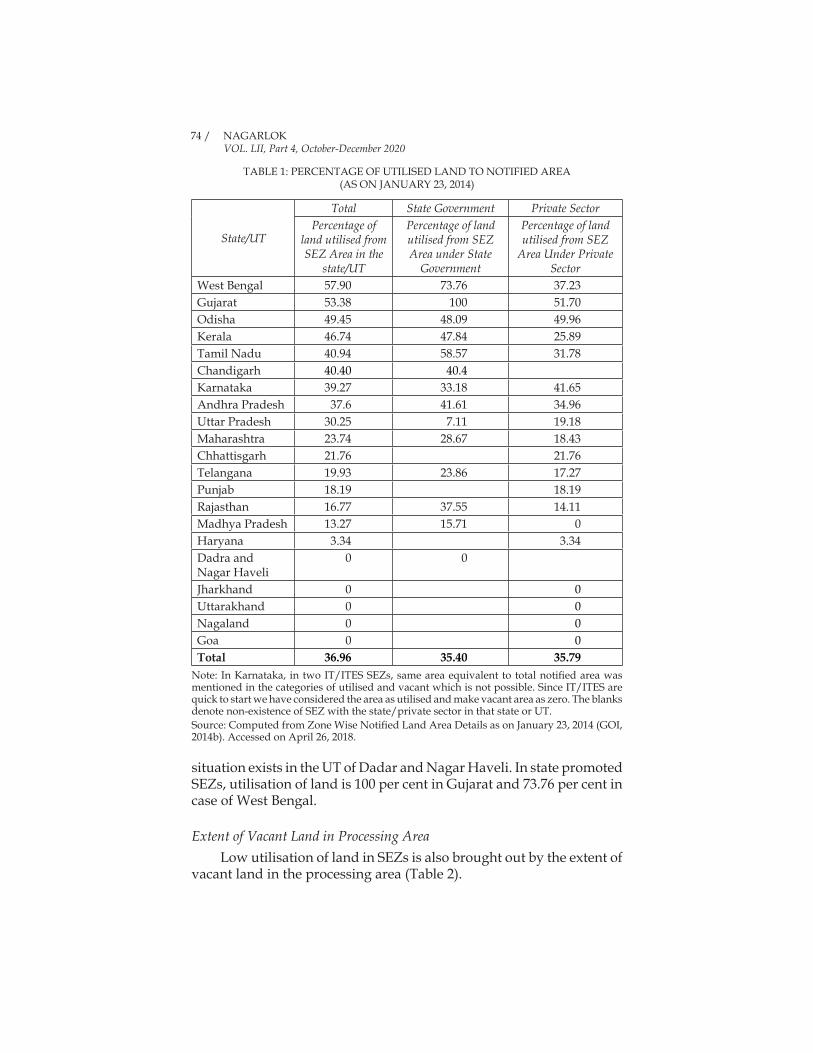
However, when it comes to utilisation of land (includes utilisation in processing and amenities),3 utilisation by privately developed SEZs is similar to state government SEZs (Table 1). Both have been able to utilise a little over 1/3 of the respective notified land. However, comparison at intra-state level reveals differences with better utilisation in state government SEZs.
Land utilisation is slightly above 50 per cent only in the state of West Bengal and Gujarat. At the promoter level in the privately developed SEZ, Gujarat tops in land utilisation at 51.7 per cent. Interestingly, in Madhya Pradesh, Jharkhand, Uttarakhand, Nagaland, and Goa, no land has been utilised in the privately developed SEZs. Since the percentage of land utilised also covers the area under amenities, no utilisation means that the private sector in these states has not yet started work to develop the SEZs. In case of state government developed SEZs such

LAND UTILISATION IN SPECIAL ECONOMIC ZONES IN INDIA /73 SURYA TEWARI
Fig. 2: Distribution of Notified Area in SEZs by the Type of Developer (as on January 23, 2014)
Source: Constructed using data extracted from Zone Wise Notified Land
Area Details as on January 23, 2014 (GOI, 2014b). Accessed on April 26, 2018.
74 / NAGARLOK VOL. LII, Part 4, October-December 2020
TABLE 1: PERCENTAGE OF UTILISED LAND TO NOTIFIED AREA (AS ON JANUARY 23, 2014)
State/UT
Total State Government Private SectorPercentage of
land utilised from SEZ Area in the
state/UT
Percentage of land utilised from SEZ Area under State
Government
Percentage of land utilised from SEZ
Area Under Private Sector
West Bengal 57.90 73.76 37.23Gujarat 53.38 100 51.70Odisha 49.45 48.09 49.96Kerala 46.74 47.84 25.89Tamil Nadu 40.94 58.57 31.78Chandigarh 40.40 40.4 Karnataka 39.27 33.18 41.65Andhra Pradesh 37.6 41.61 34.96Uttar Pradesh 30.25 7.11 19.18Maharashtra 23.74 28.67 18.43Chhattisgarh 21.76 21.76Telangana 19.93 23.86 17.27Punjab 18.19 18.19Rajasthan 16.77 37.55 14.11Madhya Pradesh 13.27 15.71 0Haryana 3.34 3.34Dadra and Nagar Haveli
0 0
Jharkhand 0 0Uttarakhand 0 0Nagaland 0 0Goa 0 0Total 36.96 35.40 35.79
Note: In Karnataka, in two IT/ITES SEZs, same area equivalent to total notified area was mentioned in the categories of utilised and vacant which is not possible. Since IT/ITES are quick to start we have considered the area as utilised and make vacant area as zero. The blanks denote non-existence of SEZ with the state/private sector in that state or UT.Source: Computed from Zone Wise Notified Land Area Details as on January 23, 2014 (GOI, 2014b). Accessed on April 26, 2018.
situation exists in the UT of Dadar and Nagar Haveli. In state promoted SEZs, utilisation of land is 100 per cent in Gujarat and 73.76 per cent in case of West Bengal.
Extent of Vacant Land in Processing AreaLow utilisation of land in SEZs is also brought out by the extent of
vacant land in the processing area (Table 2).

LAND UTILISATION IN SPECIAL ECONOMIC ZONES IN INDIA /75 SURYA TEWARI
TABLE 2: PERCENTAGE OF VACANT LAND IN PROCESSING AREA TO NOTIFIED AREA (AS ON JANUARY 23, 2014)
State/UT Total State Government Private SectorDadra and Nagar Haveli 100 100 Goa 100 100Jharkhand 100 100Nagaland 100 100Telangana 75.61 76.14 75.25Punjab 67.04 67.04Maharashtra 64.15 73.42 56.41Chandigarh 59.60 59.60 Tamil Nadu 50.90 38.56 57.59Odisha 50.55 51.92 50.04Kerala 48.20 46.75 69.34Rajasthan 47.52 58.29 46.14Karnataka 45.76 52.86 43Gujarat 40.13 0 41.57Chhattisgarh 38.18 38.18West Bengal 36.73 26.24 54.2Madhya Pradesh 31.09 30 37.07Uttar Pradesh 28.39 92.89 14.93Andhra Pradesh 27.63 32.04 26.43Haryana 4.08 4.08Uttarakhand 0 0Total 44.6 52.08 43.17
Note: The percentage of area vacant under each category (total, state, and private) is calculated from the total area under that category in the state/UT. The blanks denote non-existence of SEZ with the state/private sector in that state or UT.Source: Computed from Zone Wise Notified Land Area Details as on January 23, 2014 (GOI, 2014b). Accessed on April 26, 2018.
From Table 2 one can notice that vacant land in processing is almost half the area (45 per cent of the total notified area) under SEZs in the country. Moreover, in Dadra and Nagar Haveli, Goa, Jharkhand, and Nagaland, the entire notified area meant for processing is vacant. Among other states the share of vacant land is notable in Telangana, Maharashtra, and Tamil Nadu. These are states with large areas and the higher number of SEZs in the country.
In privately developed SEZs, vacant land is the largest in Telangana (75.25%). Vacant land amounts to over 50 per cent of the notified land in the states of Kerala (69.34%), Punjab (67.04%), Tamil

76 / NAGARLOK VOL. LII, Part 4, October-December 2020
Nadu (57.59%), Maharashtra (56.41%), and West Bengal (54.20%). In state government promoted SEZs, vacant land in processing area varies from 50 per cent to 93 per cent, with highest in Uttar Pradesh, followed by Telangana, Maharashtra, Rajasthan, Karnataka, and Odisha.
The sectors like IT/ITES, biotechnology, gems and jewellery and handicrafts, are less land-intensive than engineering, textiles, or chemicals. However, there is no difference in the extent of vacant lands.
Additions and De-notification of SEZsBy analysing the SEZ data of 2014 and 2017, we found additions of
49 SEZs and probable denotification of 78 SEZs in the country between 2014 and 2017 (the SEZs of 2014 do not appear in the list of 2017).
Out of the 49 SEZs added, 37 have been added in just three states- Telangana (16) Karnataka (14), and Maharashtra (7).
Highest number of SEZs (around 22) were denotified in Maharashtra (Table 3). Haryana has also probably denotified nine SEZs. Clearly, these are cases of total denotification, partial denotification may also have taken place after the revision of the area in August 2013 (GoI, 2013). The denotification is basically of private SEZs and mainly of the one in IT/ITES sector.
From 2006 to 2013, there was a 50 per cent reduction in area requirement of many of the sectors. In another notification dated September 19, 2018, area requirement of 10 ha for biotechnology and health sector (excluding hospitals) was withdrawn (GoI, 2018a). The recent notification of December 17, 2019 made significant change in the land area requirement (GoI, 2019). According to this notification, all existing notified SEZs would deem to be multi-sector SEZs with minimum land area requirement of 50 ha.
Operational Status of Notified SEZsFrom the list of existing SEZs we found that many of them were
notified in the years immediately following the implementation of the SEZ Act (Fig. 3). Figure 3 presents SEZs as existing in December 2017 by their year of notification. In addition, if these SEZs have been operationalised by December 2017, they have been placed in the Figure 3 corresponding to their year of notification.
The peak in notification is observed in 2007 with most of them being notified between 2006 and 2009. The slightly upward trend is noticed from 2015 onwards.

LAND UTILISATION IN SPECIAL ECONOMIC ZONES IN INDIA /77 SURYA TEWARI
With respect to operationalisation, as per the Rules, the SEZ must begin operations within three years of receiving formal Letter of Approval (LOA). To be precise, at least one unit should start functioning within three years of receiving the formal LOA. By giving leverage of three years one may ignore the proportion of operational SEZs in 2015 and later years; however, the proportion of operational SEZs notified
TABLE 3: CHANGE IN THE NUMBER OF SEZS BETWEEN JANUARY 2014 AND DECEMBER 2017
State/UT Notified SEZs (2014)
Removed SEZs
New Notified
SEZs
Total Notified SEZs(2017)
Andhra Pradesh 33 7 2 27*Chandigarh 2 2Chhattisgarh 1 1Dadra & Nagar Haveli 1 1Goa 3 3Gujarat 33 5 27*Haryana 29 9 20Jharkhand 1 1Karnataka 40 3 14 51Kerala 25 1 26Madhya Pradesh 10 4 6Maharashtra 66 22 7 51Manipur 1 1Nagaland 2 2Odisha 5 1 1 5Punjab 2 1 3Rajasthan 12 3 9Tamil Nadu 58 8 2 52Telangana 46 5 16 57Uttar Pradesh 24 5 4 23Uttarakhand 1 1West Bengal 12 4 8Total 406 78 49 375
Note: The total number of SEZs is 408 in January 2014. But in that list, two SEZs—Luxor Cyber City and Uppal Developers Private Limited in Gurgaon, Haryana—are marked crossed through horizontal line running in the middle, thereby bringing the number down to 406. In Andhra Pradesh, Kakinada SEZ 1 and 2 were merged in 2016, which brought the number to 27 rather than 28. Similarly, in Gujarat, Adani, and Mundra Ports were merged in 2016, thus bringing the number down to 27 rather than 28. Source: Zone Wise Notified Land Area Details as on January 23, 2014 (GoI, 2014b) and List of Notified SEZs of India as on December 01, 2017 (GoI, 2017a). Accessed on April 26, 2018.

78 / NAGARLOK VOL. LII, Part 4, October-December 2020
earlier than 2015 is low. It can be clearly seen from Fig. 3 that the operational percentage of SEZs notified as early as 2008/2009 is below 50 per cent. SEZs that were notified in 2006/2007 have best operational level. From 54 currently existing SEZs that were notified in 2006, 51 are operational. Of 2007, it is 96 notified, of which 75 are operational. In all other years the operational level is low, falling to 17 per cent of those notified in the year 2012 (notified – 6; operational – 1).
Land Utilisation of SEZs in JaipurGovernment of Rajasthan via its industrial organisation-Rajasthan
Industrial Investment Corporation (RIICO), played an important role in establishing both the SEZs. While Jaipur SEZ of state government was developed entirely by RIICO, in the case of Mahindra SEZ, land was made available by RIICO to the developer Mahindra Lifespaces, a subsidiary of Mahindra & Mahindra Company.
Both SEZs are located in Sanganer Tehsil and within the statutory limits of the Jaipur Development Authority (JDA), a statutory body to control the development of Jaipur city. Prior to the setting up of SEZs, the land was in agricultural use with cultivation of single crop of irrigated and unirrigated type.
Jaipur SEZ extends over 44.87 ha of land. The area was carved out from the Sitapura Industrial Area of RIICO. The entire area of the SEZ is under processing i.e., for manufacturing of goods or rendering of services.
Fig. 3: Notification and Operationalisation of SEZs (as on December 01, 2017)
Source: Constructed from the data obtained from the website on list of Notified and Operational SEZs as on December 01, 2017 (GOI, 2017a; GOI, 2017b). Accessed on 26 April 2018.

LAND UTILISATION IN SPECIAL ECONOMIC ZONES IN INDIA /79 SURYA TEWARI
To Mahindra SEZ, the land was made available by RIICO through JDA. In all, 3000 acres (1214.06 ha) of land was leased out by RIICO to the developer for 99 years. While 1000 acres (404.69 ha) land was already in occupation of JDA, fresh acquisition of 2000 acres (809.37 ha) was carried out by JDA. The process of acquisition began in 2005 (Levien, 2011). As per the developer office, land was contained in seven villages.
Out of the total leasehold area with Mahindra, 604.58 ha has been notified under SEZ, and the rest of the area is being developed as Mahindra’s Domestic Tariff Area (DTA) (See Figure 4). While the SEZ area is completely under processing use, the DTA area is being planned for residential and related infrastructure projects like schools, hospitals, retail stores, financial facilities, and entertainment. The distribution of SEZ and DTA vis-à-vis each other can be noted from Fig. 4.
Fig. 4: Mahindra SEZ – Master Plan (Not to Scale)
Source: Mahindra World City Jaipur Handbook, obtained from Mahindra SEZ Office.
From the figure, one can see residential development by real estate companies in the area surrounding the SEZ. Some of them are Emaar MGF, Ashiana housing, Unique City, and Omaxe City.
Expenditure Incurred by Developers for Developing the SEZsThe per hectare cost of land lease to the developer is 3.027 million
in Jaipur SEZ while 2.650 million in Mahindra SEZ. Land compensation paid is low by around 0.4 million per ha in Mahindra SEZ in comparison to Jaipur SEZs. This is when land for Jaipur SEZ was in occupation of RIICO since 1994-95 and in case of Mahindra SEZ the government started the acquisition process on behalf of Mahindra in 2005 (Levien, 2011). The breakup of expenditures is noted in Table 4.

80 / NAGARLOK VOL. LII, Part 4, October-December 2020
TABLE 4: PER HECTARE EXPENSES IN SETTING UP SEZS (RS IN MILLION)
SEZ Year of Notification
Area (ha)
Total Expendi-
ture
Per Hectare Land
Compensation
Per Hectare Cost of
Amenities
Per Hectare Cost of
DevelopmentJaipur 2003-04 44.87 377.7 3.027 5.391 8.418Mahindra 2007* 604.58 5688.8 2.650 6.759 9.409
Source: Primary Survey, January-February 2019.Note: 2007 is the year when the first SEZ of Mahindra was notified. The rest four SEZs were notified between 2009 and 2012. In April 2018, all five were merged into multi-product.While in the case of Jaipur SEZ, pricing of plots is based on the principle of ‘no profit, no loss’, in the case of Mahindra SEZ being a private entity, there is a margin for profit.
Extent of Processing and Vacant Area in SEZsTurning on to extent of land utilised in both the, SEZs i.e. under
processing and amenities, it is found that significant area goes under the development of amenities. In Jaipur SEZ, around 45 per cent area has been used under amenities, thereby leaving 24.45 ha to be used under processing. In case of Mahindra, 35 per cent area is under amenities. This leaves 392.98 ha area to be developed as processing area. From the processing area of both the SEZs, 20 per cent area is lying vacant in Jaipur SEZ, and 60 per cent in Mahindra SEZ (Table 5).
TABLE 5: EXTENT OF AREA UNDER DIFFERENT USES (IN HA)
SEZ Total Area
Amenities Area
Processing Area
Processing Area
Utilised
Processing Area
Vacant
Percentage of Vacant Area to Processing
AreaJaipur 44.87 20.42 24.45 18.98 4.97 20.33Mahindra 604.58 211.60 392.98 158.39 234.59 59.70
Source: Computed from the data obtained from Primary Survey, January-February 2019.
Parcelling of Land and its UtilisationWhile the entire processing area of 24.45 ha in Jaipur SEZ has been
parcelled out into 241 plots (as per master plan), in the case of Mahindra 125 plots have been carved out. The utilisation of the plots is as under (Table 6).
TABLE 6: UTILISATION OF PLOTS
SEZ Total No. of Plots Allotted Plots Vacant PlotsJaipur 241 185 56Mahindra 125 74 51
Source: Primary Survey, January-February 2019.

LAND UTILISATION IN SPECIAL ECONOMIC ZONES IN INDIA /81 SURYA TEWARI
Out of the total number of plots in Jaipur SEZ, 56 plots still need to be allocated. These vacant plots include the ones which have not been allocated so far as well as 10 plots of eight units that have made exit from the SEZ.
At the time of the field survey, 13 units made an exit from the SEZ, with two occupying the same plot of which one is on rent. Four plots of exiting units have been reallocated to three units.
The allotment is made on first-come-first-serve basis. As per the procedure fixed, the interested entrepreneur applies for setting up of a unit in the SEZ by submitting 26 per cent of the lease cost of the plot. Once the unit gets the provisional letter from the committee comprising RIICO officials, it is required to get a Letter of Offer and Acceptance (LOA) from the Development Commissioner, NOIDA SEZ within 60 days. Once this is done, the final allotment of the plot is made from RIICO on payment of the due amount. Initially, the allotments were made at the rate of Rs 1100 per sq m. This was raised to Rs 1500 per sq m, then to Rs 4800 per sq m, and currently it is Rs 6000 per sq m. The same rate is followed in the allotment of industrial plots outside the SEZ in the industrial zone. As per the developer’s office, the cost of plots at any given point of time is the cost of land, development charges and interest charges on the amount invested (till that date) divided by plot area.
In the case of Mahindra, 125 plots have been parcelled out, of which 51 plots are still to be allocated. Moreover, as per the developer’s office, a portion of the land has still to be plotted. As Mahindra SEZ caters to different sectors, the utilisation of plots as per the sectors reveals 41 of the total 81 plots in engineering are vacant (Table 7). In case of handicrafts, there were 26 plots of which nine are vacant. In IT/ITES, all but one from the total of 18 is vacant.
TABLE 7: MAHINDRA SEZ – SECTOR-WISE UTILISATION OF PLOTS
Sector Total Area (ha) Allotted Vacant TotalEngineering 233.34 40 41 81Handicrafts 165.21 17 9 26IT/ITES 92.91 17 1 18Total 491.46 74 51 125
Note: Area under IT/ITES is exclusive of 93.48 ha area with co-developers as that land is outside the purview of Mahindra’s on allotment to co-developers.Source: Primary Survey, January-February 2019.
Since land availability was high in Mahindra SEZ, the allotment was made on the choice of the entrepreneur. Before conversion into

multiproduct, the plots in the SEZ zone that were earmarked for setting up the units of specified sectors were shown to the entrepreneurs. Modification was also made in the plot sizes wherever required. Since the demand for land is not more than what is available, no problem has been faced and is foreseen in allocation.
In the beginning, the allotment in Mahindra SEZ was made at the rate of Rs 680 per sq m. The rate was applicable to only a few units (1 to 2) which were persuaded by the developer to begin operations in the SEZ. The rate was later raised to Rs 1235 per sq. m and currently it is Rs 3954 per sq. m. The rate is in fact found lower than Jaipur SEZ or Sitapura Industrial Area where plots are available at Rs 6000 per sq m. In an interview, one of the unit head said that if the land in Mahindra SEZ gets denotified then the price would increase, say, between 8,000 and 10,000 per sq m. Few of the units reported availability of cheaper land as one of the reasons for coming to Mahindra SEZ.
With respect to fixation of prices, no outside intervention is faced by Mahindra in deciding the prices. For deciding the prices, three things are taken into consideration: (i) market survey based evaluation of the demand for the plots, prices buyers are willing to pay and the rates in the nearby industrial areas; (ii) readily available stock of land; (iii) the positives of their area vis-à-vis other industrial areas. So, in a way the price component has land charges, development costs, and profit margin as well.
Plot Size of the UnitsIn Jaipur SEZ, the plot sizes vary from minimum 500 sq m to
maximum 4000 sq m (Table 8). But in the case of Mahindra, the minimum area is 4000 sq m. The area has reached to size of 28000 sq m. There are five units in the largest size range of 24000 to 28000 ha. Maximum units fall in the area bracket of 8000 to 12000 sq m.
There may be two reasons for the large plot size of the existing units: one, the units had future expansion in mind at the time of making investment in the SEZ, and two, their sector (nature) of work demanded large-sized land.
On the issue of expansion, however, out of the 25 units surveyed in Mahindra, 11 stated no expansion plan, nine have plans for expansion but would be accommodated in the current space, and only five units need to buy more land for expansion. It is important to note that units are aware of sunset clause applicable from March 2020 and the extent and duration of income tax benefits available to them.

LAND UTILISATION IN SPECIAL ECONOMIC ZONES IN INDIA /83 SURYA TEWARI
To examine whether the sectors of operation demand larger plot size, we have calculated the per cent built-up area of the surveyed units. The results of 21 surveyed units in case of Mahindra SEZ (excludes 4 surveyed units on rented space) arranged according to the sector and the size of the units (investment in plant and machinery as per MSME Act 2006) As per MSME Act 2006, in case of manufacturing, the units having investment in plant and machinery are below Rs 25 lakh are micro, between Rs 25 lakh and Rs 5 crore small and from Rs 5 crore to Rs 10 crore are termed as medium. In the study manufacturing units having investment more than Rs 10 crore are regarded as large units. In case of services, units having investment upto 10 lakh are micro, between Rs 10 lakh to Rs 2 crore are small and between Rs 2 crore to Rs 5 crore as medium. In the study, service units with investment more than 5 crore are regarded as large service units (Table 9).
From Table 9, one can clearly note lowest land utilisation in IT/ITES sector. The IT/ITES units have constructed space to the extent of 32.94 per cent of their total plot area with small-sized units having built-up area of only 13.53 per cent. The percentage of the built-up area increases in the case of large units. In case of engineering, the built-up area of micro & small units is more than that of the large units. Amongst the three, handicrafts unit has the best built-up area at 63.82 per cent.
On the question of whether the required plot size of the units is different from the allotted size, all but two units stated allocation of same plot size as demanded. The two units that demanded smaller plot
TABLE 8: PLOT SIZE OF UNITS
Area (in sq m) Jaipur SEZ Mahindra SEZ500–700 144 -1000–1500 68 -2000–4000 29 -4000–8000 - 128000–12000 - 1812000–16000 - 616000–20000 - 620000–24000 - 224000–28000 - 5
Note: Size of the plots in Jaipur SEZ is as given in the master plan. In case of Mahindra, the sizes of the SEZ plots have been gauged from the area of 44 units which have been given plots on lease by Mahindra. Of these 44 units, five have expanded their respective areas. The expansion is considered as a separate plot size. The area is in acres with the minimum being one acre. The areas have been converted into sq. m. and rounded off. Source: Primary Survey, January-February 2019.

84 / NAGARLOK VOL. LII, Part 4, October-December 2020
size were from the IT/ITES sector. Both the units came at a time when allotment in the respective SEZ had almost been made, leaving them with the limited choices.
In case of Jaipur SEZ, the built-up area of surveyed units as percentage of their plot area stands at 90.99 per cent (Table 10).
TABLE 10: JAIPUR SEZ – BUILT-UP AREA AS PERCENTAGE OF TOTAL PLOT AREA OF SURVEYED UNITS
SectorNo. of
Surveyed Units
Total Plot Area
(in ha)Micro Small Medium Overall
Gems and Jewellery
27* 4.28 61.30 (5) 90.89 (19)
110.85 (3)
90.99
Note: Figures in the parenthesis correspond to number of units. ‘*’ One small-sized unit has been excluded as its built-up area was very high. The inclusion of that unit inflated the built-up area of small-sized units to over 300 per cent.Source: Primary Survey, January-February 2019.
Micro units have a small built-up area but that may be because of their scale of operation. The built-up area as percentage of total plot area increases from micro to medium size.
CONCLUDING OBSERVATIONS AND POLICY RELEVANCE
Following features have emerged from the analysis:1. Special Economic Zones are mainly developed by the private
sector– in some of the states, the SEZs have been entirely promoted by the private sector.
TABLE 9: MAHINDRA SEZ – BUILT-UP AREA AS PERCENTAGE OF TOTAL PLOT AREA
Sector
No. of Surveyed
Units
Total Plot Area
(ha)
Built-up as a Percentage of Total Plot Area
Micro & Small
Large Overall
Engineering 9 11.20 55.51 (7) 46.33 (2) 52.31Handicrafts 5 6.61 63.82 (5) - 63.82IT/ITES 7 23.57* 13.53 (4) 36.88 (3) 32.94Total 21 41.38 49.25 (16) 38.45 (5) 43.12
Note: Figures in parenthesis correspond to the number of units. The breakup of micro and small is one and six in engineering and one and four in handicrafts. There is no micro unit in IT/ITES. ‘*’The plot area of one unit, which is also a co-developer, is around 17 ha.Source: Primary Survey, January-February 2019.

LAND UTILISATION IN SPECIAL ECONOMIC ZONES IN INDIA /85 SURYA TEWARI
2. However, when it comes to utilisation of land, SEZs are able to utilize only 37 per cent of notified lands.
3. It is only in state government promoted SEZs in Gujarat and West Bengal that the utilisation is 100 per cent and 74 per cent respectively; in all others it is below 50 per cent.
4. Within processing area, vacant land constitutes nearly half of the area under SEZs in the country. Vacant land is significant in states like Telangana, Maharashtra, and Tamil Nadu, notable with respect to quantum of SEZ area and number of SEZs in the country.
5. No difference in proportion of land used is observed in the SEZs dominated by sectors requiring large quantum of land and whose land requirement is not so large.
6. Between the year 2014 and 2017, 49 new SEZs have come while 78 SEZs have probably been denotified with the maximum numbers in Maharashtra followed by Haryana. The denotifications are mainly of private SEZs and that, too, of those in IT/ITES sector.
7. Many of the existing SEZs were notified in the years immediately following the implementation of the SEZ Act. The peak in notification was observed in 2007 with most of them being notified between 2006 and 2009. The percentage of operational SEZs, which are as old as 2008/2009, is below 50 per cent.
8. Out of the total processing area, around 20 per cent in Jaipur SEZ and 60 per cent in Mahindra SEZ is vacant.
9. The plot size in Jaipur SEZ varies from 500 sq. m to 4000 sq. m. In case of Mahindra, the plot size ranges from 4000 sq. m to 28000 sq. m with maximum 18 units on plot size of 8000 sq. m to 16000 sq. m.
10. The IT/ITES sector units have lowest land utilisation among the three sectors in Mahindra SEZ. The overall built-up percentage of surveyed units in Mahindra SEZ is 43.12 per cent, while in Jaipur SEZ the built-up is 90.99 per cent with the built-up percentage increasing with an increase in the size of the unit.
From the preceding analysis it is very much clear that there is substantial unutilised land with SEZs both at the macro and micro level. Sizes of SEZ appear to have been arbitrarily defined. Had the size been scientifically determined, the reduction in specification of area would not have taken place. The change in the principle requirement of land

86 / NAGARLOK VOL. LII, Part 4, October-December 2020
size over time shows lack of any principle in deciding the sizes. The reduction in land size requirement for SEZs may lead to denotification of the excess land held by different SEZ developers. But the question is whether or not the denotified (excess land) land would be used for industrial purpose. In the past the state of Haryana has given one-time relief of developing industrial colonies to the denotified SEZs (The Tribune, April 24, 2016). Similarly, Maharashtra government approved of converting Navi Mumbai SEZ into an Integrated Industrial Area (The Hindu, 2018b). However, whether the land will be used for industrial development would only be reflected in the times to come.
Unutilised land with SEZs appears to be a result of the transfer of large areas of land from the government (in all those cases where government transfer or acquire land on behalf of the private promoters).
Though no speculative use is expected in case of government SEZ, the large extent of vacant land can be taken as an indicator of inefficiency. In private SEZs, other than the indication of inefficiency, the vacant land also exhibits future use and land hoarding. Since the majority of the SEZs are located in and around urban areas (Mitra 2007; and Mukhopadhyay & Pradhan, 2009), the speculation cannot be missed. The proximity to urban areas and speculative use are well documented in the literature (Fisher, 1933; Madhab, 1969; Archer, 1973; Wadhva, 1983; Ramachandran, 1989; and Goldman, 2011). The urban areas have tendencies to sprawl which make their fringes the preferred site for investment to gain from speculation
However, one has to look for what all alternatives could be there to deal with unutilised land in SEZ. One option could be to de-notify the SEZs altogether where necessary and to use them for industrial purpose outside SEZ. But it would depend on kind of possession (ownership or leasehold), government regulation with respect to land use in master plan, incentives/benefits outside SEZ would be worthwhile to be seen in all such cases. In such an environment of uncertainty what is required is critical review of incentives to SEZ.
The second alternative could be to return the unutilised and denotified land to the farmers. In fact, farmers have also raised this demand. Returning unutilised land, is however difficult. One of the questions is: How can compensation be recovered, and would it be possible to put the land to agricultural use if that was the case before acquisition/purchase? If changes have been made to the original structure of the land through construction, etc., then it would be difficult to restore the land to its original level. In case of Singur (Indian Kanoon, 2016), for example, the Supreme Court had ordered for return of land

LAND UTILISATION IN SPECIAL ECONOMIC ZONES IN INDIA /87 SURYA TEWARI
to owners without recovering the compensation. Such an order makes it clear that compensation paid may have to be relinquished by the government. Since the state government was on the same page with farmers, it made it a clear-cut policy to return the land to unwilling owners who did not accept the compensation (Government of West Bengal, 2011). From the ground it is known that the return process has been completed except to those landholders whose names were there but could not be traced (benami landholders). Farmers are however, holding the land for future sale as cultivation is next to impossible on the plant site. The soil was dug so deep now it is impossible to excavate any further. Moreover, the areas surrounding the plant which were purchased by private entities in anticipation of development of area are also kept idle. In such a scenario it is important that land be put to industrial use only, if not in SEZ than outside SEZ. It is worth researching whether micro, small or medium enterprises could be established by training willing entrepreneurs in such locations.
Another alternative could be to develop new units in existing SEZs rather than developing new SEZs. This appears to be a best strategy. Focus may also be laid on first time entrepreneurs or first-time exporters. However, this would require a lot more effort in terms of finding markets for them, establishing linkages with clients, helping them to innovate, and so on. In one word, handholding would be required till the unit reaches at least the break-even point. Few of the units in Mahindra World City mentioned this fact. If focus is on inviting first timers (sector wise or export wise first), then full support has to be provided to them. Should the developer be assigned new functions with respect to monitoring, guiding, and marketing? From the field survey it is noted that no serious effort is made to attract units. In case of Jaipur SEZ no thinking and effort is there in attracting units, by Mahindra SEZ, road shows and seminars are being conducted but that are mainly with the Export Oriented Units. Basically, a unit planning to set up operations in an SEZ has to approach the developer. There is no mechanism of advertising in electronic and print media. The lack of vision in developers to attract units could be due to the fact that the developer is only supposed to meet land requirement in setting up an SEZ. While applying for setting up an SEZ, the developer has to give export and employment projections for the first five years, but certainly there is no mechanism to review and monitor this information. Once the SEZ is notified, it will remain so till the developer applies for denotification. No suo moto denotification of SEZ takes place. With respect to monitoring, the supply of only those goods and services which come into the SEZ are monitored to ensure that the authorised operations are being carried out by the developer. Other than this, no checks are conducted.

88 / NAGARLOK VOL. LII, Part 4, October-December 2020
An option could also be to throw open the SEZs to meet domestic demands as well. In fact, the expert group appointed by the government also recommended the same (GOI, 2018b). As per the Rules sale in domestic market is, however allowed on payment of custom duties. Unless one has a niche market for the product such a sale become unprofitable. In order to overcome this issue, expert group recommended reversal of duties on inputs when sold in the domestic market. To accommodate this change, the committee recommended renaming SEZs as Employment and Economic Enclaves (3Es), giving option to units to migrate to 3Es framework. However, instead of changing the character of SEZs as 3Es what is needed is linking incentives and conditions to quantum of exports, location of SEZs in unproductive lands, etc. This would remove unnecessary duplication with other zonal schemes like Industrial Clusters, Investment and Manufacturing Zones.
AcknowledgementThe article is a part of the Research Programme, “Industrial,
Trade and Investment Policies: Pathways to India’s Industrialisation”, undertaken at the Institute for Studies in Industrial Development (ISID). The earlier version of the paper is available as ISID working paper. I am thankful to Prof. H. Ramachandran, Former Head of the Department, Geography, Delhi School of Economics, University of Delhi for his valuable comments and suggestions.
REFERENCES
1. Aggarwal, A. (2007). Impact of special economic zones on employment, poverty and human development. New Delhi: Indian Council for Research on International Economic Relations.
2. Aggarwal, A. (2012). Social and economic impacts of SEZs in India. New Delhi: Oxford University Press.
3. Archer, R.W. (1973). Land speculation and scattered development: Failures in the urban-fringe land market. Urban Studies, 10(3), 367-372.
4. Banerjee-Guha, S. (2008). Space relations of capital and significance of new economic enclaves. Economic and Political Weekly, 43(47), 51-59.
5. Banerjee-Guha, S. (2017). Social relations, spatial dynamics and peripatetic capital. In B. Thakur et al. (Eds.), Regional development: Theory and Practice, Vol. 3 (pp. 343-356), New Delhi: Concept Publishing Company Pvt. Ltd.
6. Chakraborty, T., Gundimeda, H. and Kathuria V. (2017). Have the special economic zones succeeded in attracting FDI? – Analysis for India. Theoretical Economics Letters 7, 623-642.

LAND UTILISATION IN SPECIAL ECONOMIC ZONES IN INDIA /89 SURYA TEWARI
7. Cook, I., Bhatta, R. and Dinker, V. (2013). The multiple displacements of Mangalore special economic zones. Economic and Political Weekly, 48(33), 40-46.
8. Fisher, E.M. (1933). Speculation in suburban lands. The American Economic Review 23(1), 152-162.
9. Gill, S.S. (2007). Special economic zones and displacement. Man and Development, 29(4), 95-106.
10. GOI (2005). The Special Economic Zones Act 2005, No. 28 of 2005, dated June 23. Government of India: Ministry of Law and Justice. Retrieved from: https://commerce.gov.in/writereaddata/aboutus/actspdfs/SEZ%20Act,%202005.pdf
11. GOI (2010). Guidelines for development of special economic zones, dated October 27, Government of India: Ministry of Commerce and Industry. Retrieved from: http://sezindia.nic.in/upload/uploadfiles/files/10Instruction%20No_65.pdf
12. GOI (2013). Gazette notification dated August 12. Retrieved from: http://sezindia.nic.in/upload/upload files/files/13_SEZ%20Amendment.pdf
13. GOI (2014a). Chapter IV: Land allotment and utilisation. In Department of Revenue (Indirect Taxes - Customs), Union Government, Performance audit of Special Economic Zones (SEZs), Report No. 21 of 2014. Retrieved from: https://cag.gov.in/sites/default/files/audit_report_files/Union_Performance_Dept_Revenue_Indirect_Taxes_Special_Economic_Zones_SEZs_21_2014.pdf
14. GOI (2014b). Zone wise notified land area details (as on 23.01.2014). Government of India: Ministry of Commerce and Industry. Retrieved from: http://sezindia.nic.in/upload/uploadfiles/files/30VACANT%20LAND%20AREA%20AVILABLE%20IN%20SEZs.pdf
15. GOI (2017a). List of notified SEZs set up under SEZ Act, 2005 as on 01-12-2017. Government of India: Ministry of Commerce and Industry. Retrieved from: http://sezindia.nic.in/upload/uploadfiles/files/notified(1).pdf
16. GOI (2017b). List of operational SEZs of India as on 01-12-2017. Government of India: Ministry of Commerce and Industry. Retrieved from: http://sezindia.nic.in/upload/uploadfiles/files/ListofoperationalSEZs(1).pdf
17. GOI (2018a). Gazette notification dated September 19. Government of India: Ministry of Commerce and Industry. Retrieved from: http://sezindia.nic.in/upload/uploadfiles/files/SEZ%20Rules%20amnedment.pdf
18. GOI (2018b). Revitalising SEZs: From islands of exports to catalysts of economic and employment growth. Retrieved from: http://sezindia.nic.in/upload/latestnews/5c401a4291212Circular.pdf
19. GOI (2019). Gazette notification dated December 17. Government of India: Ministry of Commerce and Industry. Retrieved from: http://sezindia.nic.in/upload/uploadfiles/files/Amendment%20rules%202006.pdf
20. Goldman, M. (2011). Speculative urbanism and the making of the next world city. International Journal of Urban and Regional Research, 35(3), 1-27.

90 / NAGARLOK VOL. LII, Part 4, October-December 2020
21. Gopalkrishnan, S. (2007). Special Economic Zones and neoliberalism in India. Man and Development, 29(4), 25-40.
22. Government of Kerala (2008). SEZ Policy. Retrieved from: http://sezindia.nic.in/upload/uploadfiles/files/8kerala%20policy.pdf
23. Government of West Bengal (2011). Singur Land Rehabilitation and Development Act 2011. Retrieved from: http://www.bareactslive.com/WB/WB626.
24. Indian Kanoon (2016). Kedar Nath Yadav vs State of West Bengal & Ors on 31 August 2016. Retrieved from: https://indiankanoon.org/doc/168057026
25. Khurud, B.S. (2013). Export performance of SEZs in India. International Journal of Economics and Research, 4(4), 1-5. Retrieved from: https://www.ijeronline.com/documents/volumes/Vol4Iss4JA2013/ijer%20v4i4%20ja%202013(1).pdf
26. Wadhva, K. (1983). Land-use pattern in urban fringe areas - Case study of Ahmedabad. Economic and Political Weekly, 18(14), 541-545.
27. Levien, M. (2011). Special economic zones and accumulation by dispossession in India. Journal of Agrarian Change, 11(4), 454-483.
28. Madhab, J. (1969). Controlling urban land values. Economic and Political Weekly, 4(28), 1197-1202.
29. Mitra, S. (2007). Special economic zones: Rationale and pitfalls in implementation. Man and Development, 29(4), 25-40.
30. Mukherjee, A., Pal. P., Deb, S., Ray, S. and Goyal, T.M. (2016). Special economic zones in India: Status, issues and potential. New Delhi: Springer.
31. Mukhopadhyay, P. and Pradhan, K.C. (2009). Location of SEZs and policy benefits: What does the data say?” New Delhi: Centre for Policy Research.
32. Patrika (2014, May 10). Jodhpur SEZ Flop. Retrieved from: https://www.patrika.com/jaipur-news/sez-jodhpur-folp-981330/
33. Pratap, S. (2012). Resistance movement against SEZs: Case studies of Kakinada SEZ and Brandix SEZ in Andhra Pradesh. Asia Monitor Resource Centre. Retrieved from https://amrc.org.hk/sites/default/files/Resistance%20against%20SEZs%20in%20India.pdf
34. Ramachandran, R. (1989). Chapter 10-"The rural-urban fringe". Urbanisation and Urban Systems in India. New Delhi: Oxford University Press.
35. Rawat, V.B., Mamidi B.B. and Surepally, S. (2011). The impact of special economic zones in India: A case study of Polepally SEZ. International Land Coalition and Social Development Foundation. Retrieved from: http://www.indiaenvironmentportal.org.in/files/WEB_SDF_India_final_layout.pdf
36. Rediff (2007, February 21). Rivalry between business houses has blown up the SEZ issue. Retrieved from: https://www.rediff.com/money/2007/feb/21sez.htm

LAND UTILISATION IN SPECIAL ECONOMIC ZONES IN INDIA /91 SURYA TEWARI
37. Sampat, P. (2008). Special economic zones in India. Economic and Political Weekly, 43(28), 25-29.
38. Shah, A. (2013). Mainstreaming or marginalisation? Evidence from special economic zones in Gujarat. Economic and Political Weekly, 48(41), 55-61.
39. Sharma, N.K. (2009). Special economic zones: Socio-economic implications. Economic and Political Weekly, 44(20), 18-21.
40. Sharma, V. (2007). Implications of a Special Economic Zone on project affected people: A case study of reliance Haryana SEZ. Man and Development, 29(4), 77-94.
41. The Hindu (2018a, October 1). Ryots’ bid to take back land leads to tension. Retrieved from: https://www.thehindu.com/todays-paper/tension-builds-over-kakinada-sez-land/article25091814.ece
42. The Hindu (2018b, January 31). Navi Mumbai SEZ now an integrated industrial area. Retrieved from: https://www.thehindu.com/news/cities/mumbai/navi-mumbai-sez-now-an-integrated-industrial-area/article22598679.ece
43. The Indian Express (2017, July 26). Board of approval clears denotification of 81 special economic zones. Retrieved from: https://indianexpress.com/article/business/nirmala-sitharaman-board-of-approval-clears-de-notification-of-81-special-economic-zones-4768357/
44. The Tribune (2016, April 24). Denotified’ SEZs’ promoters can now obtain industrial licenses. Retrieved from: https://www.tribuneindia.com/news/haryana/community/-denotified-sezs-promoters-can-now-obtain-industrial-licenses/226601.html
Endnotes1. The January 2014 database contains data of 19 EPZs and SEZs, rechristened
or set up respectively, before the enactment of SEZ Act, 2005 (GOI, 2014b). In case of December 2017 database, the list of notified SEZs is of SEZs notified in SEZ Act 2005 (GOI, 2017a). The list of operational SEZs on the other hand contains the EPZs/SEZs of prior to SEZ Act as well (GOI, 2017b). With one SEZs in Jodhpur got denotified in May 2014 the number of previously existing EPZs/SEZs reduced to 18 (Patrika, May 10, 2014). The number of SEZs thus considered in 2017 database thus includes these 18 EPZs/SEZs. One more SEZ has been added in the list of SEZs of 2017. The SEZ was in Information Technology Enabled Services (ITES) located at Madhurwada in Vishakhapatnam, Andhra Pradesh. This SEZ is run by Andhra Pradesh Industrial Infrastructure Corporation Ltd and is being mentioned in the list of operational SEZs but not in the notified list. Its year of notification on the website of Andhra Pradesh Industrial Infrastructural Corporation Ltd. (APIIC) is given as April 11, 2007.
2. Other than Jaipur and Mahindra SEZs, there are three more notified SEZs in the state. These are Genpact in IT/ITES at Jaipur, RNB infrastructure in Textiles at Bikaner, and Somani Worsted in ITES in Alwar. All three are in the private sector. However, none of the three are operational.

92 / NAGARLOK VOL. LII, Part 4, October-December 2020
3. The official data provides figures on total utilisation of land in SEZs. Utilisation has not been defined anywhere in the Act or Policy. From the Secretary, NOIDA SEZ, it was known that the total utilised area includes area utilised under processing; under amenities like roads, parks, substations, and common facility; and under green belt. The area utilised under processing is also known as plot area.
4. As per the SEZ Act, Domestic Tariff Area (DTA) refers to the whole of India, including the territorial waters and continental shelf but excluding the SEZ areas.