Embed Size (px)
Citation preview

Land Use Assumptions Report 2014 Update—Final Draft
West Bradford Township
2014
The Brandywine Conservancy McMahon Associates
1/21/2014

Introduction Land Use Assumptions Report Brandywine Conservancy December 12, 2013 West Bradford Township
1 of 31
Table of Contents 1. Introduction .................................................................................................................... 3
1.1. Purpose and Objectives ............................................................................................................. 3
1.2. Pertinent Background Studies .................................................................................................. 3
2. Description of Study Areas .......................................................................................... 3
2.1. Boundary Descriptions .............................................................................................................. 3
2.2. Road Listing ................................................................................................................................ 4
3. Existing Land Use and Zoning .................................................................................. 11
3.1. Description of Existing Development ................................................................................... 11
3.2. Description of Existing Zoning .............................................................................................. 15
4. Demographics and Growth Trends .......................................................................... 16
4.1. Population ................................................................................................................................. 16
4.2. Building Permits ....................................................................................................................... 17
4.3. Employment.............................................................................................................................. 18
5. Future Development Potential ................................................................................. 21
5.1. Analysis of Vacant Parcels, Zoning, and Physical Constraints ......................................... 21
6. Summary and Conclusion .......................................................................................... 25
Appendix A. Build-Out by Parcel................................................................................. 26Appendix B. Maps Table of Tables Table 1. State Roads in the Western TSA ................................................................................................ 4 Table 2. State Roads in the Southern TSA .............................................................................................. 4 Table 3. Township Roads in the Western TSA ....................................................................................... 5 Table 4. Township Roads in the Southern TSA ..................................................................................... 7 Table 5. Study Intersections .................................................................................................................... 10 Table 6. Major Existing Residential Developments in the Western TSA ......................................... 13 Table 7. Major Existing Residential Developments in the Southern TSA ........................................ 14 Table 8. Major Approved, Un-built Residential Developments in the Western TSA .................... 15 Table 9. Major Approved, Un-built Residential Developments in the Southern TSA ................... 15 Table 10. Zoning Densities and Intensities (Residential and Non-Residential Development) ..... 15 Table 11. Population, Actual and Projected, 1970–2040 ..................................................................... 16 Table 12. Population Growth Rates, 1970–1979 through 2030–2039 ................................................. 16 Table 13. Environmental Constraints on Development...................................................................... 22 Table 14. Land Available for Residential Development (Western TSA) .......................................... 22 Table 15. Land Available for Residential Development (Southern TSA) ......................................... 23 Table 16. Land Available for Non-Residential Development (Western TSA) ................................. 23

Introduction Land Use Assumptions Report Brandywine Conservancy December 12, 2013 West Bradford Township
2 of 31
Table 17. Land Available for Non-Residential Development (Southern TSA) ............................... 23 Table 18. Ultimate Residential Build-Out Capacity (Western TSA) ................................................. 24 Table 19. Ultimate Residential Build-Out Capacity (Southern TSA) ................................................ 24 Table 20. Ultimate Non-Residential Build-Out Capacity (Western TSA) ........................................ 24 Table 21. Ultimate Non-Residential Build-Out Capacity (Southern TSA) ....................................... 24 Table 22. Development by Time Period (both TSAs) .......................................................................... 25 Table 23. Residential Build-Out—Vacant Parcels ................................................................................ 26 Table 24. Residential Build-Out—Underdeveloped Parcels .............................................................. 27 Table 25. Non-Residential Build-Out .................................................................................................... 31 Table of Figures Figure 1. Livable Landscapes ................................................................................................................. 13 Figure 2. Population & Population Projections, 1970–2040 ................................................................ 17 Figure 3. Annual Building Permits for New Residential Construction, 2007–2012 ........................ 18 Figure 4. Commute Mode ....................................................................................................................... 19 Figure 5. Vehicles Available ................................................................................................................... 19 Figure 6. Travel Time to Work ............................................................................................................... 20 Figure 7. Place of Work ........................................................................................................................... 20
Description of Study Areas Land Use Assumptions Report Brandywine Conservancy December 12, 2013 West Bradford Township
3 of 31
1 Introduction
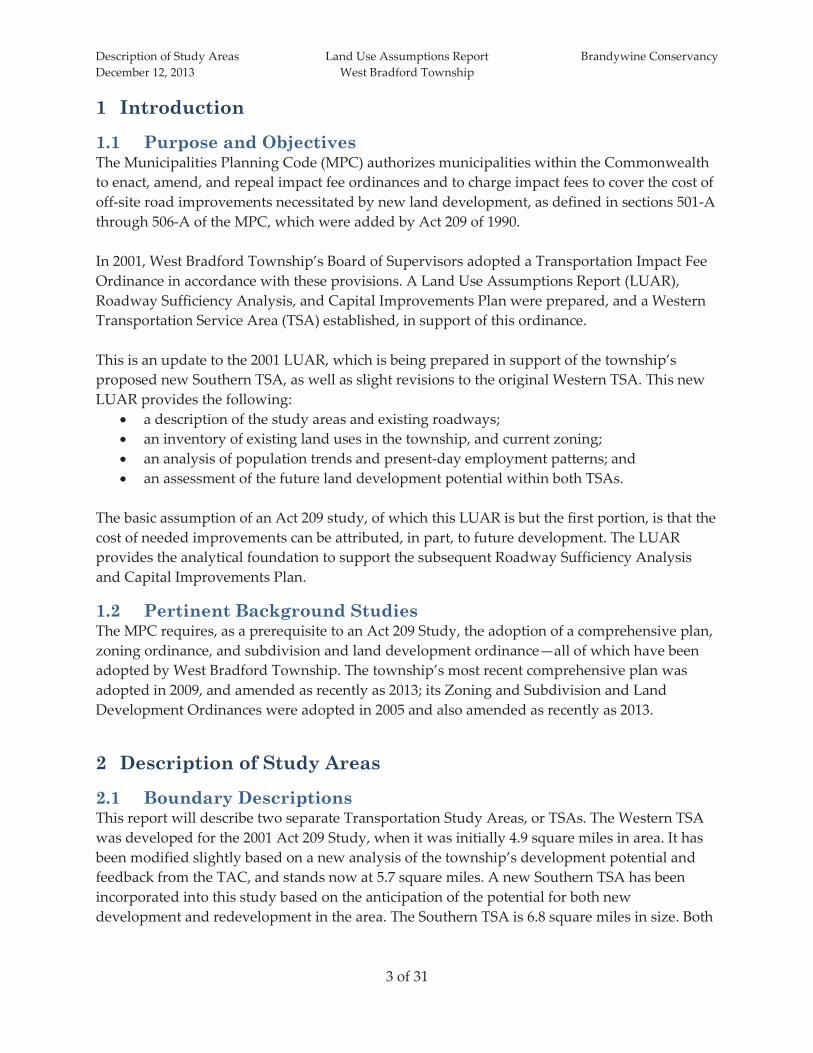
1.1 Purpose and Objectives The Municipalities Planning Code (MPC) authorizes municipalities within the Commonwealth to enact, amend, and repeal impact fee ordinances and to charge impact fees to cover the cost of off-site road improvements necessitated by new land development, as defined in sections 501-A through 506-A of the MPC, which were added by Act 209 of 1990. In 2001, West Bradford Township’s Board of Supervisors adopted a Transportation Impact Fee Ordinance in accordance with these provisions. A Land Use Assumptions Report (LUAR), Roadway Sufficiency Analysis, and Capital Improvements Plan were prepared, and a Western Transportation Service Area (TSA) established, in support of this ordinance. This is an update to the 2001 LUAR, which is being prepared in support of the township’s proposed new Southern TSA, as well as slight revisions to the original Western TSA. This new LUAR provides the following:
a description of the study areas and existing roadways; an inventory of existing land uses in the township, and current zoning; an analysis of population trends and present-day employment patterns; and an assessment of the future land development potential within both TSAs.
The basic assumption of an Act 209 study, of which this LUAR is but the first portion, is that the cost of needed improvements can be attributed, in part, to future development. The LUAR provides the analytical foundation to support the subsequent Roadway Sufficiency Analysis and Capital Improvements Plan.
1.2 Pertinent Background Studies The MPC requires, as a prerequisite to an Act 209 Study, the adoption of a comprehensive plan, zoning ordinance, and subdivision and land development ordinance—all of which have been adopted by West Bradford Township. The township’s most recent comprehensive plan was adopted in 2009, and amended as recently as 2013; its Zoning and Subdivision and Land Development Ordinances were adopted in 2005 and also amended as recently as 2013.
2 Description of Study Areas
2.1 Boundary Descriptions This report will describe two separate Transportation Study Areas, or TSAs. The Western TSA was developed for the 2001 Act 209 Study, when it was initially 4.9 square miles in area. It has been modified slightly based on a new analysis of the township’s development potential and feedback from the TAC, and stands now at 5.7 square miles. A new Southern TSA has been incorporated into this study based on the anticipation of the potential for both new development and redevelopment in the area. The Southern TSA is 6.8 square miles in size. Both

Description of Study Areas Land Use Assumptions Report Brandywine Conservancy December 12, 2013 West Bradford Township
4 of 31
TSAs are depicted on Map 1. These areas have to be separated, since the MPC limits the area of a Transportation Service Area to 7 square miles.
2.2 Road Listing Within the study areas there are approximately 18.0 miles of roads owned and maintained by the state and 52.9 miles of roads owned and maintained by the township. Table 1 and Table 2 list state roads, their length, and their functional classifications for the Western and Southern TSAs, respectively. Table 3 and Table 4 list the same information for township roads. Map 2 depicts all roads in the township by their functional classification.1
Table 1. State Roads in the Western TSA
Road Name Length
(mi.) Route
Number Functional Classification
Marshallton-Thorndale Rd 1.02 3055 Minor Arterial W Strasburg Rd 2.24 3062 Minor Arterial Embreeville Rd 0.40 3064 Minor Collector Romansville Rd 1.94 3051 Minor Collector West Chester Rd 0.90 3064 Minor Collector Stargazers Rd 0.77 3051 Primary Local Distributor
7.26
Table 2. State Roads in the Southern TSA
Road Name Length
(mi.) Route
Number Functional Classification
Telegraph Rd 1.36 0162 Major Collector
Downingtown Pk 0.92 0322 Major Arterial Marshallton-Thorndale Rd 1.76 3055 Minor Arterial W Strasburg Rd 4.10 3062 Minor Arterial Embreeville Rd 0.02 3064 Minor Collector Sugars Bridge Rd 1.41 3059 Minor Collector Northbrook Rd 1.62 3058 Primary Local Distributor Brandywine Dr 0.21 3058 Secondary Local Distributor Camp Linden Rd 0.67 3023 Secondary Local Distributor
Total Length 12.07
1 The source of this information is Chester County’s GIS department.

Description of Study Areas Land Use Assumptions Report Brandywine Conservancy December 12, 2013 West Bradford Township
5 of 31
Table 3. Township Roads in the Western TSA
Road Name Length
(mi.) Route
Number Functional Classification
Beacon Hill Rd 0.16 T380 Primary Local Distributor Chestnut Ln 1.26 T381 Primary Local Distributor Lieds Rd 0.92 T376 Primary Local Distributor Oaklyn Rd 0.06 T381 Primary Local Distributor Poorhouse Rd 0.89 T430 Primary Local Distributor Alton Wy 0.64 Secondary Local Distributor Arrowhead Tr 0.27 T520 Secondary Local Distributor Bally Moor Dr 0.33 TBD Secondary Local Distributor Blueberry Ln 0.20 T474 Secondary Local Distributor Boulder Dr 0.15 T533 Secondary Local Distributor Cranberry Ln 0.53 T475 Secondary Local Distributor Elk Run Rd 0.36 Secondary Local Distributor Ericsson Dr 0.58 T469 Secondary Local Distributor Fawn Ln 0.48 T521 Secondary Local Distributor Gallagherville Rd 0.31 T425 Secondary Local Distributor Glen Dr 0.08 T480 Secondary Local Distributor Grenoble Rd 0.16 Secondary Local Distributor Harrison Rd 0.07 Secondary Local Distributor Jamestown Dr 0.27 Secondary Local Distributor Luna Dr 0.12 Secondary Local Distributor Milta Hill Rd 0.28 Secondary Local Distributor Oakwood Rd 0.51 T403 Secondary Local Distributor Persimmon Dr 0.19 T473 Secondary Local Distributor Powder Mill Rd 0.29 Secondary Local Distributor S Bailey Rd 0.46 T401 Secondary Local Distributor Sterner Mill Rd 0.21 Secondary Local Distributor Stockton Rd 0.26 Secondary Local Distributor Strawberry Ln 0.17 T485 Secondary Local Distributor Wetherhill Dr 0.14 T530 Secondary Local Distributor Shadyside Rd 1.08 T515 Major Collector Broad Run Rd 2.99 T383 Minor Collector Glenside Rd 0.61 T426 Minor Collector Stouff Rd 0.54 T408 Minor Collector Austin Ct 0.04 Local Access Street Berue Dr 0.48 T472 Local Access Street

Description of Study Areas Land Use Assumptions Report Brandywine Conservancy December 12, 2013 West Bradford Township
6 of 31
Brownsville Rd 0.30 Local Access Street Campus Dr 0.05 Private Local Access Street Canyon Dr 0.23 T536 Local Access Street Claridge Ct 0.13 Local Access Street Colts Neck Rd 0.10 Local Access Street Desantis Dr 0.25 T471 Local Access Street Donna Ln 0.00 T517 Local Access Street E Sedona Dr 0.28 T535 Local Access Street E Stonington Dr 0.25 Local Access Street Escourt Dr 0.12 T470 Local Access Street Evergreen Dr 0.14 Private Local Access Street Forsythia Cir 0.12 Local Access Street Fox Run Dr 0.24 T466 Local Access Street Goldenridge Dr 0.16 Local Access Street Goldenrod Dr 0.23 Local Access Street Heather Dr 0.10 T523 Local Access Street High Country Rd 0.27 Local Access Street Highspire Rd 0.21 Local Access Street Hillcrest Ln 0.28 T465 Local Access Street Hilltop Rd 0.39 T452 Local Access Street Honeysuckle Ct 0.18 Local Access Street Hunt Dr 0.25 T460 Local Access Street Julie Dr 0.09 T518 Local Access Street Lone Eagle Rd 1.47 T402 Local Access Street Margaret Dr 0.13 T441 Local Access Street Marion Dr 0.12 T442 Local Access Street Marsha Ln 0.04 T519 Local Access Street Overlook Dr 0.24 T461 Local Access Street Polo Run Dr 0.31 Local Access Street Radburn Ct 0.09 Local Access Street Red Rock Dr 0.05 T537 Local Access Street Rene Ln 0.03 T516 Local Access Street Ridgewood Dr 0.32 Private Local Access Street Shannon Ln 0.19 Private Local Access Street Stanwood Ct 0.06 Local Access Street Stock Grange Dr 0.22 T496 Local Access Street Sunset Dr 0.25 T547 Local Access Street Teresa Ct 0.20 TBD Local Access Street Thistle Ct 0.02 Local Access Street

Description of Study Areas Land Use Assumptions Report Brandywine Conservancy December 12, 2013 West Bradford Township
7 of 31
Treeline Dr 0.41 Local Access Street W Sedona Dr 0.19 T534 Local Access Street W Stonington Dr 0.27 Local Access Street Weible Dr 0.17 T527 Local Access Street Winfield Dr 0.25 T528 Local Access Street Youngs Rd 0.10 Local Access Street Unnamed Rd 0.10
Total Length 25.62
Table 4. Township Roads in the Southern TSA
Road Name Length
(mi.) Route
Number Functional Classification
Broad Run Rd 2.83 T383 Primary Local Distributor Creagh Knoll Ln 0.00 T492 Primary Local Distributor Lieds Rd 0.42 T376 Primary Local Distributor N Wawaset Rd 1.08 T434 Primary Local Distributor Cann Rd 0.43 T432 Secondary Local Distributor Clayton Rd 1.10 T374 Secondary Local Distributor Edgemont Dr 0.25 T447 Secondary Local Distributor Jonathan Rd 0.16 Private Secondary Local Distributor Linda Dr 0.46 T449 Secondary Local Distributor Lucky Hill Rd 0.29 T377 Secondary Local Distributor Montvale Cir 0.93 T448 Secondary Local Distributor Old Shadyside Rd 0.34 T551 Secondary Local Distributor Ryan Blvd 0.86 Private Secondary Local Distributor Saint Andrews Dr 0.40 TBD Secondary Local Distributor Tattersall Wy 0.59 TBD Secondary Local Distributor Tuckaway Tr 0.27 TBD Secondary Local Distributor Shadyside Rd 2.59 T515 Minor Arterial Glenside Rd 0.18 T426 Minor Collector Hall Rd 1.29 T387 Minor Collector Telegraph Rd 3.61 Minor Collector Appleville Rd 0.36 Private Local Access Street Aurora Dr 0.05 T542 Local Access Street Autumn View Dr 0.05 T524 Local Access Street Baldwin Dr 0.12 Private Local Access Street Bent Oak Tr 0.09 T544 Local Access Street Butternut Cir 0.13 TBD Local Access Street

Description of Study Areas Land Use Assumptions Report Brandywine Conservancy December 12, 2013 West Bradford Township
8 of 31
Carriage Ln 0.17 T451 Local Access Street Central Dr 0.70 Private Local Access Street Coltsfoot Dr 0.13 Local Access Street Conley Dr 0.15 Private Local Access Street Courtland Pl 0.06 Private Local Access Street Crab Apple Ln 0.02 Private Local Access Street Crawford Ln 0.25 T388 Local Access Street Delicious Dr 0.08 Private Local Access Street Dogwood Hill Rd 0.42 T438 Local Access Street Ferncliffe Ln 0.06 Private Local Access Street Great Rd 0.51 T431 Local Access Street Groundhog College Rd 0.51 T428 Local Access Street Hall Ln 0.41 Private Local Access Street Hecker Dr 0.16 Private Local Access Street Hidden View Dr 0.28 T455 Local Access Street Highgrove Dr 0.39 TBD Local Access Street Jolene Dr 0.21 T440 Local Access Street Kay Cir 0.07 T439 Local Access Street Kelly Ann Dr 0.21 T457 Local Access Street Locust Cir 0.05 Private Local Access Street Machinery Rd 0.23 Private Local Access Street Manorwood Dr 0.35 T454 Local Access Street Martlet Rise Ln 0.19 Private Local Access Street McIntosh Ln 0.18 Private Local Access Street Melba Ln 0.05 Private Local Access Street Mutsu Ln 0.11 Private Local Access Street Oak Hollow Dr 0.25 TBD Local Access Street Pine Dr 0.03 Private Local Access Street Rome Rd 0.27 Private Local Access Street Royal Berkshire Cir 0.28 TBD Local Access Street Sawmill Rd 0.02 Private Local Access Street Sawtimber Tr 0.15 Private Local Access Street Scattergood Ln 0.25 Private Local Access Street Shadebrush Ridge 0.42 TBD Local Access Street Shady Glen Rd 0.05 Private Local Access Street Shagbark Dr 0.00 TBD Local Access Street Sherwood Dr 0.48 T450 Local Access Street Silverbark Ln 0.28 Private Local Access Street Spring Oak Dr 0.26 T525 Local Access Street

Description of Study Areas Land Use Assumptions Report Brandywine Conservancy December 12, 2013 West Bradford Township
9 of 31
Spruce Dr 0.33 T459 Local Access Street Stayman St 0.23 Private Local Access Street Sundance Dr 0.12 T458 Local Access Street Sunhigh Dr 0.14 Private Local Access Street Suzanne Dr 0.37 T456 Local Access Street Sylvan Dr 0.23 T445 Local Access Street Timberland Dr 0.14 T543 Local Access Street Towerview Dr 0.47 Private Local Access Street Waltz Rd 0.75 T384 Local Access Street Warpath Rd 0.25 T373 Local Access Street Whiffletree Ln 0.00 TBD Local Access Street Winesap Wy 0.14 Private Local Access Street Woodward Dr 0.10 T435 Local Access Street Yankee Dr 0.44 T462 Local Access Street N Marshallton Al 0.247 N/A Alley S Marshallton Al 0.097 N/A Alley
Total Length 27.29 Roads have a hierarchy based on their capacity, mobility, and access. This hierarchy divides roads into functional classifications. Within the study areas, there are roads designated as major arterials, minor arterials, major collectors, minor collectors, primary local distributors, secondary local distributors, and local access streets.2 Major arterials move large volumes of traffic at higher speeds. Access points to these roadways are limited. On-street parking is prohibited and the shoulders and lanes are wide. They serve traffic on an inter-regional basis and have mostly through trips. Minor arterials carry relatively large traffic volumes at moderate speeds. These roads often connect residential areas with employment and commercial centers or other destinations that support regional activities. Access controls are usually included, although access to adjacent land uses is provided. These roads frequently span long distances, but primarily support short distance trips. Minor collectors gather traffic from local roads and direct it to the major collectors. Volumes and speeds are relatively low on these roads since access is the predominant function. Minor collectors provide access to local facilities and provide connections to and between residential neighborhoods.
2 All definitions are from the 2009 West Bradford Township Comprehensive Plan.

Description of Study Areas Land Use Assumptions Report Brandywine Conservancy December 12, 2013 West Bradford Township
10 of 31
Major collectors carry relatively large traffic volumes at moderate speeds. These roads often connect residential areas with employment and commercial centers or other destinations that support regional activities. Access controls are usually included although access to adjacent land uses is provided. These roads frequently span long distances, but primarily support short distance trips. Primary local distributors are the highest-order local roads and move traffic from lower-order local roads to collectors. They generally have no parking and their points of access are more limited. Secondary local distributors are the middle-order local roads. They move traffic from local access streets to higher-order roads. They may allow parking, may have one-way restrictions, and have more access points. Local access streets serve no through function, carry low traffic volumes, and serve a limited number of dwelling units. The majority of roads in the study area are local access streets. It is anticipated that the intersections on Table 5 on the preceding page will be studied in the subsequent Roadway Sufficiency Analysis.
Table 5. Study Intersections
Western TSA Southern TSA
1 Romansville Rd/Stouff’s Rd & West Chester Rd 1 Shadyside Rd & Downingtown Pk
2 Romansville Rd & Chestnut Ln 2 Shadyside Rd & Marshallton Thorndale Rd
3 Romansville Rd & Lone Eagle Rd 3 Shadyside Rd & Glenside Rd (northern intersection)
4 Romansville Rd & Strasburg Rd 4 Shadyside Rd & Glenside Rd (southern intersection)
5 Strasburg Rd & Lone Eagle Rd 5 Hall Rd & Downingtown Pk
6 Strasburg Rd & Shadyside Rd 6 Hall Rd & Marshallton Thorndale Rd
7 Strasburg Rd & Stargazer Rd 7 Sugars Bridge Rd & Downingtown Pk
8 Strasburg Rd & Leids Rd 8 Telegraph Rd & Sugars Bridge Rd (eastern intersection)
9 Broad Run Rd & Leids Rd 9 Telegraph Rd & Sugars Bridge Rd (western intersection)
10 Broad Run Rd & Shadyside Rd 10 Telegraph Rd & Marshallton Thorndale Rd
11 Broad Run Rd & Chestnut Ln 11 Telegraph Rd & Broad Run Rd
12 Broad Run Rd & Beacon Hill Rd 12 Strasburg Rd & Sugars Bridge Rd
13 Broad Run Rd & Poorhouse Rd 13 Strasburg Rd & Northbrook Rd
14 West Chester Rd/Broad Run Rd & Embreeville Rd 14 Strasburg Rd & Marshallton Thorndale Rd
15 West Chester Rd & South Bailey Rd 15 Strasburg Rd & Telegraph Rd
16 Chestnut Ln & Oakwood Rd 16 Strasburg Rd & Broad Run Rd (eastern intersection)
17 Chestnut Ln & Lone Eagle Rd 17 Strasburg Rd & Broad Run Rd (western intersection)
18 Marshallton Thorndale Rd & Poorhouse Rd 18 Northbrook Rd & Wawaset Rd

Existing Land Use and Zoning Land Use Assumptions Report Brandywine Conservancy December 12, 2013 West Bradford Township
11 of 31
3 Existing Land Use and Zoning
3.1 Description of Existing Development Historically, West Bradford Township has been a rural community dominated by agriculture and woodlands. Its rolling topography has guided and constrained settlement patterns. Non-agricultural land uses were historically concentrated in the villages of Marshallton and Romansville along Strasburg Rd. This remained essentially the case till the 1960s. Significant development began in that decade and has continued to the present—although the rate of development has slowed considerably, with the ‘90s and ‘00s seeing growth of just 4% and 13%, respectively. (Projections for future development will be discussed in Section 4.1 ) Areas of the township developed at different times over the past half-century as sewer and water lines were built and road access increased. Today, the eastern portion of the township is substantially built-out or preserved, with significant future development in this area limited. The central portion of the township, thanks to the widespread availability of sewer, has accommodated most of the development for the past few decades. The build-out of approved developments and limited infill development is expected. The northwestern, western, and, to a lesser extent, southern portions of the township are currently, and will continue to be, the main areas of development. These two areas are delineated by the two TSAs (see Map 1). West Bradford Township has been characterized in Landscapes2, Chester County’s Comprehensive Plan, as both suburban and rural, with large areas falling under both classifications (see Figure 1). Most of its residents commute outside the township for employment (see Section 4.3 ). Existing land use in the study areas is primarily low-density (<1 dwelling unit per acre) single-family residential and agriculture; there is also a small area of medium-density (4 DUs per acre) residential in the Western TSA and a sizeable tract with abandoned institutional buildings (Embreeville State Hospital) zoned IM (Institutional/Mixed) in the Southern TSA (see Map 3 and Table 10). The township’s comprehensive plan guides future land use. The plan includes goals, objectives, and recommendations that guide and affect development. Specific development regulations are embodied in the township’s Zoning and Subdivision and Land Development Ordinances. Future development expected to result from these documents is largely low density suburban in nature. This development will be sensitive to much of the municipality’s natural resources and historical character. A new area of medium to high-density residential development is planned for the northwest portion of the township, as an alternative to industrial development historically planned for this same area but only lightly developed as such. Open space preservation, both within the context of development and by its outright acquisition, are priorities in many other parts of the township.

Existing Land Use and Zoning Land Use Assumptions Report Brandywine Conservancy December 12, 2013 West Bradford Township
12 of 31
Specifically, within the study area, a large portion of the potentially developable land is assumed to accommodate single-family residential uses at around 0.49 dwelling units to the acre, after development constraints are accounted for and assuming maximum density permitted by zoning. In addition, for the northern part of the Western TSA, specifically at the intersection of Poorhouse and Marshallton-Thorndale Roads, an area zoned Industrial can now also accommodate high-density residential land uses at up to 8 units per gross acre. Several other areas are planned and zoned for commercial, institutional, or industrial uses. In the southern part of the township, the area around Embreeville includes two developable parcels zoned IM—the former Embreeville State Hospital tract, and an adjacent parcel. Assuming current zoning remains, this area could ultimately see the addition of roughly 1.25 million square feet of additional non-residential building space. In the northern portion of the township, within the Western TSA, there is one parcel that, if developed to the fullest extent permitted by zoning, would yield over 160 thousand square feet of additional non-residential building space. See Section 5.1 for a more complete discussion of West Bradford’s development potential.

Existing Land Use and Zoning Land Use Assumptions Report Brandywine Conservancy December 12, 2013 West Bradford Township
13 of 31
Figure 1. Livable Landscapes
Major existing residential developments within the study areas are outlined in Table 6 (Western TSA) and Table 7 (Southern TSA).
Table 6. Major Existing Residential Developments in the Western TSA
Development Name Streets Dwelling
Units Type
1 Aspenwood Boulder, Canyon, Red Roack, Sedona (E&W)
38 SFD
2 Bally Moor Bally Moor 15 SFD 3 Bradford Meadows Winfield 22 SFD 4 Bradford Pointe Elk Run, High Country 45 SFD 5 Bradford Woods Ericsson (portion) 20 SFD

Existing Land Use and Zoning Land Use Assumptions Report Brandywine Conservancy December 12, 2013 West Bradford Township
14 of 31
6 Chestnut Ridge / Chestnut Ridge Estates
Alton, Austin, Brownsville, Claridge, Colts Neck, Grenoble, Goldenridge, Harrison, Highspire, Jamestown, Milta Hill, Polo Run, Powder Mill, Radburn, Stanwood, Sterner Mill, Stock Grange, Stockton, Treeline, Weatherhill
285 SFD
7 Deer Crossing Fawn Lane 30 SFD
8 Fire Fox Blueberry, Cranberry, Persimmon, Strawberry
78 SFD
9 Fox Run Fox Run 17 SFD 10 Hillcrest Hillcrest 27 SFD 11 Hilltop Hilltop 32 SFD 12 Roman Chase Hunt 16 SFD 13 (unknown) Margaret & Marion 12 SFD 14 Marshall Hunt Sunset 12 SFD 15 Overlook Acres Overlook 20 SFD 16 Reserves at Chestnut Ridge Luna, Stonington (E&W) 37 SFD
17 Romans Village Berue, DeSantis, Ericsson (portion), Escourt, Weibel
80 SFD
18 Romansville West Strasburg 56 SFD 19 Wineberry Arrowhead 12 SFD
Table 7. Major Existing Residential Developments in the Southern TSA
Development Name Streets Dwelling
Units Type 1 Appleville (private roads) 125 MH
2 Deer Valley Aurora, Bent Oak, Hall (portion), Sherwood, Timberland
87 SFD
3 Dogwood Hills Dogwood Hill 24 SFD 4 Marshallton Farms Jolene, Kay 23 SFD 5 Hidden View Farms Hidden View, Kelly Ann, Sundance & Suzanne 50 SFD 6 Highgrove Highgrove 16 SFD 7 Marshallton Manor Manorwood 48 SFD
8 Crestmont Farms, Section 5
Montvale 42 SFD
9 Oak Hollow Oak Hollow 15 SFD 10 Spring Oaks Farms Spring Oak 18 SFD 11 Spruce Hill Spruce 20 SFD
12 Tattersall
Butternut, Foothill, Linda (portion), Royal Berkshire, Saint Andrews, Sawtimber, Shadebrush, Shagbark, Tattersall, Tuckaway, Whiffletree
173 SFD
13 Rebel Hill Yankee 24 SFD Major approved, un-built residential developments are listed in Table 8 (Western TSA) and Table 9 (Southern TSA) and shown on Map 6.

Existing Land Use and Zoning Land Use Assumptions Report Brandywine Conservancy December 12, 2013 West Bradford Township
15 of 31
Table 8. Major Approved, Un-built Residential Developments
in the Western TSA
Development Name Dwelling
Units Type
1 Meadowview 69 SFA
2 Stargazer Village at Romansville 39 SFA
3 Stargazer Village at Romansville 95 SFD
Table 9. Major Approved, Un-built Residential Developments in the Southern TSA
Development
Name Dwelling
Units Type
1 Freedom Village 12 SFA
2 Freedom Village 1 SFD
3 Tattersall 25 SFD
The existing land use pattern is generally consistent with the Future Land Use Map found in the township’s comprehensive plan.
3.2 Description of Existing Zoning Map 4 (Existing Zoning) shows the zoning of the parcels within the study area. A majority of the land is zoned R-1—Residential. This zoning district is used for single-family developments at a relatively low density. While the areas enclosed by the TSAs include many different zoning designations, only three other residential districts have any significant development potential—the R-4—Residential, the TND-2—Traditional Neighborhood Development 2, and the I—Industrial districts. Table 10 describes the zoning densities of the residential districts noted above, as well as the zoning densities or intensities, in total building square footage, for the non-residential districts that make up the study areas.
Table 10. Zoning Densities and Intensities (Residential and Non-Residential Development)
Zoning District
Portion of Study Area Permitted Density or Intensity
R-1 76.0% 0.63 units per net acre; mobile homes when expanding an existing mobile home park
R-4 0.7% 5 units per net acre
TND-2 1.3% 5 units per net acre
I 2.3% 8 units per gross acre; or 30%, up to 3 stories
IM 3.6% 30%, up to 3 stories
The remaining 16.1% of the areas unaccounted for in the tables are already developed.

Demographics and Growth Trends Land Use Assumptions Report Brandywine Conservancy December 12, 2013 West Bradford Township
16 of 31
4 Demographics and Growth Trends
4.1 Population West Bradford’s population increased from 2,996 in 1970 to 12,223 in 2010, an increase of 308%, according to the US Census (see Table 11). That represents an average decadal growth rate of 77%, though growth rates have in fact been largely declining, from a peak of 145% in the period 1970 – 1979, to 13% during the 2000s. Growth is expected to experience a brief spike over the next two decades, before returning to this level during the period 2030 – 2040, as depicted in Figure 2 and Table 12 below (resulting in 6,850 additional persons during the period 2010 – 2040). The projection shown in Figure 2 was arrived at through a comprehensive build-out analysis (see Section 5 ) that determined that, based on current zoning, West Bradford Township could see the addition of 2,315 additional dwelling units through 2040 (see Table 18 and Table 19). These tables and the figure also depict DVRPC’s population projection for West Bradford Township. DVRPC’s projections are based on the simplistic assumption that West Bradford will maintain a constant 2.5% of the county’s population over the next three decades, rather than a comprehensive analysis of land-use and development potential, as is the build-out. As such, this report assumes the latter has greater validity. Table 11. Population, Actual and Projected, 1970–2040
Year Actual &
DVRPC Build-Out
1970 2,996
1980 7,343 1990 10,406 2000 10,775
2010 12,223
2020 13,280 14,815 2030 15,098 17,405
2040 16,155 19,073
Table 12. Population Growth Rates, 1970–1979 through 2030–2039
Decade Actual &
DVRPC Build-Out
1970-1979 145% 1980-1989 42% 1990-1999 4%
2000-2009 13%
2010-2019 9% 21% 2020-2029 14% 17%
2030-2039 7% 10%

Demographics and Growth Trends Land Use Assumptions Report Brandywine Conservancy December 12, 2013 West Bradford Township
17 of 31
Figure 2. Population & Population Projections, 1970–2040
4.2 Building Permits As required by the MPC, Figure 3 shows the number of building permits issued annually from 2007 through 2012, as well as a linear regression line and its R2 value. The very low R2 value indicates that building permits issued are not a function of time, and that there is essentially no predictive value in the chart below. It is much more likely that the pace of new construction in West Bradford is dependent on the state of the regional, metropolitan, or even national economy—analyses of which are outside the scope of this report. It should, however, be noted that through the end of November, 31 permits have been issued in 2013. If this pace is kept up, 2013 will look much like 2012.
2,996
7,343
10,406 10,775
12,223
14,815
17,405
19,073
13,280
15,098 16,155
0
2,000
4,000
6,000
8,000
10,000
12,000
14,000
16,000
18,000
20,000
1970 1980 1990 2000 2010 2020 2030 2040
Popu
latio
n
Actual
Build-Out
DVRPC

Demographics and Growth Trends Land Use Assumptions Report Brandywine Conservancy December 12, 2013 West Bradford Township
18 of 31
Figure 3. Annual Building Permits for New Residential Construction, 2007–2012
4.3 Employment In an effort to understand commuting characteristics, which is an important aspect of the traffic impacts of both residential and non-residential development, data on commute mode, travel time to work, place of work, and vehicle availability were collected from the American Community Survey. These data are useful supplements to the decadal Census, as they are available on an ongoing basis. All of the following charts are based on the 2007 – 2011 American Community Survey, and consider only workers 16 years and older. Figure 4 and Figure 5 confirm that West Bradford is a car-dominant township. Only a tiny portion of the township’s 6,529 workers commuted to work in 2010 by a mode other than driving alone, with carpooling coming in a distant second, and walking and cycling practically non-existent. From Figure 5 we can see that it is much more likely for a worker to have 2 or even 3 vehicles available to him or her than 1; and hardly anyone is without access to a vehicle.
8
54
50
22
31
36 35
R² = 0.0178
0
10
20
30
40
50
60
2007 2008 2009 2010 2011 2012 2013

Demographics and Growth Trends Land Use Assumptions Report Brandywine Conservancy December 12, 2013 West Bradford Township
19 of 31
Figure 4. Commute Mode
Figure 5. Vehicles Available
Figure 6, which shows travel time to work, depicts a fairly wide range, with approximately 58% of workers commuting less than 29.6 minutes to work (which is the average travel time), and over 11% traveling more than an hour to their place of employment. Because the average travel time is longer than the median travel time (about 20–24 minutes), we can say that travel time to work is skewed high—a West Bradford worker is likelier to have a long commute than a short one.
83.7%
8.1% 1.9% 1.1% 0.0% 0.0%
5.2%
0%10%20%30%40%50%60%70%80%90%
1.5% 5.8%
53.7%
39.1%
0%
10%
20%
30%
40%
50%
60%
0 1 2 3Number of Vehicles Available

Demographics and Growth Trends Land Use Assumptions Report Brandywine Conservancy December 12, 2013 West Bradford Township
20 of 31
Figure 6. Travel Time to Work
The reasons for this lengthy commute, the high vehicle-ownership, and the tendency to drive alone become apparent with Figure 7, Place of Work. Only 8.7% of workers in West Bradford work in the township. The rest work elsewhere in the county (64.7%), outside the county but in the state (21.6%), or even outside the state (5.1%). West Bradford is a bedroom community, and we can therefore expect residential development to result in a relatively high traffic impact.
Figure 7. Place of Work
8.1% 9.4%
10.4%
22.2%
8.2%
11.7%
9.2% 9.5% 11.2%
0%
5%
10%
15%
20%
25%
<10 10-14 15-19 20-24 25-29 30-34 35-44 45-59 >60Minutes
8.7%
64.7%
21.6%
5.1%
0%
20%
40%
60%
80%
100%
Place of Employment
Outside PA
In PA
In Chester County
In West Bradford

Future Development Potential Land Use Assumptions Report Brandywine Conservancy December 12, 2013 West Bradford Township
21 of 31
5 Future Development Potential
5.1 Analysis of Vacant Parcels, Zoning, and Physical Constraints Previous sections surveyed existing land use patterns, current zoning, and demographic trends. Using that information, this section will develop a build-out scenario, and a timeframe for that build-out.
5.1.1 Methodology Residential vs. non-residential. The analysis discussed in this section is broken into two parts: residential and non-residential (institutional, commercial, or industrial). Lots were considered residential or non-residential based on the township’s zoning map (Map 4). Vacant and developable. In order to identify vacant and developable parcels, several criteria were set. First, all residentially-zoned parcels whose land use code in the GIS was “vacant” were selected. Next, and based on the information described in Table 10 in Section 3.2 , all residential parcels whose existing density was below the maximum possible (i.e., those parcels which could support additional development, per the existing zoning) were added to the selection. In the case of land zoned I District, parcels that were either vacant, in agricultural use, or developed with low investment uses, were assumed to be developed with medium- to high-density residential uses under the I District’s conditional use option, and with public water and sewer. Similar criteria were used to identify buildable non-residential parcels. Instead of looking at density, however, intensity was looked at in terms of allowable impervious coverage (Table 10). For example, if a parcel permitted a maximum impervious coverage of 25% but stood at only 16%, it was assumed that there was potential for an additional 9% of impervious. In order to account for the fact that only a portion of a site’s impervious coverage is for building space (the remaining normally being parking lots), the ratio of building-to-parking lot was determined. On average, for all commercial or industrially-zoned land in the township, 70% of the impervious coverage was comprised of parking, and only 30% for buildings. We assumed that this ratio would continue to hold for the next five years’ worth of development. Potentially significant or not. In order to simplify the analysis, all parcels whose area is currently below 5 acres were culled. Development of smaller lots (below 5 acres) was a final factor in the analysis. Environmental constraints. The next-to-last step in the analysis was to account for all environmental constraints, as identified in the township’s Zoning and Subdivision and Land Development Ordinances (Table 13). This resulted in a “net acreage” for each buildable parcel in the township. See also Map 5.

Future Development Potential Land Use Assumptions Report Brandywine Conservancy December 12, 2013 West Bradford Township
22 of 31
Table 13. Environmental Constraints on Development
Constraint Level of Constraint
Floodplain 100% Wetlands and buffers 100% Water bodies 100% Slopes > 20% 1 SFD for lots ≥ 3ac Riparian buffers:
Zone 1 100% Zone 2 90%
Multipliers. The penultimate step in the analysis was to apply the zoning ordinance’s density or intensity multipliers (see Table 10) to the net acreage identified in the previous step, which yielded a number of potential new dwelling units per lot (for residential) or total additional building square footage (for non-residential). Finally, in order to capture likely development on small lots (below 5 acres), an additional 5% was added to the residential build-out (see Table 18 and Table 19). The results of this analysis are shown on Maps 6 and 7 and in the next Subsection (5.1.2 ).
5.1.2 Results Table 14, Table 15, Table 16, and Table 17 show the number of parcels, the gross acreage, and the net acreage (after accounting for environmental constraints) for each developable parcel in each TSA. Parcels are divided into two major categories: under-developed and vacant, per the discussion in subsection 5.1.1 (Methodology) above.
Table 14. Land Available for Residential Development (Western TSA)
Number of Parcels Gross Acreage Net Acreage
Zoning District Under-
developed Vacant Under-
developed Vacant Under-
developed Vacant R-1 40 15 597.129 293.89 323.11 257.35 R-4 1 1 5.00 28.50 4.00 24.88
TND-2 0 0 0.00 0.00 0.00 0.00 I 1 0 137.31 0.00 0.00 0.00
Total 42 16 739.43 322.39 327.11 282.23

Future Development Potential Land Use Assumptions Report Brandywine Conservancy December 12, 2013 West Bradford Township
23 of 31
Table 15. Land Available for Residential Development (Southern TSA)
Number of Parcels Gross Acreage Net Acreage
Zoning District Under-
developed Vacant Under-
developed Vacant Under-
developed Vacant R-1 67 30 1,459.56 698.24 1,058.10 500.32 R-4 0 0 0.00 0.00 0.00 0.00
TND-2 2 0 34.00 0.00 30.27 0.00 I 0 0 0.00 0.00 0.00 0.00
Total 69 30 1,493.56 698.24 1,088.37 500.32
Table 16. Land Available for Non-Residential Development (Western TSA)
Zoning District
Number of Parcels
Gross Acreage
Net Acreage
I 1 31.14 30.09 IM 0 0 0 Total 6 31.14 30.09
Table 17. Land Available for Non-Residential Development (Southern TSA)
Zoning District
Number of Parcels
Gross Acreage
Net Acreage
I 0 0 0 IM 2 209.10 0
Total 2 209.10 0.00
Table 18 and Table 19 summarize the residential build-out potential for the two study areas. Based on the methodology discussed above, an ultimate development build-out capacity was developed. The TAC discussed these numbers and revised them to account for known site constraints not included in the GIS analysis, the likely development intentions of individual landowners, parcel location, and market factors. In addition to determining the likely number of developable lots, Table 18 and Table 19 also summarize the population growth potential, assuming that the average household size of 2.96 from the 2010 Census holds constant. The total population growth within the two TSAs totals 6,850. When added to the township’s 2010 population of 12,223, this leads to a population projection at ultimate build-out of 19,073 (see Section 4.1 , Population).

Future Development Potential Land Use Assumptions Report Brandywine Conservancy December 12, 2013 West Bradford Township
24 of 31
Table 18. Ultimate Residential Build-Out Capacity (Western TSA)
Lots Population
Increase Zoning District
Under-developed Vacant
R-1 127 98 666 R-4 20 124 426
TND-2 0 0 0 I 1098 0 3,250
<5ac 62 11 216
Total 1,307 233 4,558
==> 1,540 units
Table 19. Ultimate Residential Build-Out Capacity (Southern TSA)
Lots Population
Increase Zoning District
Under-developed Vacant
R-1 435 191 1,852 R-4 0 0 0
TND-2 113 0 334 I 0 0 0
<5ac 27 9 106
Total 575 200 2,292
==> 775 units
Table 20 and Table 21 summarize the ultimate non-residential (institutional, commercial and industrial) build-out potential for the two study areas. In addition to assuming that each buildable parcel would maximize the allowable impervious coverage, this analysis also assumes that these buildings will, on average, see an increase in height from their present average of 1.2 to 2.0 stories for non-residential structures. An estimated 1.25 million square feet of additional non-residential space will be created at ultimate build-out.
Table 20. Ultimate Non-Residential Build-Out Capacity (Western TSA)
Zoning District
Building Area (sf)
I 162,043 IM 0
Total 162,043
Table 21. Ultimate Non-Residential Build-Out Capacity (Southern TSA)
Zoning District
Building Area (sf)
I 0 IM 1,245,579
Total 1,245,579
The final step in the process is to project when build-out might reasonably occur, given demographic trends and the TAC’s insights. Given the recent zoning change permitting high-density multi-family residential development in the I—Industrial District, and the perception by the TAC of a generally favorable development environment, the TAC agreed, for the purposes of this analysis, to assume that 100% of the township’s vacant parcels would develop completely by 2030; while the township’s under-developed parcels would develop 70% of their total remaining capacity by that same year. This leads to an aggregate build-out of 75.6% through 2030. The TAC expects the township would then complete its build out by 2040. Table 22 shows the expected development to build-out in 10-year increments for the study areas. These periods were chosen to enable ease of comparison with Census data, and to project forward to the ultimate build-out of the township, expected by 2040.

Summary and Conclusion Land Use Assumptions Report Brandywine Conservancy December 12, 2013 West Bradford Township
25 of 31
Table 22. Development by Time Period (both TSAs)
Time Period
Residential Units
Non-Residential (sq. ft.)
Population Increase
2010–2019 876 527,858 2,592 2020–2029 875 527,858 2,590 2030–2039 564 351,906 1,668
Total 2,315 1,407,622 6,850
6 Summary and Conclusion The results of the Land Use Assumptions Report show that the study area will continue to develop in a suburban manner. Assuming Township zoning remains essentially the same as today, the primary land use, with respect to acreage, will be single-family residential at less than 1 unit per acre. Where public utilities are available, several small areas will develop at up to 5 dwelling units per acre, and a large area of roughly 200 acres will develop at up to 8 dwelling units per acre. Industrial, office, or similar uses will develop in and adjacent to the Embreeville complex in the Southern TSA along Strasburg Rd. Natural features and open space will be protected and will form greenways throughout the study area. Build-out capacity for the study area is estimated to be about 2,315 units and about 1.41 million square feet of industrial/office development. Those 2,315 units represent about 6,850 additional people during the period 2010 – 2040.3 Anticipated build-out in the study area is expected to be complete by 2040, and is expected to be 75.6% complete by 2030, before slowing during the remainder of the study period.
3 The period 2010 – 2040 was chosen for ease of comparison with Census data.

Build-Out by Parcel Land Use Assumptions Report Brandywine Conservancy December 12, 2013 West Bradford Township Environmental Management Center
26 of 31
Appendix A Build-Out by Parcel The tables in this appendix show the build-out on a parcel-by-parcel basis.
Table 23. Residential Build-Out—Vacant Parcels
Tax ID Number
Gross Acreage
Zoning District
Min Lot Acreage Sewer DU /
AcreAdjusted Gross Ac.
100% Constraints
90% Constraints
67% Constraints
Net Acreage Ultimate Build-Out (units) 2030 Build-Out (units) TSA
50-1-65 77.60 R-1 0.00 0.40 0.00 0.00 0.00 0.31 77.29 30 30 Western TSA
50-5-116 11.70 R-1 0.40 54.75 21 21 Southern TSA
50-5-116.32 65.80 R-1 0.40 1.35 0.84 0.75 8.76 3 3 Southern TSA
50-6-167 61.80 R-1 0.00 0.40 24.72 15.02 1.67 6.46 38.65 15 15 Southern TSA
50-6-41 61.50 R-1 0.00 0.40 24.60 2.46 0.71 16.76 41.57 16 16 Southern TSA
50-6-36 54.70 R-1 0.00 0.40 21.88 11.03 0.02 4.33 39.32 15 15 Southern TSA
50-5-13 52.50 R-1 0.00 0.40 0.00 3.00 0.12 4.26 45.12 18 18 Western TSA
50-6-4 47.10 R-1 0.00 0.40 0.00 3.78 0.82 5.74 36.67 14 14 Southern TSA
50-9-36 44.40 R-1 0.00 0.40 17.76 35.10 0.00 0.02 9.28 3 3 Southern TSA
50-5-186.2 44.30 R-1 0.00 0.40 17.72 5.56 0.12 3.63 34.99 14 14 Southern TSA
50-8-19 42.70 R-1 0.00 0.40 17.08 10.09 1.40 5.57 25.64 10 10 Southern TSA
50-7-1 39.50 R-1 0.00 0.40 15.80 7.60 2.53 3.82 25.55 10 10 Western TSA
50-5-186 30.60 R-1 0.00 0.40 12.24 0.63 0.00 3.06 26.91 10 10 Southern TSA
50-4-68.9 28.50 R-4 0.00 0.40 28.50 2.54 0.41 0.67 24.88 124 124 Western TSA
50-5-162 28.30 R-1 0.00 0.40 11.32 0.19 0.32 2.31 25.48 10 10 Southern TSA
50-6-34 17.90 R-1 0.00 0.40 7.16 0.00 0.00 2.03 15.87 6 6 Southern TSA
50-4-17.2 17.90 R-1 0.00 0.40 7.16 0.22 0.29 0.13 17.26 6 6 Western TSA
50-6-81.2 17.00 R-1 0.00 0.40 6.80 0.00 0.00 1.51 15.49 6 6 Southern TSA
50-4-63.2 16.52 R-1 0.00 0.40 6.61 0.00 0.00 0.00 16.52 6 6 Western TSA
50-4-86.4 14.50 R-1 0.00 formula 5.80 0.00 0.00 0.42 14.08 5 5 Western TSA
50-6-32 14.43 R-1 0.00 formula 5.77 0.00 0.00 2.66 11.77 4 4 Southern TSA
50-6-46.1 14.10 R-1 0.00 formula 5.64 6.77 0.14 0.48 6.71 3 3 Southern TSA
50-6-53.3B 14.00 R-1 0.00 formula 5.60 0.00 0.00 0.36 13.64 5 5 Southern TSA
50-6-91.6 13.56 R-1 0.00 formula 5.42 0.00 0.00 1.03 12.53 5 5 Southern TSA
50-6-101.2 13.50 R-1 0.00 formula 5.40 1.14 0.12 0.12 12.12 4 4 Southern TSA
50-6-56.1 10.70 R-1 0.00 formula 4.28 8.62 0.01 0.07 2.00 1 1 Southern TSA
50-4-31 10.43 R-1 0.00 formula 4.17 0.81 0.46 1.51 7.65 3 3 Western TSA
50-6-81 10.30 R-1 0.00 formula 4.12 2.58 0.81 0.82 6.09 2 2 Southern TSA
50-4-17 10.30 R-1 0.00 formula 4.12 0.78 0.36 1.85 7.31 3 3 Western TSA

Build-Out by Parcel Land Use Assumptions Report Brandywine Conservancy December 12, 2013 West Bradford Township Environmental Management Center
27 of 31
Tax ID Number
Gross Acreage
Zoning District
Min Lot Acreage Sewer DU/Acr
e Adjusted Gross Ac.
100% Constraints
90% Constraints
67% Constraints
Net Acreage Ultimate Build-Out (units) 2030 Build-Out (units) TSA
50-6-91.3 10.22 R-1 0.00 formula 4.09 0.08 0.30 3.08 6.76 3 3 Southern TSA
50-6-91.5 10.01 R-1 0.00 formula 4.00 0.00 0.00 0.37 9.64 4 4 Southern TSA
50-4-63.1 9.94 R-1 0.00 formula 3.98 0.00 0.00 0.01 9.93 4 4 Western TSA
50-5-136 9.60 R-1 0.00 formula 3.84 0.00 0.00 1.19 8.41 3 3 Western TSA
50-6-31 9.40 R-1 0.00 formula 3.76 0.12 0.00 2.73 6.55 2 2 Southern TSA
50-6-35.2 9.30 R-1 0.00 formula 3.72 0.80 0.21 1.17 7.12 3 3 Southern TSA
50-5-139 9.30 R-1 0.00 formula 3.72 0.00 0.00 3.24 6.06 2 2 Western TSA
50-6-40 9.00 R-1 0.00 formula 3.60 2.74 1.49 2.16 2.61 1 1 Southern TSA
50-6-26.2 8.30 R-1 0.00 formula 3.32 0.00 0.00 0.59 7.71 3 3 Southern TSA
50-4-31.5 7.50 R-1 0.00 formula 3.00 0.00 0.00 0.36 7.14 3 3 Western TSA
50-1-36.1 6.80 R-1 0.00 formula 2.72 0.52 0.48 0.00 5.80 2 2 Western TSA
50-5-194 6.30 R-1 0.00 formula 2.52 0.00 0.00 0.08 6.22 2 2 Southern TSA
50-6-91.9 6.12 R-1 0.00 formula 2.45 0.00 0.00 0.56 5.56 2 2 Southern TSA
50-5-143 6.00 R-1 0.00 formula 2.40 0.00 0.00 0.51 5.49 2 2 Western TSA
50-6-101.3 5.90 R-1 0.00 formula 2.36 0.06 0.14 0.49 5.21 2 2 Southern TSA
50-4-28.1 5.50 R-1 0.00 formula 2.20 0.40 0.29 1.07 3.74 1 1 Western TSA
50-6-83.1 5.30 R-1 0.00 formula 2.12 0.06 0.00 0.54 4.70 2 2 Southern TSA
Table 24. Residential Build-Out—Underdeveloped Parcels
Tax ID Number
Gross Acreage
Zoning District
Min Lot Acreage Sewer DU /
Acre Adjusted Gross Ac.
100% Constraints
90% Constraints
67% Constraints
Net Acreage Ultimate Build-Out (units) 2030 Build-Out (units) TSA
Curative Amentment 137.31 I 1.60 0.40 N/A N/A N/A N/A N/A 1098 769 Western TSA
50-8-16 169.00 R-1 1.60 0.40 167.40 23.29 3.02 17.29 123.80 49 34 Southern TSA
50-6-38 145.20 R-1 1.60 0.40 143.60 13.20 1.48 14.53 114.39 45 32 Southern TSA
50-7-2 119.40 R-1 1.60 0.40 N/A N/A N/A N/A N/A 3 2 Western TSA
50-9-34 111.60 R-1 1.60 0.40 110.00 12.59 0.00 4.87 92.54 37 26 Southern TSA
50-9-30 102.80 R-1 1.60 0.40 101.20 0.96 0.05 2.22 97.97 39 27 Southern TSA
50-5-160 89.73 R-1 1.60 0.40 88.13 7.11 0.32 4.94 75.76 57 40 Southern TSA
50-9-23 62.10 R-1 1.60 0.40 60.50 8.12 4.02 4.29 44.07 17 12 Southern TSA
50-4-68.8 58.30 R-1 1.60 0.40 56.70 4.35 1.06 3.78 47.51 19 13 Western TSA
50-6-39 57.30 R-1 1.60 0.40 55.70 0.00 0.00 1.63 54.07 21 15 Southern TSA
50-6-35.2A 45.80 R-1 1.60 0.40 44.20 0.17 0.08 5.57 38.38 15 11 Southern TSA
50-4-27 38.87 R-1 1.60 0.40 37.27 4.46 1.88 9.88 21.05 8 6 Western TSA
50-5-147 35.50 R-1 1.60 0.40 33.90 0.00 0.00 3.73 30.17 12 8 Western TSA

Build-Out by Parcel Land Use Assumptions Report Brandywine Conservancy December 12, 2013 West Bradford Township Environmental Management Center
28 of 31
Tax ID Number
Gross Acreage
Zoning District
Min Lot Acreage Sewer DU /
Acre Adjusted Gross Ac.
100% Constraints
90% Constraints
67% Constraints
Net Acreage Ultimate Build-Out (units) 2030 Build-Out (units) TSA
50-6-45 28.70 R-1 1.60 0.40 27.10 3.96 1.80 3.44 17.90 7 5 Southern TSA
50-4-67 28.40 R-1 1.60 0.40 26.80 0.00 0.00 2.74 24.06 9 6 Western TSA
50-6-95 26.70 TND-2 0.20 YES 4.00 26.50 1.29 1.48 0.27 23.46 93 65 Southern TSA
50-9-23.3 25.30 R-1 1.60 0.40 23.70 1.73 1.45 1.24 19.28 7 5 Southern TSA
50-8-22.1 24.50 R-1 1.60 0.40 22.90 0.01 0.01 6.32 16.56 6 4 Southern TSA
50-1-6 22.80 R-1 1.60 YES 0.40 21.20 1.11 0.66 1.64 17.79 7 5 Western TSA
50-9-29 22.30 R-1 1.60 0.40 20.70 1.12 0.50 1.80 17.28 6 4 Southern TSA
50-6-23 21.00 R-1 1.60 0.40 19.40 0.00 0.00 2.48 16.92 6 4 Southern TSA
50-8-22 20.70 R-1 1.60 0.40 19.10 2.00 0.73 5.37 11.00 4 3 Southern TSA
50-6-91.1 20.47 R-1 1.60 0.40 18.87 5.30 0.18 0.78 12.61 5 4 Southern TSA
50-5-123 19.60 R-1 1.60 0.40 18.00 5.62 0.00 2.43 9.95 3 2 Western TSA
50-6-52.1 18.70 R-1 1.60 0.40 17.10 6.03 0.02 1.58 9.47 3 2 Southern TSA
50-6-89 18.50 R-1 1.60 0.40 16.90 1.58 0.01 1.72 13.59 5 4 Southern TSA
50-9-23.1 18.40 R-1 1.60 0.40 16.80 3.57 2.80 0.83 9.60 3 2 Southern TSA
50-5-185 18.00 R-1 1.60 0.40 16.40 2.30 0.00 2.42 11.68 4 3 Southern TSA
50-4-29 17.60 R-1 1.60 0.40 16.00 0.00 0.00 1.31 14.69 5 4 Western TSA
50-6-53.2A 17.00 R-1 1.60 0.40 15.40 4.16 0.00 0.21 11.03 4 3 Southern TSA
50-9-41 16.00 R-1 1.60 0.40 14.40 5.42 0.00 3.13 5.85 2 1 Southern TSA
50-9-23.2 15.90 R-1 1.60 0.40 14.30 0.00 0.00 0.09 14.21 5 4 Southern TSA
50-6-80 15.40 R-1 1.60 0.40 13.80 0.05 0.16 2.10 11.49 4 3 Southern TSA
50-6-49.1 15.00 R-1 1.60 0.40 13.40 1.92 0.02 1.02 10.44 4 3 Southern TSA
50-5-149.1 15.00 R-1 1.60 0.40 13.40 1.88 0.30 0.88 10.34 4 3 Western TSA
50-6-64 14.50 R-1 1.60 formula 12.90 0.00 0.00 0.17 12.73 5 4 Southern TSA
50-4-41 14.10 R-1 1.60 formula 12.50 0.00 0.00 1.12 11.38 4 3 Western TSA
50-9-16.2 14.00 R-1 1.60 formula 12.40 6.56 0.02 0.00 5.82 2 1 Southern TSA
50-6-51.1 13.80 R-1 1.60 formula 12.20 0.00 0.00 0.16 12.04 4 3 Southern TSA
50-4-14 12.10 R-1 1.60 formula 10.50 1.31 0.33 0.29 8.57 3 2 Western TSA
50-6-48 12.00 R-1 1.60 formula 10.40 0.01 0.00 2.29 8.10 3 2 Southern TSA
50-1-34 11.80 R-1 1.60 formula 10.20 2.13 0.50 0.65 6.92 3 2 Western TSA
50-5-10 11.80 R-1 1.60 formula 10.20 4.22 0.41 0.40 5.17 2 1 Western TSA
50-9-31.1 11.00 R-1 1.60 formula 9.40 0.05 0.07 3.26 6.02 2 1 Southern TSA
50-4-61 10.79 R-1 1.60 formula 9.19 0.00 0.00 0.01 9.18 3 2 Western TSA
50-5-10.1 10.70 R-1 1.60 formula 9.10 0.53 0.00 0.81 7.76 3 2 Western TSA
50-1-36.2B 10.60 R-1 1.60 formula 9.00 0.65 0.15 0.14 8.06 3 2 Western TSA
50-6-81.1 10.50 R-1 1.60 formula 8.90 0.44 0.34 0.10 8.02 3 2 Southern TSA

Build-Out by Parcel Land Use Assumptions Report Brandywine Conservancy December 12, 2013 West Bradford Township Environmental Management Center
29 of 31
Tax ID Number
Gross Acreage
Zoning District
Min Lot Acreage Sewer DU /
Acre Adjusted Gross Ac.
100% Constraints
90% Constraints
67% Constraints
Net Acreage Ultimate Build-Out (units) 2030 Build-Out (units) TSA
50-6-25.2 10.40 R-1 1.60 formula 8.80 0.48 0.05 2.00 6.27 2 1 Southern TSA
50-6-53.3A 10.20 R-1 1.60 formula 8.60 2.95 0.00 1.08 4.57 2 1 Southern TSA
50-6-90 10.20 R-1 1.60 formula 8.60 0.67 0.00 0.44 7.49 3 2 Southern TSA
50-6-53.3 10.20 R-1 1.60 formula 8.60 3.07 0.00 1.07 4.46 2 1 Southern TSA
50-6-91.4 10.03 R-1 1.60 formula 8.43 0.00 0.00 0.91 7.52 3 2 Southern TSA
50-9-43 10.00 R-1 1.60 formula 8.40 0.39 0.03 0.30 7.68 3 2 Southern TSA
50-6-81.3 10.00 R-1 1.60 formula 8.40 2.64 1.40 2.46 1.90 1 1 Southern TSA
50-6-101.1 10.00 R-1 1.60 formula 8.40 0.77 0.34 1.07 6.22 2 1 Southern TSA
50-6-65 9.90 R-1 1.60 formula 8.30 0.00 0.00 0.42 7.88 3 2 Southern TSA
50-9-17.2 9.70 R-1 1.60 formula 8.10 0.00 0.00 2.04 6.06 2 1 Southern TSA
50-5-193 8.90 R-1 1.60 formula 7.30 1.40 0.23 0.13 5.54 2 1 Southern TSA
50-4-39.1 8.90 R-1 1.60 formula 7.30 0.00 0.00 0.02 7.28 3 2 Western TSA
50-8-8 8.73 R-1 1.60 formula 7.13 0.50 0.78 3.71 2.14 1 1 Western TSA
50-5-159.50 8.50 R-1 1.60 formula 6.90 1.92 0.09 2.14 2.75 1 1 Southern TSA
50-4-26.19 8.40 R-1 1.60 formula 6.80 0.00 0.00 0.17 6.63 3 2 Western TSA
50-9-17.4 8.40 R-1 1.60 formula 6.80 0.00 0.00 0.17 6.63 3 2 Southern TSA
50-6-13 8.30 R-1 1.60 formula 6.70 0.00 0.00 0.68 6.02 2 1 Southern TSA
50-1-51 8.20 R-1 1.60 YES formula 6.60 0.00 0.00 0.68 5.92 2 1 Western TSA
50-6-45.1 8.20 R-1 1.60 formula 6.60 0.55 0.20 1.90 3.95 2 1 Southern TSA
50-6-7.1B 8.00 R-1 1.60 formula 6.40 0.74 0.23 1.33 4.10 2 1 Southern TSA
50-5-188 8.00 R-1 1.60 formula 6.40 0.00 0.00 0.60 5.80 2 1 Southern TSA
50-5-164.1 8.00 R-1 1.60 formula 6.40 2.45 0.00 2.10 1.85 1 1 Southern TSA
50-5-12 8.00 R-1 1.60 YES formula 6.40 0.00 0.02 2.35 4.03 2 1 Western TSA
50-6-19 7.90 R-1 1.60 formula 6.30 0.91 0.29 0.86 4.24 2 1 Southern TSA
50-4-87 7.90 R-1 1.60 formula 6.30 3.02 0.67 0.71 1.90 1 1 Western TSA
50-4-5 7.70 R-1 1.60 YES formula 6.10 0.06 0.00 0.62 5.42 2 1 Western TSA
50-4-66 7.65 R-1 1.60 formula 6.05 0.00 0.00 0.82 5.23 2 1 Western TSA
50-4-93.1 7.60 R-1 1.60 formula 6.00 0.14 0.57 0.88 4.41 2 1 Western TSA
50-8-8.1 7.31 R-1 1.60 formula 5.71 0.25 0.29 1.65 3.52 1 1 Western TSA
50-6P-53 7.30 TND-2 0.20 3.00 7.10 0.08 0.10 0.11 6.81 20 14 Southern TSA
50-9-5 7.30 R-1 1.60 formula 5.70 2.20 1.17 0.50 1.83 1 1 Southern TSA
50-5-155.7 7.10 R-1 1.60 formula 5.50 0.22 0.00 0.40 4.88 2 1 Southern TSA
50-8-12.2 7.10 R-1 1.60 YES formula 5.50 1.80 0.00 0.12 3.58 1 1 Southern TSA
50-6-7.1E 7.00 R-1 1.60 formula 5.40 0.77 0.01 1.17 3.45 1 1 Southern TSA
50-9-16.1 7.00 R-1 1.60 formula 5.40 3.03 0.07 0.07 2.23 1 1 Southern TSA

Build-Out by Parcel Land Use Assumptions Report Brandywine Conservancy December 12, 2013 West Bradford Township Environmental Management Center
30 of 31
Tax ID Number
Gross Acreage
Zoning District
Min Lot Acreage Sewer DU /
Acre Adjusted Gross Ac.
100% Constraints
90% Constraints
67% Constraints
Net Acreage Ultimate Build-Out (units) 2030 Build-Out (units) TSA
50-9-1.1 6.90 R-1 1.60 formula 5.30 1.84 0.85 0.90 1.71 1 1 Southern TSA
50-6-91.7 6.77 R-1 1.60 formula 5.17 0.00 0.00 1.63 3.54 1 1 Southern TSA
50-5-137 6.60 R-1 1.60 formula 5.00 0.01 0.00 1.51 3.48 1 1 Western TSA
50-5-149.2 6.51 R-1 1.60 formula 4.91 0.96 0.21 0.59 3.15 1 1 Western TSA
50-1-36.2 6.20 R-1 1.60 formula 4.60 0.00 0.00 0.00 4.60 2 1 Western TSA
50-8-2.4 6.20 R-1 1.60 formula 4.60 0.56 0.53 0.43 3.08 1 1 Western TSA
50-6-76 6.20 R-1 1.60 formula 4.60 0.00 0.00 0.49 4.11 2 1 Southern TSA
50-6-88-U 6.20 R-1 1.60 formula 4.60 0.65 0.00 0.73 3.22 1 1 Southern TSA
50-6-25.8 6.00 R-1 1.60 formula 4.40 0.00 0.00 0.46 3.94 2 1 Southern TSA
50-5-147.2A 6.00 R-1 1.60 formula 4.40 0.00 0.00 0.13 4.27 2 1 Western TSA
50-6-31.1 6.00 R-1 1.60 formula 4.40 0.69 0.28 0.07 3.36 1 1 Southern TSA
50-4-16.1 5.60 R-1 1.60 formula 4.00 1.58 0.41 0.18 1.83 1 1 Western TSA
50-5-134.6 5.60 R-1 1.60 formula 4.00 0.57 0.00 1.62 1.81 1 1 Western TSA
50-1-64.6 5.50 R-1 1.60 formula 3.90 0.00 0.00 0.00 3.90 2 1 Western TSA
50-8-2.1 5.40 R-1 1.60 formula 3.80 0.78 0.31 0.46 2.25 1 1 Western TSA
50-6-59 5.40 R-1 1.60 formula 3.80 0.13 0.00 0.41 3.26 1 1 Southern TSA
50-6-50 5.30 R-1 1.60 formula 3.70 0.00 0.00 0.94 2.76 1 1 Southern TSA
50-4-26 5.30 R-1 1.60 formula 3.70 0.00 0.00 0.06 3.64 1 1 Western TSA
50-4-45 5.30 R-1 1.60 formula 3.70 0.00 0.00 0.30 3.40 1 1 Western TSA
50-5-163 5.26 R-1 1.60 formula 3.66 0.00 0.00 1.62 2.04 1 1 Southern TSA
50-4-26.21 5.10 R-1 1.60 formula 3.50 0.00 0.00 0.23 3.27 1 1 Western TSA
50-4-63 5.06 R-1 1.60 formula 3.46 0.00 0.00 0.13 3.33 1 1 Western TSA
50-5-186.1 5.00 R-1 1.60 formula 3.40 0.00 0.00 0.21 3.19 1 1 Southern TSA
50-5-186.2B 5.00 R-1 1.60 formula 3.40 0.00 0.00 0.81 2.59 1 1 Southern TSA
50-4-68.5 5.00 R-4 1.00 1.00 4.00 0.00 0.00 0.00 4.00 20 14 Western TSA
50-6-33 5.00 R-1 1.60 formula 3.40 0.00 0.00 1.61 1.79 1 1 Southern TSA
50-5-186.2A 5.00 R-1 1.60 formula 3.40 0.00 0.00 0.33 3.07 1 1 Southern TSA
50-4-18 5.00 R-1 1.60 formula 3.40 1.04 0.00 0.34 2.02 1 1 Western TSA

Build-Out by Parcel Land Use Assumptions Report Brandywine Conservancy December 12, 2013 West Bradford Township Environmental Management Center
31 of 31
Table 25. Non-Residential Build-Out
Tax ID Number
Gross Acreage
Zoning District
100% Constraints
90% Constraints
67% Constraints
Net Acreage
Acres of Impervious
IMP % of Gross
IMP Max %
IMP Remain (% of Gross)
Gross Acreage
Impervious Possible (ac.)
Square Feet
Building square footage
TSA
50-8-9.4 20.00 IM 0.18 0.00 0.00 0.00 0.00 0.00 0% 0.00 20.00 0.00 65,340 10,000 Southern TSA
50-8-9 189.10 IM 9.10 4.90 21.20 0.00 0.00 0.00 25% 25.00 189.10 17.00 2,059,299 1,235,579 Southern TSA
50-5-129 31.14 I 0.00 0.00 1.05 30.09 3.06 10.00 30% 20.00 31.14 6.20 270,072 162,043 Western TSA

!(162
!(322
WA
LTZRD
PIEDMONT DR
CI
RIDGEVIEW
GREAT
RD
TE RE
SA CT
SHERWOOD
DR
FAWN LA
WA
LTON
DR
YA NKEE DR
HILLTO
PR
D
SUZA
N
NE DR
SEEDS
LA
SPRUCE DR
E SEDON
AD
R
MONTVALE CI
SU
NSET DR
OA
KW
OO
DRD
FEDERAL
DR
CRANBERRY
LA
LONE EAGLE RD
GLENSIDER
D
GLEN
SIDE
RD
WA
IMEA
DR
ROME RD
ALTONW
Y
ERICSSON DR
CRES TMO
NT
DR
SHAGBA
R K DR
GLEN
DR
A
PPLEVI LLE RD
CENT
RA
L DR
PE
N
NS RI DGE PL
CAMP LINDEN RD
OLD
SHAD
YSIDE RD
BRADFORD AV
GROUNDHOGCO
LLEGERD
LIED
SRD
HA
LL
LA
EMB
REE
VIL
LER
D
BA
LLY M OOR DR
RIDGEWOOD
DR
HIGH
GROVE
DR
SB
AILEY
RD
DO
YLE
DR
LUCKY
HILL
RD
MON
TANA DR
HILL
CR
EST LA
TOWERV
IEW
DR
SILVERBARK LA
SHADYSIDE RD
WINFIELD DR
WARPATH RD
HUN
T DR
CRAWFORD LA
BR
OA
D
RUN RD
M
ARYLANDCI
FOX
RUN
DR
TELEGRAPH RD
CAR
OL
IN APL
NW
AWASET
RD
DELONGDR
CAN
NR
D
HEC
KER DR
STOU
FFR
D
BEACON HILL RD
PARK
ERD
R
RO
MA
NSV
ILLER
D
LINDA DR
SHADEBRUSH
RIDGE
SAIN
T
ANDR
E
W S DR
SPRING
OAKDR
DE
SAN
TIS
DR
WOODWARD
DR
TATTE RSA
LLW
Y
CLAY
TON RD
CHESTNUT LA
PRIC
ELA
JAM
ESTO
WN
DR
JOLE
NE
DR
ROMIG RD
BERUE DR
POORHOUSERD
TREELINE DR
NO
RTH
BRO
OK
RD
D ELAWARE LA
ELK RUN
RD
WEST CHESTER RD
NEW VIRGINIA
RD
STAR
GA
ZERS
RD
STOCKTONR
D
S TEEPLE
CH
ASERD
SUG
ARS
BRID
GE
RD
HALL RD
DOWNINGTOW
NPK
MA
NOR
WOO
DDR
W STRASBURG RD
ADAMS
DR
RYAN
BL
SHADYSIDE RD
SAWMILL RD
STAY MAN ST
STONEGATE
DR
MARSHALLTON THORNDALERD
TELEGRAPH RD
BR
OA
D R
UN
RD
BROAD RUN RD
BROAD RUN RD
Newlin Township
East Bradford Township
Caln Township
Pocopson Township
East Caln TownshipDowningtown Borough
Date: November 21, 2013
DATA SOURCE: Base data from Chester County GIS Department, 2012.Roads from West Bradford Township, 1/2009. Transportation ServiceAreas digitized by Brandywine Conservancy, 7/2013 (edited 11/2013).
0 3,000 6,000 9,0001,500Feet
2013 Land Use Assumptions Report
RoadsStreamsBodies of waterAdjacent municipal boundariesTax parcelsTownship boundarySouthern Transportation Service Area (6.79 sq. mi.)Western Transportation Service Area (5.68 sq. mi.)
Major roadsStudy intersections
Map 1

Newlin Township
East Bradford Township
Caln Township
Pocopson Township
East Caln TownshipDowningtown Borough
!(162
!(322
WA
LTZRD
PIEDMONT DR
CI
RIDGEVIEW
GREAT
RD
TE RE
SA CT
SHERWOOD
DR
FAWN LA
WA
LTON
DR
YA NKEE DR
HILLTO
PR
D
SUZA
N
NE DR
SEEDS
LA
SPRUCE DR
E SEDON
AD
R
MONTVALE CI
SU
NSET DR
OA
KW
OO
DRD
FEDERAL
DR
CRANBERRY
LA
LONE EAGLE RD
GLENSIDER
D
GLEN
SIDE
RD
WA
IMEA
DR
ROME RD
ALTONW
Y
ERICSSON DR
CRES TMO
NT
DR
SHAGBA
R K DR
GLEN
DR
A
PPLEVI LLE RD
CENT
RA
L DR
PE
N
NS RI DGE PL
CAMP LINDEN RD
OLD
SHAD
YSIDE RD
BRADFORD AV
GROUNDHOGCO
LLEGERD
LIED
SRD
HA
LL
LA
EMB
REE
VIL
LER
D
BA
LLY M OOR DR
RIDGEWOOD
DR
HIGH
GROVE
DR
SB
AILEY
RD
DO
YLE
DR
LUCKY
HILL
RD
MON
TANA DR
HILL
CR
EST LA
TOWERV
IEW
DR
SILVERBARK LA
SHADYSIDE RD
WINFIELD DR
WARPATH RD
HUN
T DR
CRAWFORD LA
BR
OA
D
RUN RD
M
ARYLANDCI
FOX
RUN
DR
TELEGRAPH RD
CAR
OL
IN APL
NW
AWASET
RD
DELONGDR
CAN
NR
D
HEC
KER DR
STOU
FFR
D
BEACON HILL RD
PARK
ERD
R
RO
MA
NSV
ILLER
D
LINDA DR
SHADEBRUSH
RIDGE
SAIN
T
ANDR
E
W S DR
SPRING
OAKDR
DE
SAN
TIS
DR
WOODWARD
DR
TATTE RSA
LLW
Y
CLAY
TON RD
CHESTNUT LA
PRIC
ELA
JAM
ESTO
WN
DR
JOLE
NE
DR
ROMIG RD
BERUE DR
POORHOUSERD
TREELINE DR
NO
RTH
BRO
OK
RD
D ELAWARE LA
ELK RUN
RD
WEST CHESTER RD
NEW VIRGINIA
RD
STAR
GA
ZERS
RD
STOCKTONR
D
S TEEPLE
CH
ASERD
SUG
ARS
BRID
GE
RD
HALL RD
DOWNINGTOW
NPK
MA
NOR
WOO
DDR
W STRASBURG RD
ADAMS
DR
RYAN
BL
SHADYSIDE RD
SAWMILL RD
STAY MAN ST
STONEGATE
DR
MARSHALLTON THORNDALERD
TELEGRAPH RD
BR
OA
D R
UN
RD
BROAD RUN RD
BROAD RUN RD
LegendStreams
Bodies of water
Southern Transportation Service Area
Western Transportation Service Area
Tax parcelsAdjacent municipal boundaries
Township boundaryRoad Classifications
Major arterial
Minor arterial
Major collector
Minor collector
Primary local distributor
Secondary local distributor
Local access street
Alley
Map 2Roadway
Functional Classifications
Date: November 20, 2013
DATA SOURCE: Base data from Chester County GIS Department, 2009.Roads from West Bradford Township, 1/2009. Road classificationsfrom West Bradford Township, 11/2008 (edited 12/2008 to reflect approved roads).
0 3,000 6,000 9,0001,500Feet
West Bradford Township2013 Land Use Assumptions Report

!(162
!(322
WA
LTZRD
PIEDMONT DR
CI
RIDGEVIEW
GREAT
RD
TE RE
SA CT
SHERWOOD
DR
FAWN LA
WA
LTON
DR
YA NKEE DR
HILLTO
PR
D
SUZA
N
NE DR
SEEDS
LA
SPRUCE DR
E SEDON
AD
R
MONTVALE CI
SU
NSET DR
OA
KW
OO
DRD
FEDERAL
DR
CRANBERRY
LA
LONE EAGLE RD
GLENSIDER
D
GLEN
SIDE
RD
WA
IMEA
DR
ROME RD
ALTONW
Y
ERICSSON DR
CRES TMO
NT
DR
SHAGBA
R K DR
GLEN
DR
A
PPLEVI LLE RD
CENT
RA
L DR
PE
N
NS RI DGE PL
CAMP LINDEN RD
OLD
SHAD
YSIDE RD
BRADFORD AV
GROUNDHOGCO
LLEGERD
LIED
SRD
HA
LL
LA
EMB
REE
VIL
LER
D
BA
LLY M OOR DR
RIDGEWOOD
DR
HIGH
GROVE
DR
SB
AILEY
RD
DO
YLE
DR
LUCKY
HILL
RD
MON
TANA DR
HILL
CR
EST LA
TOWERV
IEW
DR
SILVERBARK LA
SHADYSIDE RD
WINFIELD DR
WARPATH RD
HUN
T DR
CRAWFORD LA
BR
OA
D
RUN RD
M
ARYLANDCI
FOX
RUN
DR
TELEGRAPH RD
CAR
OL
IN APL
NW
AWASET
RD
DELONGDR
CAN
NR
D
HEC
KER DR
STOU
FFR
D
BEACON HILL RD
PARK
ERD
R
RO
MA
NSV
ILLER
D
LINDA DR
SHADEBRUSH
RIDGE
SAIN
T
ANDR
E
W S DR
SPRING
OAKDR
DE
SAN
TIS
DR
WOODWARD
DR
TATTE RSA
LLW
Y
CLAY
TON RD
CHESTNUT LA
PRIC
ELA
JAM
ESTO
WN
DR
JOLE
NE
DR
ROMIG RD
BERUE DR
POORHOUSERD
TREELINE DR
NO
RTH
BRO
OK
RD
D ELAWARE LA
ELK RUN
RD
WEST CHESTER RD
NEW VIRGINIA
RD
STAR
GA
ZERS
RD
STOCKTONR
D
S TEEPLE
CH
ASERD
SUG
ARS
BRID
GE
RD
HALL RD
DOWNINGTOW
NPK
MA
NOR
WOO
DDR
W STRASBURG RD
ADAMS
DR
RYAN
BL
SHADYSIDE RD
SAWMILL RD
STAY MAN ST
STONEGATE
DR
MARSHALLTON THORNDALERD
TELEGRAPH RD
BR
OA
D R
UN
RD
BROAD RUN RD
BROAD RUN RD
Newlin Township
East Bradford Township
Caln Township
Pocopson Township
East Caln TownshipDowningtown Borough West Bradford Township
Date: November 20, 2013
DATA SOURCE: Base data from Chester County GIS Department, 2012.Roads from West Bradford Township, 1/2009. Existing land use fromWest Bradford Township, 12/2008. Transportation Service Areasdigitized by Brandywine Conservancy, 7/2013.
0 3,000 6,000 9,0001,500Feet
LegendMajor roadsRoadsStreamsBodies of waterWestern Transportation Service AreaSouthern Transportation Service AreaProtected open spaceTax parcelsAdjacent municipal boundariesTownship boundary
Existing land useAgricultural (19%)Commercial (1.3%)Recreational open space (3.0%)Homeowners Association (5.8%)Institutional (3.4%)Manufactured Housing Community (.8%)Municipal (.8%)Parkland (4.4%)Single family residential (44.0%)Utility (1.2%)Vacant (16.0%)
2013 Land Use Assumptions Report
Map 3Existing Land Use

!(162
!(322
Newlin Township
East Bradford Township
Caln Township
Pocopson Township
East Caln TownshipDowningtown Borough
R-4
R-2
U.D.A.
C-1
R-2
R-2
R-3
I
IM
R-1C
U.D.A.
R-2
R-5
R-2A
R-3
TND-2
R-2B
R-4
C-1
C-2A
C-2
R-2A
I
R-2
R-4R-2
R-2
C-1
WA
LTZRD
PIEDMONT DR
CI
RIDGEVIEW
GREAT
RD
TE RE
SA CT
SHERWOOD
DR
FAWN LA
WA
LTON
DR
YA NKEE DR
HIL LTO
PR
D
SUZA
N
NE DR
SEEDS
LA
SPRUCE DR
E SEDON
AD
R
MONTVALE CI
SU
NSET DR
OA
KW
OO
DRD
FEDERAL
DR
CRANBERRY
LA
LONE EAGLE RD
GLENSIDER
D
GLEN
SIDE
RD
WA
IMEA
DR
ROME RD
ALTONW
Y
ERICSSON DR
CRES TMO
NT
DR
SHAGBA
R K DR
GLEN
DR
A
PPLEVI LLE RD
CENT
RA
L DR
PE
N
NS RI DGE PL
CAMP LINDEN RD
OLD
SHAD
YSIDE RD
BRADFORD AV
GROUNDHOGCO
LLEGERD
LIED
S RD
HA
LL
LA
EMB
REE
VIL
LER
D
BA
LLY M OOR DR
RIDGEWOOD
DR
HIGH
GROVE
DR
SB
AILEY
RD
DO
YLE
DR
LUCKY
HILL
RD
MON
TANA DR
HILL
CR
EST LA
TOWERV
IEW
DR
SILVERBARK LA
SHADYSIDE RD
WINFIELD DR
WARPATH RD
HUN
T DR
CRAWFORD LA
BR
OA
D
RUN R D
M
ARYLANDCI
FOXRU
ND
R
TELEGRAPH RD
CARO
L
IN APL
NW
AWASET
RD
DELONGDR
CAN
NR
D
HEC
KER DR
STOU
FFR
D
BEACON HILL RD
PARK
ERD
R
RO
MA
NSV
ILLER
D
LINDA DR
SHADEBRUSH
RIDGE
SAIN
T
ANDR
E
W S DR
SPRING
OAKDR
DE
SAN
TIS
DR
WOODWARD
DR
TATTE RSA
LLW
Y
CLAY
TON RD
CHESTNUT LA
PRIC
ELA
JAM
ESTO
WN
DR
ROMIG RD
BERUE DR
POORHOUSERD
TREELINE DR
NO
RTH
BRO
OK
RD
D ELAWARE LA
ELK RUN
RD
WEST CHESTER RD
NEW VIRGINIA
RD
STAR
GA
ZERS
RD
STOCKTONR
D
S TEEPLE
CH
ASERD
SUG
ARS
BRID
GE
RD
HALL RD
DOWNINGTOW
NPK
MA
NOR
WOO
DDR
W STRASBURG RD
ADAMS
DR
RYAN
BL
SHADYSIDE RD
SAWMILL RD
STAY MAN ST
STONEGATE
DR
MARSHALLTON THORNDALE
RD
TELEGRAPH RD
Date: November 20, 2013
DATA SOURCE: Base data from Chester County GIS Department, 2012.Roads from West Bradford Township, 1/2009. Zoning from Chester CountyGIS Department and adopted on 8/9/2005.
0 3,000 6,000 9,0001,500Feet
LegendMajor roadsRoadsStreamsBodies of waterWestern Transportation Service AreaSouthern Transportation Service AreaTax parcelsTownship boundary
Zoning overlaysFloodplain (100 yr.)T.N.D. - Traditional Neighborhood Design(Romansville Village)
Zoning DistrictsC-1 - CommercialC-2 - CommercialC-2A - CommercialI - IndustrialIM - Institutional/MixedR-1 - ResidentialR-1C - ResidentialR-2 - ResidentialR-2A - ResidentialR-2B - ResidentialR-3 - ResidentialR-4 - ResidentialR-5 - ResidentialTND-2 - Traditional Neighborhood Development-2U.D.A. - Unified Development AreaAdjacent municipal boundaries
Map 4Existing Zoning
West Bradford Township2013 Land Use Assumptions Report

!(162
!(322
Newlin Township
East Bradford Township
Caln Township
Pocopson Township
East Caln TownshipDowningtown Borough
WA
LTZRD
PIEDMONT DR
CI
RIDGEVIEW
GREAT
RD
TE RE
SA CT
SHERWOOD
DR
FAWN LA
WA
LTON
DR
YANKEE DR
HILLT O
PR
D
SUZA
N
NE DR
SEEDS
LA
SPR
UCE DR
E SEDON
AD
R
MONTVALE CI
SU
NSET DR
OA
KW
OO
DRD
FEDERAL
DR
CRANBERRY
LA
LONE EAGLE RD
GLENSIDER
D
GLEN
SIDE
RD
WA
IMEA
DR
ROME RD
ALTONW
Y
ERICSSON DR
CRES TMO
NT
DR
SH
AGBAR K D
R
GLEN
DR
A
PPLEV
I LLE RD
CENT
RA
L DR
PE
N
NS RI DGE PL
CAMP LINDEN RD
OLD
SHAD
YSIDE RD
BRADFORD AV
GROUNDHOGCO
LLEGERD
LIED
S RD
HA
LL
LA
EMB
RE E
VIL
LER
D
BA
LLY M OOR
DR
RIDGEWOOD
DR
HIGH
GROVE
DR
SB
AILEY
RD
DO
YLE
DR
LUCKYH
ILLRD
MON
TANA DR
HILL
CR
EST LA
TOWERV
IEW
DR
SILVERBARK LA
SHADYSIDE RD
WINFIELD DR
WARPATH RD
HUN
TDR
CRAWFORD LA
BR
OA
D
RUN R D
M
ARYLANDCI
FOXRU
ND
R
TELEGRAPH RD
CARO
L
IN APL
NW
AWASET
RD
DELONGDR
CAN
NR
D
HEC
KER DR
STOU
FFR
D
BEACON HILL RD
PARK
ERD
R
RO
MA
NSV
ILLER
D
LINDA DR
SHADEBR
USH
RIDGE
SAIN
T
ANDR
E
W S DR
SPRING
OAKD
R
DE
SAN
TIS
DR
WOODWARD
DR
TATTE RSA
LLW
Y
CLAY
TON RD
CHESTNUT LA
PRIC
ELA
JAM
ESTO
WN
DR
ROMIG RD
BERUE DR
POORHOUSERD
TREELINE DR
NO
RTH
BRO
OK
RD
D ELAWARE LA
ELK R U NR
D
WEST CHESTER RD
NEW VIRGINIA
RD
STAR
GA
ZERS
RD
STOCKTONR
D
S TEEPLE
CH
ASERD
SUG
ARS
BRID
GE
RD
HALL RD
DOWNINGTOW
NPK
MA
NOR
WOO
DDR
W STRASBURG RD
ADAMS
DR
RYAN
BL
SHADYSIDE RD
SAWMILL RD
STAY MAN ST
STONEGATE
DR
MARSHALLTON THORNDALE
RD
TELEGRAPH RD
West Bradford Township
Date: November 20, 2013
DATA SOURCE: Base data from Chester County GIS Department, 2012.Roads from West Bradford Township, 1/2009. Wetlands from NWI, 2009.Hydric soils from NRCS, 2007. Flood hazard district from West BradfordTownship, 2007. Woodlands from West Bradford Township ComprehensivePlan, 2005. Slopes generated by Brandywine Conservancy from 5 footcontours from Chester County GIS Department , 2000.
0 3,000 6,000 9,0001,500Feet
Map 5Development Constraints
2013 Land Use Assumptions Report
Southern Transportation Service AreaWestern Transportation Service Area
Legend
Riparian forested buffers
Zone 2: 65' from zone 1 not to exceed 100' totalZone 1: 35' or all areas >=25% slopes adjacent to stream
Adjacent municipal boundariesTax parcelsTownship boundary
Major roadsRoadsBodies of waterStreamsConstrained wetlands areas
Slopes >25%Flood hazard district

!(162
!(322
WALTZ RD
PIEDMONT DR
CI
RIDGEVIEW
GREAT RD
TE RE
SA CT
SHERWOOD DR
FAWN LA
WALTON DR
YANKEE DR
HILLTO P R D
SUZAN NE DR
SEED S LA
SPRUCE DR
E SEDONA DR
MONTVALE CI
SU
NSET DR
OAKWOOD RD
FEDERAL DR
CRANBERRY LA
LONE EAGLE RD
GLENSIDE RD
GLENSIDE RD
WAIMEA DR
ROME RD
ALTON WY
ERICSSON DR
CRES TMO
NT DR
SHAGBAR K DR
GLEN DR
APPLEVI LLE RD
CENTRA L DR
PENNS RI DGE PL
CAMP LINDEN RD
OLD
SHAD
YSIDE RD
BRADFORD AV
GROUNDHOG COLLEGE RD
LIEDS RD
HALL LA
EMBR
EEVI
LLE
RD
BA LLY M OOR DR
RIDGEWOOD DR
HIG
HGROVE
DR
S BAIL
EY RD
DOYLE DR
LUCKY HILL RD
MONTANA DR
HILLC R EST LA
TOWERVIEW DR
SILVERBARK LA
SHADYSIDE RD
WINFIELD DR
WARPATH RD
HUNT DR
CRAWFORD LA
BROAD
RUN RD
MARYLAND CI
FOX RUN DR
TELEGRAPH RD
CAROL IN A PL
N WAWASET RD
DELONG DR
CANN
RD
HECKER DR
STOUFF RD
BEACON HILL RD
PARK
ER DR
ROMANSVILLE RD
LINDA DR
SHADEBRUSH
RIDGE
S AINT ANDRE WS DR
SPRING OAK DR
DESA
NTIS
DR
WOODWARD DR
TATTE RSAL
L WY
CLAY
TON RD
CHESTNUT LA
PRIC
E LA
JAME
STOW
N DR
JOLE
NE DR
ROMIG RD
BERUE DR
POORHOUSE RD
TREELINE DR
NORT
HBRO
OK RD
D ELAWARE LA
ELK RU N RD
WEST CHESTER RD
NEW VIRGINIA RD
S TARGAZERS RD
STOCKTON RD
S TEEPLE
CHASE RD
SUGA
RS BR
IDGE
RD
HALL RD
DOWNINGTOWN PK
MANO
RWOOD DR
W STRASBURG RD
ADAMS DR
RYAN BL
SHADYSIDE RD
SAWMILL RD
STAY MAN ST
STONEGATE
DR
MARSHALLTON THORNDALE RD
TELEGRAPH RD
BROA
D RU
N RD
BROAD RUN RD
BROAD RUN RD
Newlin Township
East Bradford Township
Caln Township
Pocopson Township
East Caln TownshipDowningtown Borough
3
49
45
37
8
57
39
17
7
9
21
19
7
6
15
7
64
53
3
5
3
12
5 4
4
5
2
4
6
44
4
593
2
4
2
3
3
2
1
3
3
33
2
3
3
2
2
3
1
2
3
2
2
2
3
31
2
1
2
2
2
1
1098
2
22
2
1
2
1
1
1
11
1
2
21
2
1
1
1
1
1
1
2
1
1
1
1
1
1
20
3
3
2
1
1
2
1
1
1
1
1
20
3
30
21
16
15
18
15
10
14
14
10
6
5
6
6
6
10
4
5
4
3
5
210
3
2124 33
3
4
4
1
2
3
1
3
33
2
2
2
2
1
2
2
West Bradford Townshipµ
Date: November 27, 2013
DATA SOURCE: Base data from Chester County GIS Department, 2012.Roads from West Bradford Township, 1/2009. Development constraintsfrom Brandywine Conservancy, 2013.
0 3,000 6,000 9,0001,500Feet
LegendMajor roadsRoadsStreamsBodies of waterPending developmentVacant landsUnderdeveloped landsSouthern Transportation Service AreaWestern Transportation Service AreaAdjacent municipal boundariesTax parcelsTownship boundary
2013 Land Use Assumptions Report
Map 6Vacant and Underdeveloped
Residential Lands
125
69
13513
12
35
38
25

!(162
!(322
WA
LTZRD
PIEDMONT DR
CI
RIDGEVIEW
GREAT
RD
TE RE
SA CT
SHERWOOD
DR
FAWN LA
WA
LTON
DR
YA NKEE DR
HILL TO
PR
D
SUZA
N
NE DR
SEEDS
LA
SPRUCE DR
E SEDONA
DR
MONTVALE CI
SU
NSET DR
OA
KW
OO
DR
D
FEDERAL
DR
CRANBERRY
LA
LONE EAGLE RD
GLENSID
ERD
GLEN
SIDE
RD
WA
IMEA
DR
ROME RD
ALTONW
Y
ERICSSON DR
CRES TMO
NT
DR
SHAGBA
R K DR
GLEN
DR
A
PPLEVI LLE RD
CENT
RA
L DR
PE
N
NS RI DGE PL
CAMP LINDEN RD
OLD
SHA
DYSIDE RD
BRADFORD AV
GROUNDHOGCO
LLEGERD
LIED
S RD
HA
LL
LA
EMB
REE
VIL
LER
D
BA
LLY M OOR
DR
RIDGEWOOD
DR
HIGH
GROVE
DR
SBA
ILEY
RD
DO
YLE
DR
LUCKY
HILLRD
MON
TANA DR
HILL
CR
EST LA
TOWERV
IEW
DR
SILVERBARK LA
SHADYSIDE RD
WINFIELD DR
WARPATH RD
HUN
TDR
CRAWFORD LA
BR
OA
D
RUN R D
M
ARYLANDCI
FOX
RUN
DR
TELEGRAPH RD
CAR
OL
IN APL
NW
AWASET
RD
DELONGDR
CAN
NR
D
HEC
KER DR
STOU
FFR
D
BEACON HILL RD
PARK
ER
DR
RO
MA
NSV
ILLER
D
LINDA DR
SHADEBRUSH
RIDGE
SAIN
T
ANDR
E
W S DR
SPRING
OAKD
R
DE
SAN
TIS
DR
WOODWARD
DR
TATTE RSA
LLW
Y
CLAY
TON RD
CHESTNUT LA
PRIC
ELA
JAM
ESTO
WN
DR
JOLE
NE
DR
ROMIG RD
BERUE DR
POORHOUSERD
TREELINE DR
NO
RTH
BRO
OK
RD
D ELAWARE LA
ELK R U NR
D
WEST CHESTER RD
NEW VIRGINIA
RD
STAR
GA
ZERS
RD
STOCKTONR
D
S TEEPLE
CH
ASERD
SUG
ARS
BRID
GE
RD
HALL RD
DOWNINGTOW
NPK
MA
NOR
WOO
DDR
W STRASBURG RD
ADAMS
DR
RYAN
BL
SHADYSIDE RD
SAWMILL RD
STAY MAN ST
STONEGATE
DR
MARSHALLTON THORNDALERD
TELEGRAPH RD
BR
OA
D R
UN
RD
BROAD RUN RD
BROAD RUN RD
Newlin Township
East Bradford Township
Caln Township
Pocopson Township
East Caln TownshipDowningtown Borough
162,043
1,235,579
10,000
West Bradford Township
Date: November 15, 2013
DATA SOURCE: Base data from Chester County GIS Department, 2012.Roads from West Bradford Township, 1/2009. Development constraintsfrom Brandywine Conservancy, 2013.
0 3,000 6,000 9,0001,500Feet
LegendMajor roadsRoadsStreamsBodies of waterVacant landsUnderdeveloped landsSouthern Transportation Service AreaWestern Transportation Service AreaAdjacent municipal boundariesTax parcelsTownship boundary
2013 Land Use Assumptions Report
Map 7Vacant and Underdeveloped
Commercial / Industrial Lands