Embed Size (px)
Citation preview

DIIS WORKING PAPER 2013:03
1
TitelUndertitel
Forfatter
DIIS Working Paper 2012:XX
WO
RKI
NG
PA
PER
DIIS WORKING PAPER
Land Tenure under Transition – Tenure Security, Land Institutions and Economic Activity in Uganda
DIIS Working Paper 2013:03
Helle Munk Ravnborg, Bernard Bashaasha, Rasmus Hundsbæk Pedersen, Rachel Spichiger and Alice Turinawe

DIIS WORKING PAPER 2013:03
2
HELLE MUNK RAVNBORG Corresponding author E-mail: [email protected]
BERNARD BASHAASHA
RASMUS HUNDSBÆK PEDERSEN
RACHEL SPICHIGER
ALICE TURINAWE
The authors wish to acknowledge the contribution of Michael Kidoido and Sarah Alobo who took part in the qualitative interviews and coordinated and supervised the questionnaire survey upon which this report is based. The authors also wish to acknowledge the useful comments provided during the study from Stephen Ajalu, Royal Danish Embassy, Kampala, and Rikke Brandt Broegaard, DIIS.
This report forms part of a study of the linkages between land and property rights and economic behaviour in Uganda, commissioned by the Royal Danish Embas-sy in Kampala, Uganda. The study has been conducted in collaboration between researchers from Danish Institute for International Studies (DIIS), Copenhagen, Denmark, and Makerere University (MAK), Kampala, Uganda.
DIIS Working Papers make available DIIS researchers’and DIIS project partners’ work in progress towardsproper publishing. They may include importantdocumentation which is not necessarily publishedelsewhere. DIIS Working Papers are published underthe responsibility of the author alone. DIIS WorkingPapers should not be quoted without the expresspermission of the author. DIIS WORKING PAPER 2013:03© The authors and DIIS, Copenhagen 2013Danish Institute for International Studies, DIISStrandgade 56, DK-1401 Copenhagen, DenmarkPh: +45 32 69 87 87Fax: +45 32 69 87 00E-mail: [email protected]: www.diis.dkCover Design: Carsten SchiølerLayout: Ellen-Marie BentsenPrinted in Denmark by Vesterkopi ASISBN: 978-87-7605-544-8 (print)ISBN: 978-87-7605-545-5 (pdf )Price: DKK 25.00 (VAT included)DIIS publications can be downloadedfree of charge from www.diis.dk

DIIS WORKING PAPER 2013:03
3
CONTENTS
1. Introduction 41.1 Background and objectives 41.2 The Study Areas 71.3 Methodology for the empirical research 91.4 Sample characterisation 13
2. Land tenure under transition – the increasing emphasis on individualised and written land tenure documentation 16
2.1 Land tenure form and acquisition mode in Amuru, Masaka and Pallisa areas 162.2 Land tenure documentation in Amuru, Masaka and Pallisa areas 202.3 Exploring correlations between land tenure-related features 272.4 Respondent-related features as sources of variation in tenure form, land acquisition and tenure documentation 30
3. Tenure security 373.1 Tenure security in Amuru, Masaka and Pallisa 373.2 Tenure security – and its correlation with tenure-related features 413.3 Respondent-related features as sources of variation in level of perceived tenure security 46
4. Land disputes and the role of institutions 50
5. Economic behaviour – investments and access to credit 555.1 Types of investments undertaken in Amuru, Masaka and Pallisa 555.2 Investments and correlations with tenure security and tenure form 565.3 Sources of finance for productive and non-productive investments 575.4 Respondent-related features as sources of variation for economic behaviour 60
6. Maintaining, deepening and widening the currently widespread perception of tenure security – conclusions and recommendations 65
6.1 Conclusions 656.2 Recommendations for maintaining, deepening and widening the current widespread perception of tenure security 69
References 71Annex I – List of qualitative interviews undertaken in Amuru, Masaka and Pallisa area 73Annex II – Procedure for sampling individuals holding access to land in the Amuru, Masaka and Pallisa areas 77Annex III – Household poverty index and categories 81Annex IV – Tenure security index and categories 85Annex V – Respondent-related features and their correlation with the propensity to undertake agricultural investments – results from binary logistic regression analysis 90

DIIS WORKING PAPER 2013:03
4
1. INTRODUCTION
1.1 Background and objectives At the time of finalizing the present report, the Cabinet of Uganda is discussing a draft for a new National Land Policy. The draft Land Policy builds upon the Constitution of Uganda (1995) which guarantees every person a right to own property either individually or in association with others. The 1995 Constitution was the first official document ever to recognise customary tenure – the pre-dominant land tenure form in Uganda. In addition to customary tenure, three other tenure forms are officially recognized in Uganda, namely mailo, leasehold and freehold tenure. A brief descrip-tion of these tenure forms is provided in Box 1.1 while Table 1.1 shows their relative importance in each of the four main regions of Uganda.
Box 1.1. Land tenure forms in UgandaFreehold tenure is a classic, individualised type of land tenure. Until independence in 1962, it was given as a grant to the citizens of Uganda as well as to existing institutions by the colonial government. After independ-ence freehold interests were abolished and all land was declared public and was vested in the state. Freehold tenure was converted into leaseholds. All this changed with the 1995 Constitution and the 1998 Land Act, which aim at gradually making freehold tenure the predominant form of land ownership in Uganda.
Leasehold has, since independence in 1962, been granted, providing for access to public land, through a time-bound contract. An owner of land under freehold or a district may grant land under leasehold. For public lands typical lease periods are 5, 45, or 99 years. In return, the tenant – the leaseholder – usually pays an annual rent or service as specified in the leasehold agreement. In contrast to other forms of land tenure, leasehold is open also to non-Ugandan citizens.
The mailo system was introduced by the colonial authorities in mutual agreement with the Buganda Kingdom in 1900. It gave the King and the feudal landlords freehold rights over large tracts of land, often inhabited by poorer subjects, who then became tenants of kibanja. This type of tenure system is prevalent in some regions of Uganda, for example Buganda, Bunyoro, Toro, Ankole and Bugisu. The 1995 constitution guarantees the secu-rity of occupancy of tenants and other ‘bona fide’ occupants, who have occupied, used or developed land un-challenged by the owner for at least 12 years. Recent legislation (the Land Amendment Acts of 2004 and 2010) has further strengthened the security of tenure of tenants vis-à-vis that of the landlords by controlling the land rents and protecting tenants from eviction. The mailo landowners and the Baganda leaders have opposed the national government’s efforts to gain control over land administration.
Customary tenure: With the Constitution (1995) and the Land Act (1998), customary tenure is recognised on a par with freehold and leasehold. Under this type of tenure people may own or have the rights to use land, but they do not have land titles. The systems vary from one place to another. Whereas pastoralist communities tend to manage the land on a communal basis, other communities allocate individual plots to their members, with known and defined boundaries marked by ridges, trenches, trees, etc.
Sources: Batungi, 2008; Bomuhangi et al., 2011; Boone, 2007; Busingye, 2002; Green, 2006; Olanya, 2011; Pedersen et al., 2012; Walker, 2002.

DIIS WORKING PAPER 2013:03
5
Table 1.1. Land tenure forms in Uganda by region1 (N=52,656 parcels; information missing for 1,883 parcels)Per cent of parcels per tenure form by regionRegion Tenure form All
tenure formsCustomary Freehold Mailo Leasehold Squattera Unknown
Northern (n=13,520 parcels)
90.6 5.2 0.1 1.8 1.2 1.0 100.0
Central (n=8,248 parcels)
25.9 22.8 29.2 6.6 14.9 0.6 100.0
Eastern (n=16,291 parcels)
81.4 13.6 0.6 2.3 1.4 0.6 100.0
Western (n=14,597 parcels)
62.7 29.1 1.6 2.0 3.5 1.2 100.0
All regions (N=52,656 parcels)
69.9 17.2 5.3 2.7 4.0 0.9 100.0
a We assume that what in the Uganda Census of Agriculture is labelled ‘squatter’ corresponds to kibanja tenancy.Source: Uganda Census of Agriculture 2008/2009; own processing.
The stated aim of the on-going revision of the national land policy is to enhance the effective use of land, e.g. through promoting the development of a land market, and despite the continued recogni-tion of the co-existence of different tenure forms in Uganda, the draft land policy states that “public policy regards freehold as the property regime of the future” (MLHUD 2011:22).
Formalisation and registration of – individual – land and property rights are widely held to stimulate and sustain economic activity of individuals and businesses through one or more of the following mechanisms:
• by bringing land onto the market so that market forces will work towards gradually allocating land to the most efficient users (seen from an economic point of view);
• by enabling that land be used as collateral for obtaining formal credit and thereby enabling investments, both land and non-land related investments; and/or
• by providing tenure security to the land right holder and thereby encouraging the land right holder – with or without accessing formal credit – to undertake long-term investments in land improvement.
1 The division of districts into regions is based on the Uganda Districts Information Handbook (2007) and the Uganda Population Census (2002). Thus the regions are defined as follows: Northern: Arua, Yumbe, Moyo, Abim, Amolatar, Koboko, Nyadri, Oyam, Kaabong, Dokolo, Amuru, Pader, Nakapiripirit, Nebbi, Moroto, Lira, Kotido, Kitgum, Gulu, Apac, Adjumani; Central: Nakaseke, Mityana, Lyantonde, Wakiso, Wakiso, Kayunga, Ssembabule, Rakai, Nakasongola, Mukono, Mubende, Mpigi, Masaka, Luwero, Kiboga, Kampala, Kalangala; Eastern: Namutumba, Manafwa, Kaliro, Butaleja, Bukwo, Bukedea, Bududa, Budaka, Amuria, Sironko, Mayuge, Kaberamaido, Tororo, Soroti, Pallisa, Mbale, Kumi, Katakwi, Kapchorwa, Kamuli, Jinja, Iganga, Busia, Bugiri; and Western: Kiruhuru, Isingiro, Ibanda, Buliisa, Kyenjojo, Kanungu, Kamwenge, Rukungiri, Ntungamo, Mbarara, Masindi, Kisoro, Kibaale, Kas-ese, Kabarole, Kabale, Hoima, Bushenyi, Bundibugyo.

DIIS WORKING PAPER 2013:03
6
In 2011, the Royal Danish Embassy in Kampala, Uganda, asked researchers at the Danish Institute for International Studies (DIIS) in Copenhagen and at Makerere University (MUK) in Kampala to undertake a study of the linkages between land and property rights and economic behaviour in Uganda. Danida has since the late 1990s provided support to Uganda for agricultural sector development and later more broadly for economic sector development. Thus, the objective of the study was to identify key policy areas and strategic areas of intervention related to land and property rights and their administration which may be conducive to inclusive economic growth.
On this background, the study sets out to examine the above assumptions about the relation-ships between tenure form and tenure administration, tenure security as it is perceived by the land rights holder, and economic behaviour, i.e. access to formal credit and investments (Figure 1.1), first through a review of the evidence already reported in literature and second through own em-pirical research.
Figure 1.1. Assumed relationship between tenure form, tenure administration, tenure security and economic behaviour
The literature review (Pedersen et al., 2012) finds that holding individual and formalised land titles in the literature is often equated with tenure security, and thus that the relationship between specific tenure forms and tenure security tends to be assumed rather than tested empirically. Moreover, it finds that the existing literature does not provide conclusive answers about the extent to which dif-ferent forms of land tenure affect economic activities in Uganda. Despite Uganda’s overall commit-ment to eliminate discriminatory practices based on gender, the review of empirical results reported in the existing literature suggests that women’s rights to land are still being hampered on the ground in several areas and that women are discriminated against both by customary and statutory institu-tions. In other words, different tenure forms, i.e. land and property rights, may provide differenti-ated access to land to different types of actors, as well as differentiated levels of security of tenure. This proposition is incorporated into a modified version of Figure 1.1 as shown in Figure 1.2.

DIIS WORKING PAPER 2013:03
7
Figure 1.2. Conceptual and analytical framework for the present study
Area characteristics:
Respondent characteristics: residence poverty level
gender ethnicity
Presence of land institutions Presence of institutions of justice Pattern and level of inequality
Thus, the second part of the study examines empirically the relationships depicted in Figure 1.2 for different types of actors (e.g. male and female land rights holders, land rights holders with peri-ur-ban and rural residence and belonging to households of different poverty levels) in three different parts of Uganda, namely in Amuru area in northern Uganda, Masaka area in central Uganda and Pallisa area in the eastern part of Uganda (Map 1.1).2 The present report presents the results from this second part of the study.
1.2 The Study AreasAmuru is located in northern Uganda. During the past decades the area has been marked by the civil war which broke out in 1986 and ended with the signing of a cease-fire agreement in 2006. It is estimated that between 1.7 and 1.8 million people were displaced in northern Uganda during the civil war. Among the respondents, from the Amuru area, included in the present survey (see survey description below), 95 per cent reported to have been displaced during the past decades. In the
2 These areas correspond to the district boundaries for Amuru, Masaka and Pallisa districts as they were defined in 2001 and entail the present Amuru and Nwoya districts (Amuru area); Bukomansimbi, Lwengo, Kalungu and Masaka districts (Masaka area); and Butebo and Pallisa districts (Pallisa area).

DIIS WORKING PAPER 2013:03
8
years since 2006, most people have returned to their villages and the area is currently in a process of reconstruction. The area is sparsely populated3 and is predominantly rural with only few urban centres – only five per cent of the population in the Amuru area lives in Amuru town or in other peri-urban trading centres – some of which are the remnants of the IDP camps. Amuru town is by far the largest town in the area and is situated 60 kilometres west of Gulu, while other centres like Pabbo are developing along the road towards South Sudan. Historically, the area around Amuru has been known as the bread-basket of Uganda (Das et al., 2008) and although not yet having re-established that status, crop sales from the area are growing and trade between South Sudan and Uganda is resuming.
Map 1.1.Amuru, Masaka and Pallisa study areas
3 The 2006 population density for Gulu district, which until mid-2006 also comprised Amuru, is estimated to be 45 persons per km2 (Anon., 2007).
Study Area in Uganda
N
50 25 0 50 100 150 Kilometres
Legend
Study Area - Districts
Open water
District Boundary

DIIS WORKING PAPER 2013:03
9
Masaka is situated in central Uganda along the western shores of Lake Victoria. Although three-quar-ters of the population of the Masaka study area is rural, the area has many urban and peri-urban trading centres and an estimated population density of 162 persons per km2 (Anon., 2007). The economy is relatively diversified, although agriculture is still, by far, the most important sector, including the cultivation of coffee.
Pallisa is located in the eastern part of Uganda. Pallisa town is located 65 kilometres west of the larger Mbale town at the border to Kenya. The area is densely populated with an estimated popu-lation density of 360 people per km2 and contains a large wetland area which among other things provides good grazing opportunities as well as opportunities for rice cultivation. Approximately 10 per cent of the population lives in Pallisa town or in one of the trading centres of the area, and agriculture and livestock keeping are the major economic activities, including the cultivation of rice and cotton.
1.3 Methodology for the empirical researchThe empirical research, upon which the present report is based, was conducted through a combi-nation of qualitative and quantitative methods. Conversational interviews were conducted with different types of actors holding access to land in order to explore the relationships between (i) holding land under specific tenure forms, (ii) the perceived level of tenure security, (iii) the efforts made to increase tenure security and (iv) the ways in which such tenure-related features influence economic behaviour in terms of investment and the financing of these investments. Interviews were also made with employees in banks and other types of credit institutions as well as with officials from district, sub-county and village level institutions. Annex I provides a complete list of the in-terviews conducted in the Amuru, Masaka and Pallisa areas as part of this exploratory phase. Some of the interviews were recorded and subsequently transcribed (see Annex I) and those that were not recorded were summarised. These interview transcriptions and summaries were subsequently coded, using the software Nvivo Nudist 8, according to the topics addressed by the informant (e.g. tenure form, tenure security, contact to land administration institutions, land disputes, economic investments, credit, etc.) and the attributes of the informant (e.g. area of residence etc.). Table 1.2 shows a complete list of the nodes used to code the interviews.

DIIS WORKING PAPER 2013:03
10
Table 1.2. List of nodes used for coding conversational interviews conducted in the Amuru, Masaka and Pallisa areasBoundaries
Credit and Banks (collateral, conditions, perceptions)
InvestmentsFunds of InvestmentIn BusinessIn Land
Land Administration InstitutionsCustomaryLocal Council (LC) systemOther
Land MarketsBorrowing LandLand SalesRenting Land
Land RegistrationInformal RegistrationRegistration Process (formal)Talk about Registration and Documents
Land TenureCustomaryFreeholdLeaseholdMailo
Marriage and Gender
OccupationBusiness PersonFarmerRetired or SickWage Labourer
SecurityDispute Settlement InstitutionsDisputesLoss of LandPerceptions
Based on the insights gained through these exploratory conversational interviews as well as through the literature review (Pedersen et al., 2012), a questionnaire entitled Land rights, land administra-tion, agricultural and non-agricultural economic activities and well-being was developed.4 Rather than establishing the proportions of individuals or households having access to land under the different tenure forms in each of the study areas, the objective of the questionnaire survey is to examine the level of correlation between the features depicted in Figure 1.2 above (i.e. holding access to land under different tenure forms, tenure documentation, tenure security and economic behaviour) for different types of actors in the three study areas.
Because freehold and leasehold tenure are not that widespread in the study areas, applying the questionnaire survey to a simple random sample of respondents would be unlikely to yield a suf-ficient number of respondents holding land under freehold or leasehold tenure to allow the ex-amination of the correlation between tenure form and the aspects of interest to the present study. Based on insights from the exploratory, qualitative interviews, holding land under leasehold and freehold tenure appears to be more widespread in urban and peri-urban settings than in rural set-tings. Hence, in order to increase the representation of cases of freehold and leasehold tenure in the samples, the three study area samples were drawn as stratified, random samples of individuals having access to land. Each sample consists of 400 individuals. Sampling only individuals who hold access to land, whether individually or through their family, community or clan, implies that the study will not be able to shed light on the land tenure experiences and the economic behaviour of
4 The questionnaire format is available at http://diis.dk/graphics/_IO_indsatsomraader/Fattigdom_og_natur-resurser/Questionnaire_format_Land%20rights_land%20administration_economic%20activities_wellbeing_DIIS_MAK_2012.pdf

DIIS WORKING PAPER 2013:03
11
individuals who have lost or do not hold access to land, including the approximately 30,000 people in northern Uganda who are estimated to still live in camps.5
For each area, half of the 400 individuals were drawn from neighbourhoods or communities6 classified as peri-urban, while the other half was drawn from the communities classified as rural. This was done through a two-stage sampling procedure. As the first step, 10 ‘rural’ and 10 ‘peri-ur-ban’ LC1s,7 i.e. communities were selected through a geographically stratified, random sampling process (please see Annex II for more details on the LC1 sampling process). Subsequently, as the second step, 20 individuals holding access to land were randomly selected from each of the selected LC1s, based on complete lists of individuals (men as well as women) residing in each of the selected LC1s and holding access to land. These lists were elaborated as part of this study.
Following this procedure, Table 1.3 illustrates the composition of our actual sample with respect to area and residence of respondent.
Table 1.3. Residence of respondents in Amuru, Masaka and Pallisa areas8 (N=1,174 respondents)9
Number of respondentsArea Residence of respondent All
Rural Peri-urbanAmuru 200 199 399Masaka 216 168 384Pallisa 199 192 391All areas 615 559 1,174
Some of the respondents hold access to more than one parcel10 of land and to land located inside as well as outside the community or neighbourhood of residence. Hence, in addition to general information about the respondent and the household to which the respondent belongs, the ques-
5 According to a brief report by International Displacement Monitoring Centre and Norwegian Refu-gee Council from 2012 (www.internal-displacement.org/8025708F004BE3B1/(httpInfoFiles)/9FB09D064C-776572C1257A0800352A30/$file/uganda-overview-may2012.pdf), the 30,000 people still confined to camps lack financial resources to move home, are aged, disabled or unwell or have no land to return to. The overwhelming majority of the 1.8 million internally displaced people who lived in camps at the height of the crisis have returned to their areas of origin or settled in new locations following the signing of the cease-fire agreement in 2006.
6 Using information from the Uganda Bureau of Statistics (UBOS), a list of UBOS-defined Enumeration Areas (EAs ) in all sub-counties of the study area districts was compiled. In most cases, EAs correspond to LC1s (villages/neighbourhoods). UBOS distinguishes between ‘rural’, ‘urban’ and ‘up-coming’ urban EAs. Based on information provided by UBOS, Annex II (Tables II.1-II.3) lists the number of rural and peri-urban households in each of the sub-counties of the Amuru, Masaka and Pallisa areas.
7 LC refers to Local Council.
8 If not indicated differently, the tables presented in this paper are based on data compiled through the questionnaire survey.
9 Although sampled, 26 interviews had to be discarded, as the respondents during the interview process turned out not to hold access to land.
10 We have chosen to use the term ’parcel’ to indicate a contiguous piece land for which a single tenure arrangement applies. ‘Parcel’ is also the term used by the Uganda Bureau of Statistics in the latest agricultural census (2008/2009).

DIIS WORKING PAPER 2013:03
12
tionnaire survey gathered information about up to a maximum of three parcels of land for each respondent. Overall, 63 per cent of the respondents had access to more than one parcel of land and 30 per cent of the respondents had access to land located outside the community of residence. The latter was the case for 20 per cent of the respondents with rural residence and 42 per cent of the respondents with peri-urban residence, indicating that many respondents with peri-urban res-idence uphold agricultural activities outside the peri-urban area. Table 1.4 provides more detailed information with respect to the parcels about which information has been collected as part of the questionnaire survey in the three study areas for respondents with rural and peri-urban residence.
Table 1.4. Parcels included in questionnaire survey in Amuru, Masaka and Pallisa areas (N=2,271 parcels)Number of parcels Area Total number of parcels reported by Average number of parcels reported by
Rural respondents
Peri-urban respondents
All respondents
Rural respondents
Peri-urban respondents
All respondents
Amuruns (n=919 parcels)
455 464 919 2.3 2.3 2.3
Masakans (n=638 parcels)
349 289 638 1.6 1.7 1.7
Pallisans (n=714 parcels)
356 358 714 1.8 2.0 1.8
All areasa 1,160 1,111 2,271 1.9 2.0 1.9
ns No significant difference in average number of parcels included per respondent with rural and peri-urban residence, respec-tively (Scheffe’s test; analysis of variance).a Significant difference in average number of parcels included per respondent in Amuru, Masaka and Pallisa, respectively at 0.05 level (Scheffe’s test; one-way analysis of variance).
The interviewing took place between May and July 2012. The actual interviews were conducted by enumerators partly from the study areas and partly from Makerere University.11 Among other criteria, the enumerators were selected based on ability to speak the relevant local languages of the three areas. The enumerators received training in the questionnaire format and on-going supervi-sion during the period of interviewing from a team of researchers from Makerere University. On
11 In Amuru, seven of the enumerators were individuals from Amuru and Nwoya who were currently unemployed but had previous experience from working as enumerators on surveys, and one enumerator was currently working with a local NGO. In Masaka, six enumerators were currently working as agricultural extension officer with an advisory service provider under NAADS, while one was a local diploma student. Finally, in Pallisa, three enumerators were recent graduates from Makerere University, one was working as a volunteer with Red Cross in Pallisa, one was self- employed and one was a senior agricultural officer working in the Pallisa district administration.

DIIS WORKING PAPER 2013:03
13
average, the questionnaire-based interview lasted 56 minutes,12 ranging from 12 minutes up to two hours and 48 minutes. Obviously, the duration depended upon among other things the number of parcels about which information was provided. Only 10 per cent of the interviews took longer than one and a half hour to complete.
The questionnaire data was digitalised and analysed using SPSS, primarily using correspondence analysis procedures and the Pearson Chi-Square test of correlation. In the tables presented in the subsequent part of the report, significance levels (p) are indicated as follows: ns – p =>0.05; * – p <0.05; ** – p <0.01; and *** – p<0.001.
1.4 Sample characterisation
EthnicityDue to being located in three different parts of Uganda, the ethnic composition of the three sam-ples differs considerably. In the Amuru area, the vast majority of the population is Acholi, while the predominant ethnic group in the Masaka area is Ganda. In the Pallisa area, the majority of the population are either Ateso or Gwere (Table 1.5). In addition, respondents identifying themselves as Nyankole and Nyarwanda are present in Masaka area, while respondents identifying themselves as Kenye, Nyole and Soga are present in Pallisa.
On the basis of this information, a variable has been computed to indicate whether or not a respondent belongs to the predominant ethnic group of the area, i.e. Acholi for the Amuru area, Ganda for the Masaka area and Ateso or Gwere for the Pallisa area. The distribution of respondents according to this variable is shown in Table 1.5 for each of the three areas.
Table 1.5. Ethnicity of respondents, Amuru, Masaka and Pallisa area*** (N=1,172 respondents; information missing for 2 respondents)Per cent respondents per area by ethnicity Area Ethnicity All
ethnic groups
Belong to the predominant
ethnic group of the area***
Acholi Ganda Ateso Gwere Other
Amuru (n=399 respondents)
98.0 0.3 0.3 – 1.5 100.0 98.0
Masaka (n=383 respondents)
– 76.5 – 0.5 23.0 100.0 76.5
Pallisa (n=390 respondents) 0.3 0.8 52.6 36.7 9.7 100.0 89.2
All areas (N=1,172 respondents)
33.4 25.3 17.6 12.4 11.3 100.0 88.1
12 Information on interview duration was available for 1,077 interviews.

DIIS WORKING PAPER 2013:03
14
Sex of respondentAlthough not stratified to ensure the inclusion of equal proportions of male and female respond-ents, this is almost the outcome of the sampling process in two of the three study areas. In Amuru and Masaka, 45 and 43 per cent of the respondents, respectively, are women. Because the female respondents in these two areas are slightly less likely to have access to more than one parcel than the male respondents, slightly lower proportions, namely 43 and 40 per cent of the parcels about which information was provided during the survey, are accessed by female respondents. In Pallisa, by contrast, where women’s access to land over time has tended to be more restricted,13 only 34 per cent of the respondents are women and an identical proportion (34 per cent) of the parcels included in the survey from the Pallisa area are accessed by women.
Household poverty levelLikewise, no explicit effort was made to stratify the sample according to household poverty level. However, the fact that the sample is drawn on the basis of individuals holding access to land implies a bias favouring the inclusion of respondents belonging to non-poor households.14 This bias has two sources. First, although very few rural households are landless,15 the poorest households are less likely to hold access to more than one parcel of land,16 than less and non-poor households. This implies that the poorest households are less likely to have two or more household members listed among the individuals holding access to land and thereby a lower probability of having an individ-ual selected among the respondents for the questionnaire survey than the less poor and non-poor households. Second, for the peri-urban households, we assume that the likelihood of holding access to land correlates negatively with household poverty level. Although Masaka and Pallisa may have experienced a reduction of household poverty between 2005 and 2012, these two aspects contrib-ute to explain part of the divergence between the household poverty profile developed for Masaka and Pallisa districts in 2005 (Figure 1.3) and the household poverty profile of our present samples for the Masaka and Pallisa areas (Figure 1.4).
13 According to Ravnborg and colleagues (2004), significantly less rural, married women had access to land in the eastern districts of Pallisa and Tororo (50 and 41 per cent, respectively), than in the central and western districts of Masaka, Rakai and Kabarole (62, 66 and 59 per cent, respectively).
14 The questionnaire survey was developed to provide the data necessary to replicate the household poverty measure devel-oped as part of the household poverty and gender impact monitoring of the Agricultural Sector Programme Support in 2001 and applied in 2001 and 2006 (for more detail please see Ravnborg et al. (2004). Annex III provides the details on how the household poverty index was computed for the present study.
15 According to the information provided through the gendered district poverty profiles (Ravnborg et al., 2004), 14 per cent of the households in Masaka district were landless or only owned the house and the plot in 2005 while in Pallisa, the corre-sponding proportion was nine per cent.
16 According to the information provided through the gendered district poverty profiles (Ravnborg et al., 2004), 23 per cent of the poorest household in Masaka have more than one parcel compared to 63 per cent of the non-poor and 51 per cent of the less poor households. In Pallisa, the corresponding figures are 50 per cent of the poorest households, compared to 81 per cent of the non-poor households and 67 per cent of the less poor households.

DIIS WORKING PAPER 2013:03
15
Figure 1.3. Household poverty level by area, 2005 (N=802 households)Per cent households per household poverty level by area
Figure 1.4. Poverty level of household to which respondent belongs by area, 2012 (N=1,174 respondents)Per cent respondents per household poverty level by area
0
20
40
60
80
100
Amuru Masaka (n=401households)
Pallisa (n=401households)
Per
cen
t h
ou
seh
old
s
Non-poor Less poor Poorest
0
20
40
60
80
100
Amuru (n=399respondents)
Masaka (n=384respondents)
Pallisa (n=391respondents)
Per c
ent r
espo
ndet
s
Non-poor Less poor Poorest
The non-poor bias is further amplified with respect to the parcels included in the survey, based on the fact that the likelihood of a respondent holding access to more than one parcel increases with decreasing levels of household poverty, particularly in Masaka and Pallisa (Figures 1.5 and 1.6).
Figure 1.5. Having access to more than one parcel by household poverty level and area (N=1,174 respondents)Per cent respondents per household poverty level having access to >1 parcel, by area
Figure 1.6. Poverty level of household to which respondent belongs by area, 2012 (N=2,271 parcels)Per cent parcels per household poverty level by area
0,0
20,0
40,0
60,0
80,0
100,0
Amuru (n=399respondents)
Masaka (n=384respondents)
Pallisa (n=391respondents)
Per
cent
res
pond
ents
Non-poor Less poor Poorest
0.0
20.0
40.0
60.0
80.0
100.0
Amuru(n=919 parcels)
Masaka(n=638 parcels)
Pallisa(n=714 parcels)
Per c
ent p
arce
ls
Non-poor Less poor Poorest

DIIS WORKING PAPER 2013:03
16
2. LAND TENURE UNDER TRANSITION – THE INCREASING EMPHASIS ON INDIVIDUALISED AND WRITTEN LAND TENURE DOCUMENTATION
Land tenure is under transition in Uganda. Several factors contribute to this process of transition. Among these are:
• policy and administrative interventions such as the on-going efforts to promote freehold ten-ure, e.g. by facilitating the gradual conversion of customary tenure into individualised, free-hold tenure by offering the issuing of certificates of customary tenure or the efforts to strength-en the tenure security of kibanja tenants vis-à-vis the mailo land owners;
• oil discoveries and the associated need to reallocate land;• a growing interest in land investments both as a means of savings (e.g. in the case of capital
generated elsewhere – and by no means only through agriculture) and as a response to grow-ing commodity prices at international level, in part as a result of increased demands related to biofuel production; and
• that much of this renewed interest in land acquisition is found among actors to whom obtain-ing land through customary institutions is either not attractive or not possible.
In some parts of Uganda, this transition has been underway for some time, while in other parts it has hardly begun.
2.1 Land tenure form and acquisition mode in Amuru, Masaka and Pallisa areasOne of the places where this process of transition has been taking place during the past decades is Pallisa. According to information from the questionnaire survey conducted as part of the gender and household poverty impact monitoring (ASPS-MUK-DIIS data), the proportion of households in Pallisa having access to land under freehold tenure increased from 15 per cent in 2001 to 26 per cent in 2005. This proportion is not quite supported by data from the 2008/2009 Uganda Census of Agriculture which finds that nine per cent of the parcels included in the census from Pallisa are held under freehold tenure (Table 2.1), nor by our present sample according to which 16 per cent of the parcels included in our survey from Pallisa are held under freehold tenure (Table 2.2). However, irrespective of the exact proportion, the data suggest a breakaway from a situation where land is held exclusively under customary tenure and obtained through inheritance. Although inheritance is still the most common way of acquiring land in Pallisa, accounting for 70 per cent of the parcels, acquiring land through the market, either through purchase or as rentals, accounts for a quarter of the parcels (Table 2.3).
DIIS WORKING PAPER 2013:03
17
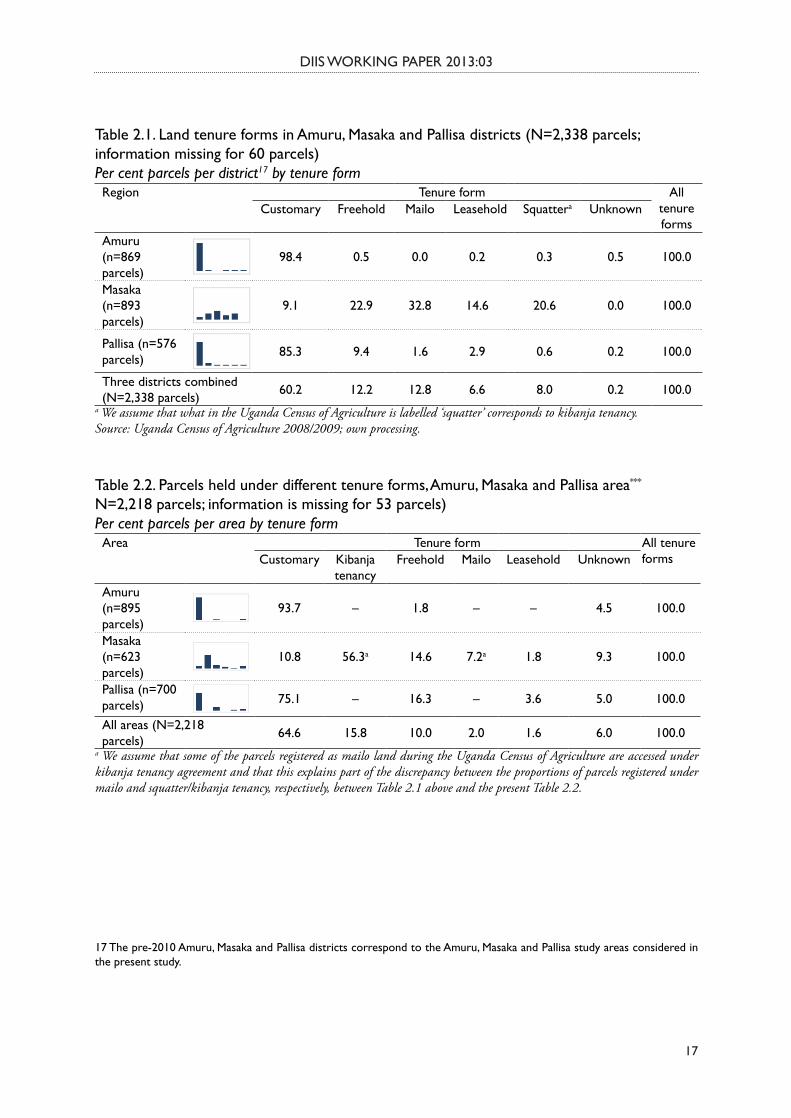
Table 2.1. Land tenure forms in Amuru, Masaka and Pallisa districts (N=2,338 parcels; information missing for 60 parcels)Per cent parcels per district17 by tenure form Region Tenure form All
tenure forms
Customary Freehold Mailo Leasehold Squattera Unknown
Amuru (n=869 parcels)
98.4 0.5 0.0 0.2 0.3 0.5 100.0
Masaka (n=893 parcels)
9.1 22.9 32.8 14.6 20.6 0.0 100.0
Pallisa (n=576 parcels) 85.3 9.4 1.6 2.9 0.6 0.2 100.0
Three districts combined (N=2,338 parcels) 60.2 12.2 12.8 6.6 8.0 0.2 100.0
a We assume that what in the Uganda Census of Agriculture is labelled ‘squatter’ corresponds to kibanja tenancy.Source: Uganda Census of Agriculture 2008/2009; own processing.
Table 2.2. Parcels held under different tenure forms, Amuru, Masaka and Pallisa area*** N=2,218 parcels; information is missing for 53 parcels)Per cent parcels per area by tenure formArea Tenure form All tenure
formsCustomary Kibanja tenancy
Freehold Mailo Leasehold Unknown
Amuru (n=895 parcels)
93.7 – 1.8 – – 4.5 100.0
Masaka (n=623 parcels)
10.8 56.3a 14.6 7.2a 1.8 9.3 100.0
Pallisa (n=700 parcels) 75.1 – 16.3 – 3.6 5.0 100.0
All areas (N=2,218 parcels) 64.6 15.8 10.0 2.0 1.6 6.0 100.0
a We assume that some of the parcels registered as mailo land during the Uganda Census of Agriculture are accessed under kibanja tenancy agreement and that this explains part of the discrepancy between the proportions of parcels registered under mailo and squatter/kibanja tenancy, respectively, between Table 2.1 above and the present Table 2.2.
17 The pre-2010 Amuru, Masaka and Pallisa districts correspond to the Amuru, Masaka and Pallisa study areas considered in the present study.

DIIS WORKING PAPER 2013:03
18
Table 2.3. Land acquisition mode, Amuru, Masaka and Pallisa area*** (N=2,255; information is missing for 16 parcels)Per cent parcels per area by land acquisition modeArea Land acquisition mode
All acquisition modesInherited Purchased
Received in
donation from
relative
Allocated from the
clanRented Other
Amuru (n=910 parcels) 87.9 1.8 3.3 1.3 3.7 2.0 100.0
Masaka (n=638 parcels) 25.4 63.6 6.7 1.7 1.3 1.3 100.0
Pallisa (n=707 parcels) 69.6 17.1 3.0 1.1 8.1 1.1 100.0
All areas (N=2,255 parcels) 64.5 24.1 4.2 1.4 4.4 1.5 100.0
In Masaka in central Uganda, the dominant form of land tenure is the mailo tenure and the asso-ciated kibanja tenancy. Although formally recognized as mailo land held under kibanja tenancy, many of the respondents included in our survey that hold access to land under kibanja tenancy, state to have purchased their land. Thus, in Masaka, almost two-thirds of the parcels included in the survey had been acquired through purchase (Table 2.3), including 64 per cent of the parcels held under kibanja tenancy.18,19 Likewise, a significantly higher proportion of the respondents from Masaka reported to have sold land during the past 10 years, namely seven per cent, as compared to four per cent of the respondents in Pallisa and two per cent in Amuru.20
Also in Masaka, land tenure is under transition, however, from a different starting point and through a different process. In the wake of the Land Act Amendment of 2010 which sought to strengthen the rights of kibanja tenants, e.g. by seeking to protect them against eviction by the mailo owners, a reduction of the rent to be paid to the mailo owners has been announced. This has contributed to undermine the authority of the mailo owners and may herald a new situation where land held under the mailo system as kibanja tenancy will gradually be converted into individualized freehold tenure, just as what appears to be happening in Pallisa. At the same time, however, these announcements have contributed to increase the level of uncertainty associated with kibanja tenan-cy, e.g. due to the fact that kibanja tenants and mailo owners may no longer know each other and that in many cases, the rent (busuulu) payment, which to many tenants is an important element in their efforts to support their land claim, has ceased as the following excerpt from a conversational interview with a young, male farmer from the Masaka area illustrates:
18 This figure is not reported in Table 2.3.
19 Some of these parcels held under kibanja tenancy, but acquired through the market, may in the Uganda Census of Agricul-ture have been included in the category of parcels held under freehold (Table 2.1).
20 Data not shown in table; correlation is significant at 0.01 level (Pearson Chi-Square test).

DIIS WORKING PAPER 2013:03
19
Q: Do you know the landlord for the plots where you have land? A: I knew the old man, but the daughter who inherited the land, no. Q: Do you pay rent to the daughter of the landlord? A: We no longer pay rent, awaiting for the new law to stipulate how much.Q: Did you refuse to pay, or you do not know where to pay the rent. A: It came from the land owners. They felt that they were getting very little money and they stopped [collecting].Q: Do you think this is right or is it dangerous one way or another? A: Yes, it is dangerous …. It is very unstable and uncertain; people buy without knowing who the land owner is. At a certain point in time, the landlord needs the land. People will either lose or gain in the process.Q: Are you planning to do anything about the uncertainty? A: To keep the previous records before they stopped [collecting the rent].21
In Amuru area, by contrast, there are few signs of land tenure being under transition. Both the 2008/2009 Uganda Census of Agriculture and our survey find that virtually all land in Amuru is held under customary tenure (98 per cent of the parcels included in the Uganda Census of Agricul-ture and 94 per cent of the parcels included in our survey – Tables 2.1 and 2.2, respectively). Yet, drastic changes have taken place during past decades. Virtually all (95 per cent) of the respondents included in the survey from the Amuru area reported to have been displaced from their area of origin during the past decades, the majority (62 per cent) during a period of more than 10 years. However, the majority of the respondents now (in 2012) indicate to live in the community where they were born (65 per cent of the respondents)22 or in a neighbouring community to where they were born (19 per cent of the respondents). Thus, rather than being under transition, land tenure may be considered to be in a process of re-establishment. As an indication, many of the people interviewed about their land tenure in the Amuru area emphasized that their land was inherited, as is the case for this widow in Amuru who together with her four children returned to her parents upon the death of her husband:
Q: When your father gave you land, did you go and see the boundaries or what happened?A: When land was given to me, my parents showed me where to work. No boundaries were given to me. For the land belongs to my parents. Q: Do you consider the piece of land as yours now?A: This land is now where I work. I have nowhere to go. As long as I am alive I will work and stay here….Q: Do you feel insecure about the land?A: This land will always be mine, even if I die, it will remain mine as long as the children are there.23
21 Interview held, October 27, 2011.
22 Ranging from 59 per cent of the respondents currently residing in a rural community to 72 per cent of the respondents currently residing in a peri-urban community.
23 Interview held, January 20, 2012.

DIIS WORKING PAPER 2013:03
20
Yet, although not widespread, our qualitative interviews suggest that changes may be underway, also in Amuru. According to a parish chief from the Amuru area, titled land is becoming more common in the area around the peri-urban trading centre Pabbo24 along the main road connecting Gulu to Nimule at the border to South Sudan. Moreover, more than one hundred applications, mainly from groups, i.e. families, for certificates of customary tenure have been presented to the District Land Board of Amuru District. So far, however, no certificates have been issued,25 apparently because the formats for the certificates have not yet been provided to the district by the Ministry of Lands, Housing and Urban Development. As several people told us during the interviews, right now, titles may not be needed, but in the future, they may be helpful:
Q: Do you plan to get a title for your land?A: Not yet for I still don’t have the money to undergo the process.Q: Why do you want the title?A: It will help in the future when I am not there, my children will use it in case someone grabs the land.26
Thus, in terms of land tenure Amuru may stand at the verge towards moving away from a situation of land held collectively by clans and families under customary tenure towards a situation of land being held individually and acquired through the market, as has taken place e.g. in Pallisa during the past couple of decades.
2.2 Land tenure documentation in Amuru, Masaka and Pallisa areasSuch moves towards obtaining individual land titles – whether freehold title or a certificate of customary tenure – appear to be motivated by a wish to strengthen land claims, partly due to the perception that customary tenure is weakening, and partly in recognition of the need to prepare for an uncertain future, as expressed by this man from Pallisa:
Q: Why would you like to get [a title]?A: Because I inherited [the land] from my dad who also inherited from his parent and managed to keep it and pass it to me, so I would like to do the same for my children, pass it to them.Q: Can’t you do that without a title?A: Aaah, you can’t know what might happen, things are changing; it is not like those days of our fathers, so it’s more safe when you have one [a title].Q: But right now, do you feel threatened of losing your land since currently you don’t have a title?A: For now no, but I fear for the future, because you can’t tell.27
24 Interview with Parish Chief, Amuru area, January 19, 2012.
25 Interview with Amuru District Land Officer, Gulu, January 18, 2012.
26 Interview with 34 year old business man in a trading centre in the Amuru area about his plans to apply for a title for land allocated to him in the village, January 21, 2012.
27 Interview male farmer in a rural community in the Pallisa area, January 25, 2012.

DIIS WORKING PAPER 2013:03
21
Thus, comparing three study areas, it is particularly in the Pallisa area that people accessing land have embraced the opportunity to obtain a title in support of their access to land held under customary tenure, thereby taking the first steps towards individualising tenure to land that has previously been held collectively through customary tenure (Table 2.4).28
Table 2.4. Land title held, Amuru, Masaka and Pallisa areas*** (N=2,264 parcels; information missing for 7 parcels)Per cent parcels per area by title held Area Type of title held All titles
Certificate of customary
tenure
Freehold title Mailo title Leasehold title
Amuru (n=917 parcels) 1.4 0.4 – – 1.9
Masaka (n=638 parcels) 1.3 6.1 3.4 1.4 12.2
Pallisa (n=709 parcels) 27.2 8.6 – 0.6 36.5
All areas (N=2,264 parcels) 9.5 4.6 1.0 0.6 15.6
Partly due to the predominance of the kibanja tenancy and the associated rent payment, partly due to the fact that the predominant way of acquiring land in the Masaka area is through purchase, some kind of written documentation exists in support of the land tenure for the vast majority of parcels included in the questionnaire survey – more than 80 per cent – from the Masaka area (Table 2.5). Much of the written documentation is thus private documentation, i.e. documentation written and authorized between two or more individuals such as a sales agreement, a will, a rental or mortgage agreement, etc. Thus, it is mainly in the Masaka area where written tenure documentation tends to be private documentation, that respondents indicate that they are planning to take steps to improve their tenure documentation, primarily by obtaining statutory titles (e.g. certificate of customary ten-ure, freehold title, etc.). Altogether, respondents planned to improve the written documentation for 43 per cent of the parcels included in the survey from Masaka area, as compared to less than 10 per cent of the parcels included from Pallisa and Amuru area.29
28 It should be noted that only three of the 190 parcels in Pallisa for which certificate of customary tenure had been obtained were by the respondents considered to be under freehold tenure. The remaining 187 parcels were considered to be under customary tenure.
29 Namely nine per cent of the parcels included from Pallisa area and four per cent of the parcels included from Amuru area; data not tabulated.

DIIS WORKING PAPER 2013:03
22
Table 2.5. Tenure documentation type by Amuru, Masaka and Pallisa areas*** (N=2,236 parcels, information missing for 35 parcels)Per cent parcels for which documentation type exists in support of tenure rights of respondent by areaArea Documentation type All
documentation types
No written documentation
Private documentation
only
Incomplete formal
documentation, possibly in
combination with private
documentation
Formal documentation,
possibly in combination with private
and incomplete formal
documentation
Amuru (n=914 parcels)
94.7 1.9 1.5 1.9 100.0
Masaka (n=629 parcels)
18.8 56.8 11.6 12.9 100.0
Pallisa (n=693 parcels)
40.3 21.4 1.0 37.4 100.0
All areas (N=2,236 parcels) 56.5 23.3 4.2 16.0 100.0
In most cases where written documentation exists, it identifies the parcel location and size and it is written in the name of the current user (Table 2.6).
Table 2.6. Tenure documentation contents in terms of parcel and right-holder identification, Amuru, Masaka and Pallisa areas (N=933 parcels; information missing for 40 parcels)Per cent parcels per area by tenure documentation contentsArea Document
identifies parcel
location and sizens
Right-holder identified in written documentation in relation to current parcel user***
All right-holder
relations to current user
Non-related/unknown by current user
Husband Relative (other than husband)
Own name
Amuru (n=34 parcels) 88.2 – 26.5 41.2 32.4 100.0
Masaka (n=506 parcels) 87.5 0.2 17.0 16.2 66.6 100.0
Pallisa (n=393 parcels) 82.5 1.8 16.8 8.7 72.8 100.0
All areas (N=933 parcels) 85.4 0.9 17.3 13.9 68.0 100.0
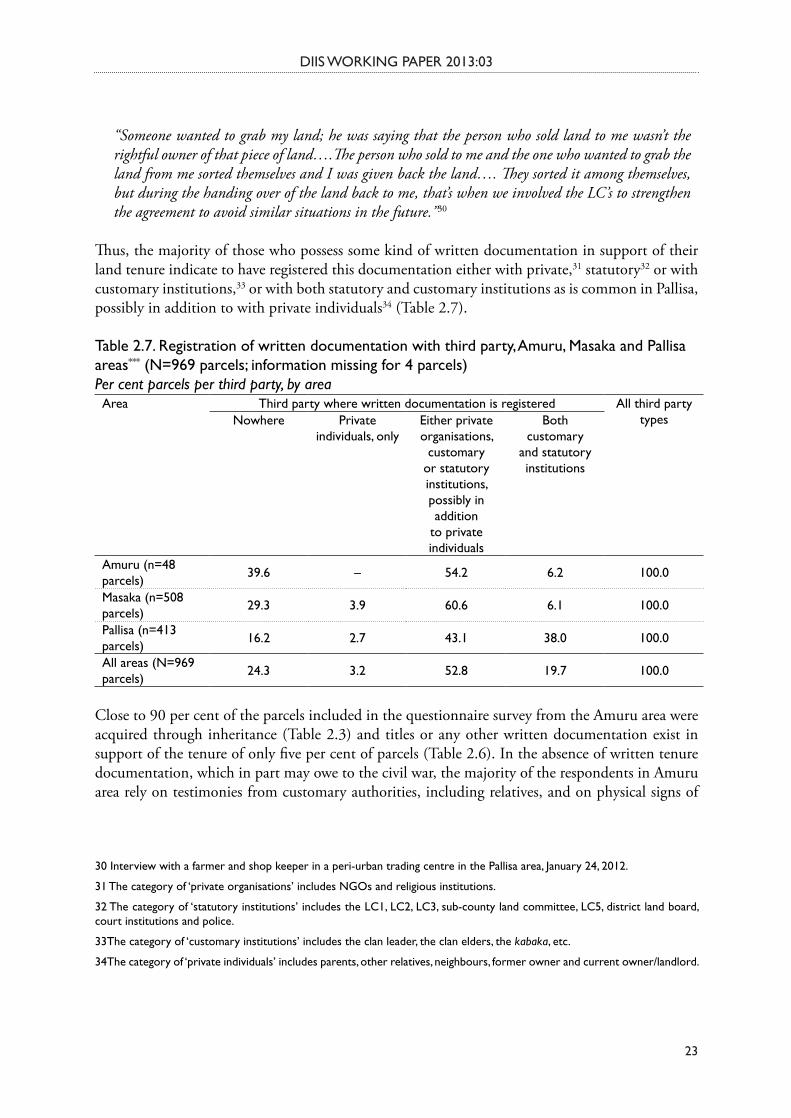
Obviously, written tenure documentation like land titles, is registered with third parties such as district land boards. However, in many cases people also choose to register written tenure documen-tation with, and in general call upon, third parties even if not formally required to do so, as this is perceived to strengthen the tenure agreement:
DIIS WORKING PAPER 2013:03
23
“Someone wanted to grab my land; he was saying that the person who sold land to me wasn’t the rightful owner of that piece of land….The person who sold to me and the one who wanted to grab the land from me sorted themselves and I was given back the land…. They sorted it among themselves, but during the handing over of the land back to me, that’s when we involved the LC’s to strengthen the agreement to avoid similar situations in the future.”30
Thus, the majority of those who possess some kind of written documentation in support of their land tenure indicate to have registered this documentation either with private,31 statutory32 or with customary institutions,33 or with both statutory and customary institutions as is common in Pallisa, possibly in addition to with private individuals34 (Table 2.7).
Table 2.7. Registration of written documentation with third party, Amuru, Masaka and Pallisa areas*** (N=969 parcels; information missing for 4 parcels)Per cent parcels per third party, by area Area Third party where written documentation is registered All third party
typesNowhere Private individuals, only
Either private organisations,
customary or statutory institutions, possibly in addition
to private individuals
Both customary
and statutory institutions
Amuru (n=48 parcels) 39.6 – 54.2 6.2 100.0
Masaka (n=508 parcels) 29.3 3.9 60.6 6.1 100.0
Pallisa (n=413 parcels) 16.2 2.7 43.1 38.0 100.0
All areas (N=969 parcels) 24.3 3.2 52.8 19.7 100.0
Close to 90 per cent of the parcels included in the questionnaire survey from the Amuru area were acquired through inheritance (Table 2.3) and titles or any other written documentation exist in support of the tenure of only five per cent of parcels (Table 2.6). In the absence of written tenure documentation, which in part may owe to the civil war, the majority of the respondents in Amuru area rely on testimonies from customary authorities, including relatives, and on physical signs of
30 Interview with a farmer and shop keeper in a peri-urban trading centre in the Pallisa area, January 24, 2012.
31 The category of ‘private organisations’ includes NGOs and religious institutions.
32 The category of ‘statutory institutions’ includes the LC1, LC2, LC3, sub-county land committee, LC5, district land board, court institutions and police.
33The category of ‘customary institutions’ includes the clan leader, the clan elders, the kabaka, etc.
34The category of ‘private individuals’ includes parents, other relatives, neighbours, former owner and current owner/landlord.

DIIS WORKING PAPER 2013:03
24
demarcation in the landscape to support their land claims as excerpts from an interview with a land holder in Amuru illustrate (see also Table 2.8):
Q: What shows that this that land is yours?A: When the lands were being allocated to us, our mom was telling us that you dig up to this tree and others to the well over there, so I know my boundaries from the tree and swamps.Q: What makes a land owner comfortable about the land?A: The trees that were planted like mango trees and also banana plantations and also the previous buildings like walls.Q: Did you plant mango trees and bananas here?A: Yes, but others were destroyed by fire and now we have started planting other trees.35
Table 2.8. Physical demarcation of parcels, Amuru, Masaka and Pallisa areas (N=2,225 parcels; information missing for 46 parcels)Per cent parcels per area by type of physical demarcationArea Parcel is
physically demarcated
in the landscape**
Type of physical demarcation
Tree
s***
Hed
ges**
*
Boun
dary
po
sts**
*
Stre
ams**
*
Fenc
es**
*
Build
ings
***
Roc
ks o
r bo
ulde
rs**
Rid
ges
or
mou
ntai
ns**
*
Roa
dns
Ant
hilns
Amuru (n=899 parcels) 92.3 55.1 31.0 1.8 17.6 1.2 4.8 4.9 1.1 3.1 4.2
Masaka (n=628 parcels) 89.3 42.7 37.1 16.4 2.4 12.4 10.4 7.3 5.6 1.8 -
Pallisa (n=698 parcels) 94.7 72.1 35.5 29.5 3.0 13.3 10.9 3.4 1.1 1.1 -
All areas (N=2,225 parcels)
92.2 56.9 34.2 14.6 8.7 8.2 8.3 5.1 2.4 2.1 1.7
Combining land tenure documentation characteristics into a land tenure documentation indexIn order to combine these different aspects of land tenure documentation, i.e. (i) the type of written tenure documentation that exists with respect to each parcel, and the extent to which the written documentation is (ii) registered with a third party; (iii) identifies the parcel location and size; and (iv) identifies the current land access holder as the right holder, a tenure documentation index was developed on the basis of the scoring system summarised in Table 2.9.
For each parcel, the tenure documentation index36 [doc_index] is computed as the average between the score obtained for documentation type [doc_type] and the score obtained for documentation
35 Interview with man who earns his livelihood from farming and working as a carpenter, Amuru, January 19, 2012.
36 The aspect of physical demarcation of the parcel was not included into the index as hardly any variation exists in this re-spect, neither within each area nor between the areas.

DIIS WORKING PAPER 2013:03
25
characteristics [doc_characteristics_index], which in turn is computed as the average between the scores obtained with respect to third party registration [doc_reg], documentation details with re-spect to location and size [doc_detail], and relationship between current access holder and the right-holder stated in the document [doc_name].
Table 2.9. Scoring system for tenure documentation index
Score Documentation type[doc_type]
Documentation characteristics [doc_characteristics_index]
Third party documentation
registration[doc_reg]
Documentation identification of
parcel location & size[doc_detail]
Relation of current access holder to right-holder
identified in documentation
[doc_name]
1 No written documentation exists Nowhere
Does not indicate precise location and
size
In name of unknown person/person un-related to present
access holder
2 Only private documentation exists Privately only In name of husband
3 Incomplete formal documentation exists
With customary or statutory institutions In name of relative
4 Complete formal documentation exists
With both customary and statutory institutions
Indicates precise location and size In own name
Figure 2.1 depicts the distribution of parcels according to this tenure documentation index. The average tenure documentation index values varies from 1.09 in Amuru, where hardly any of the respondents had written documentation in support of their tenure rights to 2.48 in Masaka, where the most common form of documentation is private documentation. In Pallisa, where those who have written documentation in support of their land tenure are most likely to have complete formal documentation, often registered both with customary and statutory institutions, but where also a considerable group of parcels exists for which no written tenure documentation is held, the average tenure documentation index value is 2.36.37
37 The distribution of parcels according to the tenure documentation index is pairwise significantly different between the three areas at 0.05 level (Scheffe’s text).

DIIS WORKING PAPER 2013:03
26
Figure 2.1. Distribution of parcels according to tenure documentation index, Amuru, Masaka and Pallisa areas (N=2,236 parcels; information missing for 35 parcels)Number of parcels
Based on the land tenure documentation index, three levels of written tenure documentation were computed (Table 2.10).38
Table 2.10. Written tenure documentation level, Amuru, Masaka and Pallisa area*** (N=2,236 parcels; information missing for 35 parcels)Per cent parcels per area by documentation levelArea Level of written documentation All levels
of written documentation
LowNo written
documentation
MediumSome or imprecise
documentation
HighMore & more
precise registered documentation
Amuru (n=914 parcels) 94.7 2.8 2.4 100.0
Masaka (n=629 parcels) 18.8 64.5 16.7 100.0
Pallisa (n=693 parcels) 40.3 23.8 35.9 100.0
All areas (N=2,236 parcels) 56.5 26.7 16.8 100.0
38 Low, i.e. no written documentation: doc_index=1; medium, i.e. some or imprecise documentation: doc_index>1 and <=3; high, i.e. more and more precise, registered documentation: doc_index>3.

DIIS WORKING PAPER 2013:03
27
2.3 Exploring correlations between land tenure-related features
Land acquisition and tenure form correlationsIn all three areas, there is a clear tendency that parcels held under freehold tenure tend to be pur-chased, while land held under customary tenure tends to be inherited (Table 2.11). This tendency is most evident in Amuru and Pallisa, whereas in Masaka where the majority of land transactions appears to be mediated through the market, a considerable part (40 per cent) even of the parcels held under customary tenure are acquired through purchase.
Tenure documentation and tenure form correlationsGiven the characteristics of the different tenure forms, it should come as no surprise that in all three areas, tenure of parcels held under customary tenure is significantly more likely not to be documented through any written documentation than tenure of parcels held under any other ten-ure form (Table 2.12). By contrast, the tenure of parcels held under freehold, mailo or leasehold is significantly more likely to be documented through more and more precise written documentation (Table 2.12). Tenure of parcels held under kibanja tenancy is likely to be documented through some written documentation, mainly purchase agreements and receipts of rent payment, as previ-ously described.

DIIS WORKING PAPER 2013:03
28
Table 2.11. Land acquisition mode by tenure form, Amuru, Masaka and Pallisa areas (N=2,202 parcels; information missing for 69 parcels)Per cent parcels per tenure form by acquisition form, by areaArea Tenure form Land acquisition mode All acquisit-
ion modesInheritance Purchase Donation from
relative
Allocated from the
clan
Rented Other
Amuru***
Customary (n=839 parcels)
94.6 0.2 2.1 1.4 0.4 1.2 100.0
Freehold (n=16 parcels)
0.0 81.3 0.0 0.0 0.0 18.8 100.0
Unknown (n=31 parcels)
9.7 3.2 16.1 0.0 64.5 6.5 100.0
All tenure forms (n=886 parcels)
90.0 1.8 2.6 1.4 2.6 1.7 100.0
Masaka***
Customary (n=67 parcels)
47.8 43.3 6.0 0.0 0.0 3.0 100.0
Kibanja tenancy (n=351 parcels)
25.6 64.4 5.7 3.1 0.6 0.6 100.0
Freehold (n=91 parcels)
20.9 68.1 11.0 0.0 0.0 0.0 100.0
Mailo (n=45 parcels)
15.6 73.3 11.1 0.0 0.0 0.0 100.0
Leasehold (n=11 parcels)
18.2 72.7 9.1 0.0 0.0 0.0 100.0
Unknown (n=58 parcels)
12.1 74.1 1.7 0.0 8.6 3.4 100.0
All tenure forms (n=623 parcels)
25.2 64.4 6.6 1.8 1.1 1.0 100.0
Pallisa***
Customary (n=526 parcels)
91.3 2.9 2.9 1.5 0.8 0.8 100.0
Freehold (n=114 parcels)
3.5 92.1 0.0 0.0 4.4 0.0 100.0
Leasehold (n=25 parcels)
0.0 0.0 0.0 0.0 100.0 0.0 100.0
Unknown (n=28 parcels)
3.6 3.6 7.1 0.0 78.6 7.1 100.0
All tenure forms (n=693 parcels)
70.0 17.5 2.5 1.2 8.1 0.9 100.0
All areas (N=2,202 parcels) 65.3 24.4 3.7 1.4 3.9 1.2 100.0

DIIS WORKING PAPER 2013:03
29
Table 2.12. Tenure documentation level by tenure form, Amuru, Masaka and Pallisa areas (N=2,059 parcels; information missing for 212 parcels)Per cent parcels per tenure form by documentation level, by areaArea Tenure form Level of written documentation All levels
of written documentation
LowNo written
documentation
MediumSome or imprecise
documentation
HighMore & more
precise registered documentation
Amuru***
Customary (n=835 parcels) 95.9 1.7 2.4 100.0
Freehold (n=15 parcels) 33.3 53.3 13.3 100.0
All tenure forms (N=850 parcels) 94.8 2.6 2.6 100.0
Masaka***
Customary (n=67 parcels) 32.3 44.6 23.1 100.0
Kibanja tenancy (n=345 parcels) 21.7 71.0 7.2 100.0
Freehold (n=91 parcels) 7.7 51.6 40.7 100.0
Mailo (n=45 parcels) 2.2 57.8 40.0 100.0
Leasehold (n=11 parcels) 9.1 27.3 63.6 100.0
All tenure forms (N=557 parcels) 18.9 62.8 18.3 100.0
Pallisa***
Customary (n=515 parcels) 45.8 17.1 37.1 100.0
Freehold (n=113 parcels) 7.1 44.2 48.7 100.0
Leasehold (n=24 parcels) 37.5 62.5 – 100.0
All tenure forms (N=652 parcels) 38.8 23.5 37.7 100.0
Despite these common patterns of correlation between tenure form and level of written documen-tation, there are also notable differences between the areas which corroborate the above account of different experiences of land tenure transition in the three areas. In Amuru, customary tenure is largely documented through claims of inheritance and thus of belonging to the land, and supported by the existence and significance of physical demarcations in the landscape. By contrast, particularly

DIIS WORKING PAPER 2013:03
30
in Pallisa but also in Masaka, customary tenure is increasingly documented through formally regis-tered written documentation, implying that customary tenure is gradually transformed from build-ing upon kinship and community relations mediated through customary authorities into building upon individualised transactions mediated through the market and statutory institutions.
2.4 Respondent-related features as sources of variation in tenure form, land acquisition and tenure documentationApart from the area and the cultural, economic and political dynamics that characterise and con-tribute to shape each area, our survey results suggest that the processes of land tenure transition seem to be embraced differently by and – in the course of new tenure forms, modes of acquisition and ways of documenting tenure gain and are assigned dominance – to favour some types of actors at the expense of others. The Tables 2.13-2.21 examine the extent to which respondent-related features correlate with (i) holding land under a particular tenure form, (ii) the mode of land acqui-sition, and (iii) the level of written documentation held in support of land tenure.
Four sets of respondent-related features are included in the analysis, namely (i) residence – whether the respondent lives in a rural or a peri-urban area; (ii) sex of respondent – whether the respondent is male or female; (iii) ethnicity – whether the respondent belongs to the predominant ethnic group(s) of the area; and (iv) household poverty level – whether the respondent belongs to a household characterised as non-poor, less poor or poorest.39
Obviously, the fact that there is very limited variation in the Amuru area with respect to the tenure–related features limits the scope of exploring the extent to which respondent-related features contribute to the (almost non-existent) variation in these respects. With this reservation in mind, only residence of the respondent40 appears to be significantly correlated with tenure form, land acquisition mode and written tenure documentation level (Tables 2.13-2.15). In Amuru, respond-ents living in peri-urban areas are slightly more likely to hold land under freehold tenure, to have purchased the land and to hold written documentation in support of their tenure than respondents living in rural areas.
39 Please see section 1.4 above and Annex III.
40 Although significant correlation is signalled also for ethnicity and household poverty level with respect to land acquisition mode (Table 2.14), more than 25 per cent of the cells have an expected frequency of less than five, which makes the chi-square test of independence less reliable.

DIIS WORKING PAPER 2013:03
31
Table 2.13. Tenure form and its correlation with respondent-related features, Amuru (N=855 parcels, information missing for 64 parcels)Per cent parcels per respondent-related characteristic according to tenure formRespondent-related feature
Tenure form All tenure forms
Customary Kibanja tenancy
Freehold Mailo Leasehold
Residence of respondent*
Rural (n=426 parcels) 99.1 – 0.9 – – 100.0Peri-urban (n=429 parcels) 97.2 – 2.8 – – 100.0
Sex of respondentns Male (n=495 parcels) 98.4 – 1.6 – – 100.0Female (n=360 parcels) 97.8 – 2.2 – – 100.0
Ethnicity – belongs to predominant ethnic group(s) of the areans
Yes (n=846 parcels) 98.1 – 1.9 – – 100.0
No (n=9 parcels) 100.0 – 0.0 – – 100.0
Poverty level of household to which respondent belongsns
Non-poor (n=154 parcels) 98.7 – 1.3 – – 100.0
Less poor (n=341 parcels) 98.8 – 1.2 – – 100.0
Poorest (n=360 parcels) 97.2 – 2.8 – – 100.0All respondents (N=855 parcels) 98,1 – 1.9 – – 100.0
Table 2.14. Land acquisition form and its correlation with respondent-related features, Amuru (N=910 parcels, information missing for 9 parcels)Per cent parcels per respondent-related characteristic according to land acquisition formRespondent-related feature
Land acquisition form All land acquisition
formsInhe-
ritancePur-
chaseDonation
from relative
Alloc-ation
from clan
Renti-ng
Other
Residence of respondent**
Rural (n=446 parcels) 90.8 0.2 4.0 1.1 2.5 1.3 100.0Peri-urban (n=464 parcels) 85.1 3.2 2.6 1.5 5.0 2.6 100.0
Sex of respondentns Male (n=521 parcels) 90.6 1.3 2.3 0.8 3.3 1.7 100.0Female (n=389 parcels) 84.3 2.3 4.6 2.1 4.4 2.3 100.0
Ethnicity – belongs to predominant ethnic group(s) of the area**,a
Yes (n=896 parcels) 88.4 1.8 3.1 1.3 3.5 1.9 100.0
No (n=14 parcels) 57.1 0.0 14.3 0.0 21.4 7.1 100.0
Poverty level of household to which respondent belongs***,b
Non-poor (n=164 parcels) 87.2 1.2 0.6 3.7 3.7 3.7 100.0
Less poor (n=372 parcels) 89.0 1.3 2.4 0.5 5.9 0.8 100.0
Poorest (n=374 parcels) 87.2 2.4 5.3 1.1 1.6 2.4 100.0All respondents (N=910 parcels) 87.9 1.8 3.3 1.3 3.7 2.0 100.0a 42 per cent of the cells have an expected frequency of less than 5.b 28 per cent of the cells have an expected frequency of less than 5.

DIIS WORKING PAPER 2013:03
32
Table 2.15. Tenure documentation level and its correlation with respondent-related features, Amuru (N=914 parcels, information missing for 5 parcels)Per cent parcels per respondent-related characteristic according to level of written tenure documentationRespondent-related feature
Level of written documentation All levels of written
documentationLow
No written documentation
MediumSome or
imprecise doc-umentation
HighMore &
more precise registered
documenta-tion
Residence of respondent***
Rural (n=453 parcels) 98.5 1.3 0.2 100.0Peri-urban (n=461 parcels) 91.1 4.3 4.6 100.0
Sex of respondentns Male (n=521 parcels) 94.4 2.9 2.7 100.0Female (n=393 parcels) 95.2 2.8 2.0 100.0
Ethnicity – belongs to predominant ethnic group(s) of the areans
Yes (n=901 parcels) 94.8 2.8 2.4 100.0
No (n=13 parcels) 92.3 7.7 0.0 100.0
Poverty level of household to which respondent belongsns
Non-poor (n=164 parcels) 92.7 3.7 3.7 100.0
Less poor (n=372 parcels) 95.7 3.2 1.1 100.0
Poorest (n=378 parcels) 94.7 2.1 3.2 100.0All respondents (N=914 parcels) 94.7 2.8 2.4 100.0
In contrast, in Masaka and Pallisa respondent-related features appear to matter more. In Masaka, respondents belonging to the poorest and less poor households are more likely to hold land under kibanja tenancy, while in turn respondents belonging to non-poor households are more likely to hold land under freehold tenure (Table 2.16). Respondents belonging to non-poor households are also significantly more likely to have purchased their land and to hold more and more precise written documentation in support of their tenure than the less poor and particularly the poorest re-spondents (Tables 2.17 and 2.18). Likewise, parcels held by respondents with peri-urban residence are significantly more likely to have been purchased and to have some or more written documenta-tion in support of their tenure than parcels held by respondents with a rural residence (Tables 2.17 and 2.18).
Respondents who belong to the Ganda ethnic group – the predominant ethnic group in the Masaka area – are more likely to hold land under kibanja tenancy than respondents who belong to other ethnic groups, although by no means implying that respondents belonging to other ethnic groups are excluded from holding land under kibanja tenancy. Whether the respondent is male or female is not found to correlate neither with holding land under any particular tenure form nor with the level of written tenure documentation, while parcels held by men are slightly more likely to have been purchased than parcels held by women.

DIIS WORKING PAPER 2013:03
33
Table 2.16. Tenure form and its correlation with respondent-related features, Masaka (N=565 parcels, information missing for 73 parcels)Per cent parcels per respondent-related characteristic according to tenure formRespondent-related feature
Tenure forms All tenure formsCustom-
aryKibanja tenancy
Free-hold
Mailo Lease-hold
Residence of respondent*
Rural (n=310 parcels) 9.4 62.3 17.7 9.7 1,0 100.0Peri-urban (n=255 parcels) 14.9 62.0 14.1 5.9 3,1 100.0
Sex of respondentns Male (n=337 parcels) 12.5 61.4 15.1 9.5 1,5 100.0Female (n=228 parcels) 11.0 63.2 17.5 5.7 2,6 100.0
Ethnicity – belongs to predominant ethnic group(s) of the area**
Yes (n=445 parcels) 11.0 65.2 15.7 7.0 1,1 100.0
No (n=119 parcels) 15.1 51.3 17.6 10.9 5,0 100.0
Poverty level of household to which respondent belongs**
Non-poor (n=344 parcels) 11.9 56.7 20.3 8.1 2,9 100.0
Less poor (n=168 parcels) 14.3 69.6 8.3 7.1 0,6 100.0
Poorest (n=53 parcels) 3.8 73.6 13.2 9.4 0,0 100.0All respondents (N=565 parcels) 11.9 62.1 16.1 8.0 1.9 100.0
a The significance of Pearson Chi-Square is 0.056.
Table 2.17. Land acquisition form and its correlation with respondent-related features, Masaka (N=638 parcels)Per cent parcels per respondent-related characteristic according to land acquisition formRespondent-related feature
Land acquisition form All land acquisition
formsInherit-
ancePur-
chaseDonation
from relative
Allocation from clan
Rent-ing
Other
Residence of respondent***
Rural (n=349 parcels) 27.5 56.4 10.3 3.2 0.9 1.7 100.0Peri-urban (n=289 parcels) 22.8 72.3 2.4 0.0 1.7 0.7 100.0
Sex of respondent* Male (n=381 parcels) 23.9 65.9 8.1 0.8 0.8 0.5 100.0Female (n=257 parcels) 27.6 60.3 4.7 3.1 1.9 2.3 100.0
Ethnicity – belongs to predominant ethnic group(s) of the areans
Yes (n=500 parcels) 27.6 62.4 5.8 2.0 1.0 1.2 100.0
No (n=137 parcels) 17.5 68.6 9.5 0.7 2.2 1.5 100.0
Poverty level of household to which respondent belongs**
Non-poor (n=390 parcels) 22.8 69.0 4.9 0.8 1.3 1.3 100.0
Less poor (n=189 parcels) 27.5 57.7 9.0 4.2 1.1 0.5 100.0
Poorest (n=59 parcels) 35.6 47.5 11.9 0.0 1.7 3.4 100.0All respondents (N=638 parcels) 25.4 63.6 6.7 1.7 1.3 1.3 100.0

DIIS WORKING PAPER 2013:03
34
Table 2.18. Tenure documentation level and its correlation with respondent-related features, Masaka (N=629 parcels, information missing for 9 parcel)Per cent parcels per respondent-related characteristic according to level of written tenure documentationRespondent-related feature
Level of written documentation All levels of written
documentationLow
No written documentation
MediumSome or
imprecise doc-umentation
HighMore & more precise regis-tered docu-mentation
Residence of respondent***
Rural (n=345 parcels) 26.7 58.8 14.5 100.0Peri-urban (n=284 parcels) 9.2 71.5 19.4 100.0
Sex of respondentns Male (n=376 parcels) 17.6 63.6 18.9 100.0Female (n=253 parcels) 20.6 66.0 13.4 100.0
Ethnicity – belongs to predominant ethnic group(s) of the areans,a
Yes (n=493 parcels) 19.9 62.1 18.1 100.0
No (n=135 parcels) 14.8 73.3 11.9 100.0
Poverty level of household to which respondent belongs***
Non-poor (n=385 parcels) 11.9 65.7 22.3 100.0
Less poor (n=187 parcels) 27.3 65.2 7.5 100.0
Poorest (n=57 parcels) 36.8 54.4 8.8 100.0All respondents (N=629 parcels) 18.8 64.5 16.7 100.0a The significance of Pearson Chi-Square is 0.051.
As previously alluded to, women in Pallisa face more difficulties in gaining access to land than do women elsewhere. Thus, besides the fact that a lower share of the respondents in our Pallisa sample are women, which in itself is a reflection of this gender-based difficulty, there is a slight tendency that women are less likely than men to access land under customary tenure and that they are more likely than men to acquire land through renting, either as leasehold or other, less formal forms of land rentals (Tables 2.19 and 2.20). 12 per cent of the parcels accessed by female respondents in Pallisa are rented compared to only six per cent of the parcels accessed by male respondents.41 The female respondents in Pallisa are also significantly less likely to hold any written documentation in support of their land tenure compared to the male respondents (Table 2.21).
In Pallisa, respondents belonging to non-poor households and with peri-urban residence are significantly more likely to hold land, acquired through the market, under freehold tenure than particularly respondents belonging to the category of poorest households and households with rural residence (Tables 2.19 and 2.20). Respondents belonging to the poorest households are more likely to hold inherited land under customary tenure and to not hold any written documentation in support of their land tenure (Tables 2.19-2.21).
41 This data is not shown in the tables.

DIIS WORKING PAPER 2013:03
35
Table 2.19. Tenure form and its correlation with respondent-related features, Pallisa (N=665 parcels, information missing for 49 parcels)Per cent parcels per respondent-related characteristic according to tenure formRespondent-related feature
Tenure forms All tenure formsCustom-
aryKibanja tenancy
Free-hold
Mailo Lease-hold
Residence of respondent***
Rural (n=324 parcels) 88.9 – 10.2 – 0.9 100.0Peri-urban (n=341 parcels) 69.8 – 23.8 – 6.5 100.0
Sex of respondent* Male (n=441 parcels) 80.7 – 17.0 – 2.3 100.0Female (n=224 parcels) 75.9 – 17.4 – 6.7 100.0
Ethnicity – belongs to predominant ethnic group(s) of the areans,a
Yes (n=595 parcels) 80.2 – 16.0 – 3.9 100.0
No (n=69 parcels) 69.6 – 27.5 – 2.9 100.0
Poverty level of household to which respondent belongs***
Non-poor (n=212 parcels) 68.9 – 27.4 – 3.8 100.0
Less poor (n=258 parcels) 80.6 – 15.3 – 4.1 100.0
Poorest (n=185 parcels) 88.6 – 8.1 – 3.2 100.0All respondents (N=665 parcels) 79.1 – 17.1 – 3.8 100.0a The significance of Pearson Chi-Square is 0.054.
Table 2.20. Land acquisition form and its correlation with respondent-related features, Pallisa (N=707 parcels, information missing for 7 parcels)Per cent parcels per respondent-related characteristic according to land acquisition formRespondent-related feature
Land acquisition form All land acquisition
formsInherit-
ancePur-
chaseDonation
from relative
Allocat-ion from
clan
Renti-ng
Other
Residence of respondent*
Rural (n=351 parcels) 74.9 12.5 3.1 1.4 7.1 0.9 100.0Peri-urban (n=356 parcels) 64.3 21.6 2.8 0.8 9.0 1.4 100.0
Sex of respondent** Male (n=465 parcels) 72.0 17.4 3.4 0.4 5.8 0.9 100.0Female (n=242 parcels) 64.9 16.5 2.1 2.5 12.4 1.7 100.0
Ethnicity – belongs to predominant ethnic group(s) of the areans
Yes (n=634 parcels) 70.5 16.4 2.8 1.1 8.0 1.1 100.0
No (n=71 parcels) 62.0 23.9 4.2 1.4 8.5 0.0 100.0
Poverty level of household to which respondent belongs*
Non-poor (n=223 parcels) 63.2 25.1 2.7 1.3 7.2 0.4 100.0
Less poor (n=289 parcels) 68.2 15.9 3.1 1.4 9.7 1.7 100.0
Poorest (n=195 parcels) 79.0 9.7 3.1 0.5 6.7 1.0 100.0All respondents (N=707 parcels) 69.6 17.1 3.0 1.1 8.1 1.1 100.0

DIIS WORKING PAPER 2013:03
36
Table 2.21. Tenure documentation level and its correlation with respondent-related features, Pallisa (N=693 parcels, information missing for 21 parcels)Per cent parcels per respondent-related characteristic according to level of written tenure documentationRespondent-related feature
Level of written documentation Level of written
documentationLow
No written documentation
MediumSome or
imprecise doc-umentation
HighMore &
more precise registered
documentationResidence of respondent***
Rural (n=351 parcels) 50.4 13.7 35.9 100.0Peri-urban (n=342 parcels) 29.8 34.2 36.0 100.0
Sex of respondent*** Male (n=453 parcels) 37.5 20.8 41.7 100.0Female (n=240 parcels) 45.4 29.6 25.0 100.0
Ethnicity – belongs to predominant ethnic group(s) of the area*
Yes (n=620 parcels) 38.7 23.9 37.4 100.0
No (n=71 parcels) 52.1 23.9 23.9 100.0
Poverty level of household to which respondent belongs***
Non-poor (n=218 parcels) 28.4 31.7 39.9 100.0
Less poor (n=287 parcels) 38.0 22.0 40.1 100.0
Poorest (n=188 parcels) 57.4 17.6 25.0 100.0
All respondents (N=693 parcels) 40.3 23.8 35.9 100.0

DIIS WORKING PAPER 2013:03
37
3. TENURE SECURITY
3.1 Tenure security in Amuru, Masaka and PallisaRather than any absolute feature of land tenure, such as holding a land title, it is the land right hold-er’s perception of land tenure security – or insecurity – which makes him or her decide e.g. whether to undertake long-term land improvement investments (Migot-Adholla et al., 1991; Broegaard, 2008).
As part of our questionnaire survey, we asked respondents how secure they perceived themselves to be with respect to each of the up to three parcels about which they provided information. The answers to this question are summarised in Table 3.1. The table shows that tenure security is wide-spread. Tenure security is perceived to be ‘secure’ or ‘very secure’ with respect to three quarters of all parcels included in the survey.
Table 3.1. Perceived security of tenure, Amuru, Masaka and Pallisa areas*** (N=2,163 parcels)Per cent parcels per area according to access holders’ overall perceived level of security of tenureArea Tenure security level All security
levelsVery secure Secure Somewhat secure
Not that secure
Insecure
Amuru (n=882 parcels) 39.5 51.8 4.1 4.3 0.3 100.0
Masaka (n=610 parcels) 25.7 46.7 20.2 5.2 2.1 100.0
Pallisa (n=671 parcels) 23.0 39.8 13.9 22.1 1.3 100.0
All areas (N=2,163 parcels) 30.9 45.8 11.4 10.0 1.2 100.0
In order to explore in more detail which aspects of tenure rights are considered in the individual respondents’ assessment of his or her overall perception of tenure security with respect to a specific parcel, we examined, informed by literature (e.g. Bruce and Migot-Adholla, 1994; Deininger and Ali, 2008), the extent to which the following three aspects of rights or abilities with respect to land were considered by respondents when assessing their tenure security:
• the ability to hold rights of continued use;• the ability to reap benefits of invested labour and capital by bequeathing land to children or
close relatives; and• the ability to reap benefits of invested labour and capital by selling the land.
Respondents were asked to assess their level of security with respect to these three aspects for each of the parcels for which information was provided. For each of these three aspects, the responses were grouped into three categories, namely (i) ‘yes’ – unconditional security; (ii) ‘yes, but it depends’ – conditional security, i.e. that the ability is perceived to depend upon the opinion and/or acceptance of e.g. spouse, children or other relatives, the land owner, if applicable; or institutions like the clan leader or the LC1 chair person; and (iii) ‘not sure’ – insecurity. Tables 3.2-3.4 show the distribution

DIIS WORKING PAPER 2013:03
38
of parcels according to the respondent’s level of perceived security with respect to each of the three aspects.
Table 3.2. Perceived security of continued use, Amuru, Masaka and Pallisa areas*** (N=2,229 parcels; information missing for 42 parcels)Per cent parcels per area according to perceived security of continued use (five years from now)Area Respondent expects to be able to use parcel five
years from nowAll levels of
perceived security of continued use“Yes” “Yes, but it
depends”“Not sure”
Amuru (N=902 parcels) 85.3 9.0 5.8 100.0
Masaka (N=634 parcels) 82.3 11.7 6.0 100.0
Pallisa (N=693 parcels) 67.1 24.7 8.2 100.0
All areas (N=2,229 parcels) 78.8 14.6 6.6 100.0
Table 3.3. Perceived security of ability to bequeath land to children or close relatives, Amuru, Masaka and Pallisa areas*** (N=2,211 parcels; information missing for 60 parcels)Per cent parcels per area according to perceived security of ability to pass on parcelArea Respondent expects to be able to bequeath parcel to
children or close relativesAll levels of
perceived security of ability to
bequeath parcel“Yes” “Yes, but it
depends”“Not sure”
Amuru (N=900 parcels) 62.2 11.0 26.8 100.0
Masaka (N=634 parcels) 70.7 14.7 14.7 100.0
Pallisa (N=677 parcels) 55.1 25.1 19.8 100.0
All areas (N=2,211 parcels) 62.5 16.4 21.2 100.0

DIIS WORKING PAPER 2013:03
39
Table 3.4. Perceived security of ability to sell parcel, Amuru, Masaka and Pallisa areas*** (N=2,223 parcels; information missing for 48 parcels)Per cent parcels per area according to perceived security of ability to sell parcelArea Respondent expects to be able to sell parcel All levels of
perceived security of ability
to sell parcel
“Yes” “Yes, but it depends”
“Not sure”
Amuru (N=904 parcels) 0.9 5.1 94.0 100.0
Masaka (N=632 parcels) 6.2 6.5 87.3 100.0
Pallisa (N=687 parcels) 1.5 12.7 85.9 100.0
All areas (N=2,223 parcels) 2.6 7.8 89.6 100.0
Tables 3.2 and 3.3 show that the perceived level of security is generally high with respect to ability of continued use and – although to a lesser degree – the ability to bequeath land to children or close relatives. Similar high levels of perceived security with respect to ability of continued use are reported by Bomuhangi et al. (2011)42 who also find that the perceived level of security is generally lower with respect to ability to bequeath land and with respect to selling land. Furthermore, our results show a close positive correlation with respect to the ability of continued use and the ability to bequeath land, on the one hand, and the perceived level of overall tenure security (shown in Table 3.1 above) on the other hand, indicating that respondents’ overall perception of tenure security is shaped by their expectation, of ability of continued use and ability to bequeath land.43
Particularly in Pallisa, a considerable proportion – more than a third – of those who consider their ability of continued use or to bequeath land to children or close relatives to depend upon the decisions of others or who are uncertain about it, indicate that it depends upon the clan leader or the LC1 chair person. In Amuru and Masaka, these abilities are not considered to depend upon the clan leader or LC1 chair person but rather upon the spouse or other relatives, and, in the case of the ability of continued use, also upon the land owner. However, in this latter case, a considerable proportion of the respondents, particularly in Amuru, are uncertain about upon which institution the ability to bequeath land depends.
The situation is very different with respect to respondents’ expectancy of their ability to sell land (Table 3.4). Very few respondents, irrespective of area and thus tenure form, express the expectancy of ability to sell land currently held. As a man from Pallisa explained: “It’s not easy to sell unless if you are selling to the clan member, once the clan member refuses to approve the sale, you can’t sell.”44 In other places, such as Amuru, even this restricted option of selling to other clan members
42 The findings of Bomuhangi and colleagues are based on interviews with a total of 770 respondents in Kapchorwa, Kibale and Luwero districts.
43 Tables are not shown, but the correlation of the distribution of parcels according to each of these two aspects and the overall perceived tenure security is statistically significant at 0.001 level (Pearson Chi-Square test).
44 Interview with a retired soldier, now earning his living from farming in a village in rural Pallisa, January 25, 2012.

DIIS WORKING PAPER 2013:03
40
may not exist. As an LC1 chairman, also from Pallisa, told us:
“There are some people who have a tendency of just rooming up and down and selling land. Anyhow, yet they have got a lot of children. In such a case, the clan head can refuse you from selling the land even if it’s yours, because the family, your kids need that land to survive, not only now but even in the near future.”45
In group discussions held in Pallisa, three reasons were mentioned as generally accepted to justify the need to sell a piece of land and thus resulting in the endorsement of the sale from clan leaders, namely (i) involvement in a court case requiring more than 10 million UShs, (ii) the need to pay for children’s higher education, however, primarily university level, and (iii) dowry for a wife.46
In an effort to combine these different aspects of perceived tenure security into a single expres-sion, a composite index of perceived tenure security was computed for each parcel based on (i) respondents’ overall assessment of their level of tenure security as reported in Table 3.1, and (ii) a combined expression of the respondents’ assessment of their level of security with respect to the three aspects of tenure security reported in Tables 3.2-3.4.47 These two components were both scaled between ‘1’ (most secure) and ‘5’ (most insecure) and the composite tenure (in)security index was thus computed as the arithmetic mean of these two components.48 On the basis of this land tenure (in)security index, three categories of perceived tenure security were computed to distinguish between parcels with respect to which respondents perceive their tenure to be ‘secure’, ‘somewhat secure’ and ‘not that secure’, respectively. Table 3.5 shows the distribution of parcels according to these three levels of perceived tenure security for each of the three study areas.
Table 3.5. Tenure security, Amuru, Masaka and Pallisa areas*** (N=2,238 parcels, information missing for 33 parcels)Per cent parcels per area according to composite level of perceived tenure securityArea Tenure security level All tenure
security levels Secure Somewhat secure Not that secure
Amuru (N=905 parcels) 59.0 35.6 5.4 100.0
Masaka (N=637 parcels) 50.4 43.2 6.4 100.0
Pallisa (N=696 parcels) 46.3 39.7 14.1 100.0
All areas (N=2,238 parcels) 52.6 39.0 8.4 100.0
45 Interview with LC1 chairman in a village in rural Pallisa, January 26, 2012.
46 Group discussion held with men and an LC1 chairman in rural Pallisa, January 26, 2012.
47 Please see Annex IV for more details on how this theoretically informed tenure security index reflecting the three aspects of continued use, ability to give land in heritage to children and ability to sell is computed.
48 Please see Annex IV for more details on how this composite index of perceived tenure (in)security and the associated tenure security categories were computed.

DIIS WORKING PAPER 2013:03
41
3.2 Tenure security – and its correlation with tenure-related featuresThe results from the questionnaire survey suggest that perceived tenure security is not inherently as-sociated with any particular land tenure form as such and irrespective of the wider context; in other words, context matters. In the Amuru area where customary tenure predominates, the majority (62 per cent) of respondents holding land under customary tenure perceive their land tenure as ‘secure’ and no difference is found between this proportion and the corresponding proportion of the very few respondents who hold land under freehold tenure in Amuru (Table 3.6). By contrast in the Pallisa area, where customary tenure co-exists with other forms of tenure; where customary land claims are increasingly backed by individualised written documentation rather than solely by cus-tomary institutions; and where women generally are less likely to enjoy access to land than women elsewhere, respondents who hold land under customary tenure are less likely to perceive their land tenure as ‘secure.’49 Only 47 per cent of respondents hold access to land under customary tenure, and this is significantly less than the corresponding proportion of respondents in Amuru and their neighbours in Pallisa holding access to land under freehold tenure of whom 66 per cent perceive their land tenure as ‘secure’ (Table 3.6).
Moreover, the results show that in all three areas, renting land is associated with a significantly lower level of perceived tenure security than other forms of acquiring land, and that in Masaka and Pallisa, perceived tenure security is significantly higher with respect to parcels that have been purchased than with respect to parcels acquired in other ways, including inherited (Table 3.7). As explained by a group of men participating in a group discussion in Pallisa, “once you have bought the land, neither the clan nor the LC1 can stop you from selling; only your family may have a say.”50
49 Significant correlation between area and level of tenure security perceived with respect to parcels under customary tenure (N=1,422) at 0.001 level (Pearson Chi-Square test) (Table not shown but relevant proportions appear from Table 3.6).
50 Group discussion held with a group of men in rural Pallisa, January 26, 2012.

DIIS WORKING PAPER 2013:03
42
Table 3.6. Tenure security level by tenure form, Amuru, Masaka and Pallisa areas (N=2,074 parcels, information missing for 197 parcels)Per cent parcels per tenure form according to composite level of perceived tenure security, per areaArea Tenure form Tenure security level All tenure
security levels
Secure Somewhat secure
Not that secure
Amuruns
Customary (n=836 parcels) 61.6 34.7 3.7 100.0
Freehold (n=16 parcels) 62.5 37.5 – 100.0
All tenure forms (N=852 parcels) 61.6 34.7 3.6 100.0
Masaka**
Customary (n=67 parcels) 61.2 28.4 10.4 100.0
Kibanja tenancy (n=351 parcels) 45.6 47.3 7.1 100.0
Freehold (n=90 parcels) 60.0 38.9 1.1 100.0
Mailo (n=45 parcels) 71.1 28.9 – 100.0
Leasehold (n=11 parcels) 45.5 54.5 – 100.0
All tenure forms (N=564 parcels) 51.8 42.4 5.9 100.0
Pallisa***
Customary (n=519 parcels) 47.4 44.3 8.3 100.0
Freehold (n=114 parcels) 65.8 28.1 6.1 100.0
Leasehold (n=25 parcels) – 20.0 80.0 100.0
All tenure forms (N=658 parcels) 48.8 40.6 10.6 100.0
All areas***
Customary (n=1,422 parcels) 56.4 37.9 5.7 100.0
Kibanja tenancy (n=351 parcels) 45.6 47.3 7.1 100.0
Freehold (n=220 parcels) 63.2 33.2 3.6 100.0
Mailo (n=45 parcels) 71.1 28.9 – 100.0
Leasehold (n=36 parcels) 13.9 30.6 55.6 100.0
All tenure forms (N=2,074 parcels) 54.9 38.7 6.4 100.0

DIIS WORKING PAPER 2013:03
43
Table 3.7. Tenure security level by land acquisition mode, Amuru, Masaka and Pallisa areas (N=2,236 parcels, information missing for 35 parcels)Per cent parcels per land acquisition mode according to composite level of perceived tenure security, per areaArea Land acquisition
modeTenure security level All tenure
security levels
Secure Somewhat secure
Not that secure
Amuru***
Inherited (n=798 parcels) 62.3 34.5 3.3 100.0
Purchased (n=16 parcels) 50.0 37.5 12.5 100.0
Donation from relative (n=30 parcels)
36.7 50.0 13.3 100.0
Allocation from clan (n=12 parcels) 83.3 8.3 8.3 100.0
Renting (n=33 parcels) 3.0 54.5 42.4 100.0
Other (n=16 parcels) 43.8 43.8 12.5 100.0
All acquisition modes (N=905 parcels) 59.0 35.6 5.4 100.0
Masaka***
Inherited (n=162 parcels) 45.1 45.1 9.9 100.0
Purchased (n=405 parcels) 55.3 42.0 2.7 100.0
Donation from relative (n=43 parcels)
51.2 41.9 7.0 100.0
Allocation from clan (n=11 parcels) 9.1 81.8 9.1 100.0
Renting (n=8 parcels) 0.0 25.0 75.0 100.0
Other (n=8 parcels) 12.5 37.5 50.0 100.0
All acquisition modes (N=637 parcels) 50.4 43.2 6.4 100.0
continues

DIIS WORKING PAPER 2013:03
44
Area Land acquisition mode
Tenure security level All tenure security levels
Secure Somewhat secure
Not that secure
Pallisa***
Inherited (n=480 parcels) 48.8 44.4 6.9 100.0
Purchased (n=120 parcels) 64.2 31.7 4.2 100.0
Donation from relative (n=21 parcels)
28.6 47.6 23.8 100.0
Allocation from clan (n=8 parcels) 50.0 25.0 25.0 100.0
Renting (n=57 parcels) 0.0 15.8 84.2 100.0
Other (n=8 parcels) 12.5 25.0 62.5 100.0
All acquisition modes (N=694 parcels) 46.4 39.5 14.1 100.0
All areas***
Inherited (n=1,440 parcels) 55.8 39.0 5.2 100.0
Purchased (n=541 parcels) 57.1 39.6 3.3 100.0
Donation from relative (n=94 parcels)
41.5 45.7 12.8 100.0
Allocation from clan (n=31 parcels) 48.4 38.7 12.9 100.0
Renting (n=98 parcels) 1.0 29.6 69.4 100.0
Other (n=32 parcels) 28.1 37.5 34.4 100.0
All acquisition modes (N=2,236 parcels) 52.6 39.0 8.4 100.0
Finally, the results suggest that the absence of titles and other forms of written tenure documen-tation does not prevent land access holders from perceiving their land tenure as ‘secure.’ While written documentation exists in support of only five per cent of the parcels included in the survey from the Amuru area, tenure was perceived to be ‘secure’ with respect to 59 per cent of the parcels in that area. Overall for the three areas combined, respondents assessed their tenure to be ‘secure’ with respect to more than half (55 per cent) of the parcels for which no written documentation exists, whereas this is the case for 50 per cent of the parcels for which some or imprecise documentation

DIIS WORKING PAPER 2013:03
45
exists and with respect to 52 per cent of the parcels for which more and more precise and registered written documentation exists (Table 3.8).
Yet, in Masaka there is a positive and significant correlation between the level of written tenure documentation and the level of tenure security: The higher the level of written documentation (more and more precise and registered documentation), the higher the level of perceived tenure security. In Pallisa, by contrast, the pattern of correlation is less straight-forward, suggesting that the perception of tenure security cannot be ascribed solely to the level of written tenure documentation but also depends on other factors, as will be discussed below. However, the results do suggest that respondents with no or only incomplete written documentation in support of their land tenure51 are significantly more likely to perceive their tenure as ‘not that secure’ than respondents who have more and more precise and registered tenure documentation52 (Table 3.8).
Table 3.8. Tenure security level by tenure documentation level, Amuru, Masaka and Pallisa areas (N=2,211 parcels, information missing for 60 parcels)Per cent parcels per tenure documentation level according to composite level of perceived tenure security, per areaArea Tenure
documentation levelTenure security level All tenure
security levels
Secure Somewhat secure
Not that secure
Amuru*
Low (n=852 parcels) 59.2 35.3 5.5 100.0
Medium (n=26 parcels) 34.6 57.7 7.7 100.0
High (n=22 parcels) 81.8 18.2 - 100.0
All tenure documentation levels (N=900 parcels) 59.0 35.6 5.4 100.0
Masaka***
Low (n=118 parcels) 35.6 44.1 20.3 100.0
Medium (n=406 parcels) 51.7 45.8 2.5 100.0
High (n=104 parcels) 64.4 31.7 3.8 100.0
All tenure documentation levels (N=628 parcels) 50.8 43.2 6.1 100.0
continues
51 ‘Low’ or ‘medium’ tenure documentation level.
52 ‘High’ tenure documentation level.

DIIS WORKING PAPER 2013:03
46
Area Tenure documentation level
Tenure security level All tenure security levels
Secure Somewhat secure
Not that secure
Pallisa***
Low (n=273 parcels) 48.4 33.0 18.7 100.0
Medium (n=164 parcels) 48.2 34.8 17.1 100.0
High (n=246 parcels) 43.5 49.2 7.3 100.0
All tenure documentation levels (N=683 parcels) 46.6 39.2 14.2 100.0
All areas**
Low (n=1,243 parcels) 54.5 35.6 9.8 100.0
Medium (n=280 parcels) 50.0 43.3 6.7 100.0
High (n=688 parcels) 51.6 42.5 5.9 100.0
All tenure documentation levels (N=2,211 parcels) 52.8 38.9 8.3 100.0
3.3 Respondent-related features as sources of variation in level of perceived tenure securityAs already alluded to, the less than straight-forward pattern of correlation between, on the one hand, tenure form, level of written tenure documentation and, to a lesser degree, land acquisition mode and, on the other hand, the level of perceived tenure security (Tables 3.6-3.8), suggests that other factors contribute to shape land holders’ perception of tenure security.
As in section 2.4 above, the possible contribution of respondent-related features is examined (Tables 3.9-3.11). Once again, the patterns of correlation that appear from the three areas with respect to the respondent-related features are far from uniform. In Amuru, Table 3.9 suggests that persons who do not belong to the predominant ethnic group of the area, who live in the peri-urban areas and belong to households characterised as less poor, i.e. people who are likely to be less strong-ly anchored in local cultural and kinship institutions, are less likely to perceive their land tenure as ‘secure’ than others. This in turn, is a reflection of the fact that land in Amuru is almost exclusively held under customary tenure and governed by customary institutions on the basis of kinship and community relations.
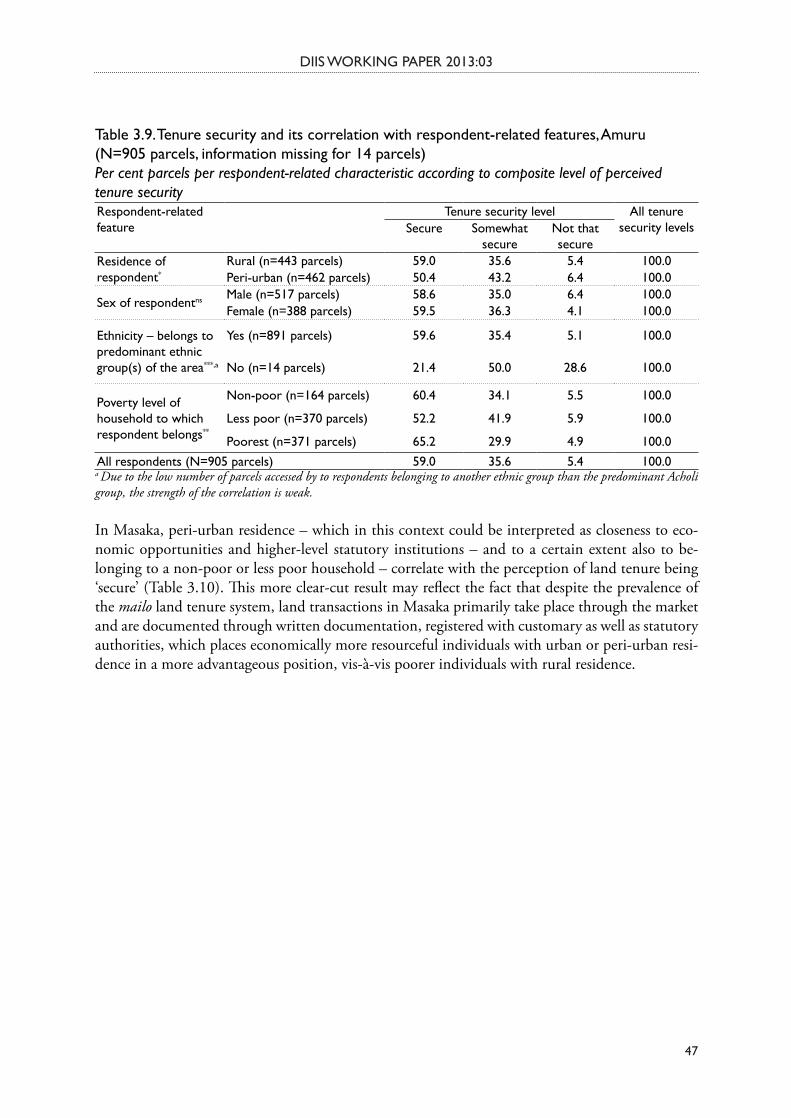
DIIS WORKING PAPER 2013:03
47
Table 3.9. Tenure security and its correlation with respondent-related features, Amuru (N=905 parcels, information missing for 14 parcels)Per cent parcels per respondent-related characteristic according to composite level of perceived tenure securityRespondent-related feature
Tenure security level All tenure security levels Secure Somewhat
secureNot that secure
Residence of respondent*
Rural (n=443 parcels) 59.0 35.6 5.4 100.0Peri-urban (n=462 parcels) 50.4 43.2 6.4 100.0
Sex of respondentns Male (n=517 parcels) 58.6 35.0 6.4 100.0Female (n=388 parcels) 59.5 36.3 4.1 100.0
Ethnicity – belongs to predominant ethnic group(s) of the area***,a
Yes (n=891 parcels) 59.6 35.4 5.1 100.0
No (n=14 parcels) 21.4 50.0 28.6 100.0
Poverty level of household to which respondent belongs**
Non-poor (n=164 parcels) 60.4 34.1 5.5 100.0
Less poor (n=370 parcels) 52.2 41.9 5.9 100.0
Poorest (n=371 parcels) 65.2 29.9 4.9 100.0All respondents (N=905 parcels) 59.0 35.6 5.4 100.0a Due to the low number of parcels accessed by to respondents belonging to another ethnic group than the predominant Acholi group, the strength of the correlation is weak.
In Masaka, peri-urban residence – which in this context could be interpreted as closeness to eco-nomic opportunities and higher-level statutory institutions – and to a certain extent also to be-longing to a non-poor or less poor household – correlate with the perception of land tenure being ‘secure’ (Table 3.10). This more clear-cut result may reflect the fact that despite the prevalence of the mailo land tenure system, land transactions in Masaka primarily take place through the market and are documented through written documentation, registered with customary as well as statutory authorities, which places economically more resourceful individuals with urban or peri-urban resi-dence in a more advantageous position, vis-à-vis poorer individuals with rural residence.

DIIS WORKING PAPER 2013:03
48
Table 3.10. Tenure security and its correlation with respondent-related features, Masaka (N=637 parcels, information missing for 1 parcel)Per cent parcels per respondent-related characteristic according to composite level of perceived tenure securityRespondent-related feature
Tenure security level All tenure security levels Secure Somewhat
secureNot that secure
Residence of respondent***
Rural (n=348 parcels) 42.8 48.3 8.9 100.0Peri-urban (n=289 parcels) 59.5 37.0 3.5 100.0
Sex of respondentns Male (n=380 parcels) 53.2 40.8 6.1 100.0Female (n=257 parcels) 46.3 46.7 7.0 100.0
Ethnicity – belongs to predominant ethnic group(s) of the areans
Yes (n=499 parcels) 51.5 41.5 7.0 100.0
No (n=137 parcels) 46.7 48.9 4.4 100.0
Poverty level of household to which respondent belongsns,a
Non-poor (n=389 parcels) 52.2 42.9 4.9 100.0
Less poor (n=189 parcels) 50.8 41.8 7.4 100.0
Poorest (n=59 parcels) 37.3 49.2 13.6 100.0All respondents (N=637 parcels) 50.4 43.2 6.4 100.0a The significance of Pearson Chi-Square is 0.056.
In Pallisa, the perception of tenure being ‘somewhat’ or ‘not that’ secure is primarily associated with being a woman (Table 3.11) thus bringing further evidence of the disadvantaged position that women experience in Pallisa with respect to accessing land. Moreover, although not statistically significant, Table 3.11 suggests the existence of a category of respondents who are non-poor and do not belong to the predominant ethnic groups of the area – the Ateso and Gwere – who are more likely than others to perceive their land tenure as ‘secure’.
Table 3.11. Tenure security and its correlation with respondent-related features, Pallisa (N=696 parcels, information missing for 18 parcels)Per cent parcels per respondent-related characteristic according to composite level of perceived tenure securityRespondent-related feature
Tenure security level All tenure security levels Secure Somewhat
secureNot that secure
Residence of respondentns
Rural (n=347 parcels) 45.2 38.0 16.7 100.0Peri-urban (n=349 parcels) 47.3 41.3 11.5 100.0
Sex of respondent*** Male (n=456 parcels) 55.0 35.1 9.9 100.0Female (n=240 parcels) 29.6 48.3 22.1 100.0
Ethnicity – belongs to predominant ethnic group(s) of the areans,a
Yes (n=623 parcels) 45.1 40.9 14.0 100.0
No (n=71 parcels) 57.7 28.2 14.1 100.0
Poverty level of household to which respondent belongsns
Non-poor (n=219 parcels) 51.1 38.4 10.5 100.0
Less poor (n=287 parcels) 43.2 41.1 15.7 100.0
Poorest (n=190 parcels) 45.3 38.9 15.8 100.0All respondents (N=696 parcels) 46.3 39.7 14.1 100.0a The significance of Pearson Chi-Square is 0.090.
DIIS WORKING PAPER 2013:03
49
The fact that the level of perceived tenure security differs between the three areas – Amuru being the area where the perception of tenure security is most widespread and Pallisa the area where the perception of tenure security is least widespread (Table 3.5) – and that this difference cannot be attributed solely to either tenure-related features nor to a single set of respondent-related features, implies that characteristics associated with the area – the dynamics taking place, the institutions being present, the level of inequality, etc. – play an independent role in shaping land holders’ per-ception of the level of tenure security. Beyond depending upon the tenure under which a particular parcel of land is held and upon the resources – social, cultural, religious, political and economic as well as mere physical power – that an individual can mobilise to protect his or her land claim, the perception of tenure security depends upon
• the perception of the level of individual tenure security that others in the area enjoy – both those who hold access to land under the same and under different tenure forms from the indi-vidual in question;
• the extent to which tenure rights are seen to be protected or guaranteed by the larger commu-nity to which the individual belongs and the associated set of institutions; and thus
• the perceived strength of the institutions backing the claims to land under the tenure form in question.
Hence, as people in Masaka holding access to land as kibanja tenants are no longer able to maintain their personal relationship with the mailo land lord and are prevented from continuing their rent payment, and as people in Pallisa are experiencing that norms previously upheld and enforced by the customary authorities, such as not allocating land to individuals from other clans, are gradually eroding, this affect their perception of tenure security negatively to land held under the authority of such institutions.

DIIS WORKING PAPER 2013:03
50
4. LAND DISPUTES AND THE ROLE OF INSTITUTIONS
At the same time as being the area where the perception of tenure security is most widespread, Amuru is also the area where land disputes are most prevalent and where the largest proportion of the respondents reports to have lost land during the last 10 years (Table 4.1).
Table 4.1. Land disputes and land loss, Amuru, Masaka and Pallisa areas (N=2,232 parcels, information missing for 39 parcels, and N=1,174 respondents, respectively)Per cent parcels and respondents, respectively per area Area Land disputes*** Land loss***
Per cent parcels for which competing land claims have been made
during past 5 years
Total number of parcels
Per cent respondents having
lost land during past 10 years
Total number of respondents
Amuru 13.8 906 12.0 399Masaka 6.6 624 1.6 384Pallisa 5.6 702 2.0 391All areas 9.2 2,232 5.3 1,174
Given recent events in northern Uganda, these findings hardly come as a surprise and correspond well to reports from the literature (Burke and Egaru, 2011; Rugadya, 2006; Rugadya, 2008). The fact that hundreds of thousands of people left the IDP camps following the cease-fire agreement from 2006 to settle on land which they had left more than a decade earlier and which in the mean-time might have changed in terms of landscape features, such as trees and other vegetation that used to demarcate the boundaries, obviously give rise to doubts about boundaries as well as encourage a certain portion of opportunistic behaviour among some. Moreover, not only the landscape, but also family composition is likely to have changed during the years in the camps and this undoubtedly has added further to the potential sources of land disputes.
However, what may come as a surprise is that this higher frequency of land disputes has not translated itself into a more widespread perception of tenure insecurity than is actually the case (see Table 3.5 above). To a large extent this should be ascribed to the existence and functioning of a fine-meshed set of institutions capable of dealing with these types of local land disputes, occurring primarily between relatives and neighbours.53
Despite complaints that the elders, who used to have a strong say in land issues, nowadays “shy away and fear to tell the truth [in public] due to fear of the youths who are volatile and rough,”54 there is a widespread sense – and trust – in the importance of mediation provided by the customary institutions often in combination with – if not identical to – the statutory institutions, in Amuru starting from the parish level (LC2) in land disputes. Besides the costs involved and the limited
53 In Amuru, competing claims were reported with respect to a total of 125 parcels. Only with respect to nine of these parcels, the persons mentioned to have stated these competing claims were living outside the locality (the community or neighbouring community) or were unknown to the respondent. With respect to 35 parcels, the competing claims were made by relatives, while with respect to the remaining 81 parcels, the competing claims were made by neighbours from the same or from a neighbouring community.
54 Interview with a sub-county chief in the Amuru area, January 18, 2012.

DIIS WORKING PAPER 2013:03
51
capacity of the court system, “the court cannot handle land issues, since you find even relatives conflicting,” a sub-secretary of an Amuru sub-county land committee, who also happens to be the secretary of the sub-county court committee and a sub-county chief, explained. Only cases which cannot be settled through mediation at parish or lower levels, are brought forward to the sub-coun-ty (LC3) level.
This pattern of, in the event of a land dispute, first trying to find a mediated solution by involv-ing institutions such as the clan, the LC1 and the LC2 chairmen which are close, i.e. people who are all close as mediators or third parties, and only calling upon sub-county or higher-level institu-tions in cases where locally mediated solutions cannot be reached, is confirmed by our results (see discussion below).
In order to establish an indication of access to institutions which potentially would serve to defend tenure rights or mediate in situations of land disputes, respondents were asked who they would call upon as witnesses of their tenure rights in case somebody would question or challenge their access to parcels under different forms of tenure, distinguishing between customary, freehold, leasehold, mailo and other forms of tenure. As shown in Figure 4.1, statutory institutions would be equally likely to be called upon as witnesses in case of access being challenged in the three areas, whereas customary institutions would be more likely to be called upon in Amuru and Pallisa than in Masaka. Reflecting the importance of kibanja tenancy as well as the importance of land transfers mediated through the market, private individuals would be called upon by 60 per cent of the re-spondents in Masaka, compared to by a good third of the respondents in Amuru and Pallisa (Figure 4.1). In most cases, however, customary institutions would be called upon in combination with statutory institutions (Table 4.2).
Figure 4.1. Type of third party called upon in case of having tenure rights challenged for parcels held under any tenure form, Amuru, Masaka and Pallisa areas (N=1,174 respondents)Per cent respondents per area by type of third party institution called upona
0102030405060708090
100
Privateindividual***
Privateorganisations*
Statutoryinstitutions
CustomaryInstitutions***
Amuru (n=399) Masaka (n=384) Pallisa (n=391)
a As each respondent may consider to call upon more than one type of institution, the percentages indicated in the figure add up to more than 100.

DIIS WORKING PAPER 2013:03
52
Table 4.2. Type of third party called upon in case of having tenure rights challenged for parcels held under any tenure form, Amuru, Masaka and Pallisa areas*** (N=1,174 respondents)Per cent respondents per area by type of third party called uponArea Type of third party institution All types of
third party institutions
Nobody called upon
Private individuals,
only
Customary institutiona called upon, possibly in addition
to private individuals
Statutory institution
called upon, possibly in addition
to private individuals
Both customary
and statutory
institutions called upon, possibly in addition
to private individuals
Amuru (n=399 respondents) 0.5 1.5 12.8 5.8 79.4 100.0
Masaka (n=384 respondents) 1.6 4.7 6.0 60.4 27.3 100.0
Pallisa (n=391 respondents) 0.5 0.5 12.0 14.3 72.6 100.0
All areas (N=1,174 respondents) 0.9 2.2 10.3 26.5 60.1 100.0a Including private organisations (church, NGO).
For those respondents who indicated the intention to call upon a statutory institution in case of their access rights being challenged, Figure 4.2 (a-b) shows in more detail the type of statutory in-stitution which would be called upon. As already mentioned, the figure confirms the tendency to only call upon higher-level institutions in cases when an agreement could not be reached through the mediation of local-level institutions at village level (LC1) (in Masaka and Pallisa) or at parish level (LC2) in Amuru. Perhaps reflecting the considerable support provided by national and inter-national organisations to northern Uganda to enhance general awareness of land dispute resolution mechanisms and to also strengthen the legal awareness among individuals holding positions within customary and statutory institutions in the wake of the peace agreement, respondents in Amuru appear to be more likely to consider calling upon also the sub-county land committee than re-spondents in the other two areas, particularly in Masaka.

DIIS WORKING PAPER 2013:03
53
Figure 4.2. Type of statutory institution called upon as third party in case of having tenure rights challenged for parcels held under customary and under freehold tenure, Amuru, Masaka and Pallisa areasPer cent respondents per area by type of statutory institution called upona
a. parcels held under customary tenure (N=666 respondents)
b. parcels held under freehold tenure (N=167 respondents)
0
20
40
60
80
100
Amuru (n=332) Masaka (n=47) Pallisa (n=287)
LC1 LC2
LC3 Sub-county land committee
LC5 District land office
Magstrates/chief magistrates court High court
Supreme court
0
20
40
60
80
100
Amuru (n=10) Masaka (n=70) Pallisa (n=87)
LC1 LC2
LC3 Sub-county land committee
LC5 District land office
Magstrates/chief magistrates court High court
Supreme court
a Each respondent may indicate the intention to contact more than one type of statutory institution. Thus for each area, the percentages may add up to more than 100.
As illustrated in Figures 4.3 (a-b), customary institutions are expected to be solicited significantly less in cases where the land for which access rights are being challenged is held under freehold ten-ure, than where land is being held under customary tenure. For land held under freehold tenure, almost all respondents indicated the intention to call upon statutory institutions and also to some extent upon private individuals, e.g. the former owner (Figure 4.3b).
Figure 4.3. Type of third party called upon in case of having tenure rights challenged, Amuru, Masaka and Pallisa areasPer cent respondents per area by type of third party institution called upon
a. parcels held under customary tenure (N=805 respondents)
b. parcels held under freehold tenure (N=177 respondents)
0102030405060708090
100
Privateindividual**
Privateorganisations
Statutoryinstitutions*
CustomaryInstitutions***
Amuru (n=388) Masaka (n=65) Pallisa (n=352)
0102030405060708090
100
Private individual Privateorganisations
Statutoryinstitutions
CustomaryInstitutions
Amuru (n=10) Masaka (n=77) Pallisa (n=90)

DIIS WORKING PAPER 2013:03
54
Thus, a transition from customary towards freehold tenure is likely to be associated with a weaken-ing of customary institutions, for which land issues constitute an important domain, while statuto-ry institutions would be further strengthened. In certain places and points in time, this alteration may not be immediately noticeable due to a large degree of overlap with respect to the individuals acting in representation of the customary and statutory institutions, respectively. The current sit-uation in Amuru may be a case in point. However, over time, this alteration may lead to gradual changes as the norms guiding these different types of institutions and the resources needed to gain access to such institutions are different and over time may change further. Thus, individuals who access land under customary tenure under the authority of customary institutions and who do not command the resources, such as legal literacy and money, to gain access to statutory institutions are likely to perceive their tenure security to be weakening at the pace of the weakening of the cus-tomary institutions. Conversely, individuals who face difficulties in gaining access to land through customary institutions either by being women, as in Pallisa, or by not belonging to a particular clan or ethnic group, may experience a strengthening of their land tenure security, provided that they possess the resources necessary to gain access through statutory institutions.

DIIS WORKING PAPER 2013:03
55
5. ECONOMIC BEHAVIOUR – INVESTMENTS AND ACCESS TO CREDIT
5.1 Types of investments undertaken in Amuru, Masaka and PallisaA large proportion of the respondents in Masaka and Pallisa has undertaken agricultural invest-ments on their land during the past five years (Table 5.1). The majority of these investments are labour intensive,55 whereas investments that are both labour and capital intensive, such as the estab-lishment of irrigation etc.,56 are less common (Table 5.2). In the wake of the cease-fire agreement in 2006, people in Amuru have been in the process of ‘moving back and settling in’, i.e. (re)construct-ing their houses and opening up their land. This probably contributes to explain that during the past five years, agricultural investments (apart from opening up land) have been sparse in Amuru (Table 5.1).
In addition to agricultural investments, some respondents have also undertaken non-agricultur-al productive investments, e.g. in shops, saloons, trade, etc. Such investments are most common among the respondents in Masaka and least common among respondents in Amuru (Table 5.1).
Table 5.1. Productive investments in Amuru, Masaka and Pallisa areas*** (N=1,164 respondents; information missing for 10 respondents)Per cent respondents per area by investment categoryArea Type of productive investment undertaken All types
None Agricultural investments,
only
Non-agricultural productive
investments, only
Both agricultural and non-
agricultural productive investments
Amuru (n=396 respondents) 89.1 5.3 5.1 0.5 100.0
Masaka (n=378 respondents) 25.4 50.0 5.3 19.3 100.0
Pallisa (n=390 respondents) 34.4 57.4 1.8 6.4 100.0
All areas (N=1,164 respondents) 50.1 37.3 4.0 8.6 100.0
55 Agricultural investments such as establishment of perennial crops (coffee, tea, etc.), tree planting, establishment of soil con-servation measures (ridges, contours, etc.), establishment of fences, hedges, irrigation systems or canals (beyond equipment like tubes and pumps), and establishment of drainage systems are all types of agricultural investments which are classified as primarily labour intensive.
56 In addition to the acquisition of irrigation equipment (pumps, tubes, etc.), also the acquisition of (more) land, (more) live-stock, etc. were classified as agricultural investments that are both labour and capital intensive.

DIIS WORKING PAPER 2013:03
56
Table 5.2. Type of agricultural investment, Amuru, Masaka and Pallisa areas*** (N=1,162 respondents; information missing for 12 respondents)Per cent respondents per area by agricultural investment typeArea Type of agricultural investmentsa All agricultural
investment types
None Primarily labour demanding
Labour & capital demanding
Amuru (n=394 respondents) 95.2 3.0 1.8 100.0
Masaka (n=380 respondents)
31.8 49.2 18.9 100.0
Pallisa (n=388 respondents) 36.1 53.6 10.3 100.0
All areas (N=1,162 respondents) 54.7 35.0 10.2 100.0
5.2 Investments and correlations with tenure security and tenure formLand investments are equally likely or, in Amuru, unlikely, at parcels for which tenure is perceived as ‘secure’ as at parcels for which tenure is perceived as ‘somewhat secure’ or ‘not that secure’ (Table 5.3) as well as at parcels held under different tenure forms. The exception from this is parcels held under leasehold in Pallisa, where the likelihood of agricultural investments is significantly lower than for parcels held under other tenure forms in that area (Table 5.4). Thus, the results do not support the assumption of a universal and one-directional relationship between the propensity to undertake agricultural investments and tenure security (see Figure 1.1). While in some cases, a perceived low level of tenure security may discourage agricultural investments, as weakly suggested to be the case in Pallisa (Table 5.3), conversely, agricultural investments may by some land tenure holders be considered as a strategy to strengthen land claims and thus boost their level of perceived tenure security. This may contribute to explain that agricultural investments are undertaken on more than half of the parcels held under kibanja tenancy in Masaka (Table 5.4).
Table 5.3. Agricultural investment by level of perceived tenure security, Amuru, Masaka and Pallisa areas (N=2,123 parcels; information missing for 148 respondents)a
Per cent parcels where agricultural investments have been undertaken per tenure security level, by area
Area Level of perceived tenure security All tenure security levels
Secure Somewhat secure Not that secure
Amuru (n=869 parcels)ns 1.7 0.3 0.0 1.2
Masaka (n=622 parcels)ns 50.6 55.0 48.6 52.4
Pallisa (n=632 parcels)ns,b 57.9 60.6 44.0 57.9
All areas (N=2,123 parcels) 30.3 37.0 32.5 33.1a Parcels that are rented and thus from the outset associated with restrictions on investments are omitted from this cross-tabulation. bp=0.093; Pearson Chi-Square test.

DIIS WORKING PAPER 2013:03
57
Table 5.4. Agricultural investment by tenure form, Amuru, Masaka and Pallisa areas (N=2,032 parcels; information missing for 239 respondents)Per cent parcels where agricultural investments have been undertaken per tenure form, by areaArea Tenure form All tenure
formsCustomary Kibanja tenancy
Freehold Mailo Leasehold
Amuru (n=849 parcels)ns 1.2 – – – – 1.2
Masaka (n=557 parcels)ns 42.4 54.4 53.8 57.8 36.4 52.8
Pallisa (n=651 parcels)*** 59.7 – 51.4 – 12.0 56.5
All areas (N=2,057 parcels) 24.5 54.4 48.6 57.8 19.4 32.7a Parcels that are rented through private land rental agreements are omitted from this cross-tabulation.
5.3 Sources of finance for productive and non-productive investmentsDespite concerted efforts during the past decades of increasing the supply of agricultural credit, e.g. by providing subsidised capital funds to credit institutions, the effective demand has not responded as anticipated, at least when judged upon the results from Amuru, Masaka and Pallisa. Overall, only around a quarter of the respondents had taken any loans, including loans from relatives, saving groups, etc., and the vast majority of those who had taken loans during the past five years had done so to finance non-productive investments, such as education for children, meeting health expendi-tures, repairing their houses, etc., rather than productive investments (Table 5.5).
Table 5.5. Taking loans to finance productive and non-productive investments, Amuru, Masaka and Pallisa areas*** (N=1,174 respondents)Per cent respondents taking loans by type of investment financed, by areaArea No loan
takenType of investment financed through loana All types of
investments financed
through loan
Agricultural investments,
only
Non-agricultural productive
investments, only
Non-productive
investments, only
Productive & non-
productive investments
Amuru (n=399 respondents) 94.5 0.3 0.3 4.5 0.5 5.5
Masaka (n=384 respondents) 72.1 1.3 0.3 20.8 5.5 27.9
Pallisa (n=391 respondents) 68.0 0.8 0.0 29.4 1.8 32.0
All areas (N=1,174 respondents) 78.4 0.8 0.2 18.1 2.6 21.6

DIIS WORKING PAPER 2013:03
58
Of the respondents who do take loans, a bit less than half take formal credit, sometimes in com-bination with taking informal loans, whereas the remaining part only takes informal credit (Table 5.6).
Table 5.6. Loan taking, Amuru, Masaka and Pallisa area*** (N=1,174 respondents)Per cent respondents by loan taking, by area
No loans taken Loan taken through formala
credit
Loan taken through informalb
credit
All respondents
Amuru (n=399 respondents) 94.2 2.5 3.3 100.0
Masaka (n=384 respondents) 71.9 15.4 12.8 100.0
Pallisa (n=391 respondents) 67.8 10.0 22.3 100.0
All areas (N=1,174 respondents) 78.1 9.2 12.7 100.0a SACCOs (Savings and Credit Cooperative Societies) and banks.b Saving groups, private individuals, etc.
In part, this low-effective demand for credit owes to the general apprehension with respect to using land as collateral for loans. Many people fear losing their land either in case of loan default or due to a generalised distrust in credit institutions, as expressed by this woman from Masaka:57
Q: Would you see it feasible to ask for credit or not? A: No, the way they want you pay back, and they can take your land!
Thus, in addition to land, also other assets like salaries, i.e. salary accounts, are used as collateral for formal credit. As shown in Table 5.7, only around one-third of the respondents who take formal credit had used land as collateral. While the majority of those who had taken informal credit had done so without presenting collateral, one-fifth of the respondents who had taken informal credit had presented collateral, in Masaka, primarily in the form of land, while in Pallisa only other types of collateral were used.58
57 Interview with woman in Masaka, undated.
58 Data on collateral for informal loans is not presented in a table.

DIIS WORKING PAPER 2013:03
59
Table 5.7. Collateral used for formal loan taking, Amuru, Masaka and Pallisa areas* (N=107 respondents)Per cent respondents by loan taking, by area
No collateral used Land used as collateral
Other type of collateral used
All respondents taking formal
credit
Amuru (n=10 respondents) 20.0 40.0 40.0 100.0
Masaka (n=58 respondents) 22.4 44.8 32.8 100.0
Pallisa (n=39 respondents) 17.9 17.9 64.1 100.0
All areas (N=107 respondents) 20.6 34.6 44.9 100.0a SACCOs and banks.b Saving groups, private individuals, etc.
Based on the assumed importance of formally registered land titles as a precondition for obtaining formal credit (see Figure 1.1), it would be natural to assume that the low level of effective demand for formal credit encountered in the three study areas, and particularly in Amuru, is caused by the high proportion of land not being formally titled and registered. However, overall, three quarters of the respondents who used collateral for their loans59 do not hold a formal land title,60 and in none of the three areas are respondents who hold formal titles found to be more likely to take formal credit than those who do not hold land titles. Thus, while the absence of formal titles by no means excludes respondents from taking loans, respondents who hold land titles are more likely to present collateral – both land and other assets – when taking loans than respondents who do not hold land titles.61 The fact that respondents holding land titles are more likely to use both land and other assets as collateral, indicates that beyond the land titles in themselves, holding land titles may cor-relate also with other factors, such as e.g. having non-agricultural sources of income which facilitate access to credit requiring the use of collateral.
Interviews with staff in a number of financial institutions62 confirm that holding a formally registered land title is not an unflinching condition for obtaining a loan. First of all, other types of assets may be accepted as collateral and secondly, in addition or at times in place of formal titles,
59 A total of 117 respondents from Amuru, Masaka and Pallisa combined, used collateral for their loan, including loans taken from both formal and informal credit institutions.
60 Certificates of customary tenure, freehold titles, leasehold titles or mailo titles.
61 Combining the samples from the three study areas, 64 per cent of the respondents holding land titles presented collateral for their loan, compared with 42 per cent of the respondents not holding land titles. Of the respondents holding land titles, 34 per cent used land as collateral while 30 per cent used other forms of collateral. For respondents not holding land titles, the corresponding proportions are 18 and 24 per cent.
62 See Annex I for list of interviews. Interviewees were promised anonymity.

DIIS WORKING PAPER 2013:03
60
also consent and sometimes the guarantee from local institutions, whether the clan, the LC1 or the LC2, is often required by formal financial institutions in order to provide the loan.
5.4 Respondent-related features as sources of variation for economic behaviourAcross the three study areas, respondents who belong to a non-poor household are significant-ly more likely to have undertaken productive investments within the past five years, particularly non-agricultural productive investments, than respondents belonging to a household characterised as less poor or poorest (Tables 5.8-5.10).63 Moreover, respondents with peri-urban residence are sig-nificantly more likely to undertake non-agricultural productive investments than respondents with rural residence in all three study areas. While female respondents are less likely to have undertaken productive investments than male respondents in Amuru and Masaka, the female respondents in Pallisa are more likely than male respondents to have undertaken particularly non-agricultural pro-ductive investments.
Table 5.8. Productive investments undertaken and their correlation with respondent-related features, Amuru area (N=396 respondents, information missing for 3 respondents)Per cent respondents per respondent-related characteristic according to type of productive investment undertaken Respondent-related feature
Type of productive investments All respond-
entsNo
productive investments
Agricultural investments,
only
Non-agricultural productive
investments, only
Both agricultural and non-
agricultural productive investments
Residence of respondent*
Rural (n=200 respondents) 90.0 2.5 7.0 0.5 100.0Peri-urban (n=196 respondents) 88.3 8.2 3.1 0.5 100.0
Sex of respondent* Male (n=220 respondents) 84.1 7.3 8.2 0.5 100.0Female (n=176 respondents) 95.5 2.8 1.1 0.6 100.0
Ethnicity – belongs to predominant ethnic group(s) of the areans
Yes (n=388 respondents) 88.9 5.4 5.2 0.5 100.0
No (n=8 respondents) 100.0 0.0 0.0 0.0 100.0
Poverty level of household to which respondent belongs***
Non-poor (n=65 respondents) 69.2 15.4 13.8 1.5 100.0Less poor (n=163 respondents) 92.0 2.5 5.5 0.0 100.0
Poorest (n=168 respondents) 94.0 4.2 1.2 0.6 100.0All respondents (N=396 respondents) 89.1 5.3 5.1 0.5 100.0
63 The results presented in this section are corroborated by the results from logistic regression analysis presented in Annex V.
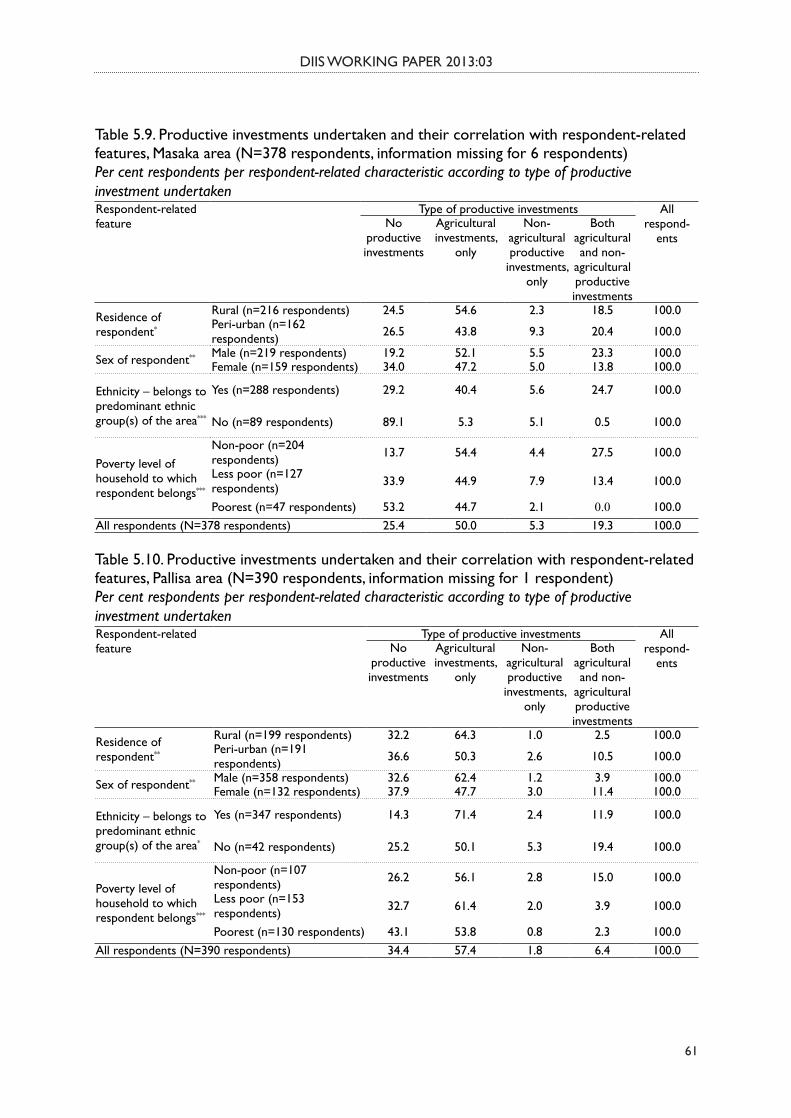
DIIS WORKING PAPER 2013:03
61
Table 5.9. Productive investments undertaken and their correlation with respondent-related features, Masaka area (N=378 respondents, information missing for 6 respondents)Per cent respondents per respondent-related characteristic according to type of productive investment undertaken Respondent-related feature
Type of productive investments All respond-
entsNo
productive investments
Agricultural investments,
only
Non-agricultural productive
investments, only
Both agricultural and non-
agricultural productive investments
Residence of respondent*
Rural (n=216 respondents) 24.5 54.6 2.3 18.5 100.0Peri-urban (n=162 respondents) 26.5 43.8 9.3 20.4 100.0
Sex of respondent** Male (n=219 respondents) 19.2 52.1 5.5 23.3 100.0Female (n=159 respondents) 34.0 47.2 5.0 13.8 100.0
Ethnicity – belongs to predominant ethnic group(s) of the area***
Yes (n=288 respondents) 29.2 40.4 5.6 24.7 100.0
No (n=89 respondents) 89.1 5.3 5.1 0.5 100.0
Poverty level of household to which respondent belongs***
Non-poor (n=204 respondents) 13.7 54.4 4.4 27.5 100.0
Less poor (n=127 respondents) 33.9 44.9 7.9 13.4 100.0
Poorest (n=47 respondents) 53.2 44.7 2.1 0.0 100.0All respondents (N=378 respondents) 25.4 50.0 5.3 19.3 100.0
Table 5.10. Productive investments undertaken and their correlation with respondent-related features, Pallisa area (N=390 respondents, information missing for 1 respondent)Per cent respondents per respondent-related characteristic according to type of productive investment undertaken Respondent-related feature
Type of productive investments All respond-
entsNo
productive investments
Agricultural investments,
only
Non-agricultural productive
investments, only
Both agricultural and non-
agricultural productive investments
Residence of respondent**
Rural (n=199 respondents) 32.2 64.3 1.0 2.5 100.0Peri-urban (n=191 respondents) 36.6 50.3 2.6 10.5 100.0
Sex of respondent** Male (n=358 respondents) 32.6 62.4 1.2 3.9 100.0Female (n=132 respondents) 37.9 47.7 3.0 11.4 100.0
Ethnicity – belongs to predominant ethnic group(s) of the area*
Yes (n=347 respondents) 14.3 71.4 2.4 11.9 100.0
No (n=42 respondents) 25.2 50.1 5.3 19.4 100.0
Poverty level of household to which respondent belongs***
Non-poor (n=107 respondents) 26.2 56.1 2.8 15.0 100.0
Less poor (n=153 respondents) 32.7 61.4 2.0 3.9 100.0
Poorest (n=130 respondents) 43.1 53.8 0.8 2.3 100.0All respondents (N=390 respondents) 34.4 57.4 1.8 6.4 100.0

DIIS WORKING PAPER 2013:03
62
Similar clear patterns of correlation appear with respect to taking loans as such and with respect to whether loans are taken from formal or informal credit institutions. Across the three areas, re-spondents belonging to non-poor households are significantly more likely to take loans both from formal and informal credit institutions than respondents from poorer households (Tables 5.11-5.13). Moreover, in Masaka and Pallisa, respondents with peri-urban residence are more likely to take loans than respondents with rural residence.
Table 5.11. Type of loan taken and its correlation with respondent-related features, Amuru area (N=399 respondents)Per cent respondents per respondent-related characteristic according to type of loan taken Respondent-related feature
Type of loan taken All respondentsNo loan taken Loan taken
from formal credit
institution
Loan taken from informal
credit institution
Residence of respondentns
Rural (n=200 respondents) 94.0 4.0 2,0 100.0Peri-urban (n=199 respondents) 94.5 1.0 4,5 100.0
Sex of respondentns Male (n=221 respondents) 94.6 2.7 2,7 100.0Female (n=178 respondents) 93.8 2.2 3,9 100.0
Ethnicity – belongs to predominant ethnic group(s) of the areans
Yes (n=391 respondents) 94.1 2.6 3,3 100.0
No (n=8 respondents) 100.0 0.0 0,0 100.0
Poverty level of household to which respondent belongs**
Non-poor (n=65 respondents) 83.1 7.7 9,2 100.0
Less poor (n=164 respondents) 95.1 1.8 3,0 100.0
Poorest (n=170 respondents) 97.6 1.2 1,2 100.0All respondents (N=399 respondents) 94.2 2.5 3.3 100.0

DIIS WORKING PAPER 2013:03
63
Table 5.12. Type of loan taken and its correlation with respondent-related features, Masaka area (N=384 respondents, information missing for 6 respondents)Per cent respondents per respondent-related characteristic according to type of loan takenRespondent-related feature
Type of loan taken All respondentsNo loan taken Loan taken
from formal credit
institution
Loan taken from informal
credit institution
Residence of respondent***
Rural (n=216 respondents) 79.2 9.3 11.6 100.0Peri-urban (n=168 respondents) 62.5 23.2 14.3 100.0
Sex of respondentns Male (n=220 respondents) 72.3 15.0 12.7 100.0Female (n=164 respondents) 71.3 15.9 12.8 100.0
Ethnicity – belongs to predominant ethnic group(s) of the areans
Yes (n=293 respondents) 71.0 15.0 14.0 100.0
No (n=90 respondents) 74.4 16.7 8.9 100.0
Poverty level of household to which respondent belongsns,a
Non-poor (n=210 respondents) 65.7 18.1 16.2 100.0
Less poor (n=127 respondents)
78.0 12.6 9.4 100.0
Poorest (n=47 respondents) 83.0 10.6 6.4 100.0
All respondents (N=384 respondents) 71.9 15.4 12.8 100.0a p=0.051
Table 5.13. Type of loan taken and its correlation with respondent-related features, Pallisa area (N=391 respondents)Per cent respondents per respondent-related characteristic according to type of loan taken Respondent-related feature
Type of loan taken All respondentsNo loan taken Loan taken
from formal credit
institution
Loan taken from informal
credit institution
Residence of respondent***
Rural (n=199 respondents) 83.4 1.5 15.1 100.0Peri-urban (n=192 respondents) 51.6 18.8 29.7 100.0
Sex of respondentns Male (n=359 respondents) 69.9 8.9 21.2 100.0Female (n=132 respondents) 63.6 12.1 24.2 100.0
Ethnicity – belongs to predominant ethnic group(s) of the area**
Yes (n=348 respondents) 69.8 10.3 19.8 100.0
No (n=42 respondents) 50.0 7.1 42.9 100.0
Poverty level of household to which respondent belongs**
Non-poor (n=107 respondents) 53.3 16.8 29.9 100.0
Less poor (n=153 respondents) 72.5 7.8 19.6 100.0
Poorest (n=131 respondents) 74.0 6.9 19.1 100.0
All respondents (N=391 respondents) 67.8 10.0 22.3 100.0

DIIS WORKING PAPER 2013:03
64
Hence, rather than narrowly depending upon tenure-related features, respondent-related features appear to be equally, if not more, important in shaping economic behaviour in terms of undertak-ing productive investments and in terms of taking loans to finance productive as well as non-pro-ductive investments.

DIIS WORKING PAPER 2013:03
65
6. MAINTAINING, DEEPENING AND WIDENING THE CURRENTLY WIDESPREAD PERCEPTION OF TENURE SECURITY – CONCLUSIONS AND RECOMMENDATIONS
6.1 Conclusions
The perception of tenure security is currently widespreadTenure security is widespread in the three study areas. Overall, tenure is perceived to be ‘secure’ with respect to half of the parcels included in the survey while being perceived as ‘not that secure’ with respect to less than 10 per cent, leaving the tenure of the remaining close to 40 per cent of the parcels to be perceived as ‘somewhat secure’. However, the fact that tenure is currently perceived to be secure does not preclude that land tenure may be lost, e.g. to outside investors. The numerous press reports of land grabbing and land conflicts, not least in the Northern part of Uganda, indicate that such risks may be real.
Tenure insecurity is associated with the co-existence of different tenure forms rather than with any tenure form in particularNo particular tenure form has the monopoly of providing tenure security. In Amuru, almost all land is held under customary tenure and at the same time, compared to both Masaka and Pallisa, it is the area where tenure is perceived as ‘secure’ with respect to the highest proportion of parcels. By contrast, in Pallisa where freehold tenure has become more widespread during past decades, holding land under customary tenure is associated with a lower likelihood of perceiving tenure as ‘secure’ as compared to holding land under freehold tenure. Rather than an absolute feature derived from any particular tenure form, the level of perceived tenure security is relative in the sense that it depends upon the extent to which tenure rights of others holding access to land under the same as well as under different tenure forms are protected. As soon as new tenure forms and new forms of written tenure documentation emerge, this affects the perception of tenure security of land tenure holders at large, particularly if preferential treatment is given to specific forms of tenure and tenure documentation.
Written tenure documentation is appreciated, but tenure may be perceived as secure without itAs in most other places, it is hard to come across a person who, if given the choice, would opt for not having a title deed endorsing his or her tenure rights to a particular piece of land. Yet, the pattern of correlation is far from straight-forward and uniform between, on the one hand, holding a title or any other form of written tenure documentation and having it registered with relevant authorities (customary as well as statutory) and, on the other hand, the perception of tenure secu-rity,. While holding no or only incomplete tenure documentation at least in Masaka and Pallisa is associated with tenure insecurity, it is only in Masaka that holding more complete written tenure documentation convincingly translates into an increased likelihood of perceived tenure being per-ceived as ‘secure’.

DIIS WORKING PAPER 2013:03
66
Context and resource endowments of the individual are important constituents of tenure securityRather than suggesting that written tenure documentation is extraneous as a source of bolstering the perception of tenure security, these findings indicate that titles and other written tenure doc-umentation is only one among other elements which in combination compose the perception of tenure security. Among these additional elements are both context- or area-specific and respond-ent-specific features. The area-specific features include the rules and norms guiding the institutions backing different forms of land tenure and the relative strength of these institutions, while the re-spondent-specific features include the location of residence, household poverty level, ethnicity and sex of respondent, as these characteristics contribute to determine the ease of access to hold land under different tenure forms and the ease of access to mobilise the institutions backing a particular land claim.
Socio-economic inequality translates into inequality in perceived tenure securityIn Amuru where people still find themselves in the early years after resettlement and where the norm that ‘you can only claim as much land as you can dig’ may still be encountered, land dis-tribution is still relatively equal, compared to the other two study areas. The distinction between customary and statutory institutions is blurred and often, in Amuru as elsewhere, those who are recognised as clan leaders are also likely to hold offices with statutory institutions such as the parish and sub-county level institutions. As virtually all land in Amuru is held under customary tenure without the support of written documentation, community and clan membership and relations are important to support land claims. Thus, in contrast to Masaka and Pallisa, respondents in Amuru who belong to the poorest households and reside in rural areas are equally – if not more – likely to perceive their land tenure to be ‘secure’ as their less poor or peri-urban neighbours, while the few non-Acholi respondents holding land in the area seem less likely than the Acholi respondents to perceive their tenure as ‘secure’. Although access to land under customary tenure as practiced in Amuru is far from equal for men and women, female and male respondents are equally likely to perceive their tenure to be ‘secure’.
The fact that hardly anybody holds written documentation in support of their tenure in Amuru, renders this element insignificant to most people in the area when assessing their tenure security. However, those who do hold rather complete written tenure documentation are more likely to perceive their tenure as ‘secure.’ This, however, may change. As more people apply for and obtain e.g. certificates of customary tenure and as new tenure forms emerge, the role of written tenure documentation in shaping tenure security perceptions will change, even among those who do not hold such documentation.
Land disputes will always be there and broad-based access to institutions is important to prevent land disputes from translating into generalised tenure insecurityIn addition to illustrating the relative – rather than the absolute – importance of tenure form and written tenure documentation, the results from Amuru also serve to illustrate the importance of access to institutions which can mediate directly in cases of land disputes and, in cases where dis-putes and other tenure-related issues cannot be resolved locally, can facilitate access to higher-level institutions. Due to the massive resettlement which has taken place since 2006, Amuru is the area with the highest incidence of land disputes among the respondents, while at the same time being the area where the perception of tenure security is most widespread. The strong engagement from
DIIS WORKING PAPER 2013:03
67
non-governmental organisations in informing people about land laws and land rights and facilitat-ing the establishment and training of local-level dispute settlement mechanisms may have contrib-uted to this. Combined with testimonies from interviewees, this points towards the importance of institutions that are accessible to the broad majority rather than only to a smaller segment of the population.
All other predicaments untold, this situation which at least seen from the perspective of tenure security appears rather ideal and inclusive, may, however, only be temporal as the silence both be-fore and after the storm. Hence, it calls for action, just as action is called for in other parts of Ugan-da. If the aim is to maintain and deepen current high levels of tenure security, perceived by current land tenure holders, while at the same time unlocking the land market, important lessons for policy and administrative interventions may be drawn from observing the situation in Masaka and Pallisa.
Land markets as a double-edged sword reducing land access for some while facilitating land access for othersMasaka, where the majority of land transactions, irrespective of tenure form, is mediated through the market and where customary tenure, whether labelled as such or as kibanja tenancy, is undergo-ing profound transformation, is also the area where belonging to a non-poor household and resid-ing in an urban or peri-urban area most clearly translate into increased tenure security. Moreover, compared to both Amuru and Pallisa, Masaka is also the area where customary institutions are least solicited and where respondents holding land under customary tenure appear to have the most lim-ited choice of institutions from where to seek support in case of having their land rights challenged, whereas respondents holding their land under freehold tenure in such cases appear to have a much more diverse set of institutions to call upon in their defence.
In Pallisa, the correlation between, on the one hand, household poverty level and residence and, on the other hand, tenure security, is, although present, strongly confounded by the correlation be-tween sex of the respondent and tenure security. The norms embedded in customary institutions in Pallisa with respect to women’s access to land first of all limit women’s access to land, and secondly imply that women who do succeed in gaining access to land are much more likely to perceive their tenure as less secure than men in Pallisa. Such differences between male and female respondents were not found in Amuru and Masaka. Although the majority of the female respondents who access land in Pallisa do so under customary tenure, a significantly higher proportion of the female than of the male respondents take recourse to land rentals, which under current conditions are perceived as insecure and associated with significant limitations in terms of investment. A similar tendency is observed for non-Acholi respondents in Amuru who presumably due to not being able to obtain access to land through customary institutions are also more likely to take recourse to land rentals than their Acholi neighbours. Thus, land markets, including rental markets, have the potential to provide access to land for those who due to non-economic factors, such as gender or ethnicity, are otherwise excluded from gaining access, while at the same time tending to favour the economically resourceful.

DIIS WORKING PAPER 2013:03
68
Credit in its present forms does not limit productive investmentsThere is only limited evidence that agricultural and non-agricultural productive investments are hampered due to low levels of tenure security, absence of formally registered tenure documentation and lack of access to credit in its present forms. The absence of the often assumed relationship be-tween perceived tenure security and investments suggests that also the reverse relationship exists, namely that investments are undertaken as part of a strategy towards strengthening land claims and thus tenure security, adopted e.g. by kibanja tenants in Masaka.
Despite the fact that almost all of the respondents interviewed in Amuru since 2006 have re-turned to their place of origin and have spent the past five to six years (re)building their homes and opening up their land, very few respondents indicated to have undertaken investments during the last five years. In Pallisa and Masaka, the majority of the respondents (two-thirds and three-quar-ters, respectively) have undertaken some form of productive investment during the past five years. However, the vast majority of these investments have been financed through own labour and sav-ings, rather than through credit.
Credit is used to finance non-productive rather than productive investmentsYet, credit is solicited – in Masaka by around a quarter of the respondents and in Pallisa by a bit less than a third of the respondents. Rather than being used to finance productive investments, credit is used to finance non-productive investments like education for children, health expenditures, etc. While by no means being exclusively taken by non-poor respondents, respondents belonging to non-poor households are more likely to take loans than respondents belonging to poorer house-holds.
Land is neither the preferred collateral nor is it required as collateral Land was only used as collateral for around one-third of the loans taken with formal credit insti-tutions such as SACCOs and banks and only in one-fifth of these cases (n=7), land tenure was supported by a formal land title. Credit institutions appear to accommodate a certain degree of flexibility with respect to land tenure documentation to the extent that local institutions – statuto-ry as well as customary – are approached to provide their endorsement of the tenure rights of the loan applicant and their consent to the loan agreement. Rather than restrictions imposed by credit institutions, the limited use of land as a collateral appears to reflect a widespread hesitation in the population in this regard. Beyond the low level of trust in credit institutions and the legal system as such, this may owe to the widespread notion of not wanting to put at risk something which is regarded as not only belonging to the individual but to the family, the clan or the community (cf. the perception of not having the right to sell land – Table 3.4). Instead of land, other and more individual assets are used as collateral, such as salary accounts, and this tends to favour the access to credit of non-poor individuals.

DIIS WORKING PAPER 2013:03
69
6.2 Recommendations for maintaining, deepening and widening the current widespread perception of tenure security
1. Focus upon area-based interventions and abstain from engaging in tenure-related interventions in a piecemeal fashion serving only a portion of the population and thus inducing tenure insecurity rather than deepening tenure security The first recommendation for policy and administrative interventions aimed to maintain, deepen and widen the perception of tenure security among current land access holders in Uganda and, where possible, expand this perception to groups who today in some areas experience tenure insecurity, is to focus upon area-based interventions. Although national land policy, legislative and administrative frameworks are far from static – nor should they be – their very revision may nurture a growing perception of tenure insecurity. Moreover, our results have shown that despite a common national framework, land tenure, the way that it is administered, and who are privileged and unprivileged vary considerably across Uganda. Moreover, in areas characterised by the co-existence of tenure forms, these tenure forms and the perceived level of tenure security they contribute to induce, are best con-ceived as series of mutually communicating vessels: If only institutions backing e.g. individual land claims are supported or if the institutions supported are being accessible only to a small segment of the population, such support will contribute to generate insecurity among those who wish to main-tain their collective land rights or those who are unable to access the institutions receiving support. Thereby, such partial efforts may contribute to generate rather than reduce tenure insecurity.
Thus in an area-based approach to maintain, deepen and widen tenure security, care should be undertaken not to intervene in a partial or piecemeal manner by only providing sufficient capacity to respond to the demands from a minor part of the land holders while leaving the remaining part unattended, as this may contribute to increase the overall level of tenure insecurity prevailing among the population of an area, nor to initiate processes of economic differentiation, leading to increasing levels of inequality. Examples of such partial interventions could be the provision of support for updating cadastral maps only for individuals already holding registered land titles, while leaving individuals not already holding registered land titles unattended.
Moreover, who is privileged and who is unprivileged or disadvantaged with respect to specific tenure forms vary from place to place. Adopting an area-based approach thus facilitates addressing such area-specific discriminatory practices, whether based on gender, ethnicity or socio-economic status, more carefully. Thus as part of the area-based approach to maintain, deepen and also widen the perception of tenure security, efforts should be made to strengthen the institutions backing all tenure forms, while at the same time aiming to eliminate discriminatory practices that may be asso-ciated with such institutions.
2. Support locally accessible land administration and dispute resolution institutions and facilitate the vertical interaction among land administration institutions at multiple levelsThe second recommendation is to support land administration and dispute resolution institutions that are accessible locally and at the same time can serve as interlocutors or gatekeepers, facilitating access to higher-level institutions. In line with the national efforts to strengthen land administra-tion in Uganda and in recognition of infrastructural conditions and associated traveling times, the sub-county level (LC3) appears to be a useful entry point for interventions that aim to support land administration and dispute resolution. With population sizes – at least in the three study areas –

DIIS WORKING PAPER 2013:03
70
rarely reaching above 10,000 inhabitants, and with the key role assigned to the sub-county land committees, and by already possessing at least some administrative and legal capacity, the sub-county level holds promise of being reachable from ‘below’ as well as being able to reach out to higher-level institutions such as district and national level institutions. The obstacles to be overcome are many, but insights may be gained from the considerable – and at least to some extent successful – support for land administration and dispute resolution provided by national and international organisations in northern Uganda.
While serving as entry points, the sub-county level institutions should not be the only target of such efforts. Rather, efforts should be directed at strengthening the vertical integration of sub-county level institutions with, on the one hand, more local institutions such as customary institutions and the LC1 and LC2 level institutions which de facto play an important role in land administration and dispute settlement, and on the other hand, more remote institutions such as district and national level institutions. Also the ability to interact with credit institutions and mediate between credit in-stitutions and e.g. clan or community-level institutions in exploring new ways of facilitating access to credit should be emphasized.
3. Facilitate access to land tenure documentation for all – as groups or as individuals – through support for making land surveys more accessible – physically as well as economically – at the local levelOne of the obstacles preventing individuals as well as groups from initiating the process of docu-menting their land tenure is the costs of having land surveyed and the suspicions and disputes – and thus eventually the tenure insecurity – it raises among neighbours. Yet, irrespective of tenure form, cadastral maps are increasingly becoming a powerful instrument in effectively stating and defending land claims. Additionally, they are a prerequisite to formally registering land, whether collectively or individually. Thus, our third recommendation is to explore ways of making land surveys and the production and registration of cadastral maps accessible not only to individuals but also – and perhaps particularly – to groups of residents and land access holders, while taking care to involve local institutions and making sure that surveys take place in the public sphere. Part of such efforts would consist of making this service more affordable by expanding supply (training, encouraging the establishing of qualified surveyors in rural areas), taking advantage of new technologies, including global positioning systems which may bring down costs without compromising quality, and perhaps by subsidising demand e.g. through establishing survey funds at sub-county level.
4. Explore ways of making land rental agreements more attractive both to persons renting land and to persons giving out land for rentThe fourth and last recommendation for policy and administrative interventions with the aim to maintain and – in this case – enhance tenure security is to explore ways of strengthening the level of security associated with private land rental agreements not only to the persons renting the land, who currently experience high levels of tenure insecurity, but also to the persons giving out land for rent. As our results indicate, land rentals hold the potential of opening the doors to land access to peo-ple who may be discriminated against when attempting to access land through other tenure forms. Making land rentals more attractive could include efforts to develop standards for land rental agree-ments and efforts to strengthen the institutional capacity of third party institutions to mediate upon entering, ending or renewing rental agreements and in cases of disagreements between the parties.

DIIS WORKING PAPER 2013:03
71
REFERENCES
Anon. (2007). Uganda Districts Information Handbook (2nd ed.). Kampala: Fountain Publishers.Batungi, N. (2008). Land Reform in Uganda. Towards a Harmonised Tenure System. Fountain Series
in Law and Business Studies. Kampala: Fountain Publishers.Bomuhangi, A., C. Doss and R. Meinzen-Dick (2011). Who Owns the Land? Perspectives from Rural
Ugandans and Implications for Land Acquisitions. IFPRI Discussion Paper 01136. Washington DC: IFPRI.
Boone, C. (2007). ‘Property and Constitutional Order: Land Tenure Reform and the Future of the African State.’ African Affairs 106 (425): 557–586.
Broegaard, R.B. (2008) Struggles for Land and Security in Nicaragua: Moulding the Slope of the Playing Field. Ph.D. Dissertation, Institute for Society and Globalization. Roskilde University, Denmark.
Bruce, J. W. and S.E. Migot-Adholla (eds.) (1994). Searching for Land Tenure Security in Africa. Washington DC: World Bank.
Burke, C. and E. O. Egaru (2011). Identification of Good Practices in Land Conflict Resolution in the Acholi Region. United Nations Resident Coordinators Office for Uganda.
Busingye, H. (2002). Customary Land Tenure Reform in Uganda: Lessons for South Africa. Interna-tional Symposium on Communal Tenure Reform. PLAAS, Johannesburg, 12–13 August 2002.
Das, R., A. Nkutu, and Nordic Consulting Group (2008). Evaluation of General Food Distribution in Northern Uganda: Gulu, Amuru and Kitgum Districts 2005-8. Norwegian Refugee Council Evaluation Report. Kampala: Nordic Consulting Group.
Deininger, K. and D. Ayalew Ali (2008.) ‘Do Overlapping Land Rights Reduce Agricultural In-vestment? Evidence from Uganda.’ American Journal of Agricultural Economics 90 (4): 869–882.
Government of Uganda (1995). The Constitution of the Republic of Uganda. Entebbe: Uganda Gov-ernment Printing and Publishing Corporation.
Government of Uganda (1998). The Land Act, 1998. Entebbe: Uganda Government Printing and Publishing Corporation.
Green, E. D. (2006). ‘Ethnicity and the Politics of Land Tenure Reform in Central Uganda.’ Com-monwealth and Comparative Politics 44 (3): 370–388.
Migot-Adholla, S., P. Hazell, B. Blarel and F. Place (1991). ‘Indigenous Land Rights Systems in Sub-Saharan Africa: A Constraint on Productivity?’ World Bank Economic Review 5 (1): 155–175.
Ministry of Lands, Housing and Urban Development (MLHUD) (2011). The Uganda National Land Policy. Final Draft. Kampala: Century House.
Olanya, D. R. (2011). Colonial Legacy, Access, Political Economy of Land, and Legal Pluralism in Uganda 1900–2010. Paper presented at ECAS 4 Conference June 2011, Uppsala, Sweden.
Pedersen, R.H., R. Spichiger, S. Alobo and M. Kidoido (2012) Land Tenure and Economic Activities in Uganda: A Literature Review. DIIS Working Paper 2012: 13. Copenhagen: Danish Institute for International Studies.
Ravnborg, H. M., J. Boesen, A. Sørensen, Z. Akello, B. Bashasha, S. Kasozi, M. Kidoido and V. Wabukawo (2004). Gendered District Poverty Profiles and Poverty Monitoring: Kabarole, Masaka, Pallisa, Rakai and Tororo Districts, Uganda. DIIS Working Paper 2004: 1. Copenhagen: Danish Institute for International Studies.

DIIS WORKING PAPER 2013:03
72
Rugadya, M.A. (2006). Pastoralism and Conservation Studies. Uganda Country Report, 2006. Kam-pala: IUCN: The World Conservation Union.
Rugadya, M.A. (2008). Northern Uganda Land Study. Analysis for Post Conflict Land Policy and Land Administration: A Survey of IDP Return and Resettlement Issues and Lesson from Acholi and Lango Regions. Kampala: World Bank.
Uganda Bureau of Statistics (UBOS). (2002). The 2002 Uganda Population and Housing Census, Population Size and Distribution. October 2006, Kampala, Uganda.
Uganda Bureau of Statistics (UBOS) (2010). Uganda Census of Agriculture 2008/2009. Volume II–IV. Kampala, Uganda.
Walker, C. (2002). Land Reform in Southern and Eastern Africa: Key Issues for Strengthening Women’s Access to and Rights in Land. Report for FAO. Rome: Food and Agriculture Organization.

DIIS WORKING PAPER 2013:03
73
ANNEX I – LIST OF QUALITATIVE INTERVIEWS UNDERTAKEN IN AMURU, MASAKA AND PALLISA AREA
Institution/Type of informant Interviewee occupation and/or place Date Record, digital
MICROFINANCE AND BANKS
AMURU
Microfinance Rural SACCO: Manager and cashier 20-01-2012 NO
MASAKA
Bank Centenary Bank branch manager 25-10-2011 YES
Bank Stanbic branch manager (acting) 25-10-2011 YES
Microfinance FINCA branch manager 25-10-2011 NO
PALLISA
Bank (Larger bank, anonymised) 24-01-2012 NO
Microfinance Brach branch manager 24-01-2012 YES
DISTRICT ADMINISTRATION
AMURU
District/Land District Land Officer 18-01-2012 YES
District/general District representatives (group) 18-01-2012 NO
MASAKA
District/general Masaka district representatives 24-10-2011 YES
District/Land Land Registrar 24-10-2011 YES
District/Land District Land Board secretary 25-10-2011 YES
PALLISA
District/Land District Land Officer 23-01-2012 YES
District/Land District Representatives (focus group) 23-01-2012 NO
SUB-COUNTY ADMINISTRATION
AMURU
Sub-county Sub-county chief 18-01-2012 YES
Sub-county Acting sub-county chief 19-01-2012 YES
MASAKA
Sub-county Sub-county clerk 26-10-2011 YES
Sub-county/land Sub-county land committee chairman 28-10-2011 YES
PALLISA
Sub-county Area land committee chairman 26-01-2012 YES
VILLAGE/LC1 LEVEL INSTITUTIONS
AMURU
Village/LC1 urban Defence secretary Pabbo 21-01-2012 YES
MASAKA
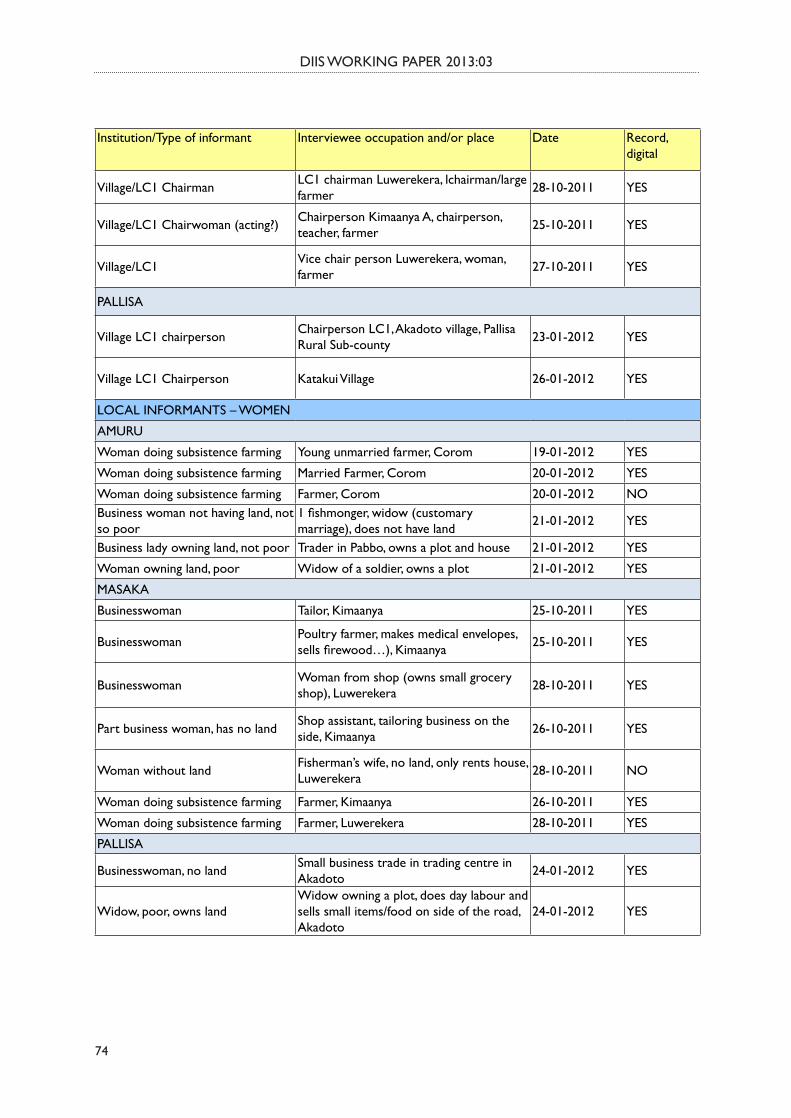
DIIS WORKING PAPER 2013:03
74
Institution/Type of informant Interviewee occupation and/or place Date Record, digital
Village/LC1 Chairman LC1 chairman Luwerekera, lchairman/large farmer 28-10-2011 YES
Village/LC1 Chairwoman (acting?) Chairperson Kimaanya A, chairperson, teacher, farmer 25-10-2011 YES
Village/LC1 Vice chair person Luwerekera, woman, farmer 27-10-2011 YES
PALLISA
Village LC1 chairperson Chairperson LC1, Akadoto village, Pallisa Rural Sub-county 23-01-2012 YES
Village LC1 Chairperson Katakui Village 26-01-2012 YES
LOCAL INFORMANTS – WOMEN
AMURU
Woman doing subsistence farming Young unmarried farmer, Corom 19-01-2012 YES
Woman doing subsistence farming Married Farmer, Corom 20-01-2012 YES
Woman doing subsistence farming Farmer, Corom 20-01-2012 NOBusiness woman not having land, not so poor
1 fishmonger, widow (customary marriage), does not have land 21-01-2012 YES
Business lady owning land, not poor Trader in Pabbo, owns a plot and house 21-01-2012 YES
Woman owning land, poor Widow of a soldier, owns a plot 21-01-2012 YES
MASAKA
Businesswoman Tailor, Kimaanya 25-10-2011 YES
Businesswoman Poultry farmer, makes medical envelopes, sells firewood…), Kimaanya 25-10-2011 YES
Businesswoman Woman from shop (owns small grocery shop), Luwerekera 28-10-2011 YES
Part business woman, has no land Shop assistant, tailoring business on the side, Kimaanya 26-10-2011 YES
Woman without land Fisherman’s wife, no land, only rents house, Luwerekera 28-10-2011 NO
Woman doing subsistence farming Farmer, Kimaanya 26-10-2011 YES
Woman doing subsistence farming Farmer, Luwerekera 28-10-2011 YES
PALLISA
Businesswoman, no land Small business trade in trading centre in Akadoto 24-01-2012 YES
Widow, poor, owns landWidow owning a plot, does day labour and sells small items/food on side of the road, Akadoto
24-01-2012 YES

DIIS WORKING PAPER 2013:03
75
Institution/Type of informant Interviewee occupation and/or place Date Record, digital
Woman farmer, poor, no land Woman doing subsistence farming, and brewing/selling marua, Katakwi 25-01-2012 YES
Woman farming, owns freehold landWidow with co-widows, husband had large freehold land, sells farm produce and dried fish, Katakwi
26-01-2012 YES
Woman farming, not so poorWoman farming, has inherited land from her father, husband rents a trading shop, Katakwi
26-01-2012 YES
LOCAL INFORMANTS – MEN
AMURU
Carpenter and small-scale farmer Corom 19-01-2012 YES
Small-scale farmer, starting business Corom 20-01-2012 YESTeacher and small-scale farmer, living in Gulu Corom 20-01-2012 YES
Shop-keeper and small-scale farmer Pabbo 21-01-2012 YESBusinessman and (pretty) large-scale farmer Pabbo 21-01-2012 YES
Produce-dealer and small-scale farmer Pabbo 21-01-2012 YES
MASAKA
Businessman and farmer, small-scale Luwerekera 27-10-2011 YES Man, subsistence farmer and construction work. Kimanya 25-10-2011 YES
Man, wealthy, rents out houses and farms Kimanya 26-10-2011 YES
Poor man, subsistence farmer and casual laborer Luwerekera 27-10-2011 YES
Man, retiree Kimanya 26-10-2011 YES Man, young, returned from Lusaka with savings, cash farming and working with construction
Luwerekera 27-10-2011 YES
Farmer, poor, land poor, subsistence and casual laborer Luwerekera 27-10-2011 YES
PALLISA
Miller and small-scale farmer Akadoto 24-01-2012 YES
Shop-keeper and (a little bit) large scale farmer Akadoto 24-01-2012 YES
Small-scale farmer Katakwi 25-01-2012 YES
Retiree and small scale farmer Katakwi 25-01-2012 YES
Bicycle repair and small-scale farmer Katakwi 25-01-2012 YES
Small-scale farmer Katakwi 25-01-2012 YES
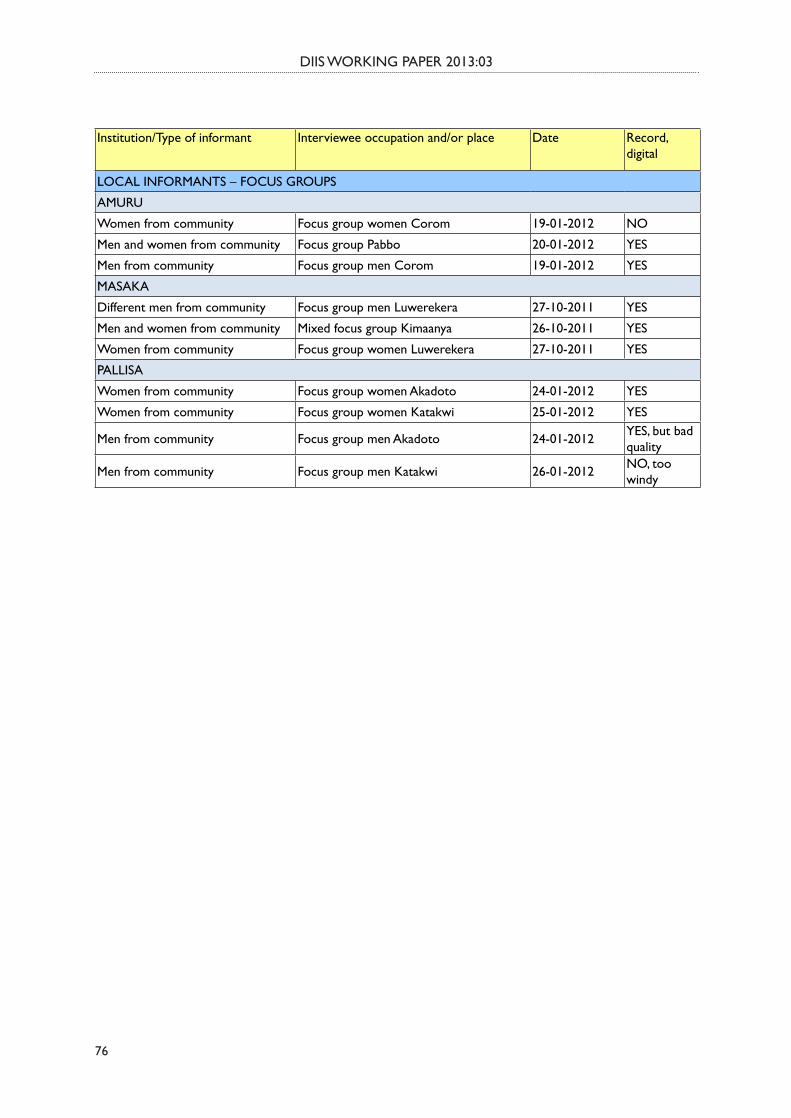
DIIS WORKING PAPER 2013:03
76
Institution/Type of informant Interviewee occupation and/or place Date Record, digital
LOCAL INFORMANTS – FOCUS GROUPS
AMURU
Women from community Focus group women Corom 19-01-2012 NO
Men and women from community Focus group Pabbo 20-01-2012 YES
Men from community Focus group men Corom 19-01-2012 YES
MASAKA
Different men from community Focus group men Luwerekera 27-10-2011 YES
Men and women from community Mixed focus group Kimaanya 26-10-2011 YES
Women from community Focus group women Luwerekera 27-10-2011 YES
PALLISA
Women from community Focus group women Akadoto 24-01-2012 YES
Women from community Focus group women Katakwi 25-01-2012 YES
Men from community Focus group men Akadoto 24-01-2012 YES, but bad quality
Men from community Focus group men Katakwi 26-01-2012 NO, too windy

DIIS WORKING PAPER 2013:03
77
ANNEX II – PROCEDURE FOR SAMPLING INDIVIDUALS HOLDING ACCESS TO LAND IN THE AMURU, MASAKA AND PALLISA AREAS
The questionnaire sample was drawn as three stratified, random samples of each 400 individuals having access to land. For each area, half of these 400 individuals were drawn from neighbourhoods or communities (EAs) classified as urban/peri-urban, while the other half was drawn from the com-munities (EAs) classified as rural. This was done through a two-stages sampling procedure:
Stage 1: From each area, 10 ‘peri-urban’ and ‘10’ rural communities were randomly selected. The communities were selected through a proportionate stratified sampling procedure based on the relative population weight of each sub-county for the rural and urban population, respectively. Table II.1 (a-c) shows the rural and peri-urban population-based weights (columns F and I, respec-tively), calculated for each sub-county. Hence, the larger the population of a sub-county (rural or peri-urban), the larger the share of the 10 communities should the selected from that sub-county. In practical terms, in order not to exclude some, primarily the smaller sub-counties, from having a community included among the sampled communities, some sub-counties were grouped (columns H and K, respectively) during the sampling process as illustrated in Table II.1. For each group of sub-counties (see Table II.1, columns H and K), lists of EAs were prepared and each EA was assigned a number. Using a list of random numbers, the required number of EAs (see Table II.1, columns H and K) was then selected from each group.
Stage 2: As our aim was to draw a sample of individuals having access to land, a list was prepared for each of the selected communities/neighbourhoods of individuals (men as well as women, heads of households as well as non-heads of households) having access to land inside or outside the par-ticular community or neighbourhood. This list was prepared through interviews with community leaders. From this list, a sample of 20 individuals was drawn as a simple random sample.

DIIS WORKING PAPER 2013:03
78
Table II.1 (a-c). Population, population-based sampling weights, and number of EAs to be sampled per sub-county for Amuru, Masaka and Pallisa areas
Table II.1a Amuru area
Rural Urban Total
Popula-tion-based weight
Ideal number of EAs to
be sampled
Adjusted number of EAs to
be sampled
Population-based
weight
Ideal number of EAs to
be sampled
Adjusted number of EAs to
be sampled
[A] [B] [C] [D] [E] [F] [G] [H] [I] [J] [K]
Amuru 8,254 1,894 10,148 16.6 1.7 71.2 7.1 7Atiak 6,347 - 6,347 12.8 1.3 0.0 0.0Lamogi 8,673 - 8,673 17.4 1.7 0.0 0.0Pabbo 9,030 484 9,514 18.2 1.8 18.2 1.8Alero 7,261 - 7,261 14.6 1.5 0.0 0.0Anaka 1,651 - 1,651 3.3 0.3 0.0 0.0Koch-Goma 4,651 - 4,651 9.4 0.9 0.0 0.0Purongo 3,843 - 3,843 7.7 0.8 0.0 0.0Nwoya T.C - 282 282 0.0 0.0 - 10.6 1.1 1
Amuru area 49,710 2,660 52,370 100.0 10.0 10 100.0 10.0 10
Population (# households)
Sub- countyDistrict
Amuru
Nwoya
3
5
2
Rural Urban
2

DIIS WORKING PAPER 2013:03
79
Table II.1b Masaka area
Rural Urban Total
Popula-tion-based weight
Ideal number of EAs to
be sampled
Adjusted number of EAs to
be sampled
Population-based
weight
Ideal number of EAs to
be sampled
Adjusted number of EAs to
be sampled
[A] [B] [C] [D] [E] [F] [G] [H] [I] [J] [K]
Bigasa 8,248 - 8,248 6.0 0.6 - - Butenga 9,429 1,268 10,697 6.9 0.7 3.1 0.3 Kibinge 6,650 - 6,650 4.9 0.5 - - Kitanda 5,458 - 5,458 4.0 0.4 - - Lwengo 10,101 3,111 13,212 7.4 0.7 7.6 0.8 Kyazanga 8,119 2,721 10,840 5.9 0.6 6.6 0.7 Malongo 6,558 1,533 8,091 4.8 0.5 3.7 0.4 Bukakata 3,277 121 3,398 2.4 0.2 0.3 0.0 Buwunga 8,349 - 8,349 6.1 0.6 - - Mukungwe 7,721 258 7,979 5.6 0.6 0.6 0.1 Kingo 7,284 122 7,406 5.3 0.5 0.3 0.0 Kabonero 5,722 621 6,343 4.2 0.4 1.5 0.2 Kisekka 8,791 - 8,791 6.4 0.6 - - Kyanamukaka 11,862 82 11,944 8.7 0.9 1 0.2 0.0 Ndagwe 7,486 - 7,486 5.5 0.5 - - Bukulula 7,226 1,848 9,074 5.3 0.5 4.5 0.5 Lukaya Town 1,148 2,599 3,747 0.8 0.1 6.3 0.6 Lwabenge 6,209 331 6,540 4.5 0.5 0.8 0.1 Kalungu 1,585 7,632 9,217 1.2 0.1 18.6 1.9 Kyamulibwa 5,403 1,050 6,453 3.9 0.4 2.6 0.3 Katwe/Buttego 330 4,421 4,751 0.2 0.0 10.8 1.1 Kmanya/Kyabakuza - 3,976 3,976 - - 9.7 1.0 1Nyendo/Senyange - 9,359 9,359 - - 22.8 2.3 2
Masaka study area 136,956 41,053 178,009 100.0 10.0 10 100.0 10.0
41Kalungu
Masaka
Bukomansimbi
Lwengo
1
2
1
1
2
21
District Sub- county
Population (# households) Rural Urban
1

DIIS WORKING PAPER 2013:03
80
Table II.1c Pallisa area
Rural Urban Total
Popula-tion-based weight
Ideal number of EAs to
be sampled
Adjusted number of EAs to
be sampled
Population-based
weight
Ideal number of EAs to
be sampled
Adjusted number of EAs to
be sampled
[A] [B] [C] [D] [E] [F] [G] [H] [I] [J] [K]
Butebo 4,897 - 4,897 8.7 0.9 - - Kabwangasi 4,476 68 4,544 7.9 0.8 1.1 0.1 Kakoro 2,910 - 2,910 5.2 0.5 - - Kibale 2,558 174 2,732 4.5 0.5 2.8 0.3 Kanginima 1,685 78 1,763 3.0 0.3 1.2 0.1 Petete 4,365 - 4,365 7.7 0.8 - - Agule 2,698 232 2,930 4.8 0.5 3.7 0.4 Apopong 5,129 - 5,129 9.1 0.9 - - Gogonya 4,415 - 4,415 7.8 0.8 - - Kameke 2,522 - 2,522 4.5 0.4 - - Kasodo 2,244 - 2,244 4.0 0.4 - - Pallisa Town council - 5,098 5,098 - - 81.5 8.2 8Pallisa 2,220 289 2,509 3.9 0.4 4.6 0.5 Puti-Puti 3,451 316 3,767 6.1 0.6 5.1 0.5 Kamuge 3,306 - 3,306 5.9 0.6 - - Akisim 2,017 - 2,017 3.6 0.4 - - Chelekwa 2,017 - 2,017 3.6 0.4 - - Olok 2,517 - 2,517 4.5 0.4 - - Opwateta 3,039 - 3,039 5.4 0.5 - -
Pallisa study area 56,466 6,255 62,721 100.0 10.0 10 100.0 10.0 10
1
1
District Sub- county
Population (# households) Rural Urban
2
Butebo
Pallisa
1
3
2
2
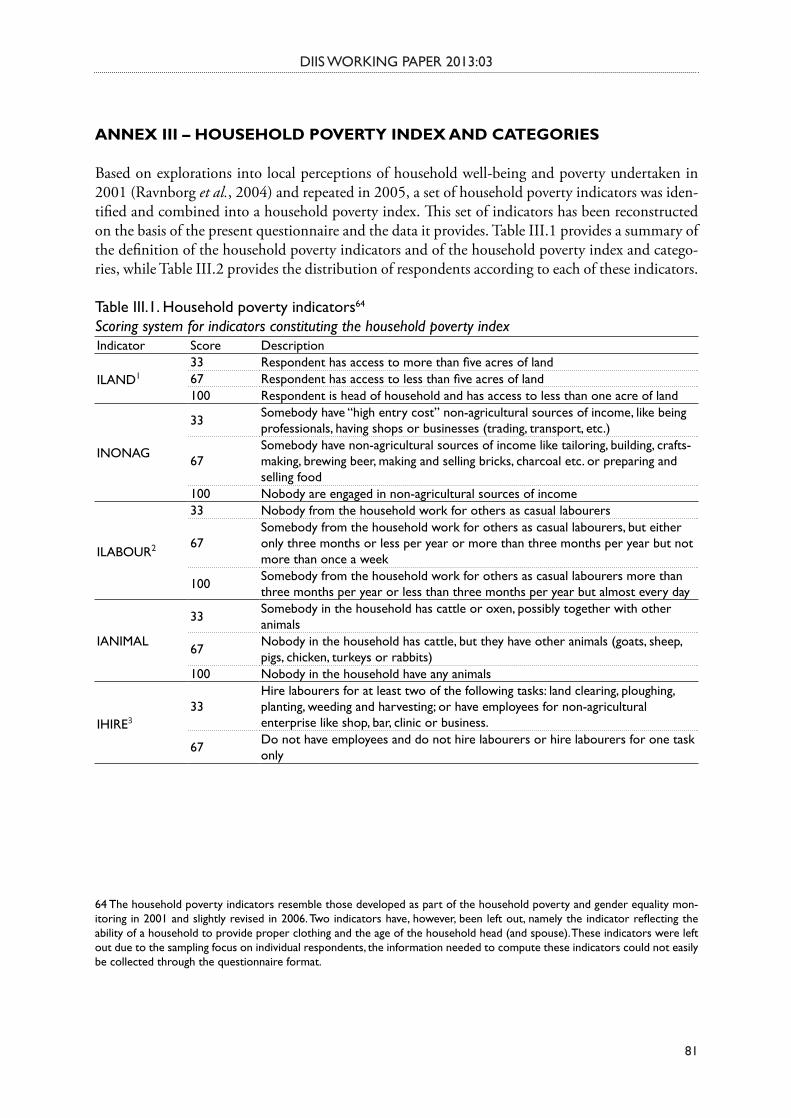
DIIS WORKING PAPER 2013:03
81
ANNEX III – HOUSEHOLD POVERTY INDEX AND CATEGORIES
Based on explorations into local perceptions of household well-being and poverty undertaken in 2001 (Ravnborg et al., 2004) and repeated in 2005, a set of household poverty indicators was iden-tified and combined into a household poverty index. This set of indicators has been reconstructed on the basis of the present questionnaire and the data it provides. Table III.1 provides a summary of the definition of the household poverty indicators and of the household poverty index and catego-ries, while Table III.2 provides the distribution of respondents according to each of these indicators.
Table III.1. Household poverty indicators64
Scoring system for indicators constituting the household poverty index Indicator Score Description
ILAND133 Respondent has access to more than five acres of land67 Respondent has access to less than five acres of land100 Respondent is head of household and has access to less than one acre of land
INONAG
33 Somebody have “high entry cost” non-agricultural sources of income, like being professionals, having shops or businesses (trading, transport, etc.)
67Somebody have non-agricultural sources of income like tailoring, building, crafts-making, brewing beer, making and selling bricks, charcoal etc. or preparing and selling food
100 Nobody are engaged in non-agricultural sources of income
ILABOUR2
33 Nobody from the household work for others as casual labourers
67Somebody from the household work for others as casual labourers, but either only three months or less per year or more than three months per year but not more than once a week
100 Somebody from the household work for others as casual labourers more than three months per year or less than three months per year but almost every day
IANIMAL
33 Somebody in the household has cattle or oxen, possibly together with other animals
67 Nobody in the household has cattle, but they have other animals (goats, sheep, pigs, chicken, turkeys or rabbits)
100 Nobody in the household have any animals
IHIRE333
Hire labourers for at least two of the following tasks: land clearing, ploughing, planting, weeding and harvesting; or have employees for non-agricultural enterprise like shop, bar, clinic or business.
67 Do not have employees and do not hire labourers or hire labourers for one task only
64 The household poverty indicators resemble those developed as part of the household poverty and gender equality mon-itoring in 2001 and slightly revised in 2006. Two indicators have, however, been left out, namely the indicator reflecting the ability of a household to provide proper clothing and the age of the household head (and spouse). These indicators were left out due to the sampling focus on individual respondents, the information needed to compute these indicators could not easily be collected through the questionnaire format.

DIIS WORKING PAPER 2013:03
82
Indicator Score Description
IFOOD4
33 Have not experienced a period of food shortage within the last year
67
Have experienced a period of food shortage within the last year which lasted less than two months or which lasted longer but the only recourse that was taken were eating less meat, using farm products rather than buying so much or buying food or that the husband day-laboured more
100 Have experienced a period of food shortage within the last year which lasted two months or more
IFEED
33 Bought sugar when they last ran out of sugar, eat meat at least once a month and fry food at least once a week
67 Either did not buy sugar when they last ran out of sugar, or eat meat less than a month or fry food only occasionally (but not all three conditions at once)
100 Went without sugar last they ran out of sugar or rarely buy sugar, eat meat less than once a month and fry food occasionally
IHOUSING
33 Have houses with brick or plastered walls and iron or tile roofs
67 Have houses which might have iron roof, plastered walls or walls of bricks or unburned bricks but not both conditions at once
100Have houses with walls made of old tins or banana or other leaves and grass-thatched roofs or roofs made of banana or other leaves, old tins or polythene, or have houses that are in need of major repairs
IHEALTH5
67
Nobody in the household had suffered from T.B., HIV/AIDS, anaemia or chest-related diseases during the year or had done so, but the household had consulted the clinic with own money without the need to borrow money from relatives, neighbours, etc.
100
Somebody in the household suffer from malaria, T.B., HIV/AIDS, anaemia or chest-related diseases but either the clinic had not been consulted due to lack of money or the clinic had been consulted with money borrowed from relatives, neighbours, etc.
ISCHOOL
33Have or have had children at secondary school or higher or have children between 6 and 12 years in private schools at the same time as not having any children (incl. orphans) between 6 and 12 years who are not attending school
67Have no children (incl. orphans) between 6 and 12 years who are not attending school, have not (had) children in secondary school, and do not have children between 6 and 12 years attending private school
100 Have children (incl. orphans) between 6 and 12 years who are not attending school
IMARITAL67 Household head is male or a married or co-habiting woman100 Household head is a widow or a single or divorced woman
1 Unfortunately, the questionnaire format does not ask for information on land access of the household but only of the individual respondent. Although the household may have access to more land than that which the respondent has access to, the household poverty indicator on land access will be estimated on the basis of the respondent’s land access. This means that among those who are assigned 67 points, some may have access to more than 5 acres of land as a household. For respondents that have access to between 2 and 5 acres of land both inside and outside the village we assume that the household as such has access to more the 5 acres in total. For respondents who are the head of the household and who indicate to have access to a total of less than one acre, we assume that also the household has access to less than an acre.2 This indicator reflects day-labouring undertaken by household head (whether male or female) and wife (in case of male household head).3 To better reflect urban and peri-urban residents, households that hire employees for their non-agricultural enterprise are included in the category receiving 33 points.4 In difference to the scoring system developed in 2001, households for which the period without sufficient food lasted more than 2 months but for which the only recourse taken was that the husband day-laboured more (without reducing number of meals etc.) are assigned 67 points (instead of 100 points). This shifts 20 households from ‘100’ to ‘67’ according to this category.5 The definition of this indicator corresponds to the 2006 definition of the ihealth indicator.

DIIS WORKING PAPER 2013:03
83
Table III.2. Distribution of respondentsa according to their scores on the household poverty indicatorsNumber of respondents by score, by household poverty indicatorHousehold poverty indicator Score Number of
respondents who have not been
assigned a score (not applicable or
lack of information)
33 67 100
Land access (iland) 178 884 112 – Non-agricultural sources of incomes (inonag) 309 407 449 9Day-labouring (ilabour) 584 416 154 20Animal ownership (ianimal) 279 677 211 7Hiring of labourers (ihire) 530 635 – 9Food security (ifood) 243 381 511 39Quality of diet (ifeed) 236 730 168 40Housing quality (ihousing) 175 485 509 5Ability to deal with health problems (ihealth) – 1,004 164 5Children’s schooling (ischool) 393 601 168 12Marital status (imarital) – 1,000 167 7a Eighty-eight per cent of the respondents (=1,033) had scores assigned on all household poverty indicators; 11 per cent of the respondents (=131) had scores assigned on 10 household poverty indicators. The lowest number of indicators according to which any respondents had valid scores was seven, and only 0.1 per cent (=1) of the households had scores assigned only on seven of the 11 indicators.
The household poverty index is computed as the average of the scores assigned to the households to which the respondent belongs according to these indicators. Figure III.1 depicts the distribution of respondents according to the household poverty index and according to threshold values defined (Ravnborg et al., 2004). Three household poverty categories are identified (Table III.3). As one of the selection criteria for being eligible for sampling was access to land, which is reflected in one of the household poverty indicators, the sample drawn for the present survey is not representative of the population of the three areas at large, but only of the part of the population having access to land. This implies that the generally lower proportion of respondents belonging to the category of ‘poorest’ households in the present survey as compared to the corresponding 2001 and 2005 figures cannot be interpreted as an indication of a falling incidence of poverty.

DIIS WORKING PAPER 2013:03
84
Figure III.1. Distribution of respondents according to household poverty index Number of respondents; dotted lines indicate limits between the household poverty categories ‘non-poor’, ‘less poor’ and ‘poorest households’
Table III.3. Distribution of respondents by household poverty category, Amuru, Masaka and Pallisa areas***
Per cent non-poor, less poor and poorest respondents per area
Area Household poverty level All poverty levelsNon-poor Less poor Poorest
Amuru# respondents 65 164 170 399% respondents 16.3 41.1 42.6 100.0
Masaka# respondents 210 127 47 384% respondents 54.7 33.1 12.2 100.0
Pallisa# respondents 107 153 131 391% respondents 27.4 39.1 33.5 100.0
All# respondents 382 444 348 1,174% respondents 32.5 37.8 29.6 100.0

DIIS WORKING PAPER 2013:03
85
ANNEX IV – TENURE SECURITY INDEX AND CATEGORIES
Based on theoretically informed conceptualisations of tenure (in)security, respondents were asked about
• their expectation to be able to use a particular piece of land five years from now; • their expectation to be able to bequeath a particular piece of land to children or close relatives;
and • their expectation to be able to sell a particular piece of land.
For each of these three aspects, the responses were grouped into three categories, assigned the fol-lowing values:
‘1’ unconditional security (‘yes’)‘3’ contingent security – ability perceived to depend upon the opinion or decision of (i) spouse,
children or other relatives, (ii) the land owner (where applicable) or (iii) institutions like the clan leader or the LC1 chair
‘5’ insecurity
For respondents who perceive ‘contingent security’ or insecurity with respect to continued use, ability to pass a parcel on to children or ability to sell a given parcel, Tables IV.1 to IV.3 show upon which institutions (or types of individuals) such abilities are perceived to depend.
Whereas the ability of continued use – within a relatively short time-span of five years – is perceived to be in control either by the respondent him- or herself (being the case of the access holders of 78.8 per cent of the parcels (Table 3.2) or of the respondent in combination with spouse or relatives (being the case for an additional seven per cent of the total number of parcels – Table IV.1), the ability to bequeath a particular parcel of land to children or to sell a particular parcel is perceived to depend upon institutions ‘further from’ the respondent or by unknown institutions (Tables IV.2 and IV.3). The respondents perceived their ability to give a particular parcel in heritage to depend upon others or were uncertain about it in the case of more than one third (37 per cent) of the parcels (Table IV.2). This was the case with respect to almost all of the parcels (97 per cent) in the case of the ability to sell a given parcel (Table IV.3). Moreover, of those who perceived that their ability to give a particular parcel of land in heritage was dependent upon others, half perceived this ability to depend upon either a relative or the land owner (Table IV.2), while the majority of those who perceived that their ability to sell a particular parcel depended upon others were unsure about who it was that they were dependent upon (Table IV.3).
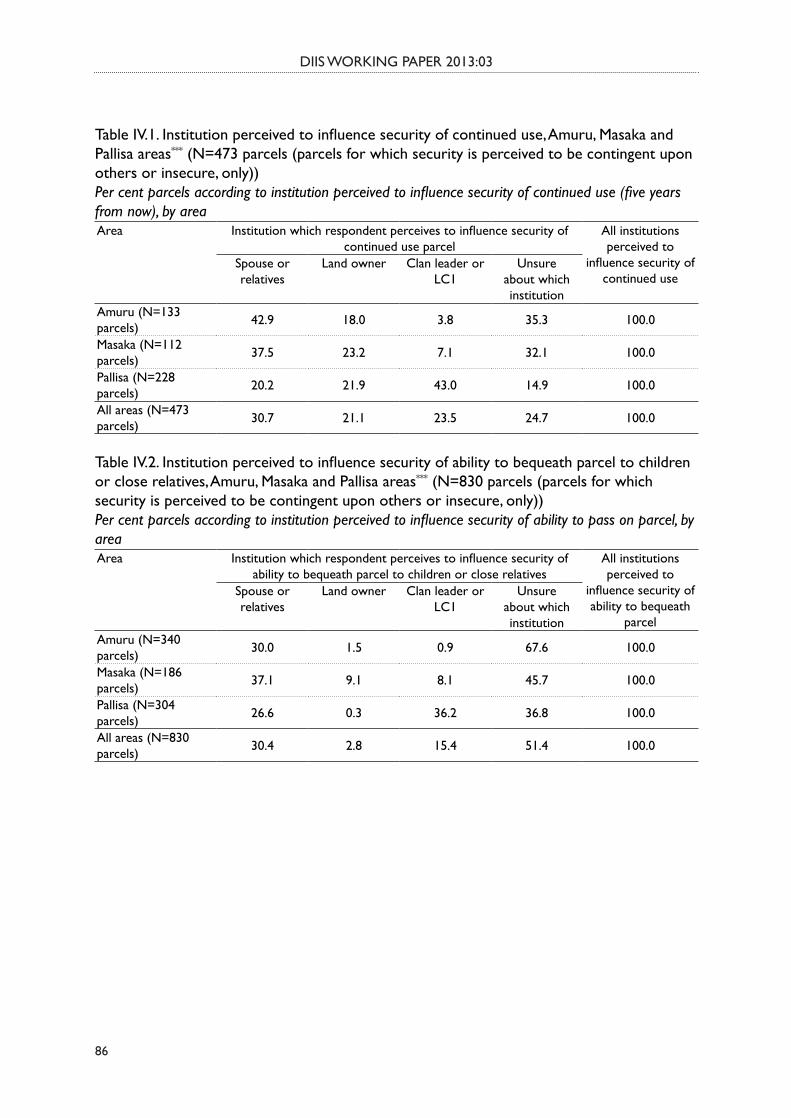
DIIS WORKING PAPER 2013:03
86
Table IV.1. Institution perceived to influence security of continued use, Amuru, Masaka and Pallisa areas*** (N=473 parcels (parcels for which security is perceived to be contingent upon others or insecure, only))Per cent parcels according to institution perceived to influence security of continued use (five years from now), by area Area Institution which respondent perceives to influence security of
continued use parcel All institutions perceived to
influence security of continued use
Spouse or relatives
Land owner Clan leader or LC1
Unsure about which institution
Amuru (N=133 parcels) 42.9 18.0 3.8 35.3 100.0
Masaka (N=112 parcels) 37.5 23.2 7.1 32.1 100.0
Pallisa (N=228 parcels) 20.2 21.9 43.0 14.9 100.0
All areas (N=473 parcels) 30.7 21.1 23.5 24.7 100.0
Table IV.2. Institution perceived to influence security of ability to bequeath parcel to children or close relatives, Amuru, Masaka and Pallisa areas*** (N=830 parcels (parcels for which security is perceived to be contingent upon others or insecure, only))Per cent parcels according to institution perceived to influence security of ability to pass on parcel, by area Area Institution which respondent perceives to influence security of
ability to bequeath parcel to children or close relatives All institutions perceived to
influence security of ability to bequeath
parcel
Spouse or relatives
Land owner Clan leader or LC1
Unsure about which institution
Amuru (N=340 parcels) 30.0 1.5 0.9 67.6 100.0
Masaka (N=186 parcels) 37.1 9.1 8.1 45.7 100.0
Pallisa (N=304 parcels) 26.6 0.3 36.2 36.8 100.0
All areas (N=830 parcels) 30.4 2.8 15.4 51.4 100.0

DIIS WORKING PAPER 2013:03
87
Table IV.3. Institution perceived to influence security of ability to sell parcel, Amuru, Masaka and Pallisa areas*** (N=2,162 parcels (parcels for which security is perceived to be contingent upon others or insecure, only))Per cent parcels according to institution perceived to influence security of ability to sell parcel, by area Area Institution which respondent perceives to influence security of
ability to sell parcelAll institutions perceived to
influence security of ability to sell parcel
Spouse or relatives Clan leader or LC1 Unsure about which institution
Amuru (N=895 parcels) 5.4 0.0 94.6 100.0
Masaka (N=593 parcels) 5.9 1.5 92.6 100.0
Pallisa (N=674 parcels) 3.1 12.5 84.4 100.0
All areas (N=2,162 parcels) 4.8 4.3 90.9 100.0
The three aspects of tenure (in)security (Tables 3.2 to 3.4) were combined into a single ‘theoretically informed tenure (in)security index’ ranging from ‘1’ – unconditional tenure security in all three aspects – to ‘5’ – tenure insecurity in all three aspects, computed as the arithmetic mean of the perceived level of tenure (in)security according to each of the three aspects. Figure IV.2 shows the distribution of parcels along this theoretically informed tenure (in)security index.
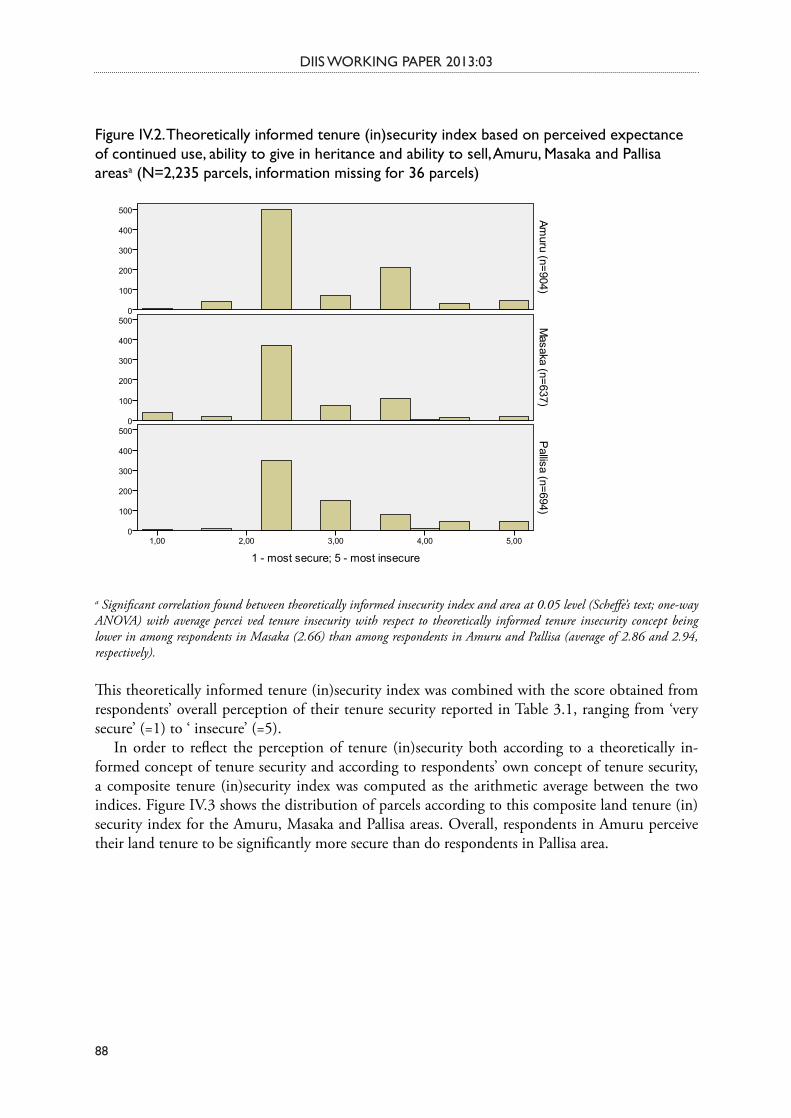
DIIS WORKING PAPER 2013:03
88
Figure IV.2. Theoretically informed tenure (in)security index based on perceived expectance of continued use, ability to give in heritance and ability to sell, Amuru, Masaka and Pallisa areasa (N=2,235 parcels, information missing for 36 parcels)
a Significant correlation found between theoretically informed insecurity index and area at 0.05 level (Scheffe’s text; one-way ANOVA) with average percei ved tenure insecurity with respect to theoretically informed tenure insecurity concept being lower in among respondents in Masaka (2.66) than among respondents in Amuru and Pallisa (average of 2.86 and 2.94, respectively).
This theoretically informed tenure (in)security index was combined with the score obtained from respondents’ overall perception of their tenure security reported in Table 3.1, ranging from ‘very secure’ (=1) to ‘ insecure’ (=5).
In order to reflect the perception of tenure (in)security both according to a theoretically in-formed concept of tenure security and according to respondents’ own concept of tenure security, a composite tenure (in)security index was computed as the arithmetic average between the two indices. Figure IV.3 shows the distribution of parcels according to this composite land tenure (in)security index for the Amuru, Masaka and Pallisa areas. Overall, respondents in Amuru perceive their land tenure to be significantly more secure than do respondents in Pallisa area.

DIIS WORKING PAPER 2013:03
89
Figure IV.3. Land tenure (in)security in Amuru, Masaka and Pallisa areasa (N=2,238 parcels; information missing for 33 parcels)Number of parcels by land tenure insecurity index based on respondents’ perceptions according to own and theoretically informed tenure security concept per area (1 – most secure; 5 – most insecure)
a Significant correlation between land tenure insecurity index and area at 0.001 level (significance of F; ANOVA). Pairwise comparisons show average tenure insecurity to be significantly higher among respondents in Pallisa (average land tenure inse-curity index=2.68) than in Amuru and Masaka areas (average land tenure insecurity index of 2.31 and 2.40, respectively) (at 0.05 level; Scheffe’s test).
On the basis of this land tenure insecurity index, three categories of tenure security were computed (Table 3.5).

DIIS WORKING PAPER 2013:03
90
ANNEX V – RESPONDENT-RELATED FEATURES AND THEIR CORRELATION WITH THE PROPENSITY TO UNDERTAKE AGRICULTURAL INVESTMENTS – RESULTS FROM BINARY LOGISTIC REGRESSION ANALYSIS
We employed logistic regression analysis to understand what combinations of parcel, respondent and institutional factors influence agricultural investments or permanent improvements on the land. Again the analyses are performed at area level to recognize and capture the unique local factors at play. Table V.1 presents the results for Amuru area.
Table V.1. Coefficient estimates of the determinants of the decision to undertake agricultural investments and/or permanent improvements on the land in Amuru area-respondent levelLogistic regressionRespondent undertook agricultural investments or permanent improvements on the parcels in the last 5yrs (1=yes, 0 otherwise)
Coef. Robust Std. Err.
z P>z
Poverty category_less poor (1=yes, 0 otherwise) -0.655 0.685 -0.960 0.339Poverty category_ nonpoor (1=yes, 0 otherwise) 1.398 0.589 2.370 0.018**
Respondent is in the rural category (1=yes, 0 otherwise) -1.113 0.585 -1.900 0.057*Respondent age is between 25 and 55 years (1=yes, 0 otherwise) -0.342 0.551 -0.620 0.534Gender of the respondent (1=female, 0 otherwise) -1.699 0.768 -2.210 0.027**Land was inherited only (1=yes, 0 otherwise) -0.987 0.575 -1.720 0.086*Respondent is the household head (1=yes, 0 otherwise) -1.329 0.704 -1.890 0.059*Household size -0.027 0.069 -0.400 0.691Respondent is secure with respect to all parcels (1=yes, 0 otherwise) 1.625 0.792 2.050 0.040**Respondent is secure with respect to some parcels (1=yes, 0 otherwise) 1.724 0.822 2.100 0.036**Respondent has lived and worked elsewhere in the past 10 years (1=yes, 0 otherwise) 0.157 0.593 0.270 0.791Constant -1.182 1.016 -1.160 0.245
Number of obs 390Wald chi2(11) 22.78Prob > chi2 0.019Pseudo R2 0.2147Log pseudolikelihood***significant at the 1% probability level; ** significant at 5% probability level and * significant at 10% probability level.
In Amuru area, being non-poor significantly increases the probability of undertaking agricultural investments or permanent improvements on the parcel by 140 per cent, respondent perceiving tenure security with respect to all parcels by 162 per cent and respondent perceiving tenure security with respect to some parcels by 172 per cent. Meanwhile, rural location, respondent being female and having only inherited land decreases the probability of undertaking agricultural investments or permanent improvements on the land. Rural location decreases the probability of undertaking ag-ricultural investments or permanent improvements by 111 per cent, female gender by 170 per cent

DIIS WORKING PAPER 2013:03
91
and having only inherited land by 99 per cent. It is not clear why a respondent being the household head is significantly associated with a reduction in the probability of undertaking agricultural in-vestments or permanent improvements on the parcel. Table V.2 presents the results for Masaka area.
Table V.2. Coefficient estimates of the determinants of the decision to undertake agricultural investments and/or permanent improvements on the land in Masaka area-respondent levelLogistic regressionRespondent undertook agricultural investments or permanent improvements on the parcels in the last 5yrs (1=yes, 0 otherwise)
Coef. Robust Std. Err.
z P>z
Tenure form_kibanja (1=yes 0 otherwise) 0.694 0.486 1.430 0.153Tenure form_freehold with others (1=yes 0 otherwise) 0.335 0.553 0.610 0.545Tenure form_mailo with others (1=yes 0 otherwise) -0.173 0.594 -0.290 0.771Poverty category_less poor (1=yes, 0 otherwise) 1.048 0.451 2.320 0.020**Poverty category_ non poor (1=yes, 0 otherwise) 2.269 0.492 4.610 0.000***Respondent is in the rural category (1=yes, 0 otherwise) 0.920 0.328 2.810 0.005***Respondent age is between 25 and 55 years (1=yes, 0 otherwise) 0.057 0.344 0.170 0.867Gender of the respondent (1=female, 0 otherwise) -0.150 0.336 -0.450 0.655Respondent is the household head (1=yes, 0 otherwise) 0.705 0.449 1.570 0.116Household size 0.050 0.045 1.110 0.265Respondent is secure with respect to all parcels (1=yes, 0 otherwise) -0.201 0.330 -0.610 0.544Respondent is secure with respect to some parcels (1=yes, 0 otherwise) 0.711 0.548 1.300 0.195Respondent accessed any type of loan (1=yes, 0 otherwise) 0.538 0.390 1.380 0.168Respondent has any type of documentation for the parcels held (1=yes 0 otherwise)
0.356 0.454 0.780 0.433
Repondent has lived and worked elsewhere in the past 10 years (1=yes, 0 otherwise)
0.860 0.410 2.100 0.036**
Constant -3.106 0.852 -3.640 0.000Number of obs 293Wald chi2(15) 56.64Prob > chi2 0.000Pseudo R2 0.1858Log pseudolikelihood -146.5***significant at the 1% probability level; ** significant at 5% probability level and * significant at 10% probability level.
In Masaka area, the factors that significantly and positively influence the probability of undertaking agricultural investments or permanent improvements on the land include respondent being less poor, respondent being non-poor, being of rural location and respondent having lived and worked elsewhere over the past 10 years. Being less poor increases the probability of undertaking agricultur-al investments or permanent improvements by 105 per cent, being non-poor by 227 per cent and being of rural location by 92 per cent. Respondent having lived or worked elsewhere in the past 10 years increases the probability of undertaking agricultural investments or permanent improvements on land by 86 per cent. The reason why rural location has a positive influence on agricultural in-vestments is less clear but might have something to do with the fact that rural is also relative. What might qualify as rural in Masaka may as well pass for urban in the Amuru area. Table V.3 presents the results for Pallisa area.

DIIS WORKING PAPER 2013:03
92
Table V.3. Coefficient estimates of the determinants of the decision to undertake agricultural investments and/or permanent improvements on the land in Pallisa area-respondent levelLogistic regressionRespondent undertook agricultural investments or permanent improvements on the parcels in the last 5yrs (1=yes, 0 otherwise)
Coef. Robust Std. Err.
z P>z
Poverty category_less poor (1=yes, 0 otherwise) 0.264 0.287 0.920 0.356Poverty category_ poorest (1=yes, 0 otherwise) 0.581 0.339 1.710 0.087*Respondent was displaced during the last 10 to 20 years (1=yes, 0 otherwise) 0.084 0.504 0.170 0.868Respondent is in the rural category (1=yes, 0 otherwise) 0.823 0.280 2.940 0.003***Respondent age is between 25 and 55 years (1=yes, 0 otherwise) 0.214 0.305 0.700 0.483Gender of the respondent (1=female, 0 otherwise) -0.358 0.363 -0.990 0.324Land was inherited only (1=yes, 0 otherwise) 0.331 0.352 0.940 0.346Land was got through renting and other means (1=yes, 0 otherwise) -0.699 0.518 -1.350 0.177Respondent is the household head (1=yes, 0 otherwise) -0.567 0.420 -1.350 0.177
Household size -0.012 0.029 -0.390 0.694Respondent is secure with respect to all parcels(1=yes, 0 otherwise) 0.172 0.653 0.260 0.792Respondent is secure with respect to some parcels (1=yes, 0 otherwise) 1.188 0.702 1.690 0.091*Respondent is somewhat secure with respect to all parcels (1=yes, 0 otherwise) 0.263 0.661 0.400 0.690Respondent is somewhat secure with respect to some parcels (1=yes, 0 otherwise) 0.205 0.727 0.280 0.778
Respondent did not get any loans(LOAN1) (1=yes, 0 otherwise) -15.632 0.630 -24.830 0.000***Respondent got loan(s) for non-productive investments only (LOAN2) (1=yes, 0 otherwise) -14.775 0.644 -22.950 0.000***Respondent has comprehensive and precise documentation for all parcels (DOCU1) (1=yes, 0 otherwise) 2.443 0.585 4.180 0.000***Respondent has some and less precise documentation for all parcels (1=yes, 0 otherwise) 1.232 0.542 2.270 0.023**Respondent has some and less precise documentation for some parcels (1=yes, 0 otherwise) 0.748 0.613 1.220 0.222Respondent has no documentation for any parcels (1=yes, 0 otherwise) 0.675 0.543 1.240 0.215Respondent has lived and worked elsewhere in the past 10 years (1=yes, 0 otherwise) -0.661 0.367 -1.800 0.072*Constant 14.246 1.264 11.270 0.000***Number of obs 379Wald chi2(21) 807.76Prob > chi2 0.000Pseudo R2 0.1425Log pseudolikelihood -211.123***significant at the 1% probability level; ** significant at 5% probability level and * significant at 10% probability level.

DIIS WORKING PAPER 2013:03
93
In the Pallisa area, four factors positively and significantly influence the probability to under-take agricultural investments or permanent improvements on land. They are being poor, being of rural location, perceiving tenure as secure with respect to some land parcels and respondent hav-ing precise documentation for all parcels. Rather surprisingly, being poor in Pallisa increases the probability of undertaking agricultural investments or permanent improvements on land by 58 per cent, whereas respondent being located in the rural areas increases the probability by 82 per cent. Respondent feeling secure with respect to some land parcels increases the probability of under-taking agricultural investments or permanent improvements on land by 119 per cent whereas the respondent having some less precise documentation for all his/her parcels increases the probability of undertaking agricultural investments or permanent improvements on land by 123 per cent. Three factors negatively and significantly influence the probability to undertake agricultural invest-ments or permanent improvements on the land including respondent not having obtained a loan, or respondent having secured a loan but for non-productive purposes and respondent having lived and worked elsewhere in the past 10 years. Not accessing a loan most strongly affects agricultural investments or permanent improvements by reducing the probability by 156 per cent. A respond-ent having secured a loan for non-productive purposes reduces the probability of undertaking agri-cultural investments or permanent improvements on land by 148 per cent, whereas the respondent having worked elsewhere in the past 10 years reduces the probability of undertaking agricultural investments or permanent improvements on land by 66 per cent.