Embed Size (px)
Citation preview
51
ISSN: 2162-6359
International Journal of Economics
and
Management Sciences
Vol. 1, No. 1, 2011, pp. 51-74
MANAGEMENT
JOURNALS
managementjournals.org
LAND DISTRIBUTION, TECHNOLOGICAL CHANGES AND PRODUCTIVITY IN
PAKISTAN’S AGRICULTURE: SOME EXPLANATIONS AND POLICY OPTIONS
Muhammad Mahroof Khan
1, Jianhua ZHANG
2, Muhammad Saim Hashmi
3
Muhammad Saim Hashmi 4
1 School of Economics,Huazhong University of Science and Technology, Wuhan, 430074, P.R.China
Email: [email protected] 2 Professor of Economics at School of Economics,Huazhong University of Science and Technology,Wuhan,
430074, P.R. China E-mail: [email protected]. 3 School of Economics, Huazhong University of Science and Technology,Wuhan, 430074, P.R.China
Email: [email protected], 4 School of Economics and Managment,Wuhan University, Wuhan, 430074, P.R.China
Email: [email protected]
ABSTRACT
This paper investigates the structural change, technological innovations and performance of agriculture in
Pakistan from historical perspectives. We used data spanning from1948-2008. The data shows that land
reforms introduced in Pakistan have not made any significant increase in the cultivated area. Only slight
change has occurred in the early seventies. However, they seem to have induced conversion of large into
small farms. As such, the proportion of area under small farms has increased and the ratio of tenancy to
ownership has decreased to some extent. Modern input had the increasing trend in early seventies. The use
of modern varieties of rice and wheat has increased more in Punjab and Sindh than in other provinces.
Similarly, the use of fertilizer and pesticides has also increased overtime. The credit extension in input
subsidies has also increased in the same period. The data also show that the application of new verities of
seeds (Irri rice and HYV wheat) and improvement in agricultural technology are key source of land
productivity growth in Pakistan.
Keywords: Land distribution, Technological change, Farm productivity, Modern inputs, Agriculture credit.
1. INTRODUCTION
The main challenge for development efforts in Pakistan lies in its rural sector, which is suffering from
widespread poverty, rising unemployment, growing income inequalities and disproportionally low health
and education opportunities. Most of these problems arise mainly, if not solely, from the skewed
distribution of land ownership, leading to correspondingly highly unequal distribution of income and social
power (Khan, 1997; Hameed, 2008). Infect, it has rendered the rural society both rigid and iniquitous. A
number of technological problems also arise from extremely uneven distribution of land in Pakistan. For
example, population pressure on unequally distributed land has forced perpetuation of traditional methods
of cultivation, and dominance of small size of cultivation units and tenancy farming, which work ultimately
to block incentives for technological progress. Similarly, many economic problems stem primarily from the
inability of the agricultural sector with inequitable land distribution to provide full employment
opportunities and its resulting failure to yield incomes needed for providing a satisfactory living standard to
the rural population of the country (Chaudhry, 1994; Khan, 2006). Further, rural households with low
income do not have enough saving capacity due to their low incomes to enable adequate capital formation
International Journal of Economics and Management Sciences Vol. 1, No. 1, 2011, pp. 51-54
© Management Journals
htt
p//
: w
ww
.man
agem
entj
ourn
als.
org
52
for raising the productivity of both land and labor and thereby optimizing their potentials (Malik, 2005).
After independence, Stagnation in agricultural production, experienced during immediate post–
independence years and emergence of food deficits in the fifties are attributable not only to the highly
unequal distribution of land and the attendant problems of incentives and constraints of adoption of new
technologies but also to the absence of any integrated policy framework to tackle them. Except for the
construction of some irrigation projects, the agricultural sector failed to stir itself out of a state of inertia.
However, accentuation of shortages of food, foreign exchange and raw material for industrial development
towards the end of the fifties forced the planners to contemplate a policy of agricultural development
(Batsin, 2008; Hamid, 2008). This policy aimed at achieving self-sufficiency in food, increasing production
for both domestic use and export, and reducing unemployment in the country.
The increased emphasis on agricultural and rural development in government policy, during the early
sixties coincided with the advent of the so-called ‗green revolution‘. This revolution started with the
scientific and technological breakthrough in farm of inputs, like high yielding varieties of seeds (HYV),
fertilizers and pesticides, and in rapid expansion of agricultural mechanization leading to assured supply of
irrigation water and farm power from tube-wells and tractors (Kamper, 2003; Kuriakose, 2005; Acumen,
2008).
In Pakistan, the green revolution period can be divided into two sub-periods with regard to the use of these
inputs. During 1960-64, increased water availability due to greater supply of surface water and, more
importantly, rapid expansion in tube-well installations, mostly, in the private sector, was the cutting edge of
development. But in the second phase, i.e., 1964-69, high yielding varieties of seeds, fertilizers, pesticides,
farm mechanization, and continued increases of supplementary water supply contributed to the
breakthrough in the agriculture of the country (Ahmad & Chaudhry, 1987). The liberal subsidization of
inputs and higher output price incentives provided the needed motivation, in the form of higher
profitability, to the farmers for adopting new technologies. The result of these economic incentives and
technological improvements was that while the agricultural sector grew at an annual growth rate of only 1.8
per cent during the first plan period, its growth rate jumped to 3.8 per cent per annum during the second
plan, and to 6 per cent during the third plan period. The peak growth of 11 per cent was registered during
1967-68.
This tempo of high growth rate could not be maintained for long. The rate of agricultural output growth
plummeted from 7.5 per cent per year during 1966-70 to 1.9 per cent during 1970-78. The green revolution
came riding on a wave of significant increases in public expenditure on subsidies, which propelled the
initial state of the breakthrough. But since the concomitant development of support services, like
agricultural extension service, and education and training did not take place, the agricultural sector began,
despite the greater availability of most key inputs like fertilizers, high yielding varieties of seeds and
water, to experience diminishing returns due to inadequate attention paid to their efficient of their use
(Greer, 2006). Further, even land reforms interdicted in the early seventies could not keep the ‗green
revolution‘ from fading due to the institutional failure. However, agricultural production once again
showed a rising trend in the late seventies, mainly because of favorable weather conditions, better input
distribution, and more appropriate farm price incentives.
It has variously been argued that since the overall growth and development of the economy depends largely
on the prosperity of agriculture, effort must be directed to enable it to generate a reasonable marketable
surplus each year so that the needs of abundant supply of cheap food and fiber, large volume of exports and
rising incomes of people connected with agriculture for them to be able to absorb a reasonable proportion
of industrial output are fulfilled satisfactory (Hamid, 2008). Unfortunately, the role of agriculture was not
viewed in this perspective in the 1950s and 1960s. Industrialization was considered the key to economic
development. The result was that agriculture stagnated and the industrial sector lost its major source of
support. Economic development of the country thus came to a standstill. Although the potential role of the
agricultural sector began to be emphasized in the 1970s, natural disasters combined with inefficient
government policies acted to restrict the growth of agriculture to a low level. Nevertheless, the performance
of the sector during the 1980s was fairly impressive. The government seemed to have realized then the

International Journal of Economics and Management Sciences Vol. 1, No. 1, 2011, pp. 51-54
© Management Journals
htt
p//
: w
ww
.man
agem
entj
ourn
als.
org
53
potential of this sector and some progress has since been made in formulating an effective long-term
strategy for the encouragement and support of all forms of agricultural activity.
This paper reviews the performance of the agricultural sector over the past sixty years and then discusses
some of the important issues facing this sector.
2. AGRARIAN SYSTEM
The agricultural sector of Pakistan is characterized by highly differentiated and asymmetrical structures and
relationships between production and ownership of means of production, specially land and capital. These
differences among various categories of land ownership have led to and are a reflection of the capitalist
development of agriculture. Broadly, the present agrarian groups in the country may be classified into five
categories.
Firstly, there are landlords who own large areas of land. They generally rent out their lands to landless
sharecroppers. They neither work for themselves nor provide their labor resources to others. Yet, they
determine the division of the produce raised by tenants on their own considerations. Tenants, in general, are
compelled by circumstances of lack of alternative work opportunities and resources to accept the terms
dictated by landlords. In Sindh and to be relatively less extent in other provinces, for example,
sharecroppers play no role in production decisions. Land as a primordial traditional factor without any
economic considerations plays a central role in determining the landlords-tenants relationships.
Secondly, there are owner-operator farmers, who reveal considerable heterogeneity opposite to the general
impression of absolute homogeneity of their interests. Normally, these farmers may own most or some of
the land; they cultivate and also rent in or get some land on lease from other owners.
Thirdly, it is the class of family farmers called middle peasants, who may own, rent in or lease a part of the
cultivated land. These landowners, however, depend almost entirely on their family labor for production.
Generally, they neither work for others nor seek others to work for them.
Fourthly, it is the class of sharecroppers, who are called ―haris‖ in Sindh. They also include poor peasants
or marginal landowners. They rent, cultivate and share the output with landlords. They depend almost
entirely on their household labor. At times, they work for landowners on wages to supplement their meagre
income. They account even at present for an important component of the feudal system.
The final class is of wageworkers. This class includes landless households who work on wages for others,
particularly for rich, capitalist farmers. They may be remunerated in cash or in kind. They may work as
permanently hired or as seasonal labor. They make both ends meet by working in and out of the agricultural
sector. These workers constitute the burgeoning proletariat for agriculture and industry.
How the structure of land ownership changed in Pakistan overtime has may be interesting to know. Table 1
shows that although the share of landowners with over 100 acres has declined overtime both in number and
area, they still own disproportionately large share of the cultivated area of Pakistan. Conversely, the area
cultivated by the other categories of farmers has increased. The share, for instance, of farmers owning less
than 5 acres of land, which they operated in 1960, has increased from 5 percent in 1972 to 9 percent in
1980 and 11 percent in 2000. Similarly, Table 2 shows the distribution of land by tenure. The area
cultivated by the smallest owner operators in farms size of less than 5 acres has increased from 43 percent
in 1960 to 56 percent in 1972 and then to 65 percent in 1980 and 67 percent in 2000.
What is general has happened in the distribution of land during 1960 to 2000 is that size classes operating
less than 12.5 acres have gained area. There is a qualitative difference in this change that occurred between
the 60s and the 70s, and the 70s and 80s and 2000s. Between 1960 and 1972, the two large size classes
above 50 acres and not the two middle size classes between 12.5 and 50 acres have lost area to the small
size classes under 12.5 acres during the inequality of operated area but not significantly where as the
reverse of it happened between 1970, 1980 and 2000. It may thus be seen that the large farm sizes remained
constant but the small farm sizes below 12.5 acres gained net area between 1972 and 1990 increasing
inequality of operated area during this period.
International Journal of Economics and Management Sciences Vol. 1, No. 1, 2011, pp. 51-54
© Management Journals
htt
p//
: w
ww
.man
agem
entj
ourn
als.
org
54
It is also important to know what changes in area operated have occurred between 1980 and 1990. The
middle size classes between 12.5 and under 25 acres also gained area. It is this gain by the largest size class
over the 80s compared to its loss over the 60s, and stability over the 70s, which has lead to increase in
concentration of land in the country.
This increase in concentration over the 90s is noticeable clearly from Table 3 & 4. These tables show that
the mean area of both losing size classes, i.e. those of 12.5 acres and 50 acres and land gaining size classes
i.e. below 12.5 acres, has decreased over time due to increase in their number. However, the mean area of
the largest size class of above 150 acres has increased over time by 8 acres between 1972 and 1980, and by
27 acres between 1980 and 2000. So, it is these gains in area percentage share in land mean farm size by
the largest size class above 150 acres which account for increase in concentration of operated area over the
last two decades, especially during the 80s.
Tenurial status of farmers has also experienced changes over time. The major tenurial change between
1960 and 1980 is that a reduction in the percentage of tenant cultivated area in each farm size has been
accompanied by a concomitant increase in that of owners. Between 1960 and 1972, tenants in each size
class lost area, while owners cum tenants gained. Between 1972 and 1990, all tenants and owners cum
tenants lost area. If this change is aggregated, the percentage of tenant area decreased from 39 percent in
1960 to 30 in 1972 and then to 22 in 1980 and 18 percent in 2000. The total number of tenants decreased
from 44 percent of the operators in 1960 to 35 in 1972 and to 26 in 1990. In other words, the proportional
number and area of tenants decreased by approximately 10 percent in each decade, reducing their number
to half of them by 1990. The concentration of operated area between 1960, 1972 and 1990 is explained by
tenants falling out of the distribution and their area being resumed by the owners.
Distribution of farm size is skewed1 in Pakistan. According to the Census of Agriculture 2000, there are
about 6.3 million farms in the country and their average size is 3.23 hectors and about 86.2 percent are
under 5 ha., accounting for 38.5 percent of farm area; 7.8 percent are medium size and account for 16.2
percent of the area; and about 6 percent are large and take up more than 45.3 percent of the area Table 3.
About 6.6 millions are operational units. About 85.7 percent are small operators and area under their
operation is about 43.4 percent of the farm area, while 8.8 percent medium size farm operators share about
19.1 percent. About 5.6 percent consider the large farm and they cultivate 37.5 percent of the area Table 4.
Regarding self plowed, about 77.6 percent of the farms are operating 73.3 percent of the total area.
Similarly, 14.5 percent of the area is cultivated by 8.4 percent owner-cum-tenants and the remaining 14
percent of farms are running by small tenants Table 5.
In a country like Pakistan, where most cultivators are either landless or most of the land is owned in large
parcels by small numbers of households, a transfer of substantial land to the former groups can extend the
peasant system or even transform it into a co-operative (co-operatized) farm system. On the other hand, a
land reform programmed can also promote, rather than retard, the development of capitalist agriculture by
creating necessary pressures on landlords by policy measures without redistributing land to landless share-
croppers and poor peasants. There is substantial evidence that the land reforms of 1972 may have
contributed to this tendency without strengthening the peasant system (Mahmood 1993 and Khan 2006).
The progress of implementation of land reforms may be seen from Table 6. It seems that land reforms
introduced in the country have not exercised any significant impact in terms of increase in the total
cultivated area Figure 1. However, they seem to have affected the distribution land by different size
categories of farms.
3. AGRICULTURE TECHNOLOGY AND INPUTS
Agricultural technologies have popularly been classified as mechanical technologies and biological
technologies. Mechanical technologies relate generally to those technologies which are embodied in
machines and appliances such as tractors, tube-wells, threshers, diggers, combine, etc. used in performing
different farm operations. Typically, mechanical technologies enable farmers to expedite farm operations
and thus enable the same labor to cultivate more land and increase cropping intensity. Similarly, diffusion
of these technologies results not only in higher cropping intensity but also in quick planting and harvesting
1 Over time the situation may have improved, nonetheless, the distribution is still perceived to be skewed.
International Journal of Economics and Management Sciences Vol. 1, No. 1, 2011, pp. 51-54
© Management Journals
htt
p//
: w
ww
.man
agem
entj
ourn
als.
org
55
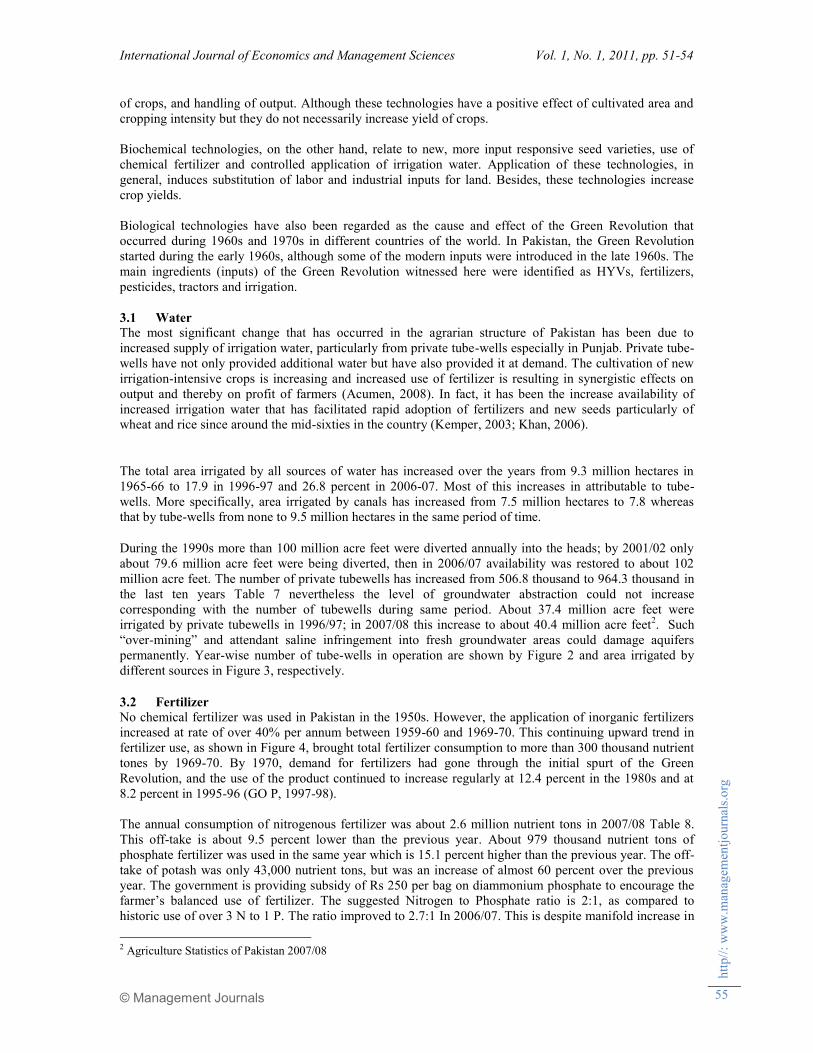
of crops, and handling of output. Although these technologies have a positive effect of cultivated area and
cropping intensity but they do not necessarily increase yield of crops.
Biochemical technologies, on the other hand, relate to new, more input responsive seed varieties, use of
chemical fertilizer and controlled application of irrigation water. Application of these technologies, in
general, induces substitution of labor and industrial inputs for land. Besides, these technologies increase
crop yields.
Biological technologies have also been regarded as the cause and effect of the Green Revolution that
occurred during 1960s and 1970s in different countries of the world. In Pakistan, the Green Revolution
started during the early 1960s, although some of the modern inputs were introduced in the late 1960s. The
main ingredients (inputs) of the Green Revolution witnessed here were identified as HYVs, fertilizers,
pesticides, tractors and irrigation.
3.1 Water
The most significant change that has occurred in the agrarian structure of Pakistan has been due to
increased supply of irrigation water, particularly from private tube-wells especially in Punjab. Private tube-
wells have not only provided additional water but have also provided it at demand. The cultivation of new
irrigation-intensive crops is increasing and increased use of fertilizer is resulting in synergistic effects on
output and thereby on profit of farmers (Acumen, 2008). In fact, it has been the increase availability of
increased irrigation water that has facilitated rapid adoption of fertilizers and new seeds particularly of
wheat and rice since around the mid-sixties in the country (Kemper, 2003; Khan, 2006).
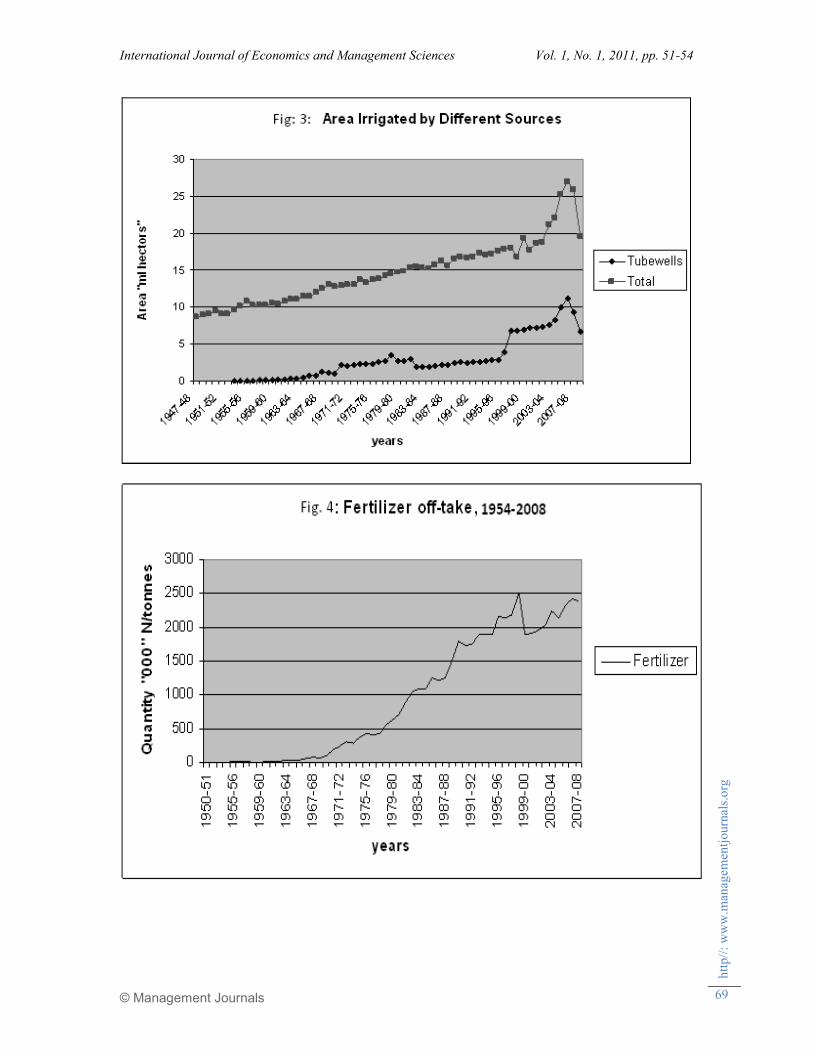
The total area irrigated by all sources of water has increased over the years from 9.3 million hectares in
1965-66 to 17.9 in 1996-97 and 26.8 percent in 2006-07. Most of this increases in attributable to tube-
wells. More specifically, area irrigated by canals has increased from 7.5 million hectares to 7.8 whereas
that by tube-wells from none to 9.5 million hectares in the same period of time.
During the 1990s more than 100 million acre feet were diverted annually into the heads; by 2001/02 only
about 79.6 million acre feet were being diverted, then in 2006/07 availability was restored to about 102
million acre feet. The number of private tubewells has increased from 506.8 thousand to 964.3 thousand in
the last ten years Table 7 nevertheless the level of groundwater abstraction could not increase
corresponding with the number of tubewells during same period. About 37.4 million acre feet were
irrigated by private tubewells in 1996/97; in 2007/08 this increase to about 40.4 million acre feet2. Such
―over-mining‖ and attendant saline infringement into fresh groundwater areas could damage aquifers
permanently. Year-wise number of tube-wells in operation are shown by Figure 2 and area irrigated by
different sources in Figure 3, respectively.
3.2 Fertilizer
No chemical fertilizer was used in Pakistan in the 1950s. However, the application of inorganic fertilizers
increased at rate of over 40% per annum between 1959-60 and 1969-70. This continuing upward trend in
fertilizer use, as shown in Figure 4, brought total fertilizer consumption to more than 300 thousand nutrient
tones by 1969-70. By 1970, demand for fertilizers had gone through the initial spurt of the Green
Revolution, and the use of the product continued to increase regularly at 12.4 percent in the 1980s and at
8.2 percent in 1995-96 (GO P, 1997-98).
The annual consumption of nitrogenous fertilizer was about 2.6 million nutrient tons in 2007/08 Table 8.
This off-take is about 9.5 percent lower than the previous year. About 979 thousand nutrient tons of
phosphate fertilizer was used in the same year which is 15.1 percent higher than the previous year. The off-
take of potash was only 43,000 nutrient tons, but was an increase of almost 60 percent over the previous
year. The government is providing subsidy of Rs 250 per bag on diammonium phosphate to encourage the
farmer‘s balanced use of fertilizer. The suggested Nitrogen to Phosphate ratio is 2:1, as compared to
historic use of over 3 N to 1 P. The ratio improved to 2.7:1 In 2006/07. This is despite manifold increase in
2 Agriculture Statistics of Pakistan 2007/08

International Journal of Economics and Management Sciences Vol. 1, No. 1, 2011, pp. 51-54
© Management Journals
htt
p//
: w
ww
.man
agem
entj
ourn
als.
org
56
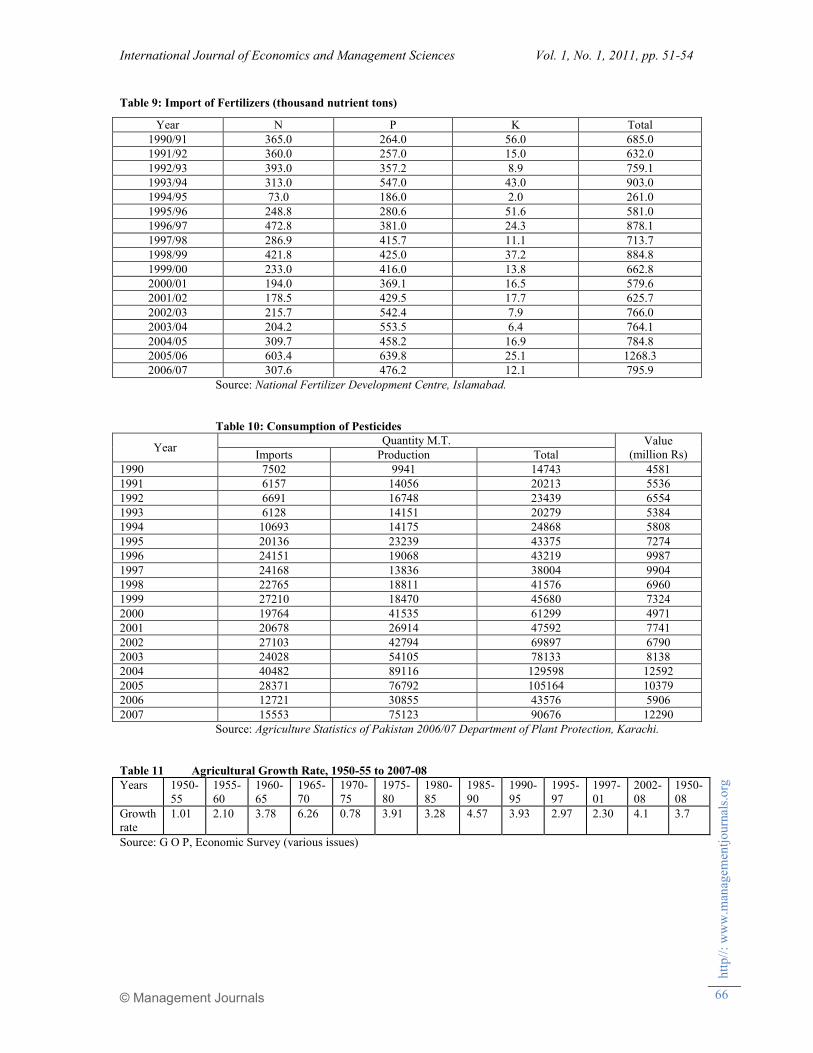
the price of phosphatic fertilizer. The gap between local production and consumption is filled through
imports by the public and private sectors. Table 9 shows that Pakistan has been importing on average about
700,000 nutrients MT in a year.
3.3 Tractors
The impact of mechanical technologies on agricultural growth and agrarian structures has been a
controversial issue in Pakistan. This applies particularly to the use of tractors. Despite the continued
controversy over their impact, the number of tractors has increased rapidly since the mid sixties Figure 2.
The argument in favor of encouraging farm tractors is that they affect positively cropping intensity, yields
level, land preparation and post-harvest operations. However, opinions differ widely on their positive
effects, particularly on yield level and cropping intensity. Some economist also content that large-scale
tractorization in Pakistan has resulted in labour displacement, tenant eviction and expansion of already
large landholdings (Malik, 1994; Khan, 2006). This argument implies that rich peasants and big landlords
are increasingly finding it profitable to encroach on the land of poor peasants and sharecroppers hence
occasioning undue concentration of land.
The process of tractorization, dominated by large tractors, was initiated by pressure from large landowners.
It has, in turn, resulted in the concentration of tractor ownership on the one hand and in increased pressure
for expansion in area operated by large landlords and rich peasants, on the other. The government has so
for closely regulated the tractor market. Public policy has so far consistently favored the import and use of
large tractors. The government has also provided handsome incentives for the purchase of tractors by
reducing import duties and taxes. These incentives are in addition to the low interest loans advanced by the
Agricultural Development Bank of Pakistan.
Tractors in operation increased at an average rate of over 14 percent during the 1970s, and 13 in the first
half of the 1990s. The growth of tractors had dropped during the late 1990s. Probably because most of large
farmers had by this time already equipped them with the necessary farm equipments. The mechanization of
smaller farm holdings is not easy, because almost all farm machines accessible in Pakistan are basically
designed to operate on large farm holdings. However, smaller tractors are now becoming popular and
possibilities of their manufacturing in Pakistan are being explored. Despite the growth of tractors and tube-
wells the availability of farm power in Pakistan is estimated still as much below the optimal level and many
tasks on the majority of landholdings are still being performed manually Malik (1994).
The reported tractors in the country are about 400,500 in which 83 percent are in the Punjab province3. The
majority of farmers use tractor-drawn blades, ridgers to prepare seed beds and cultivators. The other most
common use is tractor-operated threshers, and haulage of inputs and produce from and to market. Tractor-
drawn implements such as mould board plow; seed planters, fertilizer dusters, pesticide spraying, and
harvesting are in limited use. To encourage mechanization, the import duty on agricultural machinery is
kept at the minimum.
3.4 Pesticides
Pest attacks are a major factor in low level of agriculture production in Pakistan. The beneficial effects of
all other inputs may wipe out with in a couple of days if pests break out. The use of pesticides in Pakistan
is, however; not as widespread as it should be. The need for increased use of pesticides has become greater
as the use of fertilizers and improved seeds have increased. Pest attacks are generally more likely to occur
in plants nurtured by fertilizer and cultivated from HYV seeds.
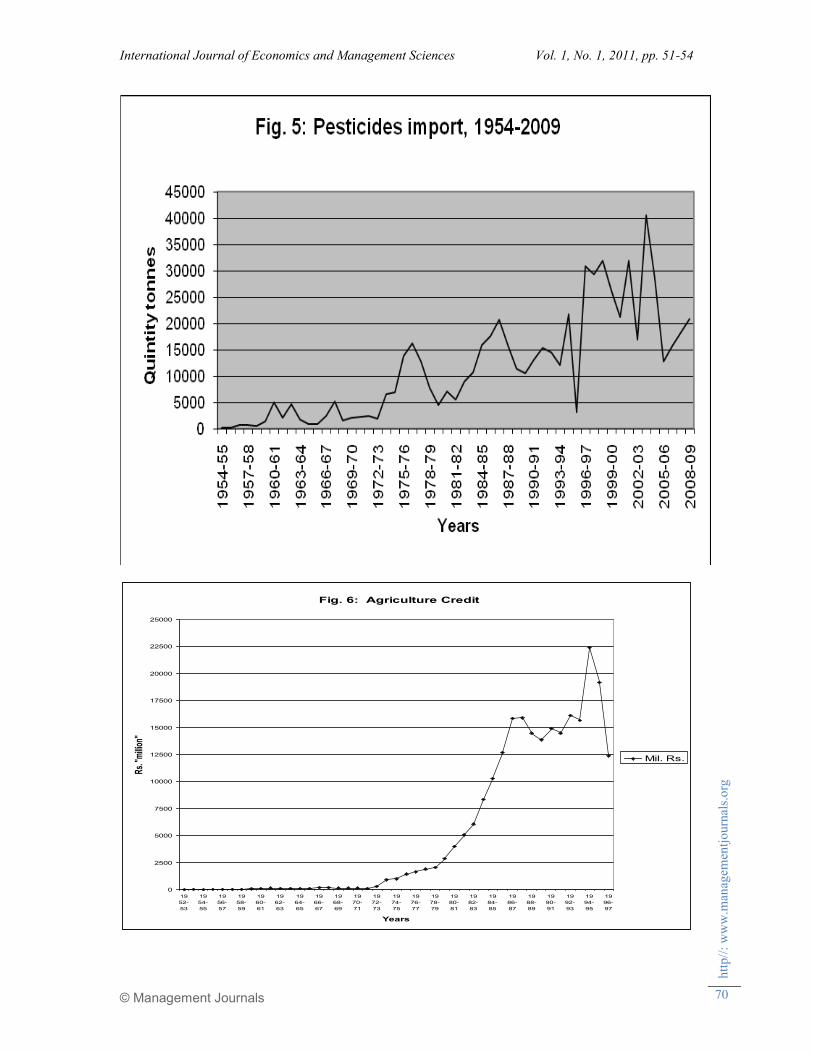
Imports of pesticides grew fast during 1952-53 to 1959-60. However, this growth rate was deceptive,
because imports began to increase from a very low level. In fact imports of pesticides in quantity began in
1972-73 Figure 5. Yet quantities imported fluctuated widely from year to year, as there were no organized
system of plant protection in Pakistan. Further, farmers have often not been able to afford the expenditure
required for the needed application of pesticides. Consequently, pesticide take off has varied widely
overtime in country.
3 Agricultural Statistics of Pakistan 2006/07: Table 116

International Journal of Economics and Management Sciences Vol. 1, No. 1, 2011, pp. 51-54
© Management Journals
htt
p//
: w
ww
.man
agem
entj
ourn
als.
org
57
During 2006/07, 15,500 MT of pesticides were imported, while 75,000 MT were locally formulated Table
10. Most of the farmers generally use pesticides without giving consideration to the infestation level and
often spray the crop unnecessarily. The indiscriminate use of a wide range of pesticides is creating health
and environmental hazards. The extension departments in the provinces need to circulate required
information regarding the safe and correct methods of pesticide application.
3.5 Agricultural Credit
Farm credit is a major source of acquiring new technology for an efficient and profitable agriculture, and
the key determinant of the level of production (Khan, 1997; Zuberi, 1989). Income from harvests in
Pakistan generally comes only twice a year and is subject to fluctuations. Farm households, thus, rely on
borrowing to tide over periods between harvests and poor crops. First farmers fulfill consumption
requirements from production and then sell the surplus to buy inputs from the market. However, the
growing popularity of ''HYV agriculture'' has enhanced the importance of rural credit significantly. Farmers
now need credit in ever-increasing amounts to finance timely purchases of modern inputs and farm
implements. Credit helps not only in removing financial constraints but also provides incentives to growers
for adopting new technology and practices with new aspirations and horizons, provided it is properly
delivered (Rao & Khan, 1991; Malik, 1991). However, the clientele of the rural credit markets are an often-
small farmer who often fined it difficult to fulfill the collateral requirements of the lending institutions. In
order to facilitate the adoption of ''HYV'' technology amongst small farmers, the government has disbursed
large amounts of credit often at highly subsidized rates. The trend of credit disbursement is depicted by
Figure 6. Peak expansion rate of credit was observed during the 1970s. The rural credit expansion rate was
estimated at 42 percent per year during 1969-70 to 1976-77. Such a surge in rural credit during this period
was due to the nationalization of the commercial banks (Qureshi, et al., 1992; Bastin 2008). Nationalization
of banks aside, overall agricultural credit has tended to increase at an annual average rate of 25 percent over
the period from 1965-66 to 2006-07 which has been higher than the average growth rates of all the other
agricultural inputs.
4. AGRICULTURAL OUTPUT AND GROWTH Agricultural output has increased irregularly in Pakistan. It has grown at fast rates in some years and at
slow rates in others. Table11 shows that the growth rates of output barely in excess of 1.0 percent per
annum during the early 1950s and just over 2 per cent during 1954-55 to 1959-60. However output growth
rates increased continuously during the sixties. Specifically, agricultural output increased at an annual
growth rate of 3.8 per cent during the first half and at 6.3 percent during the second half of the sixties.
These accelerated growth rates resulted mainly from rising growth rates of crop production, although other
sectors of livestock and forestry have also contributed to the increased growth of output of agriculture.
During the early seventies, the annual growth rate of agricultural output declined to the historically lowest
level of 0.8 percent. While crop production had a growth rate of 0.5 per cent, output of rice, cotton and
sugarcane fell persistently. Except for poultry, the livestock sector also demonstrated equally disappointing
performance. However, the agricultural growth revived after the mid-1970s and both the crop and livestock
sector registered respectable growth rates of over 4.0 per cent and 3.0 per cent, respectively.
The livestock and non-cereal crops have since around 1980s emerged as the prime mover of agricultural
growth. The livestock sector registered annual growth rate of about percent compared to the overall
agricultural output growth rate of 3.3 per cent. Cotton has been another factor in improved output
performance of the agriculture. It showed 6.7 per cent growth rate. By contrast, growth rates of entire crop
sector and cereal crops were estimated at less than 3 and 2.0 per cent, respectively. During the period of
1984-85 and 1989-90, cotton and livestock production witnessed further accelerated growth and thereby the
overall growth of agricultural output. When the growth rate of cotton was rising, growth rate of wheat
showed some recovery but those of sugarcane and rice remained very low. In the 1990s, the agricultural
growth rates fell further to less than 4.0 in 1989-90 and to 3.0 percent in 1994-95 and 4.1 percent in 2000-
08. This was primarily due to slower growth rates of cotton, rice and wheat. Although sugarcane and
livestock showed improved output performance but it was not adequate enough to offset the decline in
performance of cotton, wheat and rice. Consequently, agricultural output growth subsided during the 1990s.
Over the past sixteen years, Agriculture has grown at an average rate of 3.7 percent per annum. However,

International Journal of Economics and Management Sciences Vol. 1, No. 1, 2011, pp. 51-54
© Management Journals
htt
p//
: w
ww
.man
agem
entj
ourn
als.
org
58
volatility in the sector is high, with the range of growth varying between 6.5 percent and 1.0 percent. The
fluctuation in overall agriculture has been largely dependent on the contribution of major crops.
5. AREA, PRODUCTION AND YIELD OF WHEAT AND RICE
Wheat accounts for a staple crop in Pakistan. Continues increase in its output is pursued as a policy goal in
the country (Bastin, 2008); Dorosh, 2006; Siddiqui, 2007) and its historical production is examined below.
Wheat production fluctuated widely during the 1950s due to the ravages of floods, pest attacks, and, on
occasion, prolonged droughts. Like production, area planted to wheat also fluctuated but to a lesser extent.
As such, downswing in production of wheat during the 1950s was not so much due to any reduction in its
area but to a sharp drop in its yield. Wheat area has generally accounted for 30 to 35 percent of total crop
area in Pakistan. Between 1954-55 and 1959-60, wheat production grew at an annual average rate of just
over 4 percent but at rate of over 3 percent during early 1960s. This out put growth was due to continuous
increase in its area Figure 7. However, during the later half of the 1960s the production grew at an annual
average rate of more than 12 percent as a result of combined increase in both areas and yield (GOP, 1968).
Secular increase in yield per hectare is shown in Figure 8. Such a high growth rate was followed by low
rate of 1.3 percent per annum for the period 1979-80 to 1984-85. Severe drought in 1986-87 and again in
1991-92 has been among the factors responsible for frequently fluctuating wheat yield in the country.
Unlike wheat, rice has generally shown a rather consistent output performance with amplitudes of its
production much smaller those of wheat and cotton over the year (Siddiqui, 2007). Rice generally occupied
about 10 percent of the national cropped area. Rice production increased at an average rate of 2.7 percent
per annum from 1947-48 to 1954-55 and at 5.3 percent from 1959-60 to 1964-65. The latter rate of increase
has been caused partly by the introduction of new rice seeds (IRRI) whose yield increased by 9 percent in
1967-68 and by more than 24 percent in 1968-69 when the Green Revolution was in full swing. As could
have been expected, such an increase in yield of rice could not be maintained for long. Rice production
growth diminished the 1970s along with the fading of the Green Revolution. Its growth rate fell to 2.3
percent during 1969-70 to 1976-77 and could not increase subsequently. Consequently rice production
targets could not be achieved during 1987-88 to 1989-90 (GOP, 1989-90). The estimated trend rates of
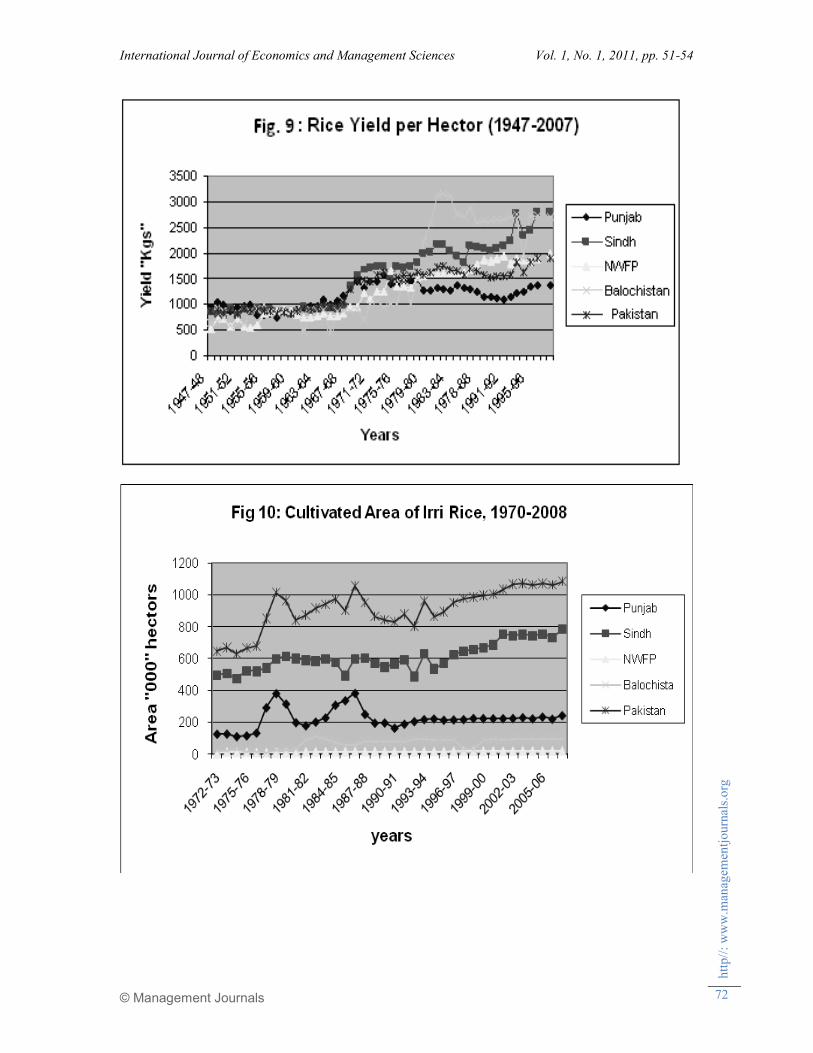
yield levels show some interesting change. As a whole the yield levels have increased only modestly in the
last fifty years. By comparison, wheat yield rose by 2.8 percent and that of rice by 2.1. In the first 8 years
after 1947, the crop yields tended either to be static or to fall. However, yields increased significantly
during the 15 years following 1959-60 Figure 9. Since 1980, the wheat yield has maintained an annual
growth rate of 1.8 percent and rice 0.8.
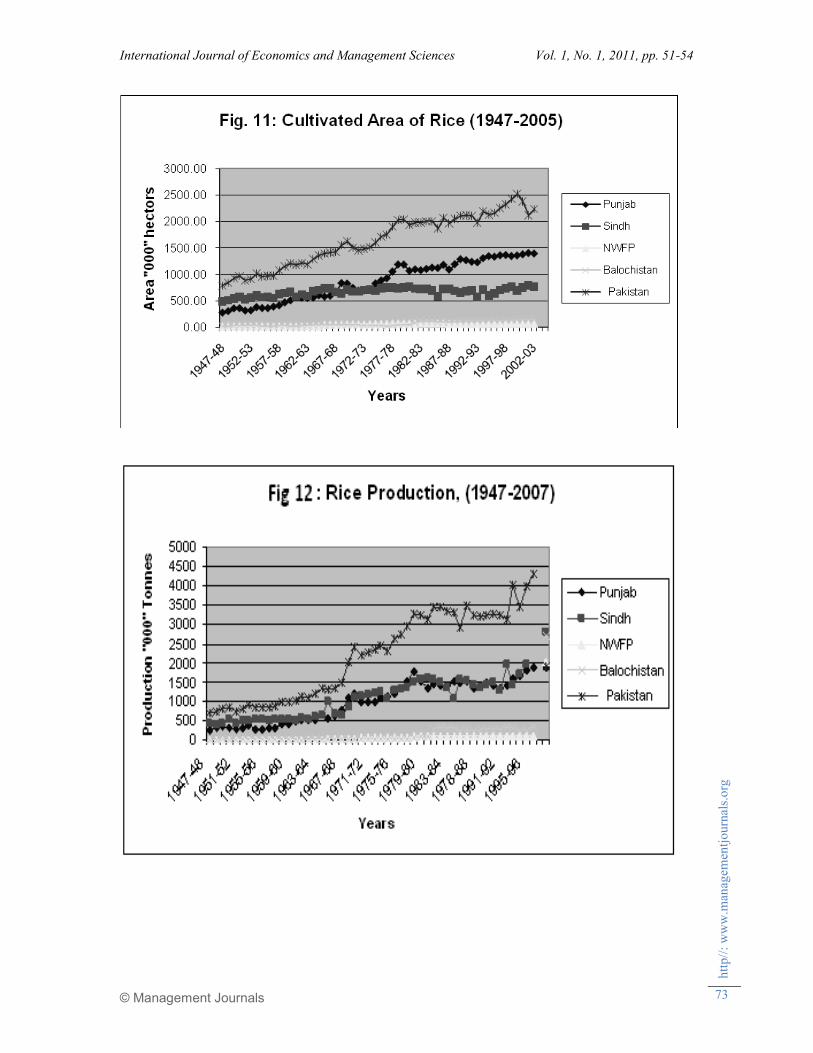
Introduction of modern varieties of wheat and rice brought about significant changes in Pakistan‘s
agriculture. The adoption of the Irri rice varieties in different province of Pakistan is shown in Figure 10.
Punjab and Sindh adopted these newly introduced seeds more rapidly than Baluchistan and NWFP and also
exceeded them in cultivated area Figure 11. It is worth mentioning that a considerable proportion of
increase in rice production in the post land reforms period resulted from both increased area and yield of
new varieties Figure 12.
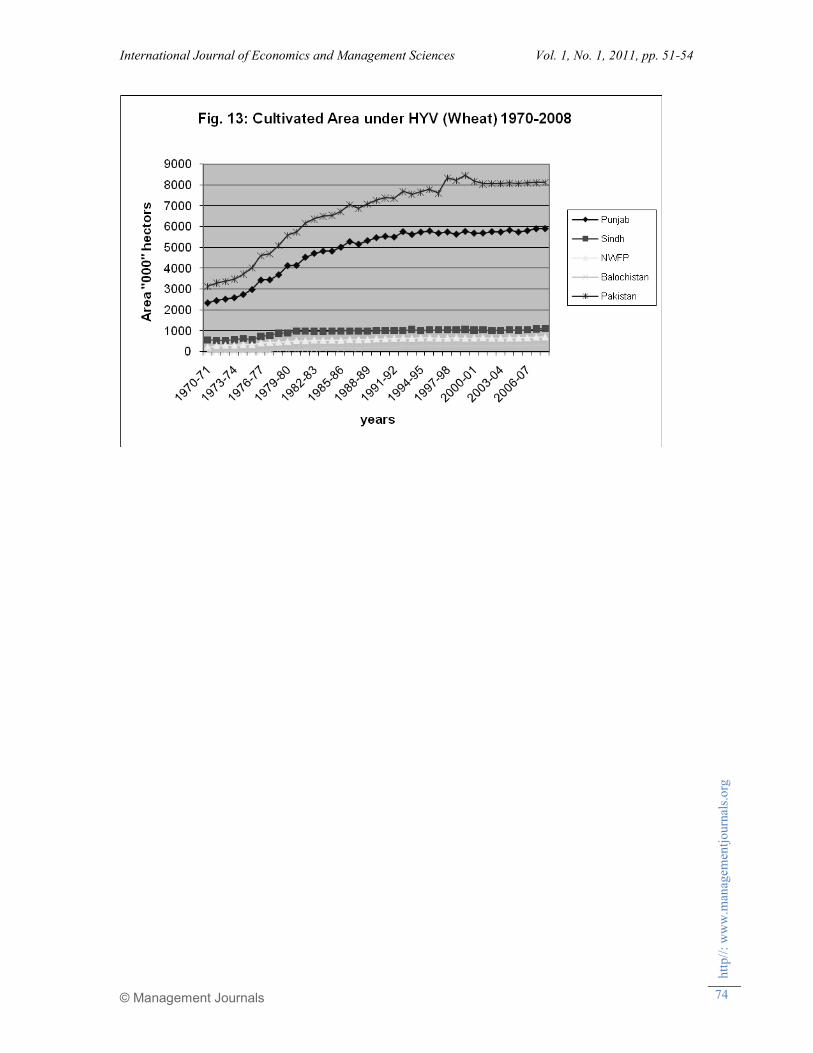
The adoption of new seeds of wheat in different provinces of Pakistan has been shown in Figure 13. The
rate of its adoption in Punjab and Sindh has been in considerable excess of that in Baluchistan and NWFP.
As in rice, the production of wheat as showed in Figure 7 also increased considerably in the post land
reforms period.
From the past 16 years, wheat production has increasing trend. About 8.6 million hectors cultivated area in
which 85 percent is irrigated and 97 percent is under high yielding varieties of seeds. Research yields for
irrigated bread wheat production are around 6,130 kg per hector.—low compared to international best
practice (e.g., Australian growers using irrigation in a similar production environment regularly obtain
yields of 8,000 kg per hector). The national average for the past five years has been 2,770 kg per hector.
Barani yields reach 1,530 kg per hector (about half the irrigated yields). Total production is about 23.3
million tonnes, of which 98 percent is based high yielding varieties of seeds. About 85 percent of
production occurs in Punjab (75percent and Sindh (11percent).
Pakistan‘s rice production generally shows a 16-year increase, 30 totaling 5.5 million tonnes from 3.2
million tonnes. Basmati varieties provide a high quality export that positions Pakistan favorably over

International Journal of Economics and Management Sciences Vol. 1, No. 1, 2011, pp. 51-54
© Management Journals
htt
p//
: w
ww
.man
agem
entj
ourn
als.
org
59
volume exporters like Vietnam. A key competitor is Thailand, whose ―hom malis‖ – a fragrant rice variety-
-has high export acceptance. This is due partly to land reforms and partly to technological advancement.
6. AGRICULTURAL PRICE POLICY AND ADOPTION OF NEW TECHNOLOGIES
A price policy may serve as an incentive for farmers to increase their production. There is convincing
evidence in Pakistan that a shift from an unfavorable to a favorable price policy for agriculture was the
main motivating force behind the Green Revolution in Pakistan (Aresvik, 1967; Dorosh, 2006). Some
important dimensions of the domestic agricultural price policy are discussed below.
6.1 Input Subsidies
Pakistan has subsidized agricultural inputs since the mid-1950s. Initially, chemical fertilizer was subsidized
in order to popularize its use (Naqvi, 1989; Khan, 2006; Hamid, 2008). The list of subsidized inputs and the
rate structure of the subsidies were expanded in later years so that towards the end of the sixties, almost all
the agricultural inputs including fertilizers, insecticides, seeds, irrigation water, tube-well installations, and
the operation and purchase of tractors and tractor-related equipment were subsidized in one or the other
form (Aresvik, 1967; Kuhnen & Fritjof, 1989). In the 1970s, subsidies were curtailed to some extent in
response to input price increases that occurred in the wake of world worldwide recession, oil embargo,
credit crunch, war with India, and steep devaluation of Pakistani Rupee (Chaudhry, 1982). Although
subsidies were applicable to most inputs during the seventies, government decided to under pressures from
the IMF and the World Bank resolutely remove them from the beginning of the 1980s (GOP, 1980). As a
consequence, there was a total withdrawal of subsidy from seeds, insecticides, tubewells, and tractors.
Phased withdrawal of fertilizer subsidy was also under taken, culminating in the case of nitrogenous
fertilizers in 1984-85 and in the case of phosphoric and potash fertilizers in 1989-90 (World Bank, 1996).
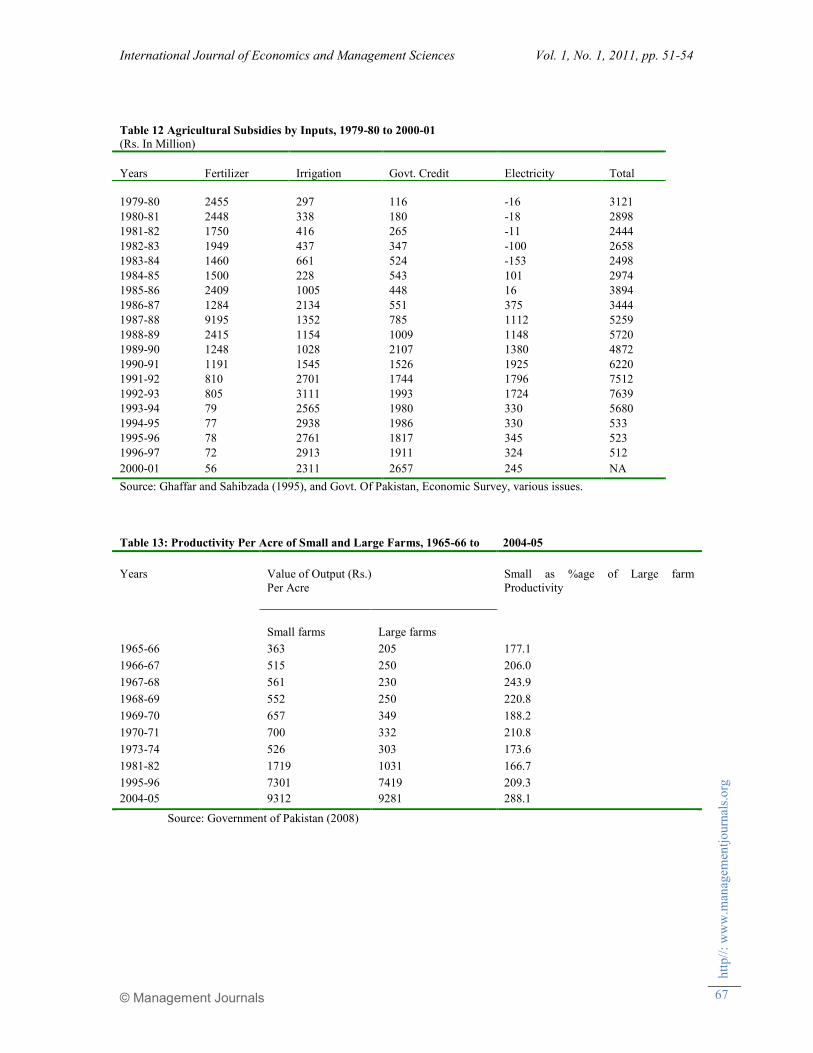
A perusal of relevant data on subsidies presented in Table12 can enable many arguments. First, the input
subsidies trended continuously up over the period under consideration. Second, in the case of implicit
subsidies, irrigation water accounted for as large a share as almost 60 percent of the total subsidy, followed
by institutional credit and electricity. Third, many land arguments about the size of the agricultural input
subsidies have been made in most of the government meetings and public forum, they hardly exceeded Rs.
2 to 3 billion for most of the period, and never exceeded Rs. 8 billion a year. Finally, as a percentage of
budgetary expenditure, total subsidies on agricultural inputs fell from nearly 10 percent in 1979-80 to 1.5
percent in 2000.
7. TECHNOLOGY AND GROWTH
It is variously argued that the technology makes a positive contribution to higher growth rate of agriculture.
For instance, there is documented evidence of private tube-wells installations increasing cropping intercity
by 50 percent (Muhammad, 1965). The shorter duration of the high-yielding varieties (HYVs) of wheat and
rice and the availability of chemical fertilizers have produced similar results (Gill, 1973). The quickness of
operations permitted by tractor cultivation augmented the cropping-intensity effects of tube-wells and
HYVs (Lawrence, 1970). The yield-increasing effects of the above technologies were equally important.
Each of the tube-wells and HYVs of wheat and rice raised crop yields by 50 percent (Muhammad, 1965;
Gill, 1973). The new varieties of cotton, introduced in the 1980s, have a yield potential of 3 to 4 times that
of the traditional varieties (Chaudhry 1994 and Chaudhry 1995).
8. LARGE VS SMALL FARM PRODUCTIVITY
There is impressive empirical evidence on the inverse relationship between the farm size and its
productivity in agriculture (Ruttan, 1969; Dorner, 1972; Cornia, 1985; Johnston & Tomich, 1985).
Empirical evidence in Pakistan also lends support to the inverse relationship between farm size and
agricultural productivity (Chaurdry, 1982; Naqvi, Khan & Chaudhry, 1989; Sharif et al., 1986; Hai 1997).
Some of the factual information in this regard has been depicted in Table13. It is apparent from this table
that the gross productivity of the small farms has been consistently higher than that of the large ones
between 1965-66 and 2004-05. In the light of the above, there is no room for the assertion that the large
farms overtook the small farms in farm productivity under the Green Revolution. Indeed, the differences in
the adoption rates of various modern technologies between the two groups have narrowed with the passage
of time.
It is argued that the major difference in farm investments of larger and small farmers lies in their ownership
of tube wells and tractors. According to the 1980‘s Census of Agriculture, large farmers owned nearly 59

International Journal of Economics and Management Sciences Vol. 1, No. 1, 2011, pp. 51-54
© Management Journals
htt
p//
: w
ww
.man
agem
entj
ourn
als.
org
60
percent of the tractors and about 39 percent of the tube-wells. By contrast, the small farmers owned only 16
percent of the tractors and 35 percent of the tube-wells (GOP, 1985). However, the situation of small
farmers with respect to farm water and power on their increased access to custom sales of tube well water
and tractor services. Accounting for this fact, nearly 35 and 32 percent of the small farmers were users of
tractors and tube-wells. By contrast, the respective percentages were 44 and 33 for the large farmers.
As far as the adoption of bio-chemical technologies is concerned, both the large and small farms used
HYVs with almost the same proportion by the early seventies (Chaudhry, 1996). It may be interesting to
note that the HYVs of wheat accounted for 68 percent of wheat acreage in 1980, on both the small and
large farms. By contrast, the small farms devoted nearly 54 percent of their rice area to HYVs of rice
compared to 44 percent on large farms (GOP, 1983). Whatever differences in the rates of application of
fertilizer on large and small farms existed in the Sixties, they were greatly reduced by the early 1980s
(Naqvi, Khan & Chaudhry, 1994).
One of the most probable reasons for a somewhat lesser use of the modern inputs on the small farms
relative to the large ones is that they are compelled by their resource endowments to prefer to make a more
intensive use of some of the traditional inputs. For example, although tractors may enable the large farms to
undertake tillage operations with precision, small farms can do the same in better ways with greater inputs
of human labour and animal power in addition to their access to hiring of tractors. According to available
evidence, the labour input per unit of land for the small farms is, at least, twice as much as that for the large
farms (Chaudhry, 1989); Herring & Chaudhry, 1974; Chaudhry, 1982). Similarly, the bullock-power input
of the small farmers was 4 times that of the large farmers. Although the small farmers have a somewhat
limited access to tube-well water, their proportionate irrigated area has historically exceeded that of the
large farmers, probably because they tend to use water more efficiently. This would be particularly true if
the small farmers had only a limited access to surface and ground water supplies. According to the 1990‘s
Census of Agriculture, the proportionate irrigated area of the small farmers was close to 81 percent as
against 73 percent of that of the large farmers. A somewhat lesser use of chemical fertilizer on the small
farms is perhaps more than offset by their higher application of manure which they use twice as per acre as
is done by large farmers (Chaudhry, 1982). As farmyard manure is rich in plant nutrients, its greater use
would be instrumental in enabling the small farmers to secure a higher and better soil-nutrient balance than
is obtained by large farmers, who solely depend on chemical fertilizers.
9. CONCLUSION
This study attempts to assess the structural change, technological innovations, and nature of technological
change in the agricultural sector of Pakistan. Firstly, we saw the impact of land reforms on the distribution
pattern of the cultivated land in the country surprisingly; the land reforms introduced in Pakistan so far
have exercised no direct significant impact on its agrarian structure. They have not made any significant
increase in the cultivated area of the country barring a slight increase in early seventies. However, they
seem to have induced conversion of large into small farms. As such, the proportion of area under small
farms has increased and the ratio of tenancy to ownership has decreased to some extent.
The use of modern varieties of rice and wheat has increased on all farms in whole of Pakistan. Relatively,
the use of the new varieties of wheat and rice is more widespread in Punjab and Sindh than in other
provinces. Similarly, the use of fertilizer, pesticides, etc has also increased overtime indicating the
occurrence of technological change in the agricultural sector of the country.
Chronological data show that agricultural productivity has been growing due to use of new verities of seeds
and application of modern technologies. Application of modern techniques of production shows that, first,
an important part of productivity growth of land is attributed to use of new seeds in Pakistan. Second, land
reallocation toward high value crops is the key source of agricultural growth during the post-Green
Revolution period. Predictable patterns of the engine of productivity growth of land are generally consistent
with prospect that use of new verities of seeds and improvement in agricultural technology are important
factors to the realization of farmers‘ economic rationality.
International Journal of Economics and Management Sciences Vol. 1, No. 1, 2011, pp. 51-54
© Management Journals
htt
p//
: w
ww
.man
agem
entj
ourn
als.
org
61
REFERENCES
Acumen, Fund. (2008). ‗What It Means to Be Patient: Drip Irrigation in Pakistan‘s Thar Desert‘.
http://blog.acumenfund.org/2008/05/12/what-it-means-to-be-patient-drip-irrigation-in-pakistans-
thar-desert/. Accessed September 18, 2008.
Ahmad, Bashir, & Chaudhry M. A. (1987) Profitability of Pakistan‘s Agriculture. The Pakistan
Development Review 27:4, 457-470.
Ahmad, Viqar & Amjad, R. (1986). The management of Pakistan‘s Economy 1947-1982. Oxford Uni.
Press (Karachi) second impression.
Aresvik, & Var, (1967). Strategy and Outlook for Agricultural Development in West Pakistan. Unpublished
paper, prepared for the ―Symposiium on Strategy of Agricultural Planning in Developing
Countries.‖ At the All-Pakistan Science Conference held at the University of Sindh, Jamshoro.
Bastin, Geoffrey, Q., Sadia,S., & Kazmi, Z. A. 2008. Wheat-flour Industry in Pakistan. Competitiveness
Support Fund. Islamabad, Report discusses food security and supply and demand situation of
wheat and wheat flour.
Chaudhry, M. G. (1982). Green Revolution and Redistribution of Rural Incomes: The Pakistan
Development Review, 21:3 173-205
Chaudhry, M. G. (1989). Structural change in Pakistan’s Agriculture. Islamabad: Pakistan Instiute of
Development Economics.
Chaudhary, M. A. (1994). Regional Agricultural Underdevelopment, Green Revolution and Future
Prospects, (A case study of Pakistan). Paper presented at 10th Annual General Meeting, Pakistan
Institute of Development Economics.
Chaudhry, M. G. & Shamim A. S. (1995) Agricultural input Subsides in Pakistan: Nature and Impact. The
Pakistan Development Review.34:4, 711-22.
Chaudhary, M. A. (1996). Perpective On Development Planning In Pakistan Bilal Books (Lahore) Pp.202-
245.
Cornia, Giovanni A. (1985). Farm Size, Land Yields and the Agricultural Production Function: An
Analysis for Fifteen Developing Countries. World Development 13;4 513-534.
Dorner & Peter, (1972). Land Reforms and Economic Development. Harmondsworth: Penguin Books
Dorosh, Paul & Salam, Abdul. Wheat Markets and Price Stabilization in Pakistan: An Analysis of Policy
Options. Pakistan Institute of Development Economics, Working Papers. 2006.
Ghulam, M. (1965). Private Tubewell Development and Cropping Patterns in West Pakistan. The Pakistan
Development Review, 5:1, 1-53.
Gill, Amjad A. (1973). Pakistan Agricultural Development and Trade. Washington, D.c.: USDA,
Economic Reaearch Service.
Government of Pakistan, (1980). National Agricultural Price. Islamabad: Ministry of Food, Agriculture
and Cooperatives. Food and Agriculture Division.
__________ Pakistan Economic Survey 1984-85. Islamabad: Finance Division (1985).
__________ Nationwide Study for Improving the Procedure for Assessment and Collection of Water
Charges and Drainage Cess 1:3 Islamabad: Minsitry of Water and Power (1990).
__________. Pakistn Economic Survey, 1989-90. Islamabad: Finance Division (1990a).
__________. Pakistan Economic Survey 1984-85. Islamabad: Finance Division (1990).
__________. Pakistan Economic Survey 1984-85. Islamabad: Finance Division (1998).
__________. Report of National Commission on Agriculture. Ministry of Food Agriculture and Livestock.
Islamabad, 1988.
__________. Task Force on Agriculture. Ministry of Finance, Revenue and Economic Affairs. Islamabad,
December 1993.
__________. Agricultural Strategies for the First Decade of New Millennium. Ministry of Food,
Agriculture and Livestock. Islamabad, June 2000.
__________. Medium Term Development Framework 2005-10. Planning Commission of Pakistan.
Islamabad, 2005.
__________. National Medium-Term Priority Framework (NMTPF) 2007-2010 for Pakistan Agriculture
Sector. Ministry of Food, Agriculture and Livestock. Islamabad, October 2007
__________. Agricultural Statistics of Pakistan 2006-2007. Ministry of Food Agriculture and Livestock,
Islamabad, December 2007.
__________. Pakistan Economic Survey 2007-08. Islamabad, June 2008. Review of the state of economy,
physical and social indicators.

International Journal of Economics and Management Sciences Vol. 1, No. 1, 2011, pp. 51-54
© Management Journals
htt
p//
: w
ww
.man
agem
entj
ourn
als.
org
62
Greer, R., & H. Jagirdar. (2006). Evaluation of the Agriculture and Natural Resources Management Sector.
Pakistan‘s Country Assistance Program Evaluation (CAPE), Asian Development Bank. Manila,
The report reviews the last 20 years of ADB supported programs.
Hai. Akhter, (1977). Selected Tables: Highlighting Basic Findings of Farm Credit Study as Part of Rural
financial Makers Study. Applied Economic Research Centre Karachi. (Mimeo).
Hamid H., & Maliha, (2008). Survey of Donor Investments in the Agriculture Sector in Pakistan CFS.
Herring, Ronald & Chaudhry, M. G. (1974). The 1972 Land Reform in Pakistan and their Economic
Implications: A Preliminary Analysis. The Pakistan Development Review, 13:3.
Johnston, B. F. & Thomas P. Tomich, (1985). Agricultural Strategies and Agrarian Structure.
Development Review 3:2 1-37.
Kemper, & Karin E. (2003). Rethinking Groundwater Management in Rethinking Water Management:
Innovative Approaches to Contemporary Issues. Edited by Caroline M Figueres, Cecilia
Tortajada, and Johan Rockstrom. Sterling, VA: Earthscan Publications.
Khan, & Mahmood H. (1997) Agricultural ‗Crisis‘ in Pakistan Same Expectation and Policy Options.
Pakistan Development Review. 36:4, 419-466.
Khan, & Mahmood H. (2006). Agriculture in Pakistan- Changes and Progress, 1947-2005. Lahore:
Vanguard Books Lahore.
Khan, & Riaz A. (2006). Powerpoint presentation on ‗Pakistan - Country Water Highlights‘ (Adviser to
Ministry of Water and Power. Prepared for ADB Conference on ADB‘s Water Financing Program
2006-2010.
Kuhnen, & Fritjof (1989). The Agrarian Sector in Pakistan‘s Development Process Historical Evidence and
Implications for Policy and Theory. The Pakistan Development Review, 28:4, 509-528.
Kuriakose, Anne T., Indira Ahluwalia et al. (2005). Gender Mainstreaming in Water Resources
Management. ARD Internal Paper, World Bank. Washington DC.
Lawrence, R. (1970). Some Economic Aspects of Farm Mechanization in Pakistan. Rawalpindi Food
Foundation (Memeo).
Mahmood, M. (1993). A Macro Analysis of Time Change in the Distribution of Land. Pakistan
Development Review , 32:4, 771-787.
Malik, Sohail J., Mushtaq, M., & Gill, M. (1991). The role of Institutional Credit in the Agricultural
Development of Pakistan. The Pakistan Development Review, 30:4, 1039-1048.
Malik, S. J. 91994). Poverty in Pakistan: 1984-85, 187-88 and 1990-91. International Food Policy Research
Institute, Washington, D.C (Mimeo).
Malik, S. J. (2005). Agricultural Growth and Rural Poverty: A review of Evidence. Pakistan Resident
Mission Working Paper Series No.2. Asian Development Bank.
Naqvi, Zyed N., H., Khan, M., H., and Ghaffar, M. (1989). Structural change in Pakistan’s Agriculture.
Islamabad: Pakistan Institute of Development Economics.
Naqvi, Syed N., H., Khan, M., H., & Ghaffar, M. (1994). How Fast Should Agriculture Be Growing.
Islamabad Pakistan Institute of Development Economics.
Qureshi, Sarfraz K., & Shah, A. H. (1992). A Critical Review of Rural Credit Policy in Pakistan. The
Pakistan Development Review, 31:4, 781-801
Panhwar, F. (2007). The Future of Pakistan Agriculture. Good recent back ground paper; recommendations
emphasize seeds).
Rao, A., & Khan, R. (1991). Some Operational Issues and Institutional Constraints in Lending to Small
Farmer. The Pakistan Development Review. 30:4 1029-1037.
Ruttan, & Vernon W. (1969). Equity and Productivity Issues in Modern Agrarian Reform Legislation. In
Ugo Papi and Charles Nunn (eds) Economic Problems of Agriculture in Industrial Societies. New
York: St. martin‘s Press.
Sharif, M. et al. (1986). Constraints Facing Small Farmers in Punjab. Economic Research Institute, Lahore.
Siddiqui, R. (2007). A CGE Analysis of Global Rice and Agriculture Trade Liberalization: Welfare and
Poverty Implications for Pakistan. Pakistan Institute of Development Economics.
Van, K., Barbara & Anne, T. K. (2008). Multiple Use Water Services in Gender in Agriculture ourcebook
World Bank. Washington DC,
World Bank (1994). Pakistan Irrigation and Drainage: Issues and Options. The World Bank, Washington,
D.C. (Report No.118-PAK).
World Bank (1996). Pakistan: Economic Policies, Institutions, and the Environment. The World Bank,
Washington, D.C. (Report No. 15781 PAK).

International Journal of Economics and Management Sciences Vol. 1, No. 1, 2011, pp. 51-54
© Management Journals
htt
p//
: w
ww
.man
agem
entj
ourn
als.
org
63
World Bank. 2008a. Project Appraisal Document – Water Sector Capacity Building and Advisory Services
Project. Report No. 43784-PK. Washington DC: World Bank.
Zuberi, & Habib A. (1989). Production Function, Institutional Credit and Agricultural Development in
Pakistan. The Pakistan Development Review, 28,1.
Table 1: Distribution of Operated Area in Pakistan, 1960, 1972, 1980 and 1990
Operated
area (Acres)
No. of Farms Farm Area (Acres) Mean Farm Area (Acres)
1960
1972
1980
1990
1960
1972
1980
1990
1960
1972
1980
1990
(%) (%)
< 5 19.0 28.2 34.1 47.5 3.0 5.2 7.1 11.3 2.2 2.4 2.4 2.2
5 - <12.5 44.3 39.9 39.4 33.4 23.6 25.2 27.3 27.5 7.9 8.2 8.0 7.7
12.5 - < 25 23.8 21.1 17.3 12.2 27.0 26.6 24.7 21.5 16.9 16.5 16.5 16.4
25 - < 50 9.0 7.7 6.5 4.7 19.0 18.8 17.8 15.8 31.3 31.9 31.8 31.5
50 - <150 3.3 2.7 2.4 1.8 16.0 15.1 14.7 13.9 72.3 72.1 71.9 70.5
> 150 0.5 0.4 0.3 0.3 11.5 9.5 8.5 10.1 331.3 277.3 285.4 310.4
Total 100 100 100 100 100 100 100 100 14.9 13.0 11.6 9.4
Source: Mahmood, (1993), quoted from Agricultural Census of Pakistan: 1960, 1972, 1980, 1990
Table 2: Distribution of Land by Tenure, 1960, 1972 and 1990
Operated Area
(Acres)
1960 Number %
1960 Area %
Owners Owner+ Tenant Tenant Owners Owner+ Tenant Tenant
< 5 47.7 13.1 39.2 42.5 16.6 40.0
5 - <12.5 32.2 21.9 45.9 31.5 22.3 46.3
12.5 - < 25 30.1 23.2 46.7 29.9 23.3 46.8
25 - < 50 32.8 24.7 42.5 32.9 25.2 42.0
50 - <150 44.4 26.2 29.4 46.0 25.9 28.1
> 150 63.3 19.4 17.3 68.9 18.1 13.1
Total 35.3 20.9 43.8 38.3 23.0 38.7
Operated Area
(Acres)
1972 Number % 1972 Area %
Owners Owner+ Tenant Tenant Owners Owner+ Tenant Tenant
< 5 61.4 11.8 26.8 55.9 15.6 28.5
5 - <12.5 33.3 25.4 41.4 31.7 26.0 42.3
12.5 - < 25 31.2 31.6 37.2 31.3 32.7 36.0
25 - < 50 38.4 34.4 27.3 38.2 35.8 26.0
50 - <150 49.0 55.2 15.8 49.3 36.0 14.7
> 150 62.8 28.4 8.8 62.4 29.6 8.0
Total 14.7 23.8 34.5 39.5 30.9 29.6
Operated Area
(Acres)
2000 Number % 2000 Area %
Owners Owner+ Tenant Tenant Owners Owner+ Tenant Tenant
< 5 70.7 9.0 20.4 65.4 11.8 22.8
5 - <12.5 45.1 22.0 32.9 43.9 22.6 33.5
12.5 - < 25 45.8 28.0 26.2 46.0 28.9 25.1
25 - < 50 49.8 31.9 18.3 49.7 33.0 17.3
50 - <150 61.3 29.2 9.5 61.7 29.7 8.6
> 150 75.6 23.2 4.2 73.4 22.9 3.7
Total 54.7 19.4 25.9 52.1 26.3 21.6
Source: Mahmood (1993), quoted from Agricultural Census of Pakistan: 1960, 1972, 2000.

International Journal of Economics and Management Sciences Vol. 1, No. 1, 2011, pp. 51-54
© Management Journals
htt
p//
: w
ww
.man
agem
entj
ourn
als.
org
64
Table 3: Area of Farms (Ownership) By Size of Farms, 2000
Size (Hectares) Farms Farms Area Avg. size
(Hectares) Number % Hectares %
All Farms 6,311,356 100.0 20,366,993 100.0 3.23
Under 0.5 1,455,802 23.1 401,662 2.0 0.28
0.5 to under 1.0 1,107,723 17.6 821,341 4.0 0.74
1.0 to under 2.0 1,297,226 20.6 1,782,716 8.8 1.37
2.0 to under 3.0 838,310 13.3 1,949,053 9.6 2.32
3.0 to under 5.0 744,114 11.8 2,883,253 14.2 3.87
Small Farms 5,443,175 86.2 7,838,025 38.5 1.44
5.0 to under 10.0 491,420 7.8 3,297,276 19.0 6.71
Medium Farms 491,420 7.8 3,297,276 16.2 6.71
10.0 to under 20.0 249,859 4.0 3,181,750 15.6 12.73
20.0 to under 40.0 86,506 1. 4 2,199,333 10.8 25.42
40.0 to under 60.0 19,941 0.3 894,496 4.4 44.86
60.0 and above 20,455 0.3 2,956,113 14.5 144.52
Large Farms 376,761 6.0 9,231,692 45.3 144.52
Source: Census of Agriculture 2000.
Table 4: Number of Operational Units and Area of Farms by Size of Farms, 2000
Size (Hectares) Farms Farms Area Avg. size
(Hectares) Number % Hectares %
All Farms 6,620,054 100.0 20,406,782 100.0 3.08
Under 0.5 1,290,098 19.5 362,544 1.8 0.28
0.5 to under 1.0 1,099,330 16.6 821,245 4.0 0.75
1.0 to under 2.0 1,425,370 21.5 1,981,277 9.7 1.39
2.0 to under 3.0 966,411 14.6 2,256,772 11.1 2.34
3.0 to under 5.0 890,755 13.5 3,442,507 16.9 3.86
Small Farms 5,671,964 85.7 8,864,345 43.4 1.56
5.0 to under 10.0 580,200 8.8 3,891,228 19.0 6.71
Medium Farms 580,200 8.8 3,891,228 19.1 6.71
10.0 to under 20.0 260,791 3.9 3,324,310 16.3 12.75
20.0 to under 40.0 77,773 1.2 1,955,330 9.6 25.14
40.0 to under 60.0 15,277 0.2 689,070 3.4 45.11
60.0 and above 14,054 0.2 1,682,491 8.2 119.72
Large Farms 367,895 5.6 7,651,201 37.5 119.72
Source: Census of Agriculture 2000.
Table 5: Number of Private Farms By Tenure, 2000
Tenure Farms Farms Area
Number % Hectares %
Owner cultivator 5,134,504 77.6 14,961,275 73.3
Owner-cum-tenant 558,991 8.4 2,963,441 14.5
Tenant 926,562 14.0 2,482,061 12.2
Total 6,620,057 100.0 20,406,777 100.0
Source: Census of Agriculture 2000.

International Journal of Economics and Management Sciences Vol. 1, No. 1, 2011, pp. 51-54
© Management Journals
htt
p//
: w
ww
.man
agem
entj
ourn
als.
org
65
Table 6: Progress of Implementation of Land Reforms upto 2000.
Province Area Resumed Area Disposed off Balance Persons Benefited
1959 MLR 64
Punjab 511244 505082 6162 109889
Sind 346307 300091 46216 43131
N-W. F.P 112108 27287 14821 24314
Boluchistan 53268 53196 72 6221
Total 1022927 955656 67271 186555
Province Area Resumed Area Disposed off Balance Persons Benefited
1972 MLR 115
Punjab 121593 94583 27010 36017
Sind 112920 72478 40442 17167
N-W. F.P 57415 55122 2293 12811
Boluchistan 185015 76298 101017 5398
Total 376943 298481 178462 71393
Province Area Resumed Area Disposed off Balance Persons Benefitted
Act- 11 of 1977
Punjab 40381 22253 18131 9437
Sind 12901 8611 4290 2118
N-W. F.P 9440 6695 2745 2694
Boluchistan 11497 1022 10475 286
Total 74222 38581 35641 14535
Source: Agricultural Statistics of Pakistan: 2000-01
Table 7: Water Availability at Farm Gate (Million Acre-Feet)
Years/Season Ground Water
Total Public T. wells Private T. wells Scrap T. wells
1996-97 1.93 37.40 - 39.33
1997-98 1.93 38.27 - 40.2
1998-99 1.93 38.63 10.51 51.07
1999-00 1.93 38.27 9.71 49.91
2000-01 1.93 39.35 9.27 50.55
2001-02 1.93 39.71 8.65 50.29
2002-03 1.93 40.08 8.01 50.02
2003-04 1.93 40.08 8.01 50.02
2004-05 1.93 40.08 8.01 50.02
2005-06 1.93 40.38 8.01 50.32
2006-07 1.93 40.38 8.01 50.32
Source: Planning & Development Division (Water Resources Section) and IRSA
Table 8: Fertilizer Consumption, 1990–2007(000 N/Tonnes, Percent Change over Previous Year)
Year Nitrogen %Change Phosphate % Change Potash % Change Total % change N.P. ratio
1990/91 1471.6 (+) 0.3 388.5 (+) 1.6 32.8 (-)18.2 1892.9 (+) 0.1 3.8:1
1991/92 1462.6 (-) 0.6 398.0 (+) 2.4 23.3 (-)29.0 1883.9 (-) 0.5 3.7:1
1992/93 1635.3 (+)11.8 488.2 (+)22.7 24.1 (+) 3.4 2147.6 (+)14.0 3.4:1
1993/94 1659.4 (+) 1.5 464.2 (-) 4.9 23.2 (-) 3.7 2146.8 (-) 0.1 3.6:1
1994/95 1738.1 (+) 4.7 428.4 (-) 7.7 16.6 (-)28.4 2183.1 (+) 1.7 4.1:1
1995/96 1990.9 (+)14.5 494.4 (+)15.4 29.7 (+)78.9 515.0 (+)15.2 4.0:1
1996/97 1985.1 (-) 0.3 419.5 (-)15.1 8.4 (-)71.7 2413.0 (-) 4.1 4.7:1
1997/98 2075.0 (+) 4.5 551.0 (+)31.5 20.0 (+)150.0 2646.0 (+) 9.7 3.8:1
1998/99 2099.0 (+) 1.2 465.0 (-)15.6 21.0 (+) 5.0 2585.0 (-) 2.3 4.5:1
1999/00 2217.0 (+) 5.6 596.0 (+)28.2 18.5 (-)13.1 2832.0 (+) 9.5 3.7:1
2000/01 2264.5 (+) 2.1 676.7 (+)13.5 22.8 (+)23.2 2964.0 (+) 4.6 3.4:1
2001/02 2285.3 (+) 0.9 624.5 (-)27.6 18.8 (-)18.0 2928.6 (-) 1.2 3.7:1
2002/03 2349.1 (+) 2.8 650.2 (+) 4.1 20.5 (+) 9.2 3019.8 (+) 3.1 3.6:1
2003/04 2526.7 (+) 7.6 673.5 (+) 3.6 21.8 (+) 6.3 3222.0 (+) 6.7 3.8:1
2004/05 2796.4 (+) 0.7 865.1 (+) 28.5 32.5 (+)49.2 3694.0 (+)14.7 3.2:1
2005/06 2926.6 (+) 4.7 850.5 (-) 1.7 27.0 (-) 16.9 3804.1 (+) 3.0 3.4:1
2006/07 2649.7 (-) 9.5 978.7 (+) 15.1 43.1 (+) 59.6 3671.5 (-) 3.5 2.7:1
Source: National Fertilizer Development Centre (NFDC), Islamabad.
International Journal of Economics and Management Sciences Vol. 1, No. 1, 2011, pp. 51-54
© Management Journals
htt
p//
: w
ww
.man
agem
entj
ourn
als.
org
66
Table 9: Import of Fertilizers (thousand nutrient tons)
Year N P K Total
1990/91 365.0 264.0 56.0 685.0
1991/92 360.0 257.0 15.0 632.0
1992/93 393.0 357.2 8.9 759.1
1993/94 313.0 547.0 43.0 903.0
1994/95 73.0 186.0 2.0 261.0
1995/96 248.8 280.6 51.6 581.0
1996/97 472.8 381.0 24.3 878.1
1997/98 286.9 415.7 11.1 713.7
1998/99 421.8 425.0 37.2 884.8
1999/00 233.0 416.0 13.8 662.8
2000/01 194.0 369.1 16.5 579.6
2001/02 178.5 429.5 17.7 625.7
2002/03 215.7 542.4 7.9 766.0
2003/04 204.2 553.5 6.4 764.1
2004/05 309.7 458.2 16.9 784.8
2005/06 603.4 639.8 25.1 1268.3
2006/07 307.6 476.2 12.1 795.9
Source: National Fertilizer Development Centre, Islamabad.
Table 10: Consumption of Pesticides
Year Quantity M.T. Value
(million Rs) Imports Production Total
1990 7502 9941 14743 4581
1991 6157 14056 20213 5536
1992 6691 16748 23439 6554
1993 6128 14151 20279 5384
1994 10693 14175 24868 5808
1995 20136 23239 43375 7274
1996 24151 19068 43219 9987
1997 24168 13836 38004 9904
1998 22765 18811 41576 6960
1999 27210 18470 45680 7324
2000 19764 41535 61299 4971
2001 20678 26914 47592 7741
2002 27103 42794 69897 6790
2003 24028 54105 78133 8138
2004 40482 89116 129598 12592
2005 28371 76792 105164 10379
2006 12721 30855 43576 5906
2007 15553 75123 90676 12290
Source: Agriculture Statistics of Pakistan 2006/07 Department of Plant Protection, Karachi.
Table 11 Agricultural Growth Rate, 1950-55 to 2007-08
Years 1950-
55
1955-
60
1960-
65
1965-
70
1970-
75
1975-
80
1980-
85
1985-
90
1990-
95
1995-
97
1997-
01
2002-
08
1950-
08
Growth
rate
1.01 2.10 3.78 6.26 0.78 3.91 3.28 4.57 3.93 2.97 2.30 4.1 3.7
Source: G O P, Economic Survey (various issues)
International Journal of Economics and Management Sciences Vol. 1, No. 1, 2011, pp. 51-54
© Management Journals
htt
p//
: w
ww
.man
agem
entj
ourn
als.
org
67
Table 12 Agricultural Subsidies by Inputs, 1979-80 to 2000-01 (Rs. In Million)
Years
Fertilizer
Irrigation
Govt. Credit
Electricity
Total
1979-80
2455
297
116
-16
3121
1980-81 2448 338 180 -18 2898
1981-82 1750 416 265 -11 2444
1982-83 1949 437 347 -100 2658
1983-84 1460 661 524 -153 2498
1984-85 1500 228 543 101 2974
1985-86 2409 1005 448 16 3894
1986-87 1284 2134 551 375 3444
1987-88 9195 1352 785 1112 5259
1988-89 2415 1154 1009 1148 5720
1989-90 1248 1028 2107 1380 4872
1990-91 1191 1545 1526 1925 6220
1991-92 810 2701 1744 1796 7512
1992-93 805 3111 1993 1724 7639
1993-94 79 2565 1980 330 5680
1994-95 77 2938 1986 330 533
1995-96 78 2761 1817 345 523
1996-97
2000-01
72
56
2913
2311
1911
2657
324
245
512
NA
Source: Ghaffar and Sahibzada (1995), and Govt. Of Pakistan, Economic Survey, various issues.
Table 13: Productivity Per Acre of Small and Large Farms, 1965-66 to 2004-05
Years
Value of Output (Rs.)
Per Acre
Small as %age of Large farm
Productivity
Small farms
Large farms
1965-66 363 205 177.1
1966-67 515 250 206.0
1967-68 561 230 243.9
1968-69 552 250 220.8
1969-70 657 349 188.2
1970-71 700 332 210.8
1973-74 526 303 173.6
1981-82 1719 1031 166.7
1995-96
2004-05
7301
9312
7419
9281
209.3
288.1
Source: Government of Pakistan (2008)

International Journal of Economics and Management Sciences Vol. 1, No. 1, 2011, pp. 51-54
© Management Journals
htt
p//
: w
ww
.man
agem
entj
ourn
als.
org
68
International Journal of Economics and Management Sciences Vol. 1, No. 1, 2011, pp. 51-54
© Management Journals
htt
p//
: w
ww
.man
agem
entj
ourn
als.
org
69
International Journal of Economics and Management Sciences Vol. 1, No. 1, 2011, pp. 51-54
© Management Journals
htt
p//
: w
ww
.man
agem
entj
ourn
als.
org
70
Fig. 6: Agriculture Credit
0
2500
5000
7500
10000
12500
15000
17500
20000
22500
25000
19
52-
53
19
54-
55
19
56-
57
19
58-
59
19
60-
61
19
62-
63
19
64-
65
19
66-
67
19
68-
69
19
70-
71
19
72-
73
19
74-
75
19
76-
77
19
78-
79
19
80-
81
19
82-
83
19
84-
85
19
86-
87
19
88-
89
19
90-
91
19
92-
93
19
94-
95
19
96-
97
Years
Rs.
"m
illio
n"
Mil. Rs.

International Journal of Economics and Management Sciences Vol. 1, No. 1, 2011, pp. 51-54
© Management Journals
htt
p//
: w
ww
.man
agem
entj
ourn
als.
org
71
International Journal of Economics and Management Sciences Vol. 1, No. 1, 2011, pp. 51-54
© Management Journals
htt
p//
: w
ww
.man
agem
entj
ourn
als.
org
72
International Journal of Economics and Management Sciences Vol. 1, No. 1, 2011, pp. 51-54
© Management Journals
htt
p//
: w
ww
.man
agem
entj
ourn
als.
org
73
International Journal of Economics and Management Sciences Vol. 1, No. 1, 2011, pp. 51-54
© Management Journals
htt
p//
: w
ww
.man
agem
entj
ourn
als.
org
74