Embed Size (px)
Citation preview

The Philippines Country Environmental Analysis
Land Degradation and Rehabilitation in the Philippines
FINAL REPORT
Submitted to:
The World Bank
Prepared by:
Roehlano M. Briones, Consultant
Senior Research Fellow
Philippine Institute for Development Studies
February, 2009
The views expressed in this study are those of the author and should not be attributed to the World Bank, members of its Board of Executive Directors, or the countries they represent. Please send your comments to the author at [email protected].
The Philippines Country Environment Analysis
1
Executive summary
While the Philippines’ resource endowment can support vast farmlands, the
majority of its land area consist of uplands for which temporary crop cultivation may not
be sustainable. Originally these uplands were forested; with timber extraction, population
expansion, and rapid agricultural growth, came the spread of crop farming by upland
settlers. A growth slowdown came in the 1980s, which was accompanied by stagnant
productivity growth, for which agriculture-related land degradation may have played a
role. Despite apparent market incentives towards diversification, allocation of resources
away from existing cropping patterns has been slow. Protection of the resource base
has become more urgent to sustain yield growth at high levels.
Land degradation in the lowlands is a result of intensive cultivation and can be
offset by proper crop management practices. A more serious problem arises from land
degradation in the uplands, which is primarily the result of soil erosion. The cost of
erosion is accounted for mostly by the depletion in the stock of available soil nutrients.
While short term effects of erosion are negligible, the long term cumulative effect is an
irreversible decline in land quality. The costs of land degradation are even more serious
when off-site costs are considered (though the quantification of impact for off-site costs
is far less developed than for on-site costs). Despite variation in the estimates, and
considerable uncertainty about the degradation parameters, a conservative estimate of
the cost of land degradation finds a large value, comparable at least to the annual
investment in research and development of the public sector.
The long term benefit of soil conservation technologies, or shifting away from
erosive land use, is the avoidance of this soil loss. Direct interventions, such as
promotion of soil conserving farm technologies, typically involve investments and
running costs. Some studies indicate that soil conservation technologies are worthwhile
investments based social benefit-cost analysis. However when the credit market is
segmented, farmers set short planning horizons (say under insecure tenure), and face
liquidity constraints, then profit-maximizing farmers may forego these investments.
Meanwhile indirect interventions alter the incentive structure of technology
adoption and land use, which in turn affect the rate of soil erosion. Tenure reform has an
ambiguous effect, while removal of domestic protection of corn has a positive effect on
soil conservation. As upland farmers, including the large population of subsistence corn
growers, are among the poorest segments of the rural population, the analysis suggests
increasing and widening incentives for adoption of soil conservation and permanent tree
The Philippines Country Environment Analysis
2
crops through extension and improved tenurial measures, while ensuring that trade
adjustment be accompanied by adequate social protection.
List of Tables
Table 1: Growth rates of agricultural output, arable land, and total population, in percent
(annual average) ...............................................................................................................9 Table 2: Estimates of TFP growth for selected Asian countries, 1981-2001 ..................11 Table 3: Area harvested by crop (‘000 ha), Philippines, 1988-2006 ...............................13 Table 4: Gross value added of major crops, 1990 – 2007 ..............................................14 Table 5: Annual real cost and returns per ha for selected crops, Philippines, 2002 –
2006, (2007 prices) .........................................................................................................15 Table 6: Yield of major crops, Philippines, 1970-2006, in t/ha/yr ....................................16 Table 7: Gross and average erosion rates by land use, 1993 ........................................19 Table 8: Soil depletion horizon by region, 1993..............................................................20 Table 9: Area and erosion rates of selected upland crops (estimated from various
sources) ..........................................................................................................................21 Table 10: Soil depletion multipliers, in t/yr per Php 1,000 change in demand (1988
prices) .............................................................................................................................21 Table 11: Nutrient loss due to erosion per ha, quantity in kg and value (2007 pesos) ...22 Table 12: Typology of formal tenure instruments in forest lands ....................................28 Table 13: Cost comparison, open field and hedgerow intercropping ..............................31 Table 14: Approximate NPV for alternative farming methods .........................................32 Table 15: Net present values of various land use systems at alternative discount rates 33
List of Figures
Figure 1: Conceptual framework .......................................................................................5 Figure 2: Shares in total land area by land capability category, in percent.......................7 Figure 3: GDP shares by sector, Philippines, 1988-2006 (At constant 1985 prices) ........8 Figure 4: Employment shares by economic sector, 1988-2005 ........................................9 Figure 5: Labor productivity in agriculture, in pesos/worker (1985 prices).....................10 Figure 6: Degree of land degradation .............................................................................12 Figure 7: Amount of soil eroded from agricultural soils, million t/yr, 1988-2000..............18 Figure 8: Nominal rate of assistance to corn (%) ............................................................30

The Philippines Country Environment Analysis
3
1. Introduction
The traditional strategy of agricultural development neglected protection and
management of natural resources, focusing rather on intensification. This involves the
application of more inputs per unit land to increase yield, based on modern technology
such as genetically improved “Green Revolution” varieties. In the past few decades
however, the problems of the traditional strategy became increasingly evident. As
farming extended into areas with a limited and fragile resource base, it wrought havoc on
local ecosystems and land resources, while reaping limited benefits from Green
Revolution technologies (World Bank, 2008). Land degradation is now widely recognized
as a serious threat to agricultural productivity worldwide (Eswaran, Lal, and Reich,
2001).
Land degradation in the Philippines is likewise seen as a serious environmental
problem. Agricultural practices and economic pressures have severely degraded the
agricultural resource base, associated with accelerated soil erosion, siltation of irrigation
systems, flooding, and water pollution (Briones, 2005). The country’ research and
agricultural development strategy is now orienting towards long term productivity growth
through natural resource management or NRM (Rola, 2004).
There is a sizable literature and data on land degradation and rehabilitation, both
globally and for the Philippines. There is however a need to compile and synthesize the
statistics and estimates from various sources towards a coherent review and
assessment of status, trends, impacts of human activity, environment and resource
management interventions, and welfare impacts on poor households. Hence, this review
aims to:
(i) Analyze the characteristics of the crop production sector;
(ii) Synthesize existing estimates of the costs of land degradation;
(iii) Analyze the costs and benefits of a few priority interventions to protect soil
resources;
(iv) Assess distributional impacts of environmental costs, as well as interventions.
The rest of the paper is organized as follows: Section 2 provides a conceptual
and methodological framework for the assessment of land degradation and
rehabilitation. Section 3 reviews the background of land degradation within the context of
Philippine agriculture. Section 4 deals with the impacts and costs of land degradation.
Section 5 evaluates land rehabilitation interventions, based on cost, benefits, and
incidence of impact. Section 6 concludes.

The Philippines Country Environment Analysis
4
2. Conceptual framework
2.1. The agricultural system
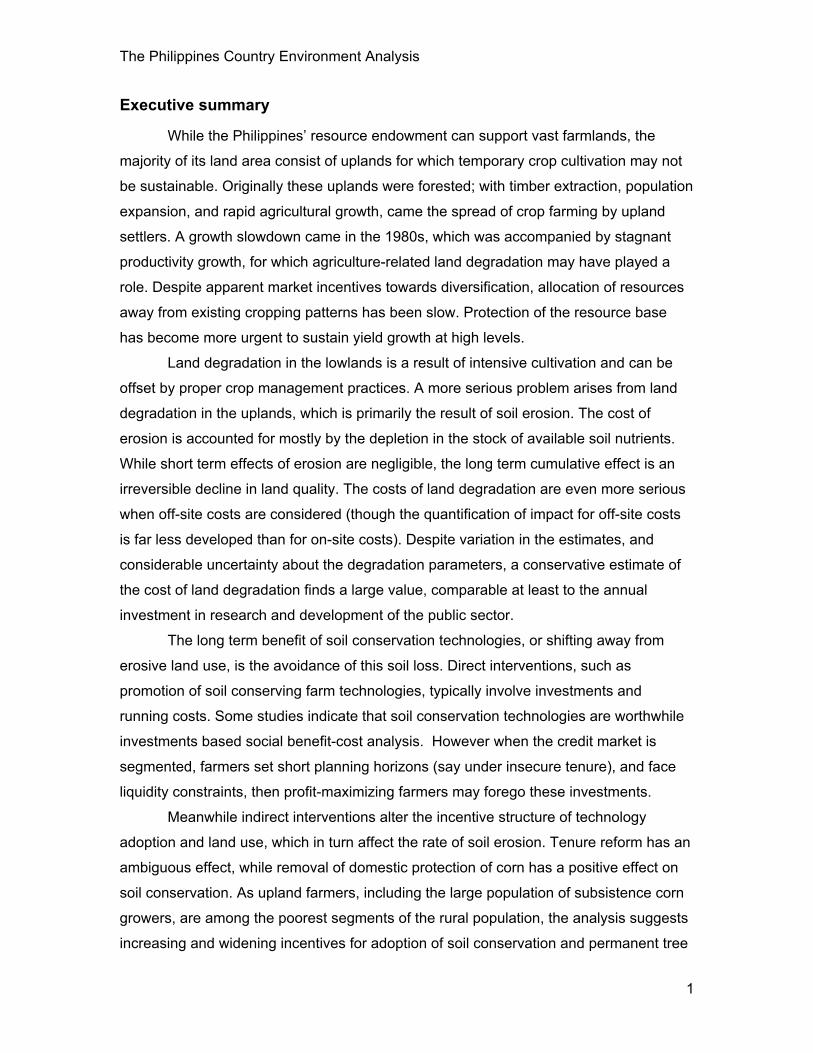
In this study we focus on the land degradation in the context of agriculture
(Figure 1).1 At the core of the analysis is the household, whose welfare improvement,
now and in the future, is the primary evaluation criterion. In standard economic theory,
household behavior is rationalized in terms of maximization of some pay-off function
subject to constraints. Households have in their possession endowments of labor and
assets. Productive factors, including land, are combined by households to produce
outputs. The focal household activity is agriculture, which can be distinguished by
location (upland, lowland) and crop grown. Agricultural activity in turn can depreciate
natural capital, i.e. through land degradation. Output is sold to the market and returns
income to households; households also obtain other agricultural inputs at a price, while
selling their endowment (e.g. labor) to the factor market.
Exogenous to the framework are institutions, primarily the state, the community,
and tenurial relations. Tenure can be formal or informal – if the latter, this presumes tacit
acceptance within the wider community. Likewise communities, through norms and
social interaction, may encourage households to act in concert to maintain the resource
base. Finally, the state can implement programs to encourage resource conservation,
provide the legal framework for tenurial instruments, as well as impose formal policies
that affect markets, such as regulations, taxes, or tariffs.
2.2. The agriculture-degradation link
The central concern of this paper is the agriculture-degradation link. Degradation
occurs through: i) actual removal of the soil, through erosion; ii) changes in the chemical,
biological, and physical endowments of soil, such as nutrient loss, salinization,
acidification, and compaction (Cummings, 1999). Erosion is a natural process from the
action of water and wind, but it can be accelerated by human activity, primarily by land
clearing. Other factors equal, steeper land is more erosion prone. It should be noted that
soil “loss” is a location-specific concept; soil eroded from one area is deposited
elsewhere, and depending on the deposition site, may still be useful for agriculture.
Nutrient loss is a related problem, as runoff causes nutrient leaching. In turn, upstream
erosion, nutrient loss, and salinization can cause downstream damages through
sedimentation, eutrophication, and saline seep.
The Philippines Country Environment Analysis
5
Figure 1: Conceptual framework
Bojö (1996) lists the the most common methods for computing the cost of land
degradation. For on-site costs there are: (i) macro-level assessments using production
functions to derive land degradation coefficients; (ii) micro-level assessments using plot-
level data on land degradation impacts on yield that are scaled up; (iii) replacement cost
approaches calculating the cost of replacing nutrients “lost” to soil, based on fertilizer
prices. Note that (i) requires a detailed cross-section and/or time series data on soil
erosion and possible explanatory variables, which may not be available. Meanwhile (ii)
can based on experimental plot data or crop simulation analysis.2 Finally, (iii) is the
simplest and easiest approach, but is prone to error; aside from the uncertainty of soil
loss estimate, there is the upward bias from the fact that current plant nutrient uptakes
may be unaffected – rather it is the long term nutrient supply that is affected by soil
HOUSEHOLD Welfare
Behavior
ENVIRONMENT AND NATURAL RESOURCES
LAND
Soil conditions
OTHERS
AGRICULTURE
Location (upland, lowland)
Crop
MARKETS
OUTPUT INPUT
INSTITUTIONS
State
Community
Tenure
The Philippines Country Environment Analysis
6
degradation. A final set of costs are off-site impact calculations pertaining to lost capacity
for irrigation and/or hydro-power, dredging costs, etc. (see e.g. Grohs, 1994).
3. Crop Production Sector
3.1. Geography and climate
While the Philippines’ resource endowment permits a significant amount of land that can
support farming, the larger share of its land area is unsuitable for annual crop cultivation.
Concepcion (2004) profiles the country’s geographic features and land
endowment based on data from the Bureau of Soil and Water Management (BSWM).
The country is an archipelago of about 30 million ha, formed out half-submerged
mountains, pushed up from the sea floor due to tectonic pressures. The island groups
are Luzon (14.1 million ha), Visayas (5.7 million ha), and Mindanao (10.2 million ha),
respectively at the north, central, and southern parts of the country. The most
mountainous group is Luzon, whereas Visayas is a more fragmented group of islands
and islets. Mindanao’s terrain is diverse, including volcanic peaks, fault block mountains,
plateaus, and low flat basins.
The climate is tropical, with an average humidity of 80% and an annual average
rainfall ranging from 80 to 450 cm. Seasonal winds are referred to as the northeast
monsoon, southwest monsoon, and north pacific trade winds. Both Luzon and Visayas
lie within the typhoon belt, which is visited by twenty or so typhoons annually. Nearly half
of annual rainfall is brought by these typhoons, while a small proportion (7%) are brought
by monsoons; the remainder is brought by the intertropical convergence zone, and
assorted rainfall-inducing weather patterns.
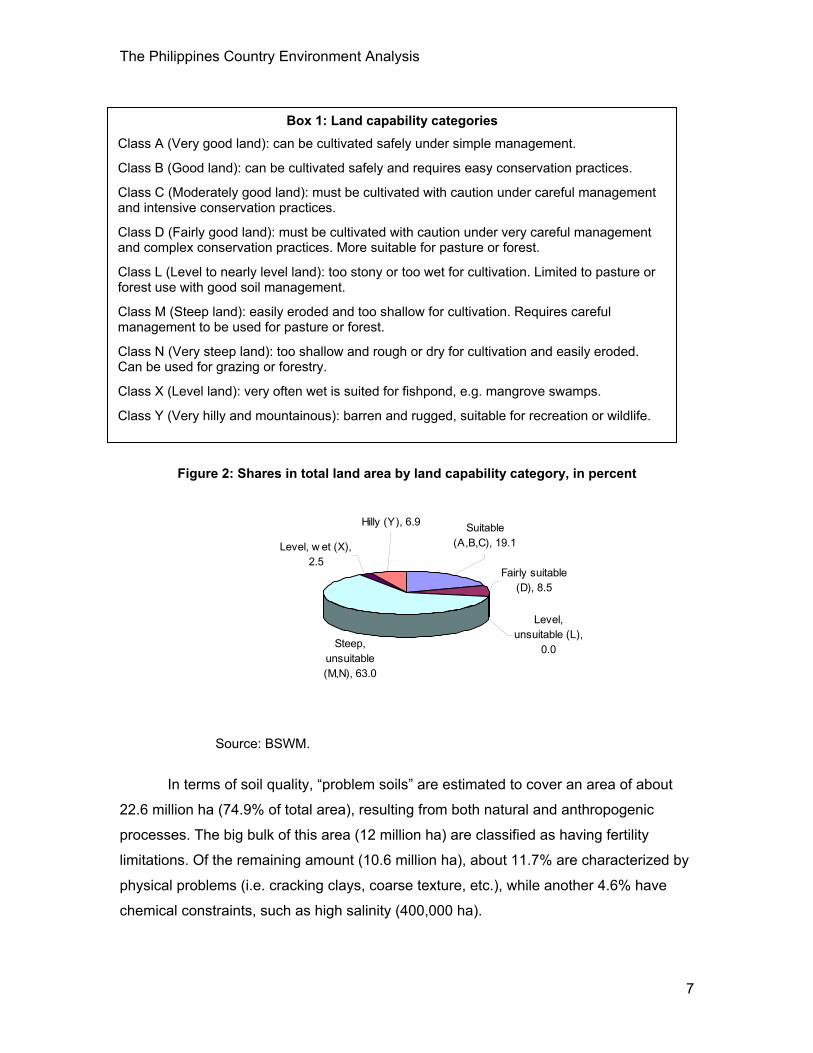
The Philippines’ land area can be divided into nine capability categories, based
on soil type and slope gradient (Box 1). The shares in total area by land capability
category are shown in Figure 2. The majority of the country’s land area is classified as
steep land unsuitable for cultivation (i.e. of temporary crops). Only 8.3 million ha (about
27.5% of land area) is classified as at least fairly suitable for cultivation. About 17% of
total area are classified as very steep slopes (>30%), and another 66% as steep slopes
(between 8-30%), making them prone to erosion.3 In fact however the country’s
agricultural area covers over 12.2 million ha, suggesting that a large extent of farming is
occurring in steep lands.
The Philippines Country Environment Analysis
7
Box 1: Land capability categories Class A (Very good land): can be cultivated safely under simple management.
Class B (Good land): can be cultivated safely and requires easy conservation practices.
Class C (Moderately good land): must be cultivated with caution under careful management and intensive conservation practices.
Class D (Fairly good land): must be cultivated with caution under very careful management and complex conservation practices. More suitable for pasture or forest.
Class L (Level to nearly level land): too stony or too wet for cultivation. Limited to pasture or forest use with good soil management.
Class M (Steep land): easily eroded and too shallow for cultivation. Requires careful management to be used for pasture or forest.
Class N (Very steep land): too shallow and rough or dry for cultivation and easily eroded. Can be used for grazing or forestry.
Class X (Level land): very often wet is suited for fishpond, e.g. mangrove swamps.
Class Y (Very hilly and mountainous): barren and rugged, suitable for recreation or wildlife.
Figure 2: Shares in total land area by land capability category, in percent
Suitable (A,B,C), 19.1
Fairly suitable (D), 8.5
Level, unsuitable (L),
0.0Steep, unsuitable (M,N), 63.0
Level, w et (X), 2.5
Hilly (Y), 6.9
Source: BSWM.
In terms of soil quality, “problem soils” are estimated to cover an area of about
22.6 million ha (74.9% of total area), resulting from both natural and anthropogenic
processes. The big bulk of this area (12 million ha) are classified as having fertility
limitations. Of the remaining amount (10.6 million ha), about 11.7% are characterized by
physical problems (i.e. cracking clays, coarse texture, etc.), while another 4.6% have
chemical constraints, such as high salinity (400,000 ha).
The Philippines Country Environment Analysis
8
3.2. Patterns and trends in Philippine agriculture
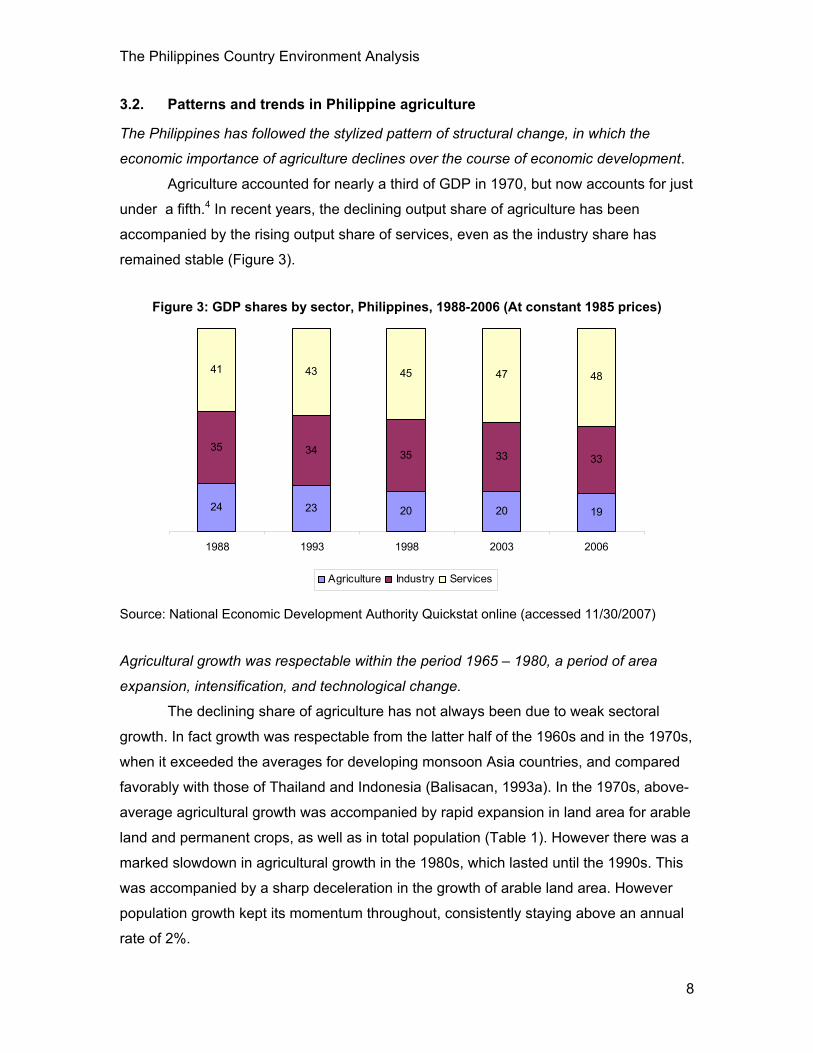
The Philippines has followed the stylized pattern of structural change, in which the
economic importance of agriculture declines over the course of economic development.
Agriculture accounted for nearly a third of GDP in 1970, but now accounts for just
under a fifth.4 In recent years, the declining output share of agriculture has been
accompanied by the rising output share of services, even as the industry share has
remained stable (Figure 3).
Figure 3: GDP shares by sector, Philippines, 1988-2006 (At constant 1985 prices)
24 23 20 20 19
35 34 35 33 33
41 43 45 47 48
1988 1993 1998 2003 2006
Agriculture Industry Services
Source: National Economic Development Authority Quickstat online (accessed 11/30/2007)
Agricultural growth was respectable within the period 1965 – 1980, a period of area
expansion, intensification, and technological change.
The declining share of agriculture has not always been due to weak sectoral
growth. In fact growth was respectable from the latter half of the 1960s and in the 1970s,
when it exceeded the averages for developing monsoon Asia countries, and compared
favorably with those of Thailand and Indonesia (Balisacan, 1993a). In the 1970s, above-
average agricultural growth was accompanied by rapid expansion in land area for arable
land and permanent crops, as well as in total population (Table 1). However there was a
marked slowdown in agricultural growth in the 1980s, which lasted until the 1990s. This
was accompanied by a sharp deceleration in the growth of arable land area. However
population growth kept its momentum throughout, consistently staying above an annual
rate of 2%.
The Philippines Country Environment Analysis
9
Table 1: Growth rates of agricultural output, arable land, and total population, in percent
(annual average) 1971-75 1976-80 1981-85 1986-90 1991-95 1996-00 2001-05
Agriculture GVA 3.1 5.1 -0.4 2.7 1.5 2.3 3.1
Arable land 2.3 2.9 0.3 0.3 0.0 1.5 0.1
Population 2.8 2.7 2.4 2.4 2.3 2.1 2.1
Sources: World Development Indicators for agricultural value added; FAOStat for arable land and population.
To meet the food requirements of a rising population, expansion of cultivated
area or “extensification” played an important early role. As the expanding population
reached the land frontier, agricultural growth would have to be achieved by raising land
productivity, i.e. through intensification. Intensification occurred in parallel with the Green
Revolution. Irrigated area rose from just 0.83 million ha in 1970 to 1.43 million ha by
2007. Over the same period, fertilizer usage rose steadily from 25 kg/ha in to over 60
kg/ha in 2002, while agricultural mechanization proceeded very rapidly, as the number of
tractors increased nearly fifteen-fold.5
The growth slowdown in the 1980s was accompanied by stagnant productivity growth,
both in terms of labor and total factor productivity.
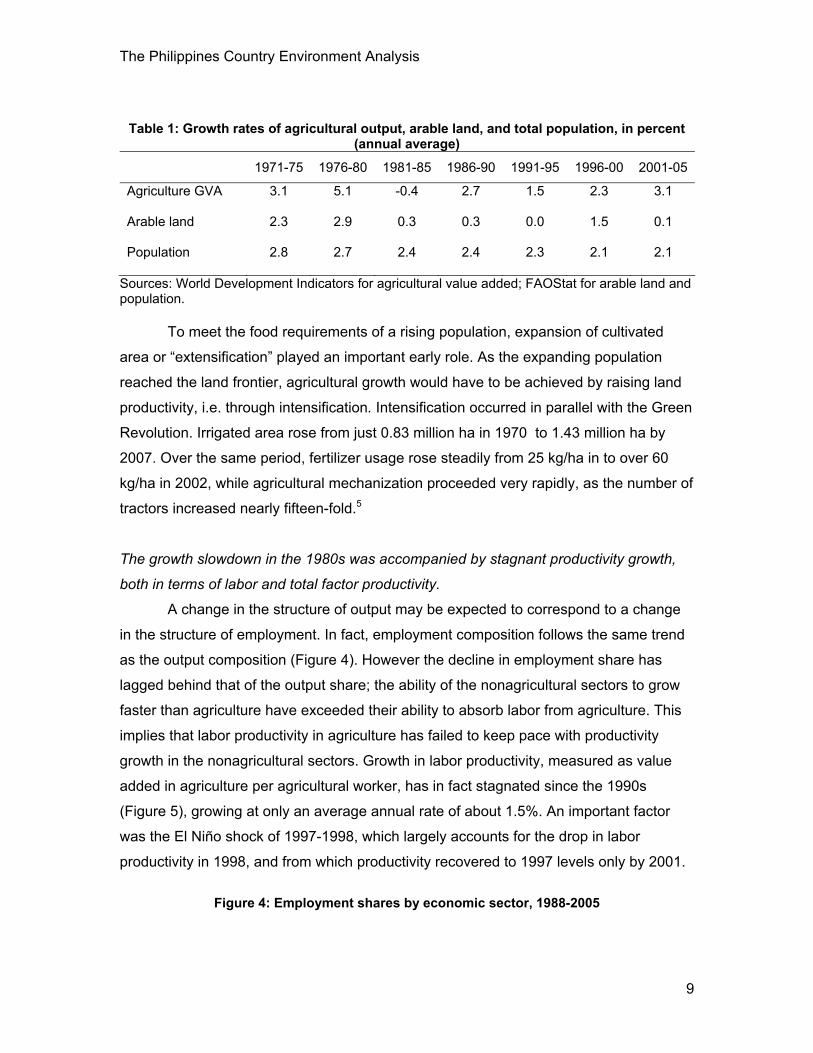
A change in the structure of output may be expected to correspond to a change
in the structure of employment. In fact, employment composition follows the same trend
as the output composition (Figure 4). However the decline in employment share has
lagged behind that of the output share; the ability of the nonagricultural sectors to grow
faster than agriculture have exceeded their ability to absorb labor from agriculture. This
implies that labor productivity in agriculture has failed to keep pace with productivity
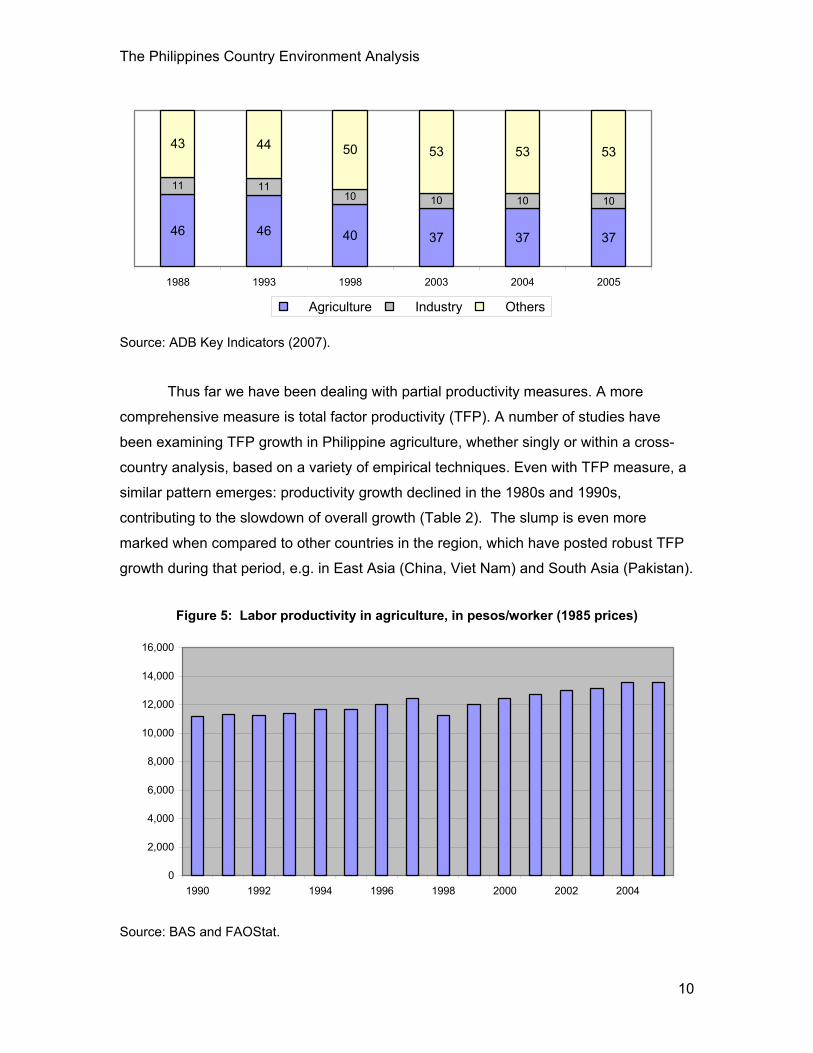
growth in the nonagricultural sectors. Growth in labor productivity, measured as value
added in agriculture per agricultural worker, has in fact stagnated since the 1990s
(Figure 5), growing at only an average annual rate of about 1.5%. An important factor
was the El Niño shock of 1997-1998, which largely accounts for the drop in labor
productivity in 1998, and from which productivity recovered to 1997 levels only by 2001.
Figure 4: Employment shares by economic sector, 1988-2005
The Philippines Country Environment Analysis
10
46 46 40 37 37 37
11 1110 10 10 10
43 44 50 53 53 53
1988 1993 1998 2003 2004 2005
Agriculture Industry Others
Source: ADB Key Indicators (2007).
Thus far we have been dealing with partial productivity measures. A more
comprehensive measure is total factor productivity (TFP). A number of studies have
been examining TFP growth in Philippine agriculture, whether singly or within a cross-
country analysis, based on a variety of empirical techniques. Even with TFP measure, a
similar pattern emerges: productivity growth declined in the 1980s and 1990s,
contributing to the slowdown of overall growth (Table 2). The slump is even more
marked when compared to other countries in the region, which have posted robust TFP
growth during that period, e.g. in East Asia (China, Viet Nam) and South Asia (Pakistan).
Figure 5: Labor productivity in agriculture, in pesos/worker (1985 prices)
0
2,000
4,000
6,000
8,000
10,000
12,000
14,000
16,000
1990 1992 1994 1996 1998 2000 2002 2004
Source: BAS and FAOStat.
The Philippines Country Environment Analysis
11
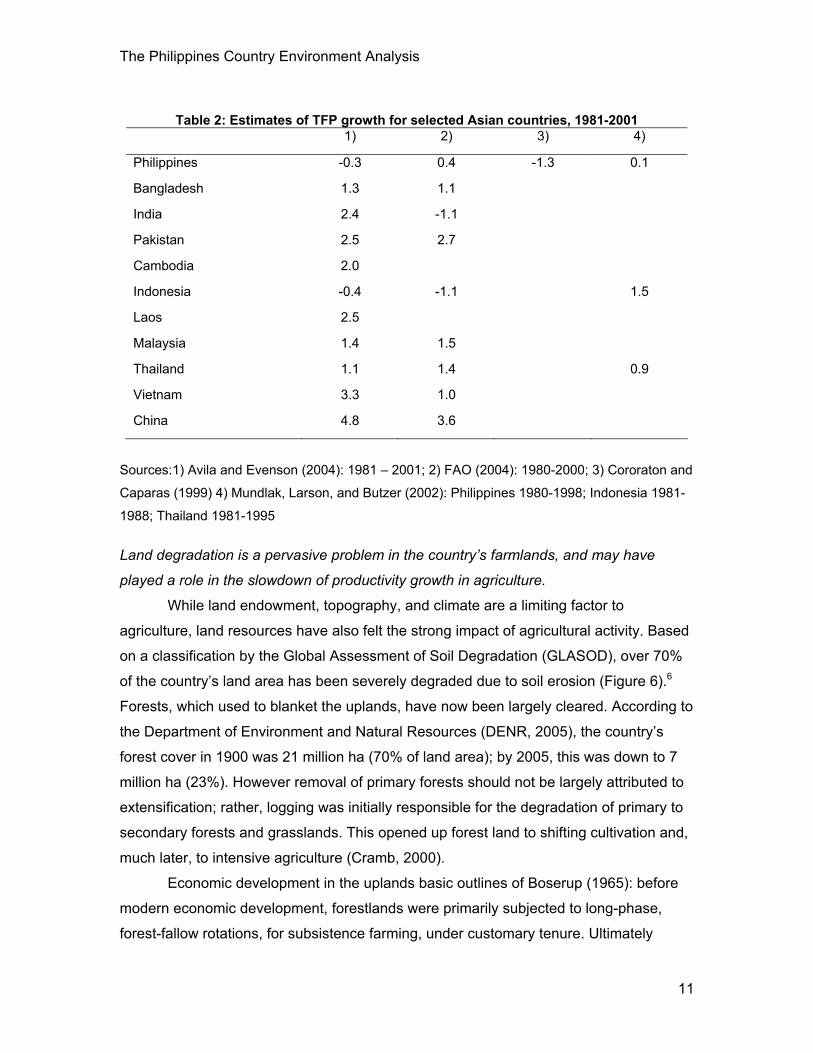
Table 2: Estimates of TFP growth for selected Asian countries, 1981-2001
1) 2) 3) 4)
Philippines -0.3 0.4 -1.3 0.1
Bangladesh 1.3 1.1
India 2.4 -1.1
Pakistan 2.5 2.7
Cambodia 2.0
Indonesia -0.4 -1.1 1.5
Laos 2.5
Malaysia 1.4 1.5
Thailand 1.1 1.4 0.9
Vietnam 3.3 1.0
China 4.8 3.6
Sources:1) Avila and Evenson (2004): 1981 – 2001; 2) FAO (2004): 1980-2000; 3) Cororaton and
Caparas (1999) 4) Mundlak, Larson, and Butzer (2002): Philippines 1980-1998; Indonesia 1981-
1988; Thailand 1981-1995
Land degradation is a pervasive problem in the country’s farmlands, and may have
played a role in the slowdown of productivity growth in agriculture.
While land endowment, topography, and climate are a limiting factor to
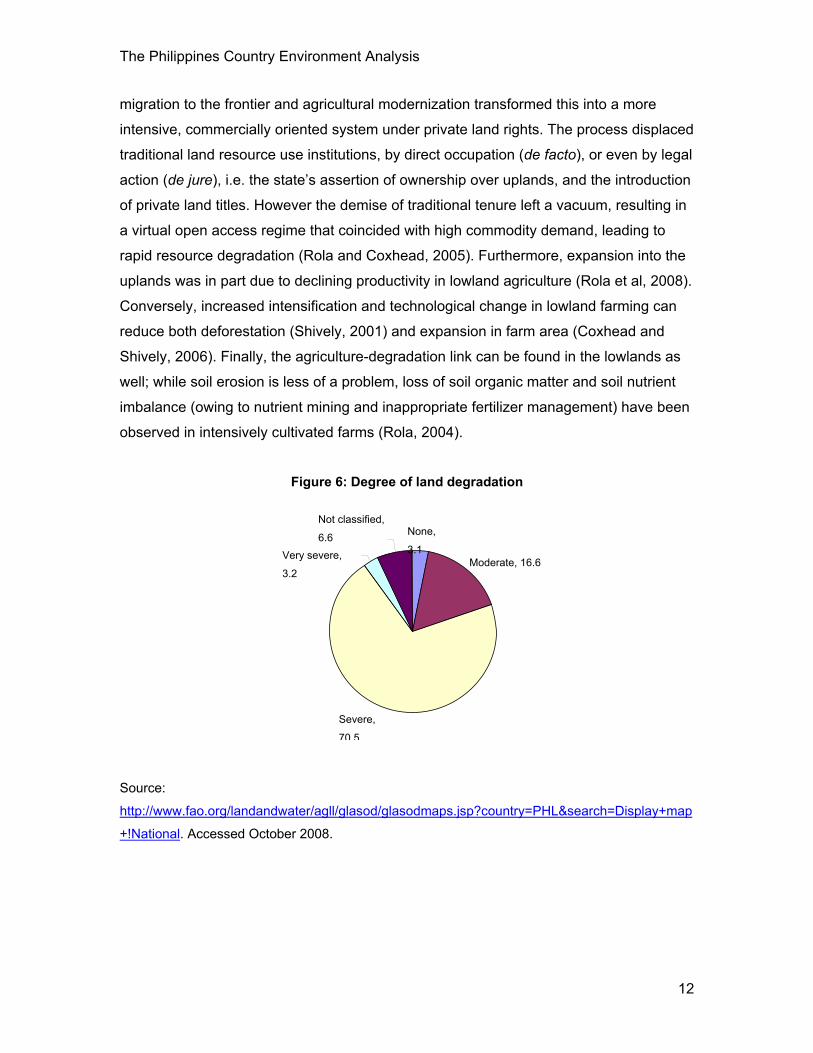
agriculture, land resources have also felt the strong impact of agricultural activity. Based
on a classification by the Global Assessment of Soil Degradation (GLASOD), over 70%
of the country’s land area has been severely degraded due to soil erosion (Figure 6).6
Forests, which used to blanket the uplands, have now been largely cleared. According to
the Department of Environment and Natural Resources (DENR, 2005), the country’s
forest cover in 1900 was 21 million ha (70% of land area); by 2005, this was down to 7
million ha (23%). However removal of primary forests should not be largely attributed to
extensification; rather, logging was initially responsible for the degradation of primary to
secondary forests and grasslands. This opened up forest land to shifting cultivation and,
much later, to intensive agriculture (Cramb, 2000).
Economic development in the uplands basic outlines of Boserup (1965): before
modern economic development, forestlands were primarily subjected to long-phase,
forest-fallow rotations, for subsistence farming, under customary tenure. Ultimately
The Philippines Country Environment Analysis
12
migration to the frontier and agricultural modernization transformed this into a more
intensive, commercially oriented system under private land rights. The process displaced
traditional land resource use institutions, by direct occupation (de facto), or even by legal
action (de jure), i.e. the state’s assertion of ownership over uplands, and the introduction
of private land titles. However the demise of traditional tenure left a vacuum, resulting in
a virtual open access regime that coincided with high commodity demand, leading to
rapid resource degradation (Rola and Coxhead, 2005). Furthermore, expansion into the
uplands was in part due to declining productivity in lowland agriculture (Rola et al, 2008).
Conversely, increased intensification and technological change in lowland farming can
reduce both deforestation (Shively, 2001) and expansion in farm area (Coxhead and
Shively, 2006). Finally, the agriculture-degradation link can be found in the lowlands as
well; while soil erosion is less of a problem, loss of soil organic matter and soil nutrient
imbalance (owing to nutrient mining and inappropriate fertilizer management) have been
observed in intensively cultivated farms (Rola, 2004).
Figure 6: Degree of land degradation
Source:
http://www.fao.org/landandwater/agll/glasod/glasodmaps.jsp?country=PHL&search=Display+map
+!National. Accessed October 2008.
None,
3.1Moderate, 16.6
Severe,
70.5
Very severe,
3.2
Not classified,
6.6
The Philippines Country Environment Analysis
13
3.3. Profile of the major crops Land use in Philippine agriculture has been dominated by a few traditional crops.
Despite apparent market incentives towards diversification, allocation of resources away
from existing cropping patterns (which may contribute to degradation) has been slow.
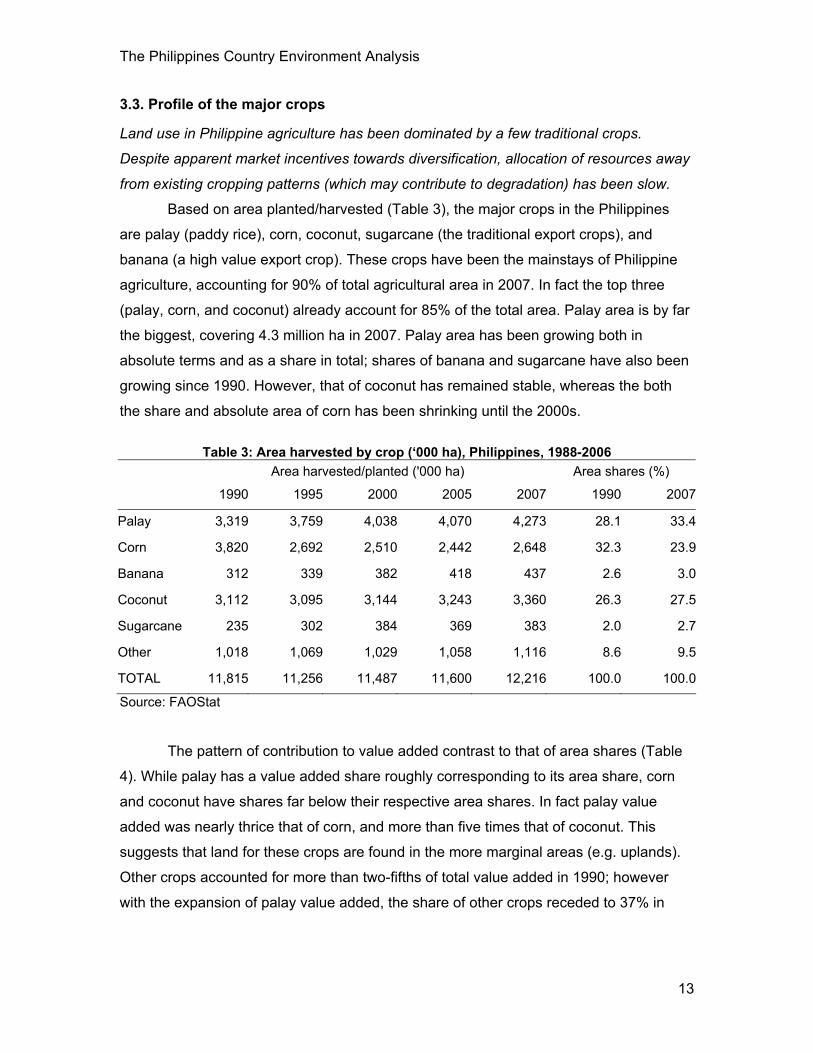
Based on area planted/harvested (Table 3), the major crops in the Philippines
are palay (paddy rice), corn, coconut, sugarcane (the traditional export crops), and
banana (a high value export crop). These crops have been the mainstays of Philippine
agriculture, accounting for 90% of total agricultural area in 2007. In fact the top three
(palay, corn, and coconut) already account for 85% of the total area. Palay area is by far
the biggest, covering 4.3 million ha in 2007. Palay area has been growing both in
absolute terms and as a share in total; shares of banana and sugarcane have also been
growing since 1990. However, that of coconut has remained stable, whereas the both
the share and absolute area of corn has been shrinking until the 2000s.
Table 3: Area harvested by crop (‘000 ha), Philippines, 1988-2006
Area harvested/planted ('000 ha) Area shares (%)
1990 1995 2000 2005 2007 1990 2007
Palay 3,319 3,759 4,038 4,070 4,273 28.1 33.4
Corn 3,820 2,692 2,510 2,442 2,648 32.3 23.9
Banana 312 339 382 418 437 2.6 3.0
Coconut 3,112 3,095 3,144 3,243 3,360 26.3 27.5
Sugarcane 235 302 384 369 383 2.0 2.7
Other 1,018 1,069 1,029 1,058 1,116 8.6 9.5
TOTAL 11,815 11,256 11,487 11,600 12,216 100.0 100.0
Source: FAOStat
The pattern of contribution to value added contrast to that of area shares (Table
4). While palay has a value added share roughly corresponding to its area share, corn
and coconut have shares far below their respective area shares. In fact palay value
added was nearly thrice that of corn, and more than five times that of coconut. This
suggests that land for these crops are found in the more marginal areas (e.g. uplands).
Other crops accounted for more than two-fifths of total value added in 1990; however
with the expansion of palay value added, the share of other crops receded to 37% in

The Philippines Country Environment Analysis
14
2007, as did the share of banana. Both corn and coconut maintained their respective
contributions to agricultural value-added.
Under the assumption of frictionless competitive markets, land should move from
low-return to high-return crops, with rates of return converging across different type of
land use (holding land quality constant). Land use change may in turn alter the rate of
land degradation. In fact however, the patterns of area allocation appear to exhibit strong
inertias to differences in net return per ha; in particular there seems to be insufficient
diversification away from traditional, low value crops towards new, high value crops.
Table 4: Gross value added of major crops, 1990 – 2007
Gross value added (millions of pesos) Shares in total (%) 1990 1995 2000 2005 2007 1990 2007
Palay 24,873 28,189 33,132 39,051 43,429 29.0 34.3
Corn 10,950 9,837 10,751 12,518 16,054 12.8 12.7
Banana 7,084 7,380 7,173 8,226 8,244 8.2 6.5
Coconut 3,652 3,964 4,642 5,691 5,463 4.3 4.3
Sugarcane 2,698 2,808 4,492 5,740 6,819 3.1 5.4
Other 36,613 40,759 40,418 43,510 46,608 42.6 36.8
TOTAL 85,870 92,937 100,608 114,736 126,617 100.0 100.0
Source: BAS.
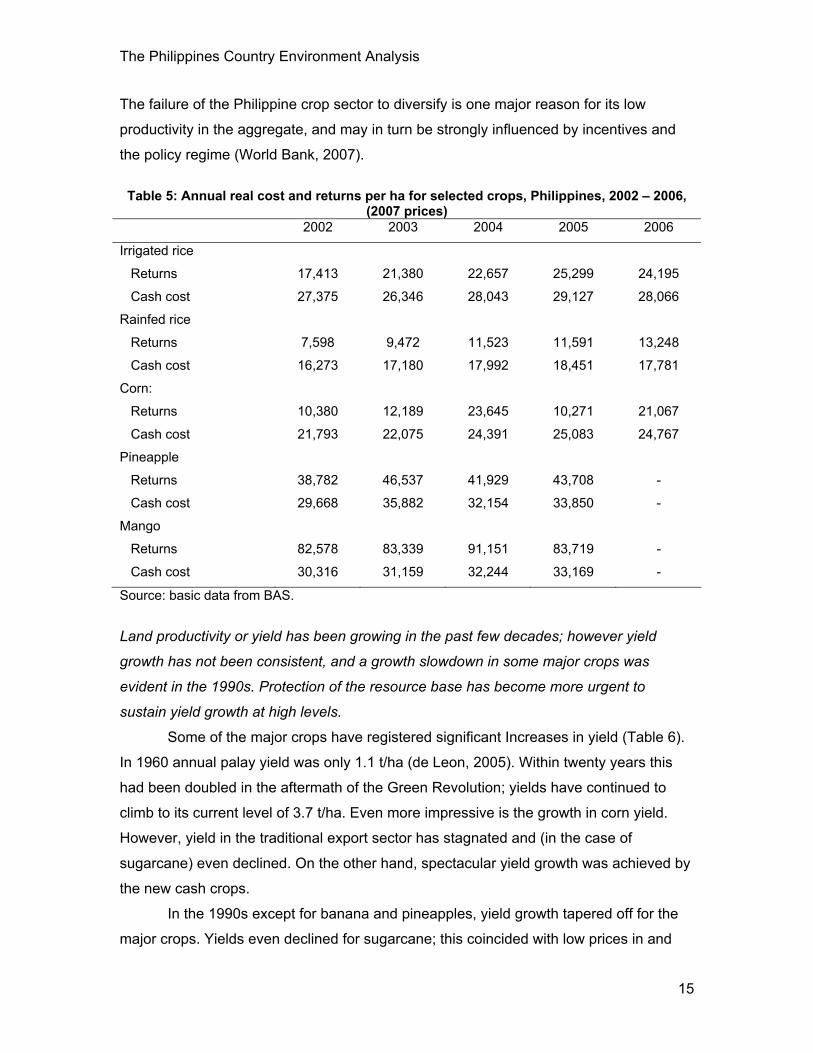
This can be seen in cost and returns data for two traditional crops and two high
value crops (Table 5), from the Bureau of Agricultural Statistics (BAS). Here the
estimates are given in annual terms, i.e. adjusting for seasonal or perennial production
cycles. 7 The data set also provides information on the component of cost paid out-of-
pocket, i.e. “cash costs”, which may act as constraints on farmers with low and erratic
cash flow. Return per ha for the high valued crops is more than double that of irrigated
rice. Meanwhile the returns to corn farming are highly variable, though still within the
range of returns to rainfed and irrigated rice. Mango farming is even more profitable than
pineapple farming. The contraction in corn area makes sense based on these figures,
but not the expansion of palay area, nor the overall failure to allocate land to high value
crops.8
Net return is of course not the sole indicator for land allocation; land quality,
gestation period, and risk also matter for crop choice. Nevertheless these persistent
discrepancies may be resulting from entry barriers in the high value sector, such as high
working capital requirement (i.e. cash cost) combined with an imperfect credit market.
The Philippines Country Environment Analysis
15
The failure of the Philippine crop sector to diversify is one major reason for its low
productivity in the aggregate, and may in turn be strongly influenced by incentives and
the policy regime (World Bank, 2007).
Table 5: Annual real cost and returns per ha for selected crops, Philippines, 2002 – 2006,
(2007 prices) 2002 2003 2004 2005 2006
Irrigated rice
Returns 17,413 21,380 22,657 25,299 24,195
Cash cost 27,375 26,346 28,043 29,127 28,066
Rainfed rice
Returns 7,598 9,472 11,523 11,591 13,248
Cash cost 16,273 17,180 17,992 18,451 17,781
Corn:
Returns 10,380 12,189 23,645 10,271 21,067
Cash cost 21,793 22,075 24,391 25,083 24,767
Pineapple
Returns 38,782 46,537 41,929 43,708 -
Cash cost 29,668 35,882 32,154 33,850 -
Mango
Returns 82,578 83,339 91,151 83,719 -
Cash cost 30,316 31,159 32,244 33,169 -
Source: basic data from BAS.
Land productivity or yield has been growing in the past few decades; however yield
growth has not been consistent, and a growth slowdown in some major crops was
evident in the 1990s. Protection of the resource base has become more urgent to
sustain yield growth at high levels.
Some of the major crops have registered significant Increases in yield (Table 6).
In 1960 annual palay yield was only 1.1 t/ha (de Leon, 2005). Within twenty years this
had been doubled in the aftermath of the Green Revolution; yields have continued to
climb to its current level of 3.7 t/ha. Even more impressive is the growth in corn yield.
However, yield in the traditional export sector has stagnated and (in the case of
sugarcane) even declined. On the other hand, spectacular yield growth was achieved by
the new cash crops.
In the 1990s except for banana and pineapples, yield growth tapered off for the
major crops. Yields even declined for sugarcane; this coincided with low prices in and

The Philippines Country Environment Analysis
16
declining quantity of the US quota market, historically the most lucrative market segment
for the sugar industry. The cereals meanwhile exhibited yield growth recovery in the
2000s; in the case of corn this was due to the spread of yellow corn varieties to meet
feed demand, while areas planted to white corn in marginal lands declined (David,
2003). In the case of rice, production growth may have been due in part to an expansion
in privately irrigated rice growing areas (Barker and Innocencio, 2007), as well as
production incentives (mainly seed and fertilizer subsidies) given by the government.
Table 6: Yield of major crops, Philippines, 1970-2006, in t/ha/yr
1970 1975 1980 1985 1990 1995 2000 2006 Annual growth, %
Paddy rice 1.7 1.7 2.2 2.6 3.0 2.8 3.1 3.7 3.1
Maize 0.8 0.9 1.0 1.1 1.3 1.5 1.8 2.4 5.2
Coconuts 3.0 4.0 2.8 2.6 3.5 4.0 4.2 4.5 1.3
Sugar cane 71.4 66.9 72.8 62.0 80.0 65.6 62.0 62.1 -0.4
Bananas 4.5 8.9 12.9 11.6 9.7 10.9 15.0 15.8 7.1
Pineapples 8.1 13.9 16.0 17.8 19.4 21.0 36.3 36.8 9.9
Source: FAOStat
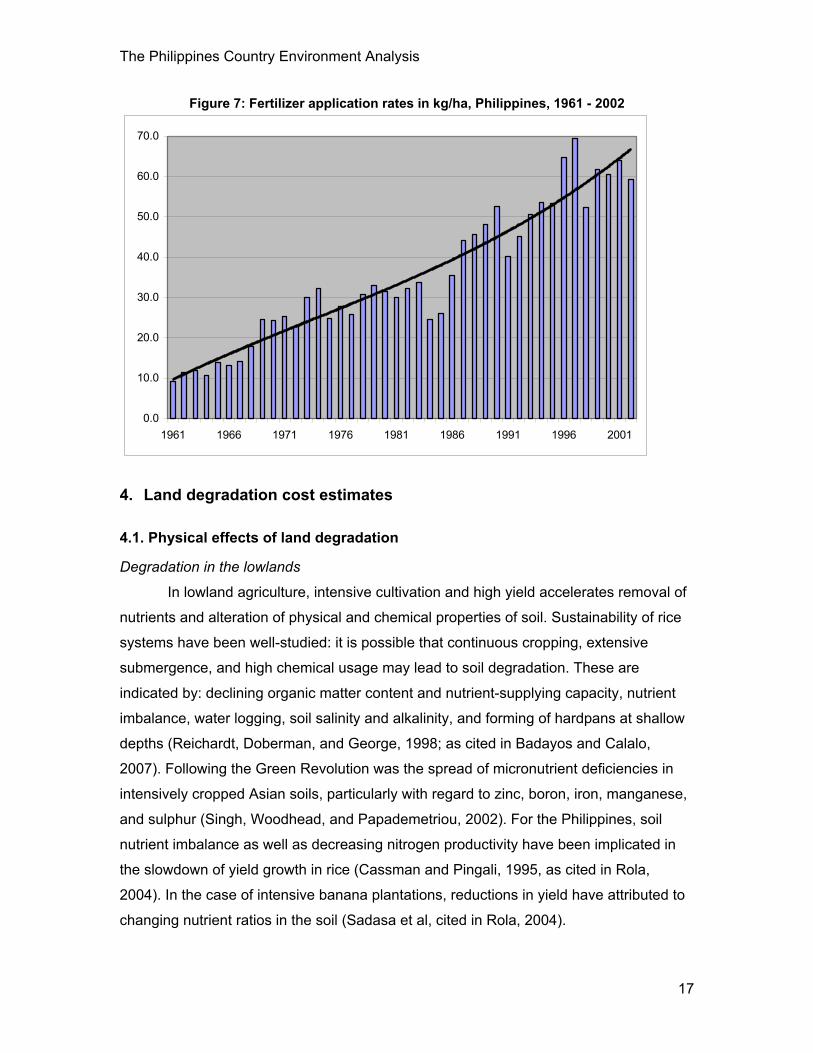
The consistent climb of yield growth may be due to intensification. Figure 7
shows fertilizer application rates since the 1960s, to which we have added a trendline.9
Clearly fertilizer application has been generally on an upward trend particularly with the
onset of the Green Revolution in the late 1960s and 1970s. Unfortunately, this may well
be masking weak supply fundamentals, i.e. slow technological progress, inadequate
infrastructure, and a deteriorating natural resource base, as may be expected from a
history of severe soil erosion. As discussed earlier, TFP, a broader productivity measure
which adjusts for input application, has generally been on a slowdown since the 1980s.
At the crop level, there is however limited analysis of TFP; in the case of rice, one study
covering the 1971 – 1990 period is available (Umetsu, Lekprichakul, and Chakravarty,
2003). This study suggests that TFP rose in the late 1970s owing to the introduction of
modern varieties, but declined in the late 1980s as a result of intensification and weak
technical change, particularly in regions where investments in infrastructure, education,
and mechanization were lower, and where the agroclimatic condition was poorer.
The Philippines Country Environment Analysis
17
Figure 7: Fertilizer application rates in kg/ha, Philippines, 1961 - 2002
0.0
10.0
20.0
30.0
40.0
50.0
60.0
70.0
1961 1966 1971 1976 1981 1986 1991 1996 2001
4. Land degradation cost estimates
4.1. Physical effects of land degradation
Degradation in the lowlands
In lowland agriculture, intensive cultivation and high yield accelerates removal of
nutrients and alteration of physical and chemical properties of soil. Sustainability of rice
systems have been well-studied: it is possible that continuous cropping, extensive
submergence, and high chemical usage may lead to soil degradation. These are
indicated by: declining organic matter content and nutrient-supplying capacity, nutrient
imbalance, water logging, soil salinity and alkalinity, and forming of hardpans at shallow
depths (Reichardt, Doberman, and George, 1998; as cited in Badayos and Calalo,
2007). Following the Green Revolution was the spread of micronutrient deficiencies in
intensively cropped Asian soils, particularly with regard to zinc, boron, iron, manganese,
and sulphur (Singh, Woodhead, and Papademetriou, 2002). For the Philippines, soil
nutrient imbalance as well as decreasing nitrogen productivity have been implicated in
the slowdown of yield growth in rice (Cassman and Pingali, 1995, as cited in Rola,
2004). In the case of intensive banana plantations, reductions in yield have attributed to
changing nutrient ratios in the soil (Sadasa et al, cited in Rola, 2004).
The Philippines Country Environment Analysis
18
However there is no evidence that such degradation is irremediable; a number
of long term experiments of continuous rice cultivation do find sustainable yields under
intensive farming with chemical inputs. Kaosa-Ard and Rerkasem (2000) note that for
Asian agriculture, irrigated land, and rainfed areas with good soil and reliable rainfall,
have yet to demonstrate the effects of degradation – and these are lands which have
contributed most to agricultural growth. In Karnal, India, soil analysis over the past 15
years show no major deterioration in yields, despite declining soil nutrients, under proper
crop and soil management. Long term experiments in the Philippines show that
continuous cultivation of irrigated rice with balanced fertilizer and submerged soils can
maintain or slightly increase soil organic matter, and maintain soil nitrogen-supplying
capacity (Pampolino et al, 2008). Furthermore over a wide range of rice-based cropping
systems, plots under organic amendments have no significant yield advantage over plots
managed with balanced application of inorganic fertilizers (Doberman and Dawe, 2008).
Degradation in the uplands
Land degradation is a bigger problem in less favored areas (Kaosa-ard and
Rerkasem, 2000); in the Philippines this takes the form of soil erosion in the uplands
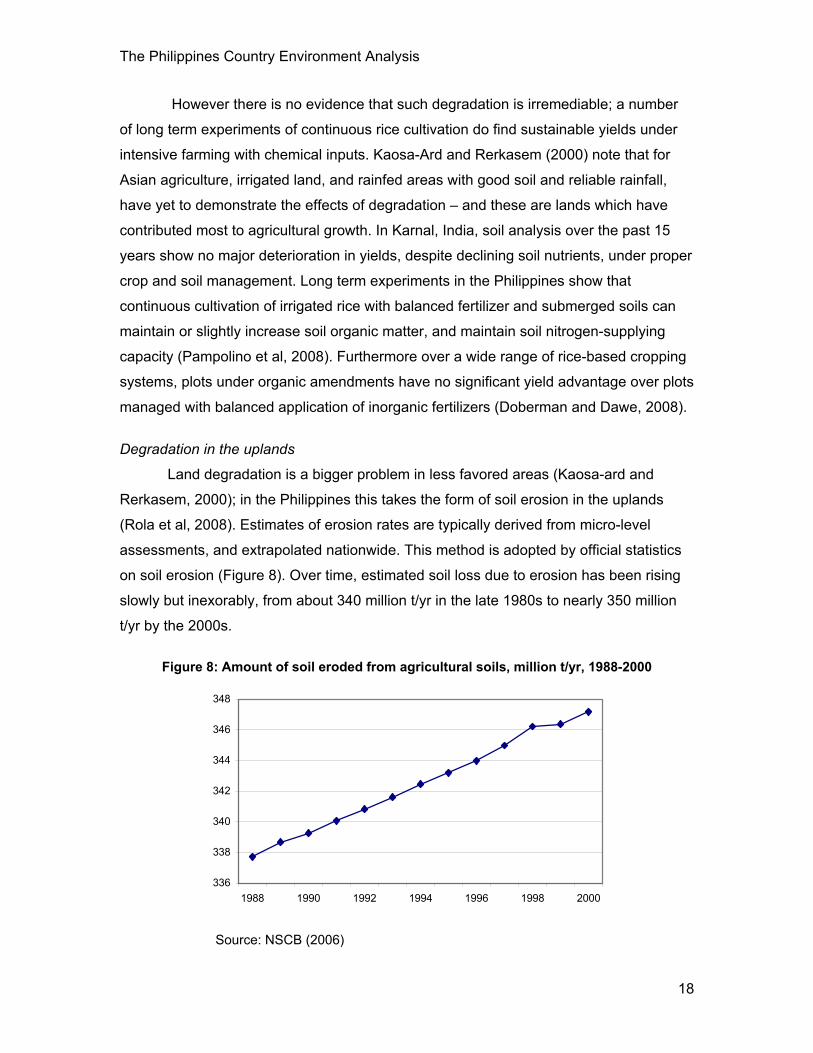
(Rola et al, 2008). Estimates of erosion rates are typically derived from micro-level
assessments, and extrapolated nationwide. This method is adopted by official statistics
on soil erosion (Figure 8). Over time, estimated soil loss due to erosion has been rising
slowly but inexorably, from about 340 million t/yr in the late 1980s to nearly 350 million
t/yr by the 2000s.
Figure 8: Amount of soil eroded from agricultural soils, million t/yr, 1988-2000
336
338
340
342
344
346
348
1988 1990 1992 1994 1996 1998 2000
Source: NSCB (2006)
The Philippines Country Environment Analysis
19
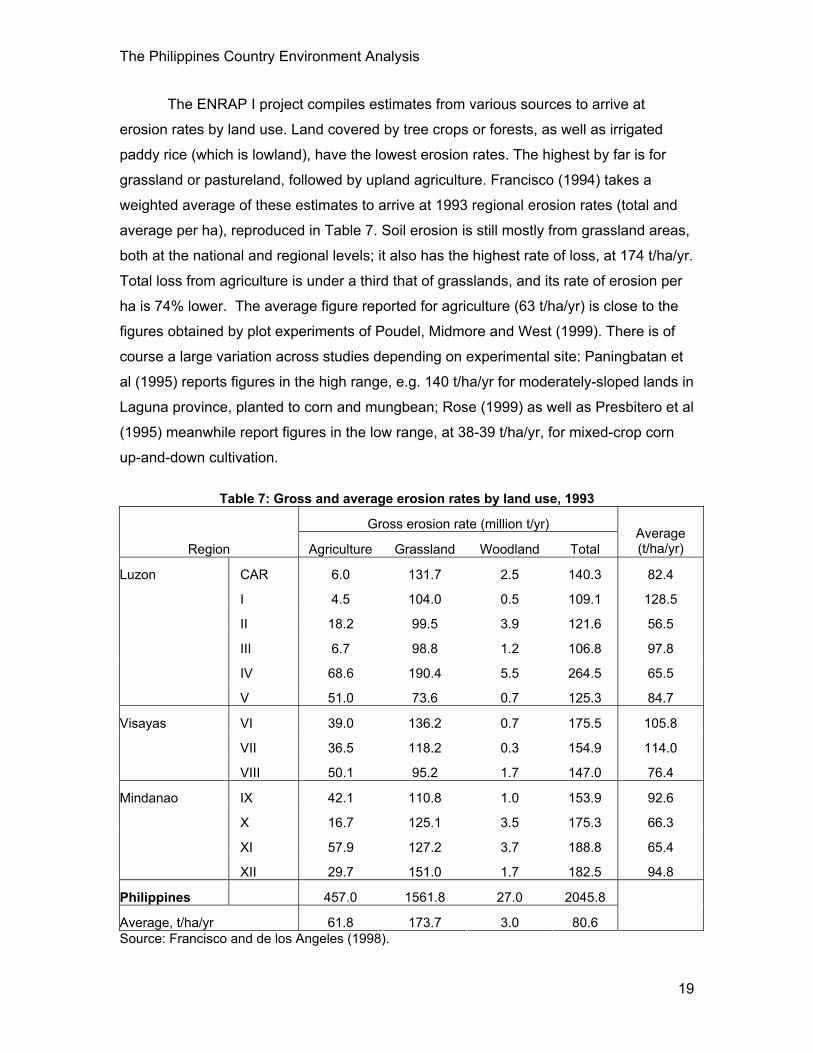
The ENRAP I project compiles estimates from various sources to arrive at
erosion rates by land use. Land covered by tree crops or forests, as well as irrigated
paddy rice (which is lowland), have the lowest erosion rates. The highest by far is for
grassland or pastureland, followed by upland agriculture. Francisco (1994) takes a
weighted average of these estimates to arrive at 1993 regional erosion rates (total and
average per ha), reproduced in Table 7. Soil erosion is still mostly from grassland areas,
both at the national and regional levels; it also has the highest rate of loss, at 174 t/ha/yr.
Total loss from agriculture is under a third that of grasslands, and its rate of erosion per
ha is 74% lower. The average figure reported for agriculture (63 t/ha/yr) is close to the
figures obtained by plot experiments of Poudel, Midmore and West (1999). There is of
course a large variation across studies depending on experimental site: Paningbatan et
al (1995) reports figures in the high range, e.g. 140 t/ha/yr for moderately-sloped lands in
Laguna province, planted to corn and mungbean; Rose (1999) as well as Presbitero et al
(1995) meanwhile report figures in the low range, at 38-39 t/ha/yr, for mixed-crop corn
up-and-down cultivation.
Table 7: Gross and average erosion rates by land use, 1993
Gross erosion rate (million t/yr)
Region Agriculture Grassland Woodland Total Average (t/ha/yr)
Luzon CAR 6.0 131.7 2.5 140.3 82.4
I 4.5 104.0 0.5 109.1 128.5
II 18.2 99.5 3.9 121.6 56.5
III 6.7 98.8 1.2 106.8 97.8
IV 68.6 190.4 5.5 264.5 65.5
V 51.0 73.6 0.7 125.3 84.7
Visayas VI 39.0 136.2 0.7 175.5 105.8
VII 36.5 118.2 0.3 154.9 114.0
VIII 50.1 95.2 1.7 147.0 76.4
Mindanao IX 42.1 110.8 1.0 153.9 92.6
X 16.7 125.1 3.5 175.3 66.3
XI 57.9 127.2 3.7 188.8 65.4
XII 29.7 151.0 1.7 182.5 94.8
Philippines 457.0 1561.8 27.0 2045.8
Average, t/ha/yr 61.8 173.7 3.0 80.6 Source: Francisco and de los Angeles (1998).
The Philippines Country Environment Analysis
20
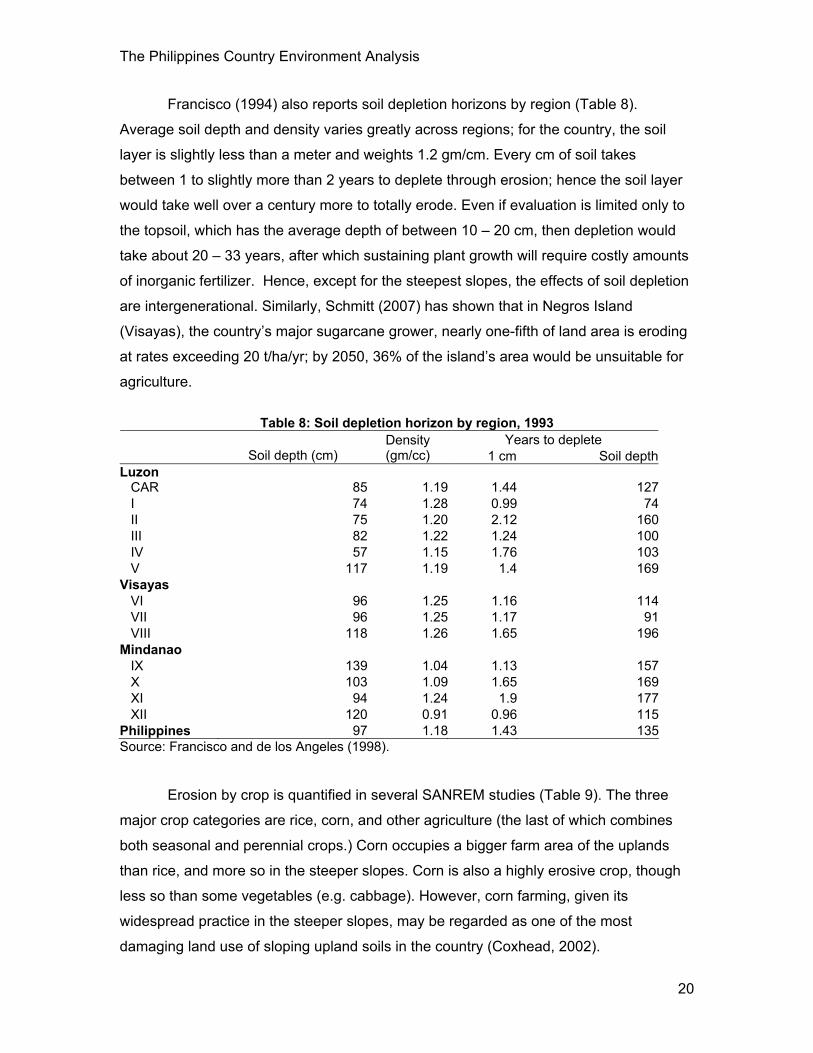
Francisco (1994) also reports soil depletion horizons by region (Table 8).
Average soil depth and density varies greatly across regions; for the country, the soil
layer is slightly less than a meter and weights 1.2 gm/cm. Every cm of soil takes
between 1 to slightly more than 2 years to deplete through erosion; hence the soil layer
would take well over a century more to totally erode. Even if evaluation is limited only to
the topsoil, which has the average depth of between 10 – 20 cm, then depletion would
take about 20 – 33 years, after which sustaining plant growth will require costly amounts
of inorganic fertilizer. Hence, except for the steepest slopes, the effects of soil depletion
are intergenerational. Similarly, Schmitt (2007) has shown that in Negros Island
(Visayas), the country’s major sugarcane grower, nearly one-fifth of land area is eroding
at rates exceeding 20 t/ha/yr; by 2050, 36% of the island’s area would be unsuitable for
agriculture.
Table 8: Soil depletion horizon by region, 1993
Years to deplete Soil depth (cm)
Density (gm/cc) 1 cm Soil depth
Luzon CAR 85 1.19 1.44 127 I 74 1.28 0.99 74 II 75 1.20 2.12 160 III 82 1.22 1.24 100 IV 57 1.15 1.76 103 V 117 1.19 1.4 169Visayas VI 96 1.25 1.16 114 VII 96 1.25 1.17 91 VIII 118 1.26 1.65 196Mindanao IX 139 1.04 1.13 157 X 103 1.09 1.65 169 XI 94 1.24 1.9 177 XII 120 0.91 0.96 115Philippines 97 1.18 1.43 135Source: Francisco and de los Angeles (1998).
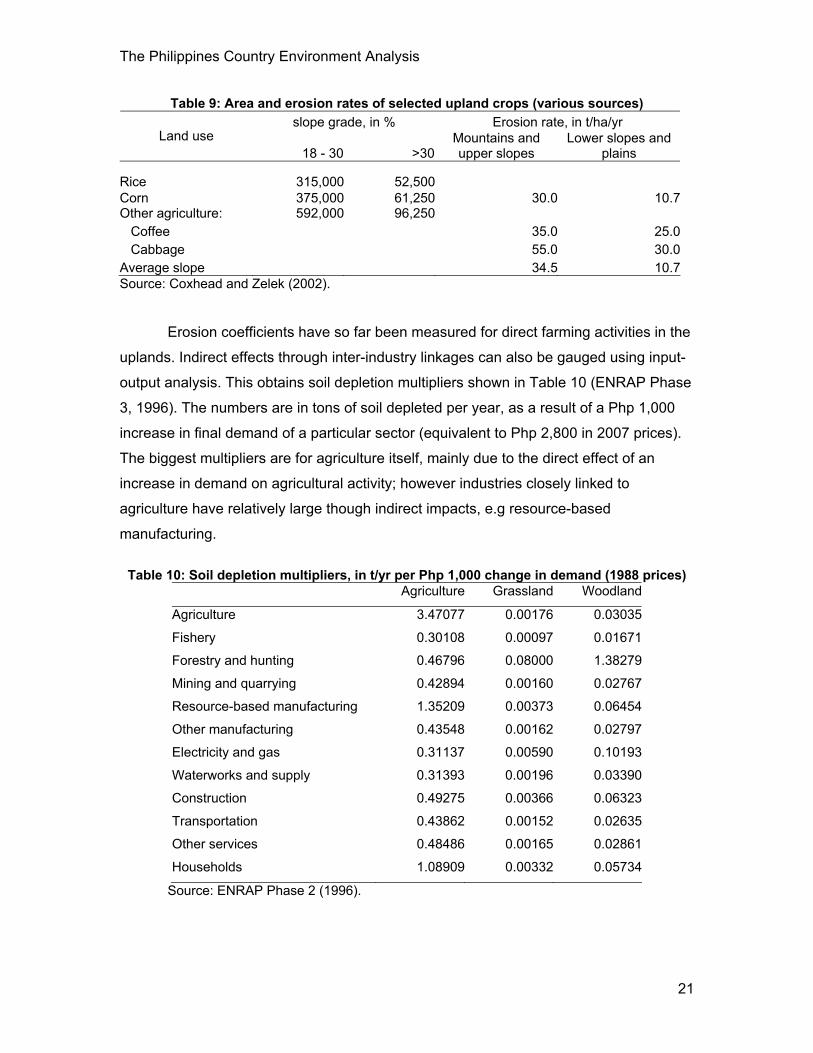
Erosion by crop is quantified in several SANREM studies (Table 9). The three
major crop categories are rice, corn, and other agriculture (the last of which combines
both seasonal and perennial crops.) Corn occupies a bigger farm area of the uplands
than rice, and more so in the steeper slopes. Corn is also a highly erosive crop, though
less so than some vegetables (e.g. cabbage). However, corn farming, given its
widespread practice in the steeper slopes, may be regarded as one of the most
damaging land use of sloping upland soils in the country (Coxhead, 2002).
The Philippines Country Environment Analysis
21
Table 9: Area and erosion rates of selected upland crops (various sources) slope grade, in % Erosion rate, in t/ha/yr
Land use 18 - 30 >30
Mountains and upper slopes
Lower slopes and plains
Rice 315,000 52,500 Corn 375,000 61,250 30.0 10.7Other agriculture: 592,000 96,250 Coffee 35.0 25.0 Cabbage 55.0 30.0Average slope 34.5 10.7Source: Coxhead and Zelek (2002).
Erosion coefficients have so far been measured for direct farming activities in the
uplands. Indirect effects through inter-industry linkages can also be gauged using input-
output analysis. This obtains soil depletion multipliers shown in Table 10 (ENRAP Phase
3, 1996). The numbers are in tons of soil depleted per year, as a result of a Php 1,000
increase in final demand of a particular sector (equivalent to Php 2,800 in 2007 prices).
The biggest multipliers are for agriculture itself, mainly due to the direct effect of an
increase in demand on agricultural activity; however industries closely linked to
agriculture have relatively large though indirect impacts, e.g resource-based
manufacturing.
Table 10: Soil depletion multipliers, in t/yr per Php 1,000 change in demand (1988 prices)
Agriculture Grassland Woodland
Agriculture 3.47077 0.00176 0.03035
Fishery 0.30108 0.00097 0.01671
Forestry and hunting 0.46796 0.08000 1.38279
Mining and quarrying 0.42894 0.00160 0.02767
Resource-based manufacturing 1.35209 0.00373 0.06454
Other manufacturing 0.43548 0.00162 0.02797
Electricity and gas 0.31137 0.00590 0.10193
Waterworks and supply 0.31393 0.00196 0.03390
Construction 0.49275 0.00366 0.06323
Transportation 0.43862 0.00152 0.02635
Other services 0.48486 0.00165 0.02861
Households 1.08909 0.00332 0.05734
Source: ENRAP Phase 2 (1996).
The Philippines Country Environment Analysis
22
4.2. Costs of land degradation
On-site costs: estimates
For lowland agriculture, the evidence suggests that the “natural capital” inherent
in land resources, is depreciated over the course of intensive farm operations; like
physical capital, this natural capital can be protected and even enhanced by
maintenance or management activities. Hence losses are internalized and valuation
appears to be an inappropriate tool for understanding the allocative effects of
degradation.
The uplands however may be a different case: soil erosion may involve a true
loss to society as farmers fail to internalize the effects of resource degradation. This is
most obviously true for off-site costs; however as seen in the above discussion of Table
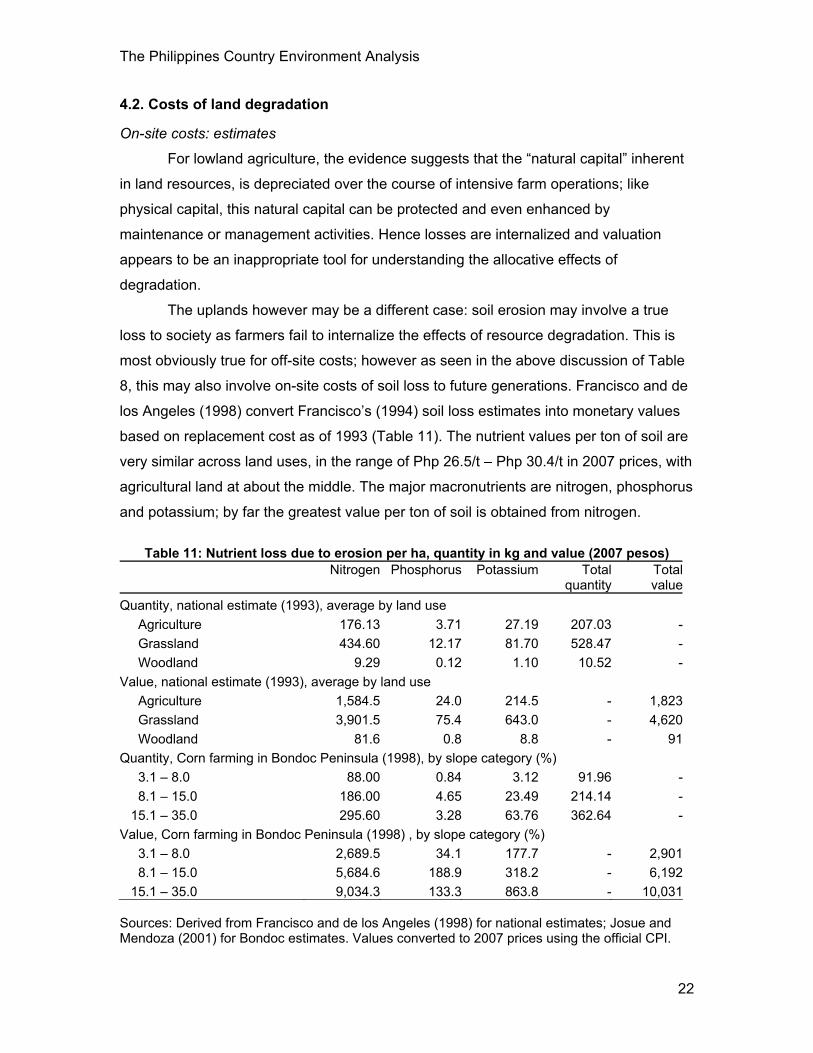
8, this may also involve on-site costs of soil loss to future generations. Francisco and de
los Angeles (1998) convert Francisco’s (1994) soil loss estimates into monetary values
based on replacement cost as of 1993 (Table 11). The nutrient values per ton of soil are
very similar across land uses, in the range of Php 26.5/t – Php 30.4/t in 2007 prices, with
agricultural land at about the middle. The major macronutrients are nitrogen, phosphorus
and potassium; by far the greatest value per ton of soil is obtained from nitrogen.
Table 11: Nutrient loss due to erosion per ha, quantity in kg and value (2007 pesos)
Nitrogen Phosphorus Potassium Total
quantityTotal value
Quantity, national estimate (1993), average by land use Agriculture 176.13 3.71 27.19 207.03 - Grassland 434.60 12.17 81.70 528.47 - Woodland 9.29 0.12 1.10 10.52 -Value, national estimate (1993), average by land use Agriculture 1,584.5 24.0 214.5 - 1,823 Grassland 3,901.5 75.4 643.0 - 4,620 Woodland 81.6 0.8 8.8 - 91Quantity, Corn farming in Bondoc Peninsula (1998), by slope category (%) 3.1 – 8.0 88.00 0.84 3.12 91.96 - 8.1 – 15.0 186.00 4.65 23.49 214.14 - 15.1 – 35.0 295.60 3.28 63.76 362.64 -Value, Corn farming in Bondoc Peninsula (1998) , by slope category (%) 3.1 – 8.0 2,689.5 34.1 177.7 - 2,901 8.1 – 15.0 5,684.6 188.9 318.2 - 6,192 15.1 – 35.0 9,034.3 133.3 863.8 - 10,031 Sources: Derived from Francisco and de los Angeles (1998) for national estimates; Josue and Mendoza (2001) for Bondoc estimates. Values converted to 2007 prices using the official CPI.
The Philippines Country Environment Analysis
23
Losses per ton of soil can be converted into losses per ha based on average
erosion rates. Losses are by far highest for grasslands due to heavy erosion rates. For
agricultural land, erosion loss per ha is only about Php 1,800/ha. Table 11 also reports
plot-level evaluation of soil loss using belt transect method, conducted in Bondoc
Peninsula of Luzon (Josue and Mendoza, 2001). Measured soil loss varied from 26 -
159 t/ha/yr for corn monocropping, and 17 - 183 t/ha/yr for fallow land, depending on the
slope. Coconut monocropping led to a soil loss of at most 5.4 t/ha/yr on the steepest
slopes (15 – 35% grade). Coconut-corn intercrop led to a dramatic increase of erosion
loss; for the steepest slopes the loss reached nearly 90 t/ha/yr. Soil loss was then
converted to nutrient loss and valued at fertilizer prices. As with Francisco and de los
Reyes, most of the nutrient loss is due to nitrogen. Since erosion rate is faster for
steeper slopes, the replacement cost likewise increases with slope. Nutrient loss value
for the second slope category is more than double that of the first; the third is 62% above
that of the second. At the last level, the value of loss virtually matches the net farm
income per ha – an indication of upward bias in the replacement cost method.
The alternative is the yield loss method. Decena (1999) applies this on data from
a PCARRD and IBSRAM study (respectively, Philippine Council for Agriculture and
Natural Resources Research and Development; and International Board for Soil
Research and Management). The study, conducted in upland farms in the provinces of
Rizal and Batangas (both in Luzon), compared farmer’s practice (up-and-down
cultivation with no fertilizer) with soil conservation farming systems. The productivity
difference between farmer’s practice and conservation systems in Rizal was valued at
Php 19,862 (compared to a replacement cost of only Php 11,568); in Batangas the yield
difference was valued at Php 13,037, this time smaller than the replacement cost equal
to Php 26,451 (which is rather an overestimate due to the severity of potassium
degradation in the area.)
Alternatively, one may compute yield differences using an agronomic model. De
Guzman (1997) used the EPIC (Erosion Productivity Impact Calculator) on IBSRAM
experimental data over the period 1990 – 2002. Actual measured soil loss under
farmer’s practice ranges from 18 – 124 t/ha/yr; the EPIC simulations predicted 18 – 71
t/ha/yr, quite accurate for the majority of the sample. The EPIC also predicted nearly
zero soil loss under conservation farming, consistent with actual measurement. However
actual and predicted yields showed substantially larger discrepancies, which points to
caution in the use of simulated data.10 To project future yield loss, crop simulations
The Philippines Country Environment Analysis
24
(when done properly) would probably perform better than simply extrapolating forward
from small-sample yield differences ex post.
Nelson (1996a, 1996b) applied agronomic modeling to compare open field maize
farming and farming with soil conservation. Model parameterization used data from
comparative field trials; economic data was collected from communities adjacent to the
field trials. Cropping and tillage practices were kept identical across farming methods.
For an erosion-prone site (located in Tranca, Laguna, Luzon), yields were projected
using the APSIM (Agricultural Production Simulator) over a 50-year horizon, of which 36
years were based on past rainfall data, and the remainder obtained from a random re-
sampling of the historical data. Predicted maize yields ranged from 1,000 to more than
3,000 kg/ha for conservation farming, with no clear time trend; however for open field
cultivation, maize yield was initially highest at nearly 3,000 kg/ha, but deteriorated
steadily over time, dipping below 500 kg/ha from year 30 onward. The differences in
midpoint are about 1,250 kg/ha, which converts to about Php 13,318 in 2007 prices.
Meanwhile for a less erosion-prone site (Claveria, Mindanao), the SCUAF (Soil
Changes Under Agroforestry) model was used over a 25-year horizon. The predicted
yields under either open field or alley cropping was about 1,400 kg/ha, but would steadily
decline; by year 25, yield under open field would fall below 400 kg/ha, while that of alley
cropping would still reach nearly 800 kg/ha. The difference in midpoint are smaller, at
only 200 kg/ha, which converts to just Php 892.
On-site costs: evaluation and synthesis
To summarize: the variations in per ha cost estimates is very large, rendering an
extrapolation to a national scale problematic. The estimates vary according to plot and
site characteristics, as well as valuation method. The fertilizer replacement approach is
prone to exaggerating the cost of land degradation. On-site, soil loss from erosion does
not entail a reduction in current plant nutrient uptake, only a decline in nutrient
availability over the long term. Moreover even if the decline in nutrient uptake equals that
lost from erosion, supplementation from inorganic fertilizer need not entail complete
replacement of lost nutrients, as a profit-maximizing enterprise would limit fertilizer use
to the point where the marginal benefits of fertilization equals the fertilizer price. Finally,
there is little reliable information about the extent of soil transfer from farm to farm by
way of erosion, further compounding the upward bias.
The Philippines Country Environment Analysis
25
It turns out that applications of the yield difference approach, whether based on
experiments or model simulation, also tend to produce high figures. For our national
estimate, we take the lower bound from the replacement cost approach, i.e. from
Francisco and de los Angeles (1998), and amend it further with more conservative
erosion estimates (38 t/ha/yr) based on Presbitero et al (1995). We apply this to the
estimated total upland area, which is about 7.5 million ha, based on the upland area
estimates of Francisco and de los Angeles, though updated by a fixed share assumption
to the current agricultural area (12.2 million ha).
The resulting figure is Php 6,428 million per year; this is equivalent to just 0.6%
of gross value added in agriculture in 2007. In contrast, the research intensity ratio has
ranged from 0.26 to 0.37% since 2001. Our estimate of the cost of soil erosion may be
considered a conservative “lower bound”, compared with estimates from other
developing regions; for instance, Young (1994) reckoned the cost of land degradation at
about 3.7% of agricultural value added in South Asia. Our national estimate is still
however higher than other studies from the region; for example, Huang and Rozelle
(1995) erosion and salinization reduced grain yields in China by only 0.4% per year in
1976-1989. Further work is needed to more accurately gauge the cost of land
degradation on agriculture on a national scale.
Off-site costs
Thus far analysis has been restricted to on-site costs, studies on off-site costs
are sparse. An early paper is Cruz, Francisco, and Conway (1988), a case study of two
major irrigation and hydropower dams in Luzon (Magat and Pantabangan). In the
watershed area, large areas of forest cover has been replaced by grassland and
farmland. The measured sedimentation rate in the early 1980s is 73% higher than
projected; higher sedimentation is attributed to the unanticipated land degradation in the
watershed. This shortens dam lifespan, and reduces dam services by limiting storage
capacity. Costs are largely accounted for by decreased irrigation services. The annual
cost per ha of irrigation service area is estimated as high as Php 9,600 for Pantabangan
and Php 6,000 for Magat.11
A fairly comprehensive, national-level assessment of off-site impacts and costs is
done by Saastamoinen (1994), though the estimation is largely based on educated
guesswork. Aside from irrigation systems, the other off-site impacts are itemized as
follows:
The Philippines Country Environment Analysis
26
• Rainfed agriculture – erosion reduces water supply and retention in rainfed areas,
increases siltation in rivers and contributes to flooding.
• Fishery and aquaculture – silt reduces light penetration and primary productivity in
the water column; flooding damages cages and ponds; siltation of rivers and lakes
reduce productivity of inland fishing; sediment deposits damage coral reefs.
• Food and beverage manufacturing – reduced water quality increases manufacturing
costs.
• Construction – flooding increases costs for the construction sector.
• Water supply – loss of natural cover and associated watershed degradation reduces
available freshwater and affects water quality.
• Tourism – sedimentation reduces quality of beaches and coral reefs.
Estimates are then made about the magnitude of the effects, in terms of
percentages of sector value-added or other related parameters. Where little is known
about the impact of erosion, very low percentages are imputed (e.g. 0.5% for tourism).
Where effects are clearer higher percentages are selected, e.g. 30% of reef fisheries.
Replacement cost was used where this would lead to lower estimates, e.g. power loss
from hydroelectric generation is set at 3% of total; this is then valued by the additional
cost from replacing lost electricity through diesel – powered generation. Likewise,
assumed domestic water supply loss of 5% was valued by the additional cost from
replacing the water supply by other methods, e.g. deep well. The final figure is P6.8
billion for 1988 (Php 27 billion in 2007 prices), or about 0.8% of GDP at the time.
Water sampling in four sub-watersheds in upper Manupali River (Mindanao) over
the period 1994 -2002 is one of very few time series data that can link water trends to
deforestation. Suspended solids range from 5.5 to 5.9 mg/L for the two sub-watersheds
where forest cover ranged from 31 – 44%, while agricultural land occupied only 36 –
45% of area. Suspended solids rose to 9.7 mg/L for a more degraded watershed (24%
forest cover and 60% farm land). In the most degraded sub-watershed, (21% forest
cover and 72% farm land), suspended solids in the upper rivers reached 29.4 mg/L,
nearly a six-fold increase over the upper rivers in the more intact watersheds (Rola et al,
2004).
More recent studies have been reviewed in Rola et al (2008). Site-specific
studies for the Manupali watershed indicate a 27% drop in lowland rice yield owing to
deterioration of the irrigation system due to siltation. Serviceable area was also restricted
to 24% of the irrigable area. In the case of the Malinao dam in the Visayas, siltation has
The Philippines Country Environment Analysis
27
shortened service life from 80 to 20 years. Upland agriculture was implicated, as over
60% of agricultural land in the watershed is sloped in excess of 18%, and traditional
maize and cassava cultivation results in an eleven-fold increase in soil erosion over
more conserving systems.
Rola et al (2008) however note that much of the sediments in irrigation systems
may not actually come from soil erosion in upland farms, as there is considerable
deposition in the hill slopes (NSCB statistics in fact assume just a 20% sedimentation
rate from farm soil erosion.) Erosion in grasslands, bank deterioration, built-over
structures (e.g. roads), footpaths, mining (where this is present) may also be implicated
in siltation of lowland water systems. Hence, while sedimentation has seriously harmed
lowland agriculture through its effect on water systems and irrigation service coverage, it
is unclear that soil erosion from agriculture is a significant source of sediments.
5. Benefit-cost analysis of priority interventions
5.1. Background
Governance and tenure in the uplands
Based on our assessment of land degradation costs, we delimit the set of priority
interventions to those aimed at upland soil conservation or land rehabilitation. At the
national level, the agency with primary responsibility over natural resources, particularly
forest land, is the DENR. Management of soil resources fall under the BSWM, which is a
bureau of the Department of Agriculture (DA). Under the Local Government Code of
1991, local government units (LGUs) were assigned powers and functions previously
exercised by national government; devolved functions include agricultural support
services, health and social services, provision and maintenance of local roads, bridges,
water supply, and other infrastructure, and management of local natural resources.
Land may be classified by legal status as alienable and disposable, or as public
forest land. The former accounts for 47% of the country’s land total area. The majority of
this area (64.8%) is privately owned and titled (Llanto and Ballesteros, 2003). The
remainder consists of lands in the public domain which can be potentially converted into
private lands. There is however an enormous difference between the legal classification,
and actual use and possession. Forestland has been defined as areas with an 18-
degree slope or higher; however a large portion of such areas are actually in use as
The Philippines Country Environment Analysis
28
settlement and agricultural land, although have yet to be reclassified. Of the 52% of the
country’s rural population, 22% reside in the forest zone (World Bank, 2004).
Following the 1986 Constitution, public forest lands can, with the approval of the
State, be exploited by individuals or associations through co-production, joint venture, or
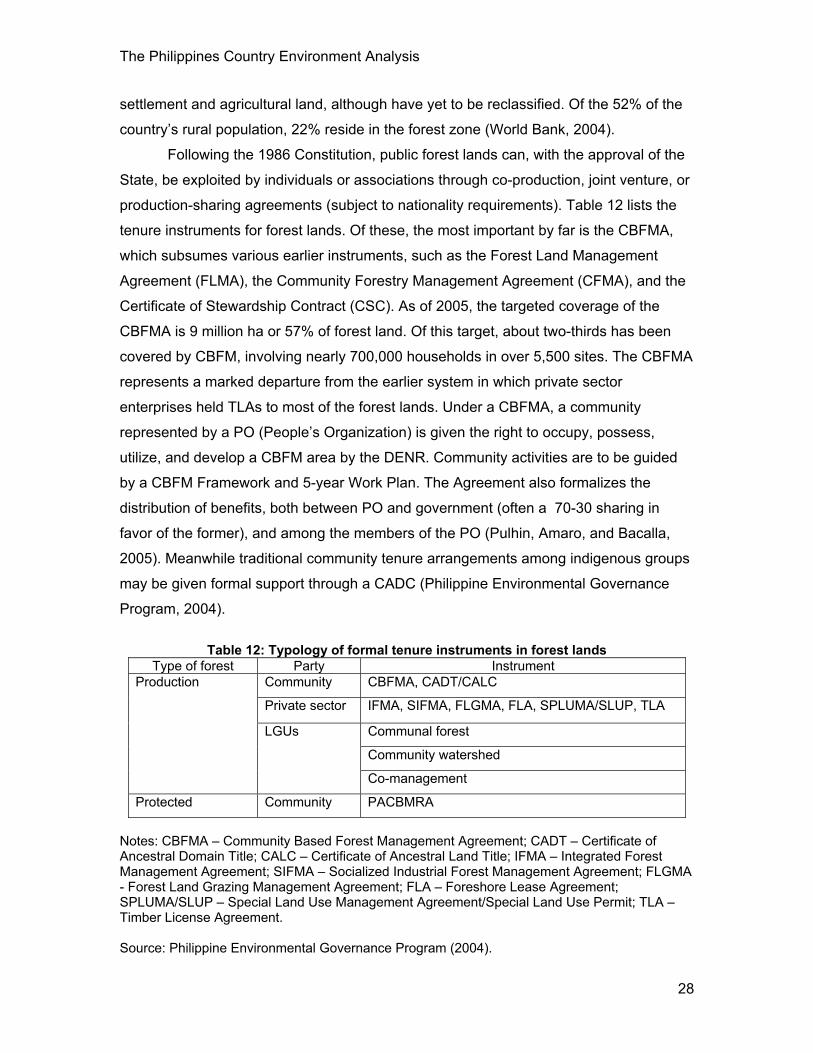
production-sharing agreements (subject to nationality requirements). Table 12 lists the
tenure instruments for forest lands. Of these, the most important by far is the CBFMA,
which subsumes various earlier instruments, such as the Forest Land Management
Agreement (FLMA), the Community Forestry Management Agreement (CFMA), and the
Certificate of Stewardship Contract (CSC). As of 2005, the targeted coverage of the
CBFMA is 9 million ha or 57% of forest land. Of this target, about two-thirds has been
covered by CBFM, involving nearly 700,000 households in over 5,500 sites. The CBFMA
represents a marked departure from the earlier system in which private sector
enterprises held TLAs to most of the forest lands. Under a CBFMA, a community
represented by a PO (People’s Organization) is given the right to occupy, possess,
utilize, and develop a CBFM area by the DENR. Community activities are to be guided
by a CBFM Framework and 5-year Work Plan. The Agreement also formalizes the
distribution of benefits, both between PO and government (often a 70-30 sharing in
favor of the former), and among the members of the PO (Pulhin, Amaro, and Bacalla,
2005). Meanwhile traditional community tenure arrangements among indigenous groups
may be given formal support through a CADC (Philippine Environmental Governance
Program, 2004).
Table 12: Typology of formal tenure instruments in forest lands
Type of forest Party Instrument Community CBFMA, CADT/CALC
Private sector IFMA, SIFMA, FLGMA, FLA, SPLUMA/SLUP, TLA
Communal forest
Community watershed
Production
LGUs
Co-management
Protected Community PACBMRA
Notes: CBFMA – Community Based Forest Management Agreement; CADT – Certificate of Ancestral Domain Title; CALC – Certificate of Ancestral Land Title; IFMA – Integrated Forest Management Agreement; SIFMA – Socialized Industrial Forest Management Agreement; FLGMA - Forest Land Grazing Management Agreement; FLA – Foreshore Lease Agreement; SPLUMA/SLUP – Special Land Use Management Agreement/Special Land Use Permit; TLA – Timber License Agreement. Source: Philippine Environmental Governance Program (2004).
The Philippines Country Environment Analysis
29
Types of interventions
Instruments to address land degradation are either direct or indirect. Direct
instruments involve the promotion of: i) soil conserving technologies; ii) more sustainable
land uses, such as tree and permanent crops. Of these instruments, benefit-cost
analysis has been most frequently applied to soil conservation technologies. These
technologies, as described in Garcia et al (2000), include physical barriers, vegetative
barriers (e.g. contour hedgerows), supplementary physical structures (e.g. drainage
canals), and farm practices (e.g. crop rotation, multiple cropping, etc.) The more
important types promoted in the Philippines include:
• Hedgerow intercropping –establishment of hedgerows (often in double rows) of
leguminous shrubs or grasses on contour, while farming annual and perennial crops
on the alleys. This technology reduces run-off, traps sediments, and forms terraces.
• Bench terracing – construction of terraces using the cut-and-fill method, to reduce
run-off and erosion by leveling the slope.
• Contour rock walls – construction of rock walls (0.5 to 1.0 m thick) on contour, with
walls stabilized by shrubs or trees, to reduce runoff and trap sediments at the wall
base.
• Contour bunds – construction of embankments and canals on the contour, often with
hedgerows on the embankments, to trap sediment, increase infiltration, and drain
excess runoff.
Among these, sloping agricultural land technology (SALT) based on alley
cropping has been the focus of various government and nongovernment efforts
(Esquejo, 2004). The SALT in the Philippines was pioneered by nongovernment
organizations. Government programs also subscribe to these technologies, often within
agroforestry projects of the DENR in the CBFM and ISF areas. Similarly numerous
research projects in natural resource management (NRM) have been pursued in state
universities and colleges, Department of Agriculture - Bureau of Agricultural Research,
and PCARRD.
Meanwhile indirect instruments work by altering incentives for the direct
instruments, i.e. encourage the adoption of conserving technologies, penalize erosive
land use, and so forth. These include trade policies, taxation, finance policies, as well as
institutional changes such as tenure reform, devolution of field extension services, etc. In
particular, domestic protection for annual crops grown in the uplands point to market
distortions that inadvertently promote upland degradation. Domestic corn producers
The Philippines Country Environment Analysis
30
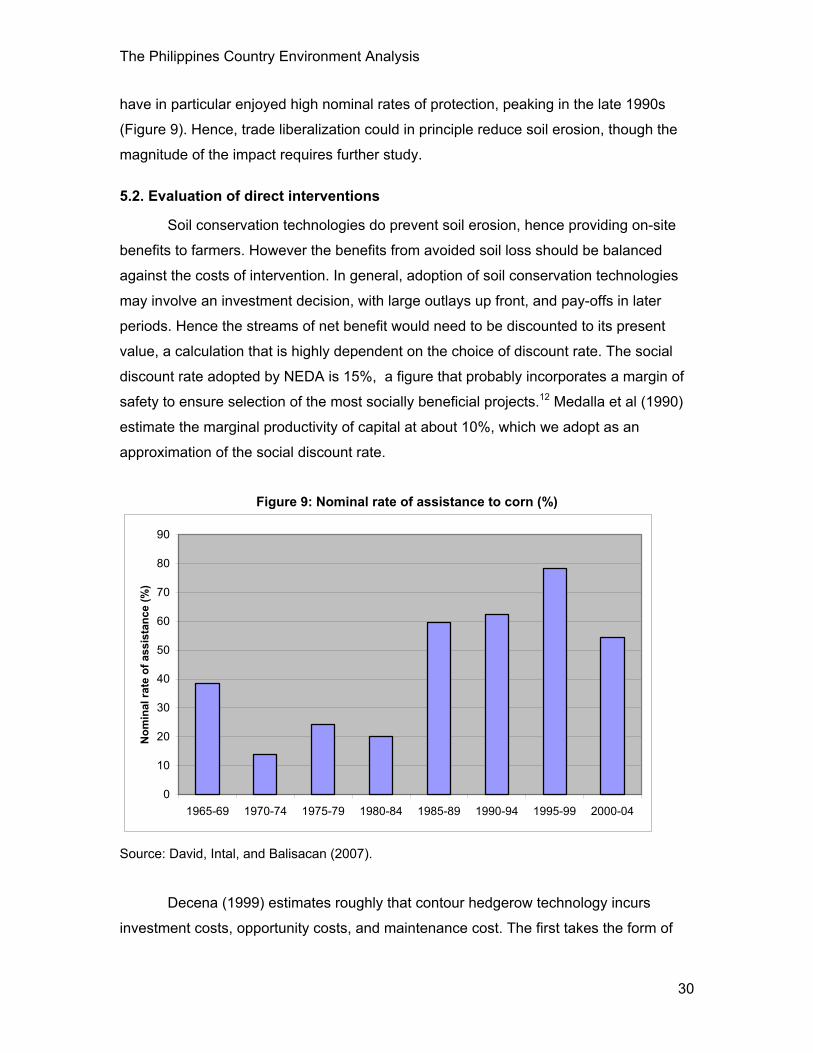
have in particular enjoyed high nominal rates of protection, peaking in the late 1990s
(Figure 9). Hence, trade liberalization could in principle reduce soil erosion, though the
magnitude of the impact requires further study.
5.2. Evaluation of direct interventions
Soil conservation technologies do prevent soil erosion, hence providing on-site
benefits to farmers. However the benefits from avoided soil loss should be balanced
against the costs of intervention. In general, adoption of soil conservation technologies
may involve an investment decision, with large outlays up front, and pay-offs in later
periods. Hence the streams of net benefit would need to be discounted to its present
value, a calculation that is highly dependent on the choice of discount rate. The social
discount rate adopted by NEDA is 15%, a figure that probably incorporates a margin of
safety to ensure selection of the most socially beneficial projects.12 Medalla et al (1990)
estimate the marginal productivity of capital at about 10%, which we adopt as an
approximation of the social discount rate.
Figure 9: Nominal rate of assistance to corn (%)
0
10
20
30
40
50
60
70
80
90
1965-69 1970-74 1975-79 1980-84 1985-89 1990-94 1995-99 2000-04
Nom
inal
rate
of a
ssis
tanc
e (%
)
Source: David, Intal, and Balisacan (2007).
Decena (1999) estimates roughly that contour hedgerow technology incurs
investment costs, opportunity costs, and maintenance cost. The first takes the form of
The Philippines Country Environment Analysis
31
labor and planting materials to establish contour hedgerows. The next two are recurring
costs: the opportunity cost is the loss in farm production owing to the diversion of farm
land into hedgerows; the last is the cost in terms of labor and planting materials to keep
the hedgerows intact. Establishment cost is estimated at Php 28,360/ha/yr (2007 prices);
opportunity cost can be estimated from the fact that, on average, 16% of farm area is
occupied by the hedgerows; finally, maintenance costs is only Php 2,127/ha/yr.
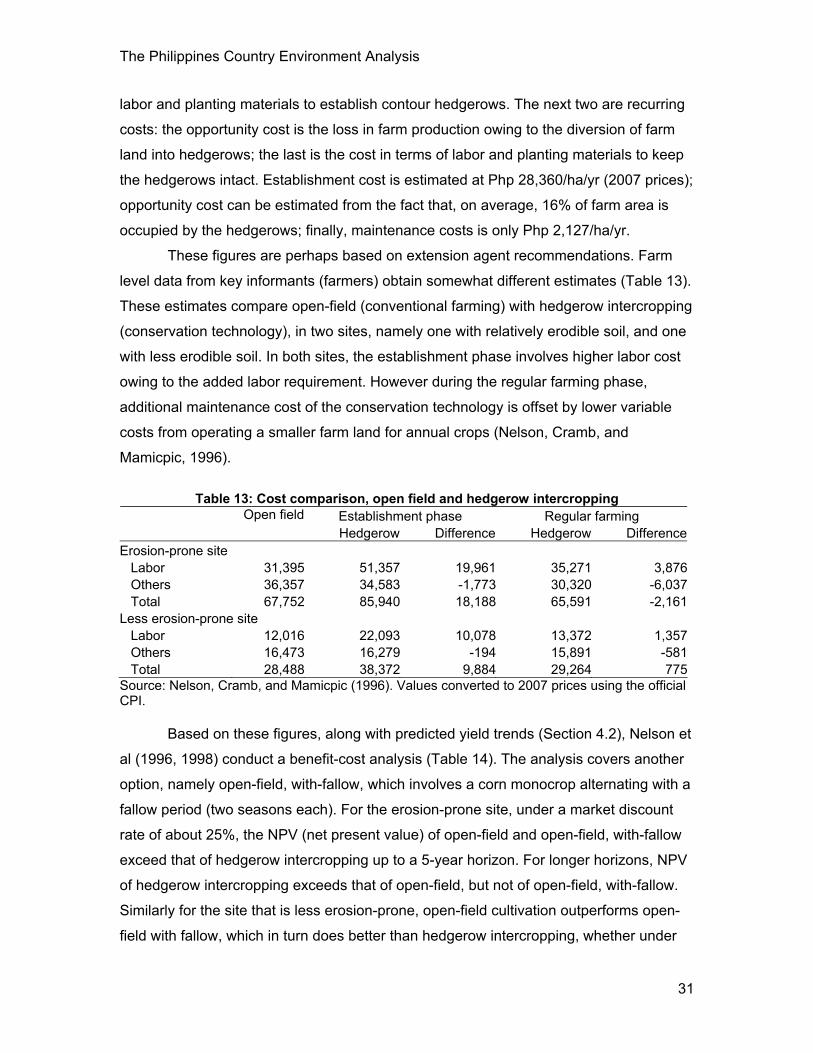
These figures are perhaps based on extension agent recommendations. Farm
level data from key informants (farmers) obtain somewhat different estimates (Table 13).
These estimates compare open-field (conventional farming) with hedgerow intercropping
(conservation technology), in two sites, namely one with relatively erodible soil, and one
with less erodible soil. In both sites, the establishment phase involves higher labor cost
owing to the added labor requirement. However during the regular farming phase,
additional maintenance cost of the conservation technology is offset by lower variable
costs from operating a smaller farm land for annual crops (Nelson, Cramb, and
Mamicpic, 1996).
Table 13: Cost comparison, open field and hedgerow intercropping
Establishment phase Regular farming
Open fieldHedgerow Difference Hedgerow Difference
Erosion-prone site Labor 31,395 51,357 19,961 35,271 3,876 Others 36,357 34,583 -1,773 30,320 -6,037 Total 67,752 85,940 18,188 65,591 -2,161Less erosion-prone site Labor 12,016 22,093 10,078 13,372 1,357 Others 16,473 16,279 -194 15,891 -581 Total 28,488 38,372 9,884 29,264 775Source: Nelson, Cramb, and Mamicpic (1996). Values converted to 2007 prices using the official CPI.
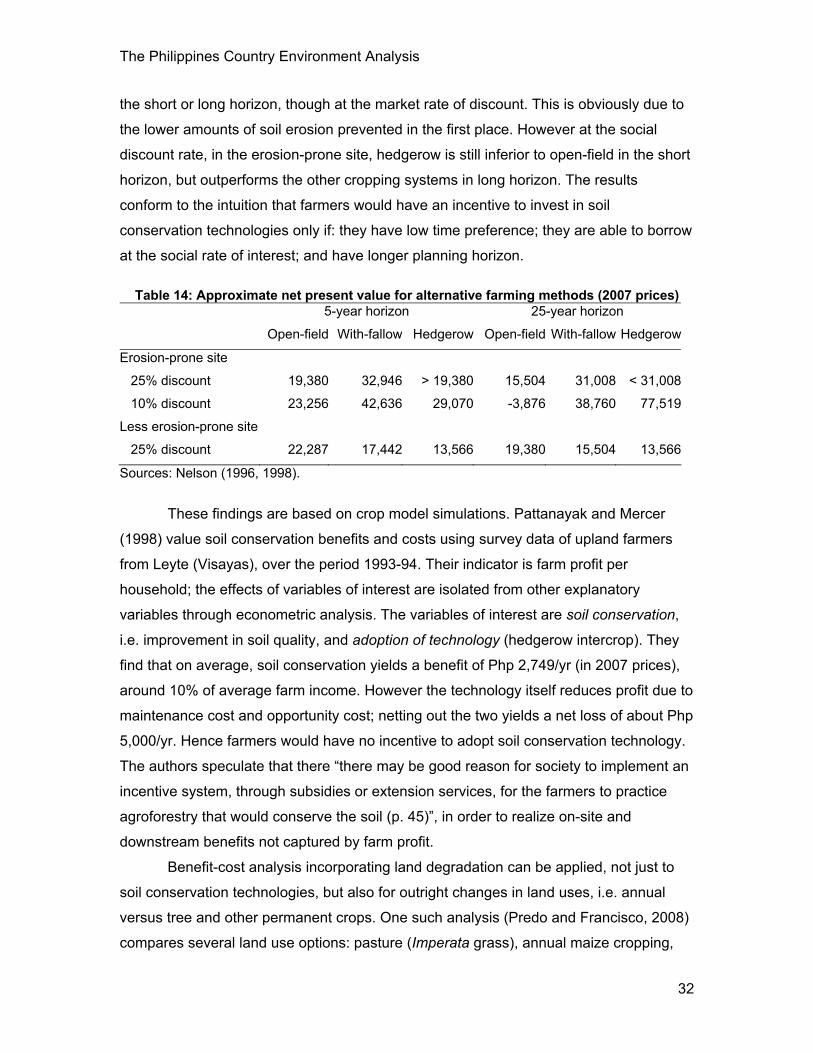
Based on these figures, along with predicted yield trends (Section 4.2), Nelson et
al (1996, 1998) conduct a benefit-cost analysis (Table 14). The analysis covers another
option, namely open-field, with-fallow, which involves a corn monocrop alternating with a
fallow period (two seasons each). For the erosion-prone site, under a market discount
rate of about 25%, the NPV (net present value) of open-field and open-field, with-fallow
exceed that of hedgerow intercropping up to a 5-year horizon. For longer horizons, NPV
of hedgerow intercropping exceeds that of open-field, but not of open-field, with-fallow.
Similarly for the site that is less erosion-prone, open-field cultivation outperforms open-
field with fallow, which in turn does better than hedgerow intercropping, whether under
The Philippines Country Environment Analysis
32
the short or long horizon, though at the market rate of discount. This is obviously due to
the lower amounts of soil erosion prevented in the first place. However at the social
discount rate, in the erosion-prone site, hedgerow is still inferior to open-field in the short
horizon, but outperforms the other cropping systems in long horizon. The results
conform to the intuition that farmers would have an incentive to invest in soil
conservation technologies only if: they have low time preference; they are able to borrow
at the social rate of interest; and have longer planning horizon.
Table 14: Approximate net present value for alternative farming methods (2007 prices) 5-year horizon 25-year horizon
Open-field With-fallow Hedgerow Open-field With-fallow Hedgerow
Erosion-prone site
25% discount 19,380 32,946 > 19,380 15,504 31,008 < 31,008
10% discount 23,256 42,636 29,070 -3,876 38,760 77,519
Less erosion-prone site
25% discount 22,287 17,442 13,566 19,380 15,504 13,566
Sources: Nelson (1996, 1998).
These findings are based on crop model simulations. Pattanayak and Mercer
(1998) value soil conservation benefits and costs using survey data of upland farmers
from Leyte (Visayas), over the period 1993-94. Their indicator is farm profit per
household; the effects of variables of interest are isolated from other explanatory
variables through econometric analysis. The variables of interest are soil conservation,
i.e. improvement in soil quality, and adoption of technology (hedgerow intercrop). They
find that on average, soil conservation yields a benefit of Php 2,749/yr (in 2007 prices),
around 10% of average farm income. However the technology itself reduces profit due to
maintenance cost and opportunity cost; netting out the two yields a net loss of about Php
5,000/yr. Hence farmers would have no incentive to adopt soil conservation technology.
The authors speculate that there “there may be good reason for society to implement an
incentive system, through subsidies or extension services, for the farmers to practice
agroforestry that would conserve the soil (p. 45)”, in order to realize on-site and
downstream benefits not captured by farm profit.
Benefit-cost analysis incorporating land degradation can be applied, not just to
soil conservation technologies, but also for outright changes in land uses, i.e. annual
versus tree and other permanent crops. One such analysis (Predo and Francisco, 2008)
compares several land use options: pasture (Imperata grass), annual maize cropping,
The Philippines Country Environment Analysis
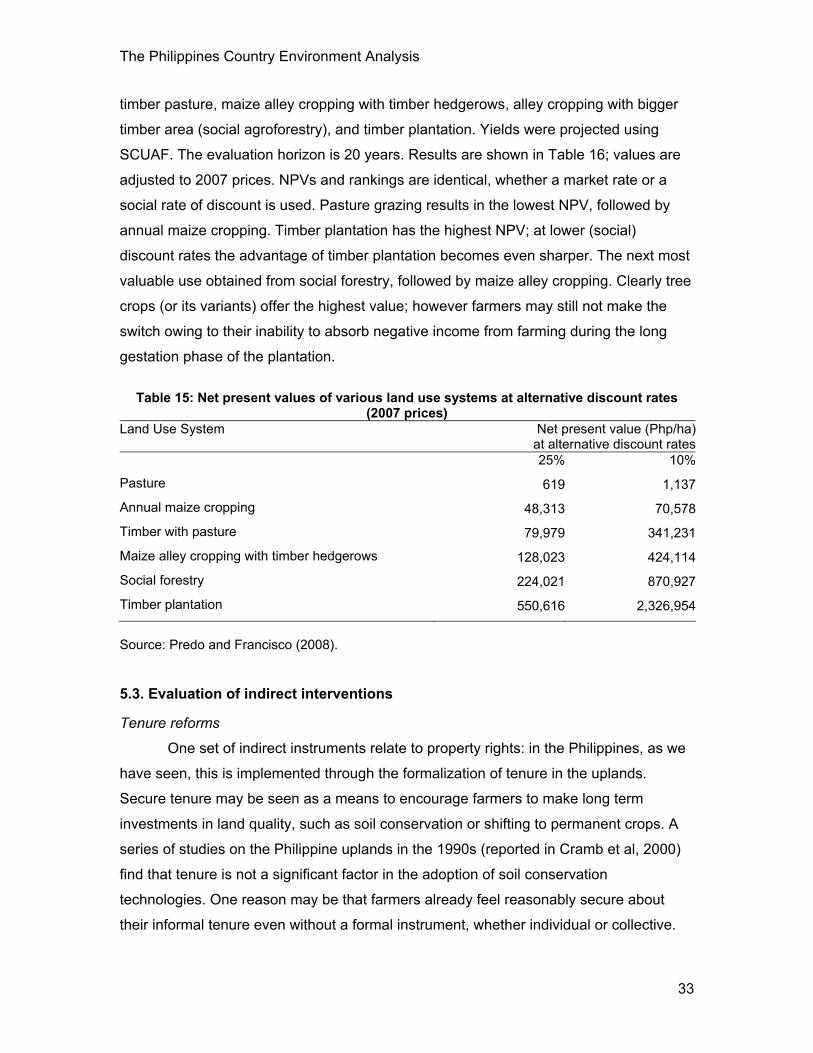
33
timber pasture, maize alley cropping with timber hedgerows, alley cropping with bigger
timber area (social agroforestry), and timber plantation. Yields were projected using
SCUAF. The evaluation horizon is 20 years. Results are shown in Table 16; values are
adjusted to 2007 prices. NPVs and rankings are identical, whether a market rate or a
social rate of discount is used. Pasture grazing results in the lowest NPV, followed by
annual maize cropping. Timber plantation has the highest NPV; at lower (social)
discount rates the advantage of timber plantation becomes even sharper. The next most
valuable use obtained from social forestry, followed by maize alley cropping. Clearly tree
crops (or its variants) offer the highest value; however farmers may still not make the
switch owing to their inability to absorb negative income from farming during the long
gestation phase of the plantation.
Table 15: Net present values of various land use systems at alternative discount rates
(2007 prices) Land Use System Net present value (Php/ha)
at alternative discount rates 25% 10%
Pasture 619 1,137
Annual maize cropping 48,313 70,578
Timber with pasture 79,979 341,231
Maize alley cropping with timber hedgerows 128,023 424,114
Social forestry 224,021 870,927
Timber plantation 550,616 2,326,954
Source: Predo and Francisco (2008).
5.3. Evaluation of indirect interventions
Tenure reforms
One set of indirect instruments relate to property rights: in the Philippines, as we
have seen, this is implemented through the formalization of tenure in the uplands.
Secure tenure may be seen as a means to encourage farmers to make long term
investments in land quality, such as soil conservation or shifting to permanent crops. A
series of studies on the Philippine uplands in the 1990s (reported in Cramb et al, 2000)
find that tenure is not a significant factor in the adoption of soil conservation
technologies. One reason may be that farmers already feel reasonably secure about
their informal tenure even without a formal instrument, whether individual or collective.
The Philippines Country Environment Analysis
34
However other studies undertake to explain econometrically the adoption decision and
find that ownership is a positive and significant factor, e.g. Lapar and Pandey (1999).
The most comprehensive tenure reform in the uplands is the establishment of
CBFM areas. While tenure reform offers great promise as an effective intervention
against upland degradation, operational and programmatic problems stand in the way of
its fulfillment. This is confirmed in a a recent audit report (Commission on Audit, 2005)
whose findings include the following:
• Community organizing – due to inadequate training, the community organization
was not transformed into a viable institution for sustained forest protection.
• Livelihood activities – majority of the livelihood projects were suspended and
terminated; these suffered from inadequate training of participants, and inadequate
feasibility studies.
• Membership – nearly half of the household population within the CBFM area were
not members, complicating the task of managing the entire area.
• Forest protection – forest protection measures were not enforced; in particular
forest fire prevention was not implemented, leading to the outbreak of several
serious forest fires in the areas.
• Forest rehabilitation – survival rates of replanted trees were low, ranging from 36 to
68%, owing to poor site selection for tree planting.
• Land use planning – there was considerable deviation of actual land use from the
land use plan; violations of existing policies were observed, e.g. the operation of a
mining concession within the area.
Economywide price policies
Another set of indirect instruments are economywide policies (not specifically
targeted to land degradation). The effect of policy reform packages on land degradation
has been explored using local and economywide (general equilibrium) models. An
example of a local level analysis is given in Nelson (1998), who apply the APSIM model
described earlier to simulate the effect of a removal of trade protection in corn. This
policy is expected to reduce domestic prices by 76% (the nominal protection rate). All
types of land use involving corn planting (open-field, with fallow, and hedgerow
intercrop) register negative NPV under any horizon; this should induce farmers to move
to other land uses, perhaps to less erosive crops.
The Philippines Country Environment Analysis
35
Another study models the Manupali watershed using an explicit behavioral model
(Coxhead and Zelek, 2002; Shively and Coxhead, 2004). In each period, farm
households maximize expected returns from farming across various crop types; each
crop type generates a mean return for the household. Households face market prices,
which can be raised (lowered) by a tax. Crops are produced with inputs along with soil
stock; the soil stock can decrease due to erosion, which in turn depends on crop mix,
slope, soil type, and rainfall. Erosion also affects downstream sedimentation with some
delay. Households solve a one-period problem, which updates the soil stock. There are
four types of households, all of which grow white corn: i) households in the forest-buffer
area, also growing coffee, ii) households in the same zone, also growing vegetables; iii)
households in the mid-watershed area, also growing coffee; iv) households in the same
zone, also growing yellow corn. Crop choices reflect resource constraints, i.e.
unconstrained households are able to diversify to vegetables and yellow corn. The
model is solved for ten periods.
Four policy experiments are examined: i) a 10% subsidy on white corn; ii) a 10%
input subsidy for vegetable producers; iii) a 10% tax on vegetables; iii) a 10% reduction
in price variance for all crops. Policies are imposed throughout the simulation horizon.
Impacts are stated in comparison with a base run. The results of their analysis are as
follows:
• Corn subsidy raises erosion by 1.16% , while increasing household welfare by 8%.
• Vegetable subsidy raises erosion by 5%; surprisingly, it reduces welfare by 1%,
owing to the long term effects of soil loss. This is because vegetable growing is a
highly erosive activity, more so than corn farming.
• Vegetable tax reduces erosion by 9%, and increases household welfare by 6%.
• Market stabilization to reduce price variance increases erosion slightly, by 0.56%.
Household welfare improves by 1%.
The most comprehensive modeling approach would be that of computable
general equilibrium (CGE). A series of studies beginning from the mid-1990s investigate
the environmental effects of trade liberalization via the erosion channel (e.g. Coxhead
and Jayasuriya, 1995; 2003a; Coxhead, 2000). An illustrative simulation is Coxhead and
Jayasuriya (2003b), which uses the APEX (Agricultural Policy Experiments), a 50-sector
whose major structural parameters are econometrically estimated. Side equations based
on soil erosion functions permit calculation of land degradation outcomes upon obtaining
the CGE solution. In one scenario, cereal imports are exogenously fixed while
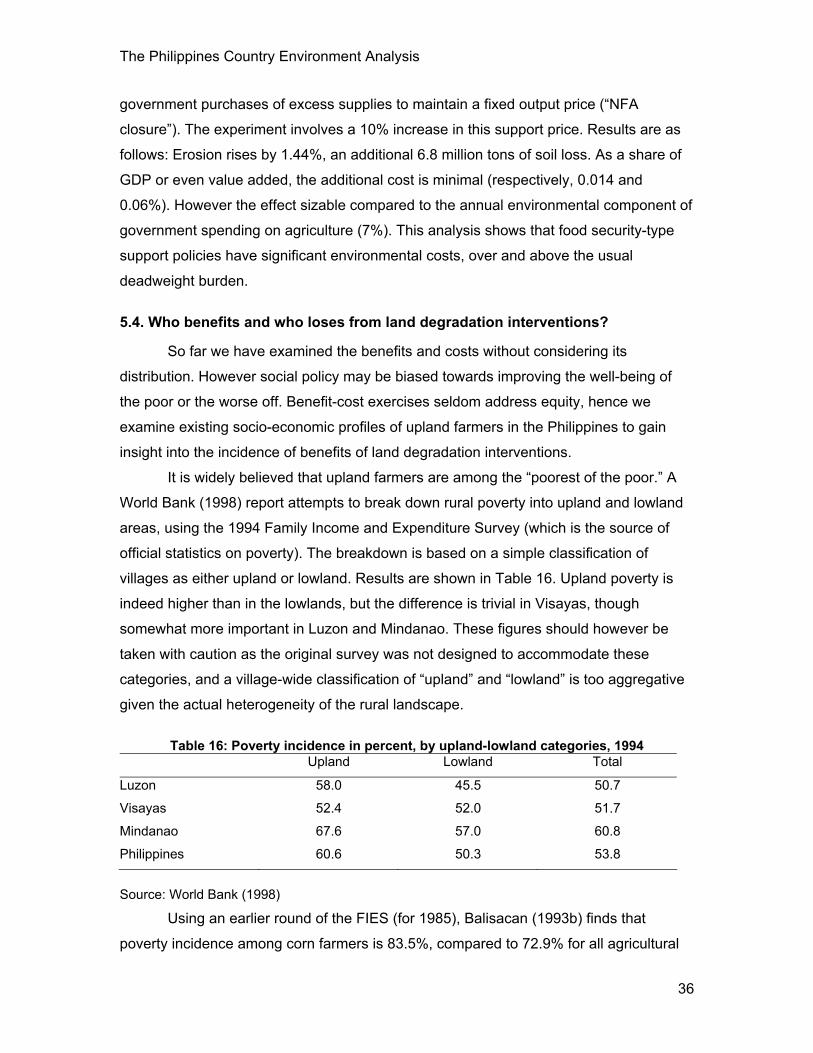
The Philippines Country Environment Analysis
36
government purchases of excess supplies to maintain a fixed output price (“NFA
closure”). The experiment involves a 10% increase in this support price. Results are as
follows: Erosion rises by 1.44%, an additional 6.8 million tons of soil loss. As a share of
GDP or even value added, the additional cost is minimal (respectively, 0.014 and
0.06%). However the effect sizable compared to the annual environmental component of
government spending on agriculture (7%). This analysis shows that food security-type
support policies have significant environmental costs, over and above the usual
deadweight burden.
5.4. Who benefits and who loses from land degradation interventions?
So far we have examined the benefits and costs without considering its
distribution. However social policy may be biased towards improving the well-being of
the poor or the worse off. Benefit-cost exercises seldom address equity, hence we
examine existing socio-economic profiles of upland farmers in the Philippines to gain
insight into the incidence of benefits of land degradation interventions.
It is widely believed that upland farmers are among the “poorest of the poor.” A
World Bank (1998) report attempts to break down rural poverty into upland and lowland
areas, using the 1994 Family Income and Expenditure Survey (which is the source of
official statistics on poverty). The breakdown is based on a simple classification of
villages as either upland or lowland. Results are shown in Table 16. Upland poverty is
indeed higher than in the lowlands, but the difference is trivial in Visayas, though
somewhat more important in Luzon and Mindanao. These figures should however be
taken with caution as the original survey was not designed to accommodate these
categories, and a village-wide classification of “upland” and “lowland” is too aggregative
given the actual heterogeneity of the rural landscape.
Table 16: Poverty incidence in percent, by upland-lowland categories, 1994
Upland Lowland Total
Luzon 58.0 45.5 50.7
Visayas 52.4 52.0 51.7
Mindanao 67.6 57.0 60.8
Philippines 60.6 50.3 53.8
Source: World Bank (1998)
Using an earlier round of the FIES (for 1985), Balisacan (1993b) finds that
poverty incidence among corn farmers is 83.5%, compared to 72.9% for all agricultural
The Philippines Country Environment Analysis
37
families, making it the poorest among the sub-sectors of farm households. Turning now
to village level studies, for corn there is a rapid field appraisal reported by Gerpacio et al
(2004) covers 24 villages from eight provinces. The rapid appraisal covers villages in
rainfed lowlands, upland plains, and rolling hills, covering a spectrum of poor to affluent
farmers. Owner-operation is the most common tenure, followed by share tenancy. Self-
help groups (farmer associations, cooperatives, NGOs, etc.) are present in the corn
villages; however, such groups appear to be devoted to enterprise assistance such as
for livestock, handiwork business, retail trade, etc., rather than to collective action on the
management of common pool resources (such as the watershed). Interestingly, in only
two provinces (Cebu and Leyte, both in Visayas) are the corn farmers poorer than
average (based on the headcount ratio), in contrast to earlier findings; this points to
heterogeneity within this subset of the population. In general the lower income corn
farmers have smaller farm sizes, and obtain a smaller share of income from corn farming
compared to better-off farmers. A possible source of heterogeneity is in the type of corn
crop: white corn farmers grow their crop at least in part for subsistence, and may be
asset-poor compared to yellow corn farmers, who are more specialized for commercial
growing.
Rice farmers in Palawan, Luzon (Shively, 2001) were surveyed in both upland
and lowland environments. Lowland irrigated rice farmers had the biggest average farm
size (4.2 ha), compared to upland farmers; the former also obtained bigger yields (over 3
tons/ha/yr in either rainfed or irrigated systems), compared to 1.7 t/ha/yr for upland
farmers. Annual farm income per ha is bigger for lowland farmers (from Php 37,000 to
Php 61,000 per ha), compared to upland farmers who earned about Php 9,000 – 10,000
per ha. Not surprisingly, per capita income of upland farmers ranges from Php 4,500 to
6,500 per ha, which is way below the national poverty threshold of Php 16,455 per
capita. Compare this with lowland farmers, whose household per capita incomes are
about Php 32,000 per year.
The last group of farmers we consider are vegetable growers in Lantapan,
surveyed under the SANREM project (Nguyen et al, 2007). The village, which hosts 513
households, has about 109 vegetable farmers, of whom the majority (55%) farmed less
than 1.5 ha. The village is located in the uplands: 86% of its area is sloped at least 18%.
A sample of 50 farmers were surveyed. Despite steep slopes, only three-fourths regard
soil erosion as either not a problem, or only a moderately serious problem.
The Philippines Country Environment Analysis
38
While farming was the major occupation of 70% of the respondents, it turns out
agriculture accounts for just 40% of household income on average; 50% came from
nonfarm sources, and the remainder from off-farm. These upland farmers were
overwhelmingly poor: per capita household income was only Php 2,200 per year,
compared to the relevant poverty threshold of Php 14,800; poverty headcount was 80%.
Food insecurity was widespread: 37% reported experiencing insufficient food availability
throughout the year.
In short, upland farmers, particularly corn growers, are poorer than the average
rural household. Hence upland soil conservation and incentives for permanent crop
growing do tend to benefit the poor. However farmer adoption has been limited despite
aggressive research and extension programs (Lapar and Pandey, 1999). The very fact
that upland farmers tend to bee resource-poor is a major reason behind this slow
uptake. As mentioned previously, segmented credit markets, credit rationing, and
liquidity constraints do restrict adoption of sustainable technologies and shifting to
permanent crops. For an upland area in Mindanao, Shively (1997) finds an additional
factor, that of consumption risk brought about by the opportunity cost of adopting contour
hedgerows. In general, higher farm size, greater tenure security, and higher labor
availability are all positively correlated with the likelihood of adoption.
Conversely, measures that reduce profitability of erosive farming in the uplands,
such as trade liberalization of corn imports, may harm the poor. Granted that such
liberalization measures may need to be pursued for its environmental and allocative
benefits, the dislocated upland corn farmers may need special protection measures to
facilitate their transition to other activities (World Bank, 1998).
6. Conclusion
Land degradation is a complex phenomenon fraught with site-specific processes
and relationships. In the Philippines, the spread of settled agriculture into large swathes
of erstwhile forested uplands signaled the onset of large-scale soil erosion, the most
prominent form land degradation in the country. While land degradation may have as yet
location-specific effects, it is likely to become (if not already is) a significant factor in the
slowdown and collapse of productivity growth, whether measured in terms of yield or
more generally with TFP. The more important cost element of soil erosion is diminution
in the stock of available soil nutrients; off-site costs on a national scale are too uncertain
to make a viable estimate. Despite the uncertainty associated with valuing soil erosion
The Philippines Country Environment Analysis
39
loss, the evidence suggests a serious enough problem, comparable in importance to the
entire public sector investment in research and development.
The benefit of soil conservation technologies, or shifting away from erosive land
use, is the avoidance of this soil loss in the long term. Direct interventions typically
involve investments as well as immediate maintenance costs to realize these benefits;
meanwhile indirect interventions alter the incentive structure of technology adoption or
land use. From a social benefit-cost perspective, some studies indicate that direct
interventions are worthwhile. However when the credit market is segmented, farmers
set short planning horizons (say under insecure tenure), and face liquidity constraints,
then farmers would forego these investments. Meanwhile among the indirect
interventions, tenure reform has an ambiguous effect, while removal of domestic
protection of corn has a positive effect on soil conservation. As upland farmers, including
the large population of subsistence corn growers, are among the poorest segments of
the rural population, the analysis suggests increasing and widening incentives for
adoption of soil conservation and permanent tree crops, while ensuring that trade
adjustment measures be accompanied by adequate social protection.
References Badayos, R.B., and F. C. Calalo, 2007. Farm sustainability and organic farming. In: Securing Rice, Reducing Poverty: Challenges and Policy Directions. A.M. Balisacan, L.S. Sebastian, and Associates. SEARCA, College, Laguna. Balisacan, A. (1993). Agricultural growth and rural performance: a Philippine perspective. Journal of Philippine Development 20(2):289-317. Balisacan, A., 1993. Agricultural growth, landlessness, off-farm employment, and rural poverty. Economic Development and Cultural Change 41(3):533 – 562. Bojö, J. , 1992. Cost-benefit analysis of soil and water conservation projects: A review of 20 empirical studies, In: Tato and Hurni, eds. Soil Conservation for Survival, 195-205. Soil and Water Conservation Society. Bojö, J., 1996. The costs of soil degradation in Sub-Saharan Africa. Ecological Economics 16: 161-171. Boserup, E., 1965. The Conditions of Agricultural Growth: The Economics of Agrarian Change under Population Pressure. Aldine, Chicago. Briones, N., 2007. Environmental sustainability issues in Philippine agriculture. Asian Journal of Agriculture and Development 2(1/2):67 – 78.
The Philippines Country Environment Analysis
40
Cassman, K.G., and P.L. Pingali, 1995. Extrapolating trends from long term expetiments to farmers’ fields: the case of irrigated rice systems in Asia. In: Agricultural Sustainability: Economic, Environmental and Statistical Considerations. V. Barnette, R. Payne, and R. Steiner, eds. John Wiley and Sons Ltd., New York. Commission on Audit, 2005. Community-Based Forest Management Program: Department of Environment and Natural Resources. Sectoral Performance Audit Overall Report. Commission on Audit, Quezon City, Philippines. Concepcion, R., 2004. Philippines. Country Report, Gateway to Land-Water Information. FAO, Rome. www.fao.org/agl/swlwpnr/reports/y_ta/z_ph/ph.htm#physio. Accessed 25 August 2008. Coxhead, I., 2000. Consequences of a food security strategy for economic welfare, income distribution and land degradation: the Philippine case. World Development 28(1):111-128. Coxhead, I., 2002. Development and the upland resource base: economic and policy context, and lessons from a Philippine watershed. Philippine Journal of Development 29(1): 1-32. Coxhead, I., and G. Shively, 2006. Economic incentives and agricultural outcomes in upland settings. In: Land Use Changes in Tropical Watersheds. I. Coxhead and G. Shively, eds. CABI Publishing, Wallingford, Oxfordshire. Coxhead, I., and S. Jayasuriya, 1995. Trade and tax reforms and the environment: the economics of soil erosion in developing countries. American Journal of Agricultural Economics 77:631 – 44. Coxhead, I., and S. Jayasuriya, 2003a. The Open Economy and the Environment, Development, Trade and Resources in Asia. Edward Elgar, Cheltenham, UK. Coxhead, I., and S. Jayasuriya, 2003b. Environment and natural resources. In: A. Balisacan and H. Hill, eds. The Philippine Economy: Development, Policies, and Challenges. Ateneo de Manila University Press, Quezon City, Philippines. Cramb, R., 2000. Agricultural land degradation in the Philippine uplands: an overview. In: Soil conservation technologies for smallholder farming systems in the Philippine uplands: A Socioeconomic Evaluation. R. A. Cramb, ed. ACIAR Monograph No. 78, Canberra, 23 – 37. Cramb, R., 2005. The role of social capital in the promotion of conservation farming: the case of Landcare in Southern Philippines. Land Degradation and Development 17(1):21-30. Cramb, R., J. Garcia, R. Gerrits, G. Saguiguit, 2000. Adoption of soil conservation technologies in the case study sites. In: Soil conservation technologies for smallholder farming systems in the Philippine uplands: A Socioeconomic Evaluation. R. A. Cramb, ed. ACIAR Monograph No. 78, Canberra, 96-118.

The Philippines Country Environment Analysis
41
Cruz, W., H. Francisco, and Z. Conway, 1988. The on-site and downstream costs of soil erosion in the Magat and Pantabangan watersheds. Journal of Philippine Development 15(1):85-111. Cummings, D., 1999. What is soil degradation? Landcare Notes December LC0063, Department of Primary Industries, State of Victoria, Australia. Craswell, E., A. Sajjapongse, D. Howlett, A. Dowling, 1998. Agroforestry in the management of sloping lands in Asia and the Pacific. Agroforestry Systems 38:121-137. David, C., 2003. Agriculture. In: The Philippine Economy: Development, Policies, and Challenges. A. Balisacan and H. Hill, eds. Ateneo de Manila University Press, Quezon City. David, C., P. Intal, and A. Balisacan, 2007. Distortions to agricultural incentives in the Philippines. Agricultural Distortions Working Paper No. 28. World Bank, Washington D.C. De Guzman, M., 1997. Evaluating the impacts of area development plans and soil conservation practices on soil productivity: a simulation approach. Unpublished M.S. Thesis, University of the Philippines Los Baños . De Leon, J. (2005). Rice that Filipinos grow and eat. Discussion Paper Series No. 2005-11. PIDS, Manila. Decena, F., 1999. Economic values of erosion in upland farms in Rizal and Batangas, Philippines, 1989 – 1994. Unpublished M.S. Thesis, University of the Philippines Los Baños . DENR, 2005. The Philippines Green Environment: Some Facts and Figures. DENR, Quezon City. Doberman, A., and D. Dawe, 2008. Can organic agriculture feed Asia? Rice Today October – December Issue. International Rice Research Center [IRRI], Los Baños , Laguna, Philippines. Eswaran, H., R. Lal, and P. Reich, 2001. Land degradation: an overview. In: Bridges, E.M., I.D. Hannam, L.R. Oldeman, F.W.T. Pening de Vries, S.J. Scherr, and S. Sompatpanit, eds. Responses to Land Degradation. Proceedings of the 2nd International Conference on Land Degradation and Desertification, Khon Kaen, Thailand. Oxford Press, New Delhi, India. ENRAP Phase III, 1996. Main Report. DENR-USAID, Manila, Philippines. Esquejo, E., 2004. “Philippines.” In: Sustainable Farming Systems in Upland Areas: Report of the APO Study Meeting, New Delhi, India, 15 – 19 January 2001. T. Partap, ed. Asian Productivity Organization, Tokyo. Fancisco, H., 1994. Upland Soil Resources of the Philippines: Resource Assessment and Accounting for Soil Depreciation. ENRAP Phase II Technical Report No. 6.
The Philippines Country Environment Analysis
42
FAO (2005). TerraStat: Global land resources GIS models and databases for poverty and food insecurity mapping. FAO Land and Water Digital Media Series CD-ROM No. 20. FAO, Rome. Francisco, H., and M. de los Angeles, 1998. Soil Rresources Depreciation and Deforestation: Philippine Case Study in Resource Accounting. FAO, Rome. Forest Management Bureau, 1998. The Philippines Strategy for Improved Watershed Resources Management. DENR, Quezon City. Garcia, J., R. Gerrits, R. Cramb, and G. Saguiguit, 2000. In: Soil conservation technologies for smallholder farming systems in the Philippine uplands: A Socioeconomic Evaluation. R. A. Cramb, ed. ACIAR Monograph No. 78, Canberra, 72-95. Gerpacio, R. V., Labios, J. D., Labios, R. V., and E. I. Diangkinay, 2004. Maize in the Philippines: Production Systems, Constraints, and Research Priorities. Mexico, D.F.: CIMMYT. Grohs, F., 1994. Economics of Soil Degradation, Erosion and Conservation: A Case Study of Zimbabwe. Wissenshaftsverlag Vauk Kiel KG, Kiel. Huang, J., and S. Rozelle, 1995. Environmental stress and grain yields in China. American Journal of Agricultural Economics 77:853 – 864. Josue, D., and T. Mendoza, 2001. Valuation of nutrient losses due to soil erosion in a tropical upland agroecosystem. The Philippine Agricultural Scientist 84(1):90-98. Kaosa-ard, M.S., and B. Rerkasem, 2000. The Growth and Sustainability of Agriculture in Asia. Oxford University Press, Oxford, UK. Lal, R., 2001. How critical are soil constraints? In: Who Will Be Fed in the 21st Century? Challenges for Science and Policy. IFPRI, Washington, D.C. Land Adminstration Management Project, 2002. Land adminstration reform. Policy Studies Integration Report. DENR and AusAid, Manila. Lapar, M. L. A., and S. Pandey, 1999. Adoption of soil conservation: the case of the Philippine uplands. Agricultural Economics 21:241 – 256. Llanto, G., and M. Ballesteros, 2003. Land issues in poverty reduction strategies and the development agenda: Philippines. Discussion Paper Series No. 2003-03. Philippine Institute for Development Studies, Makati. Medallla, E., V. Pineda, E. Tan, R. Querubin, and C. del Rosario, 1990. Reestimation of shadow prices for the Philippines. Discussion Paper Series No. 90-16. Philippine Institute for Development Studies, Makati. Nelson, R., R. Cramb, and M. Mamicpic, 1996. Costs and returns of hedgerow intercropping and open-field maize farming in the Philippine uplands. SEARCA – UQ Uplands Research Project Working Paper No. 11. SEARCA and UQ, College, Laguna.
The Philippines Country Environment Analysis
43
Nelson, R., P. Grist, K. Menz, R. Cramb, E. Paningbatan, and M. Mamicpic, 1996. A cost-benefit analysis of hedgerow intercropping in the Philippine uplands using the SCUAF model Agroforestry Systems 35(2): 203 – 220. Nelson, R., J. Dimesa, E. Paningbatan, and D. Siburna, 1998. Erosion/productivity modeling of maize farming in the Philippine uplands Part I: parameterising the Agricultural Production Systems Simulator. Agricultural Systems 58(2): 129 – 146. Nelson, R., J. Dimesa, D. Siburna, E. Paningbatan, and R. Cramb, 1998. Erosion/productivity modeling of maize farming in the Philippine uplands Part II: simulation of alternative farming methods. Agricultural Systems 58(2): 147-163. Nelson, R., R. Cramb, and M. Mamicpic, 1998. Erosion/productivity modeling of maize farming in the Philippine uplands Part III: economic analysis of alternative farming methods. Agricultural Systems 58(2): 147-163. Nguyen, M., J. de Mesa, and A. Rola, 2007. Vegetable agro-forestry system: baseline survey results in Songco, Lantapan, Bukidnon, Philippines, 2006. Working Paper No. 05-07. SANREM – CRSP, VirginiaTech, VA. NSCB , 2006. Compendium of Philippine Environment Statistics. NSCB, Manila. Pampolino, M.F., E.V. Laureles, H.C. Gines, and R.J. Buresh, 2008. Soil carbon and nitrogen changes in long-term continuous lowland rice cropping. Soil Science Society of America Journal 72:798-807. Paningbatan, E.P., Ciesiolka, C.A., Coughlan, K.J., Rose, C.W., 1995. Alley cropping for managing soil erosion of hilly lands in the Philippines. Soil Technology 8, 193–204. Pattanayak, D., and E. Mercer, 1998. Valuing soil conservation benefits of agroforestry: contour hedgerows in the Eastern Visayas, Philippines. Agricultural Economics 18(1):31-46. Philippine Environmental Governance Project, 2004. Allocation and Tenure Instruments on Forest Lands: A Source Book. DENR, Quezon City. Poudel, D.D., Midmore, D.J., West, L.T., 1999. Erosion and productivity of vegetable systems on sloping volcanic ash-derived Philippine soils. Soil Science Society of America Journal 63, 1366–1376. Predo, C., and H. Francisco, 2008. Improving productivity, profitability, and sustainability of degraded grassands through tree-based land use systems in the Philippines. In: D. Snelder and R. Lasco, eds. Smallholder Tree Growing for Rural Development and Environmental Services. Advances in Agroforestry vol. 5. Springer Science, Dordrecht, the Netherlands. Presbitero, A.L., Escalante, M.C., Rose, C.W., Coughlan, K.J., Ciesiolka, C.A., 1995. Erodibility evaluation and the effects of land management practices on soil erosion from steep slopes in Leyte, the Philippines. Soil Technology 8,205–213.
The Philippines Country Environment Analysis
44
Pulhin, J., M. Amaro, and D. Bacalla, 2005. Philippines Community Based Forest Management 2005. Country report presented during the Community Forest Forum, Regional Community Forestry Training Center, 24-26 August. Reichardt, W., A. Doberman, and T. George, 1998. Intensification of rice production systems: opportunities and limits. In: Sustainability of Rice in Global Food Systems. G. Dowling, S.M. Greenfield, and K.S. Fisher, eds., 127-44. Pacific Basin Study Center and International Rice Research Institute, Los Baños, Laguna, Philippines. Rola, A., 2004. Research program planning for agricultural resource management: a background analysis. In: E. Ponce, ed. Special Issues in Agriculture, 1 – 26. PIDS, Manila. Rola, A., A. Sajise, D. Harder, and J. Alpuerto, 2008. Agricultural productivity growth and environmental externalities. Paper prepared for the 6th Asian Agricultural Economics Society Meeting, Makati, Philippines, 28-30 August. Rola, A., and I. Coxhhead. 2002. Does nonfarm job growth encourage or retard soil conservation in the Philippine uplands? Journal of Philippine Development 29(1):55-83. Rola, A., W. Deutsch, J. Orprecio, and A. Sumbalan, 2004. Water resources management in a Bukidnon subwatershed: what can community-generated data offer? In: Winning the Water War: Watersheds, Water Policies, and Water Institutions. A. Rola, H. Francisco, and J. Liguton, eds. Philippine Institute for Development Studies, Makati, Philippines. Rola, A., and I. Coxhead, 2005. Economic development and environmental management in the uplands of Southeast Asia: challenges for policy and institutional development. Agricultural Economics 32(1):243 – 256. Rola, A., A. Sajise, D. Harder, and J. Alpuerto, 2008. Can soil conservation practices improve upland corn productivity? Paper presented at the 6th Asian Agricultural Economics Society Meeting, AIM Conference Center, Makati, Philippines, 28-30 August. Rose, C. 2001. Soil erosion models and implications for conservation of sloping tropical lands. In: Sustaining the Global Farm: Selected Papers from the 10th International Soil Conservation Organization Meeting, 24-29 May. Purdue University, pp 852-859. Ruttan, V. 2002. Productivity growth in world agriculture: sources and constraints. Journal of Economic Perspectives 16(4):161-184. Saastamoinen, O., 1994. Off-site costs of soil erosion and watershed degredation in the Philippines: sectoral impacts and tentative results. Discussion Paper Series No. 94-18. Philippine Institute for Development Studies, Manila. Scherr, S., 1999. Soil degradation: a threat to developing country food security by 2010? Food, Agriculture, and Environment Discussion Paper No. 27. International Food Policy Research Institute, Washington, D.C. Schmitt, L., 2007. Developing and applying a soil erosion model in a data-poor context to an island in rural Philippines. Environment, Development, and Sustainability.
The Philippines Country Environment Analysis
45
Shiferaw, Bekele and Stein Holden (2001) Farm-level Benefit to Investments for Mitigating Land Degradation: Empirical Evidence from Ethiopia. Environment and Development Economics Vol. 6, pp. 335-358. Cambridge University Press. Shively, G., and C. Zelek, 2002. Linking economic policy and environmental outcomes at a watershed scale. Philippine Journal of Development 29(1):101-126. Shively, G., 1997. Consumption risk, farm characteristics, and soil conservation adoption among low income farmers in the Philippines. Agricultural Economics 17:165 – 177. Shively, G., 2001. Agricultural change, rural labor markets, and forest clearing: an illustrative case from the Philippines. Land Economics 77(2):268 – 284. Sidle, R., A. Ziegler, J. Negishi, A. Rahim Nik, R. Siew, F. Turkelboom. 2006. Erosion processes in steep terrain – truths, myths, and uncertainties related to forest management in Southeast Asia. Forest Ecology and Management 224:199-225. Singh, R.B., T. Woodhead, and M.K. Papademetriou, 2002. Strategies to sustain and enhance Asia-Pacific rice production. In: Sustainable Rice Production for Food Security: Proceedings of the 20th Session of the International Rice Comission, Bangkok, 23 – 26 July. Dat Van Tran, ed. Food and Agriculture Organization, Rome. Tacio, H., 1993. Sloping agricultural land technology (SALT): a sustainable agroforestry scheme for the uplands. Agroforestry Systems 22:145-52. Teruel, R. 2008. Productivity growth in Philippine agriculture: a literature review. Report submitted to the Productivity Growth in Philippine Agriculture Project. SEARCA, College, Laguna, Philippines. Umetsu, C., T. Lekprichakul, and U. Chakravarty, 2003. Efficiency and technical change in the Philippine rice sector: a Malmquist total factor productivity analysis. American Journal of Agricultural Economics 85(4):943 – 963. World Bank, 1998. Philippines: Promoting Equitable Rural Growth. Rural Development and Natural Resources Sector Unit, East Asia and Pacific Region, World Bank, Washington, D.C. World Bank Country Office Philippines, 2004. Philippine Environment Monitor 2004: Assessing Progress. World Bank, Washington, D.C. World Bank, 2007. Philippines: Agriculture Public Expenditure Review. Technical working paper of the Rural Development, Natural Resources and Environment Sector Unit, World Bank, Washington D.C. World Bank, 2008. Agriculture for Development: World Development Report 2008. World Bank, Washington D.C. Young, A., 1994. Land Degradation in South Asia: Its Severity, Causes, and Effects Upon the People. World Soil Resources Reports: FAO, Rome.
The Philippines Country Environment Analysis
46
1 While agriculture may not have been the primary motivation for the initial clearing of trees and vegetation (as would be mentioned later), farming is a dominant and enduring feature in land use, hence causes and effects of on-going degradation are appropriately linked to agriculture. 2 Note that yield difference is an incomplete indicator when input application differs between land use or farming systems, and should be supplanted by net revenue difference where cost and returns data is available. 3 Terrastat database: http://www.fao.org/ag/agl/agll/terrastat/wsrout.asp?wsreport=3®ion=1&search=Display+statistics+%21. Accessed 26 August 2008. 4 World Development Indicators (WDI), 2007. 5 Figures from FAOStat – Agriculture, and BAS Countrystat. 6 Estimates are based on the GLASOD database (FAO, 2005). The classification involves two dimensions: first is degree of degradation, the other is extent. The degrees are: light (somewhat reduced agricultural suitability); moderate (greatly reduced agricultural productivity); strong (biotic functions largely destroyed); and extreme (biotic functions destroyed and land is non-reclaimable). The extent classes (per mapping unit) are: 0 – 5%; 5 – 10%; 10 – 25%; 25 – 50%; and 50 – 100%. The classification “severe” denotes light degradation for over 50%; moderate degradation for 10 – 50%; strong degradation for 5 – 25%; and extreme degradation for 5 – 10%. 7 Throughout the discussion, values reported in the literature are converted to 2007 prices using the Consumer Price Index of the National Statistics Office. In 2007 the average exchange rate was Php 46.15/$US 1.00. 8 Returns are also highly variable over time. The reason is that annual figures are given based on maintaining a fixed input-output relation but valued using contemporaneous prices. 9 Polynomial trendline of order 3.
10 The author also ran a regression relating corn yield to soil loss using estimates generated by EPIC itself, over the period 1990 – 2002. The coefficient of soil loss is 12.5, i.e. every ton of soil loss would supposedly reduce corn yield by 12.5 kg. This result however merely indicative of some correlation, as statistical inference is impossible with non-stochastic data. 11 Cruz et al’s (1988) method assumes that the dam’s “dead storage” capacity is an allowance for
sedimentation; in the absence of sedimentation, this amount would be available for irrigation.
Such an assumption may be problematic. Removal of this item would essentially eliminate the
cost of sedimentation in the case of Magat, and reduce the cost estimate for Pantabangan by
97%. 12 http://www.neda.gov.ph/ads/press_releases/pr.asp?ID=461. Accessed 12 November 2008.