Embed Size (px)
Citation preview

Archives of Agriculture Sciences Journal
Volume 4, Issue 1, 2021, Pages 205–220
Available online at www.agricuta.edu.eg
DOI: https://dx.doi.org/10.21608/aasj.2021.83602.1071
205
Copyright © 2021
*Corresponding author: Sayed Y. A.,
E-mail address: [email protected]
Land capability and suitability of some soils at
North-West of Dashlut, Assiut, Egypt
Sayed Y. A.*, Khalafalla M. Y.
Soils and Water Science Department, Faculty of Agriculture, Al-Azhar University, Assiut, Egypt
Abstract
Twelve soil profiles representing North-West of Dashlut area, Assiut, Egypt were selected and dug, and
43 soil samples were collected from these profiles to evaluate its productive capability and suitability for
growing selected crops. The soils of this area had a coarse texture grades (sand, loamy sand, and sandy
loam). Most of these soils were highly saline (ECe > 16 dS/m) and showed low values of organic matter
and available NPK, some of these soils are considered as calcareous. Tow modern programs including the
applied system of land evaluation (ASLE) and the microcomputer land evaluation information system
(MicroLEIS) were applied to assess the capability of these soils and their suitability to grow selected
crops. The results of land capability showed that the soils of the study area were poor (C4), very poor
(C5), and non-agricultural (C6) using the ASLE program, while the MicroLEIS (Cervatana model)
program pointed that soils had moderately (S3) and marginally (N1) capable grades. Moreover, using the
ASLE program, the soils of the study area were highly suitable, suitable, moderately suitable, marginally
suitable, and currently not suitable and permanently not suitable for 28 field and vegetable crops and fruits.
The land suitability using MicroLEIS (Almagra model) program indicated that the soils of this area were
moderately suitable, marginally suitable, and non-suitable for the selected crops due to one or more of the
limiting factors. The geostatistics approach performed with ordinary kriging interpolation and
semivariogram was applied to create a detailed and spatialized map for each soil parameter. Circular, J-
Bessel, J-Bessel, and Stable geostatistical models were used to define the spatial variability of soil
parameters based on RMS, MSE, and RMSSE. The main soil limitations of these soils were soil texture,
soil salinity, and low soil fertility. However, these soil limitations are none permanent and can be improved
through applying suited management practices.
Keywords: land capability, land suitability, MicroLEIS program, ASLE program.

Sayed and Khalafalla / Archives of Agriculture Sciences Journal 4(1) 205–220, 2021.
206
1. Introduction
Land suitability indicates that the ability of
a portion of land to tolerate the production
of crops in a sustainable way
(Bandyopadhyay et al., 2009). Land
suitability evaluation provides information
on the restrictions and opportunities for
land use and therefore, it guides decisions
on resources optimal use. Knowledge is an
essential prerequisite for land use planning
and development. Furthermore, such a
type of analysis helps to identify the major
limiting factors for agricultural production
and enables decision-makers such as land-
use planners, land users, and agricultural
support services to develop the
management of crops able to overcome
such constraints, increasing productivity.
Land could be categorized into spatially
distributed agriculture potential zones
based on the soil properties, terrain
characteristics, and analyzing present land
use (AbdelRahman et al., 2016).
According to FAO (2006), land suitability
is the classification operation of soil to use
appropriately. This operation is the
evaluation and gathering of specific areas
of land in terms of their suitability for
defined uses. Geostatistical techniques can
give more dependable, useful, and
efficient tools to predict soil properties in
unknown and unsampled sites and to
describe the spatial association of data by
variogram analyses (Webster and Oliver,
2007). The kriging is the most effective
and strong interpolation method used in
geostatistical applications (Mevlut, 2016).
De la Rosa et al. (2004; 2009) designed the
program of the Microcomputer Land
Evaluation Information System
(MicroLIES) package that has been
considered a user-friendly agro-ecological
decision support system for sustainable
land use and management. The MicroLIES
with a Cervatana and Almagra models
forecast the general land capability or
suitability for a broad series of possible
agricultural uses. The program works
interactively, comparing the values of the
characteristics of the land unit with the
generalization levels designated for each
use capability class. The prediction of the
general land use capability (Cervatana
model) and the land suitability (Almagra
model) are the results of a qualitative
evaluation process or overall interpretation
of the following biophysical factors such
as relief, soil, climate, and current use or
vegetation. Also, an Applied System for
Land Evaluation (ASLE) program is
proposed by Ismail and Morsi (2001) and
Ismail et al. (2001) to evaluate land
capability and suitability. This program
calculates the final land capability index as
a percentage value and the land suitability
depends upon four characteristics, namely
soil properties, irrigation water quality,
soil fertility factors, and environmental
parameters. Each factor was described as
an index value to give its status in the
percentage form (Marei et al., 1987; Zamil
et al., 2009). Fadel and Sayed (2020)
evaluated the soils of El-Qusiya area,
Assiut, Egypt as one of the newly
reclaimed areas using Storie index
(O’GEEN, 2008). Their output data
showed that these soils were fair (Grade 3)
and poor (Grade 4) with slope and other
soil limitation factors. MicroLIES-
Cervatana model results showed that the
land capability classes of this area were
good (S2), moderate (S3), and marginal
(N) with limiting factors of soil (i), erosion

Sayed and Khalafalla / Archives of Agriculture Sciences Journal 4(1) 205–220, 2021.
207
risks (r), and bioclimatic deficit (b).
According to Sys and Verheye (1978)
system, two land suitability classes,
namely marginal suitable (S3) with severe
limitations and presently not suitable (N1)
were reported for this area. The land
suitability of this area for growing
different crops according to MicroLIES-
Almagra model belonged to suitability
classes of high suitable (S2), moderately
suitable (S3), marginally suitable (S4), and
not suitable (S5) for wheat, maize,
watermelon, potato, soybean, cotton,
sunflower, sugar beet, alfalfa, peach,
citrus, and olive, with limitation factors of
texture (t), drainage (d), carbonate (c),
salinity (s), sodium saturation (a), and
profile development (g). North-West of
Dashlout area, Assiut, Egypt is considered
one of the promising areas for agricultural
expansion, due to its almost flat surface,
neighbor of the residential areas, and its
proximity to the main roads. So, the
current study aims to assess the productive
capacity of these lands and their suitability
for growing various crops and define the
main limitations of this study area.
2. Materials and methods
2.1 Study Area
The study area is located at North-West of
Dashlut, Assiut, Egypt between latitude
27° 34ʹ 34.4ʺ to 27° 39ʹ 12.5ʺ N and
longitude 30° 35ʹ 45.3ʺ to 30° 40ʹ 15.1ʺ E.
It covers an area of 43.94 km2 (10462
feddans). Twelve soil profiles were
chosen to represent the study area (Figure
1) to evaluate the capability and suitability
of these soils for the growth of crops and
define the limiting factors of this area.
Forty-three soil samples were collected
from these soil profiles. Locations of these
soil profiles were recorded in the field
with GPS guidance. Each soil profile was
dug to 130 -150 cm according to the type
and nature of the soil material. The
morphological description of these soil
profiles was performed according to Soil
Survey Staff (1993) and FAO (2006). The
climate of this area was a thermic
temperature regime and an aridic soil
moisture regime where the mean annual
temperature, rainfall, and relative
humidity are 26 ˚C, 1.2 mm, and 40 %,
respectively.
Figure (1): Location map of the study area.
2.2 Soil Analysis
The soil samples were air-dried, crushed,

Sayed and Khalafalla / Archives of Agriculture Sciences Journal 4(1) 205–220, 2021.
208
sieved through 2 mm sieve, and kept for
physical and chemical analysis. In these
samples, the particle-size distribution was
determined by pipette method (Piper,
1950) and the saturated hydraulic
conductivity was measured in the
undisturbed soil cores using the constant
head method (Kulte and Dirksen, 1986).
The soil organic matter content (SOM)
was determined by Wakley and Black
method (Jackson, 1973). The soil calcium
carbonate (CaCO3) was measured by the
calcimeter method according to Nelson
(1982). Soil pH was measured in a 1:1 soil
to water suspension (Mclean, 1982). The
electrical conductivity of the soil
saturated paste extract (ECe) was
determined according to Jackson (1973).
Gypsum content was determined using
the acetone method (Hesse, 1998). The
cation exchange capacity (CEC) was
measured (Jackson, 1973). The
exchangeable sodium percentage (ESP)
was calculated using the values of CEC
and the exchangeable sodium. Available
nitrogen using Kjeldahl method (Hesse,
1998), available phosphorus using Olsen
and Sommers (1982), and available
potassium using flame photometer
(Hesse, 1998) were determined in the
collected soil samples. Landsat 8 satellite
images (path 176, row 39) covering the
studied area were acquired on 19-06-
2020. The ENVI 5.1 software was
implemented (ITT, 2017). The location,
some soil properties, land capability, and
suitability maps of the investigated soils
were layout, annotated, projected, and
finally produced using Arc GIS 10.2.2
software (ESRI, 2014).
2.3 Land Capability
The applied system of land evaluation
(ASLE) program proposed by Ismail and
Morsi (2001) was used to define the
capability classes, C1, C2, C3, C4, C5,
and C6 (Table 1). MicroLEIS (Cervatana
model) internet-based program (De la
Rosa et al., 2004) that has class S1, S2, S3,
and N was also applied for land capability
(Table 1).
Table (1): Land capability classes of the applied system of land evaluation
(ASLE) and MicroLEIS (Cervatana model).
Applied System of Land Evaluation (ASLE) program MicroLEIS (Cervatana model)
Class % Class Description
1 80-100 (Excellent) S1 Excellent
2 60-80 (Good) S2 Good
3 40-60 (Fair) S3 Moderate
4 20-40 (Poor)
N Marginal 5 10-20 (Very poor)
6 <10 (Non-agricultural)
2.4 Land Suitability
The applied system of land evaluation
(ASLE) for arid and semi-arid regions
(Ismail and Morsi, 2001) program based
on the ratings of crop requirements

Sayed and Khalafalla / Archives of Agriculture Sciences Journal 4(1) 205–220, 2021.
209
proposed by Sys et al. (1993) was applied
for different crops such as cotton,
sunflower, sugar beet, wheat, barley,
sugarcane, faba bean, maize, soya bean,
rice, peanut, alfalfa, sorghum, vegetables,
watermelon, pepper, tomato, cabbage,
pea, onion, potato, date palm, fig, olive,
grape, apple, pear, citric and banana
(Table 2). The MicroLEIS (Almagra
model) program introduced by De la Rosa
et al. (2004) was used for selected crops
such as alfalfa, cotton, sugar beet, maize,
wheat, melon, potatoes, olive, soya bean,
sunflower, citrus, and peach (Table 2).
Table (2): Land suitability grades of the applied system of land evaluation (ASLE) and
MicroLEIS (Almagra model).
Applied System of Land Evaluation (ASLE)
program
MicroLEIS (Almagra model)
Suitability class Limitation Soil factor
Class % Description Symbol Definition Symbol Definition Symbol Definition
S1 < 80 High suitable S1 High suitable 1 None a Sodium saturation
S2 60-80 Suitable S2 Suitable 2 Slight c Carbonate
S3 30-60 Moderately suitable S3 Moderately suitable 3 Moderate d Drainage
S4 20-30 Marginally suitable S4 Marginally suitable 4 Severe g Profile development
NS1 10-20 Currently not suitable
S5 Not suitable 5 Very severe
p Useful depth
NS2 <10 Permanently not suitable s Salinity
t Texture
2.5 Geostatistical analyses
The variability of the soil parameters was
examined using the geostatistical
approach. The geostatistical approach
included the calculation of the
experimental semivariogram and un-
sampled site prediction. The most
advantage of geostatistics is the
measuring of the spatial correlation using
the semivariogram. There are different
models in geostatistical analysis,
including circular, spherical, tetra-
spherical, pentaspherical, exponenttial,
gaussian, rational quadratic, hole effect,
K-bessel, J-bessel, and stable. The
suitability and validation of each model
were examined through some parameters
like mean prediction errors (MPE), root
mean square prediction errors (RMSPE),
mean standardized prediction errors
(MSPE) that must be close to 0 and root
mean square standardized prediction
errors (RMSSPE) that should be close to
1 (Webster and Oliver, 2007).
3. Results and Discussion
3.1 Soil characteristics
The results show that the saturation
percentage (SP) of the soil samples ranges
between 18 to 28 %, due to the coarse
texture of these soils (Table 3). Two soil
texture categories are found in these soils
including the coarse texture which is
represented by the sand and loamy sand
texture grades and the moderately coarse
texture that is represented by the sandy
loam texture grade according to (Sys,
1979). The hydraulic conductivity of
these soil samples differs from 4.4 to 16.8
cm/h. The calcium carbonate content

Sayed and Khalafalla / Archives of Agriculture Sciences Journal 4(1) 205–220, 2021.
210
varies between 3 and 28%. Some soils of
the study area are considered as
calcareous soils (16-28 %). The soil
organic matter (OM) is low 0.07-0.56%
and the gypsum content reaches 0.74 %
(Figure 2).
Table (3): Some soil physical properties of the study area.
Profile No. Deep of layer
SP
(%)
Gravel by
volume (%)
Particle-size distribution
Texture grade Hydraulic conductivity
(cm/h)
CaCO3
(%)
O.M
(%)
Gypsum
(%) Land use Clay
(%)
Silt
(%)
Sand
(%)
1
0-20 18 11 4 8 88 Sand 12.5 16 0.48 0.74
None 20-50 21 5 8 9 83 Loamy sand 8.8 13 0.31 0.12
50-90 25 19 8 18 74 Gravelly sandy loam 5.1 9 0.37 0.53
90-150 23 25 5 15 80 Gravelly loamy sand 6.0 25 0.27 0.50
2
0-30 20 20 2 6 92 Gravelly sand 10.0 6 0.34 0.00 Wheat, Tomato,
Eggplant 30-70 23 4 7 14 79 Loamy sand 6.0 7 0.37 0.00
70-130 19 19 5 7 88 Gravelly sand 9.3 5 0.29 0.01
3
0-15 23 21 6 14 80 Gravelly loamy sand 6.7 11 0.43 0.03
None 15-55 19 16 4 5 91 Gravelly sand 11.8 9 0.26 0.11
55-105 21 11 8 8 84 Loamy sand 8.2 14 0.33 0.19
105-150 20 13 5 6 89 Sand 11.9 17 0.24 0.02
4
0-20 21 17 7 12 81 Gravelly loamy sand 7.4 9 0.49 0.02
None 20-70 23 11 12 20 68 Sandy loam 4.5 15 0.21 0.01
70-110 20 19 4 7 89 Gravelly sand 9.9 11 0.19 0.03
110-150 25 8 10 21 69 Sandy loam 5.9 16 0.22 0.15
5
0-30 19 9 5 4 91 Sand 12.9 10 0.55 0.00
Wheat, Onion, Pepper 30-80 24 17 10 18 72 Gravelly sandy loam 4.6 28 0.49 0.01
80-140 28 17 8 28 64 Gravelly sandy loam 4.5 26 0.34 0.02
6
0-25 19 7 4 6 90 Sand 14.7 9 0.35 0.01
None 25-60 24 11 8 20 72 Sandy loam 6.8 10 0.32 0.01
60-90 20 19 3 6 91 Gravelly sand 11.4 4 0.17 0.02
90-150 23 16 7 19 74 Gravelly sandy loam 6.4 5 0.07 0.01
7
0-30 20 11 6 4 90 Sand 10.9 3 0.32 0.00 Tomato, Onion,
Pepper 30-80 19 5 2 6 92 Sand 14.4 6 0.43 0.00
80-140 23 4 7 9 84 Loamy sand 10.9 5 0.29 0.01
8
0-25 27 7 11 21 68 Sandy loam 5.5 11 0.30 0.00
None 25-70 20 9 4 6 90 Sand 14.4 9 0.32 0.03
70-100 19 22 3 7 90 Gravelly sand 8.7 17 0.27 0.03
100-150 21 11 5 16 79 Loamy sand 9.7 15 0.22 0.02
9
0-30 20 14 3 8 89 Sand 13.5 13 0.40 0.00
None 30-80 24 8 9 21 70 Sandy loam 6.5 20 0.26 0.03
80-140 20 19 6 13 81 Gravelly loamy sand 6.8 10 0.25 0.03
10
0-30 19 14 3 4 93 Sand 13.6 14 0.28 0.00
None 30-90 23 7 7 33 60 Sandy loam 6.2 16 0.41 0.01
90-140 22 2 5 13 82 Loamy sand 13.0 11 0.37 0.11
11
0-30 19 9 4 7 89 Sand 13.5 6 0.38 0.00
Tomato, Onion 30-70 20 6 3 4 93 Sand 16.8 8 0.48 0.00
70-120 21 23 5 18 77 Gravelly Loamy sand 6.8 10 0.34 0.00
120-150 21 3 8 9 83 Loamy sand 9.9 14 0.29 0.01
12
0-25 23 13 13 17 70 Sandy loam 4.4 11 0.56 0.02
Wheat, Tomato,
Onion, Pepper
25-55 22 11 8 14 78 Loamy sand 7.3 15 0.34 0.01
55-110 25 12 9 31 60 Sandy loam 4.8 10 0.49 0.02
110-150 19 9 3 7 90 Sand 16.8 16 0.22 0.01
Figure (2): Spatial variability of a) the soil calcium carbonate
(CaCO3) and b) gypsum contents of the study area.

Sayed and Khalafalla / Archives of Agriculture Sciences Journal 4(1) 205–220, 2021.
211
The electrical conductivity of the
saturated soil paste extract (ECe) of these
soils ranges widely from 3.1 to 119.1
dS/m (Table 4). Most of these soils are
highly saline that have ECe˃ 16 dS/m
(Figure 3). The soil pH of these soils
varies from 7.1 to 9.4. The cation
exchange capacity (CEC) is between 3
and 18 cmol (+) /kg. It has low values due
to the prevailing coarse texture and the
low colloid fraction of these soils.
However, most of the study area has a soil
exchange sodium percentage that is less
than 15%.
Table (4): Some soil chemical characteristics of the study area.
Profile No.
Deep of layer
pH 1:1
ECe dS/m
Cations (mmol/kg) Anions (mmol/kg) CEC
cmol(+)/kg) ESP (%)
Available
nitrogen
(mg/kg)
Available
phosphorus
(mg/kg)
Available
potassium
(mg/kg) Na
+1 Ca
+2 Mg
+2 K
+1 Cl
-1 SO4
-2
CO3-2
+HCO3-1
1
0-20 7.8 119.1 136 27 8 4 184 13 0.5 15 14 45 6 126
20-50 8.1 88.6 109 30 5 2 172 6 0.4 10 13 39 3 112
50-90 7.7 103.4 185 26 7 4 223 16 0.4 12 15 43 3 78
90-150 7.6 104.8 160 26 9 4 210 14 0.5 9 16 21 4 66
2
0-30 7.9 5.4 4 2 1 1 8 1 0.4 11 9 40 7 101
30-70 9.4 3.1 4 1 0 0 6 1 0.2 12 8 40 9 69
70-130 8.2 10.9 10 3 2 1 17 1 0.6 10 10 25 6 78
3
0-15 8.0 38.2 67 6 2 2 79 3 0.3 14 15 45 8 67
15-55 9.1 31.7 36 8 2 1 46 5 0.6 9 11 38 7 95
55-105 8.6 57.3 82 14 3 1 102 8 0.4 11 13 43 5 68
105-150 8.4 44.2 57 10 3 2 81 3 0.8 8 14 23 5 55
4
0-20 8.2 41.8 49 14 4 2 80 2 0.4 16 12 50 6 44
20-70 8.5 23.3 35 6 2 1 46 2 0.7 7 8 16 7 89
70-110 8.9 55.4 56 17 8 2 101 3 0.6 7 14 17 4 56
10-150 8.8 89.9 116 37 13 4 204 8 0.5 8 16 12 5 55
5
0-30 8.2 3.3 2 1 1 0 5 0 0.6 17 9 55 5 51
30-80 8.0 26.9 39 6 5 2 58 2 0.4 16 8 46 2 126
80-140 7.9 33.8 61 9 4 2 84 3 0.8 11 11 40 4 123
6
0-25 7.1 24.9 23 7 4 2 41 2 0.3 11 6 40 13 78
25-60 7.8 23.3 28 10 2 2 48 2 1.4 11 6 38 8 90
60-90 7.9 20.1 24 4 3 1 34 3 0.3 6 8 12 5 71
90-150 7.8 12.9 13 5 2 1 26 1 0.3 3 12 11 6 59
7
0-30 8.3 3.2 3 1 0 1 5 1 0.4 11 9 39 7 106
30-80 8.5 13.3 18 2 1 1 21 1 0.5 14 8 42 9 67
80-140 7.7 27.4 34 11 2 1 56 2 0.5 10 7 37 6 93
8
0-25 8.4 17.2 26 7 2 2 43 1 0.8 10 5 40 7 56
25-70 7.9 23.4 22 6 4 2 39 3 0.8 11 6 32 6 78
70-100 8.7 41.5 45 12 3 2 70 3 0.6 9 12 34 8 82
100-150 8.9 39.8 48 11 3 2 77 3 0.6 8 11 27 4 112
9
0-30 8.2 10.7 13 3 1 1 18 1 0.4 13 9 39 6 72
30-80 8.5 45.6 55 19 6 3 99 4 0.7 9 11 34 8 95
80-140 8.4 51.4 47 19 6 3 95 3 0.8 8 12 28 4 102
10
0-30 8.3 33.5 31 9 5 2 59 2 0.6 9 8 26 8 67
30-90 8.7 66.2 75 24 10 4 146 2 0.5 13 16 42 4 79
90-140 8.6 83.5 98 30 8 4 167 6 0.4 12 15 44 5 88
11
0-30 8.2 4.1 3 1 1 0 6 1 0.2 12 14 39 9 49
30-70 8.1 11.4 13 3 1 1 20 1 0.6 15 9 41 3 115
70-120 8.9 18.1 21 6 2 1 34 1 0.8 11 5 38 10 133
20-150 9.1 24.8 32 6 2 1 47 1 0.6 10 8 26 8 78
12
0-25 8.2 22.7 29 6 4 2 45 2 0.5 18 6 57 10 149
25-55 8.0 18.9 23 4 3 2 34 2 0.4 11 5 34 10 124
55-110 8.9 55.4 77 23 5 3 129 3 1.0 16 15 41 5 78
110-150 8.3 33.6 33 10 4 2 58 2 0.6 8 9 26 4 67
The soil fertility of the study area is low
where the available nitrogen content is
low (11-57 mg/kg), the available
phosphorus varies between 2 and 13
mg/kg and the available potassium has
low values of 44 and 149 mg/kg.
Therefore, these soils need NPK
fertilizers to be added.

Sayed and Khalafalla / Archives of Agriculture Sciences Journal 4(1) 205–220, 2021.
212
Figure (3): Spatial variability of a) the soil salinity (ECe) and b)
cation exchange capacity (CEC) of the study area.
3.2 Land capability
3.2.1 ASLE program
According to the applied system of land
evaluation (ASLE) program, the obtained
results showed that the study area has
three classes of land capability, namely
poor, very poor, and non-agricultural
(Table 5 and Figure 4). Most of the
investigated area are poor (C4). Soil
profiles Nos. 1, 8, and 12 are very poor
(C5), whereas soil profiles Nos. 3, 4, 9,
and 10 are non-agricultural (C6).
Figure (4): Land capability classes of the
study area using the ASLE program.

Sayed and Khalafalla / Archives of Agriculture Sciences Journal 4(1) 205–220, 2021.
213
Table (5): Land capability classes of the investigated soils using
the applied system of land evaluation (ASLE) program.
A. Profile No. The applied system of land evaluation (ASLE) program
% Class
1 10.09 C5 (Very poor)
2 34.78 C4 (Poor)
3 9.64 C6 (Non-agricultural)
4 9.67 C6 (Non-agricultural)
5 31.22 C4 (Poor)
6 25.78 C4 (Poor)
7 32.65 C4 (Poor)
8 11.28 C5 (Very poor)
9 9.50 C6 (Non-agricultural)
10 6.83 C6 (Non-agricultural)
11 34.67 C4 (Poor)
12 12.69 C5 (Very poor)
3.2.2 MicroLEIS (Cervatana model)
Concerning the application of the
microcomputer land evaluation
information system (MicroLEIS-
Cervatana model), all the study areas have
a marginal capability grade, except soil
profile No. 2 which has a moderate
capability grade (Table 6 and Figure 5).
The soil limitations are coarse soil texture,
soil salinity, soil fertility, and erosion risk.
3.3 Land suitability
3.3.1 ASLE program
The land suitability classes for some
selected crops using the applied system of
land evaluation program that can be
grown in the study area are shown in
Table (7) and Figure (6).
Table (6): Land capability grades of the studied soils
using MicroLEIS program (Cervatana model).
A. Profile No. B. MicroLEIS program (Cervatana model)
Grade
1 N1(Marginal)
2 S3r (Moderate)
3 N1(Marginal)
4 N1(Marginal)
5 N1(Marginal)
6 N1(Marginal)
7 N1(Marginal)
8 N1(Marginal)
9 N1(Marginal)
10 N1(Marginal)
11 N1(Marginal)
12 N1(Marginal) r: Erosion risk, 1: Soil limitation.

Sayed and Khalafalla / Archives of Agriculture Sciences Journal 4(1) 205–220, 2021.
214
Figure (5): Land capability classes of the
study area using MicroLEIS program
(Cervatana model).
Accordingly, the soils of the study area
have in general a widely range of
suitability grades, from highly suitable
(S1) to not suitable N (currently not
suitable, N1 and permanently not suitable,
N2). Most of the selected crops are highly
suitable, suitable moderately suitable, and
marginally suitable for field crops, forage
crops, vegetables, and fruit crops, except
crops rice, cabbage, and banana that are
currently not suitable (N1) and
permanently not suitable (N2) for some soils.
Table (7): Land suitability classes under the surface, sprinkler, and drip irrigation systems of
the study area for selected crops using ASLE program.
Pro
file
No.
Field Crops Forage Crops Vegetables Fruit Crops
Sunfl
ow
er
Fab
a bea
n
Bar
ley
Sugar
bee
t
Whea
t
Cott
on
Pea
nut
Mai
ze
Soya
bea
n
Sugar
cane
Ric
e
Alf
alfa
Sorg
hum
Tom
ato
Pep
per
pea
Wat
er m
elon
Onio
n
Pota
to
Cab
bag
e
Dat
e pal
m
Fig
Oli
ve
Gra
pe
Apple
Pea
r
Cit
rus
Ban
ana
1 S4 NS1 NS2 NS2 NS2 NS1 NS1 NS1 NS1 NS2 NS2 NS2 NS1 S4 S4 S4 S4 NS2 NS1 NS2 S4 S4 S4 S4 NS1 NS2 NS1 NS2
2 S2 S3 S4 S4 S4 S2 S2 S3 S3 S4 NS2 S4 S3 S2 S2 S2 S2 S4 S3 NS1 S2 S2 S2 S2 S3 S4 S2 NS2
3 S4 NS1 NS2 NS2 NS2 NS1 NS1 NS1 NS1 NS2 NS2 NS2 NS1 S4 S4 S4 S4 NS2 NS1 NS2 S4 S4 S4 S4 NS1 NS2 NS1 NS2
4 NS1 NS1 NS2 NS2 NS2 NS1 NS1 NS1 NS1 NS2 NS2 NS2 NS1 S4 S4 NS1 NS1 NS2 NS1 NS2 S4 NS1 NS1 NS1 NS1 NS2 NS1 NS2
5 S2 NS1 S4 S4 S4 S3 NS1 NS1 NS1 S4 NS2 S4 S3 S2 S4 NS1 NS1 NS2 NS1 NS2 S2 S2 S2 S2 NS1 NS2 NS1 NS2
6 S4 NS2 S4 S4 NS2 S4 NS1 NS2 NS2 NS2 NS2 NS2 NS2 NS2 NS2 NS2 NS2 NS2 NS1 NS2 S2 S4 NS2 S4 NS2 NS2 NS1 NS2
7 S2 NS1 S4 S4 S4 S2 S3 S3 NS1 S4 NS2 S4 S3 S2 S2 NS1 S3 S4 S3 NS2 S2 S2 S2 S2 S3 NS1 S3 NS2
8 S4 S4 S4 NS2 NS2 S2 NS1 NS1 NS1 NS2 NS2 NS2 NS1 S4 S4 S4 S4 NS2 NS1 NS2 S2 S4 S4 S4 NS1 NS2 NS1 NS2
9 S3 NS1 S4 S4 NS2 S3 NS1 NS1 NS1 NS2 NS2 NS2 NS1 S4 S4 NS1 NS1 NS2 NS1 NS2 S2 S4 NS1 S4 NS1 NS2 NS1 NS2
10 S4 NS2 S4 S4 S4 S4 NS1 NS2 NS2 NS1 NS2 NS2 NS2 NS2 NS2 NS2 NS2 NS2 NS1 NS2 S2 S3 S4 NS1 NS2 NS2 NS1 NS2
11 S1 S1 S1 S1 S1 S2 S2 S2 S2 S2 NS2 S1 S2 S1 S1 S1 S1 S1 S2 NS2 S1 S1 S1 S1 S2 S2 S1 NS2
12 S2 S2 S4 S4 S4 S2 S2 S2 S2 S4 NS2 S4 S2 S2 S2 S2 S2 S3 S2 NS1 S1 S1 S1 S2 S2 S4 S2 NS2
S1: Highly suitable (˃80 %), S2: Suitable (60-80 %), S3: Moderately suitable (30-60 %), S4: Marginally suitable

Sayed and Khalafalla / Archives of Agriculture Sciences Journal 4(1) 205–220, 2021.
215
(20-30 %), N1: Currently not suitable (10-20 %), N2: Permanently not suitable (<10 %).
Figure (6): Land suitability of the study area for selected crops using ASLE program.

Sayed and Khalafalla / Archives of Agriculture Sciences Journal 4(1) 205–220, 2021.
216
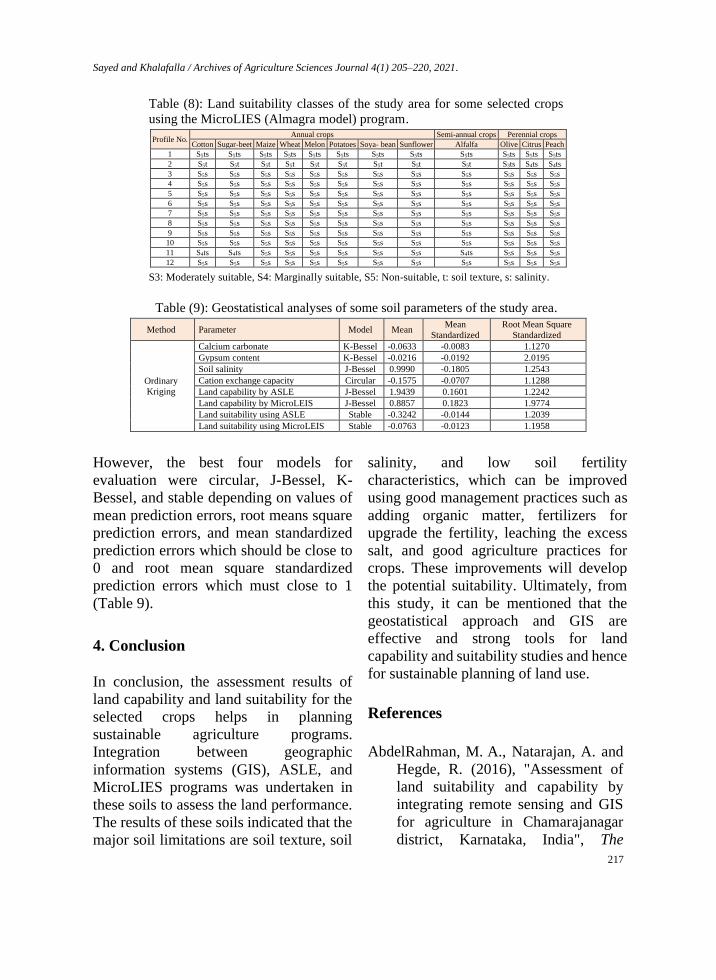
3.3.2 MicroLEIS (Almagra model)
In general, the soils of the study area are
not suitable (5) for the selected crops using
the microcomputer land evaluation
information system (MicroLEIS-Almagra
model) with few exceptional cases which
are present and illustrated in Table (8) and
Figure (7) respectively. The soil
limitations of the current study are soil
texture, soil salinity, and soil fertility.
3.4 Geostatistical analysis
Geostatistical analyses for mapping
distribution of some soil properties, land
capability, and land suitability rates were
calculated using variance structure that
was performed using eleven semi-
variogram models; circular, spherical,
tetraspherical, pentaspherical, exponential,
gaussian, rational quadratic, hole effect, k-
bessel, j-bessel and stable.
Figure (7): Land suitability of the study area for some selected crops using MicroLIES
(Almagra model).
Sayed and Khalafalla / Archives of Agriculture Sciences Journal 4(1) 205–220, 2021.
217
Table (8): Land suitability classes of the study area for some selected crops
using the MicroLIES (Almagra model) program.
Profile No. Annual crops Semi-annual crops Perennial crops
Cotton Sugar-beet Maize Wheat Melon Potatoes Soya- bean Sunflower Alfalfa Olive Citrus Peach
1 S5ts S5ts S5ts S5ts S5ts S5ts S5ts S5ts S5ts S5ts S5ts S5ts
2 S5t S5t S5t S5t S5t S5t S5t S5t S5t S3ts S4ts S4ts
3 S5s S5s S5s S5s S5s S5s S5s S5s S5s S5s S5s S5s
4 S5s S5s S5s S5s S5s S5s S5s S5s S5s S5s S5s S5s
5 S5s S5s S5s S5s S5s S5s S5s S5s S5s S5s S5s S5s
6 S5s S5s S5s S5s S5s S5s S5s S5s S5s S5s S5s S5s
7 S5s S5s S5s S5s S5s S5s S5s S5s S5s S5s S5s S5s
8 S5s S5s S5s S5s S5s S5s S5s S5s S5s S5s S5s S5s
9 S5s S5s S5s S5s S5s S5s S5s S5s S5s S5s S5s S5s
10 S5s S5s S5s S5s S5s S5s S5s S5s S5s S5s S5s S5s
11 S4ts S4ts S5s S5s S5s S5s S5s S5s S4ts S5s S5s S5s
12 S5s S5s S5s S5s S5s S5s S5s S5s S5s S5s S5s S5s
S3: Moderately suitable, S4: Marginally suitable, S5: Non-suitable, t: soil texture, s: salinity.
Table (9): Geostatistical analyses of some soil parameters of the study area.
Method Parameter Model Mean Mean
Standardized
Root Mean Square
Standardized
Ordinary
Kriging
Calcium carbonate K-Bessel -0.0633 -0.0083 1.1270
Gypsum content K-Bessel -0.0216 -0.0192 2.0195
Soil salinity J-Bessel 0.9990 -0.1805 1.2543
Cation exchange capacity Circular -0.1575 -0.0707 1.1288
Land capability by ASLE J-Bessel 1.9439 0.1601 1.2242
Land capability by MicroLEIS J-Bessel 0.8857 0.1823 1.9774
Land suitability using ASLE Stable -0.3242 -0.0144 1.2039
Land suitability using MicroLEIS Stable -0.0763 -0.0123 1.1958
However, the best four models for
evaluation were circular, J-Bessel, K-
Bessel, and stable depending on values of
mean prediction errors, root means square
prediction errors, and mean standardized
prediction errors which should be close to
0 and root mean square standardized
prediction errors which must close to 1
(Table 9).
4. Conclusion
In conclusion, the assessment results of
land capability and land suitability for the
selected crops helps in planning
sustainable agriculture programs.
Integration between geographic
information systems (GIS), ASLE, and
MicroLIES programs was undertaken in
these soils to assess the land performance.
The results of these soils indicated that the
major soil limitations are soil texture, soil
salinity, and low soil fertility
characteristics, which can be improved
using good management practices such as
adding organic matter, fertilizers for
upgrade the fertility, leaching the excess
salt, and good agriculture practices for
crops. These improvements will develop
the potential suitability. Ultimately, from
this study, it can be mentioned that the
geostatistical approach and GIS are
effective and strong tools for land
capability and suitability studies and hence
for sustainable planning of land use.
References
AbdelRahman, M. A., Natarajan, A. and
Hegde, R. (2016), "Assessment of
land suitability and capability by
integrating remote sensing and GIS
for agriculture in Chamarajanagar
district, Karnataka, India", The

Sayed and Khalafalla / Archives of Agriculture Sciences Journal 4(1) 205–220, 2021.
218
Egyptian Journal of Remote Sensing
and Space Science, Vol. 19 No. 1, pp.
125–141.
Bandyopadhyay, S., Jaiswal, R. K.,
Hegde, V. S. and Jayaraman, V.
(2009), "Assessment of land
suitability potentials for agriculture
using a remote sensing and GIS
based approach", International
Journal of Remote Sensing, Vol. 30
No. 4, pp. 879–895.
De la Rosa, D., Mayol, F., Diaz-Pereira,
E. and Fernandez, M. (2009), "A land
evaluation decision support system
(MicroLEIS DSS) for agricultural
soil protection", Environmental
Modeling and Software, Vol. 19, pp.
929–942.
De la Rosa, D., Moreno, J. A., Garcia, L. V. and Almorza, J. (2004),
"MicroLEIS: A microcomputer-
based Mediterranean land evaluation
information system", Soil Use and
Management, Vol. 8, pp. 89–96.
ESRI (2014), Arc Map version 10.2.2.
User Manual, 380 New York Street,
Redlands, California, 92373–8100,
USA.
Fadel, M. E. and Sayed, Y. A. (2020),
"Land Resources Evaluation for
Sustainable Agriculture in El-Qusiya
Area, Assiut, Egypt. Egypt",
Egyptian Journal of Soil Science,
Vol. 60 No. 3, pp. 289–302.
FAO (2006), Guidelines for soil profile
description, 4th edition, Food and
Agriculture Organization of the
United Nations. Rome, Italy.
Hesse, P. R. (1998), A Textbook of soil
chemical analysis, CBS Publishers &
Distributors, Delhi, India.
Ismail, H. A., Morsy, I., El-Zahaby, E. M.
and El-Nagar, F. S. (2001), "A
developed expert system for land use
planning by coupling land
information system and modeling",
Alexandria Journal of Agricultural
Research, Vol. 46 No. 3, pp. 141–
154.
Ismail, H. and Morsi, I. (2001), Applied
System of Land Evaluation (ASLE) in
arid zones (software), Soil and Water
Science Department, Faculty of
Agriculture, Alexandria University,
Egypt.
ITT (2017), ITT Corporation, ENVI 5.1
Software, 1133 Westchester Avenue,
White Plains, NY 10604, USA.
Jackson, M. L. (1973), Soil chemical
analysis, Prentice-Hall of India, New
Delhi.
Klute, A. and Dirksen C. (1986),
Hydraulic conductivity and
diffusivity: laboratory methods, In:
Klute, A. (ed.), Methods of Soil
Analysis, Part 1., 2nd ed. ASA
Publications, Madison, WI., USA,
pp. 687–734.
Marei, S. M., Ismail, H. A. and Meshref,
H. (1987), "A computer program for
land evaluation in Egypt", Mansoura
University Journal of Agricultural
Sciences, Vol. 12 No. 4 pp. 1427–

Sayed and Khalafalla / Archives of Agriculture Sciences Journal 4(1) 205–220, 2021.
219
1447.
Mclean, E. O. (1982), "Soil pH and lime
requirement", In Page, A.L., Miller,
R.H. and Keeney, D.R. (eds.,)
Methods of soil analysis, Part 2 -
Chemical and Microbiological
Properties, 2nd edition. Agronomy 9:
Am. Soil Sci. Soc., Madison, WI.,
USA, pp. 199–223.
Mevlut, U. (2016), "Determination of
agricultural soil index using
geostatistical analysis and GIS on
land consolidation projects: A case
study in Konya/Turkey", Computers
and Electronics in Agriculture, Vol.
123, pp. 402–409.
Nelson, R. E. (1982), "Carbonate and
gypsum", In: Page, A.L., Miller, R.
H. and Keeney, D.R. (eds.), Methods
of soil analysis, Part 2-Chemical and
Microbiological properties, 2nd ed.,
Agronomy 9, Soil Science Society of
America, Madison, WI., USA, pp.
181–198.
O’Geen, A. T. (2008), Revised Storie
Index for Use with Digital Soils
Information, Water: 11, Publication
8335, Division of Agriculture and
Natural Resources, University of
California, USA.
Olsen S. R. and Sommers, L. E. (1982),
Methods of Soil Analysis Part 2:
Chemical and Microbiological
Properties, Second ed., In: Page,
A.L., Miller, R.H. and Keeney, D.R.
(eds), American Society Agronomy,
Madison, Wisconsin, USA, pp. 403–
430
Piper, C. S. (1950), Soil and plants
analysis, InterScience, Inc., New
York. USA.
Soil Survey Staff (1993), Soil Survey
Manual, Soil Conservation Service,
U.S. Department of Agriculture,
Handbook, 18.
Sys, C. (1979), Evaluation of the physical
environment for irrigation in terms of
land characteristics and land
qualities, World Soil Resources
Reports (FAO), No. 50.
Sys, C. and Verheye, W. (1978), An
Attempt to the Evaluation of Physical
Land Characteristics for Irrigation
According to the FAO Framework
for Land Evaluation, International
Training Center for Post Graduate
Soil Scientists, Chent, Belgium, pp.
66–78.
Sys, C. E., Van, R. E., Debaveye, J. and
Beernaert, F. (1993), Land
evaluation, part III: crop
requirements, General
administration for development
cooperation, Agricultural
Publication, No. 7, Brussels,
Belgiem, pp. 191–195.
Webster, R. and Oliver, M. A. (2007),
Geostatistics for Environmental
Scientists, Second edition, John
Wiley & Sons, West Sussex,
England.
Zamil, B. A., Abd Allah, M. A., El-
Salam, G. M. and El-Shahawy, M. I. (2009), "Land evaluation of old
irrigated soils in North Delta region

Sayed and Khalafalla / Archives of Agriculture Sciences Journal 4(1) 205–220, 2021.
220
(Rewena Canal Area) at Kafr El
Sheikh governorate", Alexandria
Science Exchange Journal, Vol. 30
No. 2, pp. 206–227.