Embed Size (px)
DESCRIPTION
Land and water productivity Trends across Punjab canal commands 2000
Citation preview

WORKING PAPER 14
Pakistan Country Series Number 3
Land and Water
Productivity
Trends Across Punjab CanalCommands
Zubair Tahir
Zaigham Habib
IWMI is a Future Harvest CenterSupported by the CGIAR
SM
Working Paper 14
Land And Water Productivity: Land And Water Productivity: Trends Across Punjab Canal Trends Across Punjab Canal
CommandsCommands
Zubair Tahir Zaigham Habib
International Water Management Institute

The authors: Zubair Tahir, Economist IWMI Zaigham Habib, Principal Researcher (WM) IWMI
Tahir, Z. and Habib, Z. 2000. Land and Water Productivity trends: Across Punjab Cananl, Pakistan: International Water Management Institute (IWMI) 35p. (IWMI working paper 14).
/ land productivity / water productivity / gross value of productivity / canal command / water availability / performance indicators / Indus Basin / Punjab / Pakistan
ISBN: 92-9090-435-6
Copyright © 2001, by IWMI. All rights reserved.
Please direct inquiries and comments to: [email protected]
IWMI receives its principal funding from 58 governments, private foundations, and international and regional organizations known as the Consultative Group on International Agricultural Research (CGIAR). The Governments of Pakistan, South Africa, and Sri
Lanka also give support.
iii
Contents
GLOSSARY ................................................................................................................................... vi
INTRODUCTION ........................................................................................................................... 1 Perspective .................................................................................................................................. 1 Objectives of the current report .................................................................................................. 2 Study Area................................................................................................................................... 3
METHODOLOGY .......................................................................................................................... 4
Gross production indicators: the concept.................................................................................... 4 Production per unit of cropped area (Rs./hectare)........................................................................................................ 5 Production per unit of command area (Rs./hectare)..................................................................................................... 5 Production per unit of water (Rs / m3) ............................................................................................................................. 5
Explaining variation in GVP with special reference to water..................................................... 5 Functional form........................................................................................................................... 6
INFORMATION AVAILABILITY AND ITS LIMITATIONS....................................................... 7 Information on crop acreage, yields and commodity prices ....................................................... 7
Crop Acreage........................................................................................................................................................................ 7 Crop Yields............................................................................................................................................................................ 8 Commodity Prices................................................................................................................................................................ 8 Solution.................................................................................................................................................................................. 9
Information on water sources.................................................................................................... 10 Canal Water........................................................................................................................................................................10 Rain Water ..........................................................................................................................................................................11 Ground Water.....................................................................................................................................................................12
VARIATION IN GVP ACROSS CANAL COMMANDS.............................................................. 13 Estimation of Gross production Indicators ............................................................................... 13
GVP per unit of land in Kharif and Rabi.......................................................................................................................14 GVP per unit of water in Kharif and Rabi.....................................................................................................................15 Annual GVP per unit of land and water ........................................................................................................................16
GVP, Cropping intensity and cropping pattern......................................................................... 17 Cropping intensity, water availability and GVP ..........................................................................................................17 Cropping Pattern, water availability and GVP............................................................................................................18 GVP as a function of cropping intensity and cropping pattern.................................................................................21
GVP and water availability....................................................................................................... 21 GVP per unit of water and different sources of water.................................................................................................24
SUMMARY AND CONCLUSIONS.............................................................................................. 27 Summary of findings................................................................................................................. 27 Conclusions ............................................................................................................................... 28
REFERENCES.............................................................................................................................. 30
ANNEX 1: THE INDUS BASIN IRRIGATION SYSTEM............................................................. 31
ANNEX 2: PERCENTAGE OF DISTRICT AREAS FALLING IN PUNJAB CANALS............... 33
ANNEX 3: YIELD OF MAJOR CROPS....................................................................................... 35
iv
ABSTRACT
As a consequence of green revolution in 1960s, though irrigated areas and agriculture production has increased considerably, yields are still less as compared to various countries of the world. Furthermore, huge spatial variation in cropping pattern and productivity of land and water within irrigated agriculture of Pakistan has become a chronic issue. There are various reasons causing low production. These include farmers' investment potential, physical environments, market mechanism and availability of water, which is the most precious input in farming. The role of irrigation water resources and its management is extremely important. The sustainability of agriculture can be largely insured through proper and better management of water resources. Indus Basin Irrigation System (IBIS) is basically supply-based by its design which means water is not supplied according to crop requirement. Low gross production is an inherent limitation of this supply-based system.
The research activity aims to see the spatial variation in production across canal commands using gross production indicators i.e. Gross Value of Production (GVP) per unit of land and GVP per unit of
water. Given the data constraints, Punjab province is selected for the analysis, which consists of major network of 12, inter-linked and a total of 23 canals out of 45 canals of IBIS. The analysis is performed at the canal command level.
Secondary data gathered from government agencies are used. These data are available at different levels e.g. canal commands, administrative districts and meteorological stations. Geographic Information System is used to standardize the data at canal command level. Water availability responses to GVP are analyzed by using regression technique. By explaining GVP in two ways Inferences are made. First, by estimating GVP as a response of intensity and types of crops grown in a canal command, as both mainly rely on water. Second, by estimating direct relationship between GVP and water availability.
Huge variation in cropping intensities across Punjab canals is found which ranges from less than 60% to 160%, annually. GVP per hectare of command area varies with a ratio of about 1:5 (Rs. 3844 per hectare to Rs. 18326 per hectare). GVP per cubic meter of water varies with a ratio of 1:5 (Rs. 0.35 per
cubic meter to Rs. 1.57 per cubic meter). Some canal commands produce less per unit of land and per unit of water in spite of higher canal supplies. Environmental degradation i.e. waterlogging/salinity is probably the reason for low production. Ground water is the major influence in certain canal command areas during Rabi season. Annual GVP and Kharif GVP are explained by canal water while Rabi GVP is explained by ground water.

v
ACKNOWLEDGMENTS
We wish our appreciation to staff of Punjab Irrigation and Drainage Authority (PIDA), Pakistan Meteorological Department (PMD), Water and Power Development Authority (WAPDA) and Directorate of Economic & Marketing of Provincial Agriculture Department for making the required information available to us.
We wish our gratitude to S. A. Prathapar for his guidance at the initial stage of the study. Thanks are owed to Chris Perry, Gil Levine and Randy Barker for their constructive comments.
We are also indebted to Asim Rauf Khan, M. Kaleem Ullah for providing information and helpful
discussions and also to Amir Wazir for making tedious visits to different agencies to collect information. The efforts of Asma Bashir for preparing data files are also appreciated.
Special thanks go to Salman Asif for his help in GIS work and Saim Muhammad for preparing maps. We are also grateful to Sofiya Saeed for editing the manuscript and Shahnaz Akhtar to format it.
Finally, we extend our gratitude to Hammond Murray-Rust (Acting Director, IWMI Regional office for Pakistan and Central Asia) for his support to make this manuscript, public.

vi
GLOSSARY
Abiana = Irrigation water charges.
ASP = Agriculture Statistics of Pakistan.
CA = Cropped Area.
CCA = Culturable Command Area of canal.
DEM = Directorate of Economic and Marketing of the Provincial Agriculture Department.
GCA = Gross Command Area of canal.
GDP = Gross Domestic Product.
GIS = Geographic Information System.
GVP = Gross Value of Production.
Kharif = Summer time, warm-wet season, officially mid-April to mid-October.
Patwari = Revenue and Irrigation department official responsible for keeping land records and assessing abiana, respectively.
PIPD = Provincial Irrigation and Power Department.
Rabi = Winter time, cool-dry season, officially mid-October to mid-April.
Tehsil = A sub-divisional administrative zone under a district administration.
Tehsildar = Revenue officer of tehsil.
WAPDA = Water and Power Development Authority.
Zilladar = Head of a section of irrigation sub-division who have several patwari under him. Usually an irrigation sub-division consists of 3-4 sections.
UNITS
1 Hectare = 2.471 Acres
1 US $ = 30 Pak. Rupees (1993-94)
1
LAND AND WATER PRODUCTIVITY TRENDS ACROSS PUNJAB CANAL COMMANDS
INTRODUCTION
Perspective
Pakistan is one of the foremost among the countries facing threat of rapidly increasing population with the growth rate of 2.7 percent. Its population was reported 138 million in 1998 (census 1998) and was projected to reach 208.06 million in year 2025 (PWP 2000). Food grain production in the country shows shortfall with respect to its requirement. A recent study shows that food grain requirement will increase from 26 million ton in year 2000 to 40 million ton in year 2025 (PWP 2000). Alongside the food grain, requirement for other products of agriculture sector will have to face momentous increase. Hitherto, agriculture is the backbone of country's economy having 1/4th share in its Gross Domestic Product (GDP). About 50 percent of the labor force relies on agriculture. The sector earns 70 percent of export revenue, directly or indirectly (World Bank 1994).
Out of 80 million hectares of Pakistan, 20 million hectares of land is cultivable and 75 percent of this consists of irrigated areas. The climatic conditions are suitable for double cropping. The summer cropping season which lies between mid April to mid October is called Kharif season while the rest
(winter) is called Rabi season. Major crops of Kharif are Cotton and Rice while in Rabi season Wheat is the single major crop. Sugarcane is an annul crop, which takes almost whole year to mature. Fodder is sown in both seasons to fulfill the local livestock requirements.
The green revolution in 1960s brought more area under cultivation. Though the production of crops increased considerably, crop yields are lower than many other countries of the world (Mellor et al 1994) particularly wheat, which contributes more than 50% of per capita daily availability of calories and 85% of the total protein intakes (Alderman et al 1993).
The stagnant yields and huge disparity in average yields demand inquiry of its causes. There can be several causes of low production. Along with the socio-economic factors e.g. land tenure and land fragmentation, there are several physical factors as well for this low yield. Indus basin Irrigation system is basically supply-based by its design, which means water, is not supplied according to crop water requirements. Thus, the irrigation supplies do not meet the crop water needs for optimum yields.
Adequacy and reliability are the two main issues. The volume of water supplied does not match with the time pattern of crop needs.
Being a precious input in farming, the role of irrigation water resources and its management is extremely important. The sustainability of agriculture can be largely insured through the proper and better management of water resources. There have been substantial changes in century old contiguous
2
system, which now consists of 3 major reservoirs, 15 barrages, 12 link canals and 45 mains canals (see annex 1 for a note of Indus Basin Irrigation System, IBIS).
The annual average water supply through this network is about 180 billion cubic meters and the command area is 14.3 million hectares. Before the development of present system of canals in 1817 by
British Army engineers, a number of inundation canals existed on all rivers of the Indus Basin. They were constructed and managed by cultivators, local states or tribes. Building weirs, head works and remodeling of the canals by 1900 improved four old inundation canals of Punjab. Most of the existing irrigation channels of Punjab were constructed before 1930 and most of the projects in other provinces were completed before 1960.
Before 1960's, there were no reservoirs within the Basin. Water was diverted from rivers to canals through weirs. Water rights of the canals were fixed as perennial or non-perennial (Table 1.1). This classification was based on availability of river water at the specific location in winter, water use patterns of the inundation canals and political agreements between states and the British Government. Design cropping intensities and water duties were based upon the average values in the cultivated areas of that time. The management, operation and maintenance rules were designed on simplicity requiring minimum human interventions.
Since 1960's, there have been significant changes in the physical and management structure of the system. These include the construction of inter-river link canals and reservoirs as the result of Indus Basin Treaty of 1960 between India and Pakistan, which led to approximately 40% increase in water availability. Furthermore, groundwater became a major supplement to canal water. Resultantly, the cultivable area increased by 15-20 percent and cropping intensities doubled.
In spite of these changes, the official water allocation strategy has not been revised. Consequently, there is lack of coherence among water allocation rules that are in place. The Indus Basin Study of IWMI aims at developing coherent water allocation rules, which maximize agricultural production and minimize environmental degradation (Habib 1997). One major component of this study is to analyze the relationship between surface water supplies, ground water use, cropping pattern, environmental degradation and agriculture production through gross performance indicators. On production side, these Indicators include production per unit of land and production per unit of water. The estimation of these two indicators is the major concern of the report. Production is estimated in term of money values
(section 2), which is called Gross Value of Production (hereafter GVP). The analysis provides an overview of money return per unit of area and per drop of surface water made available to different canal commands. The specific objectives of the current report are mentioned in the following section.
Objectives of the current report
Current report has four specific objectives;
§ Discuss sources of secondary information which could be used to determine the spatial variation in gross value of production (GVP) per unit of land and per unit of water,

3
§ Identify methods to reconcile information available at different levels by canal command level,
§ Find out the spatial distribution of GVP per unit of land and water;
§ Estimate the effect of water available from different sources on GVP.
Study Area
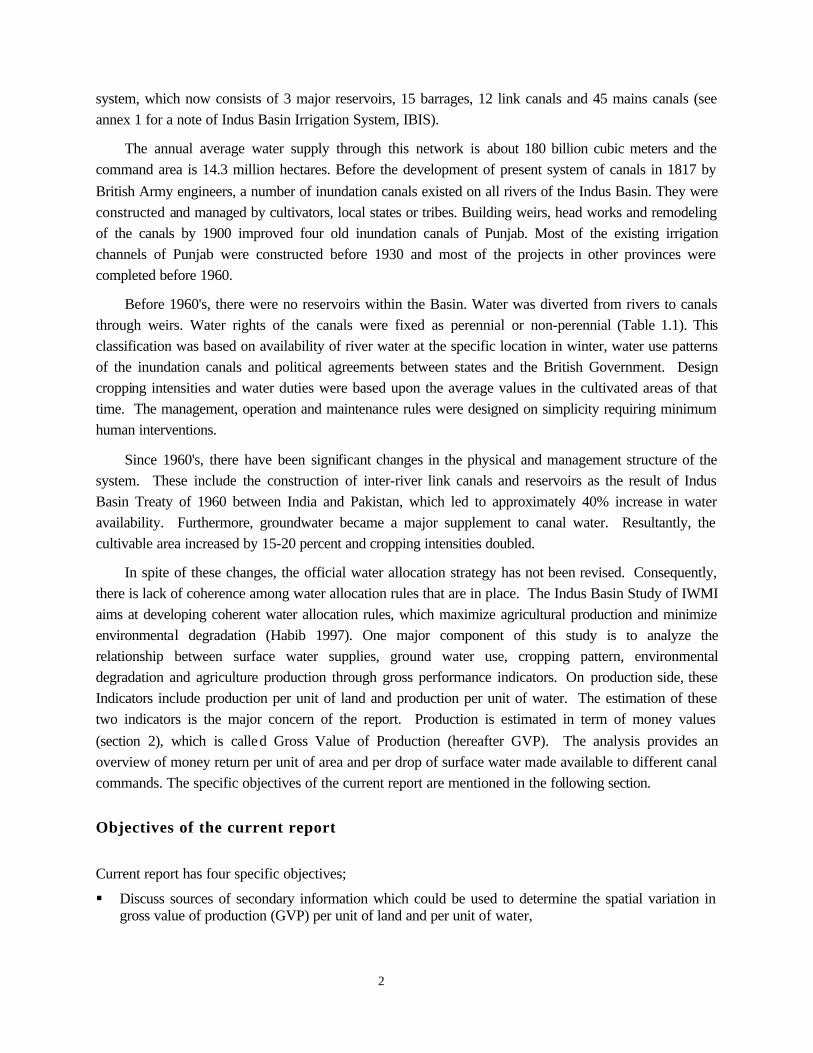
Given the information constraint, canal commands of Punjab province are chosen for the analysis. The Punjab area consists of 23 canals (Figure 1.1) out of the total 45 canals of the Indus basin. Punjab is the biggest part of contiguous Indus Basin Irrigation System (IBIS), consisting of 12 inter-linked channels. It consists of the 25.8 percent of the land area of the country with 56.5 percent of total population (GWP 1999) and is a densely populated area. Table 1.1 presents the salient statistics of Punjab canals, which include year of operation, Gross Command Area (GCA), Culturable Command Area (CCA) and information on perennial and non-perennial systems.
Figure 1.1. Punjab canal commands.
4
Table 1.1. Command area statistics of Punjab canals.
Canals Year of Operation
GCA CCA % Area Perennial
Upper Chenab 1912 618836 580147 60%
M.R.Link 1956 71002 63616 0%
C.B.D.C. 1859 284639 265700 100%
Depalpur (Upper) 1928 152223 141711 0%
Depalpur (Lower) 1928 263620 247718 0%
B.R.B.D. 0%
Lower Chenab (East) 1892 773321 647502 95%
Lower Chenab (West) 1892 724140 588614 95%
Upper Jehlum 1915 236625 220094 69%
Lower Jehlum 1901 662982 614488 86%
Thal 1947 950802 773843 100%
L.B.D.C. 1913 740374 675667 97%
Haveli 1939 457382 411711 36%
Mailsi 1928 303916 277956 32%
Pakpattan (Upper & Lower) 1927 570971 516233 60%
Fordwah 1927 188118 173111 15%
East Sadiqia 1926 497749 424850 98%
Abbasia 1929 120739 96139 48%
Bahawal 1927 365681 299776 47%
Qaim 1927 18320 17121 0%
Panjnad 1929 613172 551926 33%
D.G.Khan 1958 388706 368546 0%
Muzaffargarh 1958 383473 331764 0%
Rangpur 1939 144831 139769 0%
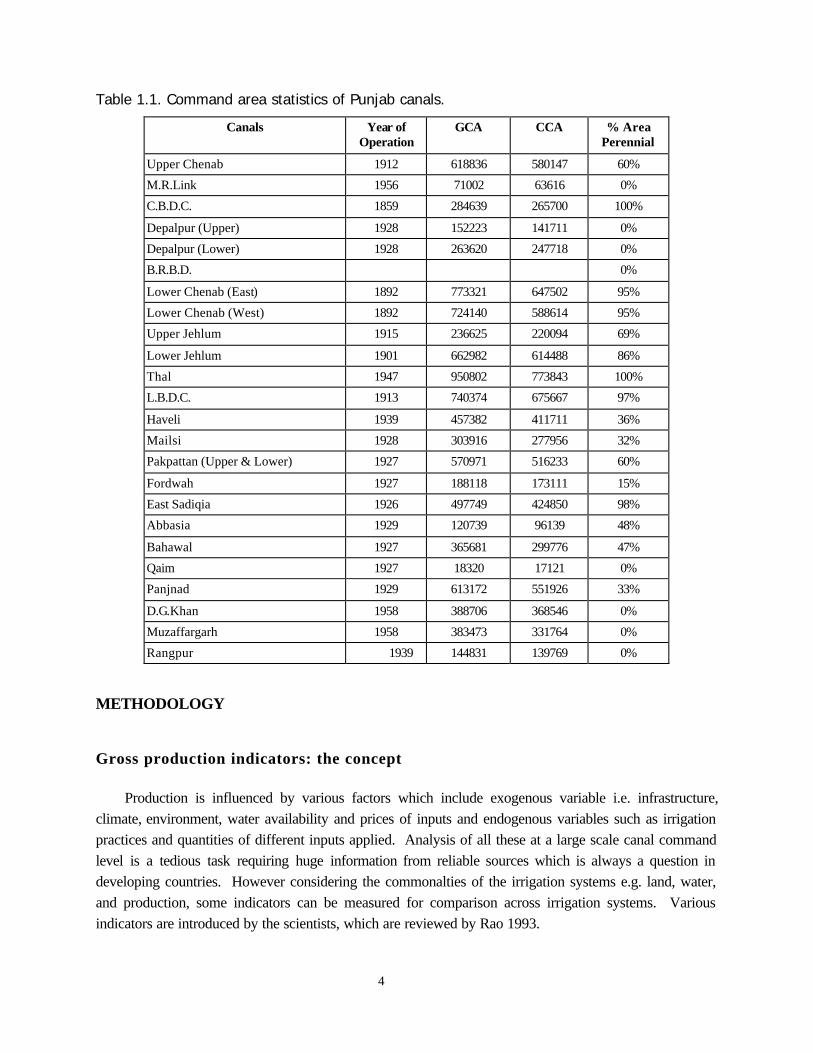
METHODOLOGY
Gross production indicators: the concept
Production is influenced by various factors which include exogenous variable i.e. infrastructure, climate, environment, water availability and prices of inputs and endogenous variables such as irrigation practices and quantities of different inputs applied. Analysis of all these at a large scale canal command level is a tedious task requiring huge information from reliable sources which is always a question in developing countries. However considering the commonalties of the irrigation systems e.g. land, water, and production, some indicators can be measured for comparison across irrigation systems. Various indicators are introduced by the scientists, which are reviewed by Rao 1993.
5
Perry 1996 presented a minimum set of indicators, which are tested for various systems by IWMI scientists. These indicators are not too data-intensive to discourage widespread application.
Given the data constraint, three basic production indicators, gross value of production (hereafter GVP) per cropped area; GVP per command area and GVP per unit of water are selected. The rationale
behind considering VALUE of production instead of MASS production is obvious. Mass production is meaningful for comparison when only one crop is considered. But when different crops are aggregated, one has to translate production into value by considering its market prices, as 1 kg of a crop is not equal to 1 kg of another in terms of value. In the study, as the analysis is for the canal systems of the same region, therefore, local prices are used. Following is the description of these indicators.
Production per unit of cropped area (Rs./hectare)
( )CA
pcGVP jj
i
∑ ×=
Where; GVPi = Gross value of production in jth season, Cj = crop production of jth crop, Pj = market price of jth crop, and CA = Cropped area
Production per unit of command area (Rs./hectare)
( )CCA
pcGVP jj
i
∑ ×=
Where; CCA means Culturable Command Area
Production per unit of water (Rs / m3)
( )Water
pcGVP jj
i
∑ ×=
Where; Water = water available
GVP per unit of CA measures the response of land used for crops while GVP per unit of CCA
measures the response of land available for crops. GVP per unit water measures the response of water available. Ideally, a 4th indicator GVP per unit of water used, should also be calculated. However, this is not included in the analysis due to non-availability of such information.
Explaining variation in GVP with special reference to water
Production of a particular crop can be increased in two ways. First, by increasing the area under that particular crop and second, by adopting yield enhancing inputs there. However, to increase the aggregate production (production sum of all crops in terms of money value), another important thing is, crop type.
6
Cash crops such as cotton and sugarcane give high returns. Therefore, three determinants of GVP appear cropping intensity, yields and cropping pattern. (Market prices also influence the gross value of production, however, this part is kept out of the analysis by assuming there is no variation in prices across canal commands as the agricultural markets are well integrated, Tahir et al. 1997).
Thus;
GVP = f (Cropping Intensity, Cropping Pattern, Yields)……………………………(1)
Though cropping intensity and cropping pattern are not solely determined by water and are influenced by other factors such as depth to water table and soil conditions, water availability is a major determinant among these. Similarly, yields of different crops also depend upon various endogenous factors i.e. use of better seeds, fertilizers, farm machinery, labour intensity and plant protection (pesticides
and wedicides etc.), however, water availability has a major influence. Given the data constrains, relationship of water availability with cropping intensity and cropping pattern, is estimated.
By explaining GVP in two ways Inferences are made. First, by estimating equation 1 and second, by estimating direct relationship between GVP and water availability (Equation 2).
GVP = f (Water Availability)………………………………………………………(2)
GVP from CCA is used, as dependent variable in the Equation 2 where CCA refers to Culturable Command Area whish is worthy of canal water.
Functional form
Water availability response to GVP is analyzed by using regression technique. This technique provides the information needed in determining the resource use and output patterns. In studying agricultural relations, economists usually use linear, log, semi-log and quadratic equations. Most accepted procedure to choose the functional form is that which best explains the variation in dependent variable. The functional forms that provide the least residual sum of square and highest coefficient of determination (R2) are used to select the best-fitted model (Maddala 1988). Following basic functional form is used to analyze the resource use efficiency.
εβα ++= ∑ ijj
n
ji XY
Where
Y = gross value of production;
α = constant;
β = parameters to be estimated; X = explanatory variable;
ε = random error term; i = 1,2,3…..n canals j = 1,2,3…..n explanatory variables.

7
INFORMATION AVAILABILITY AND ITS LIMITATIONS
Information on crop acreage, yields and commodity prices
To calculate GVP at canal command level, mainly three type of information is required (i) crop acreage (ii) crop yields, and (iii) output commodity prices. These data are collected by different government agencies at different scales. As these agencies have different objectives of monitoring, their methodology and time scale is not the same. For instance, Provincial Irrigation and Power Departments
monitor and maintain the information on crop acreage at main canal command level and its secondary and tertiary levels. PIPD staff monitor crops from acre to acre to levy water charges, which vary from area to area and crop to crop. The variation in water charges is due to crop water requirement of different crops. Thus, PIPD groups different crops according to crop families such as oilseeds, vegetables and pulses etc.
The following paragraphs discuss the above three topics, separately.
Crop Acreage
Crop acreage data are gathered from two sources;
i) Provincial Irrigation and Power Department (PIPD)
ii) Directorate of Crop Reporting Service, Agriculture Department, Government of Punjab
Scale of data of above two sources is different. PIPD maintain their data at canal command level as
they are directly concerned with canals while Crop Reporting Service keep up data at administrative unit level (districts). Crop Reporting Service has its sub-office at tehsil (district's lower administrative unit) level where they gather crop area data. The PIPD source is selected because data is available at canal
command level while conversion from district to canal command is not straightforward.
As discussed above, the purpose of maintaining crop acreage data by the PIPD is basically the assessment of crop for water charges. Revenue department is involved with the irrigation department in recovering water charges. The process of assessment of crop acreage and recovery is:
In an irrigation sub-division (usually a canal command consists of several sub-divisions), number of halqas on the basis of village located in the canal command, are established. One canal patwari (visiting clerk) is appointed per halqa. In the beginning of each season (rabi / kharif) a printed book1 is given to canal patwari by the Divisional Canal Officer through Deputy Collector. Canal patwari conducts numerous visits from crop sowing to its maturity. After the maturity, canal patwari makes final measurement by visiting halqa. After that he moves to his zilladar's office2 where he makes the final statement of assessment called khatuni. After the completion of khatunis, zilladar submits it to Divisional
1 Book is printed with machine numbered pages using indelible ink. 2 Zilladar is the head of a section of irrigation sub-division who have several patwaris under him. Usually an irrigation sub-
division consists of 3-4 sections.
8
Canal Officer where after final checking the khatunis are transferred to tehsildar (revenue department's officer for the administrative sub-division). Tehsildar hands over these khatunis to revenue patwaris who recover water charges (abiana) from the farmer through village lamberdar. Crop acreage statements that are organized at canal level are then send to PIPD head office.
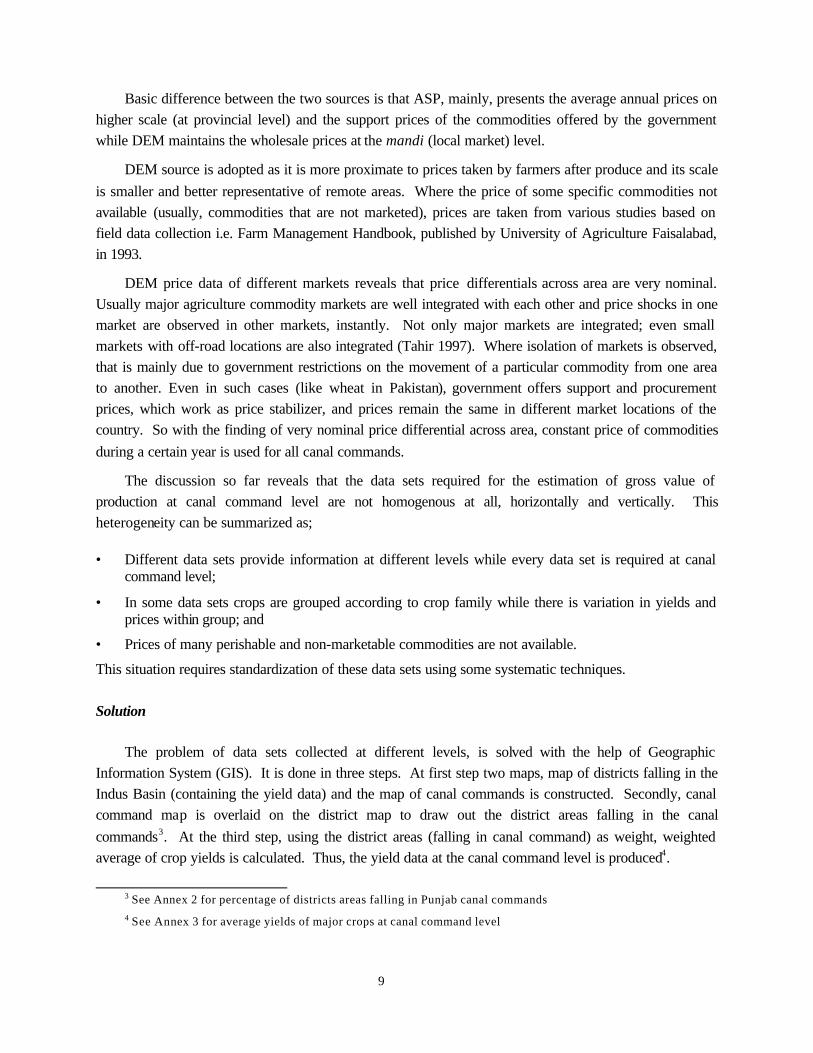
Crop acreage statements do not expose all crops in detail. Usually, crops of same family or having the same revenue are aggregated in one group. For instance, different fodder crops sown in kharif season are aggregated and called kharif fodder.
PIPD reported following crops in kharif and rabi seasons.
Table 3.1. Crops reported in crop acreage data.
No. Kharif Crops Rabi Crops
1 Sugarcane Wheat 2 Rice Barley
3 Cotton Grain
4 Maize Grams
5 Jowar & Chari Rabi Oilseeds
6 Bajra Rabi Fodder
7 Kharif Oilseeds Rabi Others
8 Kharif Fodder Rabi Orchards
9 Kharif Others
10 Kharif Orchards
Crop Yields
Federal Ministry of Food and Agriculture publishes the average yields of different crops by administrative districts after every three years. Federal ministry collects this data from Crop Reporting Service. For instance, Directorate Crop Reporting Service of Agriculture Department, Government of Punjab, has 1010 sample village locations through out Punjab province where they monitor crop yield and then generalize it to district level.
Commodity Prices
Mainly, two type of information regarding prices with respect to sources, is available that are;
i) Directorate of Economics and Marketing (hereafter DEM) of provincial agriculture departments, and
ii) Agriculture Statistics of Pakistan (hereafter ASP), published by Federal Ministry of Agriculture, Food and Livestock.
9
Basic difference between the two sources is that ASP, mainly, presents the average annual prices on higher scale (at provincial level) and the support prices of the commodities offered by the government while DEM maintains the wholesale prices at the mandi (local market) level.
DEM source is adopted as it is more proximate to prices taken by farmers after produce and its scale
is smaller and better representative of remote areas. Where the price of some specific commodities not available (usually, commodities that are not marketed), prices are taken from various studies based on field data collection i.e. Farm Management Handbook, published by University of Agriculture Faisalabad, in 1993.
DEM price data of different markets reveals that price differentials across area are very nominal. Usually major agriculture commodity markets are well integrated with each other and price shocks in one market are observed in other markets, instantly. Not only major markets are integrated; even small markets with off-road locations are also integrated (Tahir 1997). Where isolation of markets is observed, that is mainly due to government restrictions on the movement of a particular commodity from one area to another. Even in such cases (like wheat in Pakistan), government offers support and procurement prices, which work as price stabilizer, and prices remain the same in different market locations of the country. So with the finding of very nominal price differential across area, constant price of commodities
during a certain year is used for all canal commands.
The discussion so far reveals that the data sets required for the estimation of gross value of production at canal command level are not homogenous at all, horizontally and vertically. This heterogeneity can be summarized as;
• Different data sets provide information at different levels while every data set is required at canal command level;
• In some data sets crops are grouped according to crop family while there is variation in yields and prices within group; and
• Prices of many perishable and non-marketable commodities are not available.
This situation requires standardization of these data sets using some systematic techniques.
Solution
The problem of data sets collected at different levels, is solved with the help of Geographic
Information System (GIS). It is done in three steps. At first step two maps, map of districts falling in the Indus Basin (containing the yield data) and the map of canal commands is constructed. Secondly, canal command map is overlaid on the district map to draw out the district areas falling in the canal
commands3. At the third step, using the district areas (falling in canal command) as weight, weighted average of crop yields is calculated. Thus, the yield data at the canal command level is produced4.
3 See Annex 2 for percentage of districts areas falling in Punjab canal commands 4 See Annex 3 for average yields of major crops at canal command level
10
The heterogeneity in crops in area and yield data sets was a big problem. In the yield data mostly the yield of each and every crop are reported while in the area data crops of same family are grouped under one name (e.g. oilseeds, pulses etc.). This causes the problem of associating yield to oilseeds in order to calculate the production, as it is not known that yield of which oilseed crop (either sunflower or mustard
or whatever) is more appropriate for oilseed category in a particular canal command. This problem is resolved by literature survey. Studies conducted in different areas of Indus Basin reveal the crops grown in the area. Thus, the appropriate oilseed crop can be assessed in a particular canal command area. Further, taking a look at the cropping patterns, it is scrutinized that grouped crops mostly have minor area under them. So, even taking constant yield for all canal commands will not provide misleading results.
The unavailability of prices of many perishable and unmarketable commodities was another problem in calculating the gross value of production. Some assumptions are made while doing these calculations;
• Commodities are of the same quality,
• Prices are stable during the crop season,
• Market price is equal to farm gate price, and
• Markets in the canal commands are well-integrated.
Again, consulting the literature and studies, shadow prices are used for perishable, unmarketable and some time for grouped crops.
Information on water sources
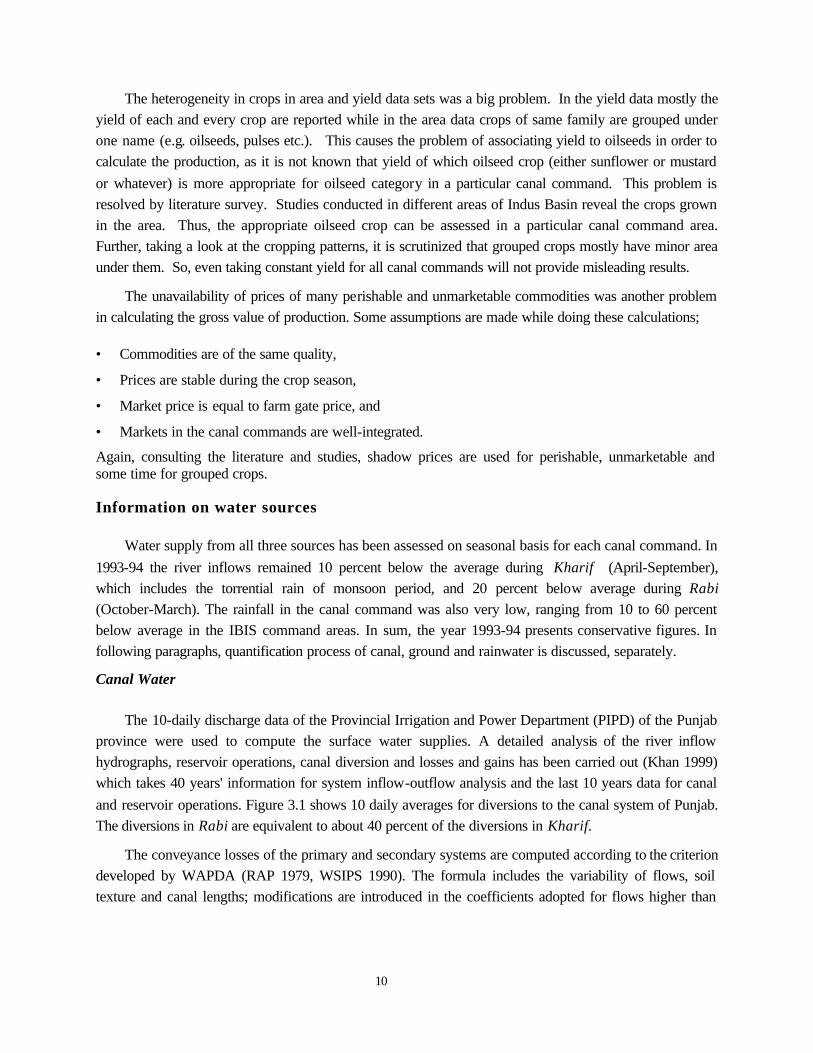
Water supply from all three sources has been assessed on seasonal basis for each canal command. In
1993-94 the river inflows remained 10 percent below the average during Kharif (April-September), which includes the torrential rain of monsoon period, and 20 percent below average during Rabi (October-March). The rainfall in the canal command was also very low, ranging from 10 to 60 percent below average in the IBIS command areas. In sum, the year 1993-94 presents conservative figures. In following paragraphs, quantification process of canal, ground and rainwater is discussed, separately.
Canal Water
The 10-daily discharge data of the Provincial Irrigation and Power Department (PIPD) of the Punjab
province were used to compute the surface water supplies. A detailed analysis of the river inflow hydrographs, reservoir operations, canal diversion and losses and gains has been carried out (Khan 1999) which takes 40 years' information for system inflow-outflow analysis and the last 10 years data for canal
and reservoir operations. Figure 3.1 shows 10 daily averages for diversions to the canal system of Punjab. The diversions in Rabi are equivalent to about 40 percent of the diversions in Kharif.
The conveyance losses of the primary and secondary systems are computed according to the criterion developed by WAPDA (RAP 1979, WSIPS 1990). The formula includes the variability of flows, soil texture and canal lengths; modifications are introduced in the coefficients adopted for flows higher than

11
80 percent. The loss coefficients vary from 13 percent to 34 percent for the main canals. The losses are computed for every 10-daily period and accumulated for the season.
Figure 3.1. Diversions to Punjab canal system in the crop year of 1993-94.
0
10
20
30
40
50
60
AP
R
JU
N
AU
G
OC
T
DE
C
FE
B
10-Day Period
10
00
Cu
se
cs
Kharif
1993
Rain Water
The rain data of 37 metrology stations are processed to compute the monthly and seasonal rainfall.
This data was used to prepare Isohyetal Maps (Linsley, et al, 1992) using Geographic information system. These maps are superimposed with the canal command maps to compute the rainfall volume for each canal command area. The spatial and seasonal variation of rainfall in Pakistan (command areas indicated) for 1993-94 is shown in Figure 3.2 and 3.3.
Figure 3.2. Distribution of rain across the Punjab during Kharif 1993.
Figure 3.3. Distribution of rain across the Punjab during Rabi 1993-94.

12
Ground Water
For the estimation of ground water, tubewell density data collected at the district level (Agriculture Machinery Census 1994) and the utilization coefficients established by WAPDA are used. The data are transformed to the canal command level by overlaying the district and CCA maps (Habib et al. 1999). The estimated total ground water mining for the CCAs is 65 bcm from private and 6.8 bcm from public wells. The growth rate of tubewells and pumpage between 1986 and 1994 was 70 percent and 47 percent, respectively.
Following figures present the amount of water available from all three sources discussed above, for Kharif and Rabi seasons separately.
Figure 3.4. Water availability in Punjab canal commands during Kharif 1993.
0
200
400
600
800
1000
1200
1400
UC
C
CB
DC
U. D
ipa
lpu
r
L. D
ipa
lpu
r
Gu
ge
ra
Jh
an
g
UJ
C
LJ
C
Th
al
LB
DC
Ha
ve
li
Ma
ilsi
Pa
kp
att
an
Fo
rdw
ah
E. S
adiq
ia
Ab
ba
sia
Ba
ha
wa
l
Qa
im
Pa
nja
nd
DG
Kh
an
M'G
arh
Ra
ng
pu
r
mili
mete
rs
Canal kharif TW kharif Rain kharif
Figure 3.5. Water availability in Punjab canal commands during Rabi 1993-94.
0
200
400
600
800
1000
1200
1400
UC
C
CB
DC
U. D
ipa
lpu
r
L. D
ipa
lpu
r
Gu
ge
ra
Jh
an
g
UJ
C
LJ
C
Th
al
LB
DC
Ha
ve
li
Ma
ilsi
Pa
kp
att
an
Fo
rdw
ah
E. S
adiq
ia
Ab
ba
sia
Ba
ha
wa
l
Qa
im
Pa
nja
nd
DG
Kh
an
M'G
arh
Ra
ng
pu
r
mili
mete
rs
Canal rabi TW rabi Rain rabi
13
Table 3.2. Water availability in Punjab canal commands (all figures are in millimeters).
Kharif Season Rabi Season Canal Command
Canal waterTubewell
water Rain Total water Canal water
Tubewell water Rain Total water
UCC 208 335 410 953 41 335 26 402
CBDC 327 294 295 916 249 294 36 580
Upper Dipalpur 349 311 255 915 71 311 25 407
Lower Dipalpur 464 280 250 994 64 280 25 369
LCC East (Gugera) 372 242 270 883 244 242 25 510
LCC West (Jhang) 273 316 284 872 179 316 25 520
Upper Jehlam 429 294 480 1203 309 294 25 627
Lower Jehlam 252 304 305 861 159 304 25 488
Thal 324 107 310 742 230 107 44 380
LBDC 426 292 250 968 262 292 25 579
Haveli 370 307 250 926 194 307 25 526
Mailsi 389 422 183 993 83 422 25 530
Pakpattan 402 222 250 874 205 222 25 451
Fordwah 444 82 250 776 38 82 25 145
Eastern Sadiqia 508 83 240 831 357 83 25 465
Abbasia 375 89 145 609 411 89 25 525
Bahawal 520 167 150 837 243 167 25 436
Qaim 718 0 224 942 199 0 25 224
Panjand 536 163 65 764 168 163 25 357
DG Khan 727 48 138 913 233 48 25 306
Muzzafargarh 609 133 206 949 134 133 25 292
Rangpur 238 205 237 680 33 205 25 263
VARIATION IN GVP ACROSS CANAL COMMANDS
Estimation of Gross production Indicators
This section presents the estimated gross value of production per unit of land and water for crop seasons, Kharif and Rabi, separately. Aggregation of seasons leading to annual GVP per unit of land and water is, then, presented.
14
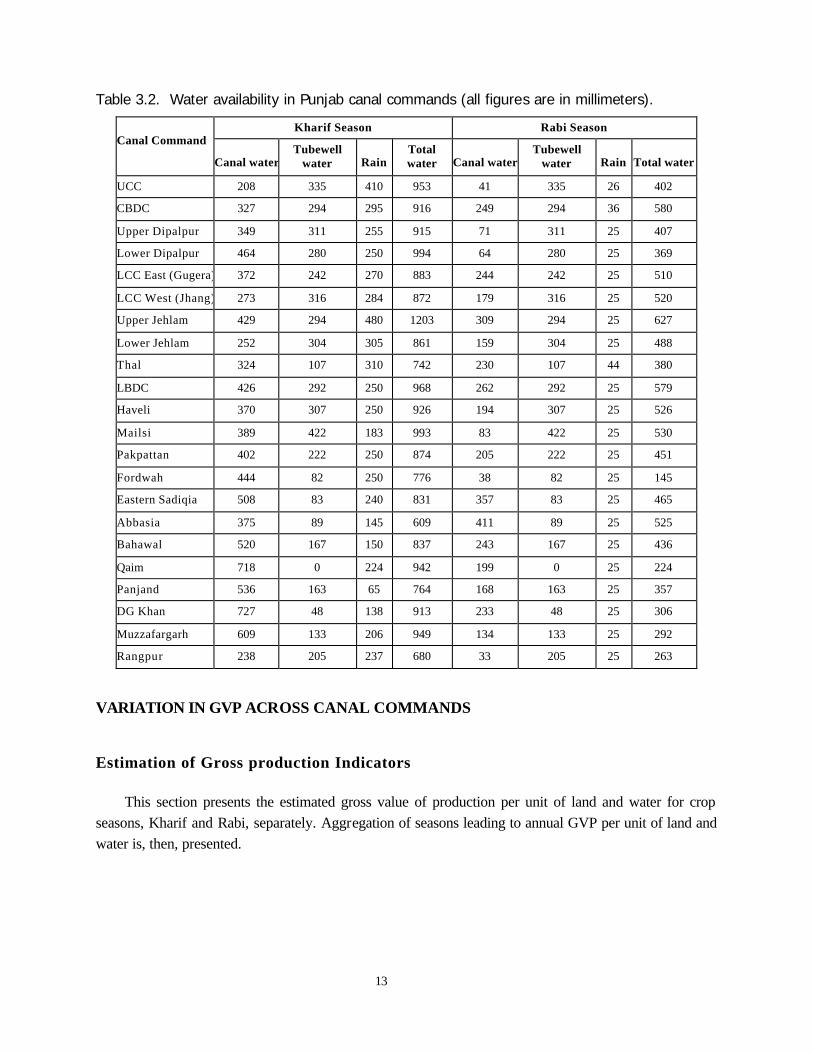
GVP per unit of land in Kharif and Rabi
Estimation of GVP per hectare of Culturable Command Area (CCA) and Cropped Area (CA) for
Kharif season indicates that;
GVP per unit of CCA varies with a ratio of 1:10 (Rs. 1,451 per hectare to Rs. 13,836 per hectare), and
GVP per unit of CA varies with a ratio of about 1:4 (Rs. 4,368 per hectare to Rs. 15,649 per hectare).
Figure 4.1 reveals two inferences in this regard. (i) Canal commands are terribly heterogeneous regarding land productivity in Kharif season. This leads to scrutinize the relationship between GVP per unit land and water availability in this season. (ii) Big difference between GVP per hectare of CCA and GVP per hectare of CA indicates under utilization of land in some canal command. It leads to analyze the relationship between land use (cropping intensity) and availability of water in these canal commands.
Figure 4.1. GVP per unit of land in Kharif season.
0
2,000
4,000
6,000
8,000
10,000
12,000
14,000
16,000
18,000
U.C
.C.
C.B
.D.C
.
DE
PA
LP
UR
UP
PE
R
DE
PA
LP
UR
LO
WE
R
L.C
.C E
AS
T (
Gugera
)
L.C
.C W
ES
T (
Jhang)
U.J
.C
L.J
.C
TH
AL
L.B
.D.C
HA
VE
LI
MA
ILS
I
PA
KP
AT
TA
N (
Upper+
Low
er)
FO
RD
WA
H
EA
ST
ER
N S
AD
IQIA
AB
BA
SIA
BA
HA
WA
L
QA
IM
PA
NJN
AD
D.G
.KH
AN
MU
ZZ
AF
AR
GA
RH
RA
NG
PU
R
Pak.
Rs.
/ h
ect
are
Kharif GVP / CCA Kharif GVP / CA
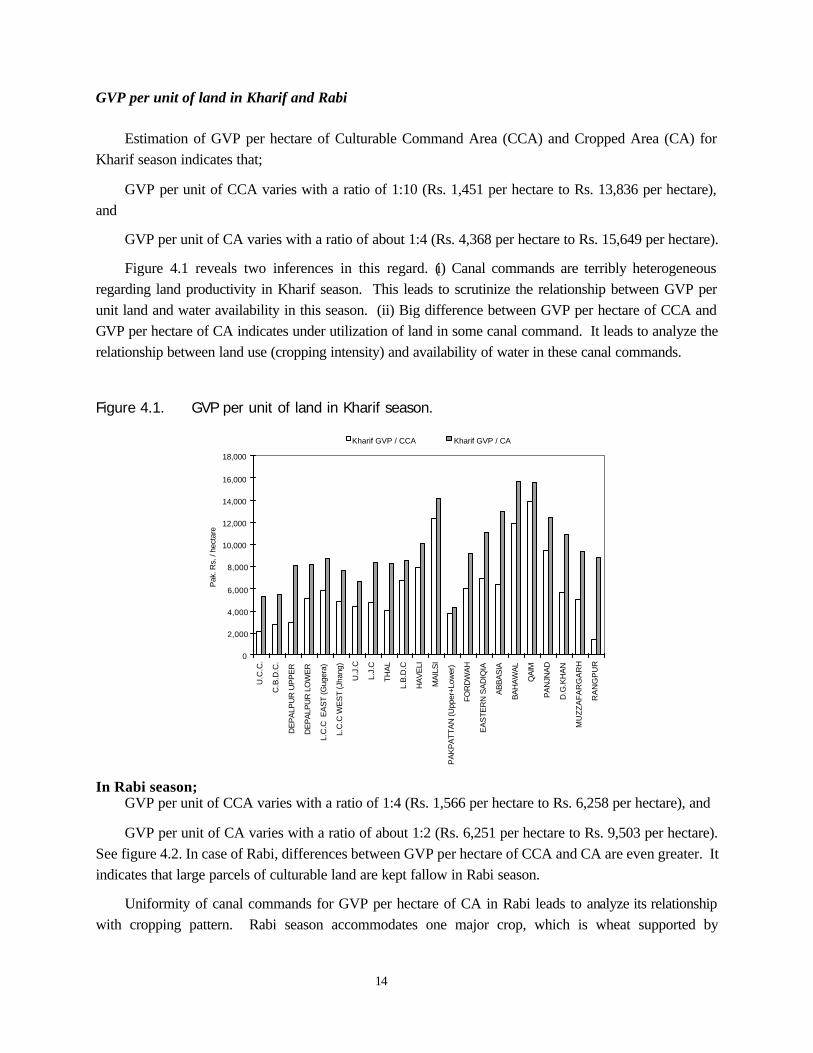
In Rabi season;
GVP per unit of CCA varies with a ratio of 1:4 (Rs. 1,566 per hectare to Rs. 6,258 per hectare), and
GVP per unit of CA varies with a ratio of about 1:2 (Rs. 6,251 per hectare to Rs. 9,503 per hectare). See figure 4.2. In case of Rabi, differences between GVP per hectare of CCA and CA are even greater. It indicates that large parcels of culturable land are kept fallow in Rabi season.
Uniformity of canal commands for GVP per hectare of CA in Rabi leads to analyze its relationship with cropping pattern. Rabi season accommodates one major crop, which is wheat supported by
15
controlled pricing policy of the government. While Kharif season comprises on various cash crops, their values drastically different from each other. This analysis is presented in section 4.2.
Figure 4.2. GVP per unit of land in Rabi season.
0
1,000
2,000
3,000
4,000
5,000
6,000
7,000
8,000
9,000
10,000
U.C
.C.
C.B
.D.C
.
DE
PA
LP
UR
UP
PE
R
DE
PA
LP
UR
LO
WE
R
L.C
.C E
AS
T (
Gugera
)
L.C
.C W
ES
T (
Jhang)
U.J
.C
L.J
.C
TH
AL
L.B
.D.C
HA
VE
LI
MA
ILS
I
PA
KP
AT
TA
N (
Upper+
Low
er)
FO
RD
WA
H
EA
ST
ER
N S
AD
IQIA
AB
BA
SIA
BA
HA
WA
L
QA
IM
PA
NJN
AD
D.G
.KH
AN
MU
ZZ
AF
AR
GA
RH
RA
NG
PU
R
Pak.
Rs.
/ h
ect
are
Rabi GVP / CCA Rabi GVP / CA
GVP per unit of water in Kharif and Rabi
Estimations of GVP per cubic meter of water available from all sources for Kharif and Rabi seasons, separately, provide interesting information;
• In Kharif season; GVP per unit of water varies with a ratio of 1:6 (Rs. 0.21 per cubic meter to Rs. 1.47 per cubic meter), and
• In Rabi season; GVP per unit of water varies with a ratio of 1:6 (Rs. 0.39 per cubic meter to Rs. 2.41 per cubic meter). See figure 4.3.
It infers that productivity of water is higher in Rabi season as compared to Kharif season. This is contrary to productivity of land. As indicated above, productivity of land is higher is Kharif season than Rabi.
Aggregate figures for Punjab province also strengthen this finding.
Total land available in Punjab canal commands (CCA) 8.43 Mha
Total water available at watercourse head from all sources in kharif 76 bcm
Total water available at watercourse head from all sources in rabi 39 bcm
Total GVP in kharif 49 billion rupees
Total GVP in rabi 39 billion rupees
Per hectare GVP in kharif 5,752 rupees
Per hectare GVP in rabi 4,564 rupees
Per cubic meter GVP in kharif 0.64 rupee
Per cubic meter GVP in rabi 1.00 rupee

16
Figure 4.3. GVP per unit of water in Kharif and Rabi seasons.
0.00
0.25
0.50
0.75
1.00
1.25
1.50
1.75
2.00
2.25
2.50
U.C
.C.
C.B
.D.C
.
DE
PA
LP
UR
UP
PE
R
DE
PA
LP
UR
LO
WE
R
L.C
.C
EA
ST
(G
ug
era
)
L.C
.C W
ES
T (
Jh
an
g)
U.J
.C
L.J
.C
TH
AL
L.B
.D.C
HA
VE
LI
MA
ILS
I
PA
KP
AT
TA
N (
Up
pe
r+L
ow
er)
FO
RD
WA
H
EA
ST
ER
N S
AD
IQIA
AB
BA
SIA
BA
HA
WA
L
QA
IM
PA
NJN
AD
D.G
.KH
AN
MU
ZZ
AF
AR
GA
RH
RA
NG
PU
R
Pak
Rupees
per
cubic
mete
r
Kharif GVP / Total Water Rabi GVP / Total Water
Annual GVP per unit of land and water
Figure 4.4 shows that GVP per unit of CCA among 23 canal of Punjab varies with a ratio of about 1:5 (Rs. 3,844 per hectare to Rs. 18,326 per hectare). GVP per unit of water available varies with a ratio of 1:5 (Rs. 0.35 per cubic meter to Rs. 1.57 per cubic meter).
Figure 4.4. Annual GVP per unit land and water in Punjab, year 1993-94.
0
2,000
4,000
6,000
8,000
10,000
12,000
14,000
16,000
18,000
20,000
U.C
.C.
C.B
.D.C
.
DE
PA
LP
UR
UP
PE
R
DE
PA
LP
UR
LO
WE
R
L.C
.C
EA
ST
(G
ug
era
)
L.C
.C W
ES
T (
Jh
an
g)
U.J
.C
L.J
.C
TH
AL
L.B
.D.C
HA
VE
LI
MA
ILS
I
PA
KP
AT
TA
N (
Up
pe
r+L
ow
er)
FO
RD
WA
H
EA
ST
ER
N S
AD
IQIA
AB
BA
SIA
BA
HA
WA
L
QA
IM
PA
NJN
AD
D.G
.KH
AN
MU
ZZ
AF
AR
GA
RH
RA
NG
PU
R
Pak.
Rs.
/ hect
are
0.00
0.20
0.40
0.60
0.80
1.00
1.20
1.40
1.60
1.80
Pak.
Rs.
/ cu
bic
mete
r of c
anal w
ate
r
GVP / CCA GVP / Total Water
17
GVP, Cropping intensity and cropping pattern
Cropping intensity, water availability and GVP
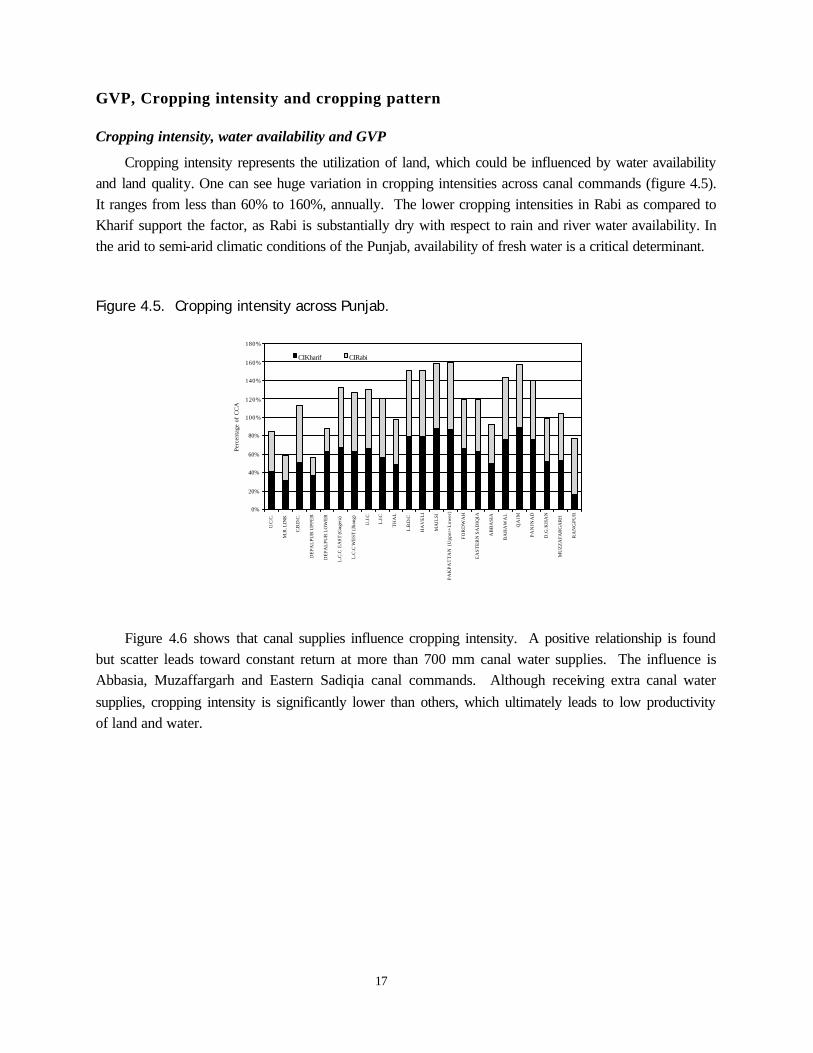
Cropping intensity represents the utilization of land, which could be influenced by water availability and land quality. One can see huge variation in cropping intensities across canal commands (figure 4.5). It ranges from less than 60% to 160%, annually. The lower cropping intensities in Rabi as compared to Kharif support the factor, as Rabi is substantially dry with respect to rain and river water availability. In the arid to semi-arid climatic conditions of the Punjab, availability of fresh water is a critical determinant.
Figure 4.5. Cropping intensity across Punjab.
0%
20%
40%
60%
80%
100%
120%
140%
160%
180%
U.C
.C.
M.R
. LIN
K
C.B
.D.C
.
DE
PA
LP
UR
UP
PE
R
DE
PA
LP
UR
LO
WE
R
L.C
.C E
AST
(Gug
era)
L.C
.C W
EST
(Jha
ng)
U.J
.C
L.J.
C
TH
AL
L.B
.D.C
HA
VE
LI
MA
ILS
I
PA
KP
AT
TA
N (
Upp
er+
Low
er)
FO
RD
WA
H
EA
ST
ER
N S
AD
IQIA
AB
BA
SIA
BA
HA
WA
L
QA
IM
PA
NJN
AD
D.G
.KH
AN
MU
ZZ
AFA
RG
AR
H
RA
NG
PU
R
Perc
enta
ge o
f C
CA
CIKharif CIRabi
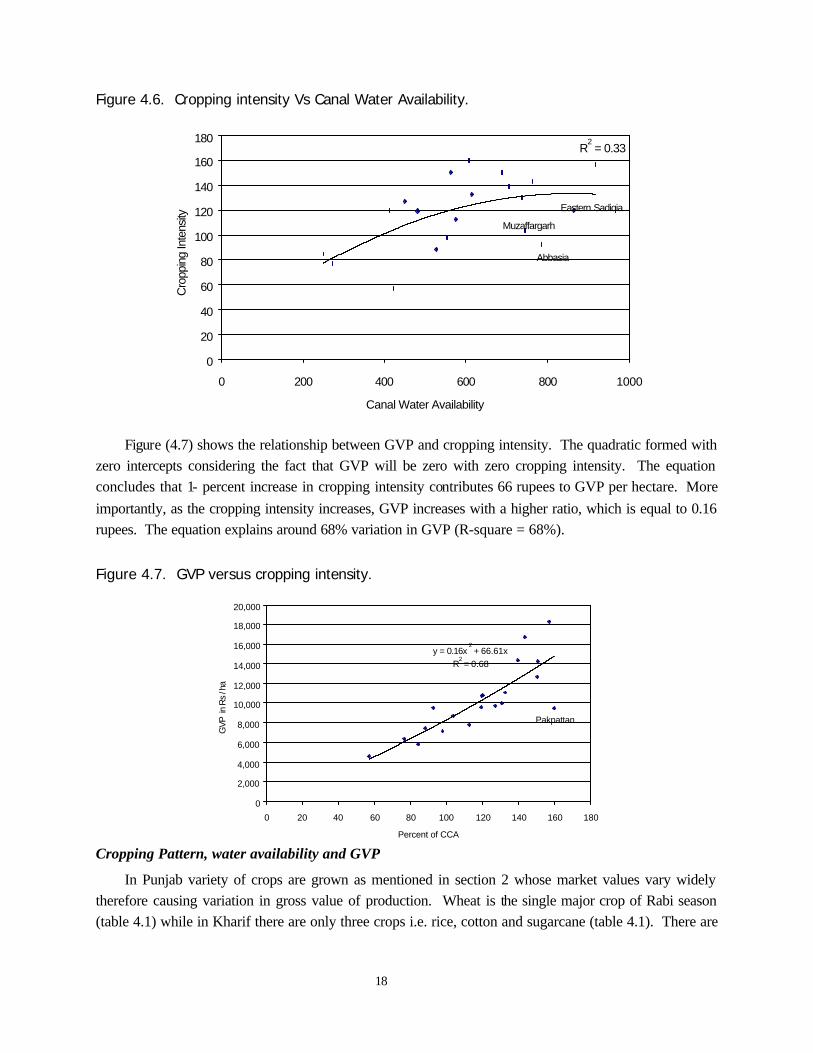
Figure 4.6 shows that canal supplies influence cropping intensity. A positive relationship is found
but scatter leads toward constant return at more than 700 mm canal water supplies. The influence is Abbasia, Muzaffargarh and Eastern Sadiqia canal commands. Although receiving extra canal water
supplies, cropping intensity is significantly lower than others, which ultimately leads to low productivity of land and water.
18
Figure 4.6. Cropping intensity Vs Canal Water Availability.
R2 = 0.33
0
20
40
60
80
100
120
140
160
180
0 200 400 600 800 1000
Canal Water Availability
Cro
ppin
g In
tensi
ty
Abbasia
Muzaffargarh
Eastern Sadiqia
Figure (4.7) shows the relationship between GVP and cropping intensity. The quadratic formed with zero intercepts considering the fact that GVP will be zero with zero cropping intensity. The equation concludes that 1- percent increase in cropping intensity contributes 66 rupees to GVP per hectare. More
importantly, as the cropping intensity increases, GVP increases with a higher ratio, which is equal to 0.16 rupees. The equation explains around 68% variation in GVP (R-square = 68%).
Figure 4.7. GVP versus cropping intensity.
y = 0.16x2 + 66.61x
R2 = 0.68
0
2,000
4,000
6,000
8,000
10,000
12,000
14,000
16,000
18,000
20,000
0 20 40 60 80 100 120 140 160 180
Percent of CCA
GV
P i
n R
s / h
a
Pakpattan
Cropping Pattern, water availability and GVP
In Punjab variety of crops are grown as mentioned in section 2 whose market values vary widely therefore causing variation in gross value of production. Wheat is the single major crop of Rabi season (table 4.1) while in Kharif there are only three crops i.e. rice, cotton and sugarcane (table 4.1). There are
19
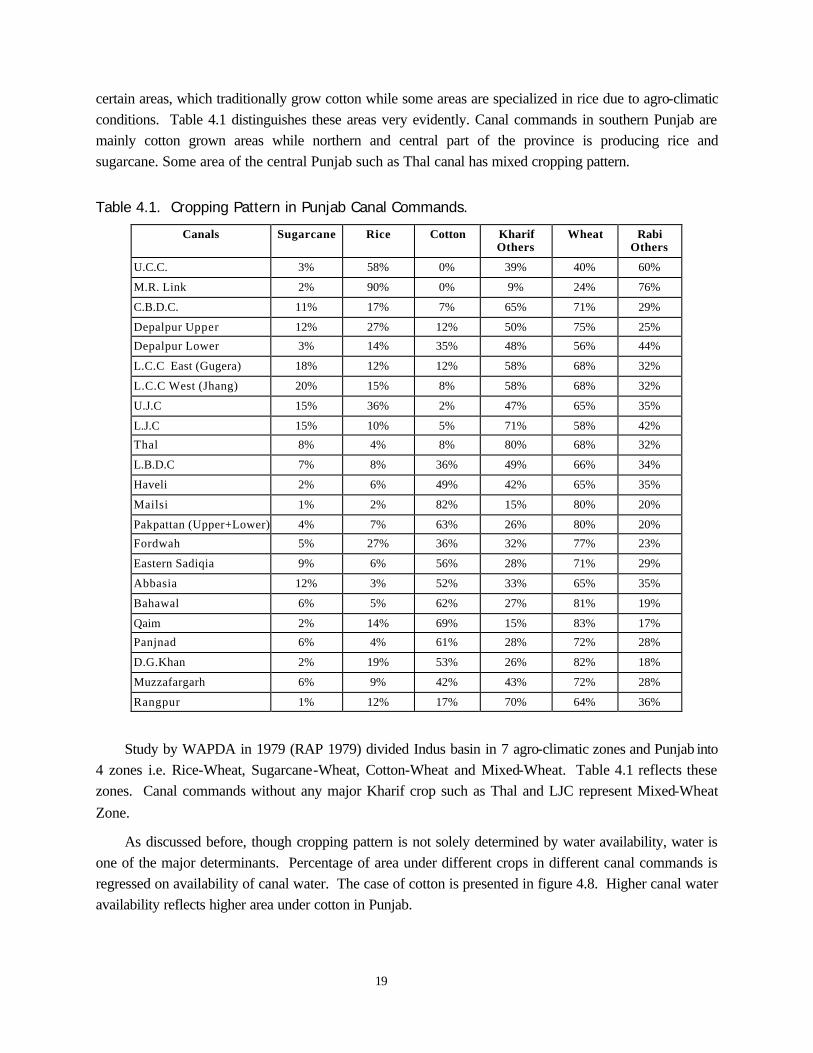
certain areas, which traditionally grow cotton while some areas are specialized in rice due to agro-climatic conditions. Table 4.1 distinguishes these areas very evidently. Canal commands in southern Punjab are mainly cotton grown areas while northern and central part of the province is producing rice and sugarcane. Some area of the central Punjab such as Thal canal has mixed cropping pattern.
Table 4.1. Cropping Pattern in Punjab Canal Commands.
Canals Sugarcane Rice Cotton Kharif Others
Wheat Rabi Others
U.C.C. 3% 58% 0% 39% 40% 60%
M.R. Link 2% 90% 0% 9% 24% 76%
C.B.D.C. 11% 17% 7% 65% 71% 29%
Depalpur Upper 12% 27% 12% 50% 75% 25%
Depalpur Lower 3% 14% 35% 48% 56% 44%
L.C.C East (Gugera) 18% 12% 12% 58% 68% 32%
L.C.C West (Jhang) 20% 15% 8% 58% 68% 32%
U.J.C 15% 36% 2% 47% 65% 35%
L.J.C 15% 10% 5% 71% 58% 42%
Thal 8% 4% 8% 80% 68% 32%
L.B.D.C 7% 8% 36% 49% 66% 34%
Haveli 2% 6% 49% 42% 65% 35%
Mailsi 1% 2% 82% 15% 80% 20%
Pakpattan (Upper+Lower) 4% 7% 63% 26% 80% 20%
Fordwah 5% 27% 36% 32% 77% 23%
Eastern Sadiqia 9% 6% 56% 28% 71% 29%
Abbasia 12% 3% 52% 33% 65% 35%
Bahawal 6% 5% 62% 27% 81% 19%
Qaim 2% 14% 69% 15% 83% 17%
Panjnad 6% 4% 61% 28% 72% 28%
D.G.Khan 2% 19% 53% 26% 82% 18%
Muzzafargarh 6% 9% 42% 43% 72% 28%
Rangpur 1% 12% 17% 70% 64% 36%
Study by WAPDA in 1979 (RAP 1979) divided Indus basin in 7 agro-climatic zones and Punjab into 4 zones i.e. Rice-Wheat, Sugarcane-Wheat, Cotton-Wheat and Mixed-Wheat. Table 4.1 reflects these zones. Canal commands without any major Kharif crop such as Thal and LJC represent Mixed-Wheat
Zone.
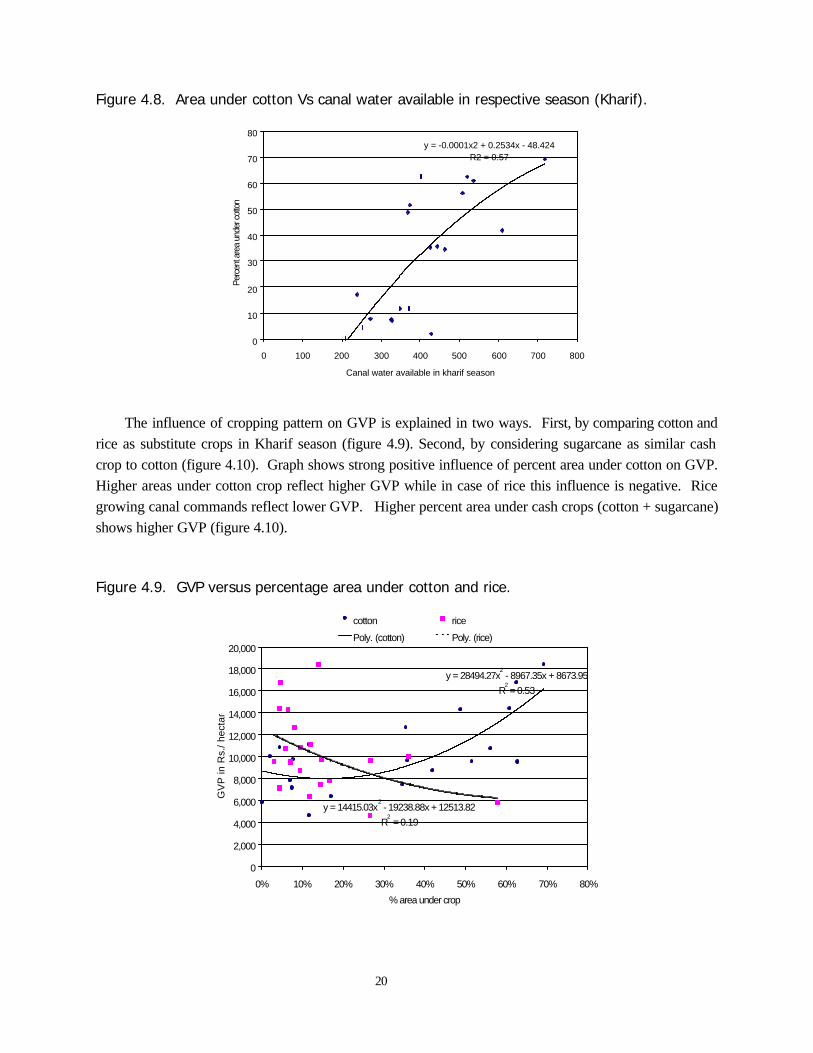
As discussed before, though cropping pattern is not solely determined by water availability, water is one of the major determinants. Percentage of area under different crops in different canal commands is regressed on availability of canal water. The case of cotton is presented in figure 4.8. Higher canal water availability reflects higher area under cotton in Punjab.
20
Figure 4.8. Area under cotton Vs canal water available in respective season (Kharif).
y = -0.0001x2 + 0.2534x - 48.424
R2 = 0.57
0
10
20
30
40
50
60
70
80
0 100 200 300 400 500 600 700 800
Canal water available in kharif season
Per
cent
are
a un
der c
otto
n
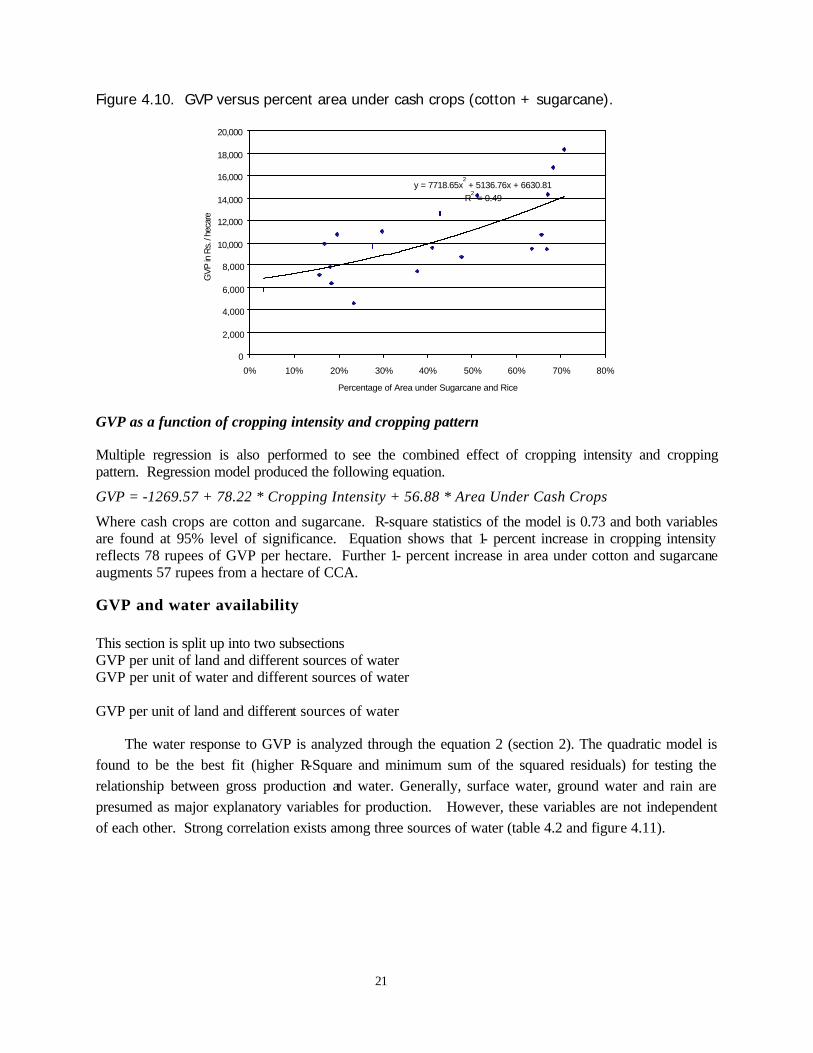
The influence of cropping pattern on GVP is explained in two ways. First, by comparing cotton and rice as substitute crops in Kharif season (figure 4.9). Second, by considering sugarcane as similar cash crop to cotton (figure 4.10). Graph shows strong positive influence of percent area under cotton on GVP. Higher areas under cotton crop reflect higher GVP while in case of rice this influence is negative. Rice growing canal commands reflect lower GVP. Higher percent area under cash crops (cotton + sugarcane) shows higher GVP (figure 4.10).
Figure 4.9. GVP versus percentage area under cotton and rice.
y = 28494.27x2 - 8967.35x + 8673.95
R2 = 0.53
y = 14415.03x2 - 19238.88x + 12513.82
R2 = 0.19
0
2,000
4,000
6,000
8,000
10,000
12,000
14,000
16,000
18,000
20,000
0% 10% 20% 30% 40% 50% 60% 70% 80%
% area under crop
GV
P in
Rs./
he
cta
re
cotton rice
Poly. (cotton) Poly. (rice)
21
Figure 4.10. GVP versus percent area under cash crops (cotton + sugarcane).
y = 7718.65x2 + 5136.76x + 6630.81
R2 = 0.49
0
2,000
4,000
6,000
8,000
10,000
12,000
14,000
16,000
18,000
20,000
0% 10% 20% 30% 40% 50% 60% 70% 80%
Percentage of Area under Sugarcane and Rice
GV
P in
Rs.
/ he
care
GVP as a function of cropping intensity and cropping pattern
Multiple regression is also performed to see the combined effect of cropping intensity and cropping pattern. Regression model produced the following equation.
GVP = -1269.57 + 78.22 * Cropping Intensity + 56.88 * Area Under Cash Crops
Where cash crops are cotton and sugarcane. R-square statistics of the model is 0.73 and both variables are found at 95% level of significance. Equation shows that 1- percent increase in cropping intensity reflects 78 rupees of GVP per hectare. Further 1- percent increase in area under cotton and sugarcane augments 57 rupees from a hectare of CCA.
GVP and water availability
This section is split up into two subsections GVP per unit of land and different sources of water GVP per unit of water and different sources of water GVP per unit of land and different sources of water
The water response to GVP is analyzed through the equation 2 (section 2). The quadratic model is found to be the best fit (higher R-Square and minimum sum of the squared residuals) for testing the relationship between gross production and water. Generally, surface water, ground water and rain are presumed as major explanatory variables for production. However, these variables are not independent of each other. Strong correlation exists among three sources of water (table 4.2 and figure 4.11).

22
Table 4.2. Correlation between water sources.
R P-Value
Canal water Vs Ground water -0.65 0.0013
Canal water Vs Rain -0.44 0.0460
Ground water Vs Rain 0.53 0.0136
Figure 4.11. Canal water availability versus ground water exploitation and rain.
R2 = 0.42
R2 = 0.42
0
100
200
300
400
500
600
700
800
900
0 200 400 600 800 1000 1200 1400 1600 1800
canal water in mm
mm
Tubewell in mm
Rain in mm
Linear (Tubewell in mm)
Linear (Rain in mm)
Since, the variables representing three waters are inter-linked, according to econometric criteria, these cannot be used in a single equation as independent variables. Therefore, simple regression equation is estimated. Following matrix of relationships is constructed and estimated. Only significant relationships are presented (95% level of significance). The matrix is followed by graphical presentation of significant relationships.
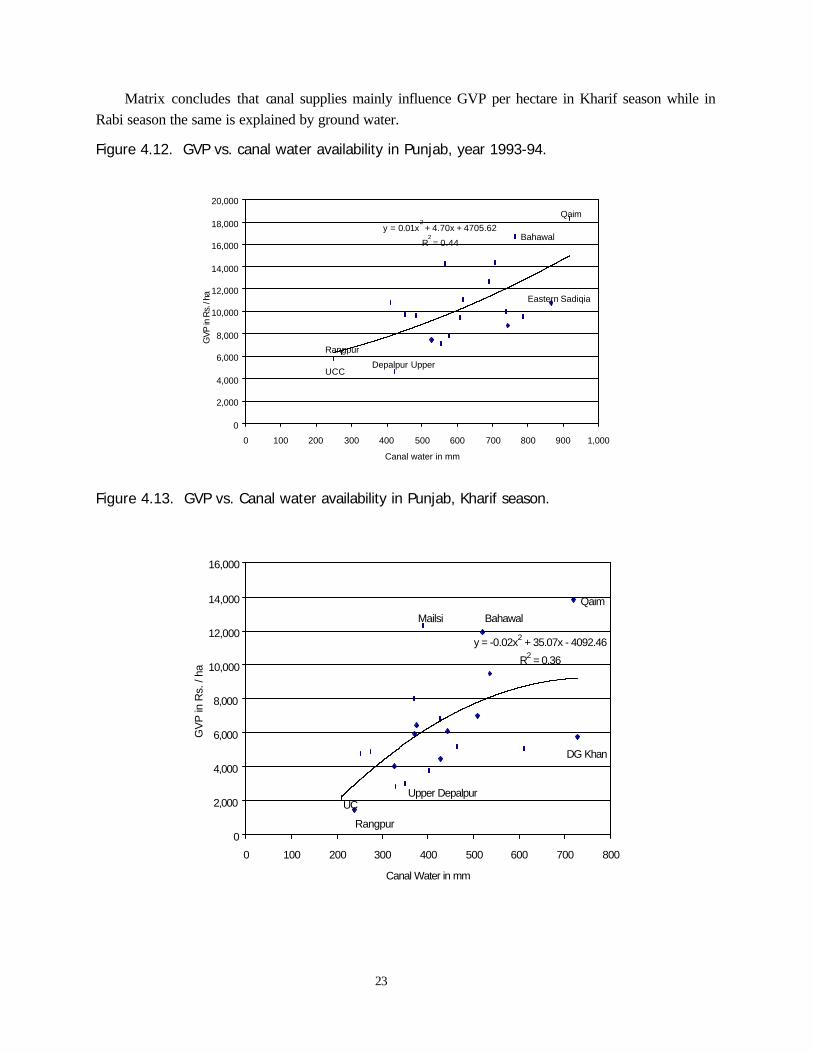
Table 4.3. Matrix of relationship between GVP per hectare of land and water.
Canal Water Ground Water Rain
Annual GVP y = 0.01x2 + 4.70x + 4705
R2 = 0.44
X X
Kharif GVP y = -0.02x2 + 35.07x - 4092
R2 = 0.36
X X
Rabi GVP X y = -0.02x2 + 17.16x + 2395
R2 = 0.71
X
23
Matrix concludes that canal supplies mainly influence GVP per hectare in Kharif season while in Rabi season the same is explained by ground water.
Figure 4.12. GVP vs. canal water availability in Punjab, year 1993-94.
y = 0.01x2 + 4.70x + 4705.62
R2 = 0.44
0
2,000
4,000
6,000
8,000
10,000
12,000
14,000
16,000
18,000
20,000
0 100 200 300 400 500 600 700 800 900 1,000
Canal water in mm
GV
P in
Rs.
/ ha
Qaim
UCC
Rangpur
Depalpur Upper
Eastern Sadiqia
Bahawal
Figure 4.13. GVP vs. Canal water availability in Punjab, Kharif season.
y = -0.02x2 + 35.07x - 4092.46
R2 = 0.36
0
2,000
4,000
6,000
8,000
10,000
12,000
14,000
16,000
0 100 200 300 400 500 600 700 800
Canal Water in mm
GV
P in
Rs.
/ h
a
Qaim
UC
Rangpur
Upper Depalpur
Mailsi Bahawal
DG Khan
24
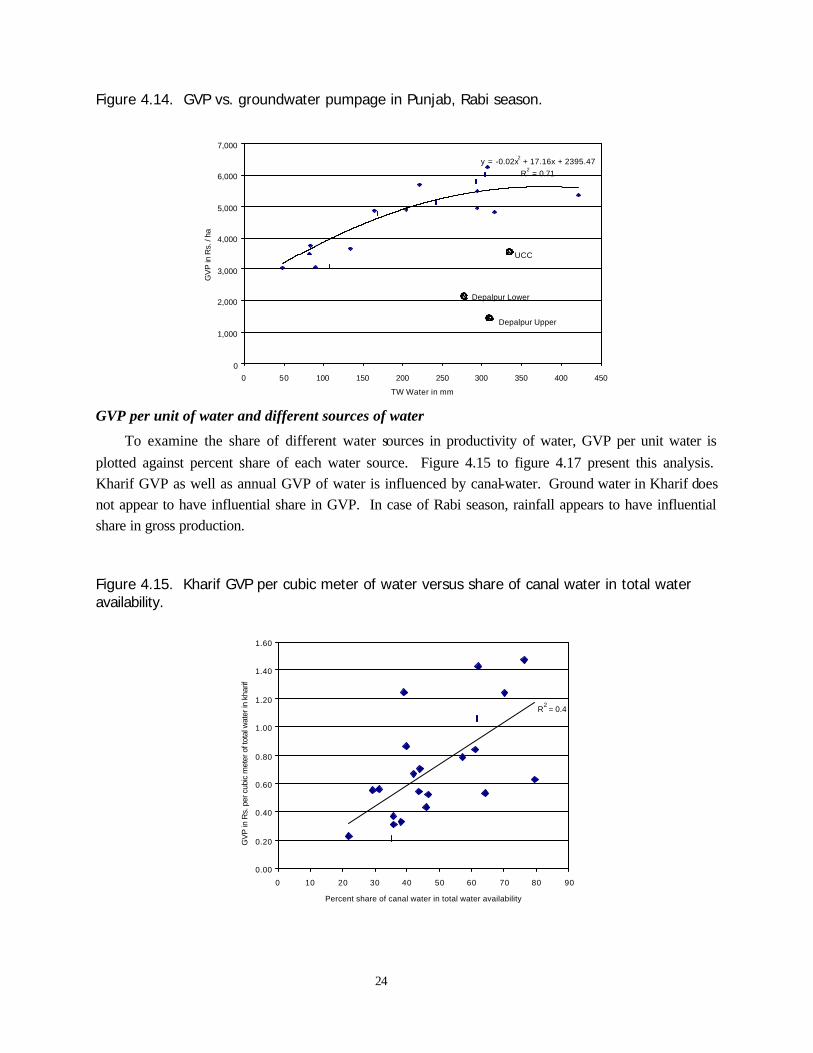
Figure 4.14. GVP vs. groundwater pumpage in Punjab, Rabi season.
y = -0.02x2 + 17.16x + 2395.47
R2 = 0.71
0
1,000
2,000
3,000
4,000
5,000
6,000
7,000
0 50 100 150 200 250 300 350 400 450
TW Water in mm
GV
P in
Rs.
/ h
a
Depalpur Upper
Depalpur Lower
UCC
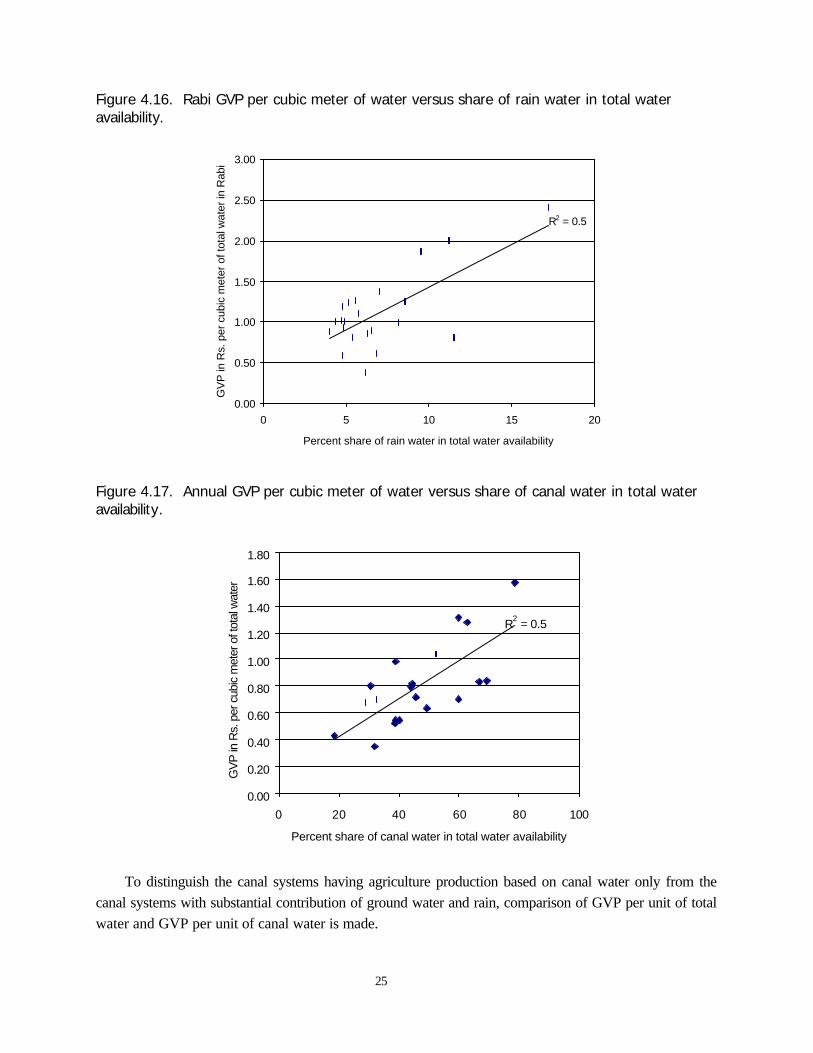
GVP per unit of water and different sources of water
To examine the share of different water sources in productivity of water, GVP per unit water is
plotted against percent share of each water source. Figure 4.15 to figure 4.17 present this analysis. Kharif GVP as well as annual GVP of water is influenced by canal-water. Ground water in Kharif does not appear to have influential share in GVP. In case of Rabi season, rainfall appears to have influential share in gross production.
Figure 4.15. Kharif GVP per cubic meter of water versus share of canal water in total water availability.
R2 = 0.4
0.00
0.20
0.40
0.60
0.80
1.00
1.20
1.40
1.60
0 10 20 30 40 50 60 70 80 90
Percent share of canal water in total water availability
GV
P in
Rs.
per cu
bic
mete
r of to
tal w
ate
r in
kharif
25
Figure 4.16. Rabi GVP per cubic meter of water versus share of rain water in total water availability.
R2 = 0.5
0.00
0.50
1.00
1.50
2.00
2.50
3.00
0 5 10 15 20
Percent share of rain water in total water availability
GV
P in
Rs.
per
cubic
mete
r of to
tal w
ate
r in
Rabi
Figure 4.17. Annual GVP per cubic meter of water versus share of canal water in total water availability.
R2 = 0.5
0.00
0.20
0.40
0.60
0.80
1.00
1.20
1.40
1.60
1.80
0 20 40 60 80 100
Percent share of canal water in total water availability
GV
P in
Rs.
per cu
bic
mete
r of t
ota
l wate
r
To distinguish the canal systems having agriculture production based on canal water only from the canal systems with substantial contribution of ground water and rain, comparison of GVP per unit of total water and GVP per unit of canal water is made.
26
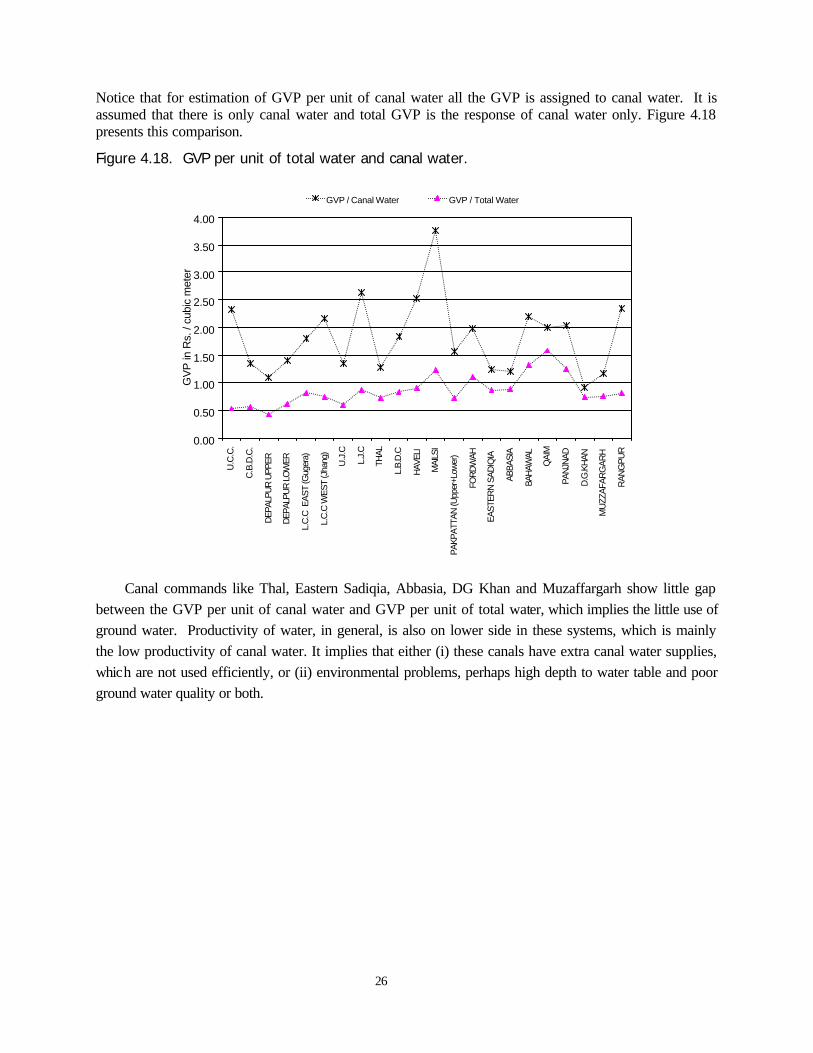
Notice that for estimation of GVP per unit of canal water all the GVP is assigned to canal water. It is assumed that there is only canal water and total GVP is the response of canal water only. Figure 4.18 presents this comparison.
Figure 4.18. GVP per unit of total water and canal water.
0.00
0.50
1.00
1.50
2.00
2.50
3.00
3.50
4.00U
.C.C
.
C.B
.D.C
.
DE
PA
LPU
R U
PP
ER
DE
PA
LPU
R L
OW
ER
L.C
.C E
AS
T (G
uger
a)
L.C
.C W
ES
T (J
hang
)
U.J
.C
L.J.
C
TH
AL
L.B
.D.C
HAVELI
MA
ILS
I
PA
KP
ATTA
N (U
pper
+Lo
wer
)
FO
RD
WA
H
EA
STE
RN
SA
DIQ
IA
AB
BA
SIA
BAH
AW
AL
QA
IM
PA
NJN
AD
D.G
.KH
AN
MU
ZZA
FA
RG
AR
H
RA
NG
PU
R
GV
P in
Rs.
/ c
ubic
mete
rGVP / Canal Water GVP / Total Water
Canal commands like Thal, Eastern Sadiqia, Abbasia, DG Khan and Muzaffargarh show little gap between the GVP per unit of canal water and GVP per unit of total water, which implies the little use of ground water. Productivity of water, in general, is also on lower side in these systems, which is mainly the low productivity of canal water. It implies that either (i) these canals have extra canal water supplies, which are not used efficiently, or (ii) environmental problems, perhaps high depth to water table and poor ground water quality or both.
27
SUMMARY AND CONCLUSIONS
Summary of findings
Spatial variation in land and water productivity across canal commands is analyzed through gross production indicators (gross value of production per unit of land and water) by using secondary information. Secondary data was available at different levels e.g. canal commands, administrative districts and meteorological stations that was standardized at canal command level by using Geographic
Information System. Relationship between cropping intensity, cropping pattern, gross value of production and water availability from different sources was estimated. Following are the major findings:
(i) During this analysis, GIS application was developed and validated to convert district level (administrative unit) information into canal command (hydraulic unit) level. Punjab Province has 35 districts and 23 main canals (section 3.1.4 & Annex 2).
(ii) A big variation in cropping intensities across Punjab canals is shown by the secondary data, ranging from less than 60% to 160%, annually.
(iii) In Kharif season, GVP per unit of CCA varies with a ratio of 1:10 (Rs. 1,451 per hectare to Rs. 13,836 per hectare), and GVP per unit of CA varies with a ratio of about 1:4 (Rs. 4,368 per hectare to Rs. 15,649 per hectare).
(iv) In Rabi season, GVP per unit of CCA varies with a ratio of 1:4 (Rs. 1,566 per hectare to Rs. 6,258 per hectare), and GVP per unit of CA varies with a ratio of about 1:2 (Rs. 6,251 per hectare to Rs. 9,503 per hectare).
(v) In Kharif season, GVP per unit of water varies with a ratio of 1:6 (Rs. 0.21 per cubic meter to Rs. 1.47 per cubic meter).
(vi) In Rabi season, GVP per unit of water varies with a ratio of 1:6 (Rs. 0.39 per cubic meter to Rs. 2.41 per cubic meter).
(vii) Annual GVP per unit of CCA among 23 canal of Punjab varies with a ratio of about 1:5 (Rs. 3,844 per hectare to Rs. 18,326 per hectare).
(viii) Annual GVP per unit of water available varies with a ratio of 1:5 (Rs. 0.35 per cubic meter to Rs. 1.57 per cubic meter).
Values of GVP per unit land and water from secondary data are 15% different than indicated in Fordwah Canal command analysis using primary information (Habib et al. 2001). This is due to reporting constraints. However, secondary information could be used for comparison purpose.
(ix) The Difference between GVP per culturable command area (CCA) and GVP per cropped area (CA) shows that large parcels of land are kept fallow in certain canal commands (mostly rice based). Productivity of water is also lower in these canal commands.
28
Cropping intensity and cropping pattern are two main contributors of gross value of production in canal commands. Areas growing sugarcane and cotton give higher GVP than areas of rice and other crops.
Ground water is the major source of water in certain canal command areas during Rabi season.
Annual and Kharif GVP per unit of land are explained by canal water while annual and Rabi GVP are explained by ground water.
The quadratics equation shows that GVP increases at a higher rate with an increase in canal water. It indicates the importance of canal water supplies for agricultural production as a whole.
The production per unit of water in canal systems is lower than the expected values, though they have significant canal supplies. All of these canals have higher percentage of waterlogged areas.
Analysis does not find any relationship between gross value of production and perennial/non-perennial systems. Some perennial canal commands produce less than some non-perennial commands or vice versa.
Ground water exploitation has inverse relationship with canal water supplies and direct relationship with rainfall. It implies that more ground water is mined in those areas where canal water supplies are lower and where rainfall is high.
(x) Some non-perennial canals e.g. Qaim, DG Khan and Muzaffargarh receive handsome amount of water from canal during Rabi season. Amount of water received is even higher than in some of the perennial canals.
Conclusions
(i) Secondary information required for calculating GVP per unit of land and water is available at the office of different government agencies. However, this information is maintained at different scales. GIS tools can be used to reconcile this information efficiently.
(ii) Though the GVP estimates from secondary information are relatively lower to estimates from primary information, however, secondary information could be used for comparison purpose.
(iii) Production per unit of water and production per unit of land are generally low and quite diverse among canal systems. From the cropping system, cropping intensities and patterns are the main determining factors of gross production.
(iv) Productivity of land is higher is Kharif season as compared to Rabi. However, in case of water productivity, the results are opposite. The efficient use of water is in Rabi season.
(v) The analysis shows the importance of canal water as a primary source of water. The marginal productivity of canal water is higher in certain canal commands and increased supply to these canals augments the aggregate production.
(vi) Analysis also shows the importance of secondary water source. The influence of ground water supplies is decisive in Rabi season. The ground water supply is the main factor determining the GVP in Rabi season. In fact, all sources of water, canal, ground and rain are integrated to a great extent. For instance, it is found that an extra amount of canal water will increase GVP but at the

29
same time it will reduce the exploitation of ground water. This may reduce the productivity of incremental water.
(vii) Two indicators GVP per unit of land and GVP per unit of water provide overview of production as a response of resource use and may be used in defining reallocation strategy. However, any criteria developed for water reallocation requires the understanding of relationship between cropping pattern and physical environment, more precisely depth to water table and also the relationship between physical environment and GVP. Furthermore, inter-linked water sources need to be studied in a conjunctive way.
(viii) An integrated utilization of canal and rain inflows and ground water extraction is taking place. A formal integrated water management is required, especially in view of excess canal supplies to some canal commands.

30
REFERENCES
Agriculture Machinery Census, Agriculture Census Organization, Statistics Division, Government of Pakistan, Gurumangat Road, Gulberg III, Lahore, 1994.
Alderman, Harold and Marito Garcia, Household Food Security and Nutrition in Rural Pakistan, Research Report, International Food Policy Research Institute, 1993.
Global Water Partnership, South Asia - Water Vision 2025 Country report Pakistan, GWP-SASTAC Regional Office, Water and Land Management Institute (WALMI) P.O. Box 504, Kanchanwadi, Aurangabad - 431 005, Maharashtra, India, 1999.
Habib Z. and Zubair Tahir, Impact of land and water management on irrigated agriculture at sub-basin level: Chishtian, Punjab, Pakistan., Research Report (forthcoming) International Water Management Institute P.O. Box 2075, Colombo, Sri Lanka, 2001.
Habib, Z., Zubair Tahir and Asim Rauf Khan, Across the basin analysis of water and land utilization using spatio-temporal information techniques emphasize the need for integrated resource management, Paper presented at 2nd Inter-Regional Conference on Environment-Water 99, Lausanne, Switzerland, 1999.
Khan, A. R, An analysis of the surface water resources and water delivery systems in the Indus Basin, International Water Management Institute, Lahore, Pakistan, July 1999.
Linsely R. K., J.B. Franzini, Water Resource Engineering, McGraw - Hill Company, USA, 1992.
Molden David, R, Shakthivadivel, Christopher J. Perry, Charlotte de Fraiture and Wim H. Kloezen., Indicators for comparing performance of irrigated agriculture systems , International Water Management Institute, P.O. Box 2075, Colombo, Sri Lanka, 1998.
Pakistan Water Partnership, The framework for action for achieving the Pakistan water vision 2025, The national coordinator for frame for action, Pakistan Water Partnership, January 2000.
Perry C. J. Quantification and measurement of a minimum set of indicators of the performance of irrigation systems, International Irrigation Management Institute, Colombo, Sri Lanka, Duplicated 1996.
Rao, P.S., Review of selected literature on indicators of irrigation performance, International Irrigation Management Institute, P.O. Box 2075, Colombo, Sri Lanka, 1993.
RAP, Revised Action Program for Irrigated Agriculture, WAPDA, 1979.
Tahir, Z. and Khalid Riaz, Integration of agricultural commodity markets in Punjab, the Pakistan Development Review, 36:3 Autumn 1997.
WSIPS, Report by WAPDA, Water Sector Investment Planning Study, Federal Planning Study, 1990.
31
ANNEX 1: THE INDUS BASIN IRRIGATION SYSTEM5
The Indus River System in Pakistan serves the world's largest contiguous irrigation network (16 mHa). The system comprises six major rivers, namely Kabul, the Indus, Jhelum, Chenab, Ravi and Sutlej. The Indus River is the largest of all these rivers and carries almost two-thirds of the annual river-flow in the system. Most of the river runoff occurs in the summer months of May-August. Nearly 80% of this
runoff comes from snow and glacial melt. During August and September, the upper catchments of these rivers (mainly Jhelum, Chenab, Ravi and Sutlej) are hit by the Monsoons, bringing in lots of rain that may result in heavy floods.
The mean annual river runoff available in the system is 172 bcm, 83% of which is available during the six months April-to-September period. There are three major reservoirs in the system having a combined live storage capacity equal to 10% of the mean annual river-flow. There are 15 barrages and 45 main canals with discharge capacities ranging from 15 m3/sec to 425 m3/sec. In addition, there is a network of 14 inter-river link canals, having discharge capacities ranging from 142 to 624 m3/sec, for transferring water from one river to another. The annual canal withdrawals in the system average 130 bcm with almost 65% of river water diverted during the Kharif season (April thru September) and the rest in the Rabi season (October thru March).
This complex irrigation network is mainly managed by three public sector organizations. At the
national level, the Indus River System Authority (IRSA) looks after provincial interests by ensuring that each province gets its share of water in the light of the Water Apportionment Accord (WAA) of 1991. The Pakistan Water and Power Development Authority (WAPDA) is responsible for the operation of reservoirs for irrigation water supply, hydropower generation and flood mitigation. The Provincial Irrigation Departments (PIDs) regulate and distribute the water diverted from the rivers to agricultural farms through a network of canals. The early Kharif period (April-June) is the most critical period when irrigation water demands to sow of Kharif crop are high; the reservoirs nearly empty after providing for the winter crop, and the spring freshet has yet to commence. This is the period when conflicts regarding the sharing of irrigation water arise between the provinces.
Rainfall and groundwater are also important contributors towards irrigation in the Indus Basin Irrigation System (IBIS). The rainfall in Pakistan is markedly variable in magnitude, time of occurrence and in its areal distribution. However, most of the rainfall (almost two-thirds) is concentrated in the three
summer months of July−September. The mean annual precipitation ranges from less than 100 mm in parts
of the Lower Indus Plain (Sind Province) to over 800 mm in the Upper Indus Plain near the foothills. There are two major sources of rainfall in Pakistan, the Monsoon Winds (July thru September) and the Western Disturbances (December thru March). The Indus Plains receive most of their rainfall from the
Monsoons. In the last 25−30 years, ground water has become a major supplement to canal supplies
especially in the Upper Indus Plain (Punjab Province) where ground water quality is good. Groundwater
5 Khan 1999

32
resources of Pakistan existing in the Indus Plains, extending from the Himalayan foothills to the Arabian Sea, are stored in the alluvial deposits. Major part of groundwater abstraction for irrigation is within the canal commands or in the flood plains of the rivers. The groundwater pumpage for the Indus Basin canal commands is estimated to be over 50 bcm.

33
ANNEX 2: PERCENTAGE OF DISTRICT AREAS FALLING IN PUNJAB CANALS
Distt. ID District Name Canal ID Canal Name District Area in
Canal (sq. meters)l Total District Area
(sq. meters) District area percentage in
CC
2.00 Gujranwala 1 Upper Chenab Canal 2134339000 3433773000 62.16
3.00 Hafizabad 1 Upper Chenab Canal 51528060 2367511000 2.18
4.00 Sheikhupura 1 Upper Chenab Canal 2027630000 6115865000 33.15
1.00 Sialkot 2 Marala Ravi Canal 524410300 3702319000 14.16
4.00 Sheikhupura 2 Marala Ravi Canal 118798100 6115865000 1.94
6.00 Lahore 3 Central Bari Doab Canal 1046336000 1457728000 71.78
21.00 Kasur 3 Central Bari Doab Canal 2074052000 4410471000 47.03
21.00 Kasur 4 Upper Dipalpur Canal 1331660000 4410471000 30.19
22.00 Okara 4 Upper Dipalpur Canal 375419000 4167336000 9.01
22.00 Okara 5 Lower Dipalpur Canal 1600235000 4167336000 38.40
23.00 Sahiwal 5 Lower Dipalpur Canal 291257100 5623143000 5.18
26.00 Pakpattan 5 Lower Dipalpur Canal 556463200 1013199000 54.92
1.00 Sialkot 6 Raya Branch (BRBD Inetranl) 119816900 3702319000 3.24
2.00 Gujranwala 6 Raya Branch (BRBD Inetranl) 295098400 3433773000 8.59
4.00 Sheikhupura 6 Raya Branch (BRBD Inetranl) 1352154000 6115865000 22.11
3.00 Hafizabad 7 Gugera 173246500 2367511000 7.32
4.00 Sheikhupura 7 Gugera 1533336000 6115865000 25.07
7.00 Faisalabad 7 Gugera 3264439000 5252541000 62.15
8.00 T.T. Singh 7 Gugera 2057898000 3160077000 65.12
2.00 Gujranwala 8 Jhang 137997400 3433773000 4.02
3.00 Hafizabad 8 Jhang 1439103000 2367511000 60.79
4.00 Sheikhupura 8 Jhang 633103600 6115865000 10.35
7.00 Faisalabad 8 Jhang 1932489000 5252541000 36.79
8.00 T.T. Singh 8 Jhang 1053882000 3160077000 33.35
9.00 Jhang 8 Jhang 2855436000 8916454000 32.02
2.00 Gujranwala 9 Upper Jehlum Canal 83489810 3433773000 2.43
10.00 Gujrat 9 Upper Jehlum Canal 283733000 2740865000 10.35
11.00 Sargodha 9 Upper Jehlum Canal 124228600 5912901000 2.10
12.00 M.B. Din 9 Upper Jehlum Canal 2156162000 2943098000 73.26
9.00 Jhang 10 Lower Jehlum Canal 1664667000 8916454000 18.67
11.00 Sargodha 10 Lower Jehlum Canal 5067048000 5912901000 85.69
12.00 M.B. Din 10 Lower Jehlum Canal 230437500 2943098000 7.83
13.00 Mianwali 11 Thal Canal 1606651000 5573883000 28.82
14.00 M.Garh 11 Thal Canal 1399381000 8266734000 16.93
15.00 Layyah 11 Thal Canal 2896975000 5709921000 50.74
16.00 Khushab 11 Thal Canal 1776902000 6639989000 26.76
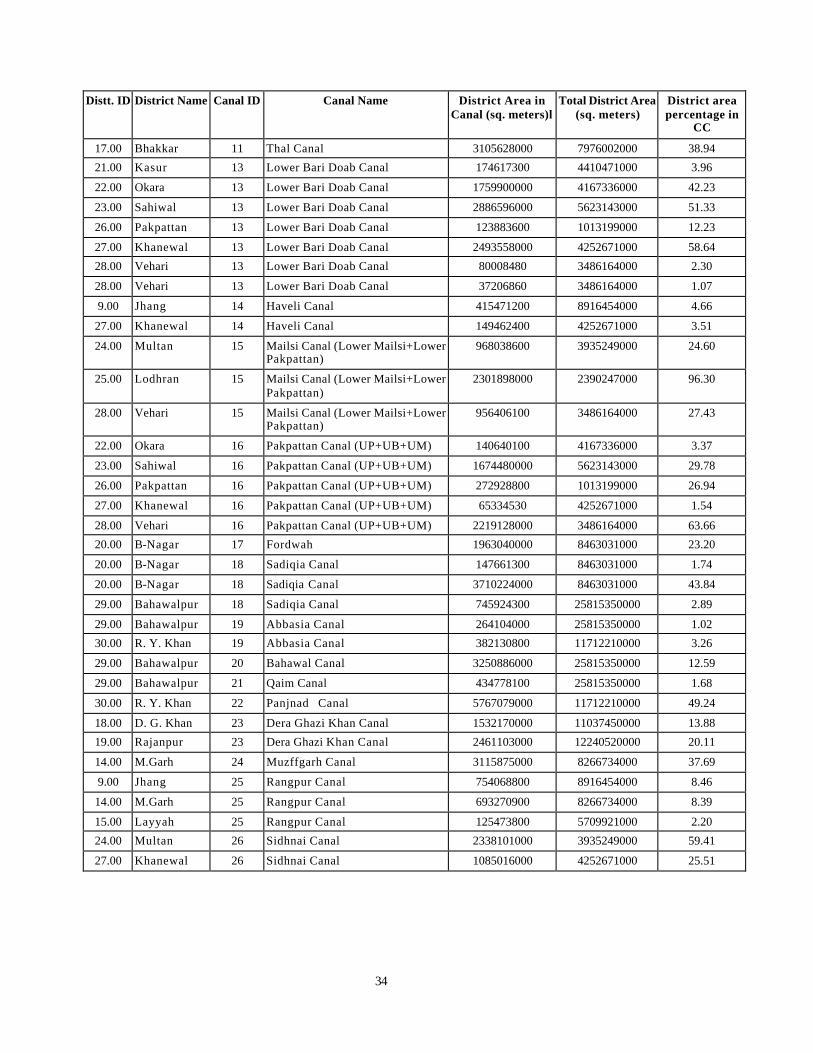
34
Distt. ID District Name Canal ID Canal Name District Area in Canal (sq. meters)l
Total District Area (sq. meters)
District area percentage in
CC
17.00 Bhakkar 11 Thal Canal 3105628000 7976002000 38.94
21.00 Kasur 13 Lower Bari Doab Canal 174617300 4410471000 3.96
22.00 Okara 13 Lower Bari Doab Canal 1759900000 4167336000 42.23
23.00 Sahiwal 13 Lower Bari Doab Canal 2886596000 5623143000 51.33
26.00 Pakpattan 13 Lower Bari Doab Canal 123883600 1013199000 12.23
27.00 Khanewal 13 Lower Bari Doab Canal 2493558000 4252671000 58.64
28.00 Vehari 13 Lower Bari Doab Canal 80008480 3486164000 2.30
28.00 Vehari 13 Lower Bari Doab Canal 37206860 3486164000 1.07
9.00 Jhang 14 Haveli Canal 415471200 8916454000 4.66
27.00 Khanewal 14 Haveli Canal 149462400 4252671000 3.51
24.00 Multan 15 Mailsi Canal (Lower Mailsi+Lower Pakpattan)
968038600 3935249000 24.60
25.00 Lodhran 15 Mailsi Canal (Lower Mailsi+Lower Pakpattan)
2301898000 2390247000 96.30
28.00 Vehari 15 Mailsi Canal (Lower Mailsi+Lower Pakpattan)
956406100 3486164000 27.43
22.00 Okara 16 Pakpattan Canal (UP+UB+UM) 140640100 4167336000 3.37
23.00 Sahiwal 16 Pakpattan Canal (UP+UB+UM) 1674480000 5623143000 29.78
26.00 Pakpattan 16 Pakpattan Canal (UP+UB+UM) 272928800 1013199000 26.94
27.00 Khanewal 16 Pakpattan Canal (UP+UB+UM) 65334530 4252671000 1.54
28.00 Vehari 16 Pakpattan Canal (UP+UB+UM) 2219128000 3486164000 63.66
20.00 B-Nagar 17 Fordwah 1963040000 8463031000 23.20
20.00 B-Nagar 18 Sadiqia Canal 147661300 8463031000 1.74
20.00 B-Nagar 18 Sadiqia Canal 3710224000 8463031000 43.84
29.00 Bahawalpur 18 Sadiqia Canal 745924300 25815350000 2.89
29.00 Bahawalpur 19 Abbasia Canal 264104000 25815350000 1.02
30.00 R. Y. Khan 19 Abbasia Canal 382130800 11712210000 3.26
29.00 Bahawalpur 20 Bahawal Canal 3250886000 25815350000 12.59
29.00 Bahawalpur 21 Qaim Canal 434778100 25815350000 1.68
30.00 R. Y. Khan 22 Panjnad Canal 5767079000 11712210000 49.24
18.00 D. G. Khan 23 Dera Ghazi Khan Canal 1532170000 11037450000 13.88
19.00 Rajanpur 23 Dera Ghazi Khan Canal 2461103000 12240520000 20.11
14.00 M.Garh 24 Muzffgarh Canal 3115875000 8266734000 37.69
9.00 Jhang 25 Rangpur Canal 754068800 8916454000 8.46
14.00 M.Garh 25 Rangpur Canal 693270900 8266734000 8.39
15.00 Layyah 25 Rangpur Canal 125473800 5709921000 2.20
24.00 Multan 26 Sidhnai Canal 2338101000 3935249000 59.41
27.00 Khanewal 26 Sidhnai Canal 1085016000 4252671000 25.51
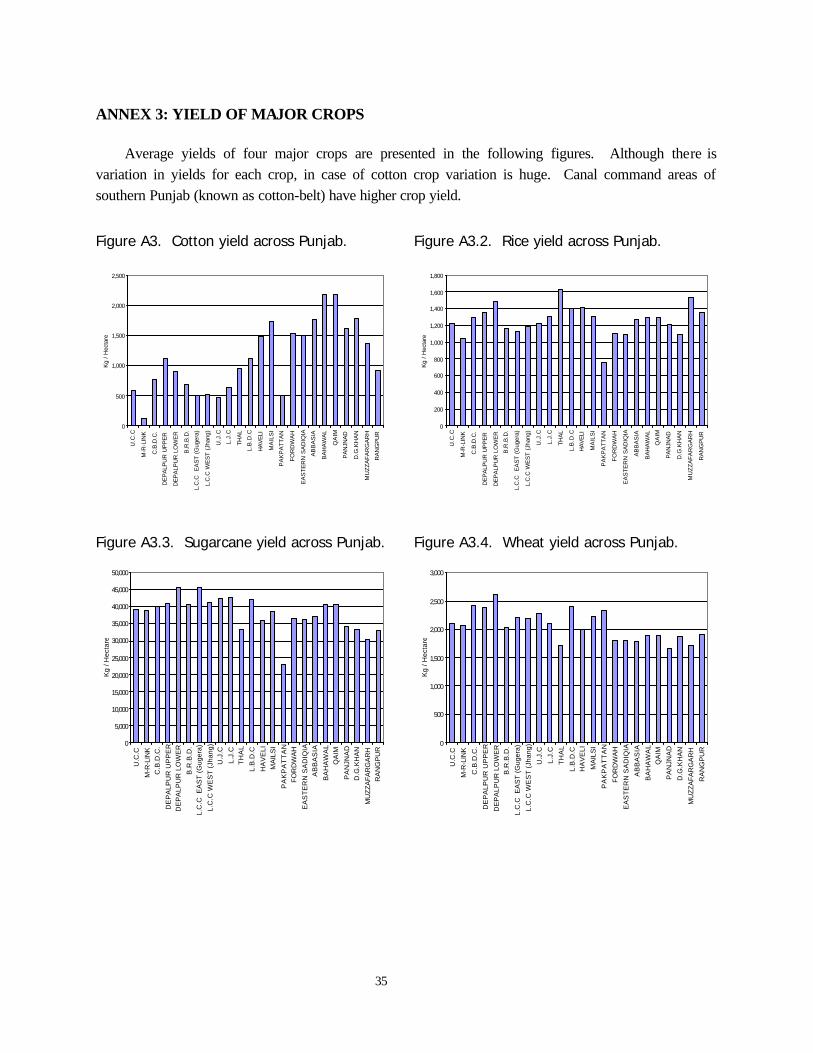
35
ANNEX 3: YIELD OF MAJOR CROPS
Average yields of four major crops are presented in the following figures. Although there is variation in yields for each crop, in case of cotton crop variation is huge. Canal command areas of southern Punjab (known as cotton-belt) have higher crop yield.
Figure A3. Cotton yield across Punjab. Figure A3.2. Rice yield across Punjab.
0
500
1,000
1,500
2,000
2,500
U.C
.C
M-R
-LIN
K
C.B
.D.C
.
DE
PA
LP
UR
UP
PE
R
DE
PA
LP
UR
LO
WE
R
B.R
.B.D
.
L.C
.C
EA
ST
(G
ugera
)
L.C
.C W
ES
T (
Jhang)
U.J
.C
L.J
.C
TH
AL
L.B
.D.C
HA
VE
LI
MA
ILS
I
PA
KP
AT
TA
N
FO
RD
WA
H
EA
ST
ER
N S
AD
IQIA
AB
BA
SIA
BA
HA
WA
L
QA
IM
PA
NJN
AD
D.G
.KH
AN
MU
ZZ
AF
AR
GA
RH
RA
NG
PU
R
Kg /
Hect
are
0
200
400
600
800
1,000
1,200
1,400
1,600
1,800
U.C
.C
M-R
-LIN
K
C.B
.D.C
.
DE
PA
LP
UR
UP
PE
R
DE
PA
LP
UR
LO
WE
R
B.R
.B.D
.
L.C
.C
EA
ST
(G
ugera
)
L.C
.C W
ES
T (
Jhang)
U.J
.C
L.J
.C
TH
AL
L.B
.D.C
HA
VE
LI
MA
ILS
I
PA
KP
AT
TA
N
FO
RD
WA
H
EA
ST
ER
N S
AD
IQIA
AB
BA
SIA
BA
HA
WA
L
QA
IM
PA
NJN
AD
D.G
.KH
AN
MU
ZZ
AF
AR
GA
RH
RA
NG
PU
R
Kg /
Hect
are
Figure A3.3. Sugarcane yield across Punjab. Figure A3.4. Wheat yield across Punjab.
0
5,000
10,000
15,000
20,000
25,000
30,000
35,000
40,000
45,000
50,000
U.C
.C
M-R
-LIN
K
C.B
.D.C
.
DE
PA
LP
UR
UP
PE
R
DE
PA
LP
UR
LO
WE
R
B.R
.B.D
.
L.C
.C
EA
ST
(G
ug
era
)
L.C
.C W
ES
T (
Jh
an
g)
U.J
.C
L.J
.C
TH
AL
L.B
.D.C
HA
VE
LI
MA
ILS
I
PA
KP
AT
TA
N
FO
RD
WA
H
EA
ST
ER
N S
AD
IQIA
AB
BA
SIA
BA
HA
WA
L
QA
IM
PA
NJN
AD
D.G
.KH
AN
MU
ZZ
AF
AR
GA
RH
RA
NG
PU
R
Kg
/ H
ecta
re
0
500
1,000
1,500
2,000
2,500
3,000
U.C
.C
M-R
-LIN
K
C.B
.D.C
.
DE
PA
LP
UR
UP
PE
R
DE
PA
LP
UR
LO
WE
R
B.R
.B.D
.
L.C
.C
EA
ST
(G
ug
era
)
L.C
.C W
ES
T (
Jh
an
g)
U.J
.C
L.J
.C
TH
AL
L.B
.D.C
HA
VE
LI
MA
ILS
I
PA
KP
AT
TA
N
FO
RD
WA
H
EA
ST
ER
N S
AD
IQIA
AB
BA
SIA
BA
HA
WA
L
QA
IM
PA
NJN
AD
D.G
.KH
AN
MU
ZZ
AF
AR
GA
RH
RA
NG
PU
R
Kg
/ H
ecta
re

SM
IWMI is a Future Harvest CenterSupported by the CGIAR
Head Office
Tel.
Fax
Website
Regionl Office
P O Box 2075
Colombo
Sri Lanka
127, Sunil Mawatha
Pelawatta
Battaramulla
Sri Lanka
94-1-867404, 869080
94-1-866854
www.iwmi.org
Location
IWMI 12km
Multan Road
Chowk Thoker Niaz Baig
Lahore 53700
Pakistan