Embed Size (px)
Citation preview

87
LAMPIRAN
88
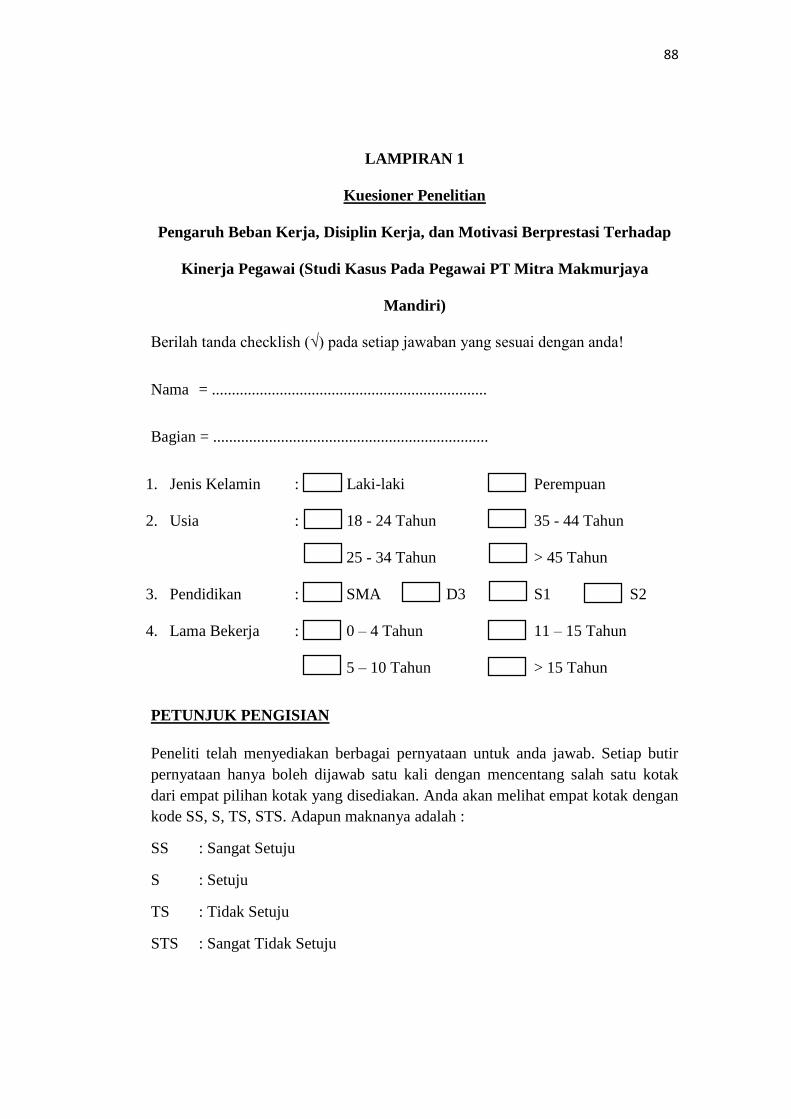
LAMPIRAN 1
Kuesioner Penelitian
Pengaruh Beban Kerja, Disiplin Kerja, dan Motivasi Berprestasi Terhadap
Kinerja Pegawai (Studi Kasus Pada Pegawai PT Mitra Makmurjaya
Mandiri)
Berilah tanda checklish (√) pada setiap jawaban yang sesuai dengan anda!
Nama = .....................................................................
Bagian = .....................................................................
1. Jenis Kelamin : Laki-laki Perempuan
2. Usia : 18 - 24 Tahun 35 - 44 Tahun
25 - 34 Tahun > 45 Tahun
3. Pendidikan : SMA D3 S1 S2
4. Lama Bekerja : 0 – 4 Tahun 11 – 15 Tahun
5 – 10 Tahun > 15 Tahun
PETUNJUK PENGISIAN
Peneliti telah menyediakan berbagai pernyataan untuk anda jawab. Setiap butir
pernyataan hanya boleh dijawab satu kali dengan mencentang salah satu kotak
dari empat pilihan kotak yang disediakan. Anda akan melihat empat kotak dengan
kode SS, S, TS, STS. Adapun maknanya adalah :
SS : Sangat Setuju
S : Setuju
TS : Tidak Setuju
STS : Sangat Tidak Setuju
89
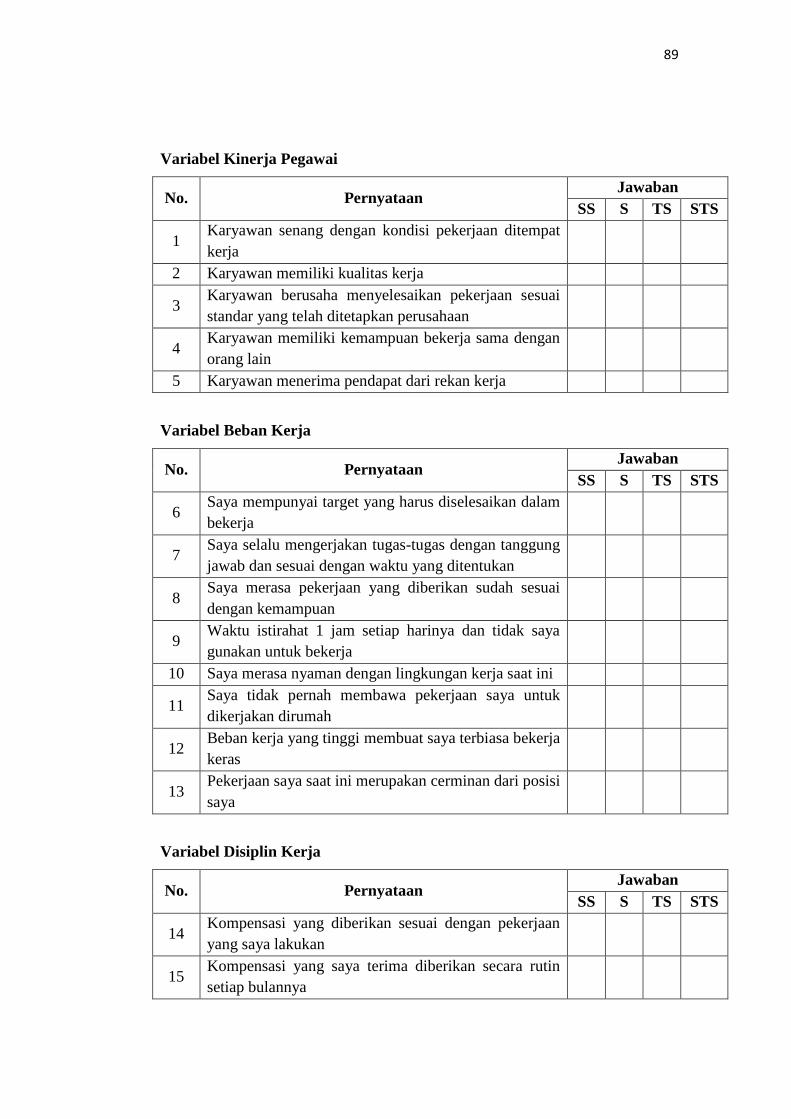
Variabel Kinerja Pegawai
No. Pernyataan Jawaban
SS S TS STS
1 Karyawan senang dengan kondisi pekerjaan ditempat
kerja
2 Karyawan memiliki kualitas kerja
3 Karyawan berusaha menyelesaikan pekerjaan sesuai
standar yang telah ditetapkan perusahaan
4 Karyawan memiliki kemampuan bekerja sama dengan
orang lain
5 Karyawan menerima pendapat dari rekan kerja
Variabel Beban Kerja
No. Pernyataan Jawaban
SS S TS STS
6 Saya mempunyai target yang harus diselesaikan dalam
bekerja
7 Saya selalu mengerjakan tugas-tugas dengan tanggung
jawab dan sesuai dengan waktu yang ditentukan
8 Saya merasa pekerjaan yang diberikan sudah sesuai
dengan kemampuan
9 Waktu istirahat 1 jam setiap harinya dan tidak saya
gunakan untuk bekerja
10 Saya merasa nyaman dengan lingkungan kerja saat ini
11 Saya tidak pernah membawa pekerjaan saya untuk
dikerjakan dirumah
12 Beban kerja yang tinggi membuat saya terbiasa bekerja
keras
13 Pekerjaan saya saat ini merupakan cerminan dari posisi
saya
Variabel Disiplin Kerja
No. Pernyataan Jawaban
SS S TS STS
14 Kompensasi yang diberikan sesuai dengan pekerjaan
yang saya lakukan
15 Kompensasi yang saya terima diberikan secara rutin
setiap bulannya
90
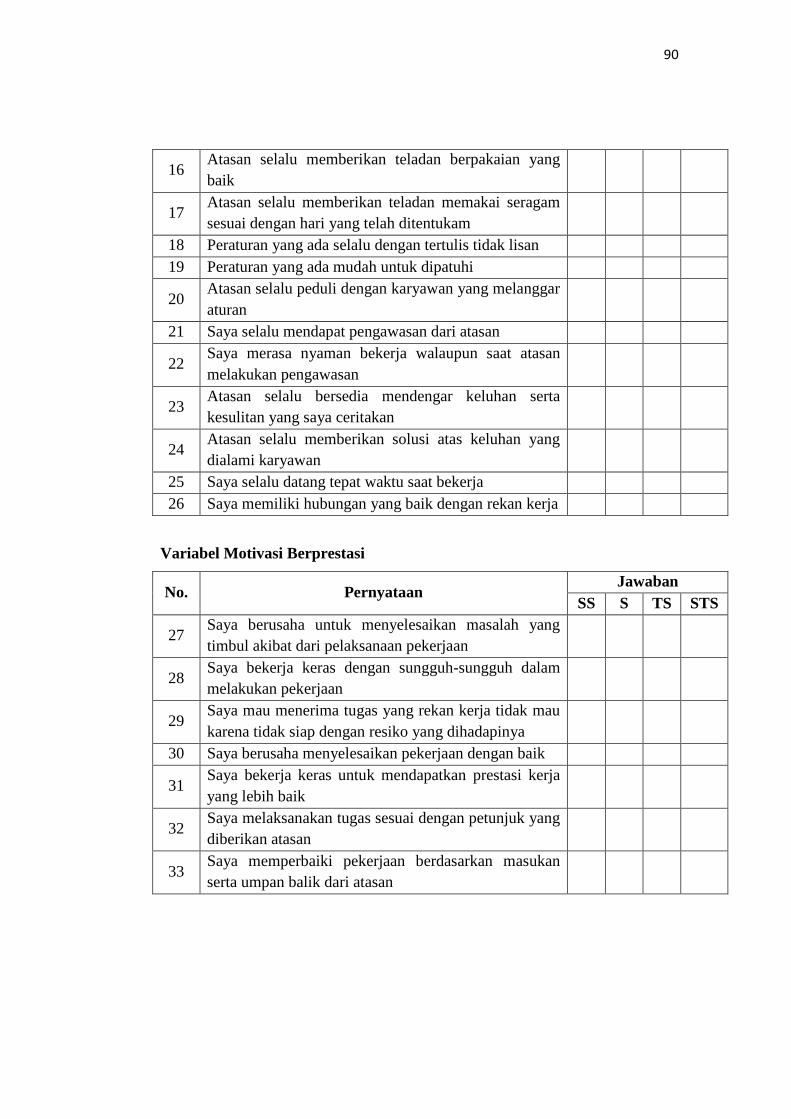
16 Atasan selalu memberikan teladan berpakaian yang
baik
17 Atasan selalu memberikan teladan memakai seragam
sesuai dengan hari yang telah ditentukam
18 Peraturan yang ada selalu dengan tertulis tidak lisan
19 Peraturan yang ada mudah untuk dipatuhi
20 Atasan selalu peduli dengan karyawan yang melanggar
aturan
21 Saya selalu mendapat pengawasan dari atasan
22 Saya merasa nyaman bekerja walaupun saat atasan
melakukan pengawasan
23 Atasan selalu bersedia mendengar keluhan serta
kesulitan yang saya ceritakan
24 Atasan selalu memberikan solusi atas keluhan yang
dialami karyawan
25 Saya selalu datang tepat waktu saat bekerja
26 Saya memiliki hubungan yang baik dengan rekan kerja
Variabel Motivasi Berprestasi
No. Pernyataan Jawaban
SS S TS STS
27 Saya berusaha untuk menyelesaikan masalah yang
timbul akibat dari pelaksanaan pekerjaan
28 Saya bekerja keras dengan sungguh-sungguh dalam
melakukan pekerjaan
29 Saya mau menerima tugas yang rekan kerja tidak mau
karena tidak siap dengan resiko yang dihadapinya
30 Saya berusaha menyelesaikan pekerjaan dengan baik
31 Saya bekerja keras untuk mendapatkan prestasi kerja
yang lebih baik
32 Saya melaksanakan tugas sesuai dengan petunjuk yang
diberikan atasan
33 Saya memperbaiki pekerjaan berdasarkan masukan
serta umpan balik dari atasan
91
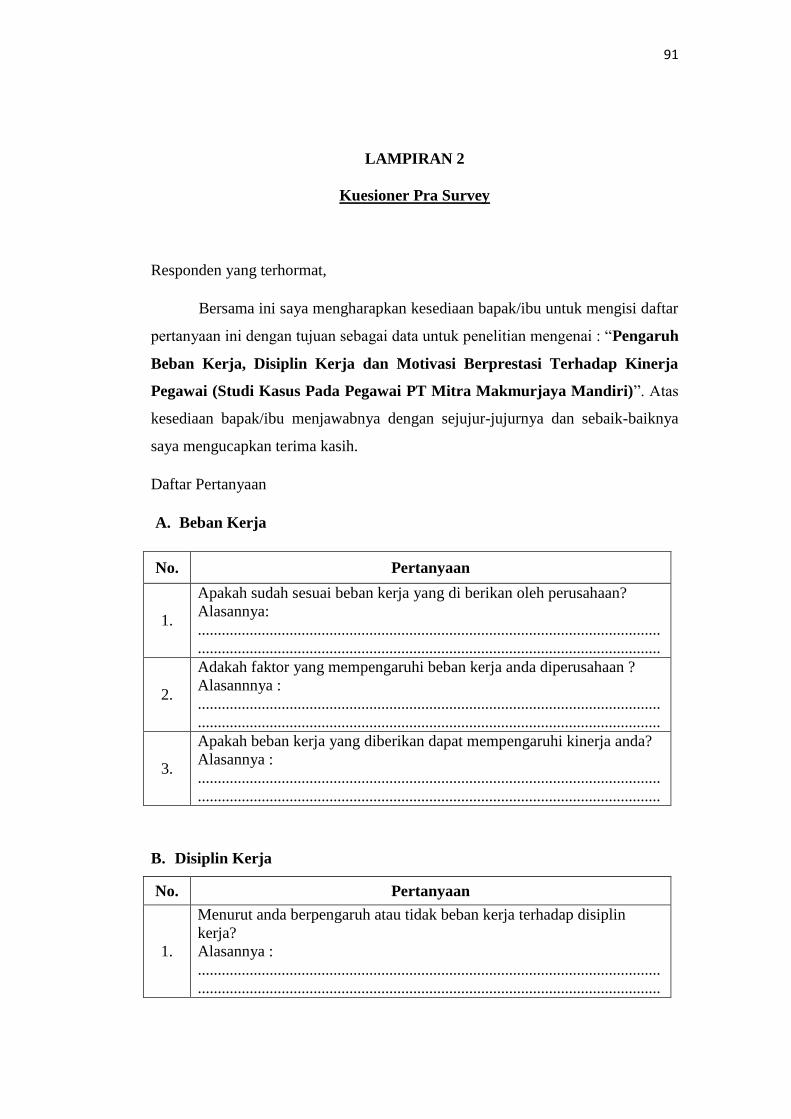
LAMPIRAN 2
Kuesioner Pra Survey
Responden yang terhormat,
Bersama ini saya mengharapkan kesediaan bapak/ibu untuk mengisi daftar
pertanyaan ini dengan tujuan sebagai data untuk penelitian mengenai : “Pengaruh
Beban Kerja, Disiplin Kerja dan Motivasi Berprestasi Terhadap Kinerja
Pegawai (Studi Kasus Pada Pegawai PT Mitra Makmurjaya Mandiri)”. Atas
kesediaan bapak/ibu menjawabnya dengan sejujur-jujurnya dan sebaik-baiknya
saya mengucapkan terima kasih.
Daftar Pertanyaan
A. Beban Kerja
No. Pertanyaan
1.
Apakah sudah sesuai beban kerja yang di berikan oleh perusahaan?
Alasannya:
....................................................................................................................
....................................................................................................................
2.
Adakah faktor yang mempengaruhi beban kerja anda diperusahaan ?
Alasannnya :
....................................................................................................................
....................................................................................................................
3.
Apakah beban kerja yang diberikan dapat mempengaruhi kinerja anda?
Alasannya :
....................................................................................................................
....................................................................................................................
B. Disiplin Kerja
No. Pertanyaan
1.
Menurut anda berpengaruh atau tidak beban kerja terhadap disiplin
kerja?
Alasannya :
....................................................................................................................
....................................................................................................................
92
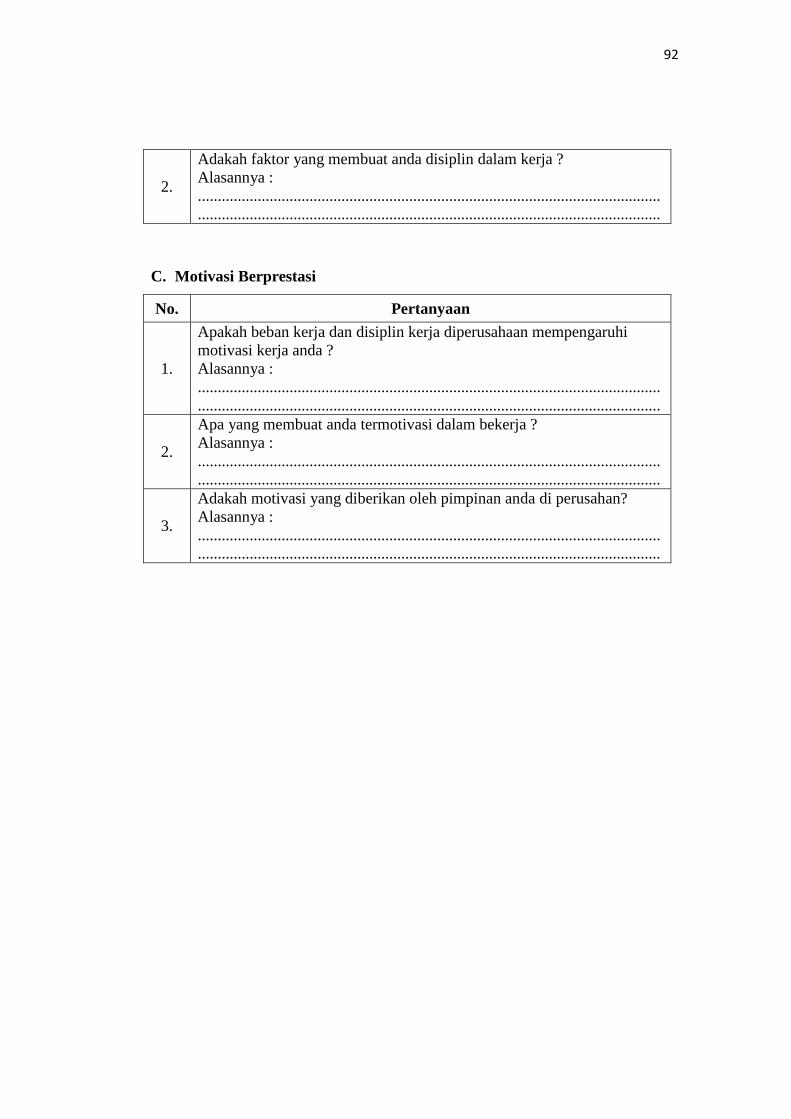
2.
Adakah faktor yang membuat anda disiplin dalam kerja ?
Alasannya :
....................................................................................................................
....................................................................................................................
C. Motivasi Berprestasi
No. Pertanyaan
1.
Apakah beban kerja dan disiplin kerja diperusahaan mempengaruhi
motivasi kerja anda ?
Alasannya :
....................................................................................................................
....................................................................................................................
2.
Apa yang membuat anda termotivasi dalam bekerja ?
Alasannya :
....................................................................................................................
....................................................................................................................
3.
Adakah motivasi yang diberikan oleh pimpinan anda di perusahan?
Alasannya :
....................................................................................................................
....................................................................................................................
93
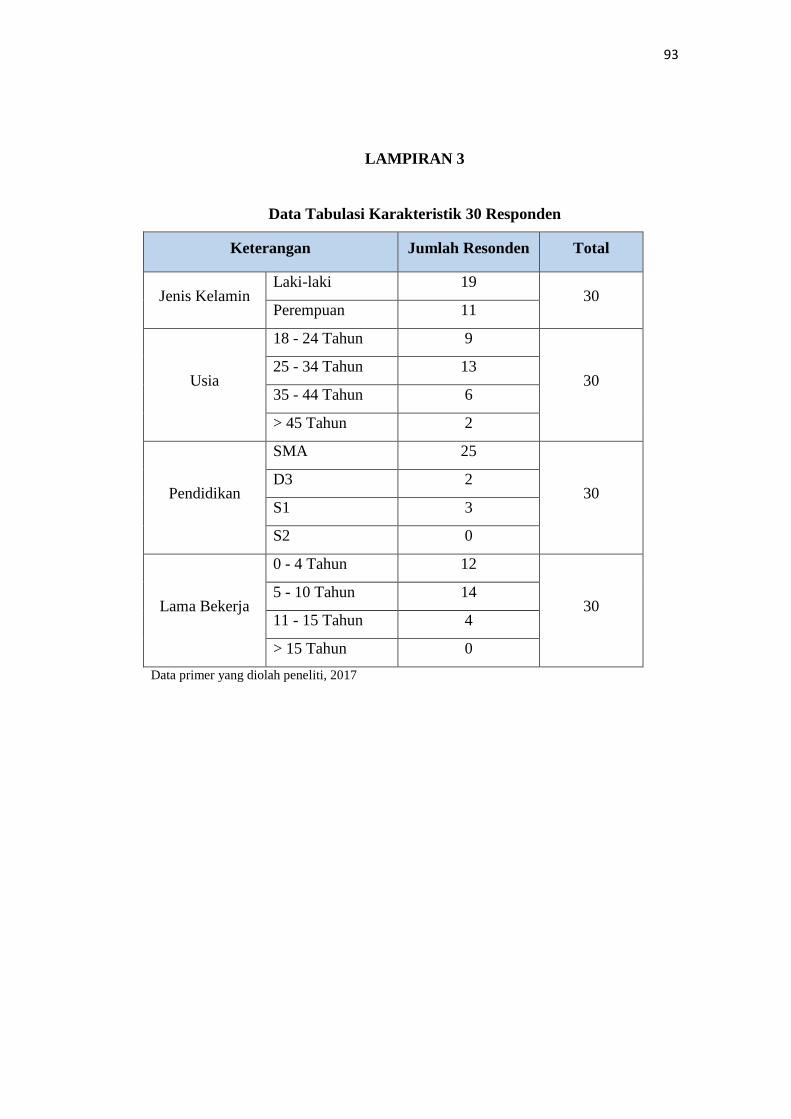
LAMPIRAN 3
Data Tabulasi Karakteristik 30 Responden
Keterangan Jumlah Resonden Total
Jenis Kelamin Laki-laki 19
30 Perempuan 11
Usia
18 - 24 Tahun 9
30 25 - 34 Tahun 13
35 - 44 Tahun 6
> 45 Tahun 2
Pendidikan
SMA 25
30 D3 2
S1 3
S2 0
Lama Bekerja
0 - 4 Tahun 12
30 5 - 10 Tahun 14
11 - 15 Tahun 4
> 15 Tahun 0
Data primer yang diolah peneliti, 2017
94
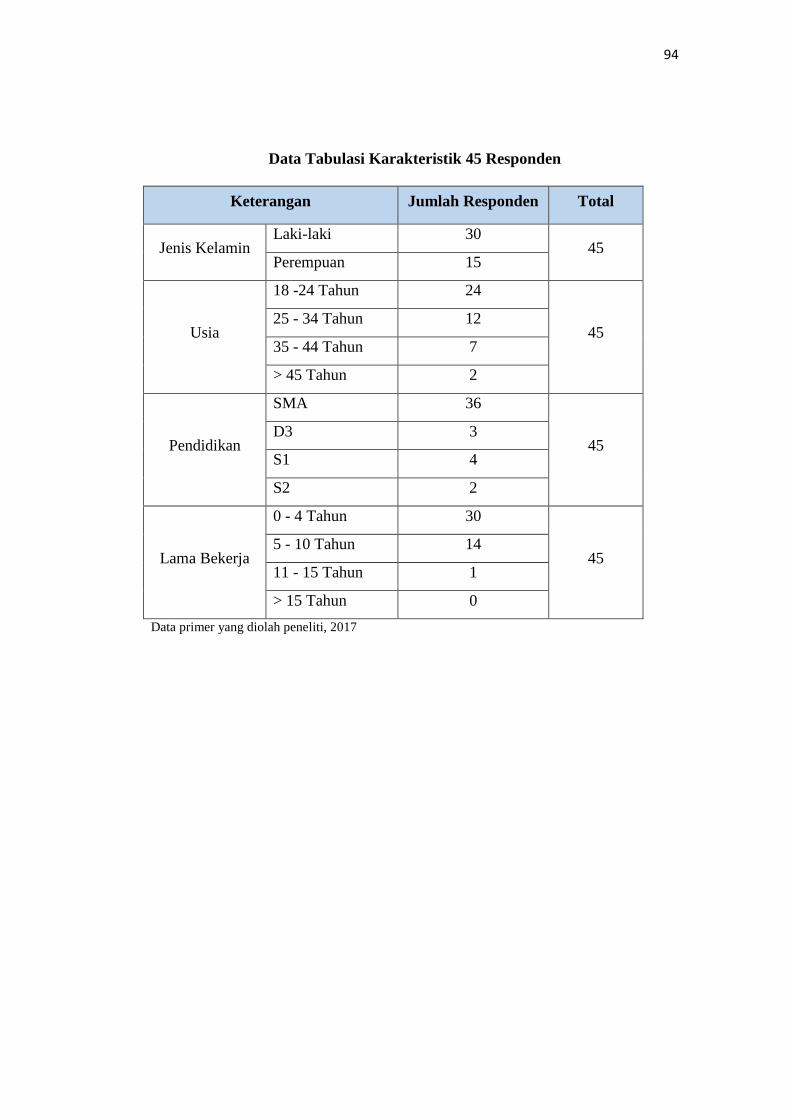
Data Tabulasi Karakteristik 45 Responden
Keterangan Jumlah Responden Total
Jenis Kelamin Laki-laki 30
45 Perempuan 15
Usia
18 -24 Tahun 24
45 25 - 34 Tahun 12
35 - 44 Tahun 7
> 45 Tahun 2
Pendidikan
SMA 36
45 D3 3
S1 4
S2 2
Lama Bekerja
0 - 4 Tahun 30
45 5 - 10 Tahun 14
11 - 15 Tahun 1
> 15 Tahun 0
Data primer yang diolah peneliti, 2017
95
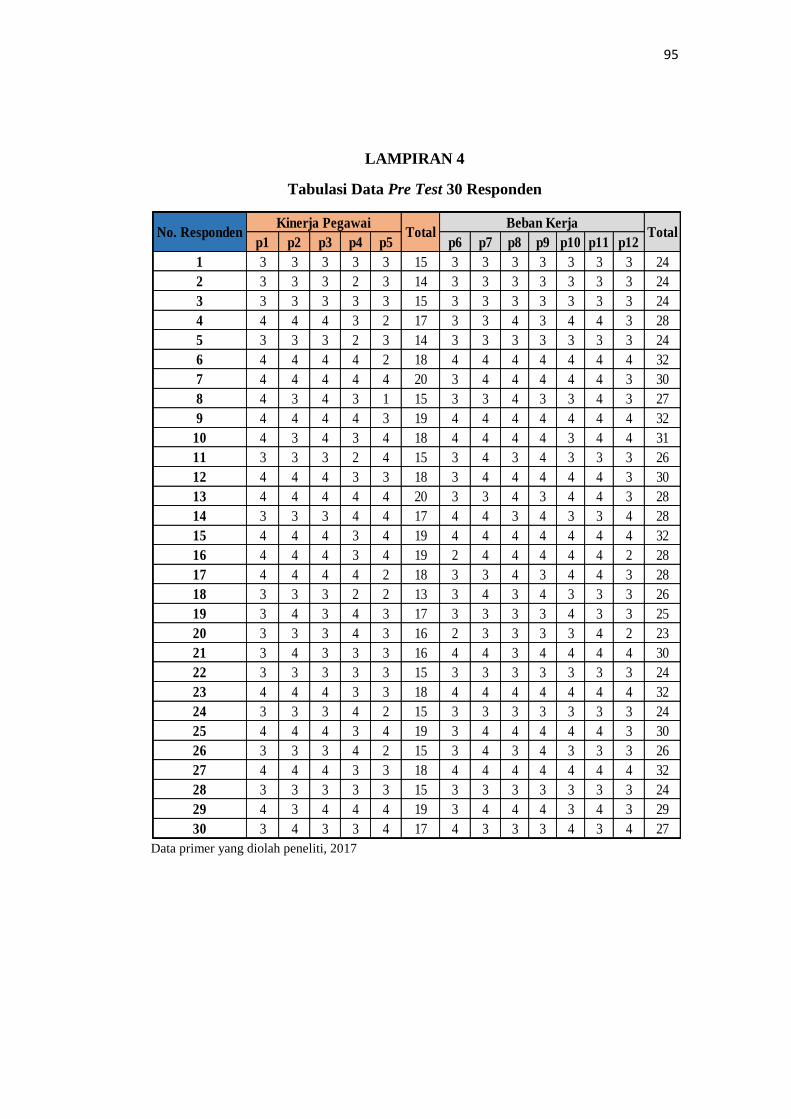
LAMPIRAN 4
Tabulasi Data Pre Test 30 Responden
Data primer yang diolah peneliti, 2017
p1 p2 p3 p4 p5 p6 p7 p8 p9 p10 p11 p12
1 3 3 3 3 3 15 3 3 3 3 3 3 3 24
2 3 3 3 2 3 14 3 3 3 3 3 3 3 24
3 3 3 3 3 3 15 3 3 3 3 3 3 3 24
4 4 4 4 3 2 17 3 3 4 3 4 4 3 28
5 3 3 3 2 3 14 3 3 3 3 3 3 3 24
6 4 4 4 4 2 18 4 4 4 4 4 4 4 32
7 4 4 4 4 4 20 3 4 4 4 4 4 3 30
8 4 3 4 3 1 15 3 3 4 3 3 4 3 27
9 4 4 4 4 3 19 4 4 4 4 4 4 4 32
10 4 3 4 3 4 18 4 4 4 4 3 4 4 31
11 3 3 3 2 4 15 3 4 3 4 3 3 3 26
12 4 4 4 3 3 18 3 4 4 4 4 4 3 30
13 4 4 4 4 4 20 3 3 4 3 4 4 3 28
14 3 3 3 4 4 17 4 4 3 4 3 3 4 28
15 4 4 4 3 4 19 4 4 4 4 4 4 4 32
16 4 4 4 3 4 19 2 4 4 4 4 4 2 28
17 4 4 4 4 2 18 3 3 4 3 4 4 3 28
18 3 3 3 2 2 13 3 4 3 4 3 3 3 26
19 3 4 3 4 3 17 3 3 3 3 4 3 3 25
20 3 3 3 4 3 16 2 3 3 3 3 4 2 23
21 3 4 3 3 3 16 4 4 3 4 4 4 4 30
22 3 3 3 3 3 15 3 3 3 3 3 3 3 24
23 4 4 4 3 3 18 4 4 4 4 4 4 4 32
24 3 3 3 4 2 15 3 3 3 3 3 3 3 24
25 4 4 4 3 4 19 3 4 4 4 4 4 3 30
26 3 3 3 4 2 15 3 4 3 4 3 3 3 26
27 4 4 4 3 3 18 4 4 4 4 4 4 4 32
28 3 3 3 3 3 15 3 3 3 3 3 3 3 24
29 4 3 4 4 4 19 3 4 4 4 3 4 3 29
30 3 4 3 3 4 17 4 3 3 3 4 3 4 27
No. RespondenKinerja Pegawai
TotalBeban Kerja
Total
96
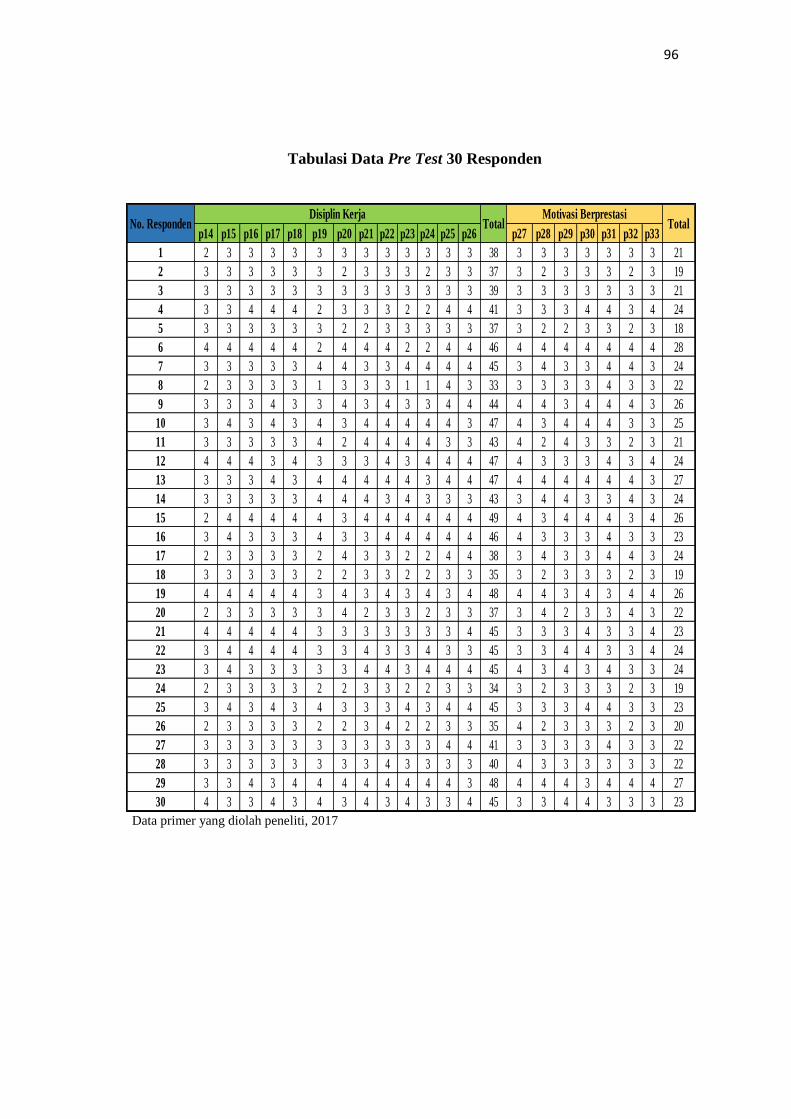
Tabulasi Data Pre Test 30 Responden
Data primer yang diolah peneliti, 2017
p14 p15 p16 p17 p18 p19 p20 p21 p22 p23 p24 p25 p26 p27 p28 p29 p30 p31 p32 p33
1 2 3 3 3 3 3 3 3 3 3 3 3 3 38 3 3 3 3 3 3 3 21
2 3 3 3 3 3 3 2 3 3 3 2 3 3 37 3 2 3 3 3 2 3 19
3 3 3 3 3 3 3 3 3 3 3 3 3 3 39 3 3 3 3 3 3 3 21
4 3 3 4 4 4 2 3 3 3 2 2 4 4 41 3 3 3 4 4 3 4 24
5 3 3 3 3 3 3 2 2 3 3 3 3 3 37 3 2 2 3 3 2 3 18
6 4 4 4 4 4 2 4 4 4 2 2 4 4 46 4 4 4 4 4 4 4 28
7 3 3 3 3 3 4 4 3 3 4 4 4 4 45 3 4 3 3 4 4 3 24
8 2 3 3 3 3 1 3 3 3 1 1 4 3 33 3 3 3 3 4 3 3 22
9 3 3 3 4 3 3 4 3 4 3 3 4 4 44 4 4 3 4 4 4 3 26
10 3 4 3 4 3 4 3 4 4 4 4 4 3 47 4 3 4 4 4 3 3 25
11 3 3 3 3 3 4 2 4 4 4 4 3 3 43 4 2 4 3 3 2 3 21
12 4 4 4 3 4 3 3 3 4 3 4 4 4 47 4 3 3 3 4 3 4 24
13 3 3 3 4 3 4 4 4 4 4 3 4 4 47 4 4 4 4 4 4 3 27
14 3 3 3 3 3 4 4 4 3 4 3 3 3 43 3 4 4 3 3 4 3 24
15 2 4 4 4 4 4 3 4 4 4 4 4 4 49 4 3 4 4 4 3 4 26
16 3 4 3 3 3 4 3 3 4 4 4 4 4 46 4 3 3 3 4 3 3 23
17 2 3 3 3 3 2 4 3 3 2 2 4 4 38 3 4 3 3 4 4 3 24
18 3 3 3 3 3 2 2 3 3 2 2 3 3 35 3 2 3 3 3 2 3 19
19 4 4 4 4 4 3 4 3 4 3 4 3 4 48 4 4 3 4 3 4 4 26
20 2 3 3 3 3 3 4 2 3 3 2 3 3 37 3 4 2 3 3 4 3 22
21 4 4 4 4 4 3 3 3 3 3 3 3 4 45 3 3 3 4 3 3 4 23
22 3 4 4 4 4 3 3 4 3 3 4 3 3 45 3 3 4 4 3 3 4 24
23 3 4 3 3 3 3 3 4 4 3 4 4 4 45 4 3 4 3 4 3 3 24
24 2 3 3 3 3 2 2 3 3 2 2 3 3 34 3 2 3 3 3 2 3 19
25 3 4 3 4 3 4 3 3 3 4 3 4 4 45 3 3 3 4 4 3 3 23
26 2 3 3 3 3 2 2 3 4 2 2 3 3 35 4 2 3 3 3 2 3 20
27 3 3 3 3 3 3 3 3 3 3 3 4 4 41 3 3 3 3 4 3 3 22
28 3 3 3 3 3 3 3 3 4 3 3 3 3 40 4 3 3 3 3 3 3 22
29 3 3 4 3 4 4 4 4 4 4 4 4 3 48 4 4 4 3 4 4 4 27
30 4 3 3 4 3 4 3 4 3 4 3 3 4 45 3 3 4 4 3 3 3 23
No. RespondenDisiplin Kerja
TotalMotivasi Berprestasi
Total
97
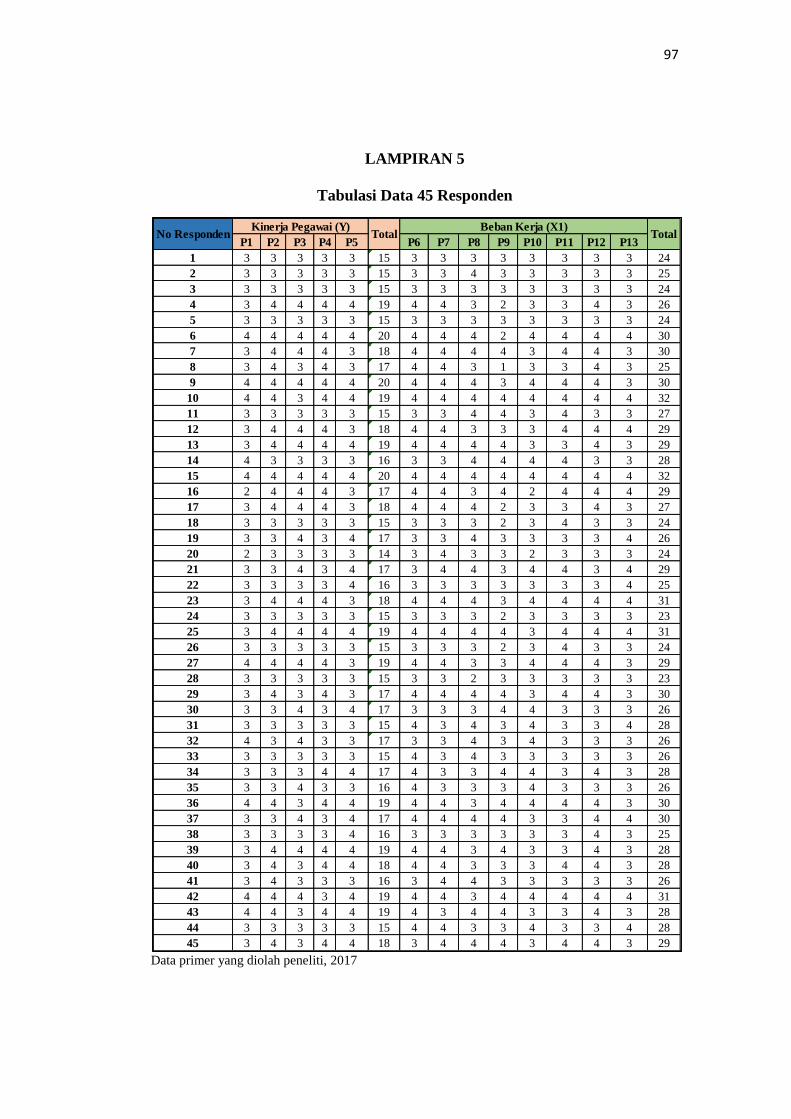
LAMPIRAN 5
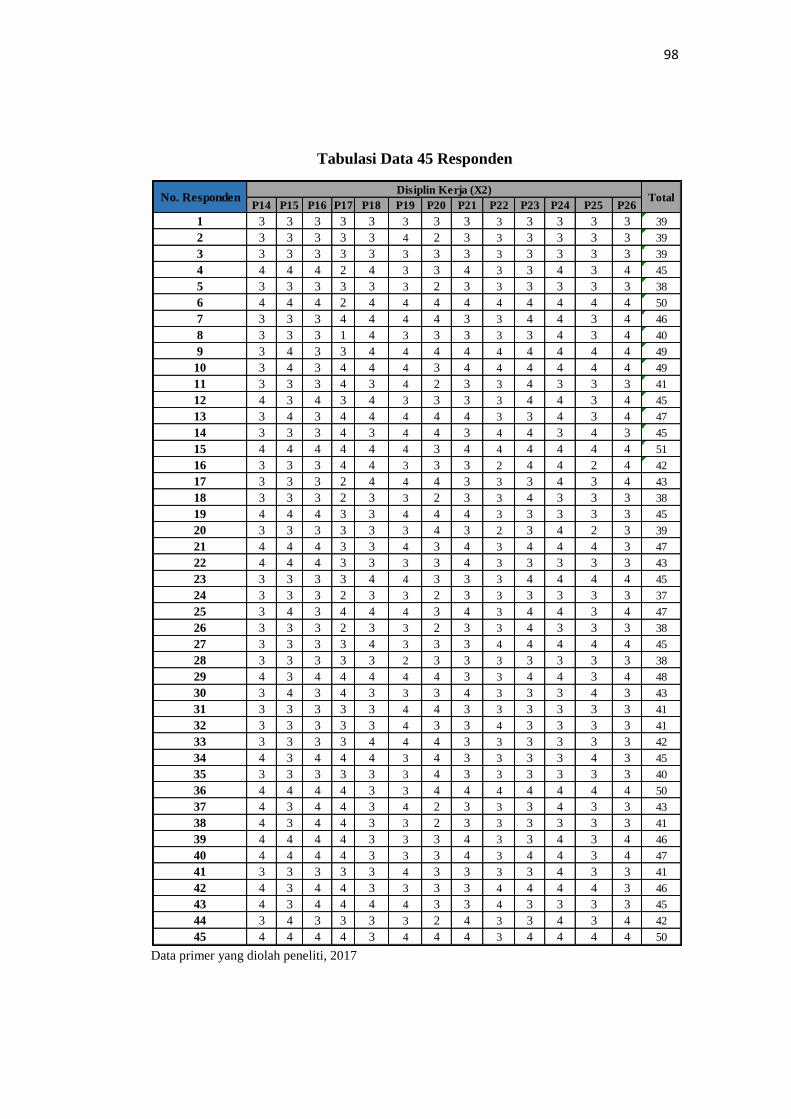
Tabulasi Data 45 Responden
Data primer yang diolah peneliti, 2017
P1 P2 P3 P4 P5 P6 P7 P8 P9 P10 P11 P12 P13
1 3 3 3 3 3 15 3 3 3 3 3 3 3 3 24
2 3 3 3 3 3 15 3 3 4 3 3 3 3 3 25
3 3 3 3 3 3 15 3 3 3 3 3 3 3 3 24
4 3 4 4 4 4 19 4 4 3 2 3 3 4 3 26
5 3 3 3 3 3 15 3 3 3 3 3 3 3 3 24
6 4 4 4 4 4 20 4 4 4 2 4 4 4 4 30
7 3 4 4 4 3 18 4 4 4 4 3 4 4 3 30
8 3 4 3 4 3 17 4 4 3 1 3 3 4 3 25
9 4 4 4 4 4 20 4 4 4 3 4 4 4 3 30
10 4 4 3 4 4 19 4 4 4 4 4 4 4 4 32
11 3 3 3 3 3 15 3 3 4 4 3 4 3 3 27
12 3 4 4 4 3 18 4 4 3 3 3 4 4 4 29
13 3 4 4 4 4 19 4 4 4 4 3 3 4 3 29
14 4 3 3 3 3 16 3 3 4 4 4 4 3 3 28
15 4 4 4 4 4 20 4 4 4 4 4 4 4 4 32
16 2 4 4 4 3 17 4 4 3 4 2 4 4 4 29
17 3 4 4 4 3 18 4 4 4 2 3 3 4 3 27
18 3 3 3 3 3 15 3 3 3 2 3 4 3 3 24
19 3 3 4 3 4 17 3 3 4 3 3 3 3 4 26
20 2 3 3 3 3 14 3 4 3 3 2 3 3 3 24
21 3 3 4 3 4 17 3 4 4 3 4 4 3 4 29
22 3 3 3 3 4 16 3 3 3 3 3 3 3 4 25
23 3 4 4 4 3 18 4 4 4 3 4 4 4 4 31
24 3 3 3 3 3 15 3 3 3 2 3 3 3 3 23
25 3 4 4 4 4 19 4 4 4 4 3 4 4 4 31
26 3 3 3 3 3 15 3 3 3 2 3 4 3 3 24
27 4 4 4 4 3 19 4 4 3 3 4 4 4 3 29
28 3 3 3 3 3 15 3 3 2 3 3 3 3 3 23
29 3 4 3 4 3 17 4 4 4 4 3 4 4 3 30
30 3 3 4 3 4 17 3 3 3 4 4 3 3 3 26
31 3 3 3 3 3 15 4 3 4 3 4 3 3 4 28
32 4 3 4 3 3 17 3 3 4 3 4 3 3 3 26
33 3 3 3 3 3 15 4 3 4 3 3 3 3 3 26
34 3 3 3 4 4 17 4 3 3 4 4 3 4 3 28
35 3 3 4 3 3 16 4 3 3 3 4 3 3 3 26
36 4 4 3 4 4 19 4 4 3 4 4 4 4 3 30
37 3 3 4 3 4 17 4 4 4 4 3 3 4 4 30
38 3 3 3 3 4 16 3 3 3 3 3 3 4 3 25
39 3 4 4 4 4 19 4 4 3 4 3 3 4 3 28
40 3 4 3 4 4 18 4 4 3 3 3 4 4 3 28
41 3 4 3 3 3 16 3 4 4 3 3 3 3 3 26
42 4 4 4 3 4 19 4 4 3 4 4 4 4 4 31
43 4 4 3 4 4 19 4 3 4 4 3 3 4 3 28
44 3 3 3 3 3 15 4 4 3 3 4 3 3 4 28
45 3 4 3 4 4 18 3 4 4 4 3 4 4 3 29
No RespondenKinerja Pegawai (Y)
TotalBeban Kerja (X1)
Total
98
Tabulasi Data 45 Responden
Data primer yang diolah peneliti, 2017
P14 P15 P16 P17 P18 P19 P20 P21 P22 P23 P24 P25 P26
1 3 3 3 3 3 3 3 3 3 3 3 3 3 39
2 3 3 3 3 3 4 2 3 3 3 3 3 3 39
3 3 3 3 3 3 3 3 3 3 3 3 3 3 39
4 4 4 4 2 4 3 3 4 3 3 4 3 4 45
5 3 3 3 3 3 3 2 3 3 3 3 3 3 38
6 4 4 4 2 4 4 4 4 4 4 4 4 4 50
7 3 3 3 4 4 4 4 3 3 4 4 3 4 46
8 3 3 3 1 4 3 3 3 3 3 4 3 4 40
9 3 4 3 3 4 4 4 4 4 4 4 4 4 49
10 3 4 3 4 4 4 3 4 4 4 4 4 4 49
11 3 3 3 4 3 4 2 3 3 4 3 3 3 41
12 4 3 4 3 4 3 3 3 3 4 4 3 4 45
13 3 4 3 4 4 4 4 4 3 3 4 3 4 47
14 3 3 3 4 3 4 4 3 4 4 3 4 3 45
15 4 4 4 4 4 4 3 4 4 4 4 4 4 51
16 3 3 3 4 4 3 3 3 2 4 4 2 4 42
17 3 3 3 2 4 4 4 3 3 3 4 3 4 43
18 3 3 3 2 3 3 2 3 3 4 3 3 3 38
19 4 4 4 3 3 4 4 4 3 3 3 3 3 45
20 3 3 3 3 3 3 4 3 2 3 4 2 3 39
21 4 4 4 3 3 4 3 4 3 4 4 4 3 47
22 4 4 4 3 3 3 3 4 3 3 3 3 3 43
23 3 3 3 3 4 4 3 3 3 4 4 4 4 45
24 3 3 3 2 3 3 2 3 3 3 3 3 3 37
25 3 4 3 4 4 4 3 4 3 4 4 3 4 47
26 3 3 3 2 3 3 2 3 3 4 3 3 3 38
27 3 3 3 3 4 3 3 3 4 4 4 4 4 45
28 3 3 3 3 3 2 3 3 3 3 3 3 3 38
29 4 3 4 4 4 4 4 3 3 4 4 3 4 48
30 3 4 3 4 3 3 3 4 3 3 3 4 3 43
31 3 3 3 3 3 4 4 3 3 3 3 3 3 41
32 3 3 3 3 3 4 3 3 4 3 3 3 3 41
33 3 3 3 3 4 4 4 3 3 3 3 3 3 42
34 4 3 4 4 4 3 4 3 3 3 3 4 3 45
35 3 3 3 3 3 3 4 3 3 3 3 3 3 40
36 4 4 4 4 3 3 4 4 4 4 4 4 4 50
37 4 3 4 4 3 4 2 3 3 3 4 3 3 43
38 4 3 4 4 3 3 2 3 3 3 3 3 3 41
39 4 4 4 4 3 3 3 4 3 3 4 3 4 46
40 4 4 4 4 3 3 3 4 3 4 4 3 4 47
41 3 3 3 3 3 4 3 3 3 3 4 3 3 41
42 4 3 4 4 3 3 3 3 4 4 4 4 3 46
43 4 3 4 4 4 4 3 3 4 3 3 3 3 45
44 3 4 3 3 3 3 2 4 3 3 4 3 4 42
45 4 4 4 4 3 4 4 4 3 4 4 4 4 50
Disiplin Kerja (X2)TotalNo. Responden
99
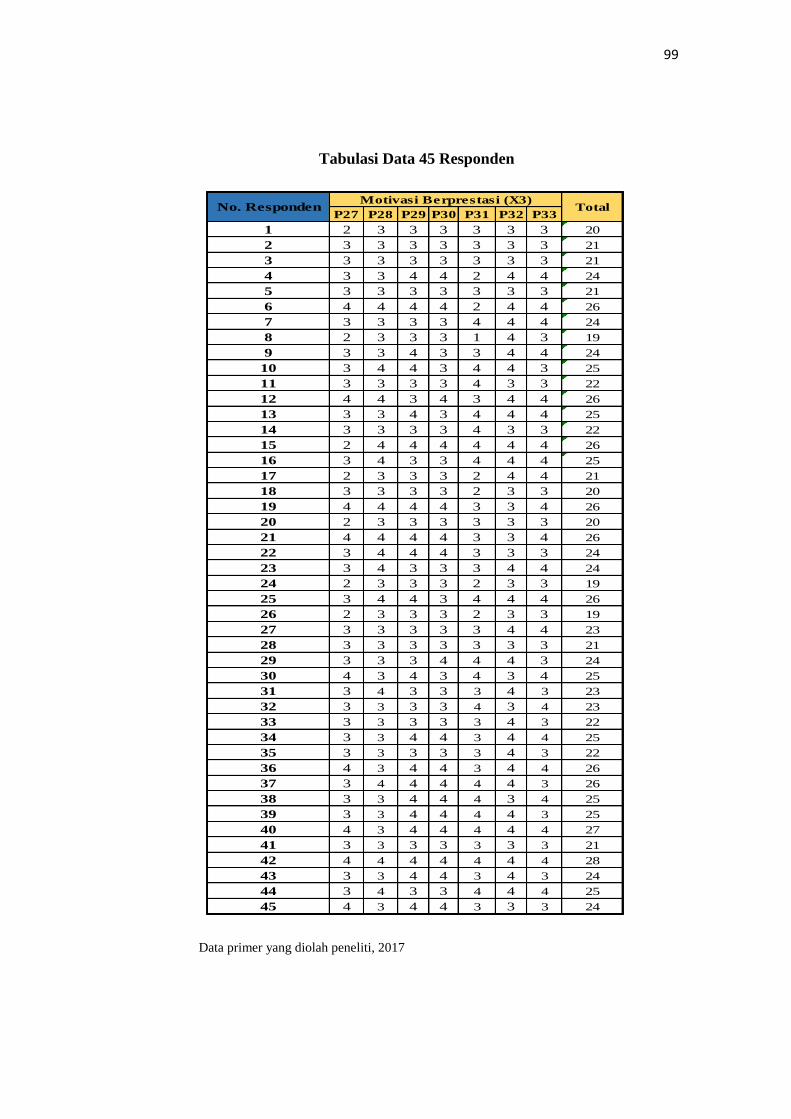
Tabulasi Data 45 Responden
Data primer yang diolah peneliti, 2017
P27 P28 P29 P30 P31 P32 P33
1 2 3 3 3 3 3 3 20
2 3 3 3 3 3 3 3 21
3 3 3 3 3 3 3 3 21
4 3 3 4 4 2 4 4 24
5 3 3 3 3 3 3 3 21
6 4 4 4 4 2 4 4 26
7 3 3 3 3 4 4 4 24
8 2 3 3 3 1 4 3 19
9 3 3 4 3 3 4 4 24
10 3 4 4 3 4 4 3 25
11 3 3 3 3 4 3 3 22
12 4 4 3 4 3 4 4 26
13 3 3 4 3 4 4 4 25
14 3 3 3 3 4 3 3 22
15 2 4 4 4 4 4 4 26
16 3 4 3 3 4 4 4 25
17 2 3 3 3 2 4 4 21
18 3 3 3 3 2 3 3 20
19 4 4 4 4 3 3 4 26
20 2 3 3 3 3 3 3 20
21 4 4 4 4 3 3 4 26
22 3 4 4 4 3 3 3 24
23 3 4 3 3 3 4 4 24
24 2 3 3 3 2 3 3 19
25 3 4 4 3 4 4 4 26
26 2 3 3 3 2 3 3 19
27 3 3 3 3 3 4 4 23
28 3 3 3 3 3 3 3 21
29 3 3 3 4 4 4 3 24
30 4 3 4 3 4 3 4 25
31 3 4 3 3 3 4 3 23
32 3 3 3 3 4 3 4 23
33 3 3 3 3 3 4 3 22
34 3 3 4 4 3 4 4 25
35 3 3 3 3 3 4 3 22
36 4 3 4 4 3 4 4 26
37 3 4 4 4 4 4 3 26
38 3 3 4 4 4 3 4 25
39 3 3 4 4 4 4 3 25
40 4 3 4 4 4 4 4 27
41 3 3 3 3 3 3 3 21
42 4 4 4 4 4 4 4 28
43 3 3 4 4 3 4 3 24
44 3 4 3 3 4 4 4 25
45 4 3 4 4 3 3 3 24
Motivasi Berprestasi (X3)TotalNo. Responden
100
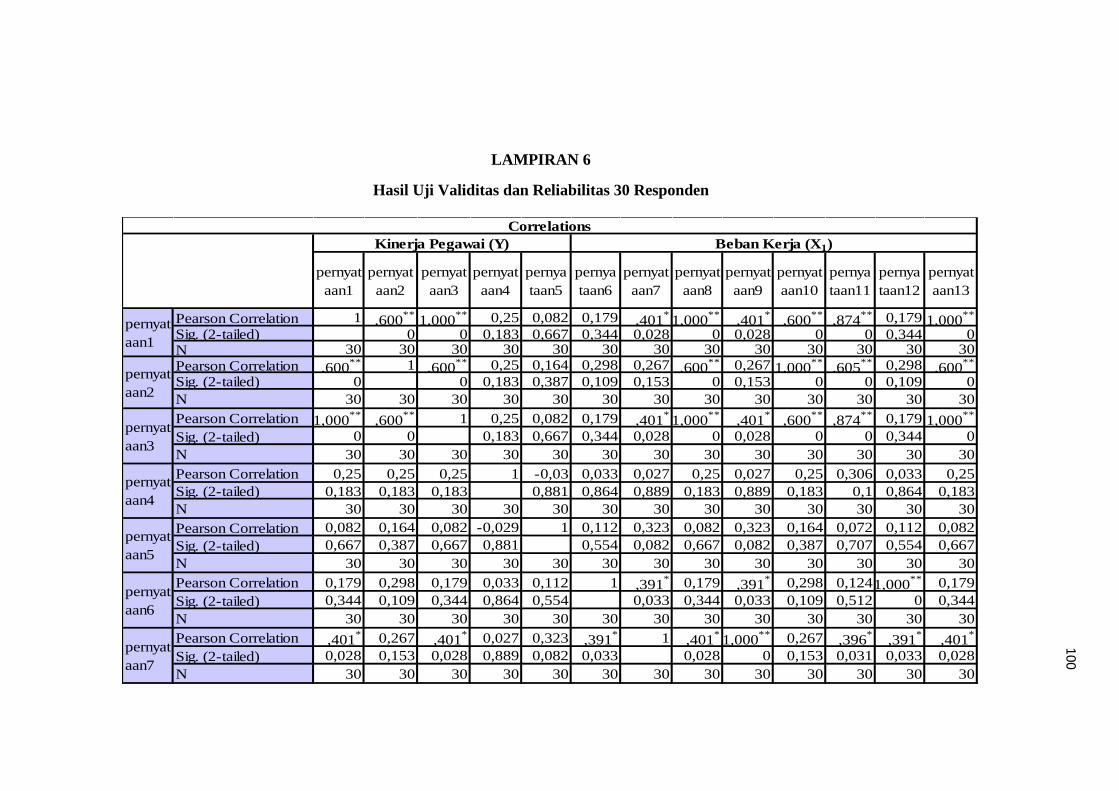
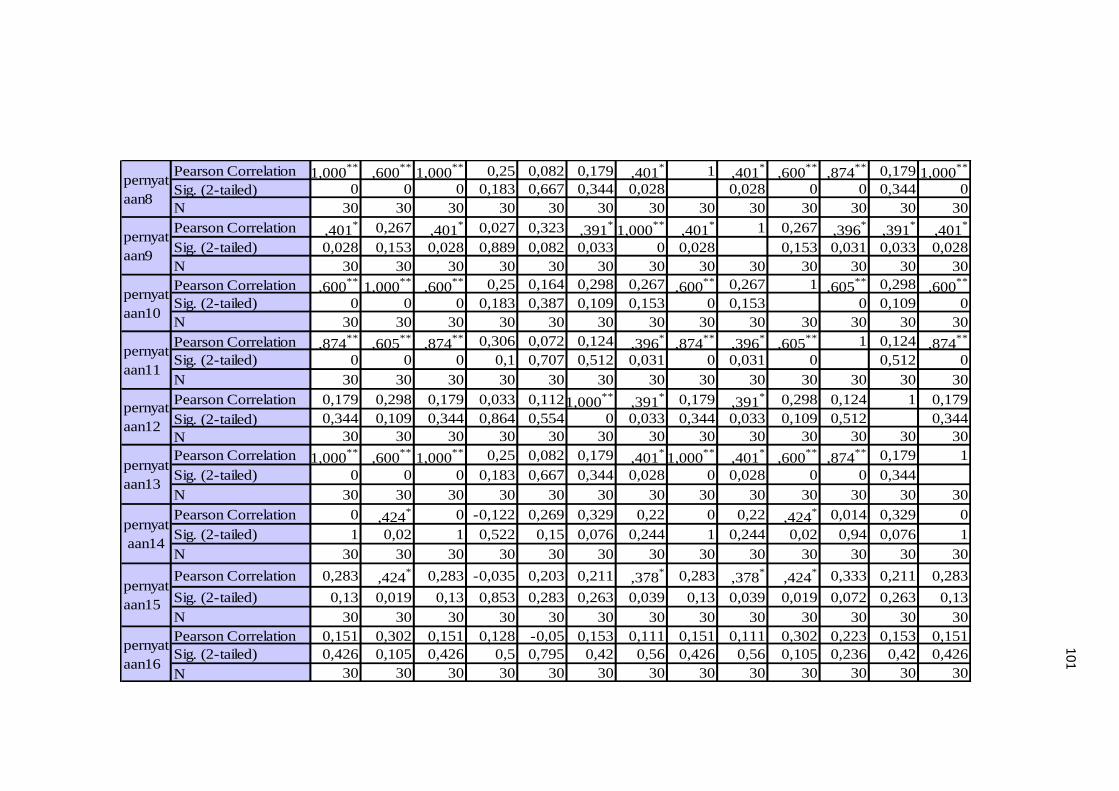
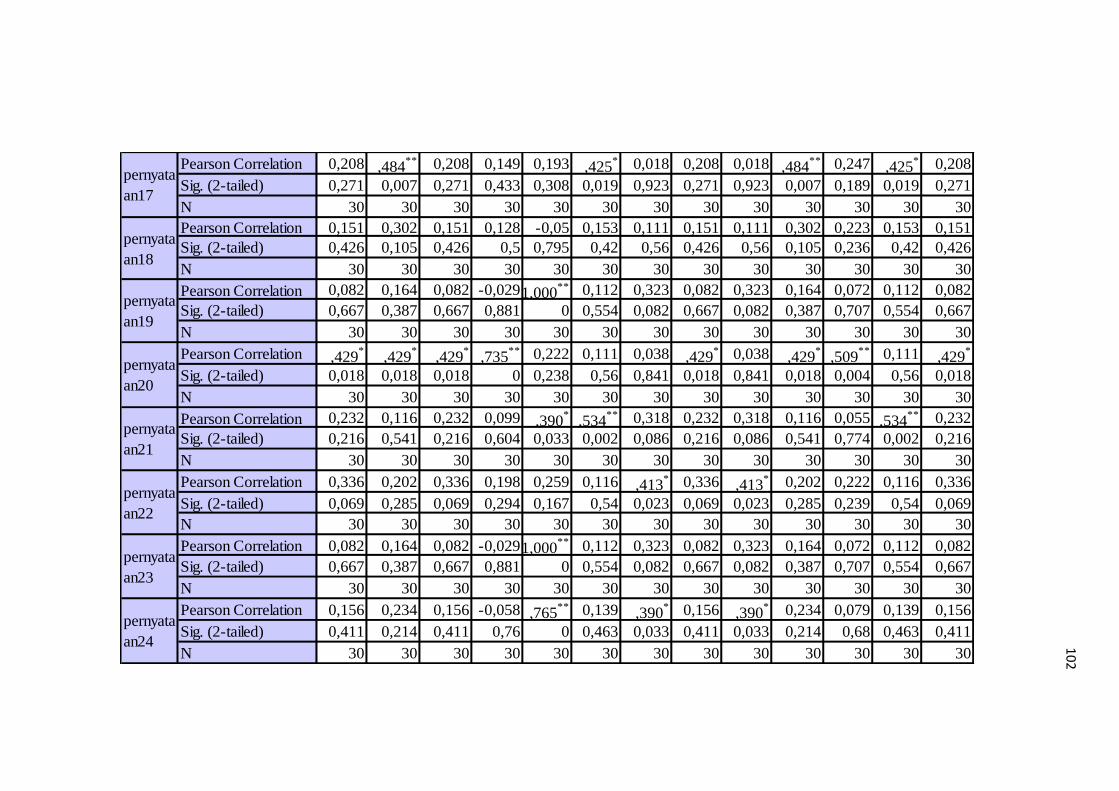
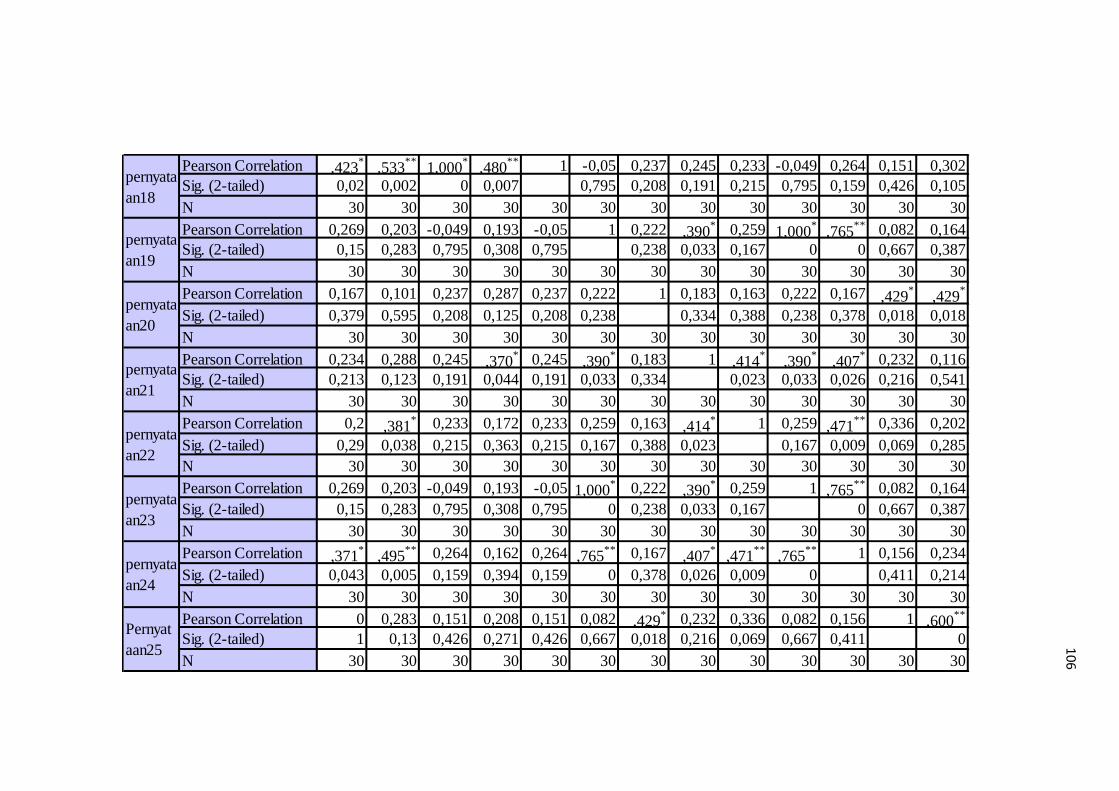
LAMPIRAN 6
Hasil Uji Validitas dan Reliabilitas 30 Responden
pernyat
aan1
pernyat
aan2
pernyat
aan3
pernyat
aan4
pernya
taan5
pernya
taan6
pernyat
aan7
pernyat
aan8
pernyat
aan9
pernyat
aan10
pernya
taan11
pernya
taan12
pernyat
aan13
Pearson Correlation 1 ,600**
1,000** 0,25 0,082 0,179 ,401
*1,000
**,401
*,600
**,874
** 0,179 1,000**
Sig. (2-tailed) 0 0 0,183 0,667 0,344 0,028 0 0,028 0 0 0,344 0N 30 30 30 30 30 30 30 30 30 30 30 30 30
Pearson Correlation ,600** 1 ,600
** 0,25 0,164 0,298 0,267 ,600** 0,267 1,000
**,605
** 0,298 ,600**
Sig. (2-tailed) 0 0 0,183 0,387 0,109 0,153 0 0,153 0 0 0,109 0
N 30 30 30 30 30 30 30 30 30 30 30 30 30
Pearson Correlation 1,000**
,600** 1 0,25 0,082 0,179 ,401
*1,000
**,401
*,600
**,874
** 0,179 1,000**
Sig. (2-tailed) 0 0 0,183 0,667 0,344 0,028 0 0,028 0 0 0,344 0
N 30 30 30 30 30 30 30 30 30 30 30 30 30
Pearson Correlation 0,25 0,25 0,25 1 -0,03 0,033 0,027 0,25 0,027 0,25 0,306 0,033 0,25
Sig. (2-tailed) 0,183 0,183 0,183 0,881 0,864 0,889 0,183 0,889 0,183 0,1 0,864 0,183
N 30 30 30 30 30 30 30 30 30 30 30 30 30
Pearson Correlation 0,082 0,164 0,082 -0,029 1 0,112 0,323 0,082 0,323 0,164 0,072 0,112 0,082
Sig. (2-tailed) 0,667 0,387 0,667 0,881 0,554 0,082 0,667 0,082 0,387 0,707 0,554 0,667
N 30 30 30 30 30 30 30 30 30 30 30 30 30
Pearson Correlation 0,179 0,298 0,179 0,033 0,112 1 ,391* 0,179 ,391
* 0,298 0,1241,000** 0,179
Sig. (2-tailed) 0,344 0,109 0,344 0,864 0,554 0,033 0,344 0,033 0,109 0,512 0 0,344
N 30 30 30 30 30 30 30 30 30 30 30 30 30
Pearson Correlation ,401* 0,267 ,401
* 0,027 0,323 ,391* 1 ,401
*1,000
** 0,267 ,396*
,391*
,401*
Sig. (2-tailed) 0,028 0,153 0,028 0,889 0,082 0,033 0,028 0 0,153 0,031 0,033 0,028
N 30 30 30 30 30 30 30 30 30 30 30 30 30
pernyat
aan3
pernyat
aan4
pernyat
aan5
pernyat
aan6
pernyat
aan7
Correlations
Kinerja Pegawai (Y) Beban Kerja (X1)
pernyat
aan1
pernyat
aan2
101
Pearson Correlation 1,000**
,600**
1,000** 0,25 0,082 0,179 ,401
* 1 ,401*
,600**
,874** 0,179 1,000
**
Sig. (2-tailed) 0 0 0 0,183 0,667 0,344 0,028 0,028 0 0 0,344 0
N 30 30 30 30 30 30 30 30 30 30 30 30 30
Pearson Correlation ,401* 0,267 ,401
* 0,027 0,323 ,391*
1,000**
,401* 1 0,267 ,396
*,391
*,401
*
Sig. (2-tailed) 0,028 0,153 0,028 0,889 0,082 0,033 0 0,028 0,153 0,031 0,033 0,028
N 30 30 30 30 30 30 30 30 30 30 30 30 30
Pearson Correlation ,600**
1,000**
,600** 0,25 0,164 0,298 0,267 ,600
** 0,267 1 ,605** 0,298 ,600
**
Sig. (2-tailed) 0 0 0 0,183 0,387 0,109 0,153 0 0,153 0 0,109 0
N 30 30 30 30 30 30 30 30 30 30 30 30 30
Pearson Correlation ,874**
,605**
,874** 0,306 0,072 0,124 ,396
*,874
**,396
*,605
** 1 0,124 ,874**
Sig. (2-tailed) 0 0 0 0,1 0,707 0,512 0,031 0 0,031 0 0,512 0
N 30 30 30 30 30 30 30 30 30 30 30 30 30
Pearson Correlation 0,179 0,298 0,179 0,033 0,1121,000**
,391* 0,179 ,391
* 0,298 0,124 1 0,179
Sig. (2-tailed) 0,344 0,109 0,344 0,864 0,554 0 0,033 0,344 0,033 0,109 0,512 0,344
N 30 30 30 30 30 30 30 30 30 30 30 30 30
Pearson Correlation 1,000**
,600**
1,000** 0,25 0,082 0,179 ,401
*1,000
**,401
*,600
**,874
** 0,179 1
Sig. (2-tailed) 0 0 0 0,183 0,667 0,344 0,028 0 0,028 0 0 0,344
N 30 30 30 30 30 30 30 30 30 30 30 30 30
Pearson Correlation 0 ,424* 0 -0,122 0,269 0,329 0,22 0 0,22 ,424
* 0,014 0,329 0
Sig. (2-tailed) 1 0,02 1 0,522 0,15 0,076 0,244 1 0,244 0,02 0,94 0,076 1
N 30 30 30 30 30 30 30 30 30 30 30 30 30
Pearson Correlation 0,283 ,424* 0,283 -0,035 0,203 0,211 ,378
* 0,283 ,378*
,424* 0,333 0,211 0,283
Sig. (2-tailed) 0,13 0,019 0,13 0,853 0,283 0,263 0,039 0,13 0,039 0,019 0,072 0,263 0,13
N 30 30 30 30 30 30 30 30 30 30 30 30 30
Pearson Correlation 0,151 0,302 0,151 0,128 -0,05 0,153 0,111 0,151 0,111 0,302 0,223 0,153 0,151
Sig. (2-tailed) 0,426 0,105 0,426 0,5 0,795 0,42 0,56 0,426 0,56 0,105 0,236 0,42 0,426
N 30 30 30 30 30 30 30 30 30 30 30 30 30
pernyat
aan14
pernyat
aan15
pernyat
aan16
pernyat
aan9
pernyat
aan10
pernyat
aan11
pernyat
aan12
pernyat
aan13
pernyat
aan8
102
Pearson Correlation 0,208 ,484** 0,208 0,149 0,193 ,425
* 0,018 0,208 0,018 ,484** 0,247 ,425
* 0,208
Sig. (2-tailed) 0,271 0,007 0,271 0,433 0,308 0,019 0,923 0,271 0,923 0,007 0,189 0,019 0,271
N 30 30 30 30 30 30 30 30 30 30 30 30 30
Pearson Correlation 0,151 0,302 0,151 0,128 -0,05 0,153 0,111 0,151 0,111 0,302 0,223 0,153 0,151
Sig. (2-tailed) 0,426 0,105 0,426 0,5 0,795 0,42 0,56 0,426 0,56 0,105 0,236 0,42 0,426
N 30 30 30 30 30 30 30 30 30 30 30 30 30
Pearson Correlation 0,082 0,164 0,082 -0,0291,000** 0,112 0,323 0,082 0,323 0,164 0,072 0,112 0,082
Sig. (2-tailed) 0,667 0,387 0,667 0,881 0 0,554 0,082 0,667 0,082 0,387 0,707 0,554 0,667
N 30 30 30 30 30 30 30 30 30 30 30 30 30
Pearson Correlation ,429*
,429*
,429*
,735** 0,222 0,111 0,038 ,429
* 0,038 ,429*
,509** 0,111 ,429
*
Sig. (2-tailed) 0,018 0,018 0,018 0 0,238 0,56 0,841 0,018 0,841 0,018 0,004 0,56 0,018
N 30 30 30 30 30 30 30 30 30 30 30 30 30
Pearson Correlation 0,232 0,116 0,232 0,099 ,390*
,534** 0,318 0,232 0,318 0,116 0,055 ,534
** 0,232
Sig. (2-tailed) 0,216 0,541 0,216 0,604 0,033 0,002 0,086 0,216 0,086 0,541 0,774 0,002 0,216
N 30 30 30 30 30 30 30 30 30 30 30 30 30
Pearson Correlation 0,336 0,202 0,336 0,198 0,259 0,116 ,413* 0,336 ,413
* 0,202 0,222 0,116 0,336
Sig. (2-tailed) 0,069 0,285 0,069 0,294 0,167 0,54 0,023 0,069 0,023 0,285 0,239 0,54 0,069
N 30 30 30 30 30 30 30 30 30 30 30 30 30
Pearson Correlation 0,082 0,164 0,082 -0,0291,000** 0,112 0,323 0,082 0,323 0,164 0,072 0,112 0,082
Sig. (2-tailed) 0,667 0,387 0,667 0,881 0 0,554 0,082 0,667 0,082 0,387 0,707 0,554 0,667
N 30 30 30 30 30 30 30 30 30 30 30 30 30
Pearson Correlation 0,156 0,234 0,156 -0,058 ,765** 0,139 ,390
* 0,156 ,390* 0,234 0,079 0,139 0,156
Sig. (2-tailed) 0,411 0,214 0,411 0,76 0 0,463 0,033 0,411 0,033 0,214 0,68 0,463 0,411
N 30 30 30 30 30 30 30 30 30 30 30 30 30
pernyata
an22
pernyata
an23
pernyata
an24
pernyata
an17
pernyata
an18
pernyata
an19
pernyata
an20
pernyata
an21
103
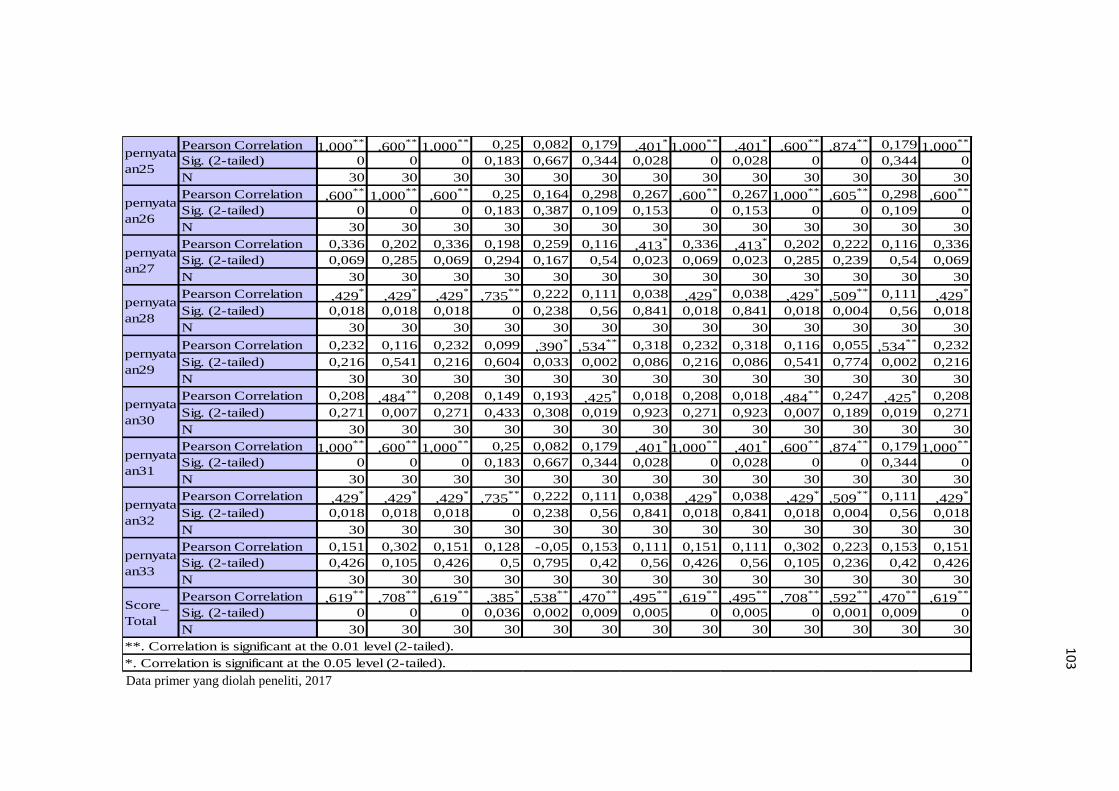
Data primer yang diolah peneliti, 2017
Pearson Correlation 1,000**
,600**
1,000** 0,25 0,082 0,179 ,401
*1,000
**,401
*,600
**,874
** 0,179 1,000**
Sig. (2-tailed) 0 0 0 0,183 0,667 0,344 0,028 0 0,028 0 0 0,344 0
N 30 30 30 30 30 30 30 30 30 30 30 30 30
Pearson Correlation ,600**
1,000**
,600** 0,25 0,164 0,298 0,267 ,600
** 0,267 1,000**
,605** 0,298 ,600
**
Sig. (2-tailed) 0 0 0 0,183 0,387 0,109 0,153 0 0,153 0 0 0,109 0
N 30 30 30 30 30 30 30 30 30 30 30 30 30
Pearson Correlation 0,336 0,202 0,336 0,198 0,259 0,116 ,413* 0,336 ,413
* 0,202 0,222 0,116 0,336
Sig. (2-tailed) 0,069 0,285 0,069 0,294 0,167 0,54 0,023 0,069 0,023 0,285 0,239 0,54 0,069
N 30 30 30 30 30 30 30 30 30 30 30 30 30
Pearson Correlation ,429*
,429*
,429*
,735** 0,222 0,111 0,038 ,429
* 0,038 ,429*
,509** 0,111 ,429
*
Sig. (2-tailed) 0,018 0,018 0,018 0 0,238 0,56 0,841 0,018 0,841 0,018 0,004 0,56 0,018
N 30 30 30 30 30 30 30 30 30 30 30 30 30
Pearson Correlation 0,232 0,116 0,232 0,099 ,390*
,534** 0,318 0,232 0,318 0,116 0,055 ,534
** 0,232
Sig. (2-tailed) 0,216 0,541 0,216 0,604 0,033 0,002 0,086 0,216 0,086 0,541 0,774 0,002 0,216
N 30 30 30 30 30 30 30 30 30 30 30 30 30
Pearson Correlation 0,208 ,484** 0,208 0,149 0,193 ,425
* 0,018 0,208 0,018 ,484** 0,247 ,425
* 0,208
Sig. (2-tailed) 0,271 0,007 0,271 0,433 0,308 0,019 0,923 0,271 0,923 0,007 0,189 0,019 0,271
N 30 30 30 30 30 30 30 30 30 30 30 30 30
Pearson Correlation 1,000**
,600**
1,000** 0,25 0,082 0,179 ,401
*1,000
**,401
*,600
**,874
** 0,179 1,000**
Sig. (2-tailed) 0 0 0 0,183 0,667 0,344 0,028 0 0,028 0 0 0,344 0
N 30 30 30 30 30 30 30 30 30 30 30 30 30
Pearson Correlation ,429*
,429*
,429*
,735** 0,222 0,111 0,038 ,429
* 0,038 ,429*
,509** 0,111 ,429
*
Sig. (2-tailed) 0,018 0,018 0,018 0 0,238 0,56 0,841 0,018 0,841 0,018 0,004 0,56 0,018
N 30 30 30 30 30 30 30 30 30 30 30 30 30
Pearson Correlation 0,151 0,302 0,151 0,128 -0,05 0,153 0,111 0,151 0,111 0,302 0,223 0,153 0,151
Sig. (2-tailed) 0,426 0,105 0,426 0,5 0,795 0,42 0,56 0,426 0,56 0,105 0,236 0,42 0,426
N 30 30 30 30 30 30 30 30 30 30 30 30 30
Pearson Correlation ,619**
,708**
,619**
,385*
,538**
,470**
,495**
,619**
,495**
,708**
,592**
,470**
,619**
Sig. (2-tailed) 0 0 0 0,036 0,002 0,009 0,005 0 0,005 0 0,001 0,009 0
N 30 30 30 30 30 30 30 30 30 30 30 30 30
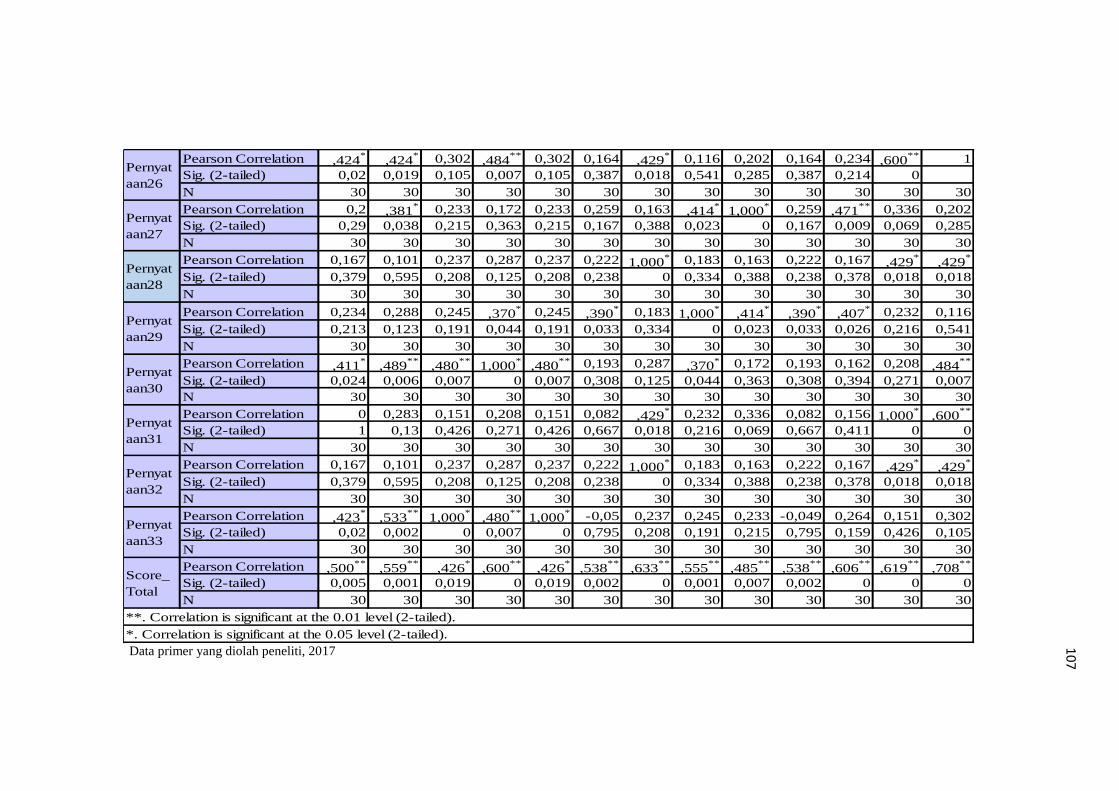
**. Correlation is significant at the 0.01 level (2-tailed).
*. Correlation is significant at the 0.05 level (2-tailed).
pernyata
an29
pernyata
an30
pernyata
an31
pernyata
an32
pernyata
an33
Score_
Total
pernyata
an25
pernyata
an26
pernyata
an27
pernyata
an28
104
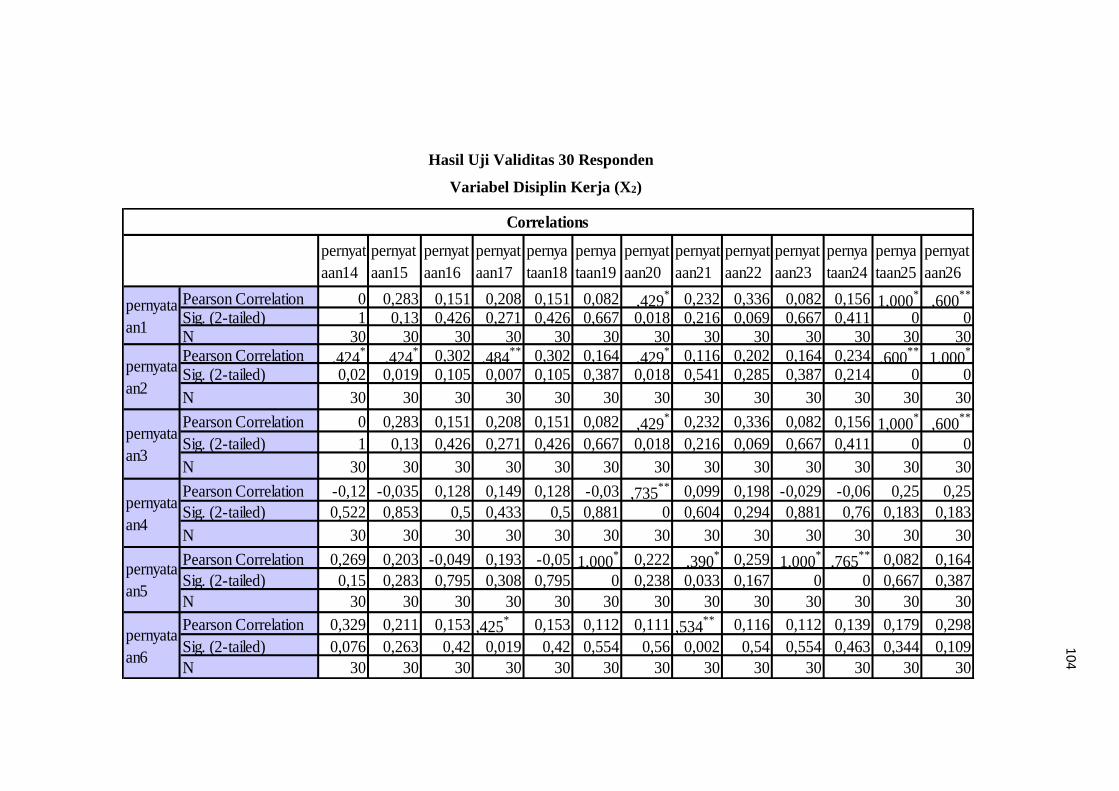
Hasil Uji Validitas 30 Responden
Variabel Disiplin Kerja (X2)
pernyat
aan14
pernyat
aan15
pernyat
aan16
pernyat
aan17
pernya
taan18
pernya
taan19
pernyat
aan20
pernyat
aan21
pernyat
aan22
pernyat
aan23
pernya
taan24
pernya
taan25
pernyat
aan26
Pearson Correlation 0 0,283 0,151 0,208 0,151 0,082 ,429* 0,232 0,336 0,082 0,156 1,000
*,600
**
Sig. (2-tailed) 1 0,13 0,426 0,271 0,426 0,667 0,018 0,216 0,069 0,667 0,411 0 0N 30 30 30 30 30 30 30 30 30 30 30 30 30Pearson Correlation ,424
*,424
* 0,302 ,484** 0,302 0,164 ,429
* 0,116 0,202 0,164 0,234 ,600**
1,000*
Sig. (2-tailed) 0,02 0,019 0,105 0,007 0,105 0,387 0,018 0,541 0,285 0,387 0,214 0 0
N 30 30 30 30 30 30 30 30 30 30 30 30 30
Pearson Correlation 0 0,283 0,151 0,208 0,151 0,082 ,429* 0,232 0,336 0,082 0,156 1,000
*,600
**
Sig. (2-tailed) 1 0,13 0,426 0,271 0,426 0,667 0,018 0,216 0,069 0,667 0,411 0 0
N 30 30 30 30 30 30 30 30 30 30 30 30 30
Pearson Correlation -0,12 -0,035 0,128 0,149 0,128 -0,03 ,735** 0,099 0,198 -0,029 -0,06 0,25 0,25
Sig. (2-tailed) 0,522 0,853 0,5 0,433 0,5 0,881 0 0,604 0,294 0,881 0,76 0,183 0,183
N 30 30 30 30 30 30 30 30 30 30 30 30 30
Pearson Correlation 0,269 0,203 -0,049 0,193 -0,05 1,000* 0,222 ,390
* 0,259 1,000*
,765** 0,082 0,164
Sig. (2-tailed) 0,15 0,283 0,795 0,308 0,795 0 0,238 0,033 0,167 0 0 0,667 0,387
N 30 30 30 30 30 30 30 30 30 30 30 30 30
Pearson Correlation 0,329 0,211 0,153 ,425* 0,153 0,112 0,111 ,534
** 0,116 0,112 0,139 0,179 0,298
Sig. (2-tailed) 0,076 0,263 0,42 0,019 0,42 0,554 0,56 0,002 0,54 0,554 0,463 0,344 0,109
N 30 30 30 30 30 30 30 30 30 30 30 30 30
Correlations
pernyata
an1
pernyata
an2
pernyata
an3
pernyata
an4
pernyata
an5
pernyata
an6
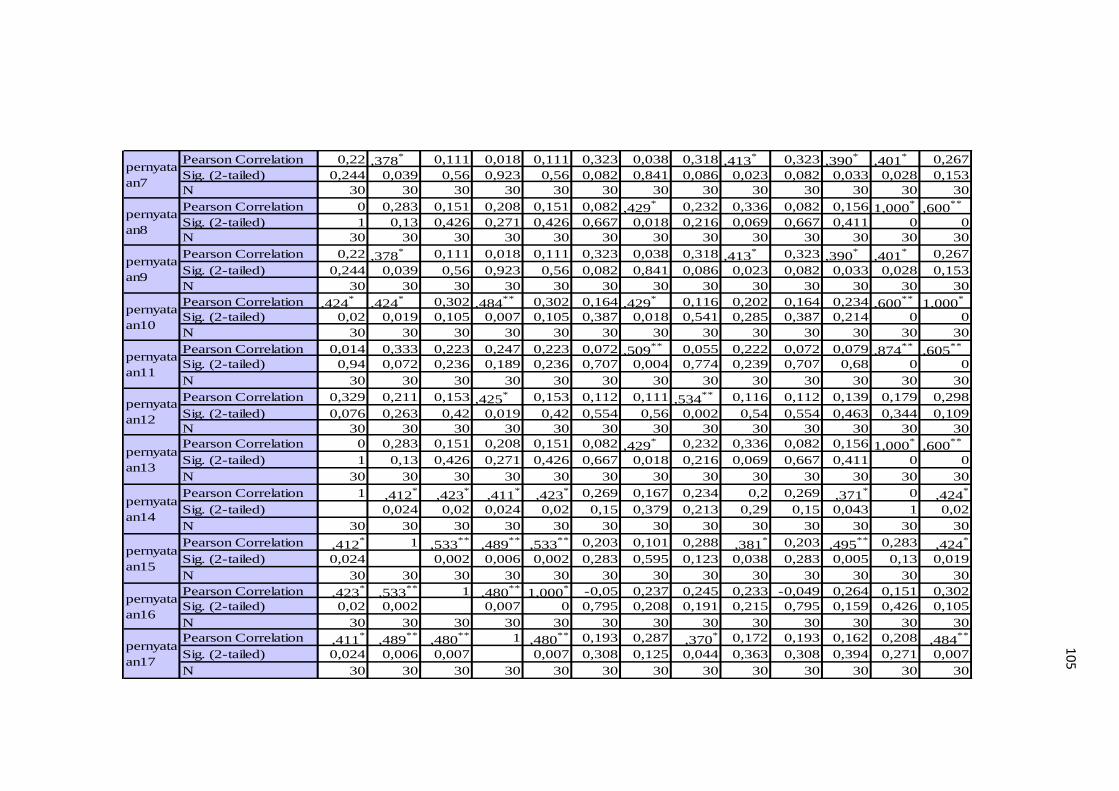
105
Pearson Correlation 0,22 ,378* 0,111 0,018 0,111 0,323 0,038 0,318 ,413
* 0,323 ,390*
,401* 0,267
Sig. (2-tailed) 0,244 0,039 0,56 0,923 0,56 0,082 0,841 0,086 0,023 0,082 0,033 0,028 0,153
N 30 30 30 30 30 30 30 30 30 30 30 30 30
Pearson Correlation 0 0,283 0,151 0,208 0,151 0,082 ,429* 0,232 0,336 0,082 0,156 1,000
*,600
**
Sig. (2-tailed) 1 0,13 0,426 0,271 0,426 0,667 0,018 0,216 0,069 0,667 0,411 0 0
N 30 30 30 30 30 30 30 30 30 30 30 30 30
Pearson Correlation 0,22 ,378* 0,111 0,018 0,111 0,323 0,038 0,318 ,413
* 0,323 ,390*
,401* 0,267
Sig. (2-tailed) 0,244 0,039 0,56 0,923 0,56 0,082 0,841 0,086 0,023 0,082 0,033 0,028 0,153
N 30 30 30 30 30 30 30 30 30 30 30 30 30
Pearson Correlation ,424*
,424* 0,302 ,484
** 0,302 0,164 ,429* 0,116 0,202 0,164 0,234 ,600
**1,000
*
Sig. (2-tailed) 0,02 0,019 0,105 0,007 0,105 0,387 0,018 0,541 0,285 0,387 0,214 0 0
N 30 30 30 30 30 30 30 30 30 30 30 30 30
Pearson Correlation 0,014 0,333 0,223 0,247 0,223 0,072 ,509** 0,055 0,222 0,072 0,079 ,874
**,605
**
Sig. (2-tailed) 0,94 0,072 0,236 0,189 0,236 0,707 0,004 0,774 0,239 0,707 0,68 0 0
N 30 30 30 30 30 30 30 30 30 30 30 30 30
Pearson Correlation 0,329 0,211 0,153 ,425* 0,153 0,112 0,111 ,534
** 0,116 0,112 0,139 0,179 0,298
Sig. (2-tailed) 0,076 0,263 0,42 0,019 0,42 0,554 0,56 0,002 0,54 0,554 0,463 0,344 0,109
N 30 30 30 30 30 30 30 30 30 30 30 30 30
Pearson Correlation 0 0,283 0,151 0,208 0,151 0,082 ,429* 0,232 0,336 0,082 0,156 1,000
*,600
**
Sig. (2-tailed) 1 0,13 0,426 0,271 0,426 0,667 0,018 0,216 0,069 0,667 0,411 0 0
N 30 30 30 30 30 30 30 30 30 30 30 30 30
Pearson Correlation 1 ,412*
,423*
,411*
,423* 0,269 0,167 0,234 0,2 0,269 ,371
* 0 ,424*
Sig. (2-tailed) 0,024 0,02 0,024 0,02 0,15 0,379 0,213 0,29 0,15 0,043 1 0,02
N 30 30 30 30 30 30 30 30 30 30 30 30 30
Pearson Correlation ,412* 1 ,533
**,489
**,533
** 0,203 0,101 0,288 ,381* 0,203 ,495
** 0,283 ,424*
Sig. (2-tailed) 0,024 0,002 0,006 0,002 0,283 0,595 0,123 0,038 0,283 0,005 0,13 0,019
N 30 30 30 30 30 30 30 30 30 30 30 30 30
Pearson Correlation ,423*
,533** 1 ,480
**1,000
* -0,05 0,237 0,245 0,233 -0,049 0,264 0,151 0,302
Sig. (2-tailed) 0,02 0,002 0,007 0 0,795 0,208 0,191 0,215 0,795 0,159 0,426 0,105
N 30 30 30 30 30 30 30 30 30 30 30 30 30
Pearson Correlation ,411*
,489**
,480** 1 ,480
** 0,193 0,287 ,370* 0,172 0,193 0,162 0,208 ,484
**
Sig. (2-tailed) 0,024 0,006 0,007 0,007 0,308 0,125 0,044 0,363 0,308 0,394 0,271 0,007
N 30 30 30 30 30 30 30 30 30 30 30 30 30
pernyata
an14
pernyata
an15
pernyata
an16
pernyata
an17
pernyata
an9
pernyata
an10
pernyata
an11
pernyata
an12
pernyata
an13
pernyata
an7
pernyata
an8
106
Pearson Correlation ,423*
,533**
1,000*
,480** 1 -0,05 0,237 0,245 0,233 -0,049 0,264 0,151 0,302
Sig. (2-tailed) 0,02 0,002 0 0,007 0,795 0,208 0,191 0,215 0,795 0,159 0,426 0,105
N 30 30 30 30 30 30 30 30 30 30 30 30 30
Pearson Correlation 0,269 0,203 -0,049 0,193 -0,05 1 0,222 ,390* 0,259 1,000
*,765
** 0,082 0,164
Sig. (2-tailed) 0,15 0,283 0,795 0,308 0,795 0,238 0,033 0,167 0 0 0,667 0,387
N 30 30 30 30 30 30 30 30 30 30 30 30 30
Pearson Correlation 0,167 0,101 0,237 0,287 0,237 0,222 1 0,183 0,163 0,222 0,167 ,429*
,429*
Sig. (2-tailed) 0,379 0,595 0,208 0,125 0,208 0,238 0,334 0,388 0,238 0,378 0,018 0,018
N 30 30 30 30 30 30 30 30 30 30 30 30 30
Pearson Correlation 0,234 0,288 0,245 ,370* 0,245 ,390
* 0,183 1 ,414*
,390*
,407* 0,232 0,116
Sig. (2-tailed) 0,213 0,123 0,191 0,044 0,191 0,033 0,334 0,023 0,033 0,026 0,216 0,541
N 30 30 30 30 30 30 30 30 30 30 30 30 30
Pearson Correlation 0,2 ,381* 0,233 0,172 0,233 0,259 0,163 ,414
* 1 0,259 ,471** 0,336 0,202
Sig. (2-tailed) 0,29 0,038 0,215 0,363 0,215 0,167 0,388 0,023 0,167 0,009 0,069 0,285
N 30 30 30 30 30 30 30 30 30 30 30 30 30
Pearson Correlation 0,269 0,203 -0,049 0,193 -0,05 1,000* 0,222 ,390
* 0,259 1 ,765** 0,082 0,164
Sig. (2-tailed) 0,15 0,283 0,795 0,308 0,795 0 0,238 0,033 0,167 0 0,667 0,387
N 30 30 30 30 30 30 30 30 30 30 30 30 30
Pearson Correlation ,371*
,495** 0,264 0,162 0,264 ,765
** 0,167 ,407*
,471**
,765** 1 0,156 0,234
Sig. (2-tailed) 0,043 0,005 0,159 0,394 0,159 0 0,378 0,026 0,009 0 0,411 0,214
N 30 30 30 30 30 30 30 30 30 30 30 30 30
Pearson Correlation 0 0,283 0,151 0,208 0,151 0,082 ,429* 0,232 0,336 0,082 0,156 1 ,600
**
Sig. (2-tailed) 1 0,13 0,426 0,271 0,426 0,667 0,018 0,216 0,069 0,667 0,411 0
N 30 30 30 30 30 30 30 30 30 30 30 30 30
pernyata
an22
pernyata
an23
pernyata
an24
Pernyat
aan25
pernyata
an18
pernyata
an19
pernyata
an20
pernyata
an21
107
Data primer yang diolah peneliti, 2017
Pearson Correlation ,424*
,424* 0,302 ,484
** 0,302 0,164 ,429* 0,116 0,202 0,164 0,234 ,600
** 1
Sig. (2-tailed) 0,02 0,019 0,105 0,007 0,105 0,387 0,018 0,541 0,285 0,387 0,214 0
N 30 30 30 30 30 30 30 30 30 30 30 30 30
Pearson Correlation 0,2 ,381* 0,233 0,172 0,233 0,259 0,163 ,414
*1,000
* 0,259 ,471** 0,336 0,202
Sig. (2-tailed) 0,29 0,038 0,215 0,363 0,215 0,167 0,388 0,023 0 0,167 0,009 0,069 0,285
N 30 30 30 30 30 30 30 30 30 30 30 30 30
Pearson Correlation 0,167 0,101 0,237 0,287 0,237 0,222 1,000* 0,183 0,163 0,222 0,167 ,429
*,429
*
Sig. (2-tailed) 0,379 0,595 0,208 0,125 0,208 0,238 0 0,334 0,388 0,238 0,378 0,018 0,018
N 30 30 30 30 30 30 30 30 30 30 30 30 30
Pearson Correlation 0,234 0,288 0,245 ,370* 0,245 ,390
* 0,183 1,000*
,414*
,390*
,407* 0,232 0,116
Sig. (2-tailed) 0,213 0,123 0,191 0,044 0,191 0,033 0,334 0 0,023 0,033 0,026 0,216 0,541
N 30 30 30 30 30 30 30 30 30 30 30 30 30
Pearson Correlation ,411*
,489**
,480**
1,000*
,480** 0,193 0,287 ,370
* 0,172 0,193 0,162 0,208 ,484**
Sig. (2-tailed) 0,024 0,006 0,007 0 0,007 0,308 0,125 0,044 0,363 0,308 0,394 0,271 0,007
N 30 30 30 30 30 30 30 30 30 30 30 30 30
Pearson Correlation 0 0,283 0,151 0,208 0,151 0,082 ,429* 0,232 0,336 0,082 0,156 1,000
*,600
**
Sig. (2-tailed) 1 0,13 0,426 0,271 0,426 0,667 0,018 0,216 0,069 0,667 0,411 0 0
N 30 30 30 30 30 30 30 30 30 30 30 30 30
Pearson Correlation 0,167 0,101 0,237 0,287 0,237 0,222 1,000* 0,183 0,163 0,222 0,167 ,429
*,429
*
Sig. (2-tailed) 0,379 0,595 0,208 0,125 0,208 0,238 0 0,334 0,388 0,238 0,378 0,018 0,018
N 30 30 30 30 30 30 30 30 30 30 30 30 30
Pearson Correlation ,423*
,533**
1,000*
,480**
1,000* -0,05 0,237 0,245 0,233 -0,049 0,264 0,151 0,302
Sig. (2-tailed) 0,02 0,002 0 0,007 0 0,795 0,208 0,191 0,215 0,795 0,159 0,426 0,105
N 30 30 30 30 30 30 30 30 30 30 30 30 30
Pearson Correlation ,500**
,559**
,426*
,600**
,426*
,538**
,633**
,555**
,485**
,538**
,606**
,619**
,708**
Sig. (2-tailed) 0,005 0,001 0,019 0 0,019 0,002 0 0,001 0,007 0,002 0 0 0
N 30 30 30 30 30 30 30 30 30 30 30 30 30
**. Correlation is significant at the 0.01 level (2-tailed).
*. Correlation is significant at the 0.05 level (2-tailed).
Pernyat
aan29
Pernyat
aan30
Pernyat
aan31
Pernyat
aan32
Pernyat
aan33
Score_
Total
Pernyat
aan26
Pernyat
aan27
Pernyat
aan28
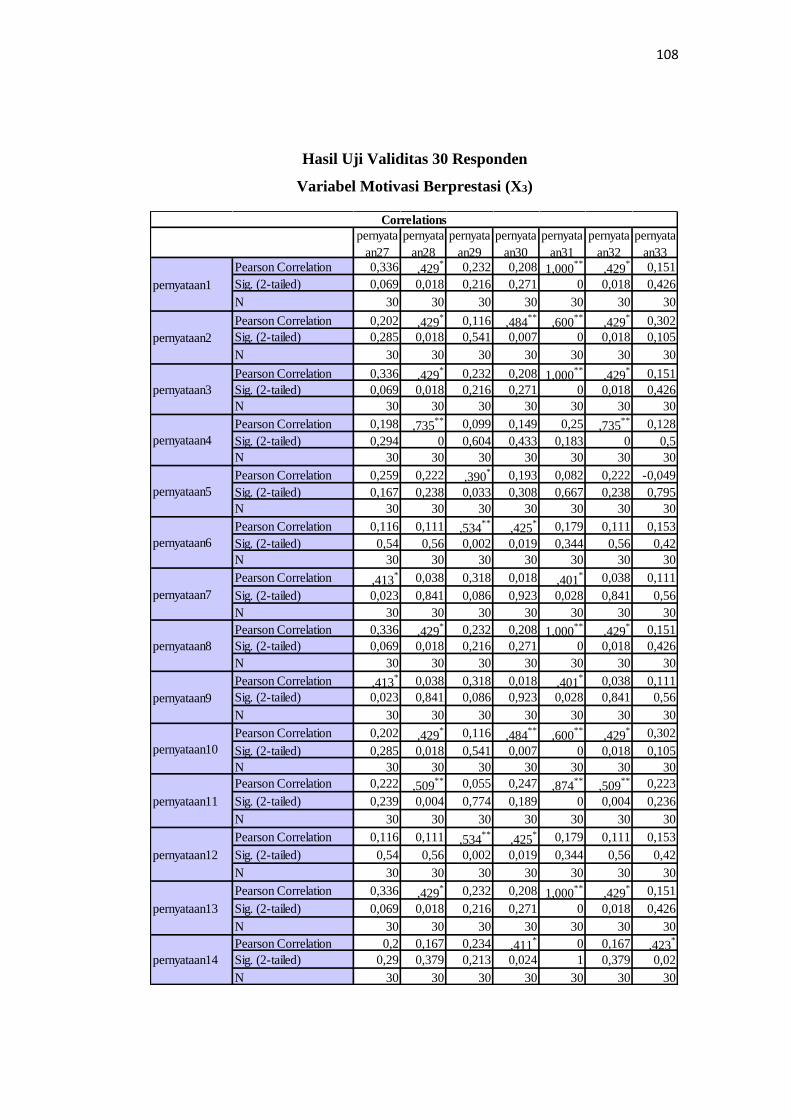
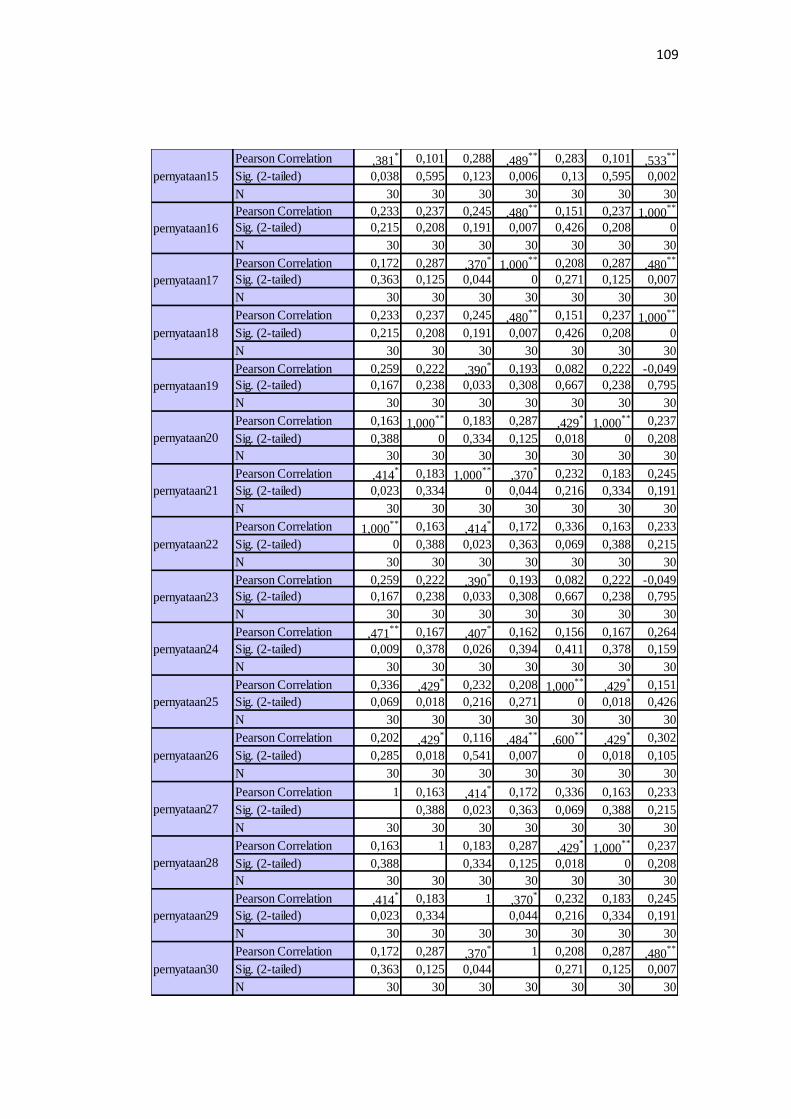
108
Hasil Uji Validitas 30 Responden
Variabel Motivasi Berprestasi (X3)
pernyata
an27
pernyata
an28
pernyata
an29
pernyata
an30
pernyata
an31
pernyata
an32
pernyata
an33Pearson Correlation 0,336 ,429
* 0,232 0,208 1,000**
,429* 0,151
Sig. (2-tailed) 0,069 0,018 0,216 0,271 0 0,018 0,426
N 30 30 30 30 30 30 30
Pearson Correlation 0,202 ,429* 0,116 ,484
**,600
**,429
* 0,302
Sig. (2-tailed) 0,285 0,018 0,541 0,007 0 0,018 0,105
N 30 30 30 30 30 30 30
Pearson Correlation 0,336 ,429* 0,232 0,208 1,000
**,429
* 0,151
Sig. (2-tailed) 0,069 0,018 0,216 0,271 0 0,018 0,426
N 30 30 30 30 30 30 30
Pearson Correlation 0,198 ,735** 0,099 0,149 0,25 ,735
** 0,128
Sig. (2-tailed) 0,294 0 0,604 0,433 0,183 0 0,5
N 30 30 30 30 30 30 30
Pearson Correlation 0,259 0,222 ,390* 0,193 0,082 0,222 -0,049
Sig. (2-tailed) 0,167 0,238 0,033 0,308 0,667 0,238 0,795
N 30 30 30 30 30 30 30
Pearson Correlation 0,116 0,111 ,534**
,425* 0,179 0,111 0,153
Sig. (2-tailed) 0,54 0,56 0,002 0,019 0,344 0,56 0,42
N 30 30 30 30 30 30 30
Pearson Correlation ,413* 0,038 0,318 0,018 ,401
* 0,038 0,111
Sig. (2-tailed) 0,023 0,841 0,086 0,923 0,028 0,841 0,56
N 30 30 30 30 30 30 30
Pearson Correlation 0,336 ,429* 0,232 0,208 1,000
**,429
* 0,151
Sig. (2-tailed) 0,069 0,018 0,216 0,271 0 0,018 0,426
N 30 30 30 30 30 30 30
Pearson Correlation ,413* 0,038 0,318 0,018 ,401
* 0,038 0,111
Sig. (2-tailed) 0,023 0,841 0,086 0,923 0,028 0,841 0,56
N 30 30 30 30 30 30 30
Pearson Correlation 0,202 ,429* 0,116 ,484
**,600
**,429
* 0,302
Sig. (2-tailed) 0,285 0,018 0,541 0,007 0 0,018 0,105
N 30 30 30 30 30 30 30
Pearson Correlation 0,222 ,509** 0,055 0,247 ,874
**,509
** 0,223
Sig. (2-tailed) 0,239 0,004 0,774 0,189 0 0,004 0,236
N 30 30 30 30 30 30 30
Pearson Correlation 0,116 0,111 ,534**
,425* 0,179 0,111 0,153
Sig. (2-tailed) 0,54 0,56 0,002 0,019 0,344 0,56 0,42
N 30 30 30 30 30 30 30
Pearson Correlation 0,336 ,429* 0,232 0,208 1,000
**,429
* 0,151
Sig. (2-tailed) 0,069 0,018 0,216 0,271 0 0,018 0,426
N 30 30 30 30 30 30 30
Pearson Correlation 0,2 0,167 0,234 ,411* 0 0,167 ,423
*
Sig. (2-tailed) 0,29 0,379 0,213 0,024 1 0,379 0,02
N 30 30 30 30 30 30 30
pernyataan7
Correlations
pernyataan1
pernyataan2
pernyataan3
pernyataan4
pernyataan5
pernyataan6
pernyataan8
pernyataan9
pernyataan10
pernyataan11
pernyataan12
pernyataan13
pernyataan14
109
Pearson Correlation ,381* 0,101 0,288 ,489
** 0,283 0,101 ,533**
Sig. (2-tailed) 0,038 0,595 0,123 0,006 0,13 0,595 0,002
N 30 30 30 30 30 30 30
Pearson Correlation 0,233 0,237 0,245 ,480** 0,151 0,237 1,000
**
Sig. (2-tailed) 0,215 0,208 0,191 0,007 0,426 0,208 0
N 30 30 30 30 30 30 30
Pearson Correlation 0,172 0,287 ,370*
1,000** 0,208 0,287 ,480
**
Sig. (2-tailed) 0,363 0,125 0,044 0 0,271 0,125 0,007
N 30 30 30 30 30 30 30
Pearson Correlation 0,233 0,237 0,245 ,480** 0,151 0,237 1,000
**
Sig. (2-tailed) 0,215 0,208 0,191 0,007 0,426 0,208 0
N 30 30 30 30 30 30 30
Pearson Correlation 0,259 0,222 ,390* 0,193 0,082 0,222 -0,049
Sig. (2-tailed) 0,167 0,238 0,033 0,308 0,667 0,238 0,795
N 30 30 30 30 30 30 30
Pearson Correlation 0,163 1,000** 0,183 0,287 ,429
*1,000
** 0,237
Sig. (2-tailed) 0,388 0 0,334 0,125 0,018 0 0,208
N 30 30 30 30 30 30 30
Pearson Correlation ,414* 0,183 1,000
**,370
* 0,232 0,183 0,245
Sig. (2-tailed) 0,023 0,334 0 0,044 0,216 0,334 0,191
N 30 30 30 30 30 30 30
Pearson Correlation 1,000** 0,163 ,414
* 0,172 0,336 0,163 0,233
Sig. (2-tailed) 0 0,388 0,023 0,363 0,069 0,388 0,215
N 30 30 30 30 30 30 30
Pearson Correlation 0,259 0,222 ,390* 0,193 0,082 0,222 -0,049
Sig. (2-tailed) 0,167 0,238 0,033 0,308 0,667 0,238 0,795
N 30 30 30 30 30 30 30
Pearson Correlation ,471** 0,167 ,407
* 0,162 0,156 0,167 0,264
Sig. (2-tailed) 0,009 0,378 0,026 0,394 0,411 0,378 0,159
N 30 30 30 30 30 30 30
Pearson Correlation 0,336 ,429* 0,232 0,208 1,000
**,429
* 0,151
Sig. (2-tailed) 0,069 0,018 0,216 0,271 0 0,018 0,426
N 30 30 30 30 30 30 30
Pearson Correlation 0,202 ,429* 0,116 ,484
**,600
**,429
* 0,302
Sig. (2-tailed) 0,285 0,018 0,541 0,007 0 0,018 0,105
N 30 30 30 30 30 30 30
Pearson Correlation 1 0,163 ,414* 0,172 0,336 0,163 0,233
Sig. (2-tailed) 0,388 0,023 0,363 0,069 0,388 0,215
N 30 30 30 30 30 30 30
Pearson Correlation 0,163 1 0,183 0,287 ,429*
1,000** 0,237
Sig. (2-tailed) 0,388 0,334 0,125 0,018 0 0,208
N 30 30 30 30 30 30 30
Pearson Correlation ,414* 0,183 1 ,370
* 0,232 0,183 0,245
Sig. (2-tailed) 0,023 0,334 0,044 0,216 0,334 0,191
N 30 30 30 30 30 30 30
Pearson Correlation 0,172 0,287 ,370* 1 0,208 0,287 ,480
**
Sig. (2-tailed) 0,363 0,125 0,044 0,271 0,125 0,007
N 30 30 30 30 30 30 30
pernyataan19
pernyataan15
pernyataan16
pernyataan17
pernyataan18
pernyataan20
pernyataan21
pernyataan22
pernyataan23
pernyataan24
pernyataan25
pernyataan26
pernyataan27
pernyataan28
pernyataan29
pernyataan30
110
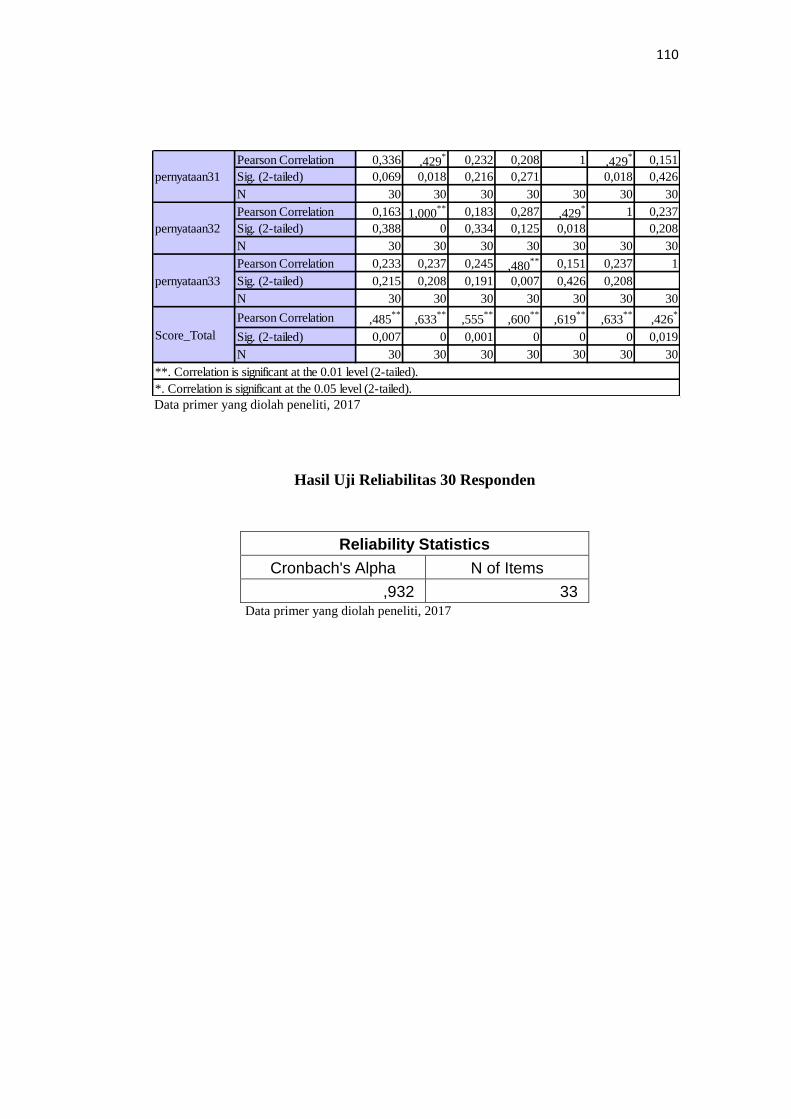
Data primer yang diolah peneliti, 2017
Hasil Uji Reliabilitas 30 Responden
Reliability Statistics
Cronbach's Alpha N of Items
,932 33 Data primer yang diolah peneliti, 2017
Pearson Correlation 0,336 ,429* 0,232 0,208 1 ,429
* 0,151
Sig. (2-tailed) 0,069 0,018 0,216 0,271 0,018 0,426
N 30 30 30 30 30 30 30
Pearson Correlation 0,163 1,000** 0,183 0,287 ,429
* 1 0,237
Sig. (2-tailed) 0,388 0 0,334 0,125 0,018 0,208
N 30 30 30 30 30 30 30
Pearson Correlation 0,233 0,237 0,245 ,480** 0,151 0,237 1
Sig. (2-tailed) 0,215 0,208 0,191 0,007 0,426 0,208
N 30 30 30 30 30 30 30
Pearson Correlation ,485**
,633**
,555**
,600**
,619**
,633**
,426*
Sig. (2-tailed) 0,007 0 0,001 0 0 0 0,019
N 30 30 30 30 30 30 30
pernyataan31
pernyataan32
pernyataan33
Score_Total
**. Correlation is significant at the 0.01 level (2-tailed).
*. Correlation is significant at the 0.05 level (2-tailed).
111
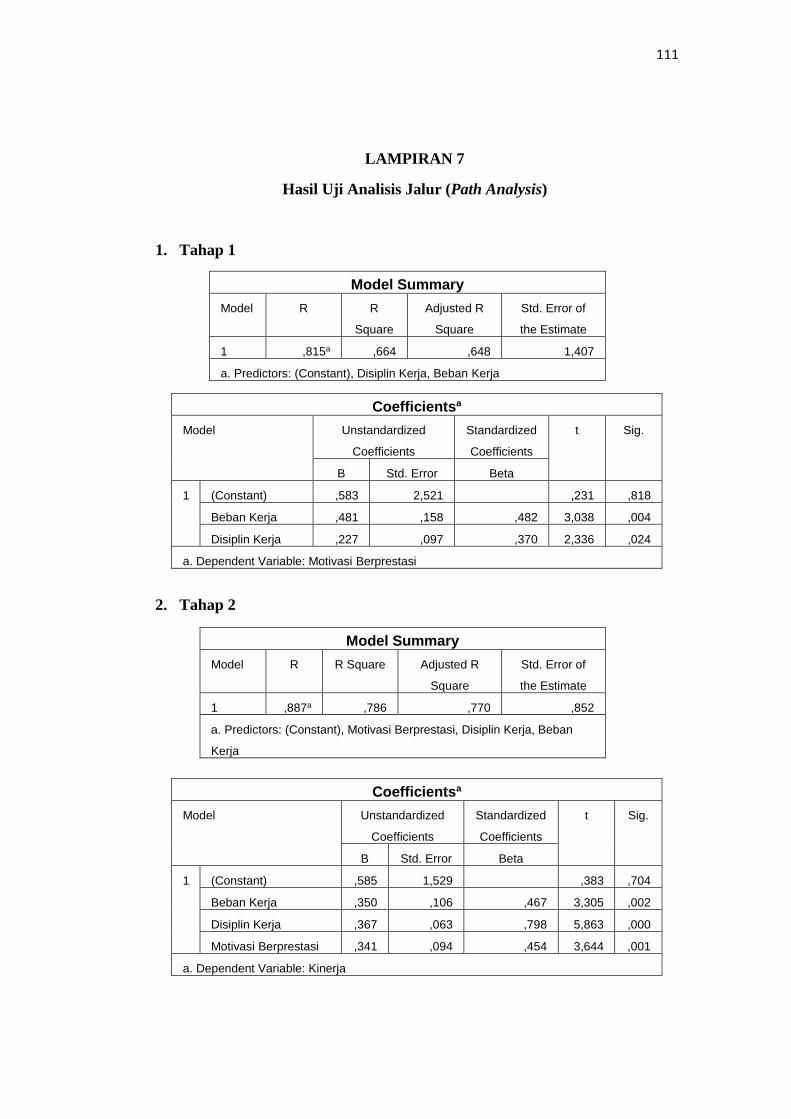
LAMPIRAN 7
Hasil Uji Analisis Jalur (Path Analysis)
1. Tahap 1
Model Summary
Model R R
Square
Adjusted R
Square
Std. Error of
the Estimate
1 ,815a ,664 ,648 1,407
a. Predictors: (Constant), Disiplin Kerja, Beban Kerja
Coefficientsa
Model Unstandardized
Coefficients
Standardized
Coefficients
t Sig.
B Std. Error Beta
1 (Constant) ,583 2,521 ,231 ,818
Beban Kerja ,481 ,158 ,482 3,038 ,004
Disiplin Kerja ,227 ,097 ,370 2,336 ,024
a. Dependent Variable: Motivasi Berprestasi
2. Tahap 2
Model Summary
Model R R Square Adjusted R
Square
Std. Error of
the Estimate
1 ,887a ,786 ,770 ,852
a. Predictors: (Constant), Motivasi Berprestasi, Disiplin Kerja, Beban
Kerja
Coefficientsa
Model Unstandardized
Coefficients
Standardized
Coefficients
t Sig.
B Std. Error Beta
1 (Constant) ,585 1,529 ,383 ,704
Beban Kerja ,350 ,106 ,467 3,305 ,002
Disiplin Kerja ,367 ,063 ,798 5,863 ,000
Motivasi Berprestasi ,341 ,094 ,454 3,644 ,001
a. Dependent Variable: Kinerja
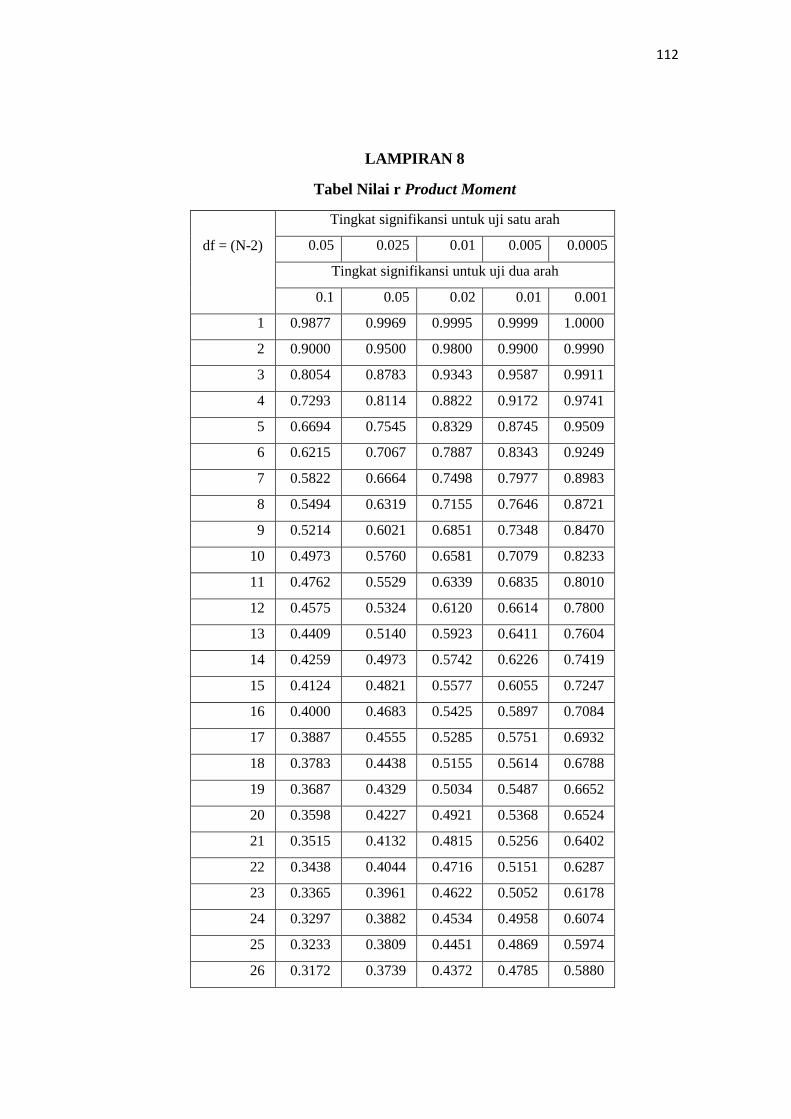
112
LAMPIRAN 8
Tabel Nilai r Product Moment
df = (N-2)
Tingkat signifikansi untuk uji satu arah
0.05 0.025 0.01 0.005 0.0005
Tingkat signifikansi untuk uji dua arah
0.1 0.05 0.02 0.01 0.001
1 0.9877 0.9969 0.9995 0.9999 1.0000
2 0.9000 0.9500 0.9800 0.9900 0.9990
3 0.8054 0.8783 0.9343 0.9587 0.9911
4 0.7293 0.8114 0.8822 0.9172 0.9741
5 0.6694 0.7545 0.8329 0.8745 0.9509
6 0.6215 0.7067 0.7887 0.8343 0.9249
7 0.5822 0.6664 0.7498 0.7977 0.8983
8 0.5494 0.6319 0.7155 0.7646 0.8721
9 0.5214 0.6021 0.6851 0.7348 0.8470
10 0.4973 0.5760 0.6581 0.7079 0.8233
11 0.4762 0.5529 0.6339 0.6835 0.8010
12 0.4575 0.5324 0.6120 0.6614 0.7800
13 0.4409 0.5140 0.5923 0.6411 0.7604
14 0.4259 0.4973 0.5742 0.6226 0.7419
15 0.4124 0.4821 0.5577 0.6055 0.7247
16 0.4000 0.4683 0.5425 0.5897 0.7084
17 0.3887 0.4555 0.5285 0.5751 0.6932
18 0.3783 0.4438 0.5155 0.5614 0.6788
19 0.3687 0.4329 0.5034 0.5487 0.6652
20 0.3598 0.4227 0.4921 0.5368 0.6524
21 0.3515 0.4132 0.4815 0.5256 0.6402
22 0.3438 0.4044 0.4716 0.5151 0.6287
23 0.3365 0.3961 0.4622 0.5052 0.6178
24 0.3297 0.3882 0.4534 0.4958 0.6074
25 0.3233 0.3809 0.4451 0.4869 0.5974
26 0.3172 0.3739 0.4372 0.4785 0.5880
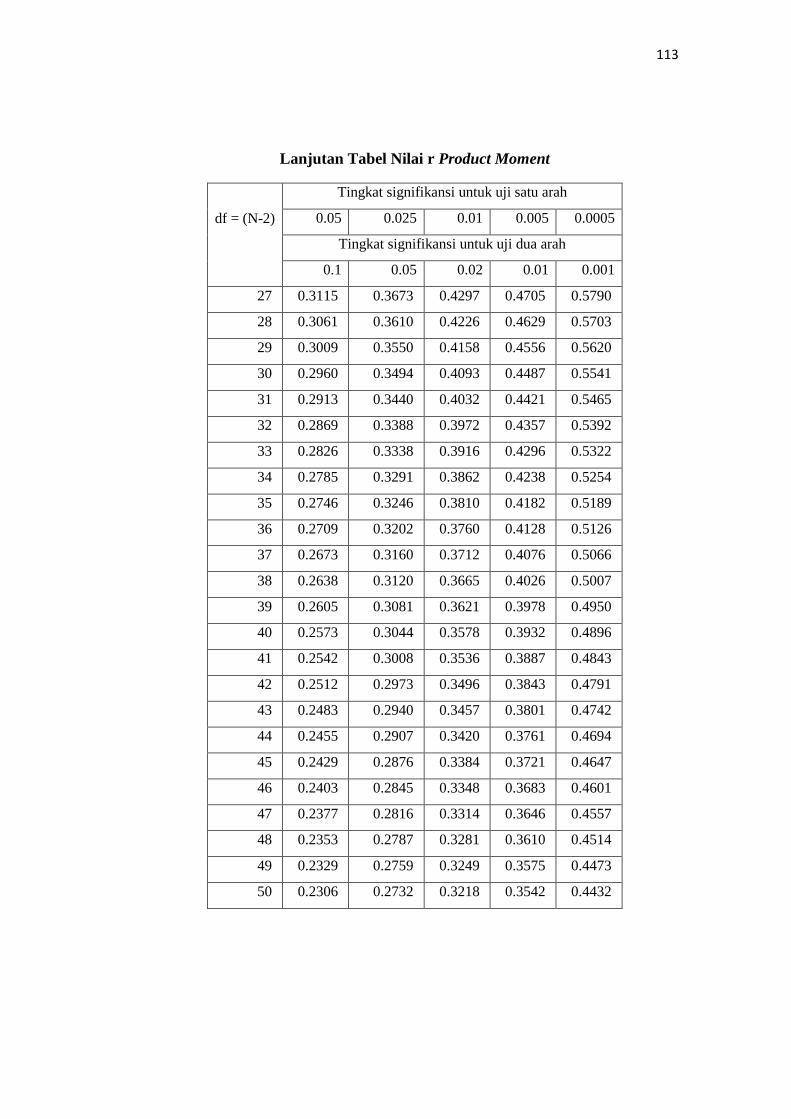
113
Lanjutan Tabel Nilai r Product Moment
df = (N-2)
Tingkat signifikansi untuk uji satu arah
0.05 0.025 0.01 0.005 0.0005
Tingkat signifikansi untuk uji dua arah
0.1 0.05 0.02 0.01 0.001
27 0.3115 0.3673 0.4297 0.4705 0.5790
28 0.3061 0.3610 0.4226 0.4629 0.5703
29 0.3009 0.3550 0.4158 0.4556 0.5620
30 0.2960 0.3494 0.4093 0.4487 0.5541
31 0.2913 0.3440 0.4032 0.4421 0.5465
32 0.2869 0.3388 0.3972 0.4357 0.5392
33 0.2826 0.3338 0.3916 0.4296 0.5322
34 0.2785 0.3291 0.3862 0.4238 0.5254
35 0.2746 0.3246 0.3810 0.4182 0.5189
36 0.2709 0.3202 0.3760 0.4128 0.5126
37 0.2673 0.3160 0.3712 0.4076 0.5066
38 0.2638 0.3120 0.3665 0.4026 0.5007
39 0.2605 0.3081 0.3621 0.3978 0.4950
40 0.2573 0.3044 0.3578 0.3932 0.4896
41 0.2542 0.3008 0.3536 0.3887 0.4843
42 0.2512 0.2973 0.3496 0.3843 0.4791
43 0.2483 0.2940 0.3457 0.3801 0.4742
44 0.2455 0.2907 0.3420 0.3761 0.4694
45 0.2429 0.2876 0.3384 0.3721 0.4647
46 0.2403 0.2845 0.3348 0.3683 0.4601
47 0.2377 0.2816 0.3314 0.3646 0.4557
48 0.2353 0.2787 0.3281 0.3610 0.4514
49 0.2329 0.2759 0.3249 0.3575 0.4473
50 0.2306 0.2732 0.3218 0.3542 0.4432
114
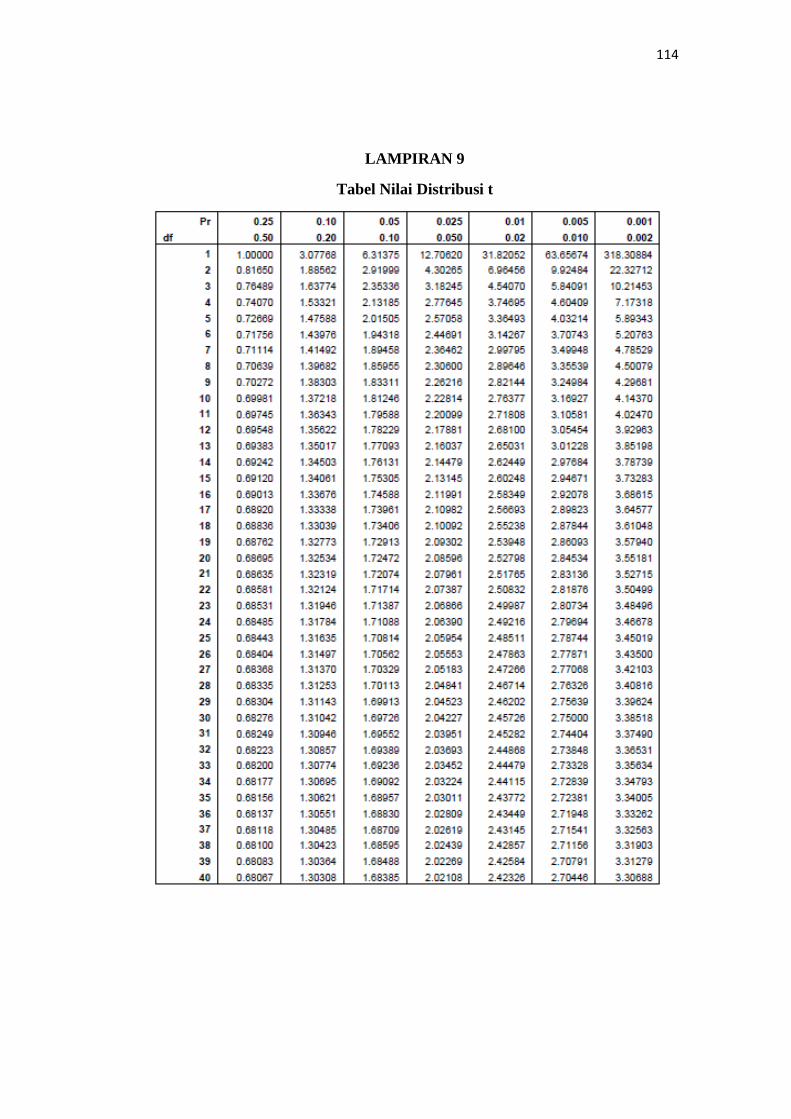
LAMPIRAN 9
Tabel Nilai Distribusi t
115
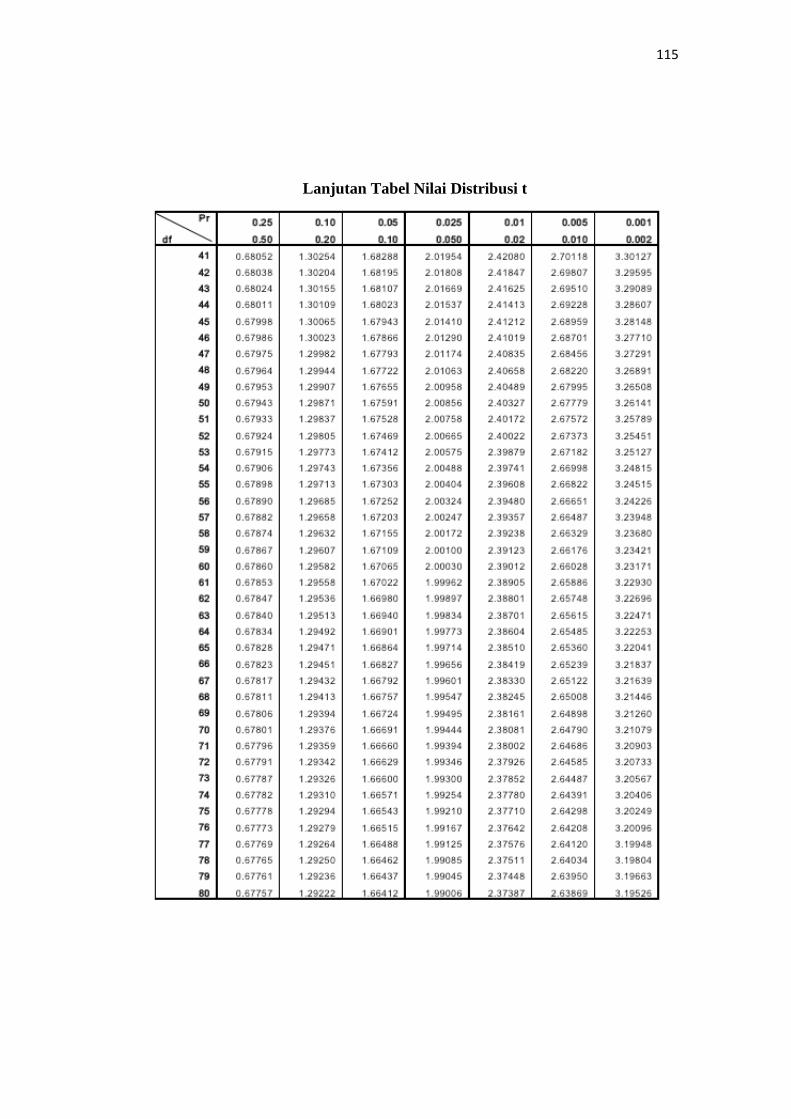
Lanjutan Tabel Nilai Distribusi t