Embed Size (px)
Citation preview
UTM/RMC/F/0024 (1998)
Lampiran 20
UNIVERSITI TEKNOLOGI MALAYSIA
BORANG PELAPORAN AKHI
TAJUK PROJEK : DEVELOPMENT AND A HIGH PERFORMANCE
ANALYSIS OF PESTICID
MOHD MARSIN
Saya ___________________________________ (HURUF B
Mengaku membenarkan Laporan Akhir PenyTeknologi Malaysia dengan syarat-syarat kegun
1. Laporan Akhir Penyelidikan ini adalah
2. Perpustakaan Universiti Teknologi tujuan rujukan sahaja.
3. Perpustakaan dibenarkan mem
Penyelidikan ini bagi kategori TIDAK
4. * Sila tandakan ( / )
SULIT (Mengandun Kepentingan AKTA RAH TERHAD (Mengandun Organisasi/b TIDAK TERHAD
CATATAN : * Jika Laporan Akhir Penyelidikan ini SULIberkuasa/organisasi berkenaan dengan menyatakan sekali sebab dan
NGESAHAN
R PENYELIDIKAN
PPLICATION OF HIGH TEMPERATURE
LIQUID CHROMATOGRAPHY TO THE
ES AND PERSISTANT ORGANIC POLLUTANTS
SANAGI ____________________________________ ESAR)
elidikan ini disimpan di Perpustakaan Universiti aan seperti berikut :
hakmilik Universiti Teknologi Malaysia.
Malaysia dibenarkan membuat salinan untuk
buat penjualan salinan Laporan Akhir TERHAD.
gi maklumat yang berdarjah keselamatan atau Malaysia seperti yang termaktub di dalam SIA RASMI 1972).
gi maklumat TERHAD yang telah ditentukan oleh adan di mana penyelidikan dijalankan).
TANDATANGAN KETUA PENYELIDIK
MOHD MARSIN SANAGI
Nama & Cop Ketua Penyelidik
Tarikh : _________________ 11 April 2008
T atau TERHAD, sila lampirkan surat daripada pihak tempoh laporan ini perlu dikelaskan sebagai SULIT dan TERHAD.
End of Project Report Guidelines A. Purpose The purpose of the End of Project is to allow the IRPA Panels and their supporting group of experts to assess the results of research projects and the technology transfer actions to be taken. B. Information Required The following Information is required in the End of Project Report : • Project summary for the Annual MPKSN Report;
• Extent of achievement of the original project objectives;
• Technology transfer and commercialisation approach;
• Benefits of the project, particularly project outputs and organisational outcomes; and
• Assessment of the project team, research approach, project schedule and project
costs.
C. Responsibility The End of Project Report should be completed by the Project Leader of the IRPA-funded project. D. Timing The End of Project Report should be submitted within three months of the completion of the research project. E. Submission Procedure One copy of the End of Project is to be mailed to :
IRPA Secretariat Ministry of Science, Technology and the Environment 14th Floor, Wisma Sime Darby Jalan Raja Laut 55662 Kuala Lumpur
End of Project Report
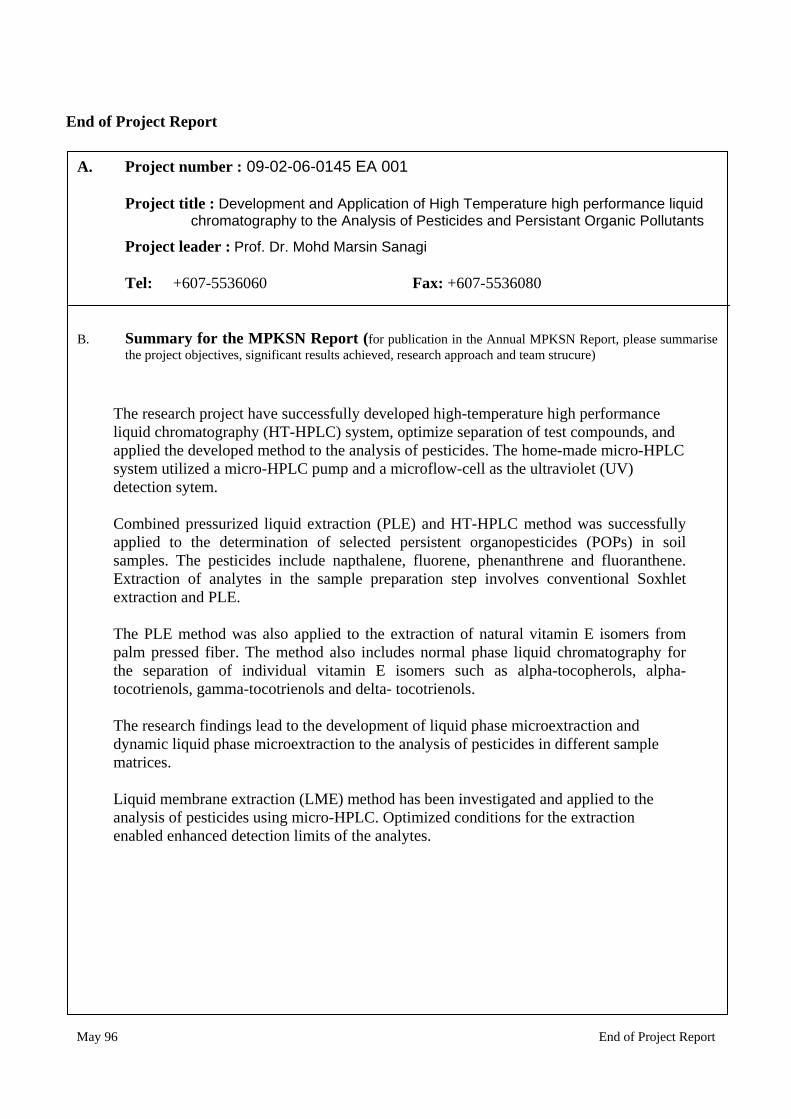
A. Project number : 09-02-06-0145 EA 001
Project title : Development and Application of High Temperature high performance liquid chromatography to the Analysis of Pesticides and Persistant Organic Pollutants
Project leader : Prof. Dr. Mohd Marsin Sanagi
Tel: +607-5536060 Fax: +607-5536080
B. Summary for the MPKSN Report (for publication in the Annual MPKSN Report, please summarise
the project objectives, significant results achieved, research approach and team strucure)
The research project have successfully developed high-temperature high performance liquid chromatography (HT-HPLC) system, optimize separation of test compounds, and applied the developed method to the analysis of pesticides. The home-made micro-HPLC system utilized a micro-HPLC pump and a microflow-cell as the ultraviolet (UV) detection sytem. Combined pressurized liquid extraction (PLE) and HT-HPLC method was successfully applied to the determination of selected persistent organopesticides (POPs) in soil samples. The pesticides include napthalene, fluorene, phenanthrene and fluoranthene. Extraction of analytes in the sample preparation step involves conventional Soxhlet extraction and PLE. The PLE method was also applied to the extraction of natural vitamin E isomers from palm pressed fiber. The method also includes normal phase liquid chromatography for the separation of individual vitamin E isomers such as alpha-tocopherols, alpha-tocotrienols, gamma-tocotrienols and delta- tocotrienols. The research findings lead to the development of liquid phase microextraction and dynamic liquid phase microextraction to the analysis of pesticides in different sample matrices. Liquid membrane extraction (LME) method has been investigated and applied to the analysis of pesticides using micro-HPLC. Optimized conditions for the extraction enabled enhanced detection limits of the analytes.
May 96 End of Project Report

C. Objectives achievement
• Original project objectives (Please state the specific project objectives as described in Section ll of the Application Form)
TO DEVELOP HT-HPLC TO OPTIMIZE SEPARATION OF TEST COMPOUNDS TO EXPLORE THE APPLICATIONS OF HT-HPLC
• Objectives Achieved (Please state the extent to which the project objectives were achieved)
All objectives were achieved. • Objectives not achieved (Please identify the objectives that were not achieved and give reasons)
Nil
D. Technology Transfer/Commercialisation Approach (Please describe the approach planned to
transfer/commercialise the results of the project)
• Patent search has been conducted.
• Patent filing is in progress: PLEX: Pressurized Liquid Extraction For the
Monitoring of Residue Oil Content and Natural Vitamin E in Palm Pressed
Fiber
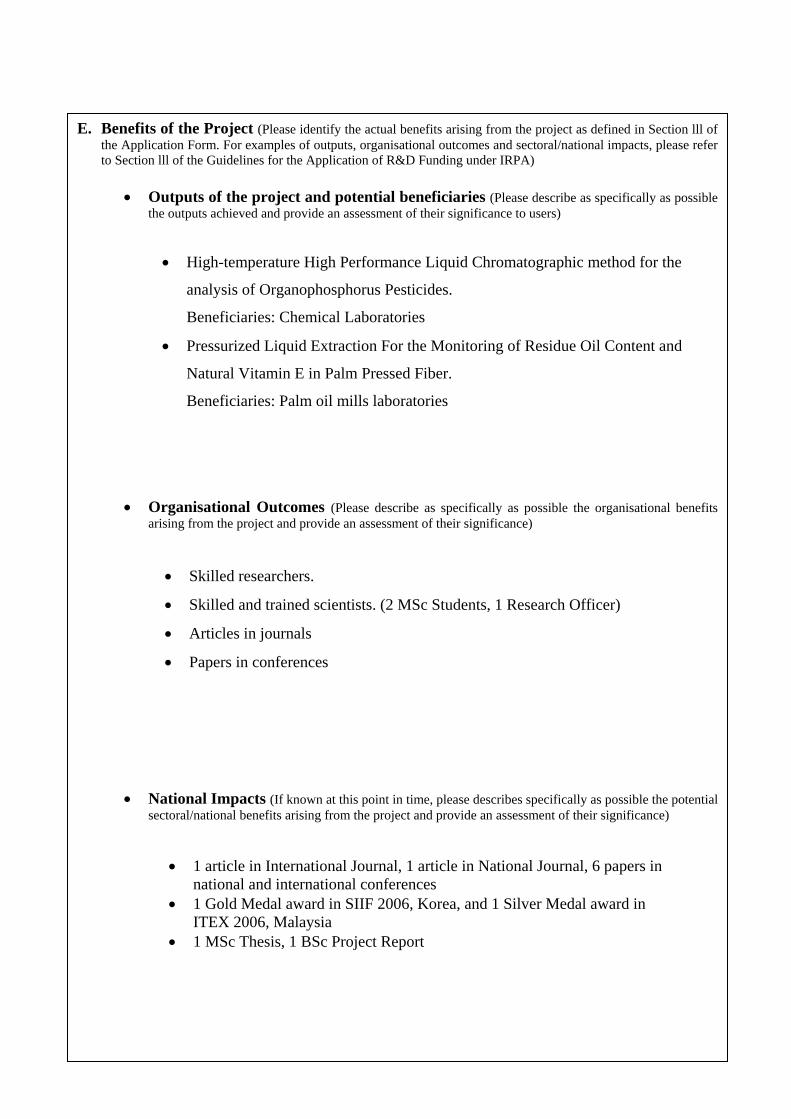
E. Benefits of the Project (Please identify the actual benefits arising from the project as defined in Section lll of the Application Form. For examples of outputs, organisational outcomes and sectoral/national impacts, please refer to Section lll of the Guidelines for the Application of R&D Funding under IRPA)
• Outputs of the project and potential beneficiaries (Please describe as specifically as possible
the outputs achieved and provide an assessment of their significance to users)
• Organisational Outcomes (Please describe as specifically as possible the organisational benefits
arising from the project and provide an assessment of their significance) • N
se
•
•
• Skilled researchers.
• Skilled and trained scientists. (2 MSc Students, 1 Research Officer)
• Articles in journals
• Papers in conferences
atictor
•
•
•
High-temperature High Performance Liquid Chromatographic method for the
analysis of Organophosphorus Pesticides.
Beneficiaries: Chemical Laboratories
Pressurized Liquid Extraction For the Monitoring of Residue Oil Content and
Natural Vitamin E in Palm Pressed Fiber.
Beneficiaries: Palm oil mills laboratories
onal Impacts (If known at this point in time, please describes specifically as possible the potential al/national benefits arising from the project and provide an assessment of their significance)
1 article in International Journal, 1 article in National Journal, 6 papers in national and international conferences 1 Gold Medal award in SIIF 2006, Korea, and 1 Silver Medal award in ITEX 2006, Malaysia 1 MSc Thesis, 1 BSc Project Report

The project schedule was almost as planned.
F. Assessment of project structure
• Project Team (Please provide an assessment of how the project team performed and highlight any significant departures from plan in either structure or actual man-days utilised)
• Collaborations (Please describe the nature of collaborations with other research organisations and/or
industry)
G. Assessment of Research Approach (Please highlight the main steps actually performed and indicate any major departure from the planned approach or any major difficulty encountered)
H. Assessment of the Project Schedule (Please make any relevant comment regarding the actual duration
of the project and highlight any significant variation from plan)
The project research approach was as planned.
The project was able to be condu.cted with the collaboration with the palm oil
industry and agriculture industry
The project team is as planned.

I. Assessment of Project Costs (Please comment on the appropriateness of the original budget and highlight any major departure from the planned budget)
J. Additional Project Funding Obtained (In case of involvement of other funding sources, please indicate the source and total funding provided)
K. Other Remarks (Please include any other comment which you feel is relevant for the evaluation of this
project)
Date : 11 April 2008 Signature :
The financial performance is in line with plan.
The researchers wish to thank Universiti Teknologi Malaysia and the Ministry of
Science, Technology and Innovation Malaysia for facilities and financial support.
Nil

Benefits Report Guidelines A. Purpose The purpose of the Benefits Report is to allow the IRPA Panels and their supporting experts to assess the benefits derived from IRPA-funded research projects. B. Information Required The Project Leader is required to provide information on the results of the research project, specifically in the following areas: • Direct outputs of the project;
• Organisational outcomes of the project; and
• Sectoral/national impacts of the project.
C. Responsibility The Benefits Report should be completed by the Project Leader of the IRPA-funded project. D. Timing The Benefits Report is to be completed within three months of notification by the IRPA Secretariat. Only IRPA-funded projects identified by MPKSN are subject to this review. Generally, the Secretariat will notify Project Leaders of selected projects within 18 months of project completion. E. Submissin Procedure One copy of this report is to be mailed to :
IRPA Secretariat Ministry of Science, Technology and the Environment 14th, Floor, Wisma Sime Darby Jalan Raja Laut 55662 Kuala Lumpur
0
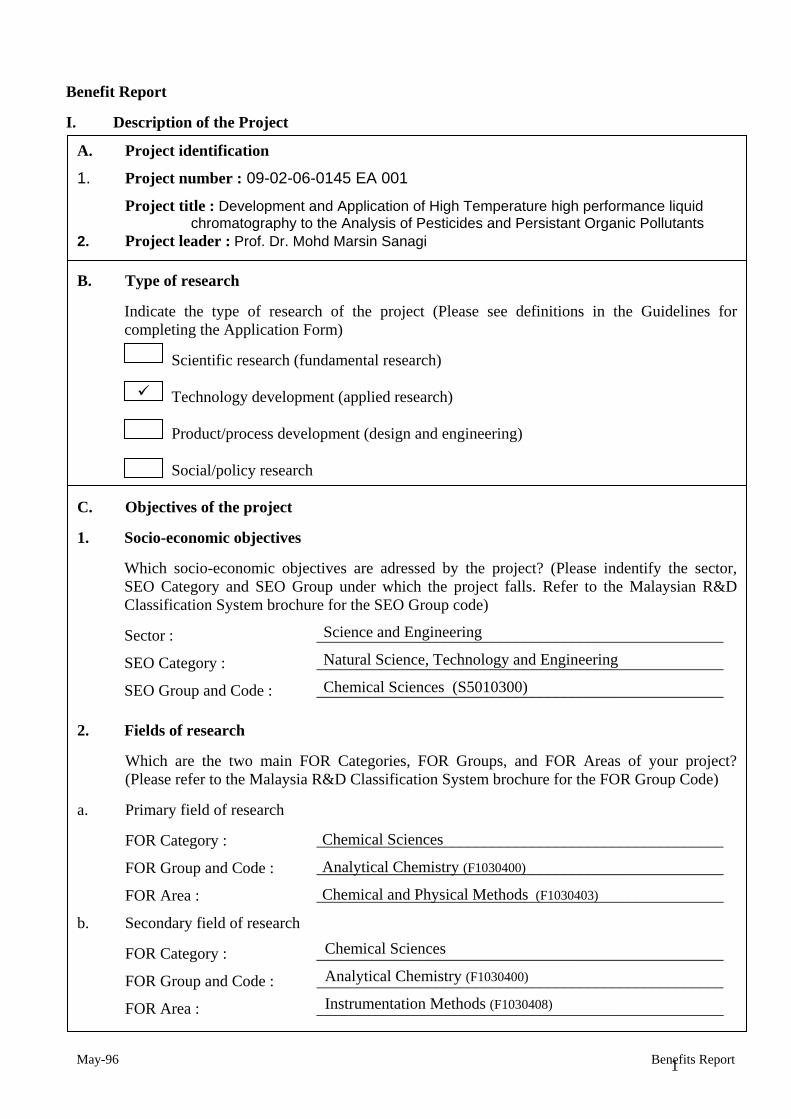
Benefit Report I. Description of the Project
A. Project identification
1. Project number : 09-02-06-0145 EA 001
Project title : Development and Application of High Temperature high performance liquid chromatography to the Analysis of Pesticides and Persistant Organic Pollutants
2. Project leader : Prof. Dr. Mohd Marsin Sanagi B. Type of research
Indicate the type of research of the project (Please see definitions in the Guidelines for completing the Application Form)
Scientific research (fundamental research)
Technology development (applied research)
Product/process development (design and engineering)
Social/policy research
C. Objectives of the project 1. Socio-economic objectives
Which socio-economic objectives are adressed by the project? (Please indentify the sector, SEO Category and SEO Group under which the project falls. Refer to the Malaysian R&D Classification System brochure for the SEO Group code) Sector : _____________
SEO Category : _____________
SEO Group and Code : _____________
2. Fields of research
Which are the two main FO(Please refer to the Malaysia R
a. Primary field of research
FOR Category :
FOR Group and Code :
FOR Area :
b. Secondary field of research
FOR Category :
FOR Group and Code :
FOR Area :
May-96
______________________________________
______________________________________
______________________________________
Science and Engineering
Natural Science, Technology and Engineering
Chemical Sciences (S5010300)
R Categories, FOR Groups, and FOR Areas of your project? &D Classification System brochure for the FOR Group Code)
________________
________________
________________
___________________________________
___________________________________
___________________________________
Chemical Sciences
Analytical Chemistry (F1030400)
Chemical and Physical Methods (F1030403)
_____________________
_____________________
______________________________
______________________________
Chemical Sciences
Analytical Chemistry (F1030400)
Instrumentation Methods (F1030408)
___________________________________________________1 Benefits Report
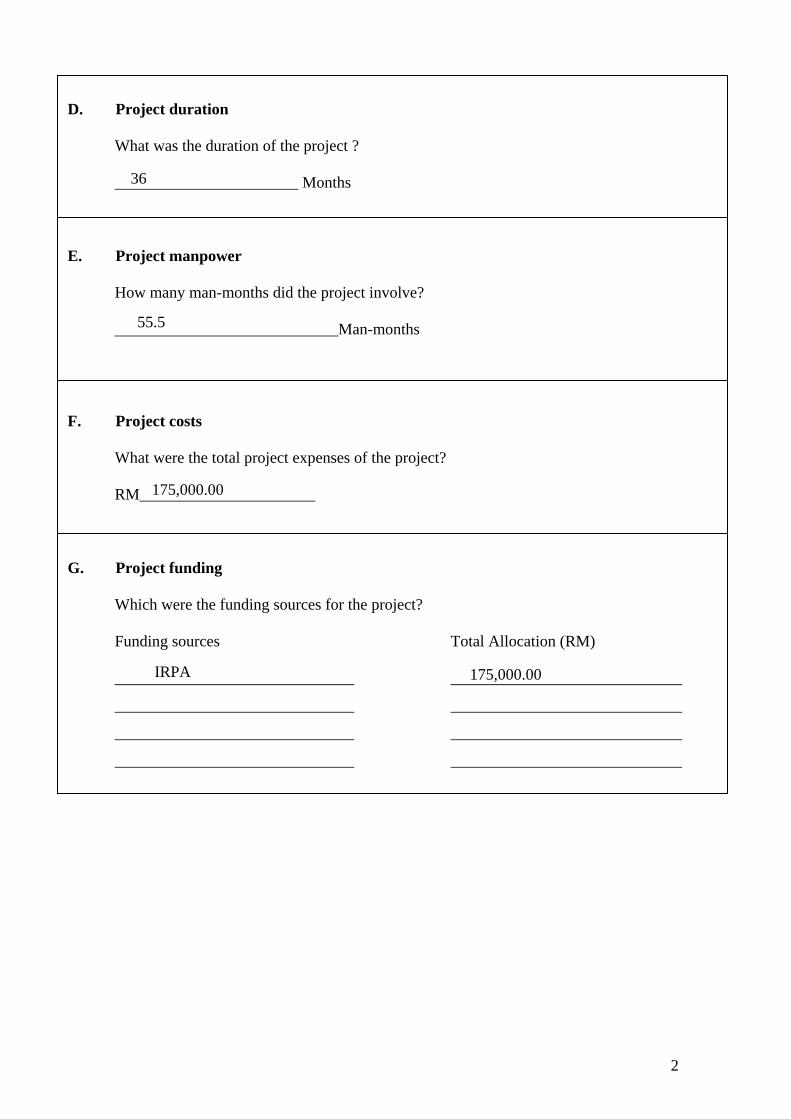
D. Project duration
What was the duration of the project ?
_______________________ Months
E. Project manpower
How many man-months did the project involve? ____________________________Man-months
F. Project costs
What were the total project expenses of the project? RM______________________
G. Project funding
Which were the funding sources for the project? Funding sources Total Allocation (RM) ______________________________ _____________________________
______________________________ _____________________________
______________________________ _____________________________
______________________________ _____________________________
IRPA 175,000.00
36
175,000.00
55.5
2

ll. Direct Outputs of the Project
A. Technical contribution of the project 1. What was the achieved direct output of the project :
For scientific (fundamental) research projects?
Algorithm
Structure
Data
Other, please specify : ______________________________________________
For technology development (applied research) projects :
Method/technique
Demonstrator/prototype
Other, please specify : _______________________________________________
For product/process development (design and engineering) projects:
Product/component
Process
Software
Other, please specify : _______________________________________________
2. How would you characterise the quality of this output?
Significant breakthrough
Major improvement
Minor improvement
3

B. Contribution of the project to knowledge 1. How has the output of the project been documented?
Detailed project report
Product/process specification documents
Other, please specify : _______________________________________________
2. Did the project create an intellectual property stock?
Patent obtained
Patent pending
Patent application will be filed
Copyright
3. What publications are available?
Articles (s) in scientific publications How Many: ________________
Papers(s) delivered at conferences/seminars How Many: ________________
Book
Other, please specify : _______________________________________________
4. How significant are citations of the results?
Citations in national publications How Many: ________________
Citations in international publications How Many: ________________
None yet
Not known
~1
~1
6
2
4

lll. Organisational Outcomes of the Project
A. Contribution of the project to expertise development 1. How did the project contribute to expertise?
PhD degrees How Many: ________________
MSc degrees How Many: ________________
Research staff with new specialty How Many: ________________
Other, please specify: ________________________________________________
2. How significant is this expertise?
One of the key areas of priority for Malaysia
An important area, but not a priority one
B. Economic contribution of the project? 1. How has the economic contribution of the project materialised?
Sales of manufactured product/equipment
Royalties from licensing
Cost savings
Time savings
Other, please specify : _______________________________________________
2. How important is this economic contribution ?
High economic contribution Value: RM________________
Medium economic contribution Value: RM________________
Low economic contribution Value: RM________________
1
2
5

3. When has this economic contribution materialised?
Already materialised
Within months of project completion
Within three years of project completion
Expected in three years or more
Unknown
C Infrastructural contribution of the project
1. What infrastructural contribution has the project had?
New equipment Value: RM __________________
New/improved facility Investment : RM __________________
New information networks
Other, please specify: ____________________________________________
2. How significant is this infrastructural contribution for the organisation?
Not significant/does not leverage other projects
Moderately significant
Very significant/significantly leverages other projects
D. Contribution of the project to the organisation’s reputation
1. How has the project contributed to increasing the reputation of the organisation
Recognition as a Centre of Excellence
National award
International award
Demand for advisory services
Invitations to give speeches on conferences
Visits from other organisations
Other, please specify: ______________________________________________
69,977.00
6

2. How important is the project’s contribution to the organisation’s reputation ?
Not significant
Moderately significant
Very significant
7

1V. National Impacts of the Project
________________________________ ________________________________
2. How has/will the socio-economic contribution of the project materialised ?
Improvements in health
Improvements in safety
Improvements in the environment
Improvements in energy consumption/supply
Improvements in international relations
Other, please specify: ________________________________________________
A. Contribution of the project to organisational linkages
1. Which kinds of linkages did the project create?
Domestic industry linkages
International industry linkages
Linkages with domestic research institutions, universities
Linkages with international research institutions, universities
2. What is the nature of the linkages?
Staff exchanges
Inter-organisational project team
Research contract with a commercial client
Informal consultation
Other, please specify: ________________________________________________
B. Social-economic contribution of the project
1. Who are the direct customer/beneficiaries of the project output?
Customers/beneficiaries: Number: ________________________________ ________________________________
_ ____________
Collaboration in Experimental Research
_______________________________ ____________________Analytical Laboratories Estimated >200
8

3. How important is this socio-economic contribution?
High social contribution
Medium social contribution
Low social contribution
4. When has/will this social contribution materialised?
Already materialised
Within three years of project completion
Expected in three years or more
Unknown
Date: Signature: 11 April 2008
9

Lampiran 13
UTM/RMC/F/0014 (1998)
1
UNIVERSITI TEKNOLOGI MALAYSIA Research Management Centre
PRELIMINARY IP SCREENING & TECHNOLOGY ASSESSMENT FORM
(To be completed by Project Leader submission of Final Report to RMC or whenever IP protection arrangement is required) 1. PROJECT TITLE IDENTIFICATION :
yles: Their Impact On University Student's Learning Orientations Study Skills and Academic
Vote No:
Achievements
Project number : 09-02-06-0145 EA 001
Project Title: Development and Application of High Temperature high performance liquid chromatography To the Analysis of Pesticides and Persistant Organic Pollutants
2. PROJECT LEADER :
Name : Prof. Dr. Mohd Marsin Sanagi
Address :
__________________________________________________________________________
__________________________________________________________________________
Tel : __________________ Fax : _______________ e-mail : _______________________
3. DIRECT OUTPUT OF PROJECT (Please tick where applicable)
4. INTELLECTUAL PROPERTY (Please tick where applicable) Not patentable Technology protected by patents
Patent search required Patent pending
Patent search completed and clean Monograph available
Invention remains confidential Inventor technology champion
No publications pending Inventor team player
No prior claims to the technology Industrial partner identified
Scientific Research Applied Research Product/Process Development Algorithm Method/Technique Product / Component Structure Demonstration / Process Prototype Data Software
Other, please specify Other, please specify Other, please specify ___________________ __________________ ___________________________ ___________________ __________________ ___________________________ ___________________ __________________ ___________________________
Department of Chemistry, Faculty of Science, Universiti Teknologi Malaysia,
81310 UTM Skudai, Johor
+607-5536060 +6-7-5536080 [email protected]
74255
UTM/RMC/F/0014 (1998)
2
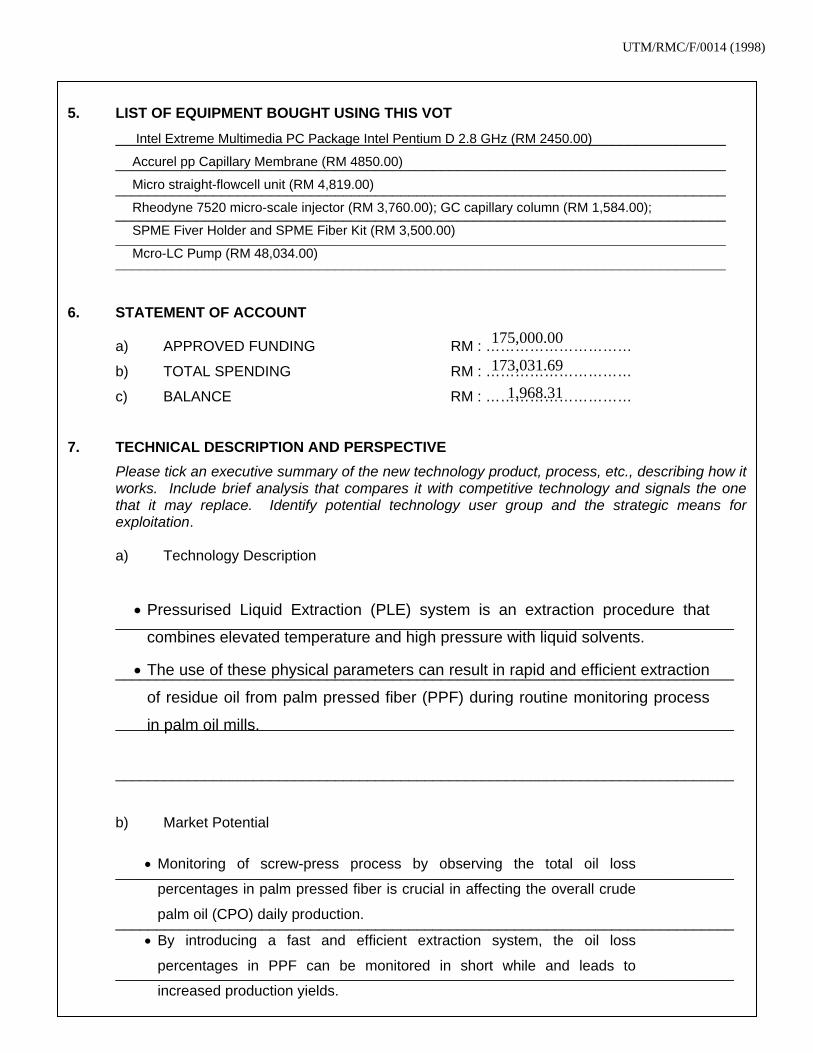
5. LIST OF EQUIPMENT BOUGHT USING THIS VOT
___________________________________________________________________________
___________________________________________________________________________
___________________________________________________________________________
___________________________________________________________________________
___________________________________________________________________________
___________________________________________________________________________
6. STATEMENT OF ACCOUNT
a) APPROVED FUNDING RM : …………
Intel Extreme Multimedia PC Package Intel Pentium D 2.8 GHz (RM 2450.00)
Accurel pp Capillary Membrane (RM 4850.00)
Micro straight-flowcell unit (RM 4,819.00)
Rheodyne 7520 micro-scale injector (RM 3,760.00); GC capillary column (RM 1,584.00);
SPME Fiver Holder and SPME Fiber Kit (RM 3,500.00)
Mcro-LC Pump (RM 48,034.00)
b) TOTAL SPENDING RM : …………
c) BALANCE RM : …………
7. TECHNICAL DESCRIPTION AND PERSPECTIVE
Please tick an executive summary of the new technologyworks. Include brief analysis that compares it with comthat it may replace. Identify potential technology usexploitation. a) Technology Description
_____________________________________________
_____________________________________________
_____________________________________________
_____________________________________________
b) Market Potential
_____________________________________________
_____________________________________________
_____________________________________________
• Pressurised Liquid Extraction (PLE) system i
combines elevated temperature and high pressu
• The use of these physical parameters can resul
of residue oil from palm pressed fiber (PPF) du
in palm oil mills.
• Monitoring of screw-press process by observ
percentages in palm pressed fiber is crucial in aff
palm oil (CPO) daily production.
• By introducing a fast and efficient extraction
percentages in PPF can be monitored in sho
increased production yields.
………………175,000.00
………………
…
173,031.69
…………… 1,968.31
product, process, etc., describing how it petitive technology and signals the one er group and the strategic means for
_______________________________
_______________________________
_______________________________
_______________________________
_______________________________
_______________________________
_______________________________
s an extraction procedure that
re with liquid solvents.
t in rapid and efficient extraction
ring routine monitoring process
ing the total oil loss
ecting the overall crude
system, the oil loss
rt while and leads to
UTM/RMC/F/0014 (1998)
3
c) Commercialisation Strategies
____________________________________________________________________________
____________________________________________________________________________
____________________________________________________________________________
____________________________________________________________________________
____________________________________________________________________________
____________________________________________________________________________ 8. RESEARCH PERFORMANCE EVALUATION
a) FACULTY RESEARCH COORDINATOR Research Status ( ) ( ) ( ) ( ) ( ) ( ) Spending ( ) ( ) ( ) ( ) ( ) ( ) Overall Status ( ) ( ) ( ) ( ) ( ) ( ) Excellent Very Good Good Satisfactory Fair Weak
Comment/Recommendations : _____________________________________________________________________________
_____________________________________________________________________________
_____________________________________________________________________________
_____________________________________________________________________________
_____________________________________________________________________________
_____________________________________________________________________________
………………………………………… Name : ………………………………………
Signature and stamp of Date : ……………………………………… JKPP Chairman
• Patent Search has been carried out.
• Patent Filing is in progress.
RE
4
b) RMC EVALUATION
Research Status ( ) ( ) ( ) ( ) ( ) ( ) Spending ( ) ( ) ( ) ( ) ( ) ( ) Overall Status ( ) ( ) ( ) ( ) ( ) ( ) Excellent Very Good Good Satisfactory Fair Weak
Comments :- _____________________________________________________________________________
_____________________________________________________________________________
_____________________________________________________________________________
_____________________________________________________________________________
_____________________________________________________________________________
_____________________________________________________________________________ Recommendations :
Needs further research
Patent application recommended
Market without patent
No tangible product. Report to be filed as reference
……………………………………….. Name : ……………………………………………
Signature and Stamp of Dean / Date : …………………………………………… Deputy Dean Research Management Centre
UTM/RMC/F/0014 (1998)
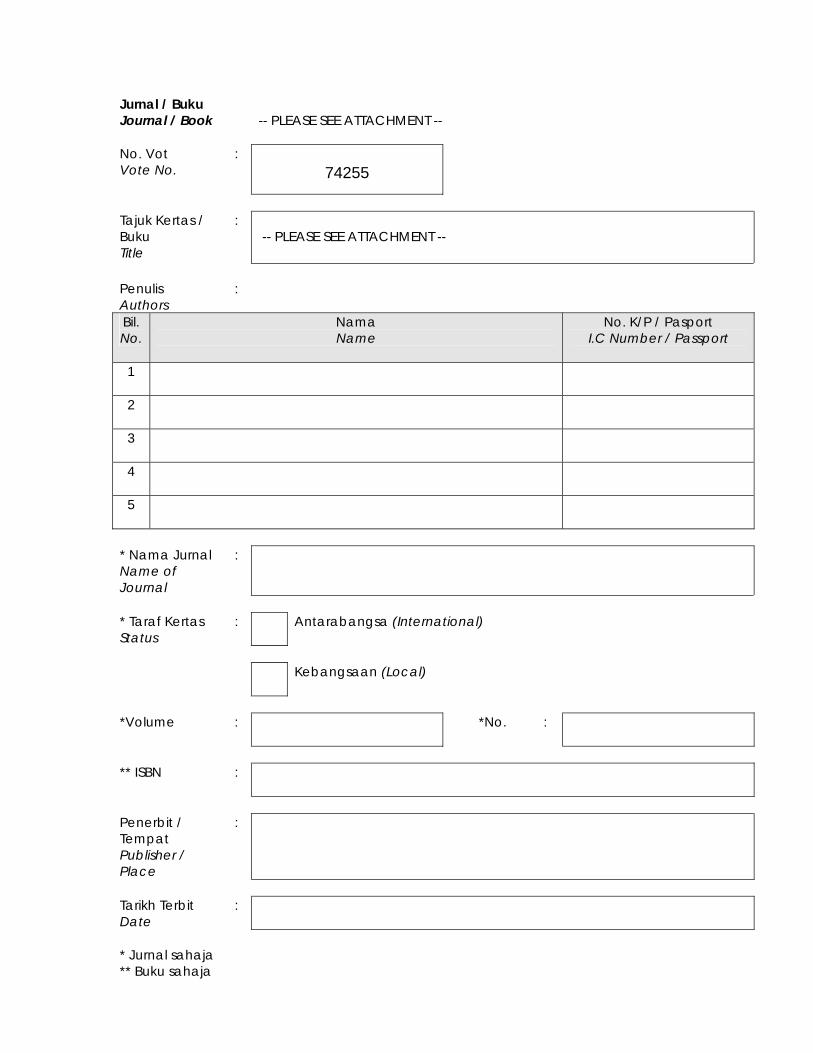
Jurnal / Buku Journal / Book
-- PLEASE SEE ATTACHMENT --
No. Vot Vote No.
: 74255
Tajuk Kertas / Buku Title
: -- PLEASE SEE ATTACHMENT --
Penulis Authors
:
Bil. No.
Nama Name
No. K/P / Pasport I.C Number / Passport
1
2
3
4
5
* Nama Jurnal Name of Journal
:
* Taraf Kertas Status
:
Antarabangsa (International)
Kebangsaan (Local)
*Volume : *No. :
** ISBN
:
Penerbit / Tempat Publisher / Place
:
Tarikh Terbit Date
:
* Jurnal sahaja ** Buku sahaja

APPENDIX:
VOT 74255 PUBLICATIONS 1 article in International Journal, 1 article in National Journal, 6 papers in national and international conferences, 1 Gold Medal award in SIIF 2006, Korea and 1 Silver Medal award in ITEX 2006, Malaysia, 1 MSc Thesis, 1 BSc Project Report Articles in Journals and Papers in Conferences
M. Marsin Sanagi, H. H. See, Wan Aini Wan Ibrahim, Ahmedy Abu Naim, “Determination of Carotene, Tocopherols and Tocotrienols in Residual Oil from Palm Pressed Fiber Using Pressurized Liquid Extraction – Normal Phase Liquid Chromatography” Analytica Chimica Acta, 538, 71-76 (2005) M. Marsin Sanagi, Noorashikin Md Salleh, Hong Heng See, Wan Aini Wan Ibrahim and Ahmedy Naim, “Elevated Temperature Reversed-Phase High Performance liquid Chromatography of Polycyclic Aromatic Hydrocarbons on ODS-Silica Phase”. Buletin Kimia, 21 (2005) 19-26.
Hong Heng See, M. Marsin Sanagi, Wan Aini Wan Ibrahim, Ahmedy Abu Naim, “Determination of Carotene, Tocopherols and Tocotrienols in Residue Oil from Palm Pressed-Fiber using Pressurized Liquid Extraction – Normal Phase Liquid Chromatography” (G1-1). Presented at Asian Chemical Congress 2005, Seoul, Korea, 24-26 August 2005. Hong Heng See, M. Marsin Sanagi, Wan Aini Wan Ibrahim, Ahmedy Abu Naim, “Novel Applications of High Temperature Liquid Chromatography using Hydro-Organic and Superheated Water Eluent” (G1-8). Presented at Asian Chemical Congress 2005, Seoul, Korea, 24-26 August 2005. Mohd Marsin Sanagi, Noorashikin Md Saleh, Hong Heng See, Wan Aini Wan Ibrahim, Ahmedy Abu Naim, “Application of High Temperature Liquid Chromatography to the Analysis of Polycyclic Aromatic Hydrocarbons in Soil”, Paper presented at the Fifth IMTGT UNINET Biannual Conference and International Seminar, Tiara Convention Center, Medan North Sumatra, Indonesia, 22-23 June, 2006. (Organized by University of North Sumatra, Medan) M. Marsin Sanagi*, Noorashikin Md Saleh, Hong Heng See, Wan Aini Wan Ibrahim, Ahmedy Abu Naim, “Elevated Temperature Reversed-Phase High Performance Liquid Chromatography of Polycyclic Aromatic Hydrocarbons on ODS-Silica Phase”, Paper presented at the Annual Fundamental Science Seminar 2005 (AFSS 2005), 4-5 July 2005, Institut Ibnu Sina, Universiti Teknologi Malaysia, 81310 Skudai, Johor, Malaysia
1/2
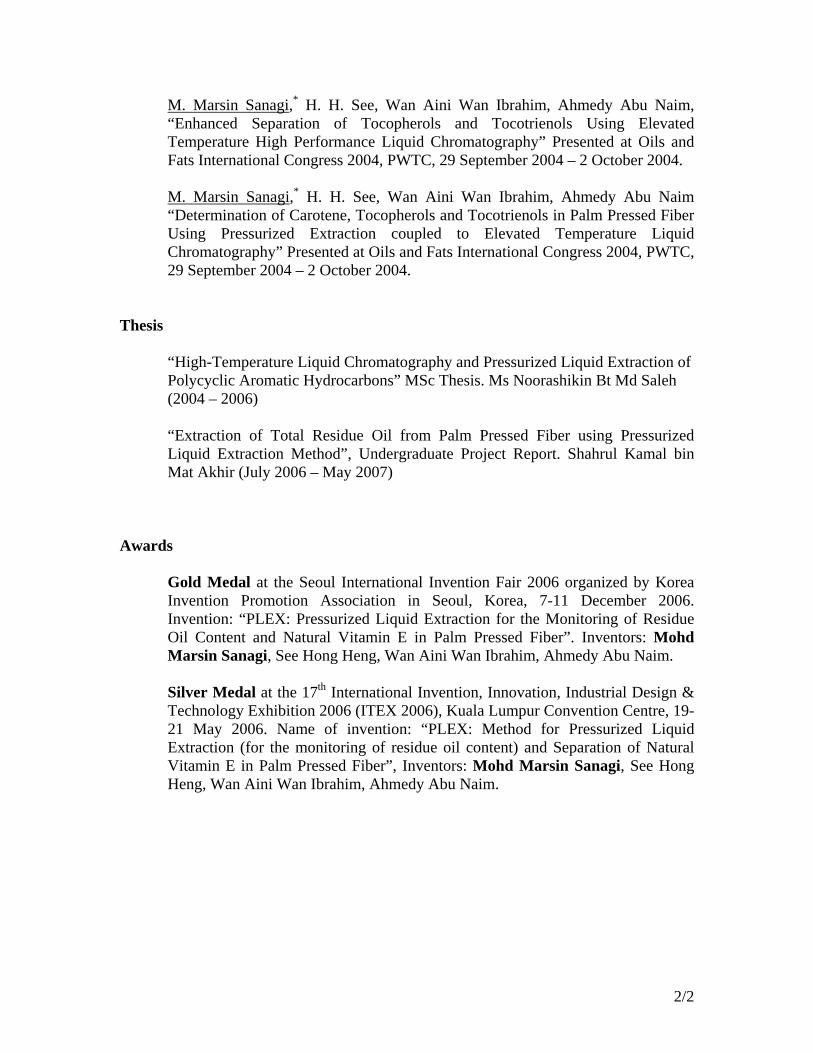
M. Marsin Sanagi,* H. H. See, Wan Aini Wan Ibrahim, Ahmedy Abu Naim, “Enhanced Separation of Tocopherols and Tocotrienols Using Elevated Temperature High Performance Liquid Chromatography” Presented at Oils and Fats International Congress 2004, PWTC, 29 September 2004 – 2 October 2004. M. Marsin Sanagi,* H. H. See, Wan Aini Wan Ibrahim, Ahmedy Abu Naim “Determination of Carotene, Tocopherols and Tocotrienols in Palm Pressed Fiber Using Pressurized Extraction coupled to Elevated Temperature Liquid Chromatography” Presented at Oils and Fats International Congress 2004, PWTC, 29 September 2004 – 2 October 2004.
Thesis
“High-Temperature Liquid Chromatography and Pressurized Liquid Extraction of Polycyclic Aromatic Hydrocarbons” MSc Thesis. Ms Noorashikin Bt Md Saleh (2004 – 2006) “Extraction of Total Residue Oil from Palm Pressed Fiber using Pressurized Liquid Extraction Method”, Undergraduate Project Report. Shahrul Kamal bin Mat Akhir (July 2006 – May 2007)
Awards
Gold Medal at the Seoul International Invention Fair 2006 organized by Korea Invention Promotion Association in Seoul, Korea, 7-11 December 2006. Invention: “PLEX: Pressurized Liquid Extraction for the Monitoring of Residue Oil Content and Natural Vitamin E in Palm Pressed Fiber”. Inventors: Mohd Marsin Sanagi, See Hong Heng, Wan Aini Wan Ibrahim, Ahmedy Abu Naim. Silver Medal at the 17th International Invention, Innovation, Industrial Design & Technology Exhibition 2006 (ITEX 2006), Kuala Lumpur Convention Centre, 19-21 May 2006. Name of invention: “PLEX: Method for Pressurized Liquid Extraction (for the monitoring of residue oil content) and Separation of Natural Vitamin E in Palm Pressed Fiber”, Inventors: Mohd Marsin Sanagi, See Hong Heng, Wan Aini Wan Ibrahim, Ahmedy Abu Naim.
2/2
DEVELOPMENT AND APPLICATION OF HIGH TEMPERATURE HIGH
PERFORMANCE LIQUID CHROMATOGRAPHY TO THE ANALYSIS OF
PESTICIDES AND PERSISTANT ORGANIC POLLUTANTS
MOHD MARSIN BIN SANAGI
WAN AINI WAN IBRAHIM
AHMEDY ABU NAIM
NOORASHIKIN MD SALEH
NORFAIRULZUKRY
PROJECT NUMBER : 09-02-06-0145 EA 001
RESEARCH VOTE NO: 74255
Jabatan Kimia
Fakulti Sains
Universiti Teknologi Malaysia
2008
UTM/RMC/F/0024 (1998)
Lampiran 20
UNIVERSITI TEKNOLOGI MALAYSIA
BORANG PELAPORAN AKHI
TAJUK PROJEK : DEVELOPMENT AND A HIGH PERFORMANCE
ANALYSIS OF PESTICID
MOHD MARSIN
Saya ___________________________________ (HURUF B
Mengaku membenarkan Laporan Akhir PenyTeknologi Malaysia dengan syarat-syarat kegun
1. Laporan Akhir Penyelidikan ini adalah
2. Perpustakaan Universiti Teknologi tujuan rujukan sahaja.
3. Perpustakaan dibenarkan mem
Penyelidikan ini bagi kategori TIDAK
4. * Sila tandakan ( / )
SULIT (Mengandun Kepentingan AKTA RAH TERHAD (Mengandun Organisasi/b TIDAK TERHAD
CATATAN : * Jika Laporan Akhir Penyelidikan ini SULIberkuasa/organisasi berkenaan dengan menyatakan sekali sebab dan
NGESAHAN
R PENYELIDIKAN
PPLICATION OF HIGH TEMPERATURE
LIQUID CHROMATOGRAPHY TO THE
ES AND PERSISTANT ORGANIC POLLUTANTS
SANAGI ____________________________________ ESAR)
elidikan ini disimpan di Perpustakaan Universiti aan seperti berikut :
hakmilik Universiti Teknologi Malaysia.
Malaysia dibenarkan membuat salinan untuk
buat penjualan salinan Laporan Akhir TERHAD.
gi maklumat yang berdarjah keselamatan atau Malaysia seperti yang termaktub di dalam SIA RASMI 1972).
gi maklumat TERHAD yang telah ditentukan oleh adan di mana penyelidikan dijalankan).
TANDATANGAN KETUA PENYELIDIK
MOHD MARSIN SANAGI
Nama & Cop Ketua Penyelidik
Tarikh : _________________ 11 April 2008
T atau TERHAD, sila lamp tempoh laporan ini perlu dike
irkan surat daripada pihak laskan sebagai SULIT dan TERHAD.
DEVELOPMENT AND APPLICATION OF HIGH TEMPERATURE HIGH
PERFORMANCE LIQUID CHROMATOGRAPHY TO THE ANALYSIS OF
PESTICIDES AND PERSISTANT ORGANIC POLLUTANTS
MOHD MARSIN BIN SANAGI
WAN AINI WAN IBRAHIM
AHMEDY ABU NAIM
NOORASHIKIN MD SALEH
NORFAIRULZUKRY
PROJECT NUMBER : 09-02-06-0145 EA 001
RESEARCH VOTE NO: 74255
Jabatan Kimia
Fakulti Sains
Universiti Teknologi Malaysia
2008
i
ACKNOWLEDGEMENT
We would like to thank Universiti Teknologi Malaysia (UTM) and Ministry of
Science and Innovation (MOSTI) for scholarship and financial supports through the grant
vote number 72455. We also would like to express our sincere appreciation to all
researchers in the Separation Science Research Group (SSRG), Department of Chemistry,
Faculty of Science, UTM, in particular Mr. Dadan Hermawan who have given their great
support to this research.
ii

ABSTRACT
A high temperature reversed-phase liquid chromatography (RP-LC) method has been
developed to separate polycyclic aromatic hydrocarbons (PAHs) on ODS-silica stationary
phase using various proportions of organic modifier in the mobile phase. The selectivity
and retention patterns of four PAHs (naphthalene, fluorene, phenanthrene and
fluoranthene) were investigated on a Hypersil ODS-silica column (4.6 mm ID × 100 mm,
5 µm) with ultraviolet detection at 254 nm. Excellent separations for the PAHs were
achieved with acetonitrile-water 40:60 (v/v) as the mobile phase at a flow rate of 2.5
mL/min at column temperatures ranging from 25°C to 70°C. Pressurized liquid extraction
(PLE) method was also developed to determine the quantity of the PAHs in soil samples.
It was found that PLE could reduce sample preparation time and reduce organic solvent
consumption to one-fifth of that required by Soxhlet extraction (United States
Environmental Protection Agency, (US EPA) Method 3545). With dichloromethane-
acetone 50:50 (v/v) as the extraction solvent, the optimum conditions were found to be
180°C at a pressure of 250 bar. For the extraction of spiked PAHs, it was found that PLE
gave results that are comparable to or better than those obtained by Soxhlet extraction
with highest recoveries of fluoranthene 94.4% for PLE and 73.6% for Soxhlet extraction.
The developed high-temperature RP-LC method gave limits of detection (LOD) for the
PAHs in the range of 0.60 to 1.08 ppm.
iii
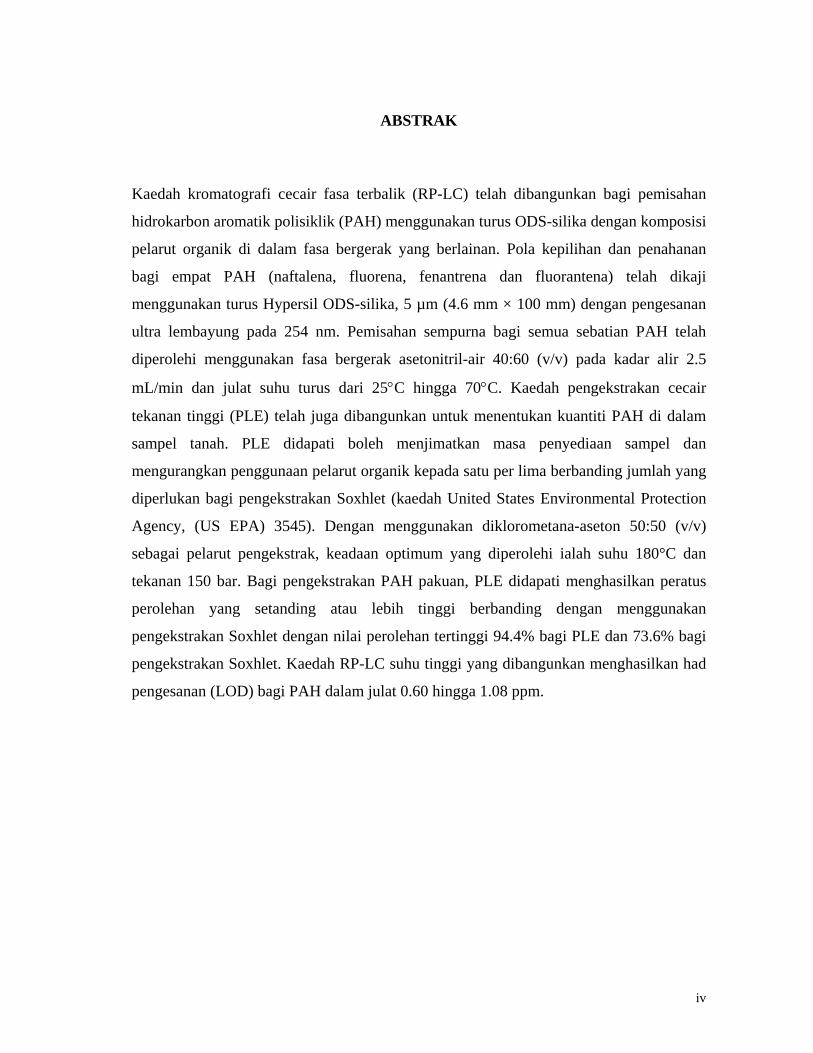
ABSTRAK
Kaedah kromatografi cecair fasa terbalik (RP-LC) telah dibangunkan bagi pemisahan
hidrokarbon aromatik polisiklik (PAH) menggunakan turus ODS-silika dengan komposisi
pelarut organik di dalam fasa bergerak yang berlainan. Pola kepilihan dan penahanan
bagi empat PAH (naftalena, fluorena, fenantrena dan fluorantena) telah dikaji
menggunakan turus Hypersil ODS-silika, 5 µm (4.6 mm × 100 mm) dengan pengesanan
ultra lembayung pada 254 nm. Pemisahan sempurna bagi semua sebatian PAH telah
diperolehi menggunakan fasa bergerak asetonitril-air 40:60 (v/v) pada kadar alir 2.5
mL/min dan julat suhu turus dari 25°C hingga 70°C. Kaedah pengekstrakan cecair
tekanan tinggi (PLE) telah juga dibangunkan untuk menentukan kuantiti PAH di dalam
sampel tanah. PLE didapati boleh menjimatkan masa penyediaan sampel dan
mengurangkan penggunaan pelarut organik kepada satu per lima berbanding jumlah yang
diperlukan bagi pengekstrakan Soxhlet (kaedah United States Environmental Protection
Agency, (US EPA) 3545). Dengan menggunakan diklorometana-aseton 50:50 (v/v)
sebagai pelarut pengekstrak, keadaan optimum yang diperolehi ialah suhu 180°C dan
tekanan 150 bar. Bagi pengekstrakan PAH pakuan, PLE didapati menghasilkan peratus
perolehan yang setanding atau lebih tinggi berbanding dengan menggunakan
pengekstrakan Soxhlet dengan nilai perolehan tertinggi 94.4% bagi PLE dan 73.6% bagi
pengekstrakan Soxhlet. Kaedah RP-LC suhu tinggi yang dibangunkan menghasilkan had
pengesanan (LOD) bagi PAH dalam julat 0.60 hingga 1.08 ppm.
iv
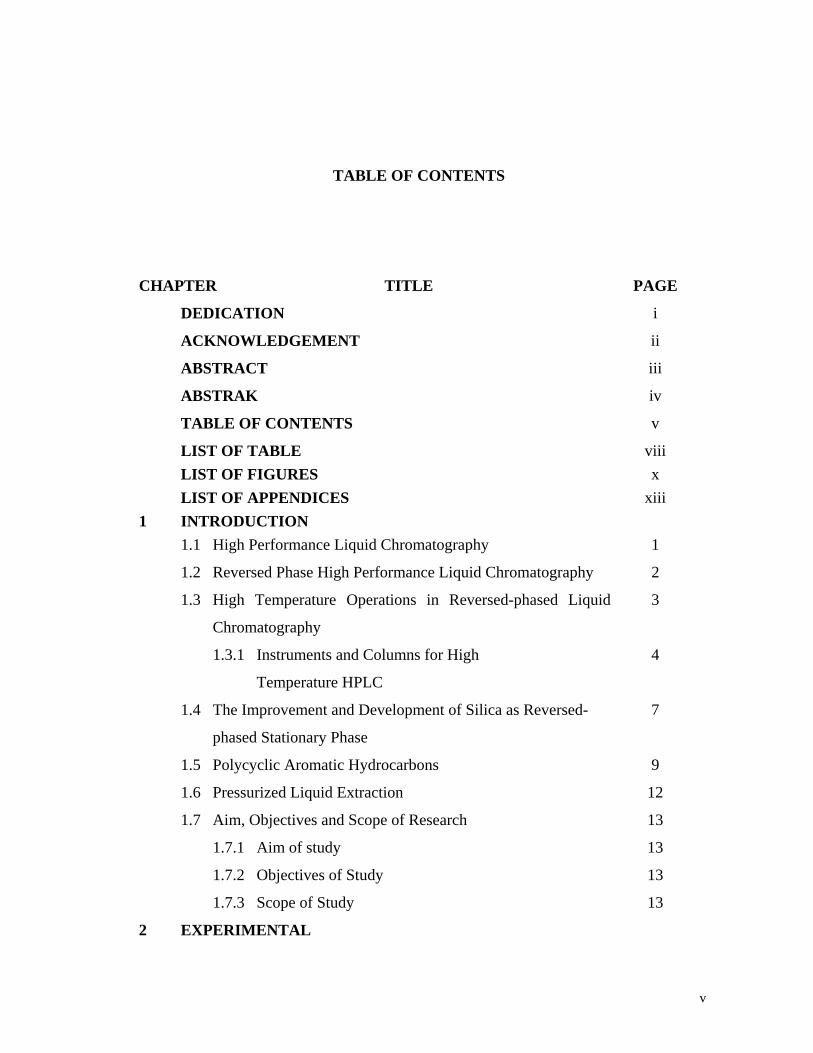
TABLE OF CONTENTS
CHAPTER TITLE PAGE
DEDICATION i
ACKNOWLEDGEMENT ii
ABSTRACT iii
ABSTRAK iv
TABLE OF CONTENTS v
LIST OF TABLE viii LIST OF FIGURES x LIST OF APPENDICES xiii 1 INTRODUCTION 1.1 High Performance Liquid Chromatography 1
1.2 Reversed Phase High Performance Liquid Chromatography 2
1.3 High Temperature Operations in Reversed-phased Liquid
Chromatography
3
1.3.1 Instruments and Columns for High
Temperature HPLC
4
1.4 The Improvement and Development of Silica as Reversed-
phased Stationary Phase
7
1.5 Polycyclic Aromatic Hydrocarbons 9
1.6 Pressurized Liquid Extraction 12
1.7 Aim, Objectives and Scope of Research 13
1.7.1 Aim of study 13
1.7.2 Objectives of Study 13
1.7.3 Scope of Study 13
2 EXPERIMENTAL
v
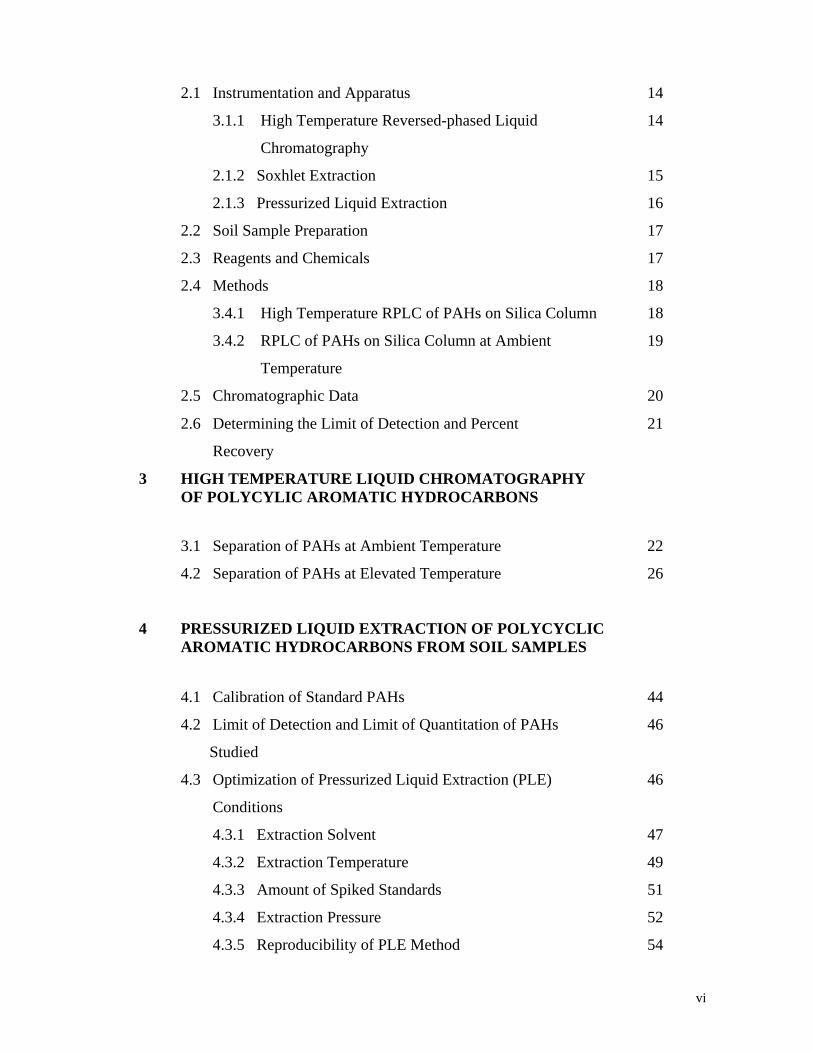
2.1 Instrumentation and Apparatus 14
3.1.1 High Temperature Reversed-phased Liquid
Chromatography
14
2.1.2 Soxhlet Extraction 15
2.1.3 Pressurized Liquid Extraction 16
2.2 Soil Sample Preparation 17
2.3 Reagents and Chemicals 17
2.4 Methods 18
3.4.1 High Temperature RPLC of PAHs on Silica Column 18
3.4.2 RPLC of PAHs on Silica Column at Ambient
Temperature
19
2.5 Chromatographic Data 20
2.6 Determining the Limit of Detection and Percent
Recovery
21
3 HIGH TEMPERATURE LIQUID CHROMATOGRAPHY OF POLYCYLIC AROMATIC HYDROCARBONS
3.1 Separation of PAHs at Ambient Temperature 22
4.2 Separation of PAHs at Elevated Temperature
26
4 PRESSURIZED LIQUID EXTRACTION OF POLYCYCLIC AROMATIC HYDROCARBONS FROM SOIL SAMPLES
4.1 Calibration of Standard PAHs 44
4.2 Limit of Detection and Limit of Quantitation of PAHs
Studied
46
4.3 Optimization of Pressurized Liquid Extraction (PLE)
Conditions
46
4.3.1 Extraction Solvent 47
4.3.2 Extraction Temperature 49
4.3.3 Amount of Spiked Standards 51
4.3.4 Extraction Pressure 52
4.3.5 Reproducibility of PLE Method 54
vi

4.4 Comparison between PLE with Soxhlet
Extraction
55
4.5 Application of the Developed PLE Method to the Analysis of
Soil samples
57
5 CONCLUSIONS AND SUGGESTIONS FOR FURTHER STUDY
5.1 Conclusions 61
6.2 Suggestions for Further Study
63
REFERENCES 64
APPENDICES 72
vii
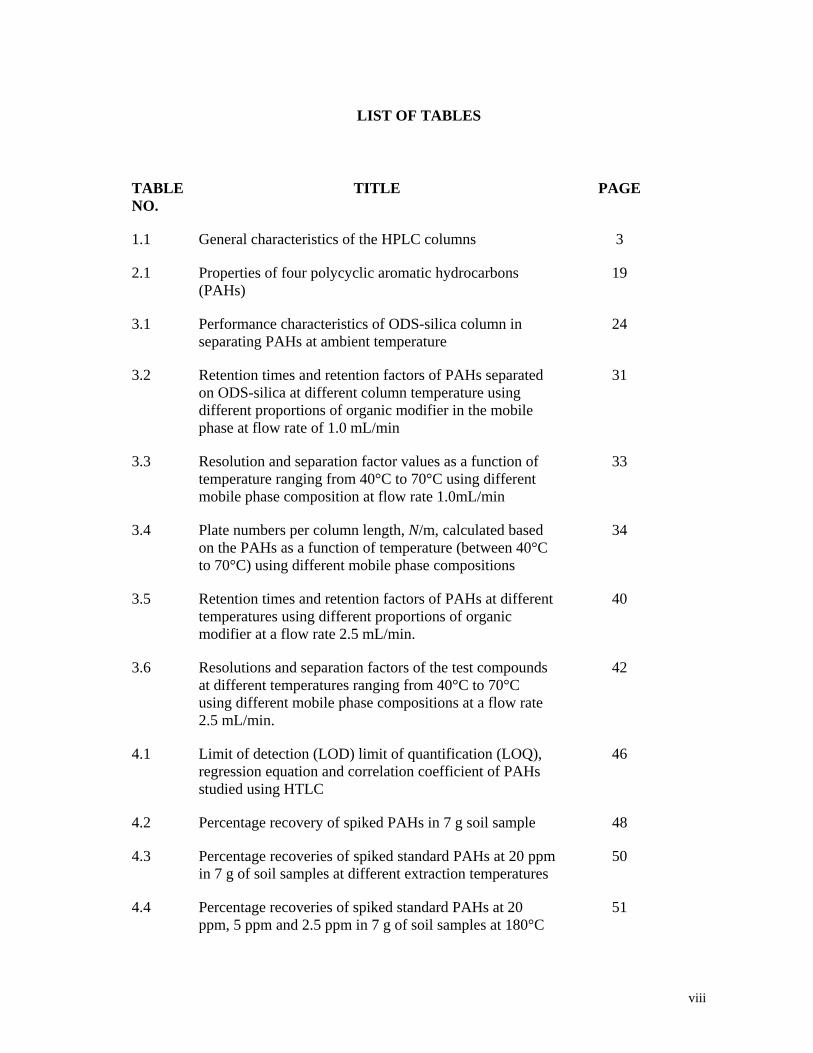
LIST OF TABLES
TABLE NO.
TITLE PAGE
1.1 General characteristics of the HPLC columns 3
2.1 Properties of four polycyclic aromatic hydrocarbons (PAHs)
19
3.1 Performance characteristics of ODS-silica column in separating PAHs at ambient temperature
24
3.2 Retention times and retention factors of PAHs separated on ODS-silica at different column temperature using different proportions of organic modifier in the mobile phase at flow rate of 1.0 mL/min
31
3.3 Resolution and separation factor values as a function of temperature ranging from 40°C to 70°C using different mobile phase composition at flow rate 1.0mL/min
33
3.4 Plate numbers per column length, N/m, calculated based on the PAHs as a function of temperature (between 40°C to 70°C) using different mobile phase compositions
34
3.5 Retention times and retention factors of PAHs at different temperatures using different proportions of organic modifier at a flow rate 2.5 mL/min.
40
3.6 Resolutions and separation factors of the test compounds at different temperatures ranging from 40°C to 70°C using different mobile phase compositions at a flow rate 2.5 mL/min.
42
4.1 Limit of detection (LOD) limit of quantification (LOQ), regression equation and correlation coefficient of PAHs studied using HTLC
46
4.2 Percentage recovery of spiked PAHs in 7 g soil sample 48
4.3 Percentage recoveries of spiked standard PAHs at 20 ppm in 7 g of soil samples at different extraction temperatures
50
4.4 Percentage recoveries of spiked standard PAHs at 20 ppm, 5 ppm and 2.5 ppm in 7 g of soil samples at 180°C
51
viii

TABLE NO.
TITLE PAGE
4.5 Percent recovery of analyte studies at different extraction pressure
52
4.6 Relative percentage recoveries and standard deviation of analytes studied between day to day
54
4.7 Comparison of extraction efficiencies of spiked 20 ppm PAHs in soil samples between Soxhlet and PLE
56
4.8 PAHs concentrations in five soil samples using developed PLE method followed by HTLC determination
58
ix
LIST OF FIGURES
FIGURE NO. TITLE PAGE
2.1 Diagrams of high temperature liquid chromatography system 15
2.2 Soxhlet extraction apparatus 16
2.3 Schematic of pressurized liquid extraction system 17
3.1 Separation of PAHs on ODS-silica at 24°C (ambient temperature) with different mobile phase compositions. Separation conditions: ODS-silica column (100 mm × 4.6 mm I.D.) mobile phase: acetonitrile-water (a) 70:30; (b) 60:40; (c) 50:50; (d) 40:60 (v/v); flow rate: 1.0 mL/min; detection: UV absorbance at 254 nm. Peaks: (1) naphthalene; (2) fluorene; (3) phenanthrene; (4) fluoranthene
23
3.2 Variation of retention factor (k) with different proportions of organic modifier in the mobile phase for PAHs at 22°C (ambient temperature)
26
3.3 HPLC separations of PAHs using acetonitrile-water 70:30 (v/v) as eluent at different column temperatures. The separation condition: ODS-silica column (100 mm × 4.6 mm I.D.); flow rate: 1.0 mL/min; UV absorbance at 254 nm. Peaks: (1) naphthalene; (2) fluorene; (3) phenanthrene; (4) fluoranthene
28
3.4 HPLC separations of PAHs using acetonitrile-water 60:40 (v/v) as eluent at different column temperatures. Separation conditions: ODS-silica column (100 mm × 4.6 mm I.D.); flow rate: 1.0 mL/min; detection: UV absorbance at 254 nm. Peaks: (1) naphthalene, (2) fluorene; (3) phenanthrene; (4) fluoranthene
29
3.5 HPLC separations of PAHs using acetonitrile-water 50:50 (v/v) as eluent at different column temperatures. Separation conditions: ODS-silica column (100 mm × 4.6 mm I.D.); flow rate: 1.0 ml/min; detection: UV absorbance at 254 nm. Peaks: (1) naphthalene; (2) fluorene; (3) phenanthrene; (4) fluoranthene
30
x
FIGURE NO. TITLE PAGE
3.6 Variation of column efficiencies calculated based on (phenanthrene) at different column temperatures with acetonitrile-water 50:50 (v/v) as the mobile phase
35
3.7 HPLC separations of PAHs compound using acetonitrile-water 50:50 (v/v) as eluent at different column temperatures. Separation condition: ODS-silica column (100 mm × 4.6 mm I.D.), flow rate: 2.5 mL/min; detection: UV absorbance at 254 nm. Peaks: (1) naphthalene; (2) fluorene; (3) phenanthrene; (4) fluoranthene
36
3.8 HPLC separations of PAHs using acetonitrile-water 40:60 (v/v) as eluent at different column temperatures. Separation condition: ODS-silica column (100 mm × 4.6 mm I.D.); flow rate: 2.5 mL/min; detection: UV absorbance at 254 nm. Peaks: (1) naphthalene; (2) fluorene; (3) phenanthrene; (4) fluoranthene
37
3.9 HPLC separations of PAHs using acetonitrile-water 30:70 (v/v) as eluent at different column temperatures. Separation conditions: ODS-silica column (100 mm × 4.6 mm I.D.), flow rate: 2.5 mL/min; detection: UV absorbance at 254 nm. Peaks: (1) naphthalene; (2) fluorene; (3) phenanthrene; (4) fluoranthene
38
3.10 Variation of retention factor (k) for PAHs with mobile phase compositions
41
4.1 Calibration graphs (peak area of compound/peak area of internal standard vs. concentration of compound) of four PAHs studied using HTLC: (A) naphthalene, (B) fluorene, (C) phenanthrene, (D) fluoranthene. Chromatographic condition: mobile phase acetonitrile-water 40:60 (v/v); flow rate 2.5 mL; temperature 70°C; UV absorbance 254 nm; injection volume 5µL.
45
4.2 Average percentage recoveries of spiked 50 ppm PAHs in soil samples using different extraction solvents
49
4.3 Average percentage recovery of PAHs studied at different extraction pressures
53
4.4 Average percentage recovery of spiked 20 ppm standard PAHs in soil sample
57
xi
FIGURE NO. TITLE PAGE
4.5 Chromatograms of PAHs extracted from soil samples using HTLC. A) Sample 1; B) Sample 2; C) Sample 3. D) Sample 4; E) Sample 5. Chromatographic condition: ODS-silica column (100 mm × 4.6 mm I.D.); mobile phase 40:60 (v/v); flow rate 2.5 mL/min; temperature 70°C; UV absorbance 254 nm; injection volume 5µL. Peaks: (2) fluorene; (3) phenanthrene; (4) fluoranthene.
59
xii
LIST OF APPENDICES
APPENDIX TITLE PAGE
1 High temperature liquid chromatography of extracts from spiked PAHs (50 ppm) in soils sample using PLE at different solvent extractions.
72
2 List of Publications 73
3 List of Awards 75
xiii
CHAPTER 1
INTRODUCTION
1.1 High Performance Liquid Chromatography
Chromatography is a separation technique of two or more components in a
mixture due to the differentiation in interaction (chemically or physically) or
adsorption between mobile phase and stationary phase. In early, 1970's, most
chemical separations were carried out using a variety of techniques including open-
column chromatography, paper chromatography, and thin-layer chromatography.
However, these chromatographic techniques were inadequate for quantification of
compounds and resolution between similar compounds. During this time, pressurized
liquid chromatography began to be used to increase flow through time, thus reducing
purification times of compounds being isolated by column chromatography.
However, flow rates were inconsistent, and the question of whether it was better to
have constant flow rate or constant pressure was debated [1].
High Performance Liquid Chromatography (HPLC) was developed in the mid
1970's and quickly improved with the development of column packing materials and
the additional convenience of on-line detectors. In the late 1970's, new methods
including reversed phase liquid chromatography allowed for improved separation
between very similar compounds. By the 1980's HPLC was commonly used for the
separation of chemical compounds. New techniques improved separation,
identification, purification and quantification far above the previous techniques [2].
Computers and automation were added to the convenience of HPLC. Improvements
in type of columns and thus reproducibility were made.
1
1.2 Reversed Phase High Performance Liquid Chromatography
In many analytical laboratories, HPLC has become an indispensable
technique for the analysis of samples, the determination of physical constants and the
isolation of purified components from complex mixtures. Now, HPLC has found
broad acceptance as the analytical technique of choice in many scientific and
application-oriented areas such as life sciences, food, synthetic polymers and
environmental chemistry. In addition, in order to meet legal requirements in
application areas such as pharmaceutical and clinical chemistry, HPLC analysis
protocols are standardized and validated [3].
Among the different available HPLC separation modes, e.g. normal phase
(NPLC) or size exclusion chromatography (SEC), definitely reversed-phase liquid
chromatography (RPLC) has taken and still takes a dominant position. It is estimated
that presently about 80-90% of HPLC separations are performed using RPLC [4]. As
already mentioned, the availability of many high quality RP columns together with
the large number of tools to control and optimize separations substantially contribute
to the great popularity of RPLC.
Although the development of RPLC already started about four decades ago,
the technique is still very popular and of great and growing interest. Therefore,
RPLC is a continuous subject of substantial research efforts in universities and with
manufacturers as well. In turn, this results in a constant appearance of RPLC-
oriented books, and scientific and technical papers [3-5]. In addition, new and also
special equipment and columns for RPLC are continuously developed and marketed.
In general, a reversed phase system consists of a non-polar stationary phase,
typically an alkyl ligand bonded to a silica surface, and a polar mobile phase. The
mobile phase is generally a mixture of water and an organic modifier such as
methanol or acetonitrile. Ideally, pure water could be used as a reversed-phase
mobile phase. However, at room temperature, water is too weak of an eluent for all
but the most polar of the solutes. For this reason, organic modifiers are used to
increase the elution strength of the mobile phase [6].
2
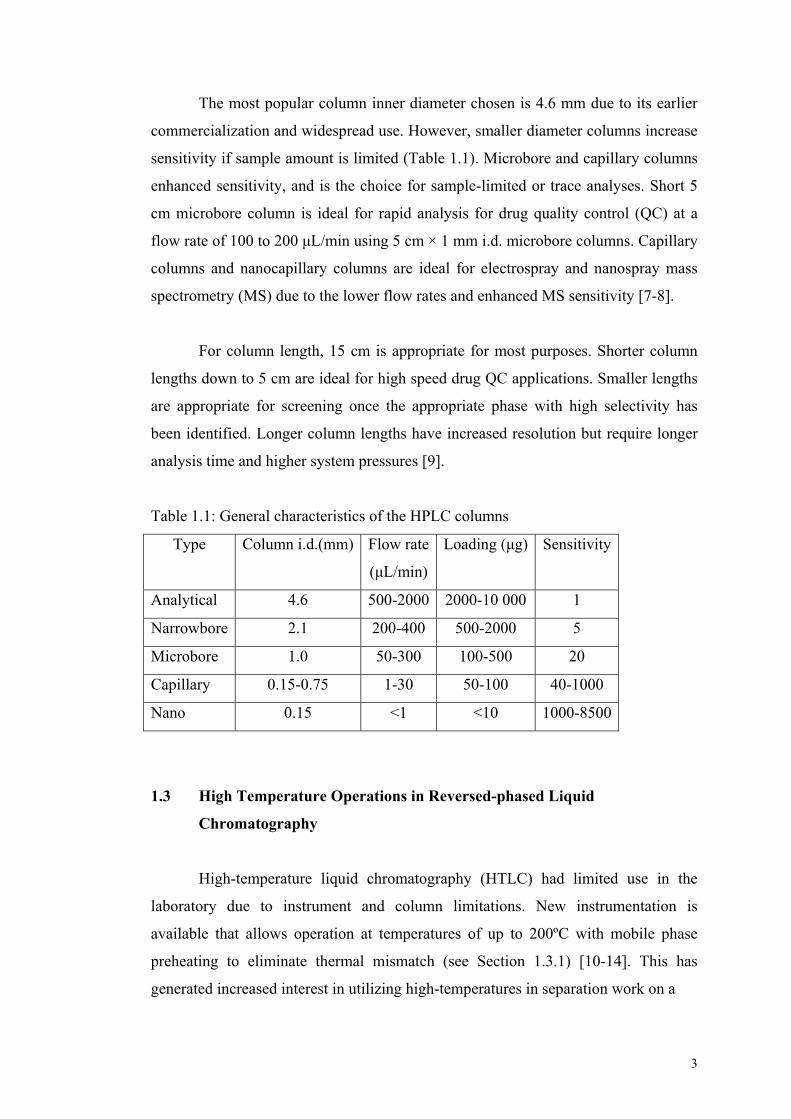
The most popular column inner diameter chosen is 4.6 mm due to its earlier
commercialization and widespread use. However, smaller diameter columns increase
sensitivity if sample amount is limited (Table 1.1). Microbore and capillary columns
enhanced sensitivity, and is the choice for sample-limited or trace analyses. Short 5
cm microbore column is ideal for rapid analysis for drug quality control (QC) at a
flow rate of 100 to 200 µL/min using 5 cm × 1 mm i.d. microbore columns. Capillary
columns and nanocapillary columns are ideal for electrospray and nanospray mass
spectrometry (MS) due to the lower flow rates and enhanced MS sensitivity [7-8].
For column length, 15 cm is appropriate for most purposes. Shorter column
lengths down to 5 cm are ideal for high speed drug QC applications. Smaller lengths
are appropriate for screening once the appropriate phase with high selectivity has
been identified. Longer column lengths have increased resolution but require longer
analysis time and higher system pressures [9].
Table 1.1: General characteristics of the HPLC columns
Type Column i.d.(mm) Flow rate
(µL/min)
Loading (µg) Sensitivity
Analytical 4.6 500-2000 2000-10 000 1
Narrowbore 2.1 200-400 500-2000 5
Microbore 1.0 50-300 100-500 20
Capillary 0.15-0.75 1-30 50-100 40-1000
Nano 0.15 <1 <10 1000-8500
1.3 High Temperature Operations in Reversed-phased Liquid
Chromatography
High-temperature liquid chromatography (HTLC) had limited use in the
laboratory due to instrument and column limitations. New instrumentation is
available that allows operation at temperatures of up to 200ºC with mobile phase
preheating to eliminate thermal mismatch (see Section 1.3.1) [10-14]. This has
generated increased interest in utilizing high-temperatures in separation work on a
3
more routine basis. Column selection, however, is still rather limited; no stationary
phases other than those based on zirconia have been used at this extreme temperature
for routine work. Stationary phases based on graphitic carbon, rigid polystyrene-
divinylbenzene polymeric particles and polydentate silica phases should be stable at
much higher temperatures than the traditional limits of 50 or 60ºC. One of the most
intriguing aspects of HTLC is the ability to perform temperature programming [15-
16].
The advantages of utilizing elevated temperatures in HPLC analysis are well
documented in the literature. HTLC offers several distinct advantages to the
separation scientist. Back pressure is reduced as the temperature is increased,
allowing the use of stationary phases with smaller particle sizes for increased
efficiency. The analyst can also operate at higher flow rates because of lower back
pressure. The Van Deemter curve “flatten out” as a result of increased diffusion rates
within the stationary phase and the mobile phase as the temperature is increased,
allowing operations at flow rates that are many times the optimal velocity without the
sacrifice in efficiency that is found at ambient temperature. The net result is faster
and more efficient separations [17-20].
1.3.1 Instruments and Columns for High Temperature HPLC
The influence and important of the role of the temperature in HPLC has been
neglected or underestimated for a long time. This is surprising because in HPLC
temperature influences many relevant physical parameters such as viscosity,
diffusivity of the analytes in mobile and stationary phases and also sample solubility.
Working under controlled, fixed temperatures or temperature programming
conditions is a strong tool to adjust and to improve retention and selectivity. In
addition, higher temperatures also decrease eluent viscosity allowing significantly
higher linear eluent velocities. As a result, retention times can be drastically reduced.
Concomitantly at higher temperatures also the diffusivity of analytes in the mobile
and stationary phases increases, resulting in much better efficiencies and improved
peak shapes. Combining these latter effects, higher temperatures in RP-HPLC may
provide better resolution and faster analysis.
4
In addition, at higher analysis temperatures also less amounts of organic
modifiers in eluent are needed to achieve the same separation. In turn, this
contributes to the reduction in the use of toxic organic solvents and hence contributes
to the appearance of “greener” laboratories. Also opposite to the change in the
amount of organic modifiers in eluent, which needs a certain equilibrium time,
temperature is more flexible and easily adjustable parameter to optimize
chromatographic separation. A recent review outlines the use of temperature
programming with capillary and microbore columns. Temperature programming with
microbore columns was reported in the literature as early as 1983 [21].
Instrument limitations have prevented the use of temperature programming
with standard 4.6 mm i.d. column. One aspect critical to successful HTLC analysis
with 4.6 mm i.d. column is adequate preheating of the mobile phase. Heat from a
forced-air oven alone is sufficient to warm the mobile phase to the same temperature
as the column because the columns used are lower in mass and operated at lower
flow rates. If the mobile phase is not preheated, the cool mobile phase entering the
heated column will warm up faster along the walls of the column than in the center.
The warmer mobile phase in this region will flow faster than that in the column
center and lead to band broadening. This ‘thermal mismatch” band broadening is
eliminated if the mobile phase is preheated [22-26]. Thermal mismatch band
broadening can occur at temperatures as low as 80ºC with 4.6 mm i.d. columns.
New instrumentation is now commercially available to perform temperature-
programmed HPLC at temperatures of up to 200ºC with 4.6 mm i.d. columns [15-
16]. This technique allows the user to perform a temperature program to alter
retention and selectivity in place of a solvent gradient. This is possible because
hydrogen bonding effects in water are reduced as the temperature is increased,
making it less polar so that water behaves like a moderately polar organic solvent
like methanol or acetonitrile during the separation process. This means that many
separations requiring a binary solvent gradient can be separated isocratically using a
temperature program [27-29].
Although a number of column heaters have been available for several years
that are capable of operation at temperatures of up to 100ºC, traditional silica based
5
column packings were only stable to about 60ºC when used with aprotic solvents. It
was not until the creation of zirconia based stationary phases that high-temperature
liquid chromatography was seriously investigated as a routine laboratory technique.
Although these zirconia stationary phases are most often the only ones that come to
mind for high-temperature use, there are other commercially available columns that
can be used at temperatures of up to 200ºC.
A number of papers [12-15] have reported the evaluation a number of
different stationary phases under HTLC conditions using temperature programming.
The columns were ZirChom, PBD, CARB, DiamondBond column, C8
polydentate
silica column, PRP-1 polymeric column and HyperCarb column consisting of a
graphitic carbon stationary phase. The C8
and PRP-1 columns had an essentially flat
baseline. The HyperCarb column exhibited a slight rise in the baseline starting at
about 150°C continuing to 200°C. The zirconia based columns exhibited excessive
column bleed under temperature-programmed high temperature HPLC conditions.
The ZirChom PBD column had a steep rise in the baseline with a maximum
absorbance at 220 nm. The ZirChom DiamondBond column had the largest baseline
rise with a maximum absorbance of almost 1.5 AU at 220 nm. This large baseline
rise was not observed with the C8, PRP-1 or HyperCarb columns or when the
columns were replaced with a stainless steel union in the instrument. This suggests
that the observed baseline rise was caused by some material leaching from the
packing of the zirconia columns during the temperature-programmed run. This
material “bleeding” from the column absorbs in the UV at 254 nm and 220 nm.
The variation in retention time and efficiency was ±10% in most cases for
each set of conditions. No lost of efficiency or retention was observed after exposure
to high-temperatures even when combined with pH extremes. Stationary phase
collapse due to extreme temperature or temperature-programming should have
resulted in a loss of retention and efficiency. No significant change in back pressure
was observed during the course of the evaluation with any of the columns during
analysis [30]. Zirconia based stationary phase can be regarded as one of the latest
high thermal stability stationary phases introduced and is able to withstand extended
exposure to column temperature as high as 150ºC. Zirconia has very rich surface
6
chemistry and able to operate at a wider pH range of 1-14 [15]. In contrast, for
conventional alkyl silane bonded phases, high temperature will directly accelerate the
dissolution of silica in aqueous solution.
The advantages of zirconia as a stationary phase were more apparent with the
development of polybutadiene-coated zirconia and carbon-clad zirconia stationary
phase. Zirconia columns coated with polybutadiene (PBD) have been widely used as
a reversed-phase HPLC stationary phase because it is a more durable substrate
compared with conventional silica-based phases, while not imparting the high
retentive characteristics of the aromatic polymer-based column. Carr and Li
established a reversed phase/cation-exchange mixed-mode chromatographic system
on PBD phases [31]. The existence of hydroxyl groups on the surface of zirconia
control the surface chemistry and reflected in its cation and anion exchange
properties.
1.4 The Improvement and Development of Silica as Reversed-Phase
Stationary Phase
By far, silica is still the most popular substrate to manufacture RP stationary
phases. Silica has a high mechanical strength that enables its use under the high
pressure conditions encountered in HPLC. Furthermore, this substrate does not swell
or shrink when exposed to organic solvents. Finally, its production and bonding
chemistry is well understood and can be performed in much different morphology
and also is reproducible. For this reason, silica seems the perfect starting material for
the manufacturing of (bonded) phases for HPLC. During the last decades, many
workers have suggested several different approaches for the synthesis of silica-based
RP stationary phases and also to improve their chemical and thermal stability.
Recently, the preparation and properties of different types of RP stationary phases
were extensively discussed and reviewed by Nawrocki et al. [32].
However, depending on the physico-chemical properties of the stationary
phase, the eluent composition and other experimental parameters silica and silica-
based RP stationary phase are vulnerable to deterioration effects. This in turn may
7
result in early column failure. Silica dissolves slightly in the pH range 2-7. The
saturation concentration is about 100 ppm and the value is somewhat dependent on
the pH. Above approximately pH 7, however, silica dissolution is substantially
accelerated. This in turn causes the impairment of the silica backbone of an RP
stationary phase. This process generally results in reduced plate numbers and finally
in column clogging. At acidic pH values of the eluent, another process is mainly
responsible for the deterioration of RPLC stationary phases. The organic ligands of
most of the presently manufactured RP phases are covalently bonded to the silica
surface by mono- or polyfunctional siloxane bonds [4, 5, 33, 34].
Silica dissolution is greatly influenced by the nature of the starting substrate
material. In principle, silica can be manufactured by a so-called silgel or a solgel
process [35]. Apart from other differences solgel silicas have significantly thicker
walls in their morphological structures compared to silgel-based silica types.
Kirkland et al. [36] showed that bonded phases prepared from solgel silicas are
significantly more stable towards aggressive alkaline eluents compared to silgel-
based RP phases.
Another approach to improve the chemical stability of silica substrates and
thus also of the resulting RP stationary phases is described by Neue et al. [34] called
hybrid organic-inorganic technology process. Furthermore, Collins et al. [37]
described that titanium grafting or zirconization of silica substrates may also
substantially improve the chemical stability under neutral and high pH conditions
[27].
In a later study, Kirkland et al. [36] investigated a number of RP C-18 phases
under non-recycling conditions using freshly prepared eluents at pH 10. Neue et al.
[34] have discussed another interesting concept for the preparation of alkyl-modified
silicas of substantially improved chemical stability. However, silica may slowly
dissolve during operation under some mobile phase conditions. If any degradation of
the silica occurs there is, in essence, no loss of the stationary phase. Retention
remains constant as only the silica surface remains. Eventually, however, the silica
may dissolve enough for the column to no longer be of use. When this occurs it
8
should be a quick loss in performance not a slow change or gradual loss in retention
[36].
1.5 Polycyclic Aromatic Hydrocarbons
Polycyclic aromatic hydrocarbons (PAHs) are a class of diverse organic
compounds containing two or more fused aromatic rings of the carbon and
hydrocarbon atoms. They are ubiquitous pollutants formed from the combustion of
fossil fuels and are always found as a mixture of individual compounds. PAHs as one
of the typical persistent organic compounds (POPs) featured in regional and global
cycling. PAHs are emitted mainly into the atmosphere and have been detected at
long distances from their source. Because of their low vapor pressures, compounds
with five or more aromatic rings exist mainly adsorbed to airborne particulate matter,
such as fly ash and soot [38].
PAHs are reported to have mutagenic and/or carcinogenic effects. The ability
of polycyclic aromatic hydrocarbons (PAHs) to induce cancer has been documented
by epidemiological studies of worker in coal tar, creosote, coal gas, coke, and cutting
oil industries. The European Union (EU) has therefore developed a directive for
controlling six PAHs in drinking water. Some analogues of these compounds, such
as polycyclic aromatic sulfur heterocycles (PASHs), are also potentially mutagenic
and carcinogenic. But, although they have a high bioaccumulation and have been
found in some water and sediment samples, they have not been studied as
extensively as PAHs [39].
PAHs are adsorbed strongly to the organic fraction of sediments and soils.
Therefore, it can be concluded that sediments and soils are usually considered as the
main sinks for PAHs in the environment and PAHs with four or more aromatic rings
are persistent in the environment. In order to minimize or prevent adverse effects of
POPs, many studies illustrate the fate of POPs in natural environments. In the past 20
years, numerous important researches focused on transport of POPs in multimedia
environment, such as between soil/water, etc.
9
The World Health Organization has issued a guide value maximum of 10
mg/mL for the single PAH benzo[a]pyrene. Because certain PAH isomers exist and
because many of these PAHs are toxic or even carcinogenic/mutagenic, the
development of an accurate and sensitive separation method is needed.
Recommended analytical procedures are documented or proposed in several USA
and European guidelines including the US Environmental Protection Agency (EPA)
method. International Standard Organization (ISO) methods, German Standard
(DIN) method and Dutch Standard (NEN) method. The EPA methods comprises a
list of 16 PAH priority pollutants; the German and Dutch standard methods only
specify 6 and 10 PAHs, respectively. Because more and more PAHs are identified
and investigated on their toxicity it can be expected that the list will be extended in
the near future [40].
Some PAHs have been demonstrated to cause cancer in human. For over 200
years, it has been known that prolonged exposure in occupational settings to very
high levels of coal tar, the principal toxic ingredient of which is benzo[a]pyrene,
leads to cancer in humans [38]. In 1775, the occurrence of scrotal cancer in chimney
sweeps was associated with the soot lodged in the crevices of their skin. Modern
workers in coke oven and gas production plants likewise experience increased levels
of lung and kidney cancer due to this PAH.
The main cause of lung cancer is the inhalation of cigarette smoke, which
contains many carcinogenic compounds in addition to PAHs. It is difficult to deduce
from health statistics the much smaller influences of pollutants such as PAHs from
other sources. Research has been established that the PAH molecules themselves are
not carcinogenic agents, rather they must be transformed by several metabolic
reactions in the body before the actual cancer-causing species is produced. A number
of PAHs have been found to cause tumors in laboratory animals that were exposed to
PAHs through their food, from breathing contaminated air and when they were
applied on their skin. When pregnant mice ate high doses of a PAH (benzo(a)pyrene)
they experienced reproductive problems. In addition, the offspring of the pregnant
mice showed birth defects and a decrease in their body weight. Other effects include
damage to skin, body fluids and the immune system which helps the body fight
disease. Animal studies showed that mice exposed to 308 parts per million (ppm) of
10
PAHs (specifically benzo(a)pyrene) in food for 10 days (short term exposure) had
offspring with birth defects. Mice exposed to 923 ppm of benzo(a)pyrene in food for
months developed problems in the liver and blood [40].
Phenanthrene is a tricycle aromatic hydrocarbon that is found in high
concentrations in polycyclic aromatic hydrocarbon (PAH)-contaminated sediments,
surface soils and waste sites. These hydrophobic contaminants are widely distributed
in the environment, occurring as natural constituents of fossil fuels and their
anthropogenic pyrolysis products. Unlike the higher-molecular-weight PAHs,
phenanthrene does not pose a risk to human health, since it exhibit no genotoxic or
carcinogenic effects. However, they have been shown to be toxic to fish and algae
[41].
Phenanthrene is considered prototypic PAHs and serve as signature
compound to detect PAH contamination, since their chemical structures is found in
carcinogenic PAHs, such as benzo[a]pyrene. It has also been used as model PAH to
determine factors that effect the bioavailability, biodegradation potential, and rate of
microbial degradation of PAHs in the environment. A variety of bacterial species
have been isolated that have the ability to utilize phenanthrene as the sole source of
carbon and energy [41].
Fluorene is a solid colourless to white or pale yellow-green PAHs. Like most
PAHs, fluorene is used to make dyes, plastics and pesticides. One of the most
common ways fluorene can enter the human body is through breathing contaminated
air. It can get into the lungs when the person breathes it. If a man works in a
hazardous waste site where PAHs are disposed, he is likely to breathe fluorene or
other PAHs. If a person eats or drinks food and water that are contaminated with
PAHs, he or she could be exposed to PAHs. Once in the body, the PAHs can spread
and target fat tissues. Target organs include kidneys, liver and fat [41].
11

1.6 Pressurized Liquid Extraction
Pressurized liquid extraction (PLE) is a relatively simple sample preparation
technique for automated extraction of analytes in solid materials. At present it is
competing with other techniques like microwave-assisted extraction (MAE) and
supercritical fluid extraction (SFE) for the extraction of organic contaminants from
various solid matrices. There are several reasons why these methodologies have
evolved, and according to Wan and Wong [42] one of the major driving forces is the
increasing demands from authorities to reduce the large volumes of organic solvents
consumed by classic extraction methods such as Soxhlet.
The first reports on PLE appeared in 1995, presenting the basic experimental
setup as well as extraction results for spiked pesticides and herbicides in soils and
PAHs in urban dust. The recoveries obtained were in good agreement with Soxhlet
data, demonstrating the great potential of PLE in terms of speed and reduced organic
solvent consumption. The success of PLE, with a matrix independent quantitative
recovery of a number of compounds after only a few minutes of static extractions,
has been explained by the enhanced solubilization and desorption of analytes from
the matrix occurring at elevated temperatures (50-200ºC) and pressures (7-20 MPa)
[41].
Since PLE was demonstrated to be very efficient, the technique was rapidly
accepted by the US Environmental Protection Agency (EPA) as a method for
evaluation of solid wastes [40]. Another contributing factor for the rapid acceptance
of PLE is that the method development is rather straight-forward. Often the organic
solvent or combination of solvents utilized in existing Soxhlet method can simply be
adopted by the PLE method. Consequently, the year after the first publications
dealing with persistent organic pollutants (POPs) in soils and sediments were
presented ever since, the number of publications dealing with PLE of POPs has
increased, where the main focused has been on PAHs [41]. Surprisingly, one of the
most well known POPs world-wide, namely polychlorinated biphenyls (PCBs), have
been paid relatively little attention and the number of papers presented until today is
limited.
12
1.7 Aim, Objectives and Scope of Research
1.7.1 Aim of Study
The aim of this study is to develop an environmentally friendly, efficient and
a rapid separation method based on high temperature pressurized liquid extraction
and HPLC for the analysis of polycyclic aromatic hydrocarbons.
1.7.2 Objectives of Study
The objectives of this study are:
a) To study the RP-HPLC separation of PAHs at ambient and high temperatures
using various compositions of organic modifier in the mobile phase.
b) To develop pressurized liquid extraction method for PAHs in soil.
c) To compare the developed PLE method with Soxhlet extraction to soil samples.
1.7.3 Scope of Study
The separation of PAHs at ambient temperature was performed using mobile
phase compositions acetonitrile-water (v/v) at 70:30, 60:40, 50:50 and 40:60. While
the separation of PAHs at elevated temperature (50ºC, 60ºC, 70ºC) was carried out
using mobile phase compositions acetonitrile-water (v/v) at 70:30, 60:40, 50:50,
40:60 and 30:70. The recoveries of PAHs using pressurized liquid extraction
employed pressures ranging from 50 to 250 bar and temperatures ranging from 60°C
to 250°C. While the recoveries of PAHs using soxhlet extraction was carried out
with solvent extractor dichloromethane: acetone, hexane: acetone, dichloromethane
and acetone.
13
CHAPTER II
EXPERIMENTAL
2.1 Instrumentation and Apparatus
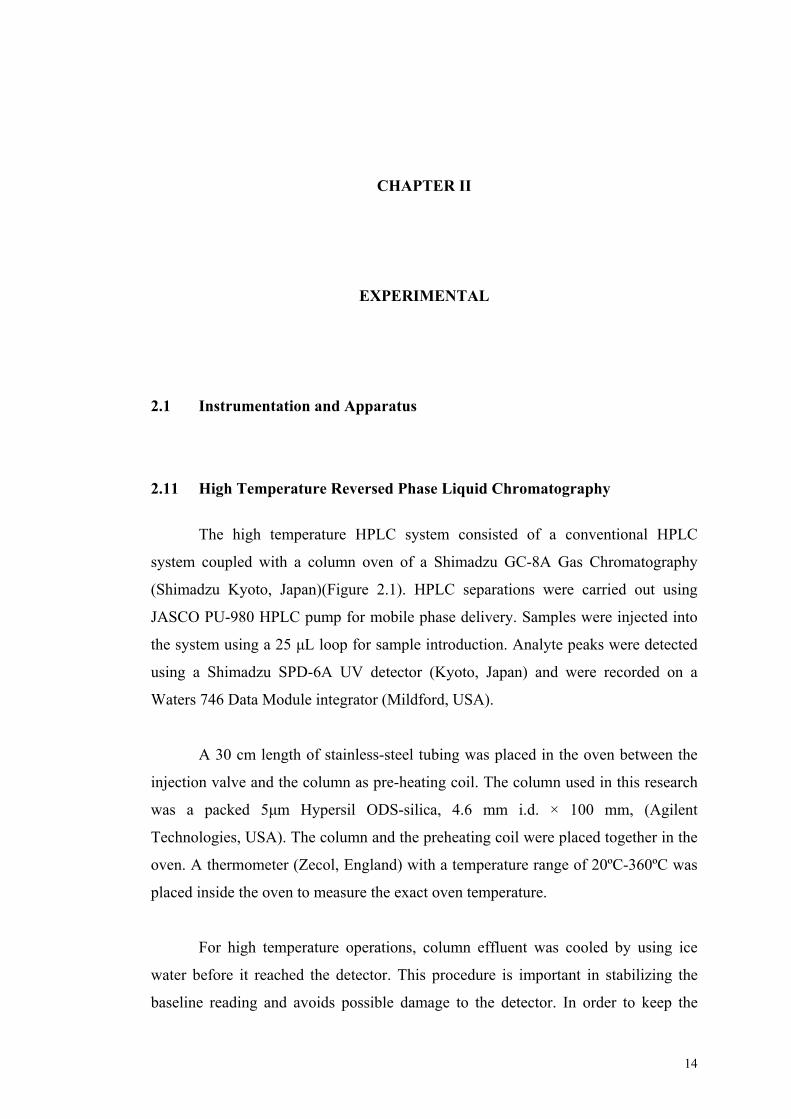
2.11 High Temperature Reversed Phase Liquid Chromatography
The high temperature HPLC system consisted of a conventional HPLC
system coupled with a column oven of a Shimadzu GC-8A Gas Chromatography
(Shimadzu Kyoto, Japan)(Figure 2.1). HPLC separations were carried out using
JASCO PU-980 HPLC pump for mobile phase delivery. Samples were injected into
the system using a 25 µL loop for sample introduction. Analyte peaks were detected
using a Shimadzu SPD-6A UV detector (Kyoto, Japan) and were recorded on a
Waters 746 Data Module integrator (Mildford, USA).
A 30 cm length of stainless-steel tubing was placed in the oven between the
injection valve and the column as pre-heating coil. The column used in this research
was a packed 5µm Hypersil ODS-silica, 4.6 mm i.d. × 100 mm, (Agilent
Technologies, USA). The column and the preheating coil were placed together in the
oven. A thermometer (Zecol, England) with a temperature range of 20ºC-360ºC was
placed inside the oven to measure the exact oven temperature.
For high temperature operations, column effluent was cooled by using ice
water before it reached the detector. This procedure is important in stabilizing the
baseline reading and avoids possible damage to the detector. In order to keep the
14

mobile phase from boiling when passing through the detector, aluminium tubing (0.1
mm i.d.) was placed at the outlet of the detector to serve as a restriction tubing to
apply a back pressure in the detector cell.
Mobile phase used in this research was degassed using a vacuum-ultrasonic
degassing procedure. Mobile phase was degassed in the ultrasonic bath (NEY 300
Ultrasonic, USA).
Solvent
Injection valve
HPLC Pump Oven
UV Detector
Integrator
column
Cooling system
Figure 2.1: Diagrams of high temperature liquid chromatography system
2.1.2 Soxhlet Extraction
The Soxhlet extraction method was based on EPA method 3540. In summary,
30 g of soil were mixed with 30 g anhydrous sodium sulfate to adsorb moisture. The
spiked standards of four PAHs was added in a soil sample and transfer into a
cellulose extraction thimble and inserted into a Soxhlet assembly fitted with a 250
mL flask (Figure 2.2). The solvents used were (i) dichloromethane-acetone, (ii)
hexane-acetone, (iii) dichloromethane, and (iv) acetone was heated for 20 hours. One
third of the extract was concentrated to 10 mL on a rotary evaporator and evaporated
under a gentle flow of nitrogen gas. Subsequently, 1 mL of solvent extract and 50 µL
15
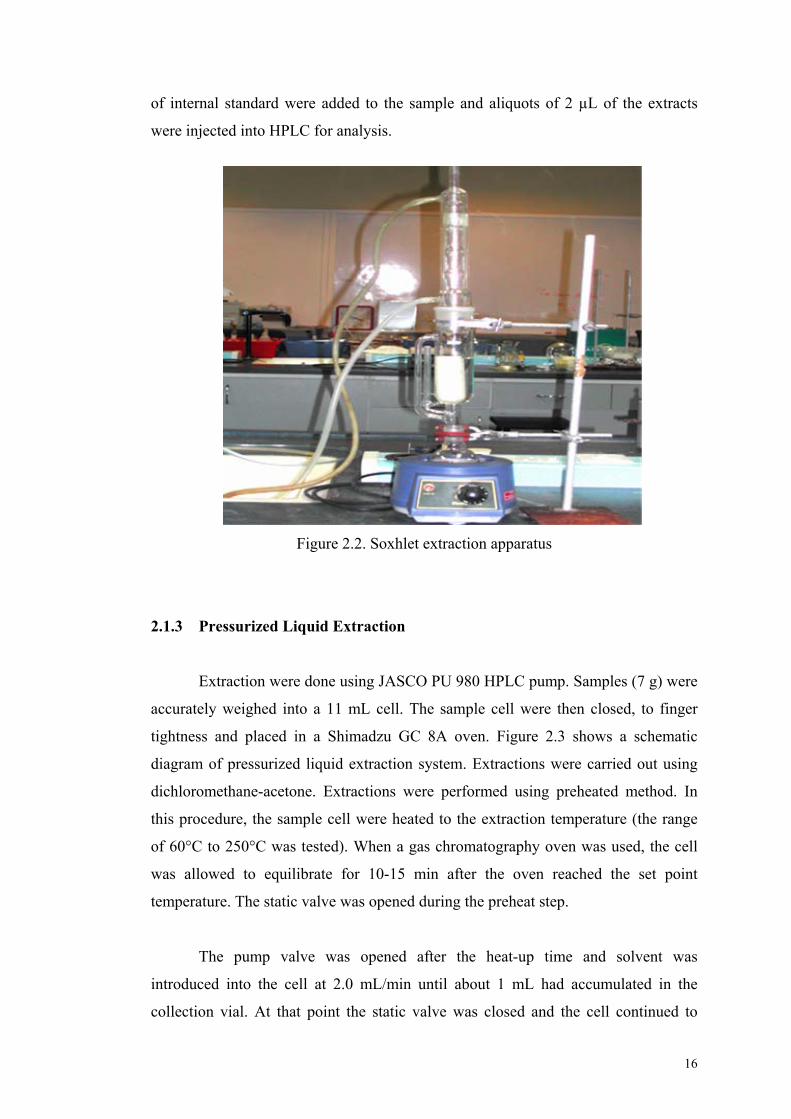
of internal standard were added to the sample and aliquots of 2 µL of the extracts
were injected into HPLC for analysis.
Figure 2.2. Soxhlet extraction apparatus
2.1.3 Pressurized Liquid Extraction
Extraction were done using JASCO PU 980 HPLC pump. Samples (7 g) were
accurately weighed into a 11 mL cell. The sample cell were then closed, to finger
tightness and placed in a Shimadzu GC 8A oven. Figure 2.3 shows a schematic
diagram of pressurized liquid extraction system. Extractions were carried out using
dichloromethane-acetone. Extractions were performed using preheated method. In
this procedure, the sample cell were heated to the extraction temperature (the range
of 60°C to 250°C was tested). When a gas chromatography oven was used, the cell
was allowed to equilibrate for 10-15 min after the oven reached the set point
temperature. The static valve was opened during the preheat step.
The pump valve was opened after the heat-up time and solvent was
introduced into the cell at 2.0 mL/min until about 1 mL had accumulated in the
collection vial. At that point the static valve was closed and the cell continued to
16

pressurize to the set point (50-250 bar). The static period for these studies was 5 min,
because longer periods did not show improvement in recoveries. After the static
period, the static valve was reopened, fresh solvent was introduced to flush the lines
and cell, and the extract was collected in the vial. During this solvent flush step, 50-
100% of the extraction cell volume of solvent was pumped into the cell.
extraction cell pump valve
HPLC pump
solvent GC oven
static valve
collection vial
Figure 2.3. Schematic diagram of pressurized liquid extraction system
2.2 Soil Sample Preparation
The land soils was sampled from a known site ( FELDA palm oil plantation,
Serting, Negeri Sembilan) and transported to the laboratory where it was air-dried for
24 h and then sieved through <7 mm sieve. The fine powdered soils were then stored
in air-tight containers for analysis.
2.3 Reagents and Chemicals
HPLC grade solvent acetonitrile was obtained from Scharlau (Barcelona, Spain).
Methanol solvent was obtained from HyperSolv (BDH Laboratory, U.K.). The
17

polycyclic aromatic hydrocarbons (napthalene (70211), fluorene (46880),
phenanthrene (77470), fluoranthene (46530) and internal standard (pyrene (82648)
were obtained from Fluka Chemika, Sigma-Aldrich Chemic, Steinheim,
(Switzerland). Double-distilled deionized water of at least 18 MΩ was purified by
Nano ultra pure water system (Barnstead, USA).
2.4 Methods
2.4.1 High Temperature RPLC of PAHs on Silica column
Samples of polycyclic aromatic hydrocarbons (PAHs) dissolved in
acetonitrile were injected in triplicate onto the column. Separation was carried out
using acetonitrile-water: 70:30, 60:40, 50:50, 40:60 and 30:70 at high temperatures
(40-70ºC) on silica column. The detection wavelength was set up at 254 nm and
system was eluted at a flow rate of 1.0 mL/min and 2.5 mL/min. Then, flushed with
fresh eluent for at least 30 min to stabilize the system. When a change was made to
the mobile phase composition, the system was flushed overnight at a flow rate of 0.1-
0.2 mL/min to make sure the column was equilibrated. At least 30 min was used to
stabilize the column temperature and equilibrium of the whole system.
All the stock solutions for each analyte (napthalene, fluorene, phenanthrene
and fluoranthene) were prepared at 1000 µg/mL by dissolving weighed amount of
analytes in acetonitrile. Internal mixture of the analytes was prepared by mixing the
specific quantities of analytes from respective stock solutions. The mixture solution
was kept in the freezer to avoid sample degradation. Approximately 2 µL of sample
mixture was injected into the HPLC system.
Retention factor, k; separation factor, α; theoretical number of separation
plates per column length, N/m; plate height, H and the resolution, Rs
were analysed
and calculated. The column efficiency and retention characteristic for high
temperature RP-HPLC system were observed and examined.
18
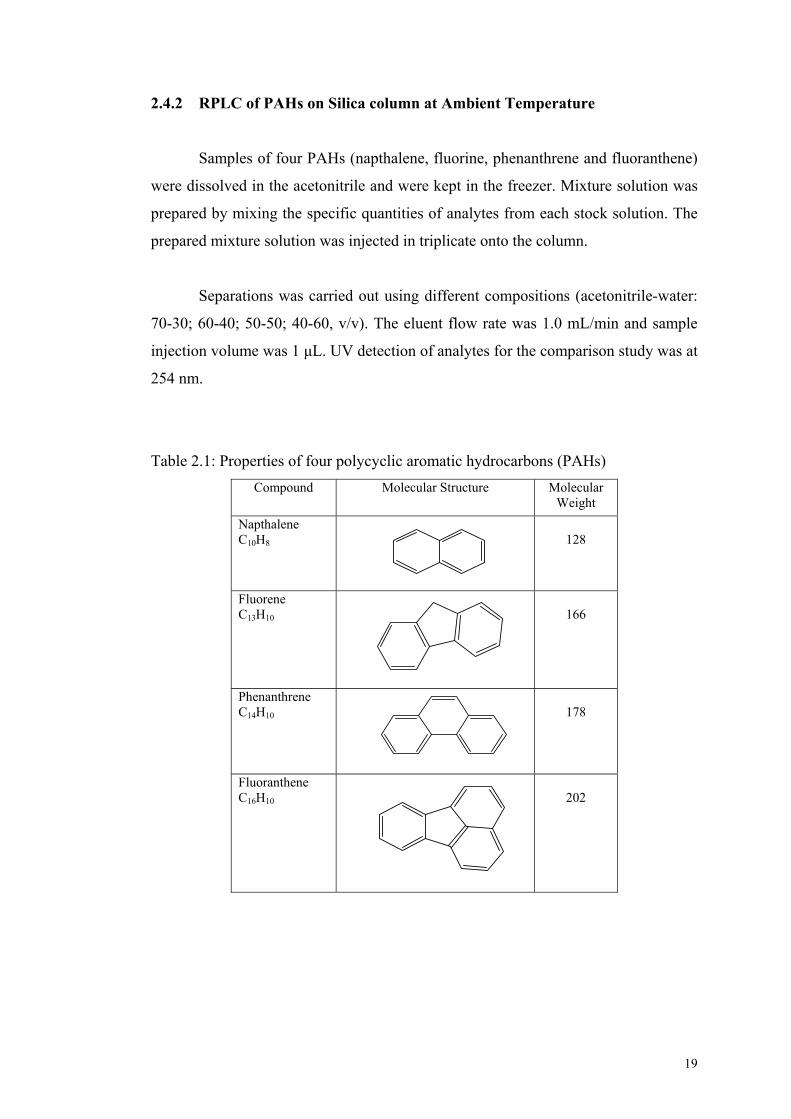
2.4.2 RPLC of PAHs on Silica column at Ambient Temperature
Samples of four PAHs (napthalene, fluorine, phenanthrene and fluoranthene)
were dissolved in the acetonitrile and were kept in the freezer. Mixture solution was
prepared by mixing the specific quantities of analytes from each stock solution. The
prepared mixture solution was injected in triplicate onto the column.
Separations was carried out using different compositions (acetonitrile-water:
70-30; 60-40; 50-50; 40-60, v/v). The eluent flow rate was 1.0 mL/min and sample
injection volume was 1 µL. UV detection of analytes for the comparison study was at
254 nm.
Table 2.1: Properties of four polycyclic aromatic hydrocarbons (PAHs) Compound
Molecular Structure Molecular
Weight Napthalene C10H8
128
Fluorene C13H10
166
Phenanthrene C14H10
178
Fluoranthene C16H10
202
19
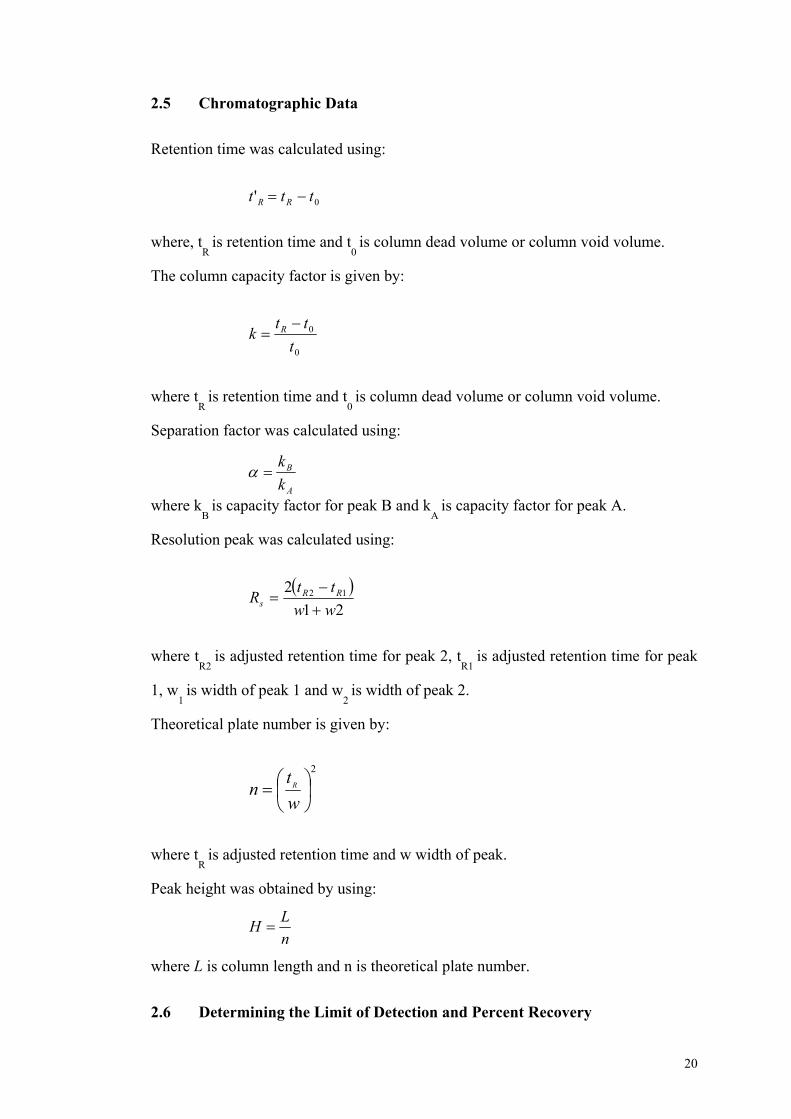
2.5 Chromatographic Data
Retention time was calculated using:
0' ttt RR −=
where, t
R is retention time and t
0 is column dead volume or column void volume.
The column capacity factor is given by:
0
0
ttt
k R −=
where t
R is retention time and t
0 is column dead volume or column void volume.
Separation factor was calculated using:
A
B
kk
=α
where kB
is capacity factor for peak B and kA
is capacity factor for peak A.
Resolution peak was calculated using:
( )
212 12
wwttR RR
s +−
=
where t
R2 is adjusted retention time for peak 2, t
R1 is adjusted retention time for peak
1, w1 is width of peak 1 and w
2 is width of peak 2.
Theoretical plate number is given by:
2
⎟⎠⎞
⎜⎝⎛=
wt
n R
where t
R is adjusted retention time and w width of peak.
Peak height was obtained by using:
nLH =
where L is column length and n is theoretical plate number.
2.6 Determining the Limit of Detection and Percent Recovery
20
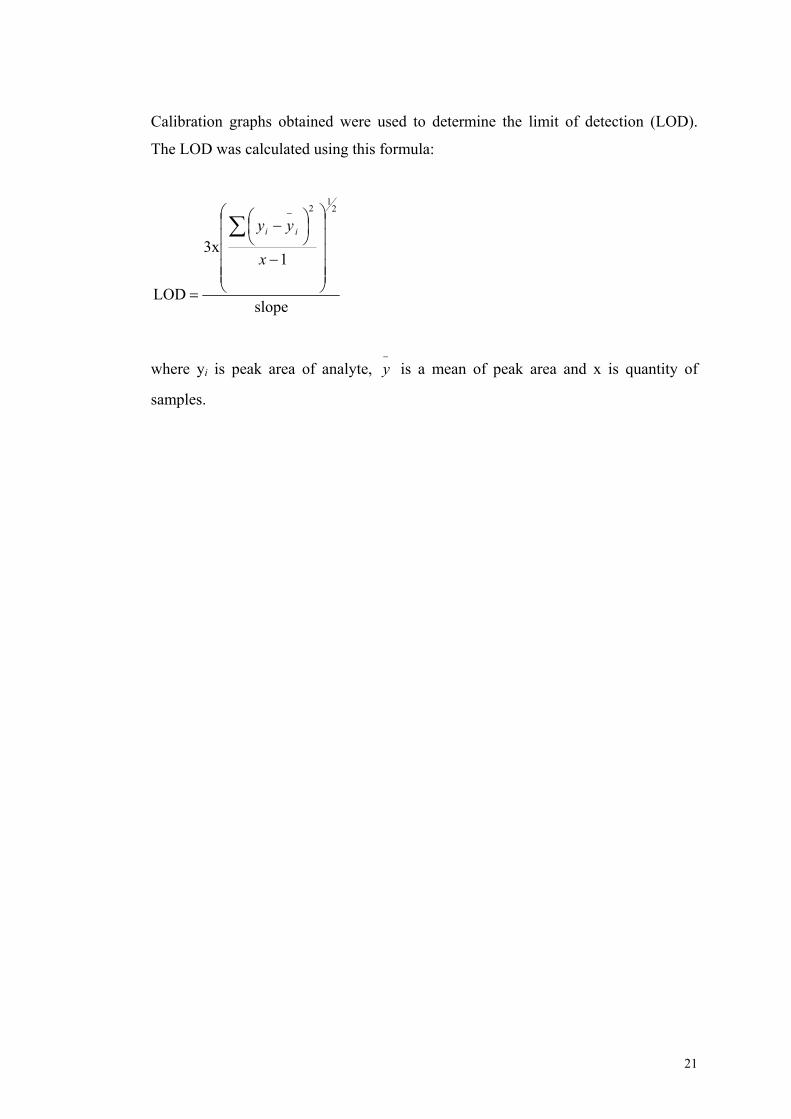
Calibration graphs obtained were used to determine the limit of detection (LOD).
The LOD was calculated using this formula:
slope
13x
LOD
21
2
⎟⎟⎟⎟⎟
⎠
⎞
⎜⎜⎜⎜⎜
⎝
⎛
−
⎟⎠⎞
⎜⎝⎛ −
=
∑−
x
yy ii
where yi is peak area of analyte, is a mean of peak area and x is quantity of
samples.
−
y
21
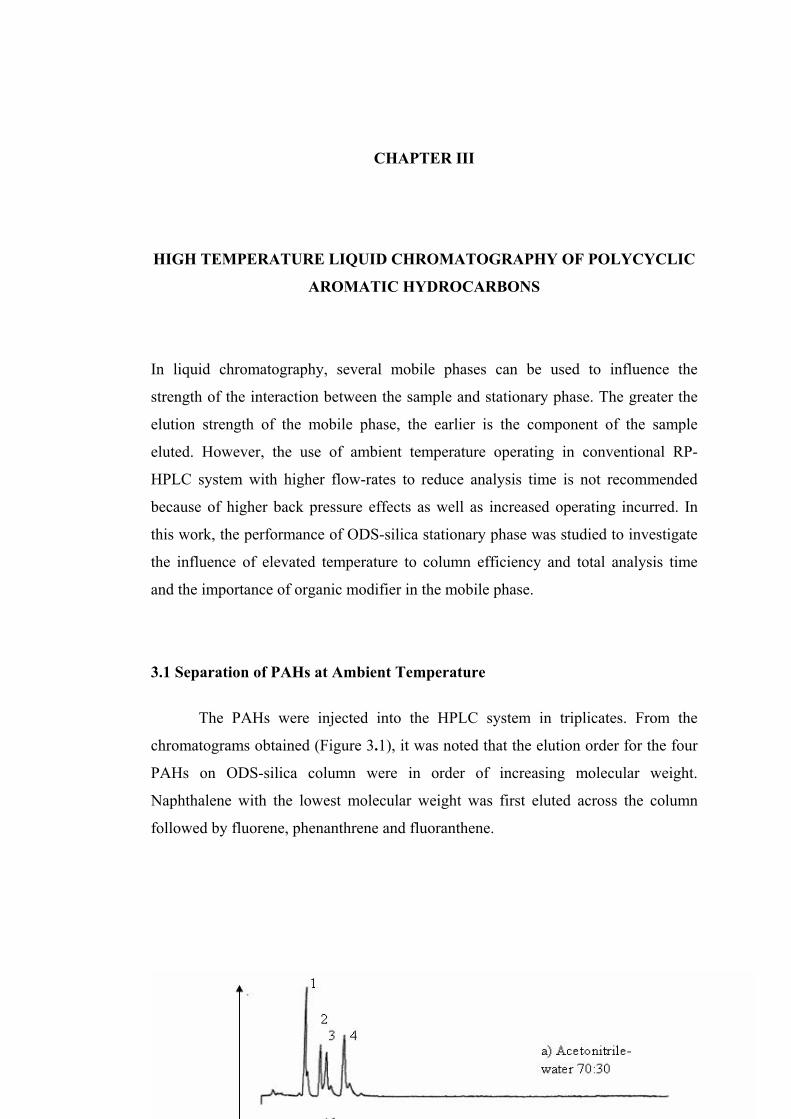
CHAPTER III
HIGH TEMPERATURE LIQUID CHROMATOGRAPHY OF POLYCYCLIC
AROMATIC HYDROCARBONS
In liquid chromatography, several mobile phases can be used to influence the
strength of the interaction between the sample and stationary phase. The greater the
elution strength of the mobile phase, the earlier is the component of the sample
eluted. However, the use of ambient temperature operating in conventional RP-
HPLC system with higher flow-rates to reduce analysis time is not recommended
because of higher back pressure effects as well as increased operating incurred. In
this work, the performance of ODS-silica stationary phase was studied to investigate
the influence of elevated temperature to column efficiency and total analysis time
and the importance of organic modifier in the mobile phase.
3.1 Separation of PAHs at Ambient Temperature
The PAHs were injected into the HPLC system in triplicates. From the
chromatograms obtained (Figure 3.1), it was noted that the elution order for the four
PAHs on ODS-silica column were in order of increasing molecular weight.
Naphthalene with the lowest molecular weight was first eluted across the column
followed by fluorene, phenanthrene and fluoranthene.
22

Figure 3.1: Separation of PAHs on ODS-silica at 24ºC (ambient temperature) with different mobile phase compositions. Separation conditions: ODS-silica column (100 mm × 4.6 mm I.D.) mobile hase: acetonitrile-water (a) 70:30; (b) 60:40; (c) 50:50; (d) 40:60 (v/v); flow rate: 1.0 mL/min; detection: UV absorbance at 254 nm. Peaks: (1) naphthalene; (2) fluorene; (3) phenanthrene; (4) fluoranthene.
The retention factor, k, separation factor, α, resolution, Rs,
and plate numbers
per column length, N/m, are summarized in Table 3.1. It was observed that the
retention factor for the PAHs decreased significantly with increasing percentage of
organic modifier (acetonitrile) used in the mobile phase ranging from 40 to 70 (v/v).
The test compounds were eluted within 60 min except for mobile phase composition
of acetonitrile-water 40:60 (v/v). A time of approximately 20 min was required to
separate all the compounds using acetonitrile-water 50:50 (v/v), 10 min using
23
p
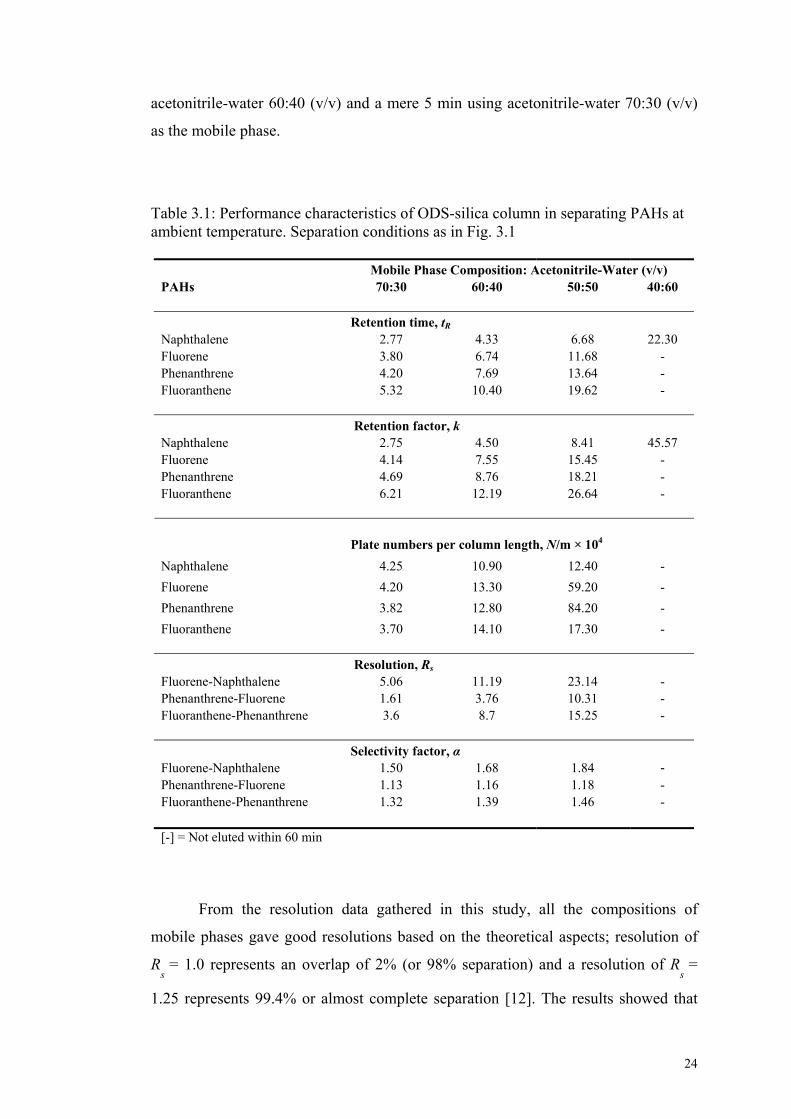
acetonitrile-water 60:40 (v/v) and a mere 5 min using acetonitrile-water 70:30 (v/v)
as the mobile phase.
Table 3.1: Performance characteristics of ODS-silica column in separating PAHs at ambient temperature. Separation conditions as in Fig. 3.1
Mobile Phase Composition: Acetonitrile-Water (v/v)
PAHs 70:30 60:40 50:50 40:60 Retention time, tR Naphthalene 2.77 4.33 6.68 22.30 Fluorene 3.80 6.74 11.68 - Phenanthrene 4.20 7.69 13.64 - Fluoranthene 5.32 10.40 19.62 -
Retention factor, k
Naphthalene 2.75 4.50 8.41 45.57 Fluorene 4.14 7.55 15.45 - Phenanthrene 4.69 8.76 18.21 - Fluoranthene 6.21 12.19 26.64 -
Plate numbers per column length, N/m × 104
Naphthalene 4.25 10.90 12.40 - Fluorene 4.20 13.30 59.20 - Phenanthrene 3.82 12.80 84.20 - Fluoranthene 3.70 14.10 17.30 -
Resolution, Rs
Fluorene-Naphthalene 5.06 11.19 23.14 - Phenanthrene-Fluorene 1.61 3.76 10.31 - Fluoranthene-Phenanthrene 3.6 8.7 15.25 -
Selectivity factor, α
Fluorene-Naphthalene 1.50 1.68 1.84 - Phenanthrene-Fluorene 1.13 1.16 1.18 - Fluoranthene-Phenanthrene 1.32 1.39 1.46 -
[-] = Not eluted within 60 min
From the resolution data gathered in this study, all the compositions of
mobile phases gave good resolutions based on the theoretical aspects; resolution of
Rs
= 1.0 represents an overlap of 2% (or 98% separation) and a resolution of Rs
=
1.25 represents 99.4% or almost complete separation [12]. The results showed that
24

the resolution for each pair of components were greater than 1.25 and hence,
sufficient for accurate quantification. It can be observed that the Rs
values for all
compound combinations were inversely proportional to the percentage of organic
modifier used in the mobile phase. Similarly, the retention factor values increased
consistently with the decrease of organic modifier percentage used in the mobile
phase. For example, with acetonitrile-water 70:30 (v/v) the retention factor was 2.75
and increased to 45.57 with acetonitrile-water 40:60. Results of plate numbers per
column length, N/m indicates that column efficiency of ODS-silica was in the good
range (> 10 000/m). The results show that no significant relationship between the
mobile phase composition with plate numbers per column length, N/m. The results
obtained that selectivity factor was inversely proportional to the percentages of
organic modifier used in the mobile phase. For example, selectivity factor for
fluorene/naphthalene was 1.50 with acetonitrile-water 70:30 and increased to 1.84
with acetonitrile-water 50:50.
The variation of retention factors with different proportions of organic
modifier in the mobile phase for PAHs compounds can be seen more clearly by
creating two-dimensional plots (Figure 3.2). The results suggest that organic
modifiers always play a very important role in activating the surface area of the
stationary phase, increasing the solubility of the solutes in mobile phase, increasing
the analytes transfer rates and reducing the total analysis time.
25
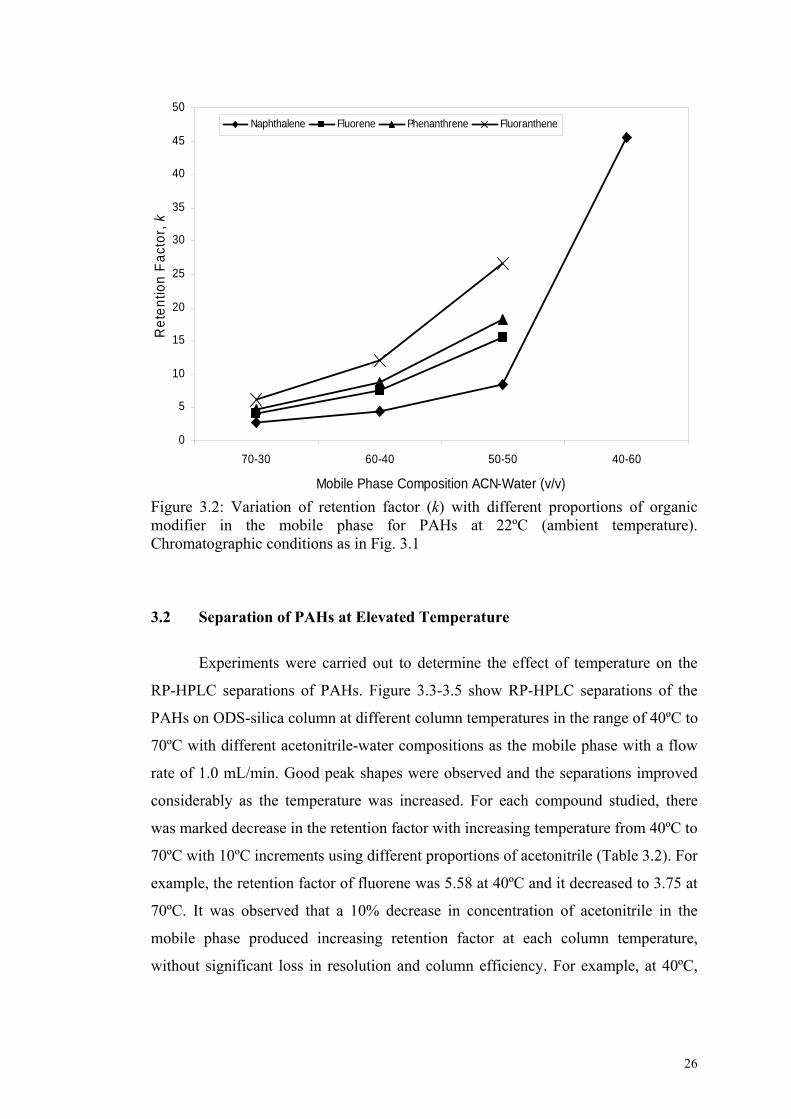
0
5
10
15
20
25
30
35
40
45
50
70-30 60-40 50-50 40-60
Mobile Phase Composition ACN-Water (v/v)
Ret
entio
n Fa
ctor
, k
Naphthalene Fluorene Phenanthrene Fluoranthene
Figure 3.2: Variation of retention factor (k) with different proportions of organic modifier in the mobile phase for PAHs at 22ºC (ambient temperature). Chromatographic conditions as in Fig. 3.1
3.2 Separation of PAHs at Elevated Temperature
Experiments were carried out to determine the effect of temperature on the
RP-HPLC separations of PAHs. Figure 3.3-3.5 show RP-HPLC separations of the
PAHs on ODS-silica column at different column temperatures in the range of 40ºC to
70ºC with different acetonitrile-water compositions as the mobile phase with a flow
rate of 1.0 mL/min. Good peak shapes were observed and the separations improved
considerably as the temperature was increased. For each compound studied, there
was marked decrease in the retention factor with increasing temperature from 40ºC to
70ºC with 10ºC increments using different proportions of acetonitrile (Table 3.2). For
example, the retention factor of fluorene was 5.58 at 40ºC and it decreased to 3.75 at
70ºC. It was observed that a 10% decrease in concentration of acetonitrile in the
mobile phase produced increasing retention factor at each column temperature,
without significant loss in resolution and column efficiency. For example, at 40ºC,
26
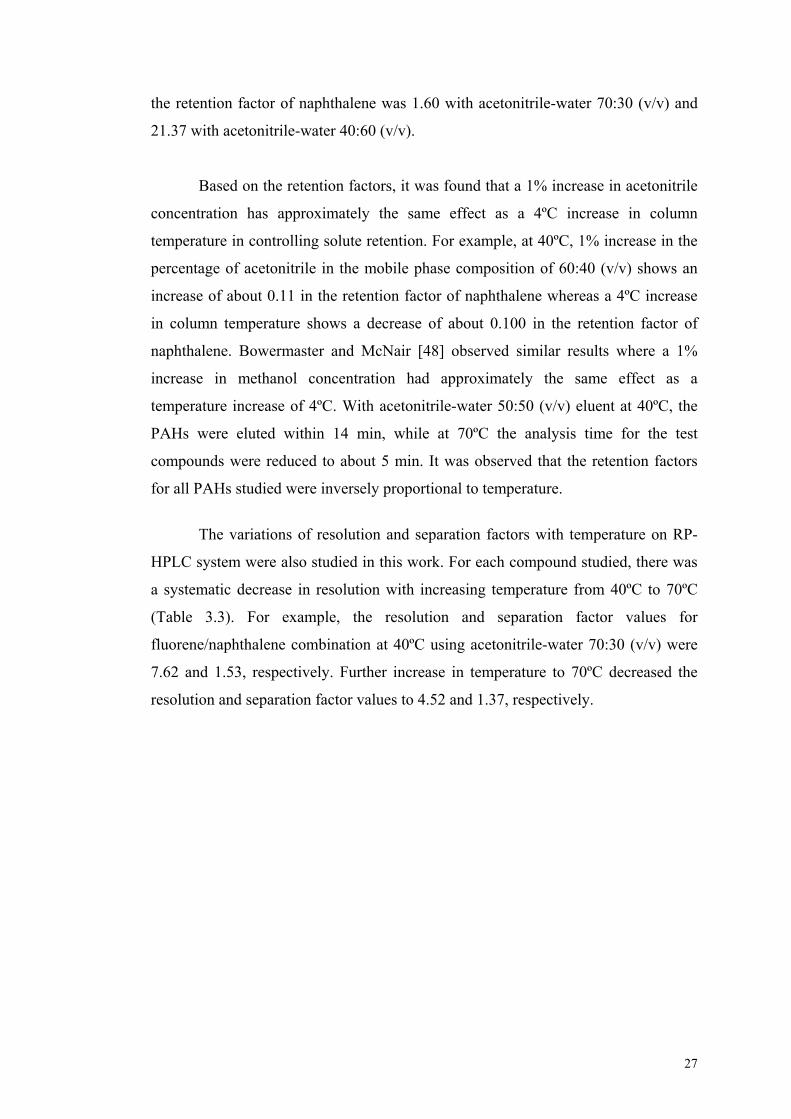
the retention factor of naphthalene was 1.60 with acetonitrile-water 70:30 (v/v) and
21.37 with acetonitrile-water 40:60 (v/v).
Based on the retention factors, it was found that a 1% increase in acetonitrile
concentration has approximately the same effect as a 4ºC increase in column
temperature in controlling solute retention. For example, at 40ºC, 1% increase in the
percentage of acetonitrile in the mobile phase composition of 60:40 (v/v) shows an
increase of about 0.11 in the retention factor of naphthalene whereas a 4ºC increase
in column temperature shows a decrease of about 0.100 in the retention factor of
naphthalene. Bowermaster and McNair [48] observed similar results where a 1%
increase in methanol concentration had approximately the same effect as a
temperature increase of 4ºC. With acetonitrile-water 50:50 (v/v) eluent at 40ºC, the
PAHs were eluted within 14 min, while at 70ºC the analysis time for the test
compounds were reduced to about 5 min. It was observed that the retention factors
for all PAHs studied were inversely proportional to temperature.
The variations of resolution and separation factors with temperature on RP-
HPLC system were also studied in this work. For each compound studied, there was
a systematic decrease in resolution with increasing temperature from 40ºC to 70ºC
(Table 3.3). For example, the resolution and separation factor values for
fluorene/naphthalene combination at 40ºC using acetonitrile-water 70:30 (v/v) were
7.62 and 1.53, respectively. Further increase in temperature to 70ºC decreased the
resolution and separation factor values to 4.52 and 1.37, respectively.
27
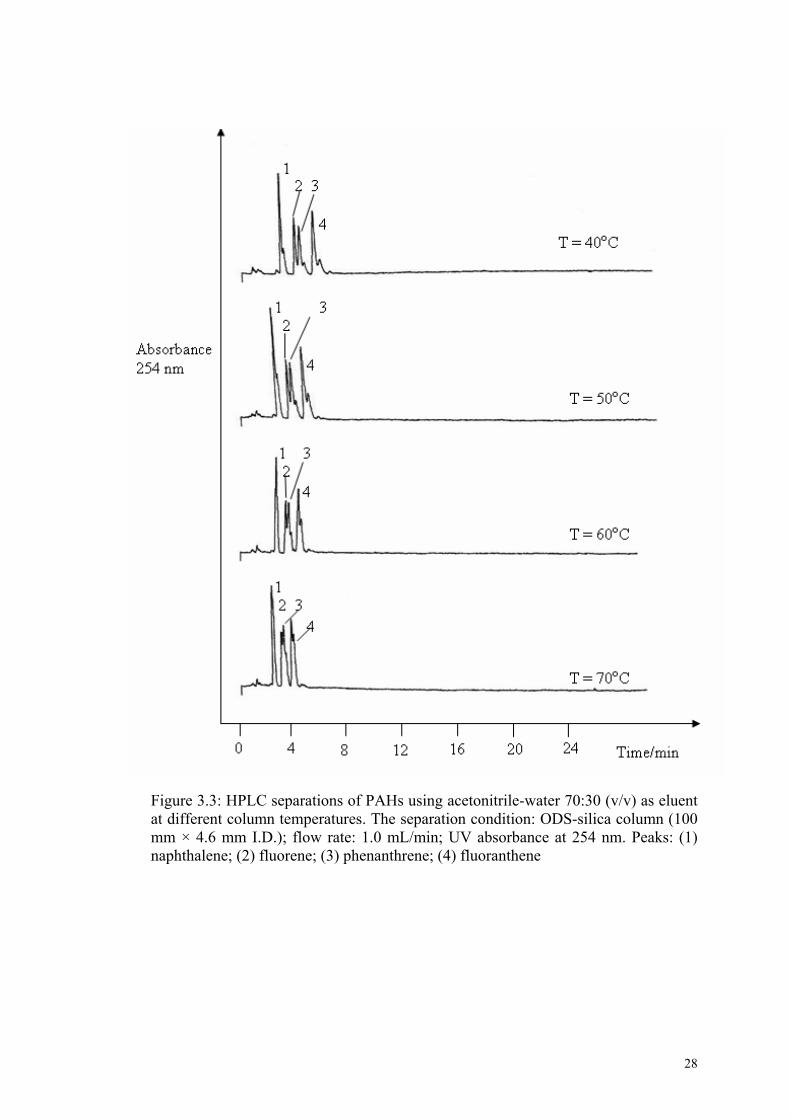
Figure 3.3: HPLC separations of PAHs using acetonitrile-water 70:30 (v/v) as eluent at different column temperatures. The separation condition: ODS-silica column (100 mm × 4.6 mm I.D.); flow rate: 1.0 mL/min; UV absorbance at 254 nm. Peaks: (1) naphthalene; (2) fluorene; (3) phenanthrene; (4) fluoranthene
28
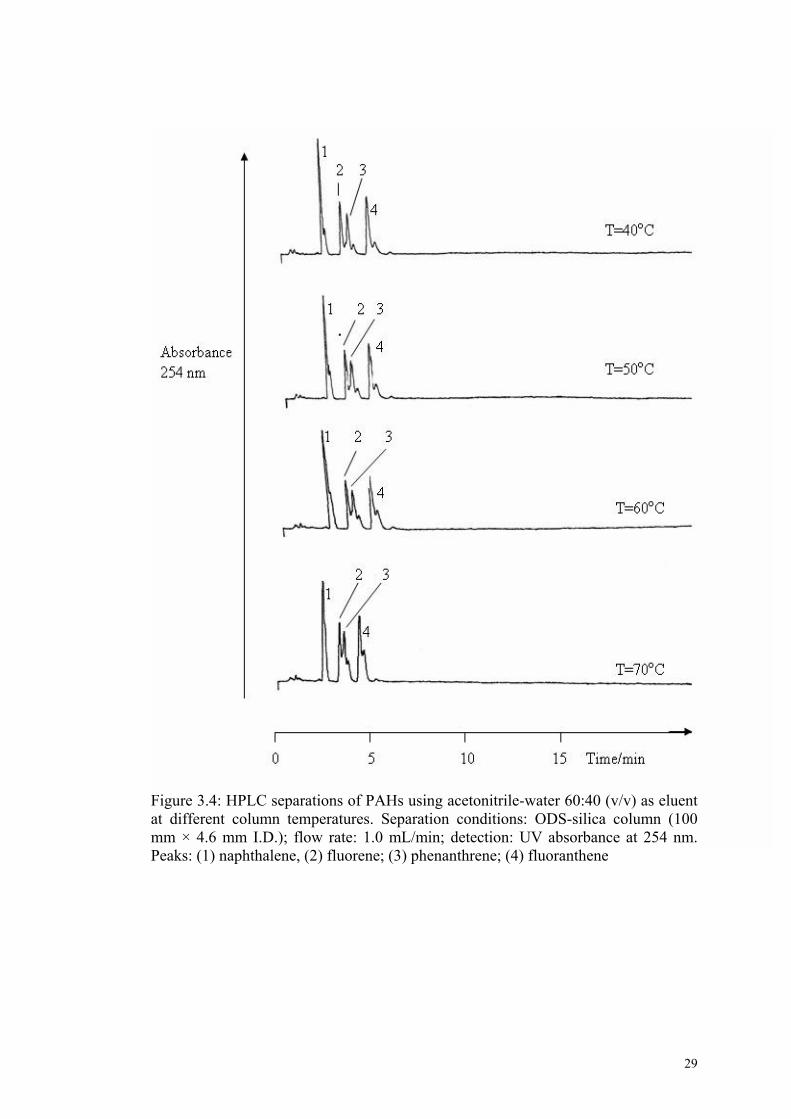
Figure 3.4: HPLC separations of PAHs using acetonitrile-water 60:40 (v/v) as eluent at different column temperatures. Separation conditions: ODS-silica column (100 mm × 4.6 mm I.D.); flow rate: 1.0 mL/min; detection: UV absorbance at 254 nm. Peaks: (1) naphthalene, (2) fluorene; (3) phenanthrene; (4) fluoranthene
29
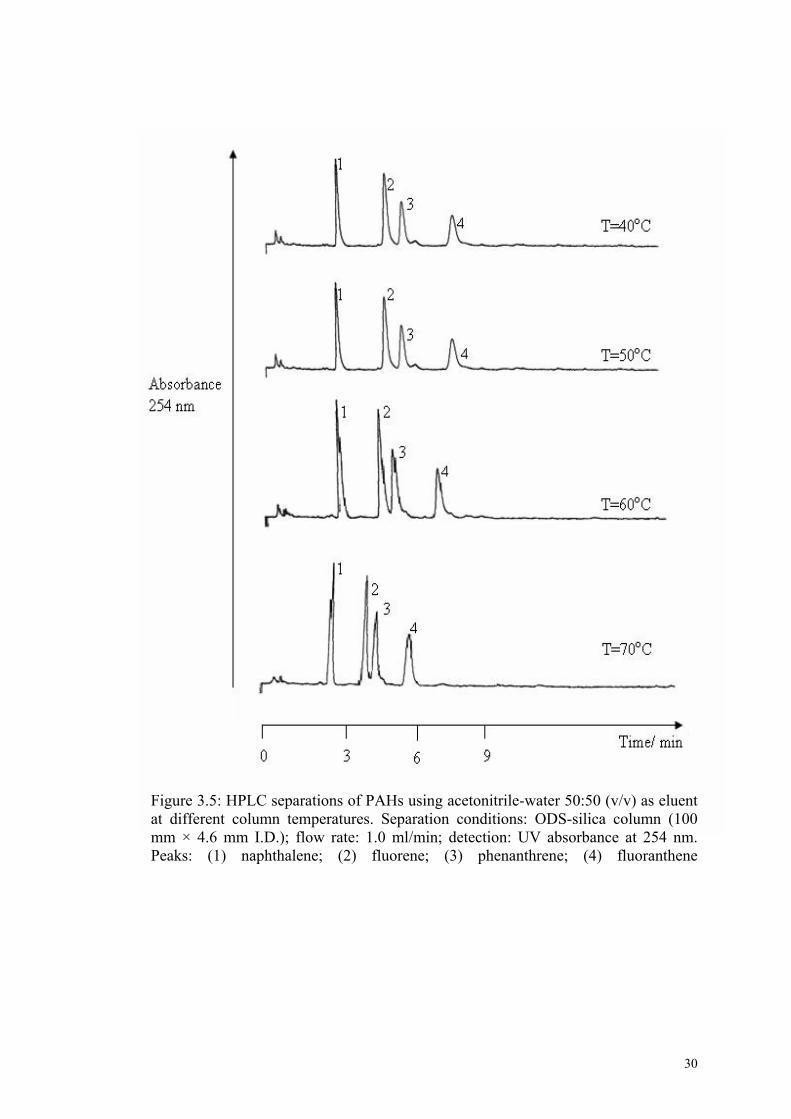
30
Figure 3.5: HPLC separations of PAHs using acetonitrile-water 50:50 (v/v) as eluent at different column temperatures. Separation conditions: ODS-silica column (100 mm × 4.6 mm I.D.); flow rate: 1.0 ml/min; detection: UV absorbance at 254 nm. Peaks: (1) naphthalene; (2) fluorene; (3) phenanthrene; (4) fluoranthene
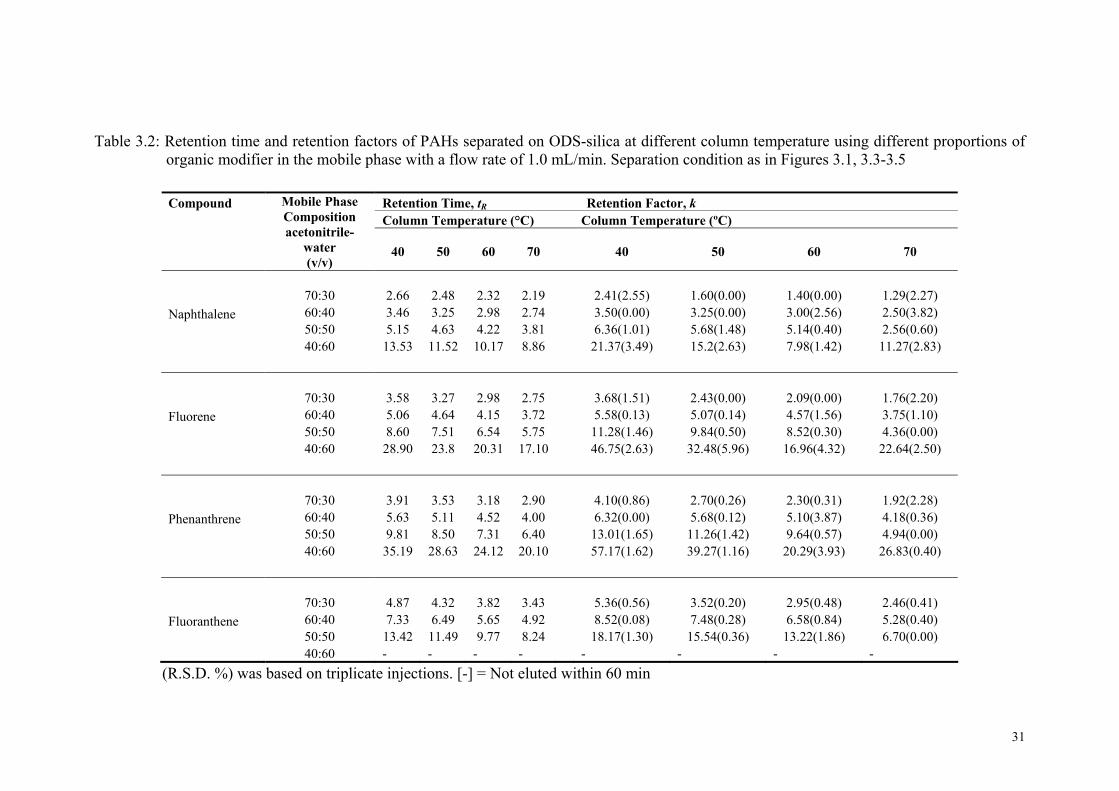
31
Table 3.2: Retention time and retention factors of PAHs separated on ODS-silica at different column temperature using different proportions of organic modifier in the mobile phase with a flow rate of 1.0 mL/min. Separation condition as in Figures 3.1, 3.3-3.5
(R.S.D. %) was based on triplicate injections. [-] = Not eluted within 60 min
Compound Retention Time, tR Retention Factor, k Column Temperature (°C) Column Temperature (ºC)
Mobile Phase Composition acetonitrile-
water (v/v)
40
50
60
70
40
50
60
70
70:30
2.66 2.48 2.32 2.19 2.41(2.55) 1.60(0.00) 1.40(0.00) 1.29(2.27)Naphthalene 60:40 3.46 3.25 2.98 2.74 3.50(0.00) 3.25(0.00) 3.00(2.56) 2.50(3.82) 50:50 5.15 4.63 4.22 3.81 6.36(1.01) 5.68(1.48) 5.14(0.40) 2.56(0.60) 40:60 13.53 11.52 10.17 8.86 21.37(3.49)
15.2(2.63)
7.98(1.42)
11.27(2.83)
70:30
3.58 3.27 2.98 2.75 3.68(1.51) 2.43(0.00) 2.09(0.00) 1.76(2.20)Fluorene 60:40 5.06 4.64 4.15 3.72 5.58(0.13) 5.07(0.14) 4.57(1.56) 3.75(1.10) 50:50 8.60 7.51 6.54 5.75 11.28(1.46) 9.84(0.50) 8.52(0.30) 4.36(0.00) 40:60 28.90 23.8 20.31 17.10 46.75(2.63)
32.48(5.96)
16.96(4.32)
22.64(2.50)
70:30
3.91 3.53 3.18 2.90 4.10(0.86) 2.70(0.26) 2.30(0.31) 1.92(2.28)Phenanthrene 60:40 5.63 5.11 4.52 4.00 6.32(0.00) 5.68(0.12) 5.10(3.87) 4.18(0.36) 50:50 9.81 8.50 7.31 6.40 13.01(1.65) 11.26(1.42) 9.64(0.57) 4.94(0.00) 40:60 35.19 28.63 24.12 20.10 57.17(1.62)
39.27(1.16)
20.29(3.93)
26.83(0.40)
70:30
4.87 4.32 3.82 3.43 5.36(0.56) 3.52(0.20) 2.95(0.48) 2.46(0.41)Fluoranthene 60:40 7.33 6.49 5.65 4.92 8.52(0.08) 7.48(0.28) 6.58(0.84) 5.28(0.40) 50:50 13.42
11.49
9.77
8.24
18.17(1.30)
15.54(0.36)
13.22(1.86)
6.70(0.00)
40:60 - - - - - - - -

32
The resolution data demonstrated that the best separation was achieved at column
temperature of 70ºC. The results show significant decrease in resolution values on going
from 40ºC to 70ºC for all analytes studied. For example, with acetonitrile-water 50:50
(v/v), it was observed that when the column temperature was increased from 40ºC to
70ºC, the resolution values for fluoranthene/phenanthrene pair decreased from 13.51 to
6.42. Therefore, in order to achieve good resolution, optimal separation conditions with
column temperature of 70ºC were used in subsequent experiments.
The overall column efficiency (N/m) observed for the silica column was
reasonable (>10 000 plates/m) (Table 3.4). The results obtained indicated that the plate
number, N, was proportional to the percentage of organic modifier used in the mobile
phase. For example, at 40ºC, the plate number based on fluorene was 12.50 × 10⁴
m-1
with
acetonitrile-water 70:30 (v/v) and 6.10 × 10⁴
m-1
with acetonitrile-water 40:60 (v/v). The
apparent plate numbers show significant improvement on increasing the temperature from
40ºC to 70ºC. For example at 40ºC with acetonitrile-water 70:30 (v/v), the plate numbers
per meter based on phenanthrene was 8.27 × 10⁴
m-1
and the value increased to 13.67 ×
104
m-1
at 70ºC. This was probably due to the increase in the diffusion coefficients of the
mobile phase and the analytes with the increase in column temperature. The variation of
column efficiency with different column temperature for PAHs can be observed clearly
from Figure 3.6. From the figure, it is evident that the column efficiency was directly
proportional to column temperature. Recent reviews by Yang et al. [11] have extensively
discussed the temperature effects on column efficiency by increasing the temperature
from 100ºC to 120ºC, the diffusivity is further increased and even better mass transfer
results. However, the better mass transfer also causes a greater axial molecular diffusion
and the lower column efficiency. This is the reason why the number of plates decreases
when the temperature is raised higher.

33
Table 3.3: Resolution and separation factor values as a function of temperature ranging from 40ºC to 70ºC using different mobile phase compositions with a flow rate of 1.0mL/min. Separation conditions as in Figures 3.1, 3.3-3.5
Compounds Resolution, Rs (R.S.D%) Separation factor, α (R.S.D. %)
Column Temperature (°C) Column Temperature (°C)
Mobile Phase
Composition acetonitrile-water (v/v) 40 50 60 70 40 50 60 70
70:30 7.62(1.46) 6.91(1.01) 5.15(1.11) 4.52(0.45) 1.53(0.46) 1.52(0.47) 1.49(0.00) 1.37(2.97)Fluorene Naphthalene 60:40
10.49(1.57) 9.63(2.92) 8.88(1.29) 6.64(2.63) 1.13(0.44) 1.12(0.88) 1.11(0.46) 1.16(2.40)
50:50 13.36(1.26) 11.79(0.54) 10.44(2.70) 9.77(1.09) 1.77(0.88) 1.73(0.50)) 1.66(0.85) 1.71(1.30)
40:60 32.54(3.04) 19.58(3.50) 19.41(1.70) 19.29(2.55) 2.18(0.23) 2.14(0.71) 2.12(1.19) 2.01(1.13)
70:30 2.12(1.67) 1.74(0.40) 1.49(0.95) 1.20(1.60) 1.12(0.63) 1.11(0.00) 1.1(0.00) 1.09(0.65)Phenanthrene Fluorene 60:40
6.00(3.28) 2.34(0.85) 2.23(3.3) 1.68(0.42) 1.13(0.00) 1.12(0.56) 1.11(1.89) 1.12(0.65)
50:50 3.76(3.09) 3.21(2.58) 2.87(1.46) 2.53(0.52) 1.15(0.75) 1.14(0.45) 1.13(0.45) 1.13(0.43)
40:60 12.30(4.87) 4.81(3.41) 3.76(1.83) 4.17(1.77) 1.22(0.43) 1.21(0.55) 1.20(0.59) 1.19(1.73)
70:30 5.41(2.66) 4.73(0.44) 4.33(0.32) 3.90(5.50) 1.31(0.54) 1.31(0.58) 1.29(0.75) 1.28(1.68)FluoranthenePhenanthrene 60:40
7.35(2.27) 5.93(4.35) 5.80(3.88) 4.83(1.31) 1.35(0.48) 1.32(0.96) 1.30(1.65) 1.26(0.55)
50:50 13.51(3.10) 8.65(1.14) 7.87(2.47) 6.42(0.64) 1.40(0.88) 1.38(1.02) 1.37(1.04) 1.35(0.98)
40:60 - - - - - - - -
(R.S.D. %) was based on triplicate injections ; [-] = not eluted within 60 min
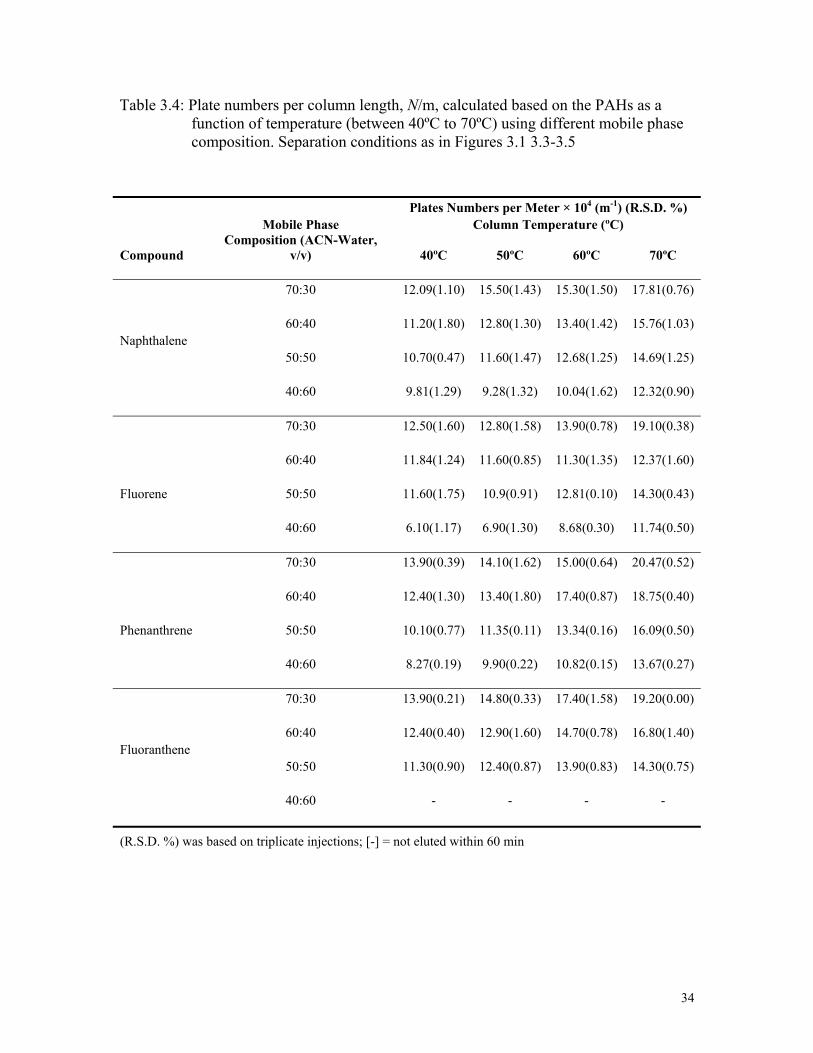
Table 3.4: Plate numbers per column length, N/m, calculated based on the PAHs as a function of temperature (between 40ºC to 70ºC) using different mobile phase composition. Separation conditions as in Figures 3.1 3.3-3.5
Plates Numbers per Meter × 104 (m-1) (R.S.D. %) Mobile Phase Column Temperature (ºC)
Compound Composition (ACN-Water,
v/v) 40ºC 50ºC 60ºC 70ºC 70:30 12.09(1.10) 15.50(1.43) 15.30(1.50) 17.81(0.76) 60:40 11.20(1.80) 12.80(1.30) 13.40(1.42) 15.76(1.03) Naphthalene 50:50 10.70(0.47) 11.60(1.47) 12.68(1.25) 14.69(1.25) 40:60 9.81(1.29) 9.28(1.32) 10.04(1.62) 12.32(0.90) 70:30 12.50(1.60) 12.80(1.58) 13.90(0.78) 19.10(0.38) 60:40 11.84(1.24) 11.60(0.85) 11.30(1.35) 12.37(1.60) Fluorene 50:50 11.60(1.75) 10.9(0.91) 12.81(0.10) 14.30(0.43) 40:60 6.10(1.17) 6.90(1.30) 8.68(0.30) 11.74(0.50) 70:30 13.90(0.39) 14.10(1.62) 15.00(0.64) 20.47(0.52) 60:40 12.40(1.30) 13.40(1.80) 17.40(0.87) 18.75(0.40) Phenanthrene 50:50 10.10(0.77) 11.35(0.11) 13.34(0.16) 16.09(0.50) 40:60 8.27(0.19) 9.90(0.22) 10.82(0.15) 13.67(0.27) 70:30 13.90(0.21) 14.80(0.33) 17.40(1.58) 19.20(0.00) 60:40 12.40(0.40) 12.90(1.60) 14.70(0.78) 16.80(1.40) Fluoranthene 50:50 11.30(0.90) 12.40(0.87) 13.90(0.83) 14.30(0.75)
40:60 - - - -
(R.S.D. %) was based on triplicate injections; [-] = not eluted within 60 min
34

35
0
2
4
6
8
10
12
14
16
18
40 50 60 70
Column Temperature(0C)
Pla
te n
umbe
rs p
er m
eter
x 1
04
Figure 3.6: Variation of column efficiency calculated based on phenanthrene at different column temperatures with acetonitrile-water 50:50 (v/v) as the mobile phase
In order to expedite the advantages of high temperature operations, RP-HPLC
separations of PAHs were performed using an elevated flow rate of 2.5 mL/min 40°C to
70°C with different mobile phase compositions ranging from 30:70 to 50:50 (v/v) (Figure
3.7-3.9). For a fixed mobile phase composition, it was observed that significantly
improved peak shapes and faster analysis times were obtained at higher temperatures.
With acetonitrile-water 30:70 (v/v) as the mobile phase, phenanthrene was eluted in about
50 min while fluoranthene, was not eluted within reasonable time (> 60 min) (Figure
3.7). However, at 70°C, all the compounds were eluted within acceptable time of
approximately 43 min. The total analysis time at 70°C, was 19 min with acetonitrile-
water 40:60 (v/v) as mobile phase (Figure 3.8) and further reduced to within 6 min with
acetonitrile-water 50:50 (v/v) as mobile phase (Figure 3.9). These results suggest that
marked decrease in the total analysis time is achievable with combined elevated
temperature and increased organic proportions in the mobile phase. The results obtained
are in good agreement with study reported by McCalley [49]. The author reported that
working under controlled, temperature programming conditions is a strong tool to adjust
and to improve retention time and selectivity. In addition, higher temperatures also
decrease eluent viscosity allowing significantly higher linear eluent velocities.
Combining these latter effects, higher temperatures in RP-HPLC may provide better
resolution and faster analysis.
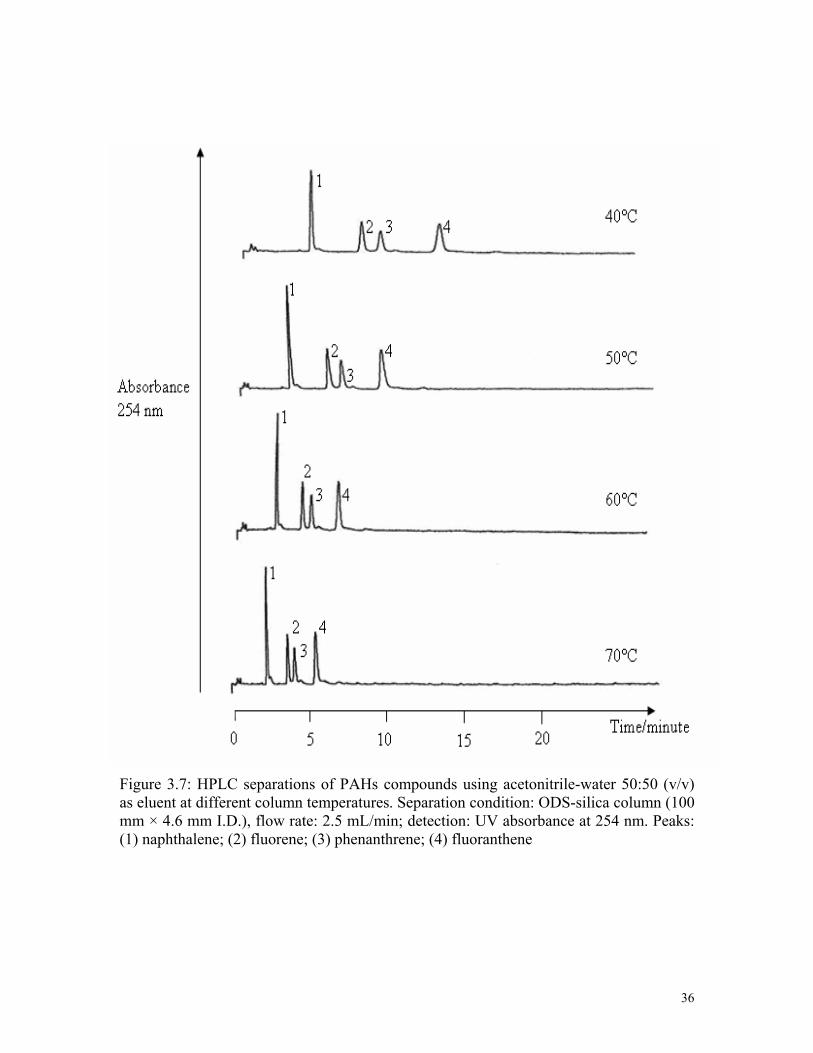
Figure 3.7: HPLC separations of PAHs compounds using acetonitrile-water 50:50 (v/v) as eluent at different column temperatures. Separation condition: ODS-silica column (100 mm × 4.6 mm I.D.), flow rate: 2.5 mL/min; detection: UV absorbance at 254 nm. Peaks: (1) naphthalene; (2) fluorene; (3) phenanthrene; (4) fluoranthene
36
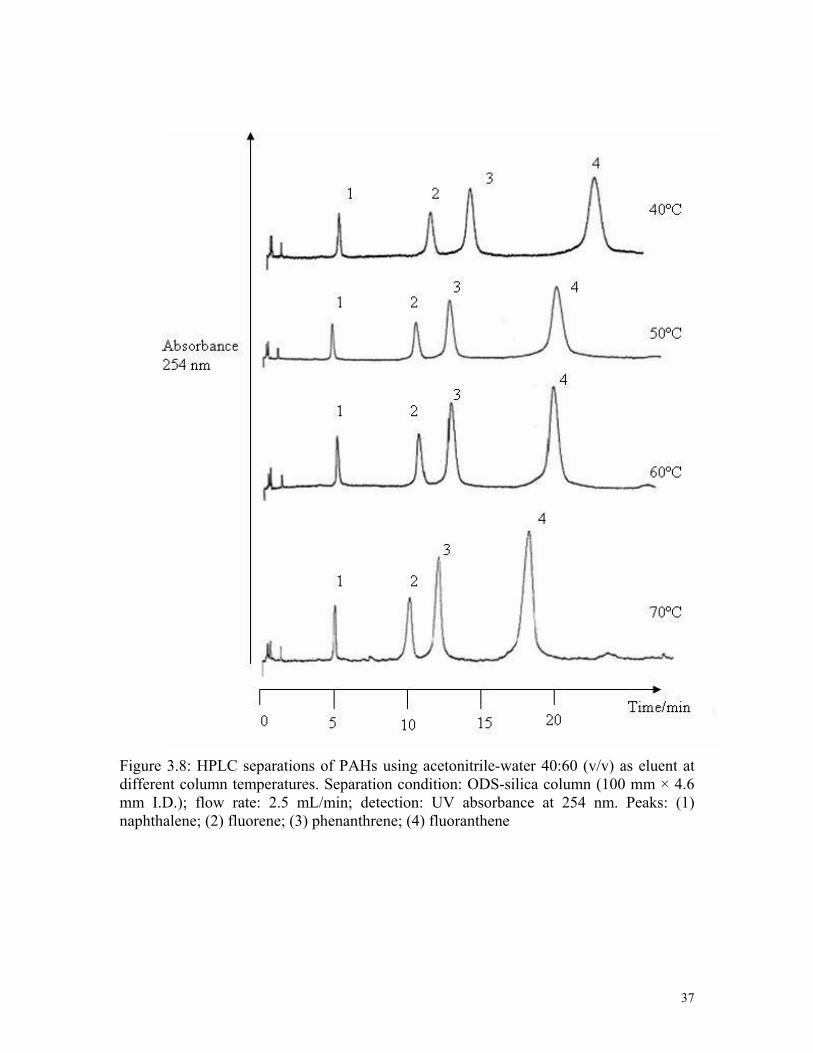
Figure 3.8: HPLC separations of PAHs using acetonitrile-water 40:60 (v/v) as eluent at different column temperatures. Separation condition: ODS-silica column (100 mm × 4.6 mm I.D.); flow rate: 2.5 mL/min; detection: UV absorbance at 254 nm. Peaks: (1) naphthalene; (2) fluorene; (3) phenanthrene; (4) fluoranthene
37
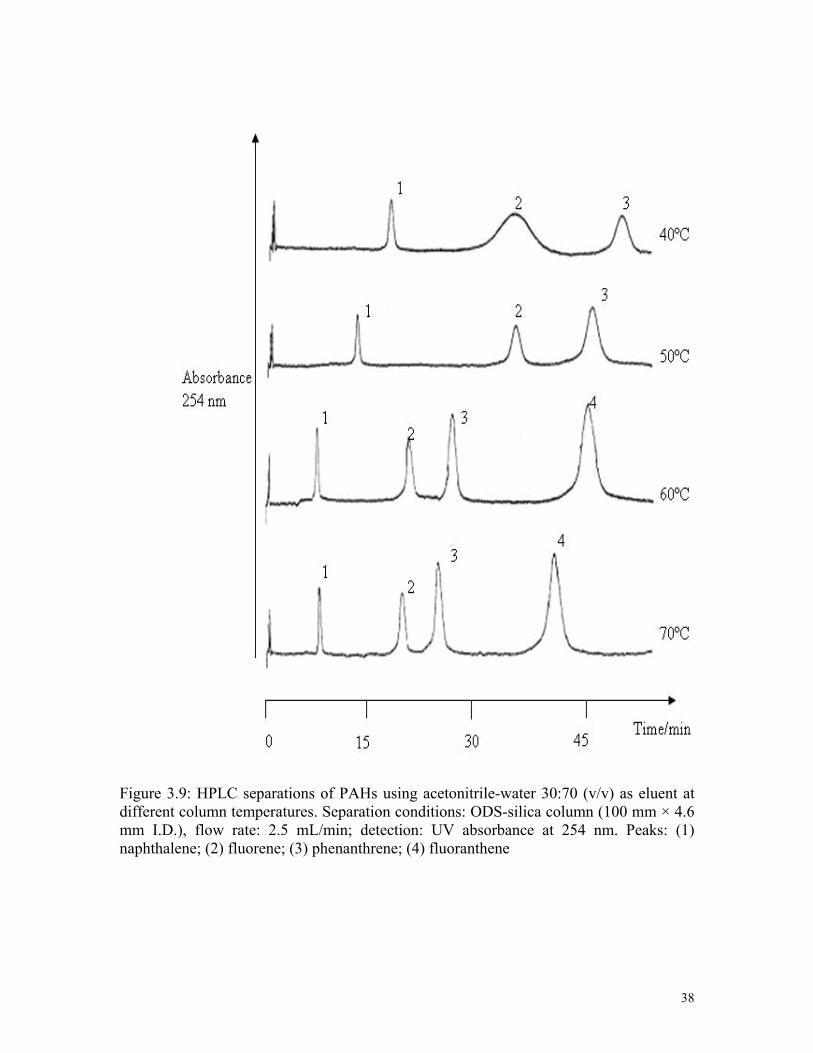
Figure 3.9: HPLC separations of PAHs using acetonitrile-water 30:70 (v/v) as eluent at different column temperatures. Separation conditions: ODS-silica column (100 mm × 4.6 mm I.D.), flow rate: 2.5 mL/min; detection: UV absorbance at 254 nm. Peaks: (1) naphthalene; (2) fluorene; (3) phenanthrene; (4) fluoranthene
38
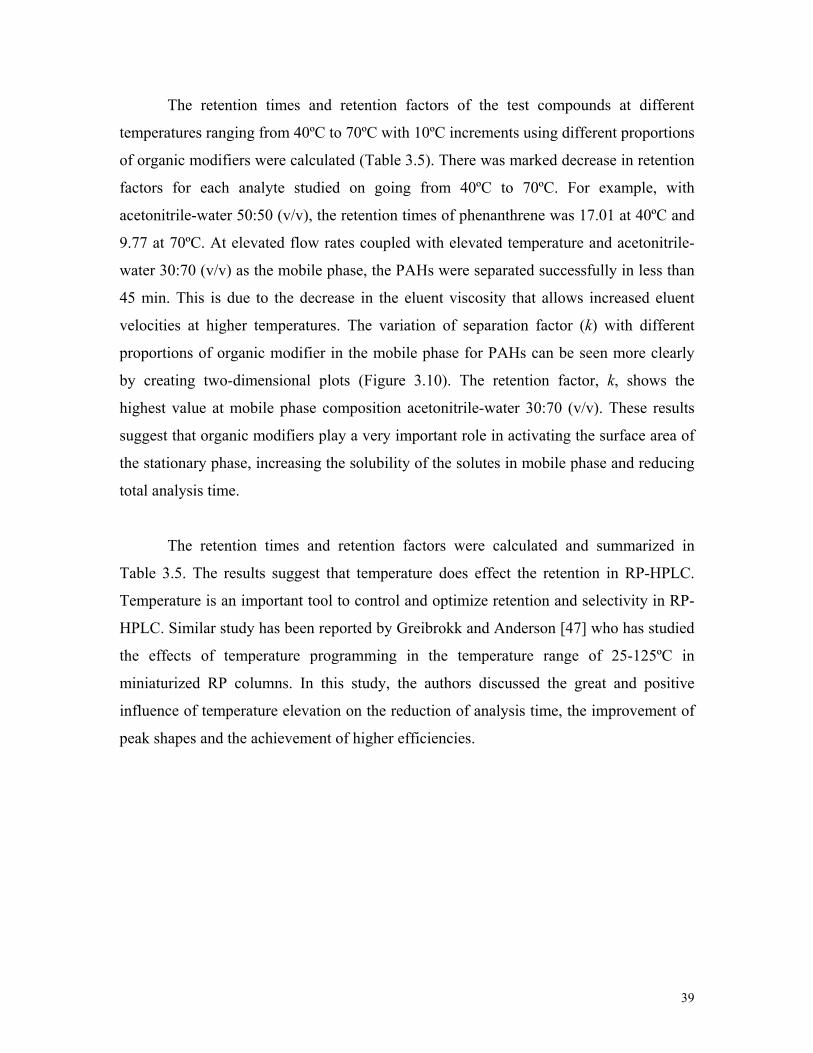
39
The retention times and retention factors of the test compounds at different
temperatures ranging from 40ºC to 70ºC with 10ºC increments using different proportions
of organic modifiers were calculated (Table 3.5). There was marked decrease in retention
factors for each analyte studied on going from 40ºC to 70ºC. For example, with
acetonitrile-water 50:50 (v/v), the retention times of phenanthrene was 17.01 at 40ºC and
9.77 at 70ºC. At elevated flow rates coupled with elevated temperature and acetonitrile-
water 30:70 (v/v) as the mobile phase, the PAHs were separated successfully in less than
45 min. This is due to the decrease in the eluent viscosity that allows increased eluent
velocities at higher temperatures. The variation of separation factor (k) with different
proportions of organic modifier in the mobile phase for PAHs can be seen more clearly
by creating two-dimensional plots (Figure 3.10). The retention factor, k, shows the
highest value at mobile phase composition acetonitrile-water 30:70 (v/v). These results
suggest that organic modifiers play a very important role in activating the surface area of
the stationary phase, increasing the solubility of the solutes in mobile phase and reducing
total analysis time.
The retention times and retention factors were calculated and summarized in
Table 3.5. The results suggest that temperature does effect the retention in RP-HPLC.
Temperature is an important tool to control and optimize retention and selectivity in RP-
HPLC. Similar study has been reported by Greibrokk and Anderson [47] who has studied
the effects of temperature programming in the temperature range of 25-125ºC in
miniaturized RP columns. In this study, the authors discussed the great and positive
influence of temperature elevation on the reduction of analysis time, the improvement of
peak shapes and the achievement of higher efficiencies.
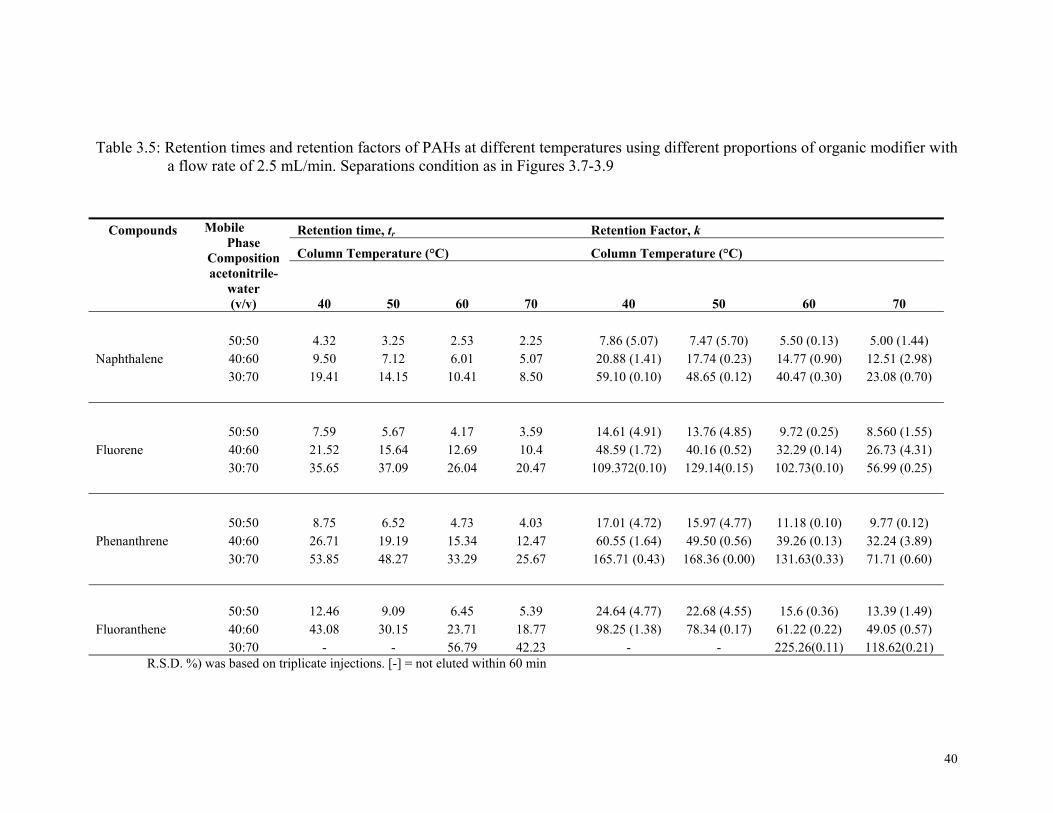
40
Table 3.5: Retention times and retention factors of PAHs at different temperatures using different proportions of organic modifier with
a flow rate of 2.5 mL/min. Separations condition as in Figures 3.7-3.9
Compounds Retention time, tr Retention Factor, k
Column Temperature (°C) Column Temperature (°C)
Mobile Phase
Composition acetonitrile-
water (v/v) 40 50 60 70 40 50 60 70
50:50 4.32 3.25 2.53 2.25 7.86 (5.07) 7.47 (5.70) 5.50 (0.13) 5.00 (1.44)
Naphthalene 40:60 9.50 7.12 6.01 5.07 20.88 (1.41) 17.74 (0.23) 14.77 (0.90) 12.51 (2.98) 30:70 19.41 14.15 10.41 8.50 59.10 (0.10) 48.65 (0.12) 40.47 (0.30) 23.08 (0.70) 50:50 7.59 5.67 4.17 3.59 14.61 (4.91) 13.76 (4.85) 9.72 (0.25) 8.560 (1.55) Fluorene
40:60 21.52 15.64 12.69 10.4 48.59 (1.72) 40.16 (0.52) 32.29 (0.14) 26.73 (4.31) 30:70
35.65 37.09 26.04 20.47 109.372(0.10)
129.14(0.15) 102.73(0.10) 56.99 (0.25)
50:50 8.75 6.52 4.73 4.03 17.01 (4.72) 15.97 (4.77) 11.18 (0.10) 9.77 (0.12) Phenanthrene 40:60 26.71 19.19 15.34 12.47 60.55 (1.64) 49.50 (0.56) 39.26 (0.13) 32.24 (3.89) 30:70 53.85 48.27 33.29 25.67 165.71 (0.43) 168.36 (0.00) 131.63(0.33) 71.71 (0.60) 50:50 12.46 9.09 6.45 5.39 24.64 (4.77) 22.68 (4.55) 15.6 (0.36) 13.39 (1.49) Fluoranthene 40:60 43.08 30.15 23.71 18.77 98.25 (1.38)
78.34 (0.17) 61.22 (0.22) 49.05 (0.57)
30:70 - - 56.79 42.23 - - 225.26(0.11) 118.62(0.21) R.S.D. %) was based on triplicate injections. [-] = not eluted within 60 min
41
The variations of resolutions and separation factors of the PAHs with temperature in RP-
HPLC were also studied (Table 3.6). For each test compound, there was a systematic
decrease in resolution and separation factors with increasing temperature. For example,
the Rs
and α factor values for phenanthrene/fluorene combination at 40ºC using
acetonitrile-water 40:60 (v/v) were 26.03 and 1.25, respectively. Further increase in
temperature of up to 70ºC decreased the resolution and separation factor values to 6.99
and 1.21, respectively. The resolutions for each combination of components were almost
always greater than 1.0, hence, sufficient for accurate quantification. In general, the Rs
and α value were inversely proportional to the percentage of organic modifier used in the
mobile phase at all temperatures studied.
Figure 3.10: Variation of retention factor (k) for PAHs with mobile phase compositions.
Separation conditions as in Figure 3.7-3.9
050-50 40-60
Mobile Phase Composition ACN-Water (
20
40
60
80
100
120
140
30-70
v/v)
Ret
entio
n Fa
ctor
, k
NapthaleneFluorenePhenanthrene Fluoranthene
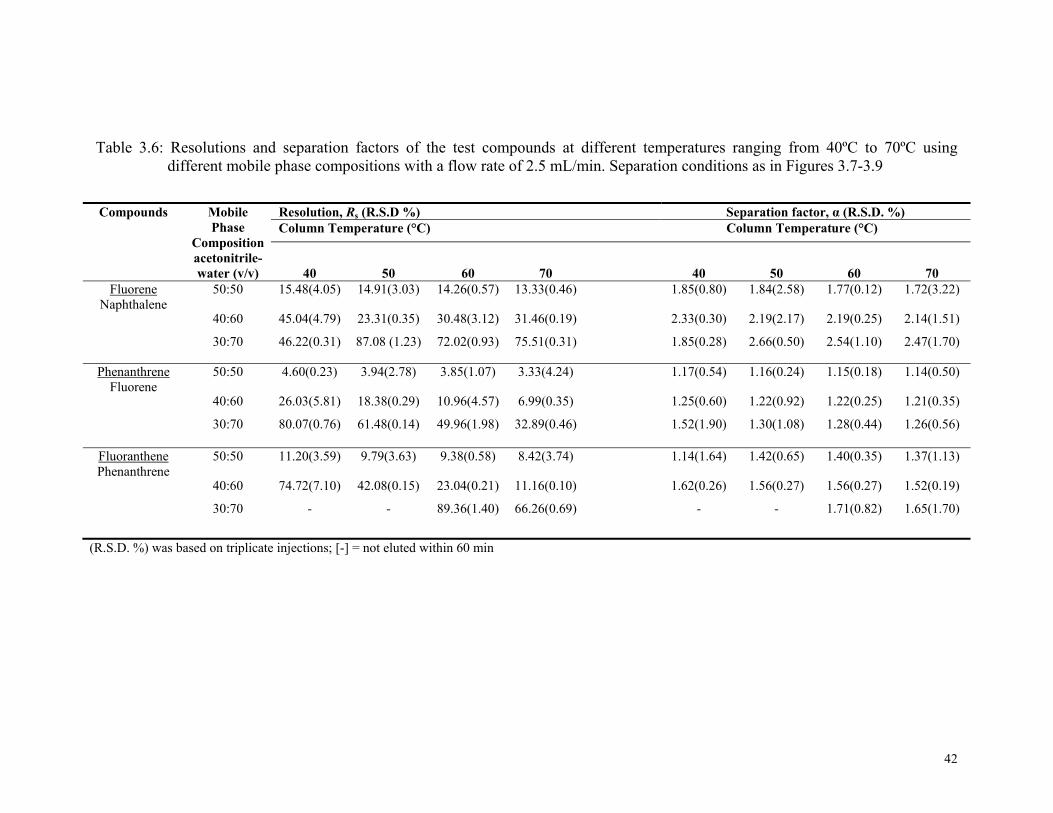
42
Table 3.6: Resolutions and separation factors of the test compounds at different temperatures ranging from 40ºC to 70ºC using
different mobile phase compositions with a flow rate of 2.5 mL/min. Separation conditions as in Figures 3.7-3.9
Compounds Resolution, Rs (R.S.D %) Separation factor, α (R.S.D. %) Column Temperature (°C) Column Temperature (°C)
Mobile Phase
Composition acetonitrile-water (v/v) 40 50 60 70 40 50 60 70
50:50 15.48(4.05) 14.91(3.03) 14.26(0.57) 13.33(0.46)
1.85(0.80) 1.84(2.58) 1.77(0.12) 1.72(3.22)Fluorene Naphthalene
40:60
45.04(4.79) 23.31(0.35) 30.48(3.12) 31.46(0.19) 2.33(0.30) 2.19(2.17) 2.19(0.25) 2.14(1.51)
30:70 46.22(0.31) 87.08 (1.23) 72.02(0.93) 75.51(0.31)
1.85(0.28) 2.66(0.50) 2.54(1.10) 2.47(1.70)
50:50 4.60(0.23) 3.94(2.78) 3.85(1.07) 3.33(4.24) 1.17(0.54) 1.16(0.24) 1.15(0.18) 1.14(0.50)Phenanthrene Fluorene
40:60
26.03(5.81) 18.38(0.29) 10.96(4.57) 6.99(0.35) 1.25(0.60) 1.22(0.92) 1.22(0.25) 1.21(0.35)
30:70 80.07(0.76) 61.48(0.14) 49.96(1.98) 32.89(0.46) 1.52(1.90) 1.30(1.08) 1.28(0.44) 1.26(0.56)
50:50 11.20(3.59) 9.79(3.63) 9.38(0.58) 8.42(3.74) 1.14(1.64) 1.42(0.65) 1.40(0.35) 1.37(1.13)FluoranthenePhenanthrene
40:60
74.72(7.10) 42.08(0.15) 23.04(0.21) 11.16(0.10) 1.62(0.26) 1.56(0.27) 1.56(0.27) 1.52(0.19)
30:70 - - 89.36(1.40) 66.26(0.69)
- - 1.71(0.82) 1.65(1.70)
(R.S.D. %) was based on triplicate injections; [-] = not eluted within 60 min
Results obtain in this work has clearly shown that working under controlled
temperature programming conditions is a strong tool to adjust and to improve retention
and selectivity. In addition, higher temperatures also decrease eluent viscosity allowing
significantly higher linear velocities. As a result, retention time can be drastically
reduced. Concomitantly, at higher temperatures, the diffusivity of analytes in the mobile
and stationary phases increases, resulting in much better efficiencies and improved peak
shapes. Combining these latter effects, higher temperatures in RP-HPLC offer better
resolution and faster analysis. In addition, at higher analysis temperatures, fewer amounts
of organic modifiers in the eluent are needed to achieve the same separation. In turn, this
contributes to reduce the use of organic solvent and hence contribute to the appearance of
“greener” laboratories.
43
44
CHAPTER IV
PRESSURIZED LIQUID EXTRACTION OF POLYCYCLIC AROMATIC
HYDROCARBONS FROM SOIL SAMPLES
Pressurized liquid extraction (PLE) is a sample preparation technique for the
extraction of analytes from solid materials. According to Wan and Wong [42] one of the
major driving forces is the increasing demand from authorities to reduce the large
volumes of organic solvents consumed by classical extraction methods such as Soxhlet.
Another contributing factor for the rapid acceptance of PLE is that the method
development is rather straight-forward. In this study, a PLE method was developed by
using conventional HPLC instrument and the performance of the PLE system was tested
using environmental soil samples.
4.1 Calibration of Standard
A calibration graph was constructed for each PAH studied. Standard mixtures of
PAHs with different concentrations were prepared and pyrene as internal standard was
added into each of the solution prepared. Linear calibration curves of the relative peak
area and concentration were plotted and it was found that the correlation coefficients
ranged from 0.9932 to 0.9952 (Figure 4.1). The calibration curves for naphthalene,
fluorene, phenanthrene and fluoranthene generally show good linearity in the
concentration range studied (1 to 10 ppm).
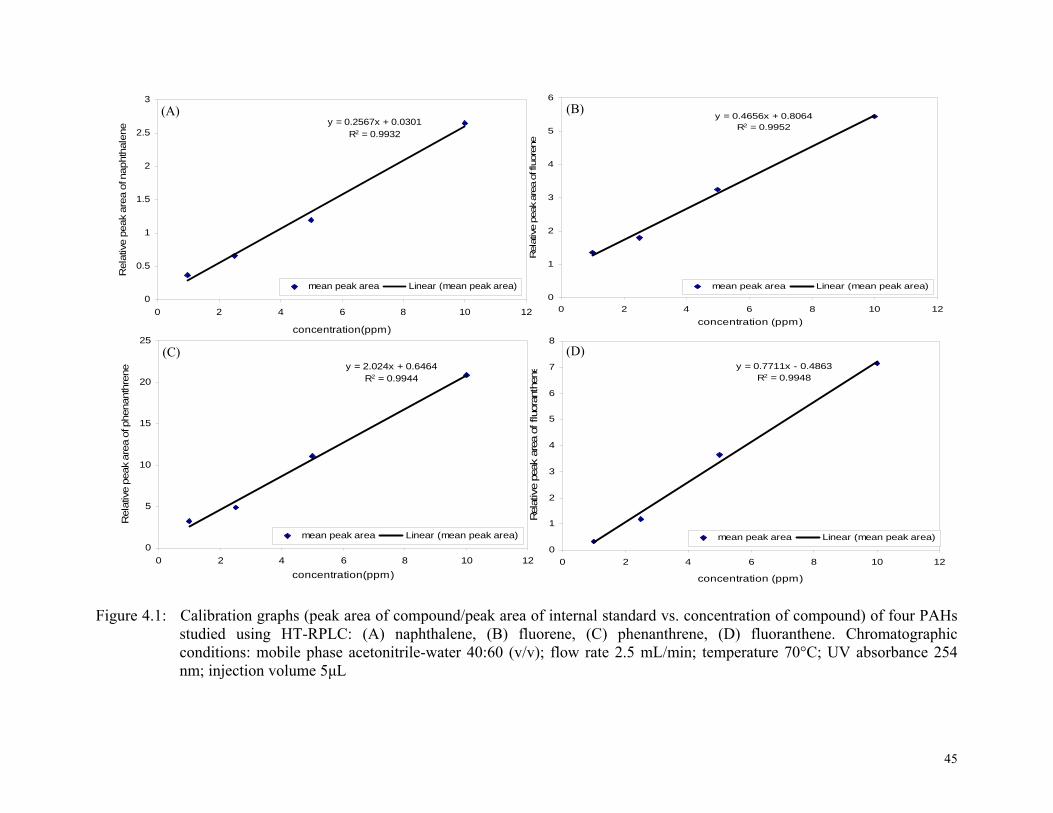
45
Figure 4.1: Calibration graphs (peak area of compound/peak area of internal standard vs. concentration of compound) of four PAHs
studied using HT-RPLC: (A) naphthalene, (B) fluorene, (C) phenanthrene, (D) fluoranthene. Chromatographic conditions: mobile phase acetonitrile-water 40:60 (v/v); flow rate 2.5 mL/min; temperature 70°C; UV absorbance 254 nm; injection volume 5µL
y = 0.2567x + 0.0301R2 = 0.9932
0
0.5
1
1.5
2
2.5
3
0 2 4 6 8 10 12
concentration(ppm)
Rel
ativ
e pe
ak a
rea
of n
apht
hale
ne
mean peak area Linear (mean peak area)
y = 0.4656x + 0.8064R2 = 0.9952
0
1
2
3
4
5
6
0 2 4 6 8 10 12concentration (ppm)
Rel
ativ
e pe
ak a
rea
of fl
uore
ne
mean peak area Linear (mean peak area)
y = 2.024x + 0.6464R2 = 0.9944
0
5
10
15
20
25
0 2 4 6 8 10 12concentration(ppm)
Rel
ativ
e pe
ak a
rea
of p
hena
nthr
ene
mean peak area Linear (mean peak area)
y = 0.7711x - 0.4863R2 = 0.9948
0
1
2
3
4
5
6
7
8
0 2 4 6 8 10 12
concentration (ppm)
Rel
ativ
e pe
ak a
rea
of fl
uora
nthe
nemean peak area Linear (mean peak area)
(B)
(C) (D)
(A)
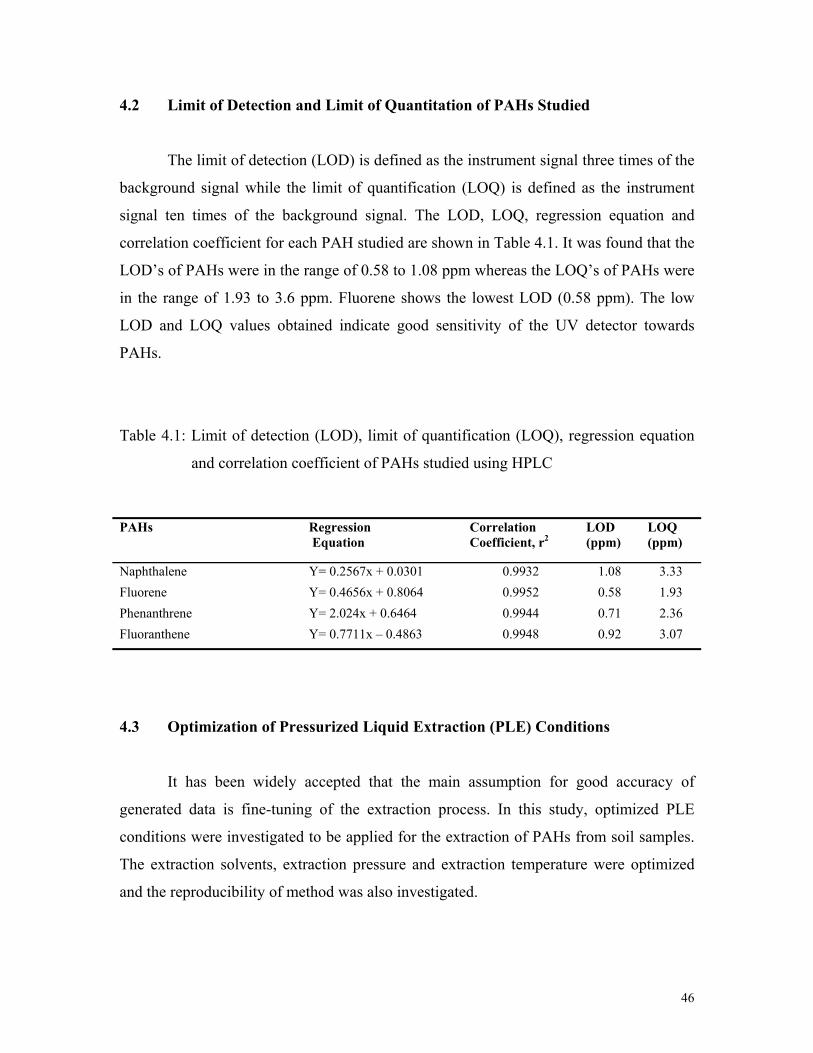
4.2 Limit of Detection and Limit of Quantitation of PAHs Studied
The limit of detection (LOD) is defined as the instrument signal three times of the
background signal while the limit of quantification (LOQ) is defined as the instrument
signal ten times of the background signal. The LOD, LOQ, regression equation and
correlation coefficient for each PAH studied are shown in Table 4.1. It was found that the
LOD’s of PAHs were in the range of 0.58 to 1.08 ppm whereas the LOQ’s of PAHs were
in the range of 1.93 to 3.6 ppm. Fluorene shows the lowest LOD (0.58 ppm). The low
LOD and LOQ values obtained indicate good sensitivity of the UV detector towards
PAHs.
Table 4.1: Limit of detection (LOD), limit of quantification (LOQ), regression equation
and correlation coefficient of PAHs studied using HPLC
PAHs Regression
Equation Correlation Coefficient, r2
LOD (ppm)
LOQ (ppm)
Naphthalene Y= 0.2567x + 0.0301 0.9932 1.08 3.33 Fluorene Y= 0.4656x + 0.8064 0.9952 0.58 1.93 Phenanthrene Y= 2.024x + 0.6464 0.9944 0.71 2.36 Fluoranthene Y= 0.7711x – 0.4863 0.9948 0.92 3.07
4.3 Optimization of Pressurized Liquid Extraction (PLE) Conditions
It has been widely accepted that the main assumption for good accuracy of
generated data is fine-tuning of the extraction process. In this study, optimized PLE
conditions were investigated to be applied for the extraction of PAHs from soil samples.
The extraction solvents, extraction pressure and extraction temperature were optimized
and the reproducibility of method was also investigated.
46
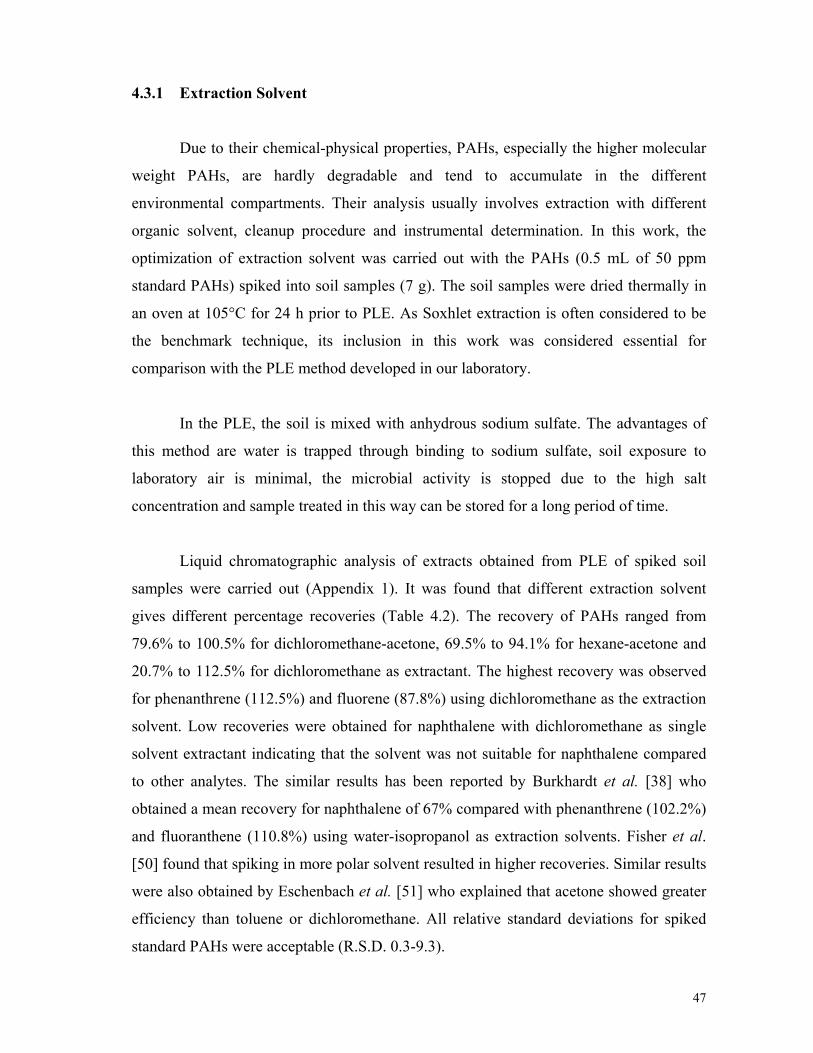
4.3.1 Extraction Solvent
Due to their chemical-physical properties, PAHs, especially the higher molecular
weight PAHs, are hardly degradable and tend to accumulate in the different
environmental compartments. Their analysis usually involves extraction with different
organic solvent, cleanup procedure and instrumental determination. In this work, the
optimization of extraction solvent was carried out with the PAHs (0.5 mL of 50 ppm
standard PAHs) spiked into soil samples (7 g). The soil samples were dried thermally in
an oven at 105°C for 24 h prior to PLE. As Soxhlet extraction is often considered to be
the benchmark technique, its inclusion in this work was considered essential for
comparison with the PLE method developed in our laboratory.
In the PLE, the soil is mixed with anhydrous sodium sulfate. The advantages of
this method are water is trapped through binding to sodium sulfate, soil exposure to
laboratory air is minimal, the microbial activity is stopped due to the high salt
concentration and sample treated in this way can be stored for a long period of time.
Liquid chromatographic analysis of extracts obtained from PLE of spiked soil
samples were carried out (Appendix 1). It was found that different extraction solvent
gives different percentage recoveries (Table 4.2). The recovery of PAHs ranged from
79.6% to 100.5% for dichloromethane-acetone, 69.5% to 94.1% for hexane-acetone and
20.7% to 112.5% for dichloromethane as extractant. The highest recovery was observed
for phenanthrene (112.5%) and fluorene (87.8%) using dichloromethane as the extraction
solvent. Low recoveries were obtained for naphthalene with dichloromethane as single
solvent extractant indicating that the solvent was not suitable for naphthalene compared
to other analytes. The similar results has been reported by Burkhardt et al. [38] who
obtained a mean recovery for naphthalene of 67% compared with phenanthrene (102.2%)
and fluoranthene (110.8%) using water-isopropanol as extraction solvents. Fisher et al.
[50] found that spiking in more polar solvent resulted in higher recoveries. Similar results
were also obtained by Eschenbach et al. [51] who explained that acetone showed greater
efficiency than toluene or dichloromethane. All relative standard deviations for spiked
standard PAHs were acceptable (R.S.D. 0.3-9.3).
47
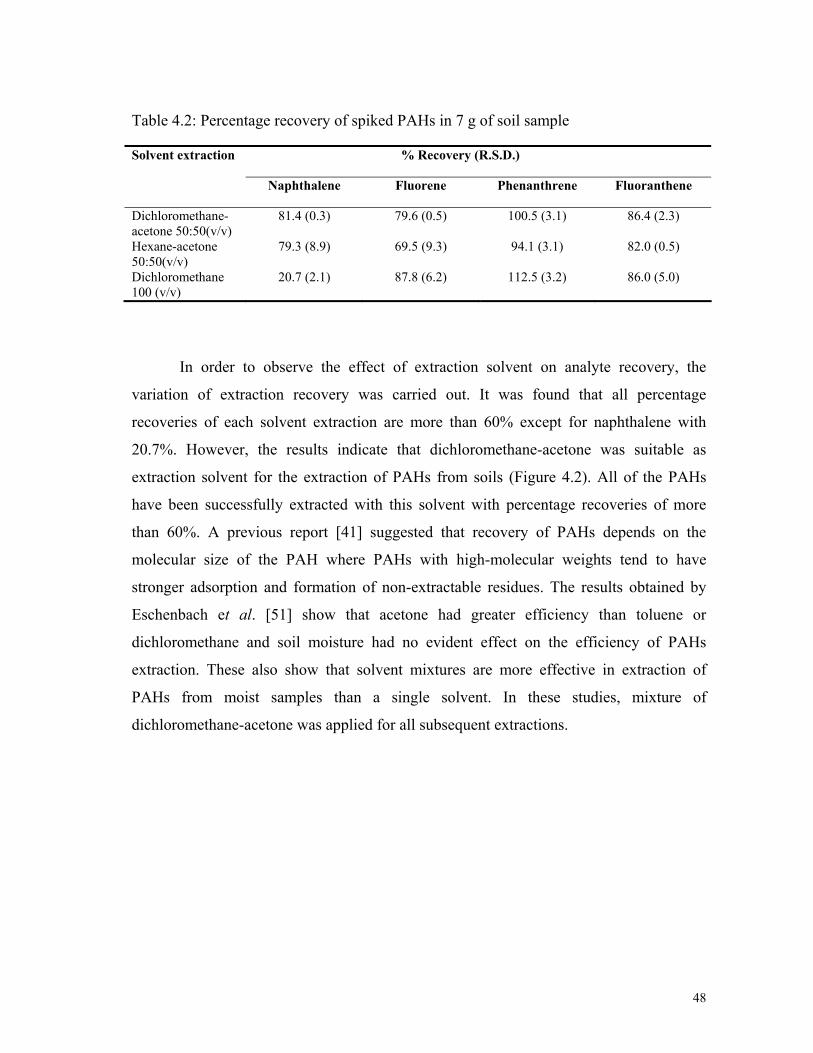
Table 4.2: Percentage recovery of spiked PAHs in 7 g of soil sample
Solvent extraction % Recovery (R.S.D.)
Naphthalene Fluorene Phenanthrene Fluoranthene
Dichloromethane-acetone 50:50(v/v)
81.4 (0.3) 79.6 (0.5) 100.5 (3.1) 86.4 (2.3)
Hexane-acetone 50:50(v/v)
79.3 (8.9) 69.5 (9.3) 94.1 (3.1) 82.0 (0.5)
Dichloromethane 100 (v/v)
20.7 (2.1) 87.8 (6.2) 112.5 (3.2) 86.0 (5.0)
In order to observe the effect of extraction solvent on analyte recovery, the
variation of extraction recovery was carried out. It was found that all percentage
recoveries of each solvent extraction are more than 60% except for naphthalene with
20.7%. However, the results indicate that dichloromethane-acetone was suitable as
extraction solvent for the extraction of PAHs from soils (Figure 4.2). All of the PAHs
have been successfully extracted with this solvent with percentage recoveries of more
than 60%. A previous report [41] suggested that recovery of PAHs depends on the
molecular size of the PAH where PAHs with high-molecular weights tend to have
stronger adsorption and formation of non-extractable residues. The results obtained by
Eschenbach et al. [51] show that acetone had greater efficiency than toluene or
dichloromethane and soil moisture had no evident effect on the efficiency of PAHs
extraction. These also show that solvent mixtures are more effective in extraction of
PAHs from moist samples than a single solvent. In these studies, mixture of
dichloromethane-acetone was applied for all subsequent extractions.
48

0
20
40
60
80
100
120
140
Naphthalene Fluorene Phenanthrene Fluoranthene
PAHs
%R
ecov
ery
Dichloromethane-acetone Hexane-acetone Dichloromethane
Figure 4.2: Average percentage recoveries of spiked 50 ppm PAHs in soil samples using
different extraction solvents
4.3.2 Extraction Temperature
Temperature has a significant influence on the diffusion coefficient of solvents;
hence the kinetic of extraction process and its overall efficiency is strongly dependent on
this parameter. In this work, recoveries of PAHs from spiked samples were determined
using different extraction temperatures in the range of 100°C-180°C with mixture of
dichloromethane-acetone 50:50 (v/v) as the extraction solvent. Examples of
chromatograms for the PAH determination are given in Appendix 2.
In general, higher recoveries of all PAHs studied were obtained at higher
temperatures (Table 4.3). For example, at 100°C and 180°C, the recoveries of
phenanthrene were 83.4% and 88.5%, respectively. A high temperature of 180°C gave
highest recoveries for fluoranthene (94.4%) followed by fluorene (92.3%), phenanthrene
(88.5%), and naphthalene (81.5%). The higher recoveries for the more hydrophobic
compounds (phenanthrene and fluoranthene) can be explained because these compounds
are generally more thermally stable. PAHs with high-molecular weight may have
49
stronger adsorption and formation of non-extractable residues. Hence, fluoranthene with
the highest molecular weight show the highest recovery and naphthalene with the lowest
molecular weight shows the lowest recovery.
The high recoveries at 180°C for the PAHs studied can be explained by the fact
that at higher temperatures, there is a decrease in the viscosity of liquid solvents, thus
allowing better penetration of matrix particles and enhancing extraction. Increased
temperature can disrupt the strong solute-matrix interactions caused by van der Waals
forces, hydrogen bonding, and dipole interactions of the solute molecules and active sites
on the matrix. In addition, increased temperatures also decrease the surface tension of the
solvent that facilitates better contact of the solvent with the analytes and enhance
extraction [45].
Results obtained are in good agreement with those reported by Jaska et al. [52]
who suggested that in order to enhance the recovery efficiency, extractions need to be
performed at elevated temperature within the range of 50-180°C, depending on the
boiling point of the analytes studied. In PLE, the samples are extracted at temperatures
well above the boiling point of the extractant used. The kinetics of mass transfer can be
greatly improved at elevated temperatures. Therefore, it is very well possible that a poor
extraction solvent in a conventional extraction method such as Soxhlet extraction can be
a good solvent in PLE at high temperatures.
Table 4.3: Percentage recoveries of spiked standard PAHs at 20 ppm in 7 g of soil samples at different extraction temperatures
Compound %Recovery (R.S.D.) Temperature 100°C 150°C 180°C Naphthalene 42.2(2.5) 67.6(1.0) 81.5(1.0) Fluorene 86.6(1.3) 91.6(1.4) 92.3(1.1) Phenanthrene 83.4(1.7) 88.1(7.7) 88.5(1.8) Fluoranthene 86.5(1.1) 87.3(1.5) 94.4(0.2) (R.S.D. %) was based on triplicate injections
50
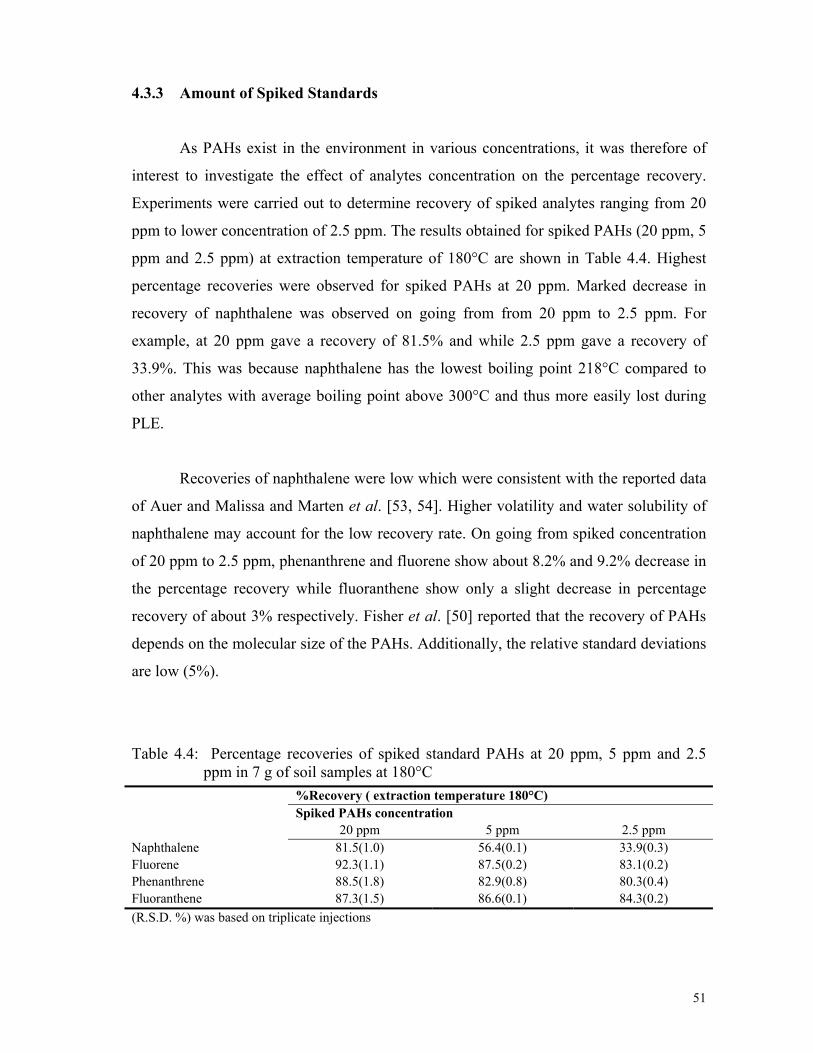
4.3.3 Amount of Spiked Standards
As PAHs exist in the environment in various concentrations, it was therefore of
interest to investigate the effect of analytes concentration on the percentage recovery.
Experiments were carried out to determine recovery of spiked analytes ranging from 20
ppm to lower concentration of 2.5 ppm. The results obtained for spiked PAHs (20 ppm, 5
ppm and 2.5 ppm) at extraction temperature of 180°C are shown in Table 4.4. Highest
percentage recoveries were observed for spiked PAHs at 20 ppm. Marked decrease in
recovery of naphthalene was observed on going from from 20 ppm to 2.5 ppm. For
example, at 20 ppm gave a recovery of 81.5% and while 2.5 ppm gave a recovery of
33.9%. This was because naphthalene has the lowest boiling point 218°C compared to
other analytes with average boiling point above 300°C and thus more easily lost during
PLE.
Recoveries of naphthalene were low which were consistent with the reported data
of Auer and Malissa and Marten et al. [53, 54]. Higher volatility and water solubility of
naphthalene may account for the low recovery rate. On going from spiked concentration
of 20 ppm to 2.5 ppm, phenanthrene and fluorene show about 8.2% and 9.2% decrease in
the percentage recovery while fluoranthene show only a slight decrease in percentage
recovery of about 3% respectively. Fisher et al. [50] reported that the recovery of PAHs
depends on the molecular size of the PAHs. Additionally, the relative standard deviations
are low (5%).
Table 4.4: Percentage recoveries of spiked standard PAHs at 20 ppm, 5 ppm and 2.5 ppm in 7 g of soil samples at 180°C
%Recovery ( extraction temperature 180°C) Spiked PAHs concentration 20 ppm 5 ppm 2.5 ppm Naphthalene 81.5(1.0) 56.4(0.1) 33.9(0.3) Fluorene 92.3(1.1) 87.5(0.2) 83.1(0.2) Phenanthrene 88.5(1.8) 82.9(0.8) 80.3(0.4) Fluoranthene 87.3(1.5) 86.6(0.1) 84.3(0.2) (R.S.D. %) was based on triplicate injections
51
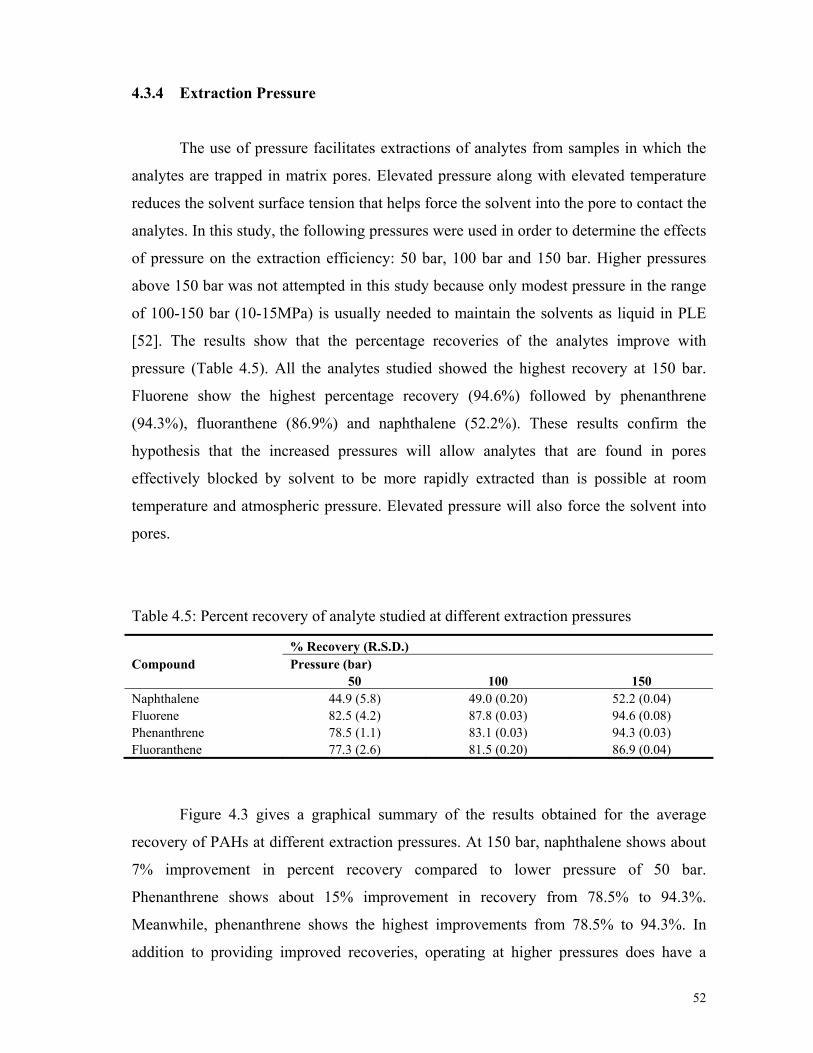
4.3.4 Extraction Pressure
The use of pressure facilitates extractions of analytes from samples in which the
analytes are trapped in matrix pores. Elevated pressure along with elevated temperature
reduces the solvent surface tension that helps force the solvent into the pore to contact the
analytes. In this study, the following pressures were used in order to determine the effects
of pressure on the extraction efficiency: 50 bar, 100 bar and 150 bar. Higher pressures
above 150 bar was not attempted in this study because only modest pressure in the range
of 100-150 bar (10-15MPa) is usually needed to maintain the solvents as liquid in PLE
[52]. The results show that the percentage recoveries of the analytes improve with
pressure (Table 4.5). All the analytes studied showed the highest recovery at 150 bar.
Fluorene show the highest percentage recovery (94.6%) followed by phenanthrene
(94.3%), fluoranthene (86.9%) and naphthalene (52.2%). These results confirm the
hypothesis that the increased pressures will allow analytes that are found in pores
effectively blocked by solvent to be more rapidly extracted than is possible at room
temperature and atmospheric pressure. Elevated pressure will also force the solvent into
pores.
Table 4.5: Percent recovery of analyte studied at different extraction pressures
% Recovery (R.S.D.) Compound Pressure (bar)
50 100 150 Naphthalene 44.9 (5.8) 49.0 (0.20) 52.2 (0.04) Fluorene 82.5 (4.2) 87.8 (0.03) 94.6 (0.08) Phenanthrene 78.5 (1.1) 83.1 (0.03) 94.3 (0.03) Fluoranthene 77.3 (2.6) 81.5 (0.20) 86.9 (0.04)
Figure 4.3 gives a graphical summary of the results obtained for the average
recovery of PAHs at different extraction pressures. At 150 bar, naphthalene shows about
7% improvement in percent recovery compared to lower pressure of 50 bar.
Phenanthrene shows about 15% improvement in recovery from 78.5% to 94.3%.
Meanwhile, phenanthrene shows the highest improvements from 78.5% to 94.3%. In
addition to providing improved recoveries, operating at higher pressures does have a
52
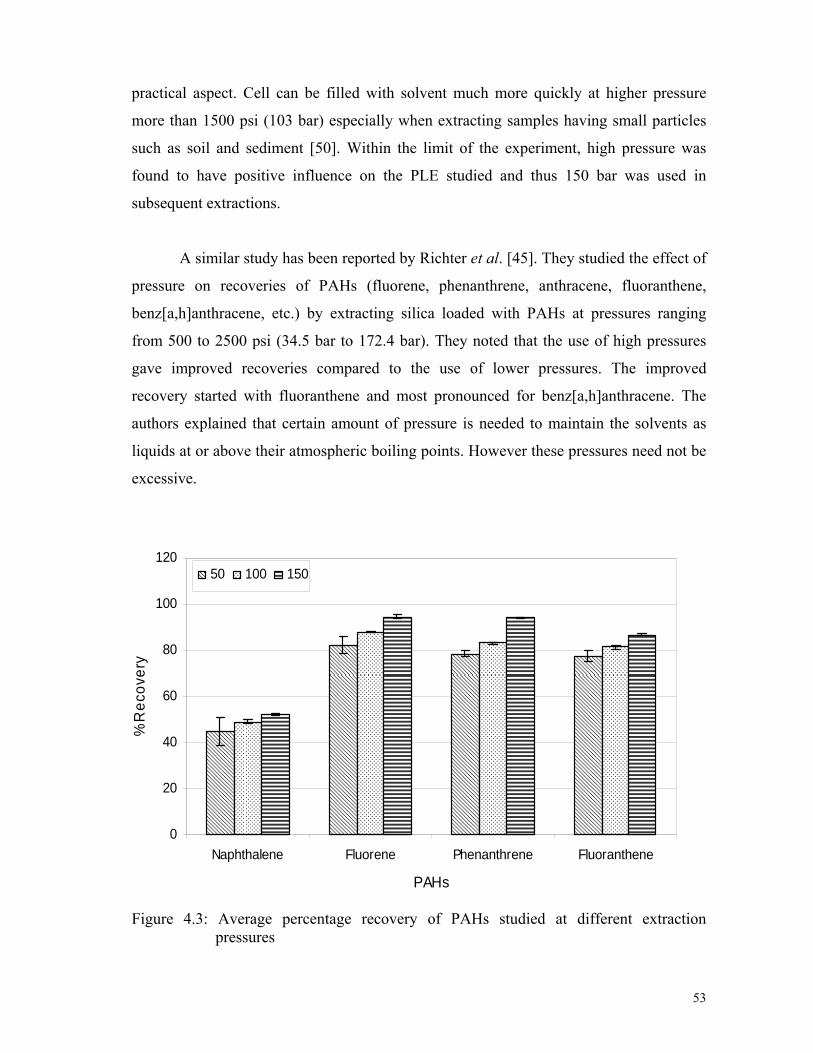
practical aspect. Cell can be filled with solvent much more quickly at higher pressure
more than 1500 psi (103 bar) especially when extracting samples having small particles
such as soil and sediment [50]. Within the limit of the experiment, high pressure was
found to have positive influence on the PLE studied and thus 150 bar was used in
subsequent extractions.
A similar study has been reported by Richter et al. [45]. They studied the effect of
pressure on recoveries of PAHs (fluorene, phenanthrene, anthracene, fluoranthene,
benz[a,h]anthracene, etc.) by extracting silica loaded with PAHs at pressures ranging
from 500 to 2500 psi (34.5 bar to 172.4 bar). They noted that the use of high pressures
gave improved recoveries compared to the use of lower pressures. The improved
recovery started with fluoranthene and most pronounced for benz[a,h]anthracene. The
authors explained that certain amount of pressure is needed to maintain the solvents as
liquids at or above their atmospheric boiling points. However these pressures need not be
excessive.
0
20
40
60
80
100
120
Naphthalene Fluorene Phenanthrene Fluoranthene
PAHs
%R
ecov
ery
50 100 150
Figure 4.3: Average percentage recovery of PAHs studied at different extraction pressures
53

4.3.5 Reproducibility of PLE Method
Extraction temperature, extraction solvent and extraction pressure have significant
influence on the diffusion coefficient of solvents; hence the kinetic of extraction process
and its overall efficiency is strongly dependent on these parameters. It is thus of interest
to determine the consistency in recovery of the developed method. Experiments were set
out to study the reproducibility of the developed method on day 1 to day 3. The average
value was calculated from three individual experiments, the percent recovery of the
PAHs was performed under the optimized condition described above (section 4.2.3). The
extraction by solvent mixture dichloromethane-acetone (50:50, v/v), extraction
temperature 180°C and extraction pressure of 150 bar.
From the results obtained (Table 4.6), it is noted that there is no significant day-
to-day differences in the efficiency of the developed method and the day-to-day R.S.D.
values were lower. The highest value was obtained for fluorene (95.05%) at day 1 while
the lowest recovery was naphthalene (63.38%) at day 2. The result showed that three-ring
PAHs (fluorene, phenanthrene) appeared to be more efficiently extracted by PLE
compared to the two-ring PAH (naphthalene), probably due to its higher volatility and
thus more analyte loss during extraction.
Table 4.6: Relative percentage recoveries and standard deviation of analytes studied
between day to day
% Recovery Mean %Recovery % R.S.D. Compound Day 1 Day 2 Day 3 Naphthalene 87.7 63.4 68.1 73.1 0.11
Fluorene 95.0 96.4 90.6 93.9 0.04
Phenanthrene 89.8 92.7 89.1 90.5 0.02
Fluoranthene 90.5 88.6 88.4 89.1 0.01
The results indicate that the developed method for PLE of PAHs has good
reproducibility. The RSD’s were good, ranging from 0.01
to 0.11. Therefore, the PLE
54
method proved to be readily applicable as a standard method for the extraction and
analysis of PAHs. Currently available US EPA methods for the extraction of PAHs from
contaminated soil include Method 3540 for Soxhlet extraction, Method 3541 for SFE and
Method 3545 for PLE. Conte et al. [43] reported that PLE is advantageous because the
parameters involved including ease of total automation that adds to better reproducibility,
reduced time direct contact between operator and solvent vapour, reduced consumption
of organic solvents, the subsequent storage and disposal.
4.4 Comparison of PLE with Soxhlet Extraction
In this study, PLE and Soxhlet extraction were carried out to determine whether
the PLE method developed was in good agreement with conventional Soxhlet extraction
method. The extraction efficiencies of PLE employing optimum extraction conditions
were compared with the efficiencies of Soxhlet extraction for the extraction of PAHs
from soil samples. PLE was completed in about 40 min for each extraction condition with
5 min for static extraction time whereas Soxhlet extraction was carried out for 20 h
(follow EPA Method 3540). In our study, 5 min of static time was used because no
difference in recovery was observed when longer static extraction time was used.
Temperature of organic solvent flowing out from the cell was measured and found
to be less than 35°C, even with the extraction cell at 100°C. The fast loss of heat was due
to the length of tubing from the cell to the collection vial. No cooling was used on the
collection vials in our experiment. This was in agreement with conditions applied in an
experiment described by Richter et al. [45] who explained that cooling system was not
necessary because no difference was seen with or without cooling on the collection vials
in terms of recovery or precision when extraction the volatile compounds.
The quantities of representative PAHs extracted by each method tested at spiked
20 ppm PAHs in soil sample is shown in Table 4.7. The total PAH contents determined
by each extraction method are in good agreement. PLE method showed good
reproducibility for the majority of PAHs. Fluoranthene showed the highest recovery
55

(94.4%) followed by fluorene (92.3%), phenanthrene (88.5%) and naphthalene (81.5%).
Based on data gathered, all PAHs are successfully extracted using PLE with minimum
percentage recovery 81.47%. High temperature at 180°C along with polar solvent
dichloromethane-acetone was found to be necessary to extract the PAHs quantitatively
from soils.
Higher recoveries are shown for naphthalene using PLE with 81.5% compared
with Soxhlet extraction 34.31%. It was probably because of increased solvent penetration
from increased swelling of soil particles [38]. Similar result has been reported by
Burkhardt et al. [38] who explained that extraction of PAHs compounds such as
naphthalene and fluorene are more efficient by using PLE than Soxhlet extraction.
Phenanthrene showed only slight difference in recoveries between PLE (88.5%) and
Soxhlet extraction (90.1%) compared with other analytes which shows marked difference
in recoveries (Figure 4.4). Similar study has been reported by Saim et al. [46] who
explain where phenanthrene extracted using PLE gave similar concentration to that
obtained by Soxhlet extraction whereas fluoranthene show the highest recovery using
Soxhlet extraction. In comparison to establish methods such as sonication and Soxhlet,
PLE offers the advantage of faster extraction times and lower solvent consumption.
Table 4.7: Comparison of extraction efficiencies of spiked 20 ppm PAHs in soil samples between Soxhlet and PLE
% Recovery (R.S.D.) Compound Soxhlet PLE (180C/150 bar) Naphthalene 34.31(8.3) 81.5(1.0) Fluorene 82.2(2.7) 92.3(1.1) Phenanthrene 90.1(6.1) 88.5(1.8) Fluoranthene 73.6(1.2) 94.4(0.2) *Soxhlet extraction conditions: solvent, 150 mL dichloromethane-acetone (50:50, v/v) heating 20 h
56
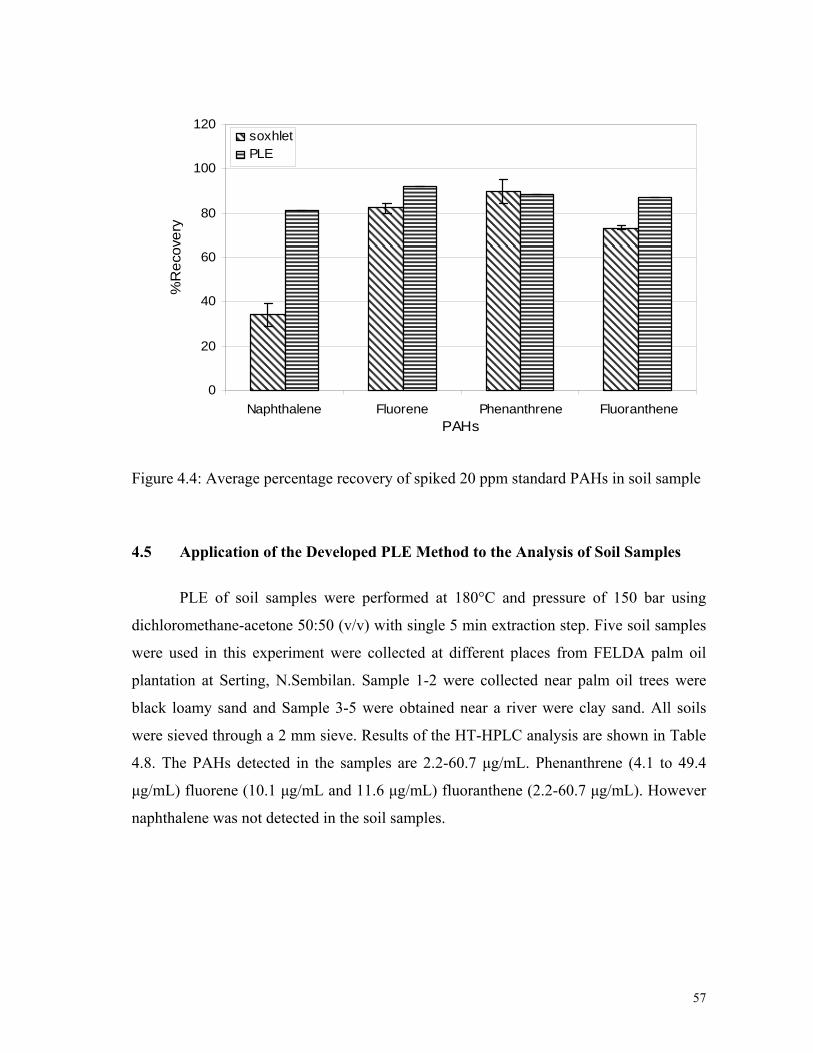
0
20
40
60
80
100
120
Naphthalene Fluorene Phenanthrene FluoranthenePAHs
%R
ecov
ery
soxhletPLE
Figure 4.4: Average percentage recovery of spiked 20 ppm standard PAHs in soil sample
4.5 Application of the Developed PLE Method to the Analysis of Soil Samples
PLE of soil samples were performed at 180°C and pressure of 150 bar using
dichloromethane-acetone 50:50 (v/v) with single 5 min extraction step. Five soil samples
were used in this experiment were collected at different places from FELDA palm oil
plantation at Serting, N.Sembilan. Sample 1-2 were collected near palm oil trees were
black loamy sand and Sample 3-5 were obtained near a river were clay sand. All soils
were sieved through a 2 mm sieve. Results of the HT-HPLC analysis are shown in Table
4.8. The PAHs detected in the samples are 2.2-60.7 µg/mL. Phenanthrene (4.1 to 49.4
µg/mL) fluorene (10.1 µg/mL and 11.6 µg/mL) fluoranthene (2.2-60.7 µg/mL). However
naphthalene was not detected in the soil samples.
57
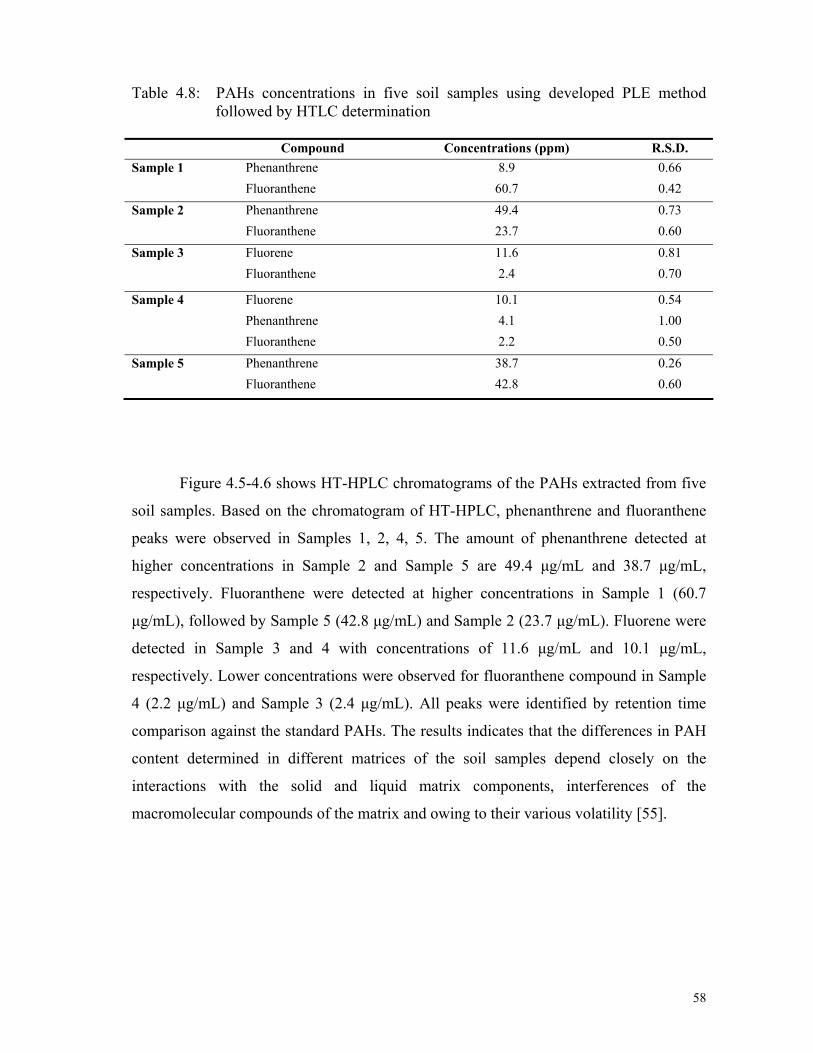
Table 4.8: PAHs concentrations in five soil samples using developed PLE method followed by HTLC determination
Compound Concentrations (ppm) R.S.D. Sample 1 Phenanthrene 8.9 0.66 Fluoranthene 60.7 0.42 Sample 2 Phenanthrene 49.4 0.73 Fluoranthene 23.7 0.60 Sample 3 Fluorene 11.6 0.81 Fluoranthene 2.4 0.70
Sample 4 Fluorene 10.1 0.54 Phenanthrene 4.1 1.00 Fluoranthene 2.2 0.50 Sample 5 Phenanthrene 38.7 0.26 Fluoranthene 42.8 0.60
Figure 4.5-4.6 shows HT-HPLC chromatograms of the PAHs extracted from five
soil samples. Based on the chromatogram of HT-HPLC, phenanthrene and fluoranthene
peaks were observed in Samples 1, 2, 4, 5. The amount of phenanthrene detected at
higher concentrations in Sample 2 and Sample 5 are 49.4 µg/mL and 38.7 µg/mL,
respectively. Fluoranthene were detected at higher concentrations in Sample 1 (60.7
µg/mL), followed by Sample 5 (42.8 µg/mL) and Sample 2 (23.7 µg/mL). Fluorene were
detected in Sample 3 and 4 with concentrations of 11.6 µg/mL and 10.1 µg/mL,
respectively. Lower concentrations were observed for fluoranthene compound in Sample
4 (2.2 µg/mL) and Sample 3 (2.4 µg/mL). All peaks were identified by retention time
comparison against the standard PAHs. The results indicates that the differences in PAH
content determined in different matrices of the soil samples depend closely on the
interactions with the solid and liquid matrix components, interferences of the
macromolecular compounds of the matrix and owing to their various volatility [55].
58
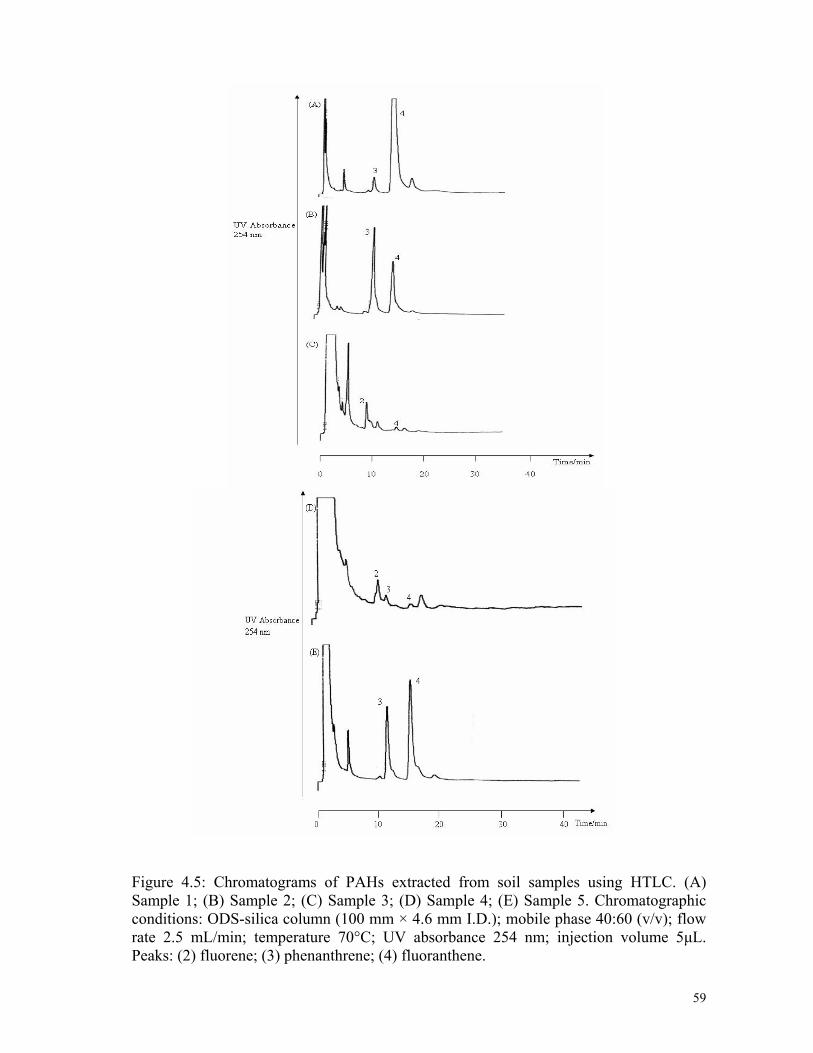
Figure 4.5: Chromatograms of PAHs extracted from soil samples using HTLC. (A) Sample 1; (B) Sample 2; (C) Sample 3; (D) Sample 4; (E) Sample 5. Chromatographic conditions: ODS-silica column (100 mm × 4.6 mm I.D.); mobile phase 40:60 (v/v); flow rate 2.5 mL/min; temperature 70°C; UV absorbance 254 nm; injection volume 5µL. Peaks: (2) fluorene; (3) phenanthrene; (4) fluoranthene.
59
The results obtained indicate that the developed method can be applied to the
analysis of PAHs in soils. Popp et al. [44] reported a similar study explained that
phenanthrene (581 ng/g) and fluoranthene (823 ng/g) were mostly detected in
contaminated soil from river Mulde, German. Filipkowska et al. [55] show the average
recoveries of PAHs from raw sediment samples was approximately 62% and
phenanthrene and anthracene was observed in lower recovery, 47% and 21%
respectively. All these are due to diverse a physical property which includes sorption,
solubility and volatility of the compounds studied.
60
CHAPTER V
CONCLUSIONS AND SUGGESTIONS FOR FURTHER STUDY
5.1 Conclusions
The separations of polycyclic aromatic hydrocarbons (PAHs) by reversed phase
liquid chromatography (RPLC) separation technique at elevated temperature have been
successfully examined. The relationship between retention factor, k; separation factor, α;
theoretical number of separation plates per column length, N/m and the resolution, Rs
with different column temperatures were analyzed and demonstrated. It was observed that
a better separation was achieved during the high operating temperature. The overall
column efficiencies at high operating temperatures were much higher relative to those at
ambient operating temperature conditions. High temperature operation in reversed phase
liquid chromatography provides the opportunity to reduce the quantity of organic solvent
used in mixed organic-water mobile phase, decreases total analysis time, and increases
analyte mass transfer rates.
Four PAHs (naphthalene, fluorene, phenanthrene and fluoranthene) were
successfully separated using RPLC at 70°C. Optimum separation conditions were
selected for the separation of these compounds on ODS-silica column with a mobile
phase acetonitrile-water 40:60 (v/v) at 70°C. It was found that by simply increasing the
column temperature, excellent separation efficiencies were achieved without significant
loss in resolution.
61
A method for the determination of PAHs has been developed using homemade
pressurized liquid extraction (PLE) system and elevated temperature RPLC. PLE showed
excellent efficiency in term of total extraction time, total solvent usage as well as the
method reproducibility. PLE method demonstrated an outstanding performance with
dichloromethane-acetone 50:50 (v/v) as solvent extraction, pressure 150 bar and
extraction temperature 180°C. Successfully results were obtained when the method
applied to the analysis of PAHs in soil samples. The PAHs detected in the samples are
2.2-60.7 µg/mL with Phenanthrene (4.1 to 49.4 µg/mL) fluorene (10.1 µg/mL and 11.6
µg/mL) fluoranthene (2.2-60.7 µg/mL). The results indicates that the differences in PAH
content determined in different matrices of the soil samples depend closely on the
interactions with the solid and liquid matrix components, interferences of the
macromolecular compounds of the matrix and owing to their various volatility.
PLE have shown to be more powerful techniques compared to Soxhlet extraction
for certain compounds. Saving in time, solvent usages are possible due to the high
extraction efficiencies at high temperature /pressure conditions. An added advantage of
method for PLE is the significantly shortened method development time because the
same solvent used in existing extraction methods can be used, reducing the amount of
time for method optimization. This PLE method of soils sample preparation has
advantages over conventional Soxhlet extraction for sample automation, reduced
extraction time and reduced solvent volume. Data showing the method R.S.D. and
reproducibility prove method suitability for routine monitoring of the compounds of
interest in samples of soil. Although we have not covered all classes of environmentally-
important compounds, PLE of representative semi-volatile compounds in soils matrix as
well as real samples indicate this technique is a viable technique among the new regime
of rapid method for extraction. Recoveries using PLE were in all cases satisfactory,
offering good agreement with established data reported.
62

5.2 Suggestions for Further Study
Although satisfactory results were obtained using high operating temperature RP-
HPLC with silica column in this study, the percentage of organic modifier compositions
should be considered. Therefore, further studies could be conducted using the modified
silica such as titanium grafting or zirconization of silica substrates which highly stable
stationary phase under neutral high pH conditions. Zirconia by itself has very rich surface
chemistry and able to withstand extended exposure to column temperature as high as
200ºC.
Further studies could be conducted where temperature programming
micro-column liquid chromatography separation technique can be utilized to improve the
separation resolution when dealing with complex mixtures. The use of temperature
programming requires fast heat transfer from the heating medium into a chromatographic
system. Hence, micro bore column (I.D. < 1 min) or alternative highly stable capillary,
which provides a very low heat capacity, can be utilized, as it is easily thermostated to a
precise and constant temperature.
In order to minimize or prevent adverse effects of POPs, many studies illustrate
the fate of POPs in natural environments. PAHs as one of the typical persistent organic
compounds (POPs) featured in regional and global cycling. Further studies should be
conduct using a different analytes which has been listing of 16 PAH priority pollutants
comprises by US Environmental Protection Agency (EPA), German and Dutch standard
methods only specify 6 and 10 PAHs, respectively. Because more and more PAHs are
identified and investigated on their toxicity it can be expected that the list will be
extended in the near future. PAHs are emitted mainly into the atmosphere and have been
detected at long distances from their source. Extensively studies should be taken at
environment samples such as vegetables, fish, marine sediment or other suspect places of
distribution PAHs.
63
REFERENCES
1. Braithwaite, A. and Smith, F.J. Chromatograhic Methods. Dordrect: Kluwer
Academic Publishers. 1999.
2. Lunn, G. HPLC: Methods for Pharmaceutical Analysis. New York: J. Wiley.
2000.
3. Synder, L.R., Kirkland, J.J. and Glajch, J.L. Practical HPLC Development.
New York:J. Wiley. 1997.
4. Neue, U.D. HPLC Column: Theory, Technology and Practice. New
York:Wiley-VCH. 1997.
5. Katz, E., Eksteen, R., Schoenmakers, P. and Miller, N. Handbook of HPLC.
New York:Marcel Daker. 1998.
6. Sadek, P.C. The HPLC Solvent Guide. New York:Wiley-Interscience. 2002.
7. Carr, P.W. and Thompson, J.D. Study of the Critical Criteria for Analyte
Stability in High Temperature Liquid Chromatography. Anal. Chem., 2002.
74:1017-1023.
8. Dasgupta, P.K. and Kephart, T.S. Superheated Water Eluent Capillary Liquid
Chromatography. Talanta, 2002. 56:977-987.
9. McNeff, C., Zigan, L., Johnson, K., Carr, P.W., Wang, A. and Weber-Main,
A.M. Analytical Advantages of Highly Stable Stationary Phases for Reversed-
Phase LC. J. Chromatogr. A, 2000. 18:514-529.
64
10. Smith, R.M. and Burgess, R.J. Superheated Water as an Eluent for Reversed-
Phase High-Performance Liquid Chromatography. J. Chromatogr. A, 1997.
785:49-55.
11. Yang, Y., Lamm, L.J. He, P. and Kondo, T. Temperature Effect on Peak
Width and Column Efficiency in Subcritical Water Chromatography. J.
Chromatogr A, 2002. 40:107.
12. Antia, F.D. and Horvath, C. High-Performance Liquid Chromatography at
Elevated Temperature: Examination of Conditions for the Rapid Separation of
Large Molecules. J. Chromatogr A, 1998. 435:1.
13. Schrenker, H. Effect of Mobile Phase Pre-Heating on High Performance
Liquid Chromatography Column Performance: A New Type of Column
Thermostat. J. Chromatogr A, 1981. 213:243-252.
14. Marin, S.J., Jones, B.A., Felix, W.D. and Clark, J. Effect of High-Temperature
on High-Performance Liquid Chromatography Column Stability and
Performance under Temperature-Programmed Conditions. J. Chromatogr. A,
2004. 1030:255-262.
15. Carr, P.W. and Li, J. Fast Separation at Elevated Temperature on
Polybutadiene-Coated Zirconia Reversed-Phase Material. Anal. Chem., 1997.
69:3884-3888.
16. Sanagi, M.M., Hong, S.H., Ibrahim, W.Aini and Naim, A.A. High
Temperature Liquid Chromatography of Triazole Fungicides on
Polybutadiene-Coated Zirconia Stationary Phase. J. Chromatogr. A. 2004.
1059:95-101.
17. Smith, R.M. Extraction with Superheated Water. J. Chromatogr. A, 2002.
975:31-46.
65
18. Openheim, G. and Grushka, E. Temperature-Dependent Refractive Index
Issues Using a UV-Visible Detector in HPLC. J. Chromatogr. A, 2002.
942:231.
19. Bidlingmeyer, B.A. and Henderson, J. Investigation of Retention on Bare-
Silica using Reversed-Phase Mobile Phases at Elevated Temperatures. J.
Chromatogr. A. 2004. 1060:187-193.
20. Li, X.F., Ma, M., Cheng, A., Zheng, J. and Tam, Y.K. “Determination of
Testosterone and Its Metabolites Using Liquid Chromatography with Elevated
Column Temperature and Flow-Rate Gradient. Anal. Chim. Acta, 2002.
457:165-171.
21. Scott, R.P.W. Small Bore Liquid Chromatography Columns: Their Properties
and Uses. New York: John Wiley and Sons. 1984.
22. Hancock, W.S., Chloupek, R.C., Kirkland, J.J. and Synder, L.R. Temperature
as a Variable in Reversed-Phased High Performance Liquid Chromatography
Separations of Peptide and Protein Samples. I. Optimizing the Separation of a
Growth Hormone Tryptic Digest. J. Chromatogr. A, 1994. 686:31.
23. Claessens, H.A. and Straten, M.A.V. Review on the Chemical and Thermal
Stability of Stationary Phases for RP-HPLC. J. Chromatogr. A, 2004.
1600:23-41.
24. Aldlof, R. and Lost, G. Analysis of Triglyceride Isomers by Silver-Ion HPLC:
Effect of Column Temperature on Retention Times. J. Chromatogr. A, 2004.
1046:109-113.
66

25. Fonseca, D.A., Humberto, R.G. and Collins, K.E. Rapid Method for
Evaluating RP-HPLC Columns Stability. J. Chromatogr. A, 2004. 1030:149-
155.
26. Stricbich, R.C. and Lawrence, J. Thermal Decomposition of High-Energy
Density Materials at High Pressure and High Temperature. J. of Anal. And
Appl. Pyrol, 2003. 70:339-352.
27. Kephart, T.S. and Dasgupta, P.K. Hot Eluent Capillary Liquid
Chromatography using Zirconia and Titania Based Stationary Phases. Anal.
Chim. Acta, 2000. 414:71-78.
28. Buckenmaier, S.M.C. McCalley, D.V. and Euerby, M.R. Rationalisation of
Unusual Changes in Efficiency and Retention with Temperature Shown Bases
in Reversed-phase HPLC at Intermediate pH. J. Chromatogr. A, 2004.
213:1145-152.
29. Smith, R.M. and Garside, D.R. Effect of Organic Modifier on the Separation
and Efficiencies of Homologues on Porous Polymer Columns. J. Chromatogr
A, 1987. 407:19-35.
30. He, H.B., Zhang, W.N., Da, S.L. and Feng, Y.Q. Preparation and
Characterization of a Magnesia-Zirconia Stationary Phase Modified with B-
Cyclodextrin for Reversed Phase HPLC. Anal. Chim. Acta, 2004. 513:481-
492.
31. Carr, P.W. and Li, J. Evaluation of Temperature Effects on Selectivity RPLC
Separation using Polybutadiene-Coated Zirconia. Anal. Chem, 1997. 69:2202-
2206.
67
32. Nawrocki, J., Dunlap, C., McCormick, A. and Carr, P.W. Part I.
Chromatography Using Ultra-Stable Metal Oxide-Based Stationary Phases for
High Performance Liquid Chromatography. J. Chromatogr. A, 2004. 1028:1.
33. Unger, K.K. Packings and Stationary Phases in Chromatographic Technique.
New York:Marcel Dekker. 1990
34. Neue, U.D. Encyclopedia of Analytical Chemistry. New York:Wiley. 2000.
11450.
35. Kirkland, J.J. and Straten, M.A., High pH Mobile Phase Effects on Silica-
Based Reversed-Phased High Performance Liquid Chromatography. J.
Chromatogr. A, 1995. 691:3-19.
36. Kirkland, J.J., Truszkowski, F.A. and Ricker, R.D. A Typical Silica-Based
Column Packings for High Performance Liquid Chromatography. J.
Chromatogr A, 2002. 965:25-34.
37. Collins, K.E., Tohni, E. and Collins, C.H. High Performance Liquid
Chromatography Stationary Phases Based on Poly(methyloctyl siloxane)
Immobilized on Silica. I. Physical and Chemical Characterization. J.
Chromatogr. A, 2002. 948:109.
38. Burkhardt, M.R., Revello, R.C., Smith, S.G. and Zaugg, S.D. Pressurized
Liquid Extraction Using Water/Isopropanol Coupled with Solid-Phase
Extraction Cleanup for Industrial and Anthropogenic Waste-Indicator
Compounds in Sediment. Anal. Chim. Acta, 2005. 534:89-100.
39. Karakoc, F.T., Tolun, L., Henkelmann, B., Klimm, C., Okay, O. and
Schramm, K.W. Polycyclic Aromatic Hydrocarbons (PAHs) and
Polychlorinated Biphenyls (PCBs) Distributions in The Bay of Marmara Sea:
Izmit Bay. J. Chromatogr A, 2002. 119: 383-397.
68
40. Bjorklund, E., Bowardt, S., Nilsson, T. and Mathiasson, L. Pressurized Fluid
Extraction of Polychlorinated Biphenyls and Polycyclic Aromatic
Hydrocarbons in Solid Environmental Samples. J. Chromatogr A, 1999.
836:285-293.
41. Song, Y.F., Jing, X., Fleischmann, S. and Wilke, B.M. Comparative Study of
Extraction Methods for the Determination of PAHs From Contaminated Soils
and Sediments. Chemosphere. 2002. 48:993-1001.
42. Wan, H.B. and Wong, M.K. Minimization of Solvent Consumption in
Pesticide Residue Analysis. J. Chromatogr. A, 1996. 754:43-47.
43. Popp, P., Keil, P., Moder, M., Paschke, A. and Thuss, U. Application of
Accelerated Solvent Extraction Follwed By Gas Chromatography, High
Performance Liquid Chromatography and Gas Chromatography-Mass
Spectrometry For The Determination of Polycyclic Aromatic Hydrocarbons,
Chlorinated Pesticides and Polychlorinated Dibenzo-p-dioxin and
Dibenzofuran in Soild Wates. J. Chromatogr. A, 1997. 774:203-211.
44. Saim, N., Dean, J.R., Abdullah, M.F. and Zakaria, Z. Extraction of Polycyclic
Aromatic Hydrocarbons From Contaminated Soils using Soxhlet Extraction,
Pressurized and Atmospheric Microwave-assisted Extraction, Supercritical
Fluid Extraction and Accelerated Solvent Extraction. J. Chromatogr. A, 1997.
791:361-366.
45. Bruce, R.E. Extraction of Hydrocarbons Contamination From Soils Using
Accelerated Solvent Extraction. J. Chromatogr. A, 2000. 874:217-224.
46. Coym, J.S. and Dorsey, J.G. Reversed-phase Retention Thermodynamics of
Pure-Water Mobile Phases at Ambient and Elevated Temperature. J.
Chromatogr. A, 2004.1035:23-29.
69
47. Greibrokk, T. and Andersen, T. High Temperature Liquid Chromatography. J.
Chromatogr. A, 2003. 1000:743-755.
48. Bowermaster, J. and McNair, H. High Speed Liquid Chromatography By
Simultaneous Optimization of Temperature and Eluent Composition. J.
Chromatogr. Sci., 1984. 22:165.
49. McCalley, D.V. Effects of Temperature and Flow Rate on Analysis of Basic
Compounds in High Performance Liquid Chromatography Using a Reversed-
Phased Column. J. Chromatogr. A, 2000. 902:311.
50. Fisher, R., Kreuzig, R. and Bahadir, M. Extraction Behaviour of Polycyclic
Aromatic Hydrocarbons Absorbed on Waste Incinerator Fly Ash.
Chemosphere, 1994. 29:311-317.
51. Eschenbach, A., Kastner, M., Bierl, R., Schaefer, G. and Mahro, B. Evaluation
of a New, Effective Method to Extract Polycyclic Aromatic Hydrocarbons
From Soil samples. Chemosphere, 1994. 28:683-692.
52. Jaska, M., Tomaniora, M., Hajslova, J. and Kocourek, V. Appraisal of
“Classic” and “Novel” Extraction Procedure Efficiencies for the Isolation of
Polycyclic Aromatic Hydrocarbons and their Derivatives from Biotic
Matrices. Anal. Chim. Acta, 2004. 520:93-103.
53. Auer, W. and Malissa, J. H. Determination of Trace Amounts of Polycyclic
Aromatic Hydrocarbons in Soil. J. Agric. Food Chem, 1990. 237:451-457.
54. Marten, D., Magahn, J., Spizauer, P. and Kettrup, A. Occurrence and
Distribution of PAHs in an Agricultural Ecosytem. Anal. Chem., 1997.
359:547-554.
70
55. Filipkowska, A., Lubecki, L. and Kowalewska, G. Polycyclic Aromatic
Hydrocarbons Analysis in Different Matrices of the Marine Environment.
Anal. Chim. Acta.,2005. 547:243-254.
71
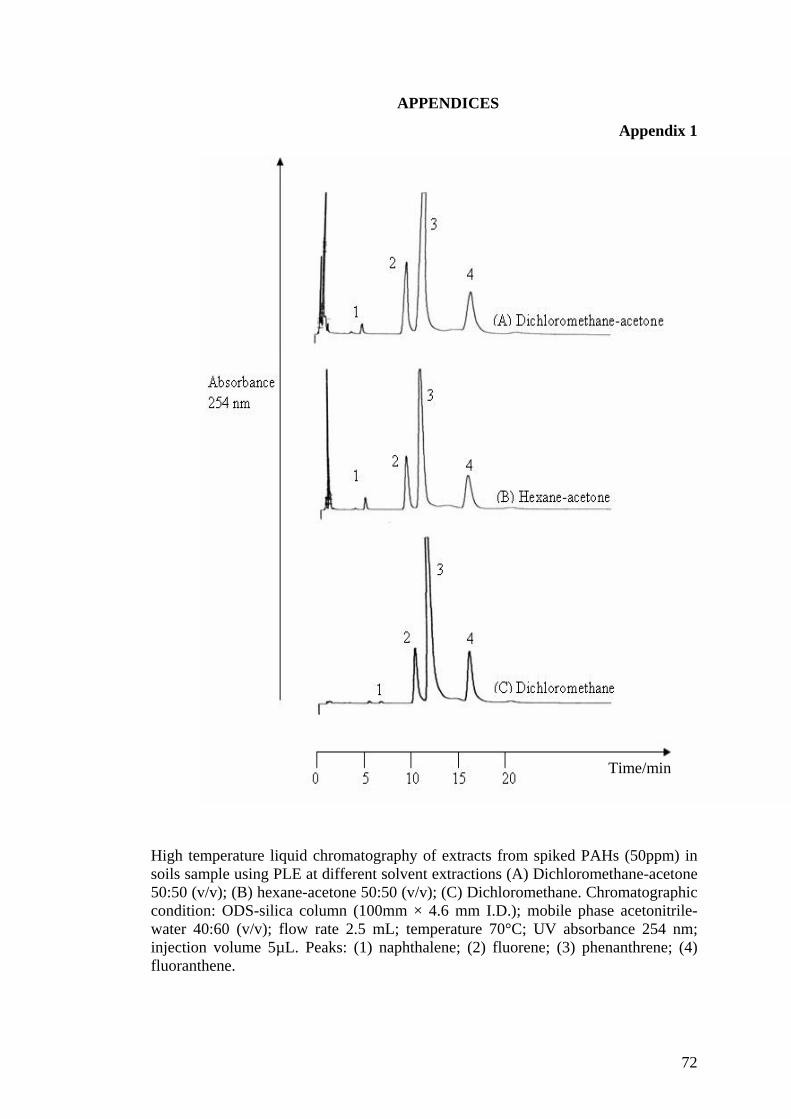
APPENDICES
Appendix 1
Time/min
High temperature liquid chromatography of extracts from spiked PAHs (50ppm) in soils sample using PLE at different solvent extractions (A) Dichloromethane-acetone 50:50 (v/v); (B) hexane-acetone 50:50 (v/v); (C) Dichloromethane. Chromatographic condition: ODS-silica column (100mm × 4.6 mm I.D.); mobile phase acetonitrile-water 40:60 (v/v); flow rate 2.5 mL; temperature 70°C; UV absorbance 254 nm; injection volume 5µL. Peaks: (1) naphthalene; (2) fluorene; (3) phenanthrene; (4) fluoranthene.
72
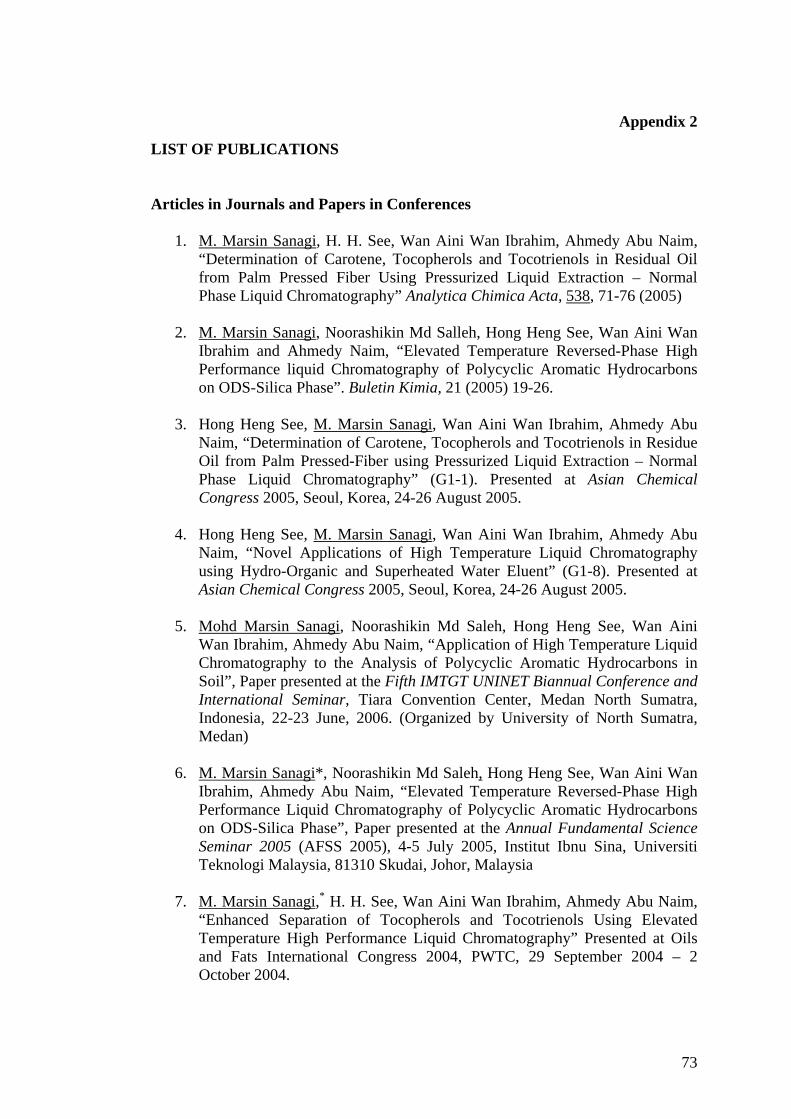
Appendix 2
LIST OF PUBLICATIONS Articles in Journals and Papers in Conferences
1. M. Marsin Sanagi, H. H. See, Wan Aini Wan Ibrahim, Ahmedy Abu Naim, “Determination of Carotene, Tocopherols and Tocotrienols in Residual Oil from Palm Pressed Fiber Using Pressurized Liquid Extraction – Normal Phase Liquid Chromatography” Analytica Chimica Acta, 538, 71-76 (2005)
2. M. Marsin Sanagi, Noorashikin Md Salleh, Hong Heng See, Wan Aini Wan Ibrahim and Ahmedy Naim, “Elevated Temperature Reversed-Phase High Performance liquid Chromatography of Polycyclic Aromatic Hydrocarbons on ODS-Silica Phase”. Buletin Kimia, 21 (2005) 19-26.
3. Hong Heng See, M. Marsin Sanagi, Wan Aini Wan Ibrahim, Ahmedy Abu
Naim, “Determination of Carotene, Tocopherols and Tocotrienols in Residue Oil from Palm Pressed-Fiber using Pressurized Liquid Extraction – Normal Phase Liquid Chromatography” (G1-1). Presented at Asian Chemical Congress 2005, Seoul, Korea, 24-26 August 2005.
4. Hong Heng See, M. Marsin Sanagi, Wan Aini Wan Ibrahim, Ahmedy Abu Naim, “Novel Applications of High Temperature Liquid Chromatography using Hydro-Organic and Superheated Water Eluent” (G1-8). Presented at Asian Chemical Congress 2005, Seoul, Korea, 24-26 August 2005.
5. Mohd Marsin Sanagi, Noorashikin Md Saleh, Hong Heng See, Wan Aini Wan Ibrahim, Ahmedy Abu Naim, “Application of High Temperature Liquid Chromatography to the Analysis of Polycyclic Aromatic Hydrocarbons in Soil”, Paper presented at the Fifth IMTGT UNINET Biannual Conference and International Seminar, Tiara Convention Center, Medan North Sumatra, Indonesia, 22-23 June, 2006. (Organized by University of North Sumatra, Medan)
6. M. Marsin Sanagi*, Noorashikin Md Saleh, Hong Heng See, Wan Aini Wan Ibrahim, Ahmedy Abu Naim, “Elevated Temperature Reversed-Phase High Performance Liquid Chromatography of Polycyclic Aromatic Hydrocarbons on ODS-Silica Phase”, Paper presented at the Annual Fundamental Science Seminar 2005 (AFSS 2005), 4-5 July 2005, Institut Ibnu Sina, Universiti Teknologi Malaysia, 81310 Skudai, Johor, Malaysia
7. M. Marsin Sanagi,* H. H. See, Wan Aini Wan Ibrahim, Ahmedy Abu Naim, “Enhanced Separation of Tocopherols and Tocotrienols Using Elevated Temperature High Performance Liquid Chromatography” Presented at Oils and Fats International Congress 2004, PWTC, 29 September 2004 – 2 October 2004.
73
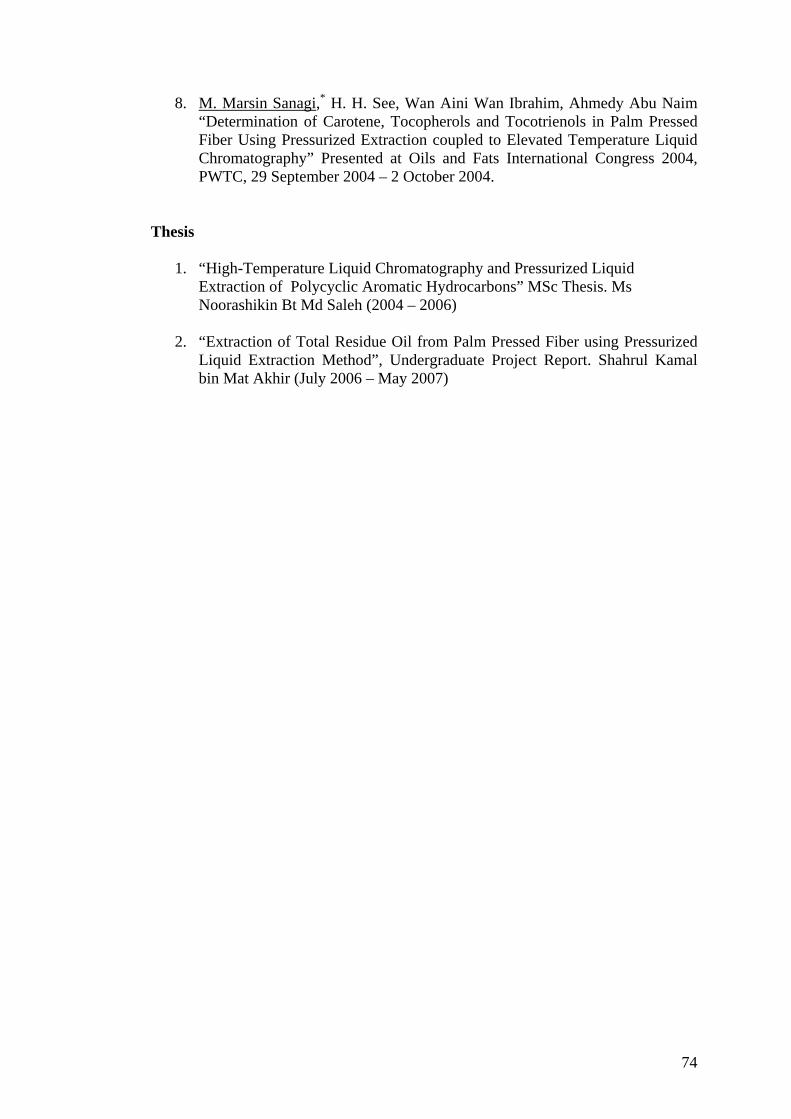
8. M. Marsin Sanagi,* H. H. See, Wan Aini Wan Ibrahim, Ahmedy Abu Naim “Determination of Carotene, Tocopherols and Tocotrienols in Palm Pressed Fiber Using Pressurized Extraction coupled to Elevated Temperature Liquid Chromatography” Presented at Oils and Fats International Congress 2004, PWTC, 29 September 2004 – 2 October 2004.
Thesis
1. “High-Temperature Liquid Chromatography and Pressurized Liquid
Extraction of Polycyclic Aromatic Hydrocarbons” MSc Thesis. Ms Noorashikin Bt Md Saleh (2004 – 2006)
2. “Extraction of Total Residue Oil from Palm Pressed Fiber using Pressurized Liquid Extraction Method”, Undergraduate Project Report. Shahrul Kamal bin Mat Akhir (July 2006 – May 2007)
74
Appendix 3
LIST OF AWARDS
1. Gold Medal at the Seoul International Invention Fair 2006 organized by Korea Invention Promotion Association in Seoul, Korea, 7-11 December 2006. Invention: “PLEX: Pressurized Liquid Extraction for the Monitoring of Residue Oil Content and Natural Vitamin E in Palm Pressed Fiber”. Inventors: Mohd Marsin Sanagi, See Hong Heng, Wan Aini Wan Ibrahim, Ahmedy Abu Naim.
2. Silver Medal at the 17th International Invention, Innovation, Industrial Design & Technology Exhibition 2006 (ITEX 2006), Kuala Lumpur Convention Centre, 19-21 May 2006. Name of invention: “PLEX: Method for Pressurized Liquid Extraction (for the monitoring of residue oil content) and Separation of Natural Vitamin E in Palm Pressed Fiber”, Inventors: Mohd Marsin Sanagi, See Hong Heng, Wan Aini Wan Ibrahim, Ahmedy Abu Naim.
75