Embed Size (px)
Citation preview

Annual Financial St atements | as at March 31, 2009
issued by Lakeview Asset Management
Lakeview Disciplined Leadership Funds
Overview .................................................................................................................................. 1
About the CI Funds Board of Governors and
Letter from the CI Funds Board of Governors...................................................................2
Management and Auditors’ Reports .....................................................................................3
Lakeview Disciplined Leadership Canadian Equity Fund ............................................................ 4
Lakeview Disciplined Leadership U.S. Equity Fund .................................................................... 9
Lakeview Disciplined Leadership High Income Fund ................................................................ 14
Notes to the Financial Statements ..................................................................................... 20
Legal Notice............................................................................................................................24
A look inside

– 1 –
Enclosed are the Financial Statements for the CI Investments mutual
funds for the year ending March 31, 2009. These financial statements
also include a complete list of portfolio holdings for each fund.
Additional information about the funds can be found on our website,
www.ci.com, including fund profiles, which are updated monthly,
Management Reports of Fund Performance, and portfolio manager
commentaries.
If you have any questions about your investments, please contact your
financial advisor. CI is proud to partner with advisors across Canada.
We believe investors are most successful when they follow an
investment plan developed with the assistance of a qualified advisor.
You may also contact CI Client Services at 1-800-792-9355. Thank
you for investing with us.
ABOUT CI INVESTMENTS
CI has been investing on behalf of Canadians since 1965 and has
grown to become one of Canada’s largest investment fund companies.
We manage over $43 billion on behalf of two million Canadians.
CI is a subsidiary of CI Financial Corp., a TSX-listed financial services
firm with $78 billion in fee-earning assets at March 31, 2009.
CI provides one of the industry’s widest selections of investment
products and services and a strong lineup of leading portfolio
management teams. Our portfolio management expertise is offered
through several platforms, including mutual funds, tax-efficient funds,
segregated funds, and managed solutions.
2 Queen Street East, Twentieth FloorToronto, Ontario M5C 3G7www.ci.com
Telephone: 416-364-1145Toll Free: 1-800-268-9374Facsimile: 416-364-6299

The CI Funds Board of Governors was voluntarily established by CI in 1998 making it one of the first
such fund governance bodies in Canada.
The Board of Governors acts as an independent governance body the Funds, providing impartial
judgment on conflicts of interest with a view to the best interests of the Funds and investors. The
Board of Governors recommends the best course of action to achieve a fair and reasonable result on
any conflict of interest issues, and CI takes into account its recommendation in accordance with its
fiduciary duty to the Funds. All of the members of the Board are independent of CI.
The Board of Governors mandate is set out in a separate charter and reviewed annually by the Board
to ensure its mandate conforms to the expectations and requirements of Canadian securities
regulators. Along with dealing with conflicts of interest, the mandate provides that the Board acts as
an audit committee for the Funds for the purpose of reviewing the financial statements of the Funds
with the auditors of the Funds and reviews holdings, purchases and sales by the Funds of securities
of the Bank of Nova Scotia and CI Financial Corp.
The Board also reviews and discusses on a regular basis matters including compliance of the Funds
with CI’s relevant policies and procedures, approval of the Funds’ auditors and the fees paid to those
auditors, and the performance of the Board and its members.
The Board of Governors adheres to the requirements set out by Canadian securities regulators in
National Instrument 81-107 Independent Review Committee for Investment Funds which requires all
mutual funds in Canada to have independent review committees.
The Board of Governors are compensated as recommended by the Canadian securities regulators in
their rule and as set out in its mandate. These expenses are paid by CI and charged to the Funds as
part of their administration fee.
The members of the Board of Governors are:
William Harding, Managing Partner, Alpine Asset Advisors AG
Governor since June 2005
Stuart P. Hensman, Corporate Director
Governor since December 2004
Christopher M. Hopper, General Manager, KLQ Mechanical Ltd.
Governor since May 2007
Sharon M. Ranson, President, The Ranson Group
Governor since December 2004
About the CI Funds Board of Governors
The Funds Board of Governors is pleased to report on its activities in respect of the annual period
ended March 31, 2009 and to date. The Governors are appointed pursuant to the Declarations of Trust
governing the Funds.
The Governors have reviewed, commented on and approved the CI Code of Ethics and Conduct, which
establishes rules of conduct designed to ensure fair treatment of the Funds’ securityholders and that,
at all times, the interests of the Funds and their securityholders are placed above personal interests
of employees, officers and directors of the Manager and each of its subsidiaries and affiliates, the
subadvisers, and the Governors, through the application of the highest standards of integrity and
ethical business conduct. The CI Code of Ethics and Conduct requires the prior clearance of personal
trades and restricts the ability of staff to trade any securities held by the Funds. The objective is not
only to remove any potential for real conflict of interest but to avoid any perception of conflict. The
Manager's year 2008 report on compliance with the CI Code of Ethics and Conduct and other relevant
policies has been provided to the Governors in a timely and satisfactory manner.
The Governors report that management has been open and cooperative, permitting the Governors to
meet with subadvisers, to meet with individual department heads and personnel to review control
mechanisms and compliance procedures, including those relating to the personal securities trading
activity of employees, and to consider other matters that affect the Funds. During 2008, the Governors
also acted as the audit committee of the Funds. The audit committee reviewed, with the Funds’
auditors, the planning, scope and results of the audit of the financial statements of the Funds for the
year 2008. In May 2009, the Board of Governors received and accepted the Annual Financial
Statements of the Funds.
Stuart P. Hensman
Chair, Board of Governors
May 27, 2009
Letter from the CI Funds Board of Governors
Annual Financial Statements as at March 31, 2009 – 2 –

Annual Financial Statements as at March 31, 2009
Management and Auditors’ Reports - Lakeview Disciplined Leadership Funds
MANAGEMENT’S RESPONSIBILITY
FOR FINANCIAL REPORTING
The accompanying financial statements have been prepared by CI Investments Inc., the Manager of
the Funds, and approved by the Board of Directors of the Manager. The Funds’ Manager is responsible
for the information and representations contained in these financial statements and other sections of
this report.
CI Investments Inc. maintains appropriate processes to ensure that relevant and reliable financial
information is produced. The financial statements have been prepared in accordance with accounting
principles generally accepted in Canada and include certain amounts that are based on estimates and
judgments. The significant accounting policies which management believes are appropriate for the
Funds are described in Note 2 to the financial statements.
Financial information provided elsewhere in this report is consistent with that in the financial
statements.
The Board of Directors is responsible for reviewing and approving the financial statements and
overseeing the performance of its financial reporting responsibilities. They also review the adequacy
of internal controls, the audit process and financial reporting with external auditors.
PricewaterhouseCoopers LLP are the external auditors of the Funds. They have audited the financial
statements in accordance with Canadian generally accepted auditing standards to enable them to
express to the unitholders their opinion on the financial statements. Their report is set out below.
Chief Executive Officer
CI INVESTMENTS INC.
Chief Financial Officer
CI INVESTMENTS INC.
AUDITORS’ REPORT
To the Unitholders of the Lakeview Disciplined Leadership Funds (the “Funds”).
We have audited the Statements of Investment Portfolio of each of the Funds as at March 31, 2009,
and the Statements of Net Assets, Operations and Changes in Net Assets as at and for the periods
indicated in Note 1. These financial statements are the responsibility of the Funds’ management. Our
responsibility is to express an opinion on these financial statements based on our audits.
We conducted our audits in accordance with Canadian generally accepted auditing standards. Those
standards require that we plan and perform an audit to obtain reasonable assurance whether the
financial statements are free of material misstatement. An audit includes examining, on a test basis,
evidence supporting the amounts and disclosures in the financial statements. An audit also includes
assessing the accounting principles used and significant estimates made by the Trustee, as well as
evaluating the overall financial statement presentation.
In our opinion, these financial statements present fairly, in all material respects, the financial position
of each of the Funds, the results of each of their operations and the changes in each of their net assets
as at and for the periods indicated in Note 1 in accordance with Canadian genereally accepted
accounting principles.
PRICEWATERHOUSECOOPERS LLP
Chartered Accountants, Licensed Public Accountants
Toronto, Ontario
June 5, 2009
– 3 –
– 4 –
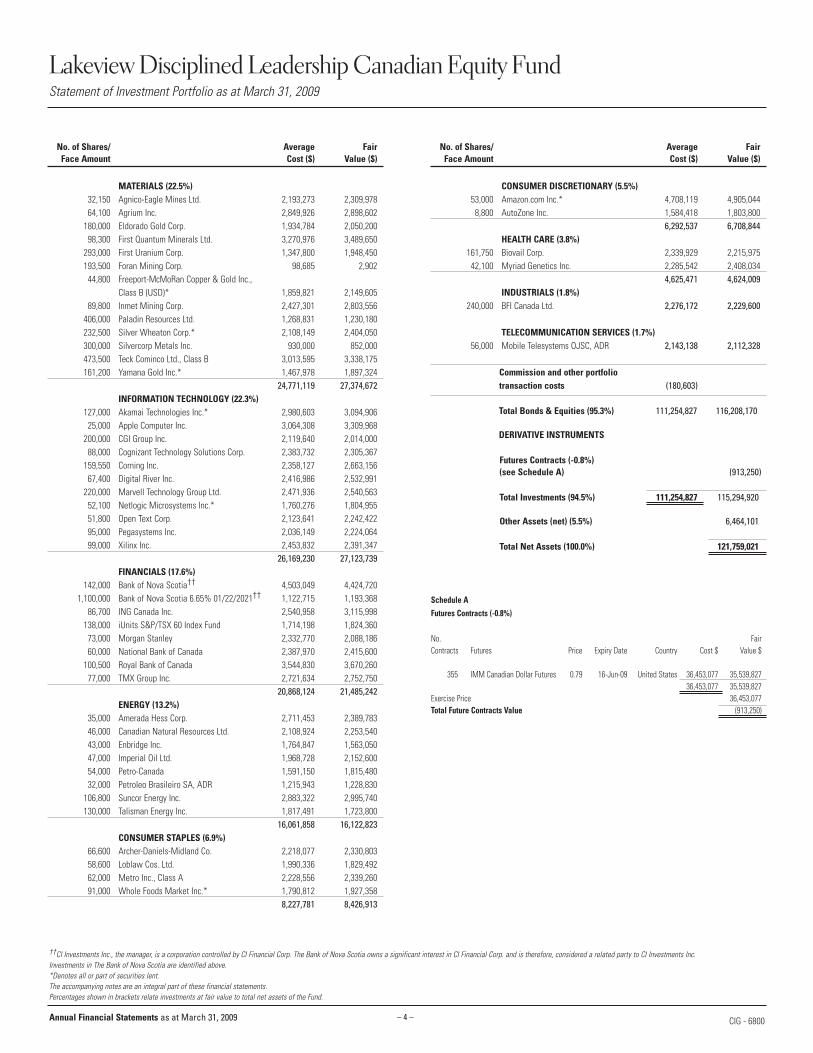
Lakeview Disciplined Leadership Canadian Equity FundStatement of Investment Portfolio as at March 31, 2009
No. of Shares/ Average FairFace Amount Cost ($) Value ($)
No. of Shares/ Average FairFace Amount Cost ($) Value ($)
MATERIALS (22.5%) 32,150 Agnico-Eagle Mines Ltd. 2,193,273 2,309,978 64,100 Agrium Inc. 2,849,926 2,898,602
180,000 Eldorado Gold Corp. 1,934,784 2,050,200 98,300 First Quantum Minerals Ltd. 3,270,976 3,489,650
293,000 First Uranium Corp. 1,347,800 1,948,450 193,500 Foran Mining Corp. 98,685 2,902
44,800 Freeport-McMoRan Copper & Gold Inc., Class B (USD)* 1,859,821 2,149,605
89,800 Inmet Mining Corp. 2,427,301 2,803,556 406,000 Paladin Resources Ltd. 1,268,831 1,230,180 232,500 Silver Wheaton Corp.* 2,108,149 2,404,050 300,000 Silvercorp Metals Inc. 930,000 852,000 473,500 Teck Cominco Ltd., Class B 3,013,595 3,338,175 161,200 Yamana Gold Inc.* 1,467,978 1,897,324
24,771,119 27,374,672INFORMATION TECHNOLOGY (22.3%)
127,000 Akamai Technologies Inc.* 2,980,603 3,094,906 25,000 Apple Computer Inc. 3,064,308 3,309,968
200,000 CGI Group Inc. 2,119,640 2,014,000 88,000 Cognizant Technology Solutions Corp. 2,383,732 2,305,367
159,550 Corning Inc. 2,358,127 2,663,156 67,400 Digital River Inc. 2,416,986 2,532,991
220,000 Marvell Technology Group Ltd. 2,471,936 2,540,563 52,100 Netlogic Microsystems Inc.* 1,760,276 1,804,955 51,800 Open Text Corp. 2,123,641 2,242,422 95,000 Pegasystems Inc. 2,036,149 2,224,064 99,000 Xilinx Inc. 2,453,832 2,391,347
26,169,230 27,123,739FINANCIALS (17.6%)
142,000 Bank of Nova Scotia†† 4,503,049 4,424,720 1,100,000 Bank of Nova Scotia 6.65% 01/22/2021†† 1,122,715 1,193,368
86,700 ING Canada Inc. 2,540,958 3,115,998 138,000 iUnits S&P/TSX 60 Index Fund 1,714,198 1,824,360
73,000 Morgan Stanley 2,332,770 2,088,186 60,000 National Bank of Canada 2,387,970 2,415,600
100,500 Royal Bank of Canada 3,544,830 3,670,260 77,000 TMX Group Inc. 2,721,634 2,752,750
20,868,124 21,485,242ENERGY (13.2%)
35,000 Amerada Hess Corp. 2,711,453 2,389,783 46,000 Canadian Natural Resources Ltd. 2,108,924 2,253,540 43,000 Enbridge Inc. 1,764,847 1,563,050 47,000 Imperial Oil Ltd. 1,968,728 2,152,600 54,000 Petro-Canada 1,591,150 1,815,480 32,000 Petroleo Brasileiro SA, ADR 1,215,943 1,228,830
106,800 Suncor Energy Inc. 2,883,322 2,995,740 130,000 Talisman Energy Inc. 1,817,491 1,723,800
16,061,858 16,122,823CONSUMER STAPLES (6.9%)
66,600 Archer-Daniels-Midland Co. 2,218,077 2,330,803 58,600 Loblaw Cos. Ltd. 1,990,336 1,829,492 62,000 Metro Inc., Class A 2,228,556 2,339,260 91,000 Whole Foods Market Inc.* 1,790,812 1,927,358
8,227,781 8,426,913
CONSUMER DISCRETIONARY (5.5%) 53,000 Amazon.com Inc.* 4,708,119 4,905,044 8,800 AutoZone Inc. 1,584,418 1,803,800
6,292,537 6,708,844HEALTH CARE (3.8%)
161,750 Biovail Corp. 2,339,929 2,215,975 42,100 Myriad Genetics Inc. 2,285,542 2,408,034
4,625,471 4,624,009INDUSTRIALS (1.8%)
240,000 BFI Canada Ltd. 2,276,172 2,229,600
TELECOMMUNICATION SERVICES (1.7%) 56,000 Mobile Telesystems OJSC, ADR 2,143,138 2,112,328
Commission and other portfolio transaction costs (180,603)
Total Bonds & Equities (95.3%) 111,254,827 116,208,170
DERIVATIVE INSTRUMENTS
Futures Contracts (-0.8%)(see Schedule A) (913,250)
Total Investments (94.5%) 111,254,827 115,294,920
Other Assets (net) (5.5%) 6,464,101
Total Net Assets (100.0%) 121,759,021
Schedule AFutures Contracts (-0.8%)
No. FairContracts Futures Price Expiry Date Country Cost $ Value $
355 IMM Canadian Dollar Futures 0.79 16-Jun-09 United States 36,453,077 35,539,827 36,453,077 35,539,827
Exercise Price 36,453,077 Total Future Contracts Value (913,250)
††CI Investments Inc., the manager, is a corporation controlled by CI Financial Corp. The Bank of Nova Scotia owns a significant interest in CI Financial Corp. and is therefore, considered a related party to CI Investments Inc. Investments in The Bank of Nova Scotia are identified above.*Denotes all or part of securities lent.The accompanying notes are an integral part of these financial statements. Percentages shown in brackets relate investments at fair value to total net assets of the Fund.
Annual Financial Statements as at March 31, 2009 CIG - 6800

– 5 –
Lakeview Disciplined Leadership Canadian Equity FundFinancial Statements
Annual Financial Statements as at March 31, 2009
AssetsInvestments at fair value*CashShort term investmentsMargin for short salesIncome taxes recoverableDaily variation margin on derivative investmentsUnrealized gain on derivative investmentsCash collateral received for securities on loan (Note 6)Premium paid for options contractReceivable for unit subscriptionsReceivable for securities soldManagement fee rebate receivableReceivable for dividends and accrued interest
LiabilitiesBank overdraftManagement fees payableAccrued expensesUnrealized loss on derivative investmentsPremium received from options contractPayable for securities purchasedPayable for unit redemptionsPayable for cash collateral under securities lending (Note 6)Investments sold short at fair value**Distributions payable
Net assets and unitholders' equity
**Investments at cost**Investments sold short at cost
Net assets per classClass AClass FClass I
Net assets per unit (see Schedule of Net Assets Reconciliation)
Class AClass FClass I
Number of units outstanding(see Schedule of Fund Unit Transactions)
Class AClass FClass I
IncomeDividendsInterest Securities lending (Note 6)Derivative income (loss)Income distribution from investmentsManagement fee rebateLess: Foreign withholding taxes
ExpensesManagement fees (Note 5)Performance fees (Note 5)Administrative fees (Note 5)Interest expenseLegal feesAudit feesGoods and services tax
Net investment income (loss) for the period
Realized and unrealized gain (loss) on investments and commissions and other portfolio transaction costs (see Schedule of Commissions)
Realized gain (loss) on investmentsForeign exchange gain (loss)Commissions and other portfolio transaction costsCapital gain distribution from investmentsChange in unrealized appreciation (depreciation)
of investmentsNet gain (loss) on investmentsIncrease (decrease) in net assets from operations
Increase (decrease) in net assets from operations per classClass AClass FClass I
Increase (decrease) in net assets from operationsper unit (Note 2)
Class AClass FClass I
as at as atMarch 31, 2009 Dec. 31, 2007
116,208 126,6392,852 2,648
- 4,675- -- -
3,010 882- -- -- -
744 3637,809 -
- -238 93
130,861 135,300
- -- -- 1
913 112- -
7,922 -267 60
- -- -- -
9,102 173121,759 135,127
111,255 114,581- -
106,817 121,6029,341 6,8615,601 6,664
9.26 12.909.26 12.729.79 13.28
11,530,136 9,429,4341,008,798 539,389
572,441 501,901
Period from Jan. 1, 2008 Year endedto March 31, 2009 Dec. 31, 2007
2,049 9512,218 353
83 7- -- (6)- -
(118) (20)4,232 1,285
3,183 2,390- -
354 11311 14
- 202- 6
177 633,725 2,788
507 (1,503)
(37,467) 26,3961,229 (905)
(3,198) (1,937)47 -
(7,924) (5,224)(47,313) 18,330(46,806) 16,827
(41,852) 14,730(2,952) 895(2,002) 1,202
(3.81) 1.76(3.99) 1.86(3.69) 2.06
Statements of Operations(in $000’s except for per unit amounts)
Statements of Net Assets(in $000’s except for per unit amounts and units outstanding)
The accompanying notes are an integral part of these financial statements.
– 6 –
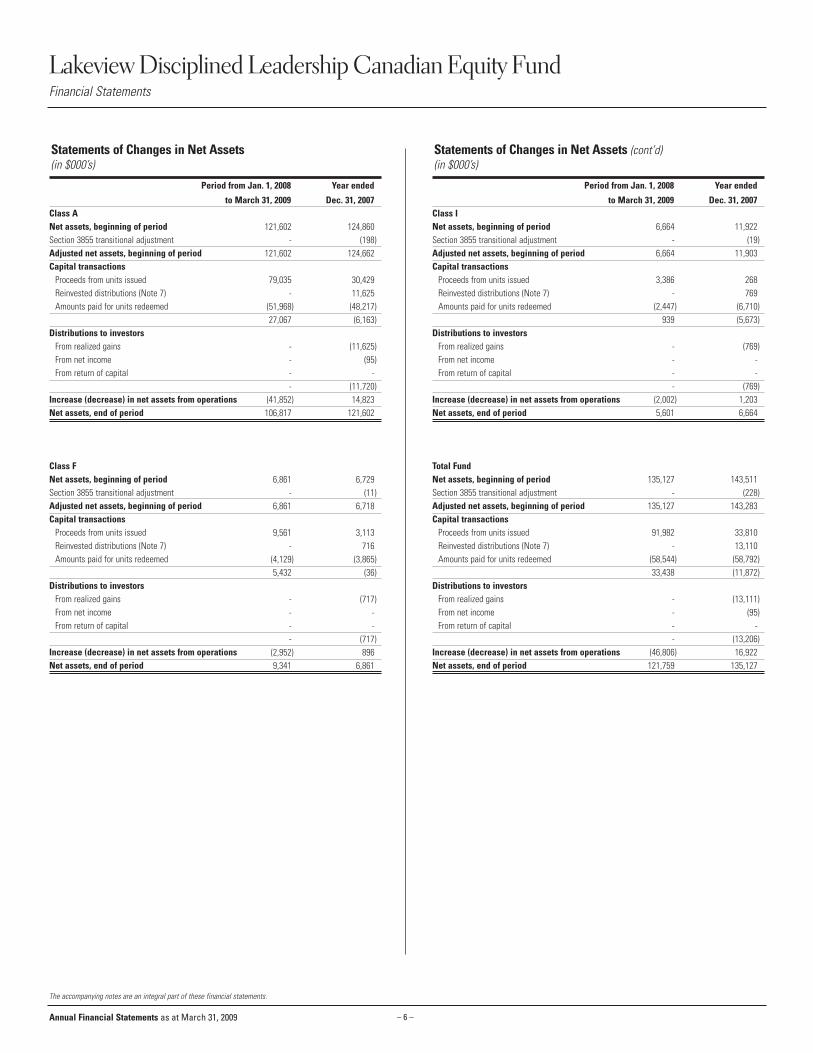
Class ANet assets, beginning of periodSection 3855 transitional adjustment Adjusted net assets, beginning of period Capital transactions
Proceeds from units issued Reinvested distributions (Note 7)Amounts paid for units redeemed
Distributions to investorsFrom realized gainsFrom net incomeFrom return of capital
Increase (decrease) in net assets from operationsNet assets, end of period
Class FNet assets, beginning of periodSection 3855 transitional adjustment Adjusted net assets, beginning of period Capital transactions
Proceeds from units issued Reinvested distributions (Note 7)Amounts paid for units redeemed
Distributions to investorsFrom realized gainsFrom net incomeFrom return of capital
Increase (decrease) in net assets from operationsNet assets, end of period
Class INet assets, beginning of periodSection 3855 transitional adjustment Adjusted net assets, beginning of period Capital transactions
Proceeds from units issued Reinvested distributions (Note 7)Amounts paid for units redeemed
Distributions to investorsFrom realized gainsFrom net incomeFrom return of capital
Increase (decrease) in net assets from operationsNet assets, end of period
Total FundNet assets, beginning of periodSection 3855 transitional adjustment Adjusted net assets, beginning of period Capital transactions
Proceeds from units issued Reinvested distributions (Note 7)Amounts paid for units redeemed
Distributions to investorsFrom realized gainsFrom net incomeFrom return of capital
Increase (decrease) in net assets from operationsNet assets, end of period
6,664 11,922- (19)
6,664 11,903
3,386 268- 769
(2,447) (6,710)939 (5,673)
- (769)- -- -- (769)
(2,002) 1,2035,601 6,664
135,127 143,511- (228)
135,127 143,283
91,982 33,810- 13,110
(58,544) (58,792)33,438 (11,872)
- (13,111)- (95)- -- (13,206)
(46,806) 16,922121,759 135,127
121,602 124,860- (198)
121,602 124,662
79,035 30,429- 11,625
(51,968) (48,217)27,067 (6,163)
- (11,625)- (95)- -- (11,720)
(41,852) 14,823106,817 121,602
6,861 6,729- (11)
6,861 6,718
9,561 3,113- 716
(4,129) (3,865)5,432 (36)
- (717)- -- -- (717)
(2,952) 8969,341 6,861
Lakeview Disciplined Leadership Canadian Equity FundFinancial Statements
Annual Financial Statements as at March 31, 2009
Statements of Changes in Net Assets (in $000’s)
Period from Jan. 1, 2008 Year ended
to March 31, 2009 Dec. 31, 2007
The accompanying notes are an integral part of these financial statements.
Statements of Changes in Net Assets (cont’d)(in $000’s)
Period from Jan. 1, 2008 Year ended
to March 31, 2009 Dec. 31, 2007
– 7 –
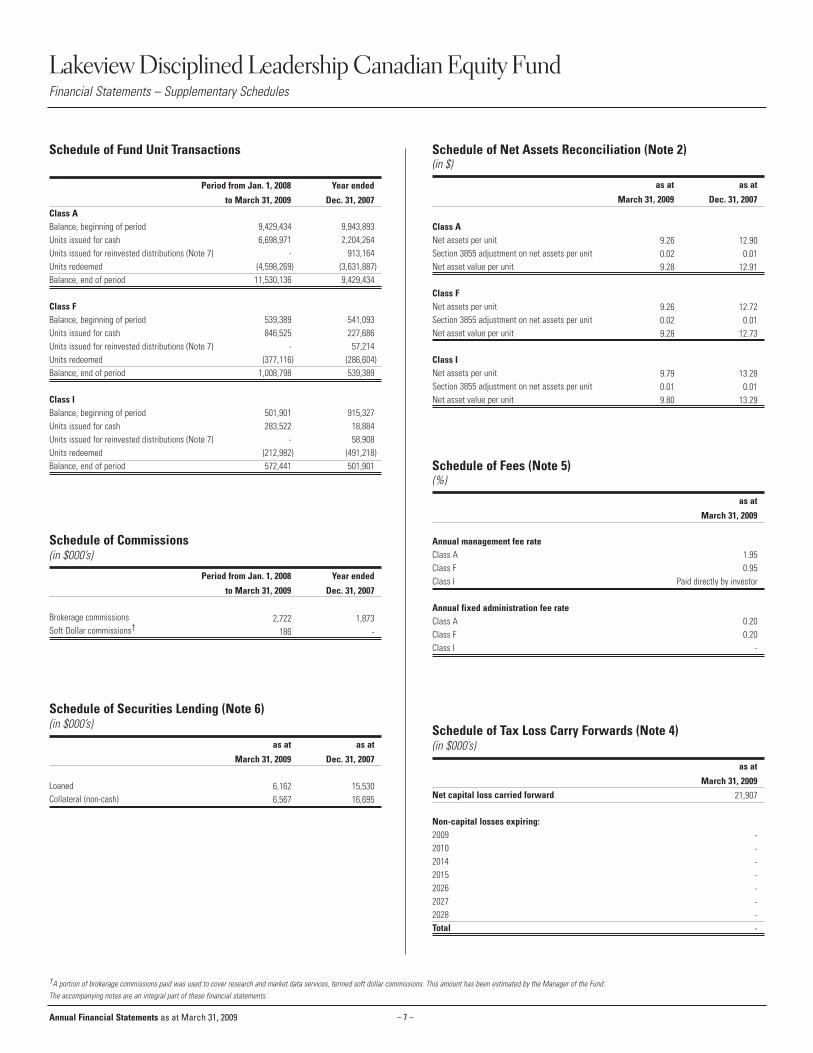
Class ABalance, beginning of periodUnits issued for cash Units issued for reinvested distributions (Note 7)Units redeemedBalance, end of period
Class FBalance, beginning of periodUnits issued for cash Units issued for reinvested distributions (Note 7)Units redeemedBalance, end of period
Class IBalance, beginning of periodUnits issued for cash Units issued for reinvested distributions (Note 7)Units redeemedBalance, end of period
Schedule of Securities Lending (Note 6)(in $000’s)
as at as at
March 31, 2009 Dec. 31, 2007
LoanedCollateral (non-cash)
6,162 15,5306,567 16,695
Lakeview Disciplined Leadership Canadian Equity FundFinancial Statements – Supplementary Schedules
Schedule of Commissions(in $000’s)
Period from Jan. 1, 2008 Year ended
to March 31, 2009 Dec. 31, 2007
Brokerage commissionsSoft Dollar commissions†
2,722 1,873186 -
Schedule of Fund Unit Transactions
Period from Jan. 1, 2008 Year ended
to March 31, 2009 Dec. 31, 2007
9,429,434 9,943,8936,698,971 2,204,264
- 913,164(4,598,269) (3,631,887)
11,530,136 9,429,434
539,389 541,093846,525 227,686
- 57,214(377,116) (286,604)
1,008,798 539,389
501,901 915,327283,522 18,884
- 58,908(212,982) (491,218)572,441 501,901
Annual Financial Statements as at March 31, 2009
†A portion of brokerage commissions paid was used to cover research and market data services, termed soft dollar commissions. This amount has been estimated by the Manager of the Fund.The accompanying notes are an integral part of these financial statements.
Annual management fee rateClass AClass FClass I
Annual fixed administration fee rateClass AClass FClass I
1.950.95
Paid directly by investor
0.200.20
-
Schedule of Fees (Note 5)(%)
as at
March 31, 2009
Class ANet assets per unitSection 3855 adjustment on net assets per unitNet asset value per unit
Class FNet assets per unitSection 3855 adjustment on net assets per unitNet asset value per unit
Class INet assets per unitSection 3855 adjustment on net assets per unitNet asset value per unit
9.26 12.900.02 0.019.28 12.91
9.26 12.720.02 0.019.28 12.73
9.79 13.280.01 0.019.80 13.29
Schedule of Net Assets Reconciliation (Note 2)(in $)
as at as at
March 31, 2009 Dec. 31, 2007
Net capital loss carried forward
Non-capital losses expiring:2009201020142015202620272028Total
21,907
--------
Schedule of Tax Loss Carry Forwards (Note 4)(in $000’s)
as at
March 31, 2009
– 8 –
Lakeview Disciplined Leadership Canadian Equity FundFund Specific Financial Instruments Risks (Note 11)
Annual Financial Statements as at March 31, 2009
The accompanying notes are an integral part of these financial statements.
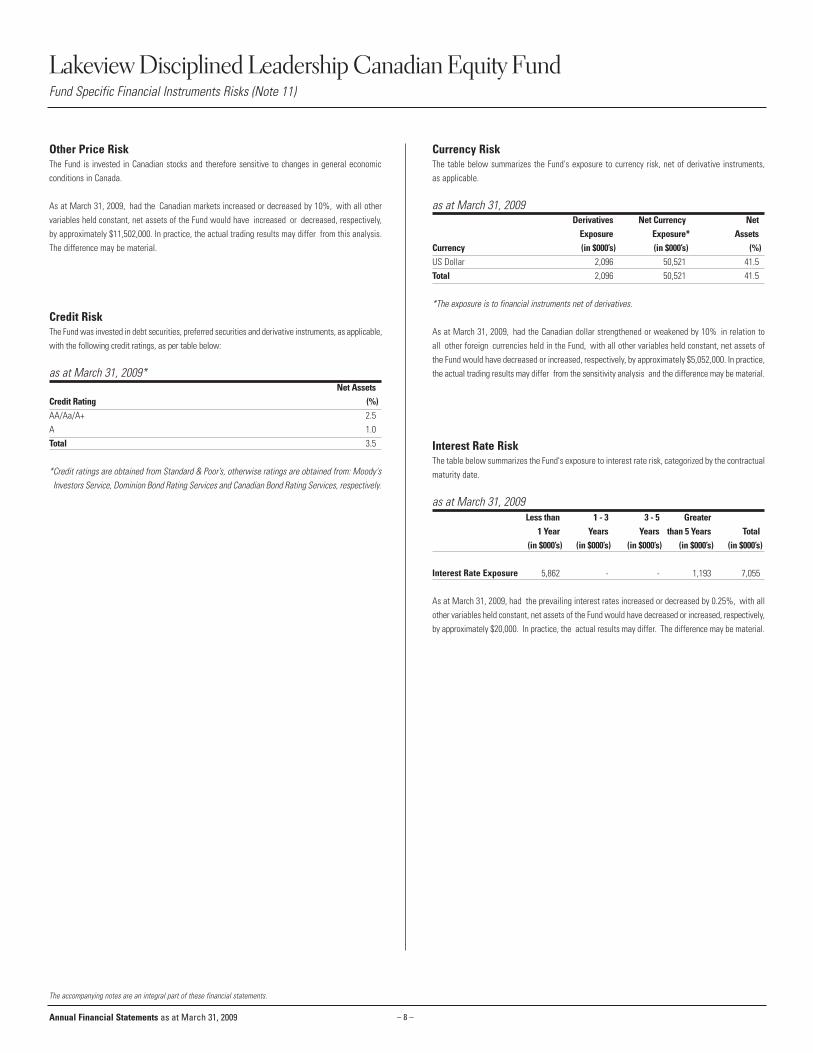
Other Price RiskThe Fund is invested in Canadian stocks and therefore sensitive to changes in general economicconditions in Canada.
As at March 31, 2009, had the Canadian markets increased or decreased by 10%, with all othervariables held constant, net assets of the Fund would have increased or decreased, respectively,by approximately $11,502,000. In practice, the actual trading results may differ from this analysis.The difference may be material.
Credit RiskThe Fund was invested in debt securities, preferred securities and derivative instruments, as applicable,with the following credit ratings, as per table below:
as at March 31, 2009*Net Assets
Credit Rating (%)AA/Aa/A+ 2.5 A 1.0Total 3.5
*Credit ratings are obtained from Standard & Poor’s, otherwise ratings are obtained from: Moody'sInvestors Service, Dominion Bond Rating Services and Canadian Bond Rating Services, respectively.
Currency RiskThe table below summarizes the Fund's exposure to currency risk, net of derivative instruments, as applicable.
as at March 31, 2009Derivatives Net Currency Net
Exposure Exposure* AssetsCurrency (in $000’s) (in $000’s) (%)US Dollar 2,096 50,521 41.5 Total 2,096 50,521 41.5
*The exposure is to financial instruments net of derivatives.
As at March 31, 2009, had the Canadian dollar strengthened or weakened by 10% in relation toall other foreign currencies held in the Fund, with all other variables held constant, net assets ofthe Fund would have decreased or increased, respectively, by approximately $5,052,000. In practice,the actual trading results may differ from the sensitivity analysis and the difference may be material.
Interest Rate RiskThe table below summarizes the Fund's exposure to interest rate risk, categorized by the contractualmaturity date.
as at March 31, 2009
Interest Rate Exposure
As at March 31, 2009, had the prevailing interest rates increased or decreased by 0.25%, with allother variables held constant, net assets of the Fund would have decreased or increased, respectively,by approximately $20,000. In practice, the actual results may differ. The difference may be material.
Less than 1 - 3 3 - 5 Greater 1 Year Years Years than 5 Years Total
(in $000’s) (in $000’s) (in $000’s) (in $000’s) (in $000’s)
5,862 - - 1,193 7,055
– 9 –
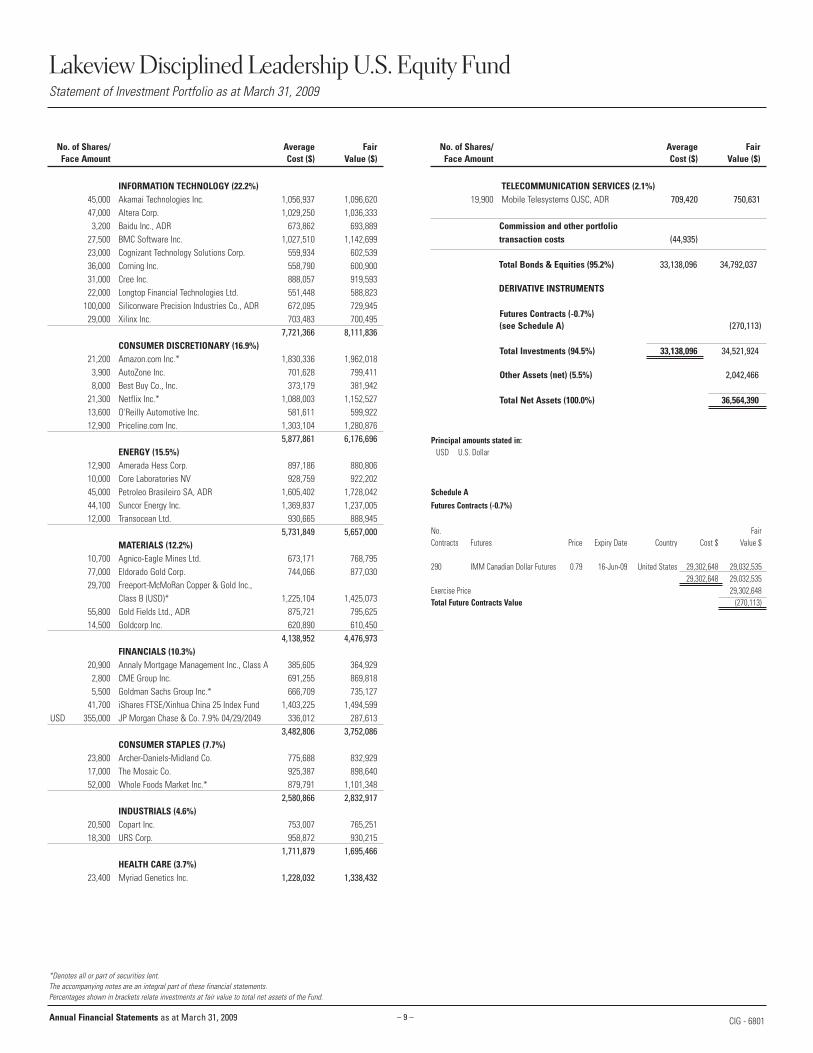
Lakeview Disciplined Leadership U.S. Equity FundStatement of Investment Portfolio as at March 31, 2009
No. of Shares/ Average FairFace Amount Cost ($) Value ($)
No. of Shares/ Average FairFace Amount Cost ($) Value ($)
INFORMATION TECHNOLOGY (22.2%) 45,000 Akamai Technologies Inc. 1,056,937 1,096,620 47,000 Altera Corp. 1,029,250 1,036,333 3,200 Baidu Inc., ADR 673,862 693,889
27,500 BMC Software Inc. 1,027,510 1,142,699 23,000 Cognizant Technology Solutions Corp. 559,934 602,539 36,000 Corning Inc. 558,790 600,900 31,000 Cree Inc. 888,057 919,593 22,000 Longtop Financial Technologies Ltd. 551,448 588,823
100,000 Siliconware Precision Industries Co., ADR 672,095 729,945 29,000 Xilinx Inc. 703,483 700,495
7,721,366 8,111,836CONSUMER DISCRETIONARY (16.9%)
21,200 Amazon.com Inc.* 1,830,336 1,962,018 3,900 AutoZone Inc. 701,628 799,411 8,000 Best Buy Co., Inc. 373,179 381,942
21,300 Netflix Inc.* 1,088,003 1,152,527 13,600 O'Reilly Automotive Inc. 581,611 599,922 12,900 Priceline.com Inc. 1,303,104 1,280,876
5,877,861 6,176,696ENERGY (15.5%)
12,900 Amerada Hess Corp. 897,186 880,806 10,000 Core Laboratories NV 928,759 922,202 45,000 Petroleo Brasileiro SA, ADR 1,605,402 1,728,042 44,100 Suncor Energy Inc. 1,369,837 1,237,005 12,000 Transocean Ltd. 930,665 888,945
5,731,849 5,657,000MATERIALS (12.2%)
10,700 Agnico-Eagle Mines Ltd. 673,171 768,795 77,000 Eldorado Gold Corp. 744,066 877,030 29,700 Freeport-McMoRan Copper & Gold Inc.,
Class B (USD)* 1,225,104 1,425,073 55,800 Gold Fields Ltd., ADR 875,721 795,625 14,500 Goldcorp Inc. 620,890 610,450
4,138,952 4,476,973FINANCIALS (10.3%)
20,900 Annaly Mortgage Management Inc., Class A 385,605 364,929 2,800 CME Group Inc. 691,255 869,818 5,500 Goldman Sachs Group Inc.* 666,709 735,127
41,700 iShares FTSE/Xinhua China 25 Index Fund 1,403,225 1,494,599 USD 355,000 JP Morgan Chase & Co. 7.9% 04/29/2049 336,012 287,613
3,482,806 3,752,086CONSUMER STAPLES (7.7%)
23,800 Archer-Daniels-Midland Co. 775,688 832,929 17,000 The Mosaic Co. 925,387 898,640 52,000 Whole Foods Market Inc.* 879,791 1,101,348
2,580,866 2,832,917INDUSTRIALS (4.6%)
20,500 Copart Inc. 753,007 765,251 18,300 URS Corp. 958,872 930,215
1,711,879 1,695,466HEALTH CARE (3.7%)
23,400 Myriad Genetics Inc. 1,228,032 1,338,432
TELECOMMUNICATION SERVICES (2.1%) 19,900 Mobile Telesystems OJSC, ADR 709,420 750,631
Commission and other portfolio transaction costs (44,935)
Total Bonds & Equities (95.2%) 33,138,096 34,792,037
DERIVATIVE INSTRUMENTS
Futures Contracts (-0.7%) (see Schedule A) (270,113)
Total Investments (94.5%) 33,138,096 34,521,924
Other Assets (net) (5.5%) 2,042,466
Total Net Assets (100.0%) 36,564,390
Principal amounts stated in:USD U.S. Dollar
Schedule AFutures Contracts (-0.7%)
No. FairContracts Futures Price Expiry Date Country Cost $ Value $
290 IMM Canadian Dollar Futures 0.79 16-Jun-09 United States 29,302,648 29,032,535 29,302,648 29,032,535
Exercise Price 29,302,648 Total Future Contracts Value (270,113)
*Denotes all or part of securities lent.The accompanying notes are an integral part of these financial statements. Percentages shown in brackets relate investments at fair value to total net assets of the Fund.
Annual Financial Statements as at March 31, 2009 CIG - 6801
– 10 –
Lakeview Disciplined Leadership U.S. Equity FundFinancial Statements
Annual Financial Statements as at March 31, 2009
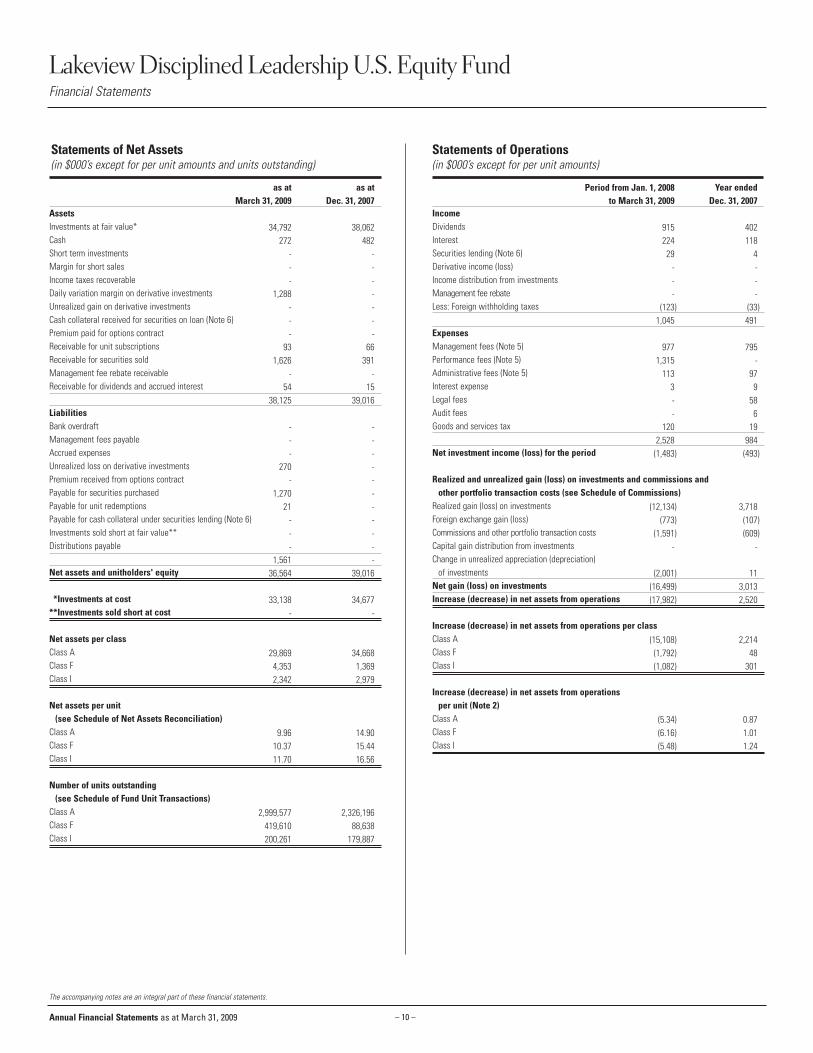
AssetsInvestments at fair value*CashShort term investmentsMargin for short salesIncome taxes recoverableDaily variation margin on derivative investmentsUnrealized gain on derivative investmentsCash collateral received for securities on loan (Note 6)Premium paid for options contractReceivable for unit subscriptionsReceivable for securities soldManagement fee rebate receivableReceivable for dividends and accrued interest
LiabilitiesBank overdraftManagement fees payableAccrued expensesUnrealized loss on derivative investmentsPremium received from options contractPayable for securities purchasedPayable for unit redemptionsPayable for cash collateral under securities lending (Note 6)Investments sold short at fair value**Distributions payable
Net assets and unitholders' equity
**Investments at cost**Investments sold short at cost
Net assets per classClass AClass FClass I
Net assets per unit (see Schedule of Net Assets Reconciliation)
Class AClass FClass I
Number of units outstanding(see Schedule of Fund Unit Transactions)
Class AClass FClass I
IncomeDividendsInterest Securities lending (Note 6)Derivative income (loss)Income distribution from investmentsManagement fee rebateLess: Foreign withholding taxes
ExpensesManagement fees (Note 5)Performance fees (Note 5)Administrative fees (Note 5)Interest expenseLegal feesAudit feesGoods and services tax
Net investment income (loss) for the period
Realized and unrealized gain (loss) on investments and commissions and other portfolio transaction costs (see Schedule of Commissions)
Realized gain (loss) on investmentsForeign exchange gain (loss)Commissions and other portfolio transaction costsCapital gain distribution from investmentsChange in unrealized appreciation (depreciation)
of investmentsNet gain (loss) on investmentsIncrease (decrease) in net assets from operations
Increase (decrease) in net assets from operations per classClass AClass FClass I
Increase (decrease) in net assets from operationsper unit (Note 2)
Class AClass FClass I
as at as atMarch 31, 2009 Dec. 31, 2007
34,792 38,062272 482
- -- -- -
1,288 -- -- -- -
93 661,626 391
- -54 15
38,125 39,016
- -- -- -
270 -- -
1,270 -21 -
- -- -- -
1,561 -36,564 39,016
33,138 34,677- -
29,869 34,6684,353 1,3692,342 2,979
9.96 14.9010.37 15.4411.70 16.56
2,999,577 2,326,196419,610 88,638200,261 179,887
Period from Jan. 1, 2008 Year endedto March 31, 2009 Dec. 31, 2007
915 402224 118
29 4- -- -- -
(123) (33)1,045 491
977 7951,315 -
113 973 9- 58- 6
120 192,528 984
(1,483) (493)
(12,134) 3,718(773) (107)
(1,591) (609)- -
(2,001) 11(16,499) 3,013(17,982) 2,520
(15,108) 2,214(1,792) 48(1,082) 301
(5.34) 0.87(6.16) 1.01(5.48) 1.24
Statements of Operations(in $000’s except for per unit amounts)
Statements of Net Assets(in $000’s except for per unit amounts and units outstanding)
The accompanying notes are an integral part of these financial statements.

– 11 –
Class ANet assets, beginning of periodSection 3855 transitional adjustment Adjusted net assets, beginning of period Capital transactions
Proceeds from units issued Reinvested distributions (Note 7)Amounts paid for units redeemed
Distributions to investorsFrom realized gainsFrom net incomeFrom return of capital
Increase (decrease) in net assets from operationsNet assets, end of period
Class FNet assets, beginning of periodSection 3855 transitional adjustment Adjusted net assets, beginning of period Capital transactions
Proceeds from units issued Reinvested distributions (Note 7)Amounts paid for units redeemed
Distributions to investorsFrom realized gainsFrom net incomeFrom return of capital
Increase (decrease) in net assets from operationsNet assets, end of period
Class INet assets, beginning of periodSection 3855 transitional adjustment Adjusted net assets, beginning of period Capital transactions
Proceeds from units issued Reinvested distributions (Note 7)Amounts paid for units redeemed
Distributions to investorsFrom realized gainsFrom net incomeFrom return of capital
Increase (decrease) in net assets from operationsNet assets, end of period
Total FundNet assets, beginning of periodSection 3855 transitional adjustment Adjusted net assets, beginning of period Capital transactions
Proceeds from units issued Reinvested distributions (Note 7)Amounts paid for units redeemed
Distributions to investorsFrom realized gainsFrom net incomeFrom return of capital
Increase (decrease) in net assets from operationsNet assets, end of period
2,979 5,524- (62)
2,979 5,462
1,073 39- -
(628) (2,823)445 (2,784)
- -- -- -- -
(1,082) 3012,342 2,979
39,016 53,471- (616)
39,016 52,855
34,448 9,543- 43
(18,918) (25,945)15,530 (16,359)
- -- (43)- -- (43)
(17,982) 2,56336,564 39,016
34,668 46,792- (541)
34,668 46,251
25,370 8,235- 43
(15,061) (22,032)10,309 (13,754)
- -- (43)- -- (43)
(15,108) 2,21429,869 34,668
1,369 1,155- (13)
1,369 1,142
8,005 1,269- -
(3,229) (1,090)4,776 179
- -- -- -- -
(1,792) 484,353 1,369
Lakeview Disciplined Leadership U.S. Equity FundFinancial Statements
Annual Financial Statements as at March 31, 2009
Statements of Changes in Net Assets (in $000’s)
Period from Jan. 1, 2008 Year ended
to March 31, 2009 Dec. 31, 2007
The accompanying notes are an integral part of these financial statements.
Statements of Changes in Net Assets (cont’d)(in $000’s)
Period from Jan. 1, 2008 Year ended
to March 31, 2009 Dec. 31, 2007
– 12 –
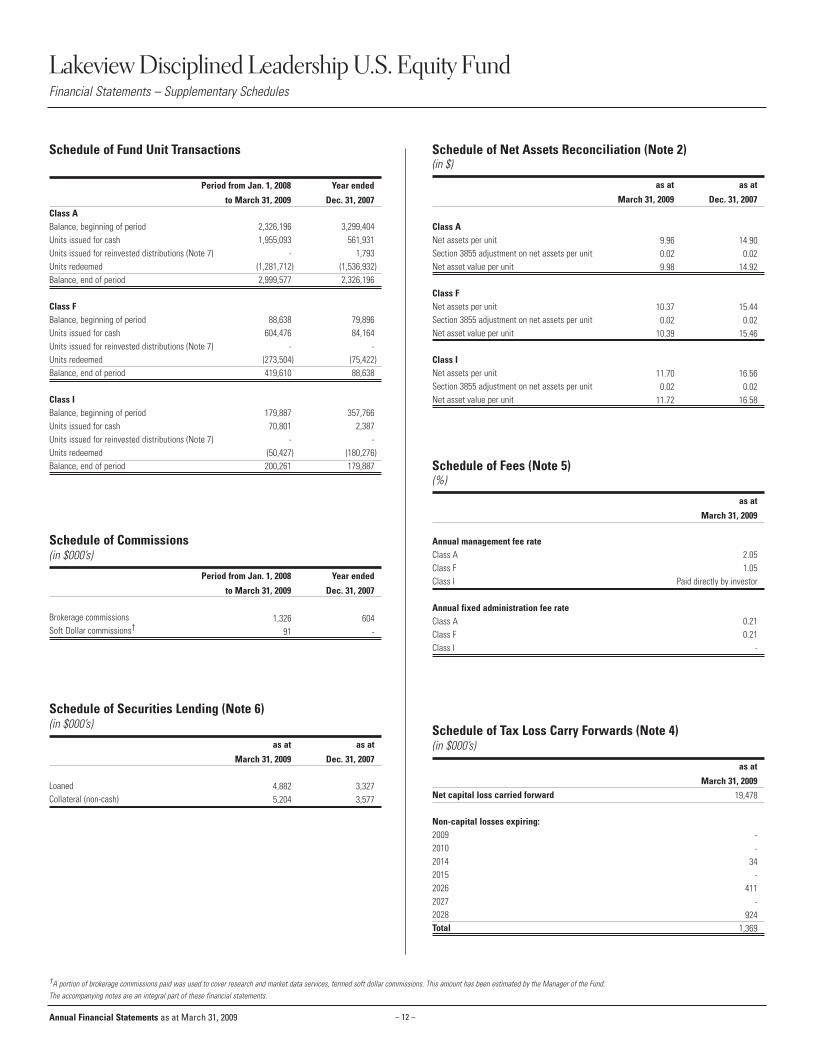
Class ABalance, beginning of periodUnits issued for cash Units issued for reinvested distributions (Note 7)Units redeemedBalance, end of period
Class FBalance, beginning of periodUnits issued for cash Units issued for reinvested distributions (Note 7)Units redeemedBalance, end of period
Class IBalance, beginning of periodUnits issued for cash Units issued for reinvested distributions (Note 7)Units redeemedBalance, end of period
Schedule of Securities Lending (Note 6)(in $000’s)
as at as at
March 31, 2009 Dec. 31, 2007
LoanedCollateral (non-cash)
4,882 3,3275,204 3,577
Lakeview Disciplined Leadership U.S. Equity FundFinancial Statements – Supplementary Schedules
Schedule of Commissions(in $000’s)
Period from Jan. 1, 2008 Year ended
to March 31, 2009 Dec. 31, 2007
Brokerage commissionsSoft Dollar commissions†
1,326 60491 -
Schedule of Fund Unit Transactions
Period from Jan. 1, 2008 Year ended
to March 31, 2009 Dec. 31, 2007
2,326,196 3,299,4041,955,093 561,931
- 1,793(1,281,712) (1,536,932)2,999,577 2,326,196
88,638 79,896604,476 84,164
- -(273,504) (75,422)419,610 88,638
179,887 357,76670,801 2,387
- -(50,427) (180,276)
200,261 179,887
Annual Financial Statements as at March 31, 2009
†A portion of brokerage commissions paid was used to cover research and market data services, termed soft dollar commissions. This amount has been estimated by the Manager of the Fund.The accompanying notes are an integral part of these financial statements.
Annual management fee rateClass AClass FClass I
Annual fixed administration fee rateClass AClass FClass I
2.051.05
Paid directly by investor
0.210.21
-
Schedule of Fees (Note 5) (%)
as at
March 31, 2009
Class ANet assets per unitSection 3855 adjustment on net assets per unitNet asset value per unit
Class FNet assets per unitSection 3855 adjustment on net assets per unitNet asset value per unit
Class INet assets per unitSection 3855 adjustment on net assets per unitNet asset value per unit
9.96 14.900.02 0.029.98 14.92
10.37 15.440.02 0.02
10.39 15.46
11.70 16.560.02 0.02
11.72 16.58
Schedule of Net Assets Reconciliation (Note 2)(in $)
as at as at
March 31, 2009 Dec. 31, 2007
Net capital loss carried forward
Non-capital losses expiring:2009201020142015202620272028Total
19,478
--
34-
411-
9241,369
Schedule of Tax Loss Carry Forwards (Note 4)(in $000’s)
as at
March 31, 2009
– 13 –
Lakeview Disciplined Leadership U.S. Equity FundFund Specific Financial Instruments Risks (Note 11)
Annual Financial Statements as at March 31, 2009
The accompanying notes are an integral part of these financial statements.
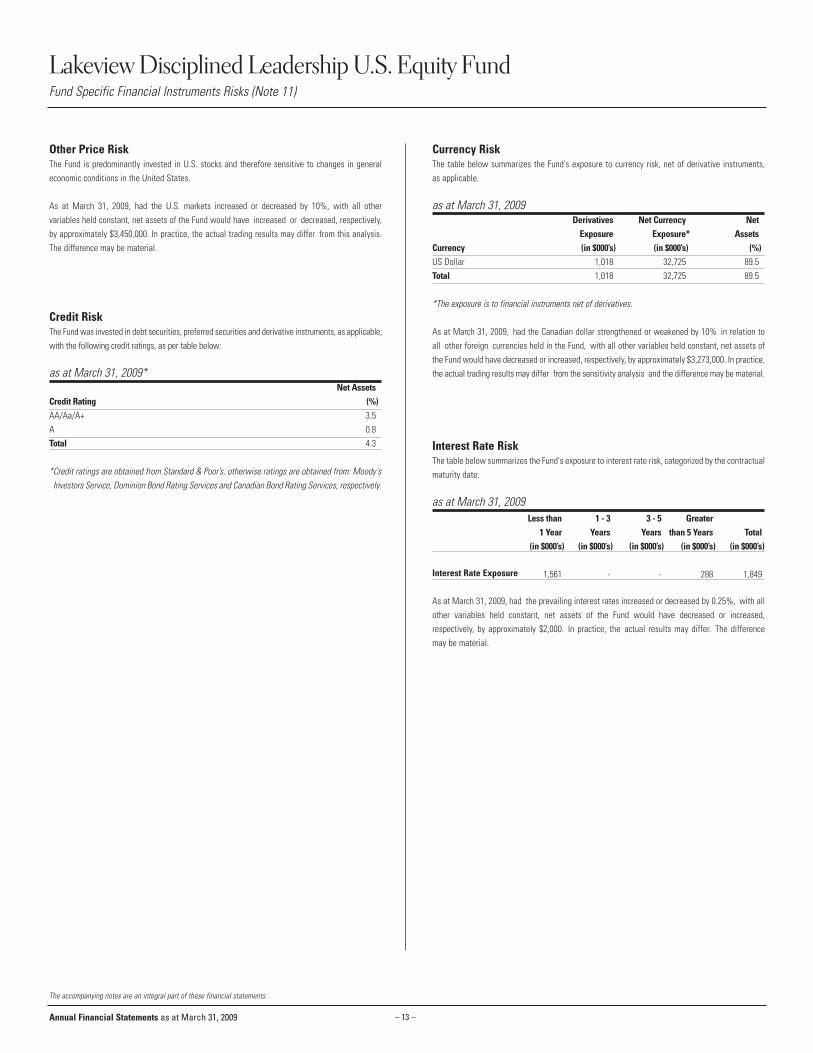
Other Price RiskThe Fund is predominantly invested in U.S. stocks and therefore sensitive to changes in generaleconomic conditions in the United States.
As at March 31, 2009, had the U.S. markets increased or decreased by 10%, with all othervariables held constant, net assets of the Fund would have increased or decreased, respectively,by approximately $3,450,000. In practice, the actual trading results may differ from this analysis.The difference may be material.
Credit RiskThe Fund was invested in debt securities, preferred securities and derivative instruments, as applicable,with the following credit ratings, as per table below:
as at March 31, 2009*Net Assets
Credit Rating (%)AA/Aa/A+ 3.5 A 0.8Total 4.3
*Credit ratings are obtained from Standard & Poor’s, otherwise ratings are obtained from: Moody'sInvestors Service, Dominion Bond Rating Services and Canadian Bond Rating Services, respectively.
Currency RiskThe table below summarizes the Fund's exposure to currency risk, net of derivative instruments, as applicable.
as at March 31, 2009Derivatives Net Currency Net
Exposure Exposure* AssetsCurrency (in $000’s) (in $000’s) (%)US Dollar 1,018 32,725 89.5 Total 1,018 32,725 89.5
*The exposure is to financial instruments net of derivatives.
As at March 31, 2009, had the Canadian dollar strengthened or weakened by 10% in relation toall other foreign currencies held in the Fund, with all other variables held constant, net assets ofthe Fund would have decreased or increased, respectively, by approximately $3,273,000. In practice,the actual trading results may differ from the sensitivity analysis and the difference may be material.
Interest Rate RiskThe table below summarizes the Fund's exposure to interest rate risk, categorized by the contractualmaturity date.
as at March 31, 2009
Interest Rate Exposure
As at March 31, 2009, had the prevailing interest rates increased or decreased by 0.25%, with allother variables held constant, net assets of the Fund would have decreased or increased,respectively, by approximately $2,000. In practice, the actual results may differ. The differencemay be material.
Less than 1 - 3 3 - 5 Greater 1 Year Years Years than 5 Years Total
(in $000’s) (in $000’s) (in $000’s) (in $000’s) (in $000’s)
1,561 - - 288 1,849
– 14 –
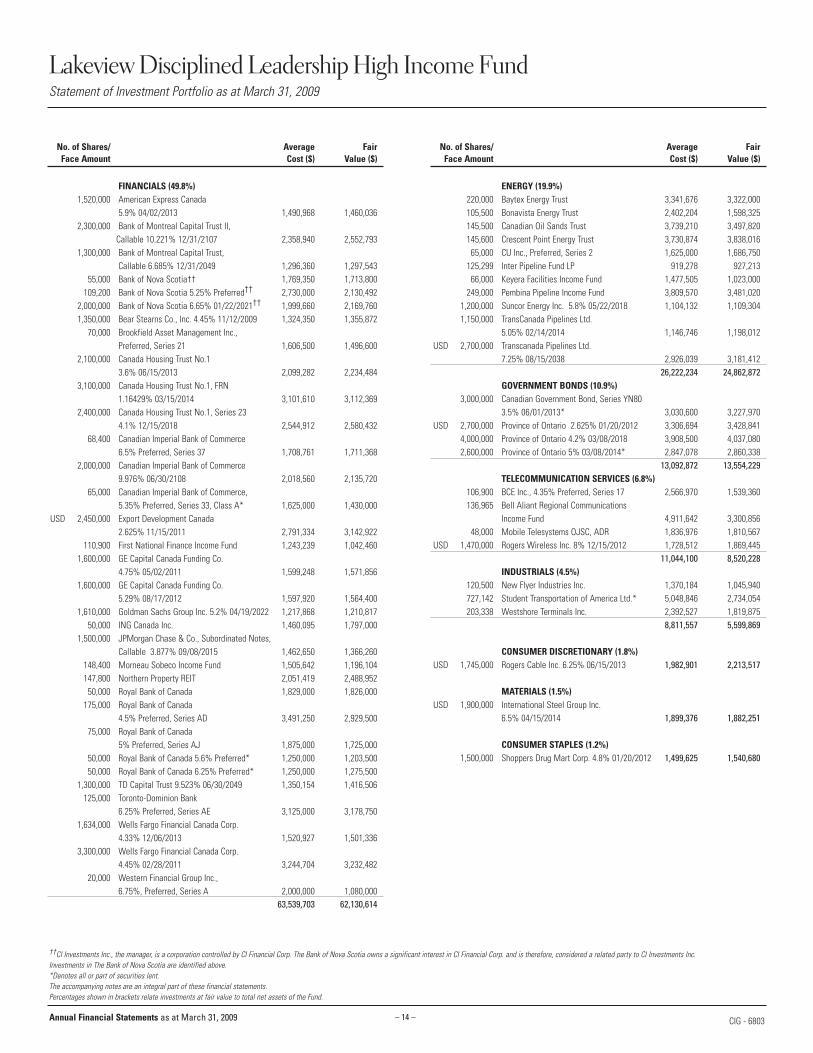
Lakeview Disciplined Leadership High Income FundStatement of Investment Portfolio as at March 31, 2009
No. of Shares/ Average FairFace Amount Cost ($) Value ($)
No. of Shares/ Average FairFace Amount Cost ($) Value ($)
FINANCIALS (49.8%) 1,520,000 American Express Canada
5.9% 04/02/2013 1,490,968 1,460,036 2,300,000 Bank of Montreal Capital Trust II,
Callable 10.221% 12/31/2107 2,358,940 2,552,793 1,300,000 Bank of Montreal Capital Trust,
Callable 6.685% 12/31/2049 1,296,360 1,297,543 55,000 Bank of Nova Scotia†† 1,769,350 1,713,800
109,200 Bank of Nova Scotia 5.25% Preferred†† 2,730,000 2,130,492 2,000,000 Bank of Nova Scotia 6.65% 01/22/2021†† 1,999,660 2,169,760 1,350,000 Bear Stearns Co., Inc. 4.45% 11/12/2009 1,324,350 1,355,872
70,000 Brookfield Asset Management Inc., Preferred, Series 21 1,606,500 1,496,600
2,100,000 Canada Housing Trust No.1 3.6% 06/15/2013 2,099,282 2,234,484
3,100,000 Canada Housing Trust No.1, FRN 1.16429% 03/15/2014 3,101,610 3,112,369
2,400,000 Canada Housing Trust No.1, Series 23 4.1% 12/15/2018 2,544,912 2,580,432
68,400 Canadian Imperial Bank of Commerce 6.5% Preferred, Series 37 1,708,761 1,711,368
2,000,000 Canadian Imperial Bank of Commerce 9.976% 06/30/2108 2,018,560 2,135,720
65,000 Canadian Imperial Bank of Commerce, 5.35% Preferred, Series 33, Class A* 1,625,000 1,430,000
USD 2,450,000 Export Development Canada 2.625% 11/15/2011 2,791,334 3,142,922
110,900 First National Finance Income Fund 1,243,239 1,042,460 1,600,000 GE Capital Canada Funding Co.
4.75% 05/02/2011 1,599,248 1,571,856 1,600,000 GE Capital Canada Funding Co.
5.29% 08/17/2012 1,597,920 1,564,400 1,610,000 Goldman Sachs Group Inc. 5.2% 04/19/2022 1,217,868 1,210,817
50,000 ING Canada Inc. 1,460,095 1,797,000 1,500,000 JPMorgan Chase & Co., Subordinated Notes,
Callable 3.877% 09/08/2015 1,462,650 1,366,260 148,400 Morneau Sobeco Income Fund 1,505,642 1,196,104 147,800 Northern Property REIT 2,051,419 2,488,952
50,000 Royal Bank of Canada 1,829,000 1,826,000 175,000 Royal Bank of Canada
4.5% Preferred, Series AD 3,491,250 2,929,500 75,000 Royal Bank of Canada
5% Preferred, Series AJ 1,875,000 1,725,000 50,000 Royal Bank of Canada 5.6% Preferred* 1,250,000 1,203,500 50,000 Royal Bank of Canada 6.25% Preferred* 1,250,000 1,275,500
1,300,000 TD Capital Trust 9.523% 06/30/2049 1,350,154 1,416,506 125,000 Toronto-Dominion Bank
6.25% Preferred, Series AE 3,125,000 3,178,750 1,634,000 Wells Fargo Financial Canada Corp.
4.33% 12/06/2013 1,520,927 1,501,336 3,300,000 Wells Fargo Financial Canada Corp.
4.45% 02/28/2011 3,244,704 3,232,482 20,000 Western Financial Group Inc.,
6.75%, Preferred, Series A 2,000,000 1,080,000 63,539,703 62,130,614
ENERGY (19.9%) 220,000 Baytex Energy Trust 3,341,676 3,322,000 105,500 Bonavista Energy Trust 2,402,204 1,598,325 145,500 Canadian Oil Sands Trust 3,739,210 3,497,820 145,600 Crescent Point Energy Trust 3,730,874 3,838,016
65,000 CU Inc., Preferred, Series 2 1,625,000 1,686,750 125,299 Inter Pipeline Fund LP 919,278 927,213
66,000 Keyera Facilities Income Fund 1,477,505 1,023,000 249,000 Pembina Pipeline Income Fund 3,809,570 3,481,020
1,200,000 Suncor Energy Inc. 5.8% 05/22/2018 1,104,132 1,109,304 1,150,000 TransCanada Pipelines Ltd.
5.05% 02/14/2014 1,146,746 1,198,012 USD 2,700,000 Transcanada Pipelines Ltd.
7.25% 08/15/2038 2,926,039 3,181,412 26,222,234 24,862,872
GOVERNMENT BONDS (10.9%) 3,000,000 Canadian Government Bond, Series YN80
3.5% 06/01/2013* 3,030,600 3,227,970 USD 2,700,000 Province of Ontario 2.625% 01/20/2012 3,306,694 3,428,841
4,000,000 Province of Ontario 4.2% 03/08/2018 3,908,500 4,037,080 2,600,000 Province of Ontario 5% 03/08/2014* 2,847,078 2,860,338
13,092,872 13,554,229TELECOMMUNICATION SERVICES (6.8%)
106,900 BCE Inc., 4.35% Preferred, Series 17 2,566,970 1,539,360 136,965 Bell Aliant Regional Communications
Income Fund 4,911,642 3,300,856 48,000 Mobile Telesystems OJSC, ADR 1,836,976 1,810,567
USD 1,470,000 Rogers Wireless Inc. 8% 12/15/2012 1,728,512 1,869,445 11,044,100 8,520,228
INDUSTRIALS (4.5%) 120,500 New Flyer Industries Inc. 1,370,184 1,045,940 727,142 Student Transportation of America Ltd.* 5,048,846 2,734,054 203,338 Westshore Terminals Inc. 2,392,527 1,819,875
8,811,557 5,599,869
CONSUMER DISCRETIONARY (1.8%) USD 1,745,000 Rogers Cable Inc. 6.25% 06/15/2013 1,982,901 2,213,517
MATERIALS (1.5%) USD 1,900,000 International Steel Group Inc.
6.5% 04/15/2014 1,899,376 1,882,251
CONSUMER STAPLES (1.2%) 1,500,000 Shoppers Drug Mart Corp. 4.8% 01/20/2012 1,499,625 1,540,680
††CI Investments Inc., the manager, is a corporation controlled by CI Financial Corp. The Bank of Nova Scotia owns a significant interest in CI Financial Corp. and is therefore, considered a related party to CI Investments Inc. Investments in The Bank of Nova Scotia are identified above.*Denotes all or part of securities lent.The accompanying notes are an integral part of these financial statements. Percentages shown in brackets relate investments at fair value to total net assets of the Fund.
Annual Financial Statements as at March 31, 2009 CIG - 6803
– 15 –
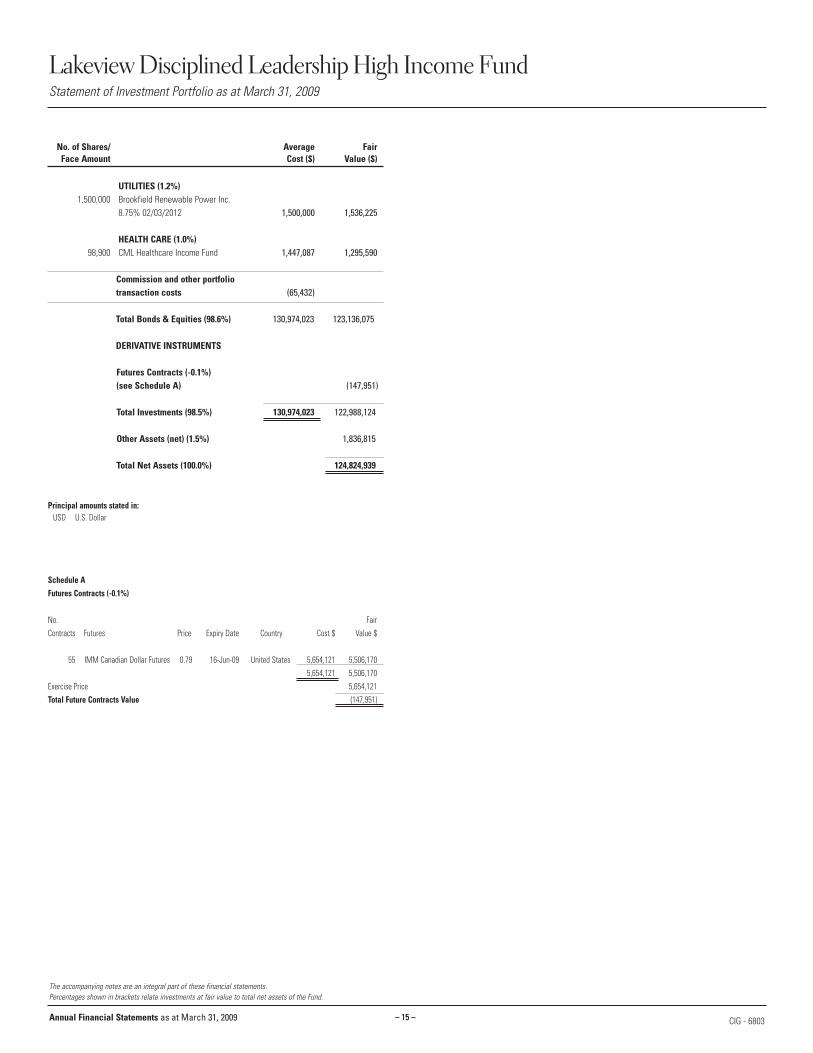
Lakeview Disciplined Leadership High Income FundStatement of Investment Portfolio as at March 31, 2009
No. of Shares/ Average FairFace Amount Cost ($) Value ($)
UTILITIES (1.2%) 1,500,000 Brookfield Renewable Power Inc.
8.75% 02/03/2012 1,500,000 1,536,225
HEALTH CARE (1.0%) 98,900 CML Healthcare Income Fund 1,447,087 1,295,590
Commission and other portfolio transaction costs (65,432)
Total Bonds & Equities (98.6%) 130,974,023 123,136,075
DERIVATIVE INSTRUMENTS
Futures Contracts (-0.1%) (see Schedule A) (147,951)
Total Investments (98.5%) 130,974,023 122,988,124
Other Assets (net) (1.5%) 1,836,815
Total Net Assets (100.0%) 124,824,939
Principal amounts stated in:USD U.S. Dollar
Schedule AFutures Contracts (-0.1%)
No. Fair
Contracts Futures Price Expiry Date Country Cost $ Value $
55 IMM Canadian Dollar Futures 0.79 16-Jun-09 United States 5,654,121 5,506,170
5,654,121 5,506,170
Exercise Price 5,654,121
Total Future Contracts Value (147,951)
The accompanying notes are an integral part of these financial statements. Percentages shown in brackets relate investments at fair value to total net assets of the Fund.
Annual Financial Statements as at March 31, 2009 CIG - 6803– 15 –
– 16 –
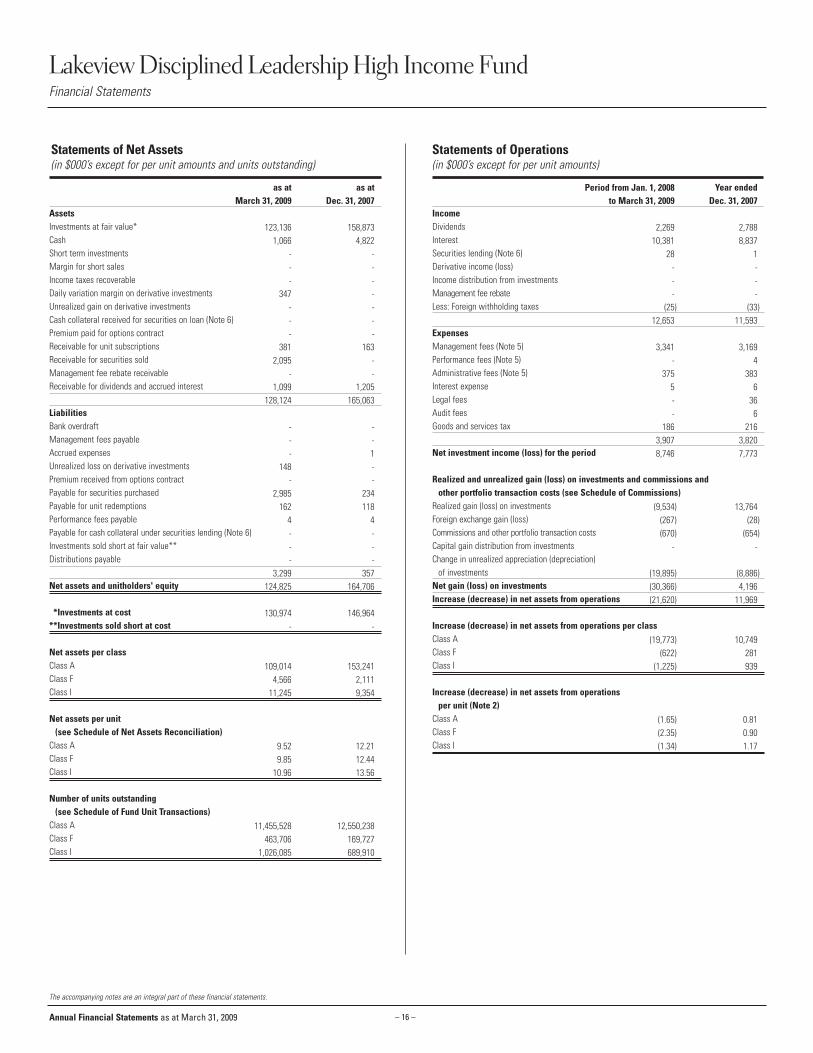
Lakeview Disciplined Leadership High Income FundFinancial Statements
Annual Financial Statements as at March 31, 2009
AssetsInvestments at fair value*CashShort term investmentsMargin for short salesIncome taxes recoverableDaily variation margin on derivative investmentsUnrealized gain on derivative investmentsCash collateral received for securities on loan (Note 6)Premium paid for options contractReceivable for unit subscriptionsReceivable for securities soldManagement fee rebate receivableReceivable for dividends and accrued interest
LiabilitiesBank overdraftManagement fees payableAccrued expensesUnrealized loss on derivative investmentsPremium received from options contractPayable for securities purchasedPayable for unit redemptionsPerformance fees payablePayable for cash collateral under securities lending (Note 6)Investments sold short at fair value**Distributions payable
Net assets and unitholders' equity
**Investments at cost**Investments sold short at cost
Net assets per classClass AClass FClass I
Net assets per unit (see Schedule of Net Assets Reconciliation)
Class AClass FClass I
Number of units outstanding(see Schedule of Fund Unit Transactions)
Class AClass FClass I
IncomeDividendsInterest Securities lending (Note 6)Derivative income (loss)Income distribution from investmentsManagement fee rebateLess: Foreign withholding taxes
ExpensesManagement fees (Note 5)Performance fees (Note 5)Administrative fees (Note 5)Interest expenseLegal feesAudit feesGoods and services tax
Net investment income (loss) for the period
Realized and unrealized gain (loss) on investments and commissions and other portfolio transaction costs (see Schedule of Commissions)
Realized gain (loss) on investmentsForeign exchange gain (loss)Commissions and other portfolio transaction costsCapital gain distribution from investmentsChange in unrealized appreciation (depreciation)
of investmentsNet gain (loss) on investmentsIncrease (decrease) in net assets from operations
Increase (decrease) in net assets from operations per classClass AClass FClass I
Increase (decrease) in net assets from operationsper unit (Note 2)
Class AClass FClass I
as at as atMarch 31, 2009 Dec. 31, 2007
123,136 158,8731,066 4,822
- -- -- -
347 -- -- -- -
381 1632,095 -
- -1,099 1,205
128,124 165,063
- -- -- 1
148 -- -
2,985 234162 118
4 4- -- -- -
3,299 357124,825 164,706
130,974 146,964- -
109,014 153,2414,566 2,111
11,245 9,354
9.52 12.219.85 12.44
10.96 13.56
11,455,528 12,550,238463,706 169,727
1,026,085 689,910
Period from Jan. 1, 2008 Year endedto March 31, 2009 Dec. 31, 2007
2,269 2,78810,381 8,837
28 1- -- -- -
(25) (33)12,653 11,593
3,341 3,169- 4
375 3835 6- 36- 6
186 2163,907 3,8208,746 7,773
(9,534) 13,764(267) (28)(670) (654)
- -
(19,895) (8,886)(30,366) 4,196(21,620) 11,969
(19,773) 10,749(622) 281
(1,225) 939
(1.65) 0.81(2.35) 0.90(1.34) 1.17
Statements of Operations(in $000’s except for per unit amounts)
Statements of Net Assets(in $000’s except for per unit amounts and units outstanding)
The accompanying notes are an integral part of these financial statements.
– 17 –
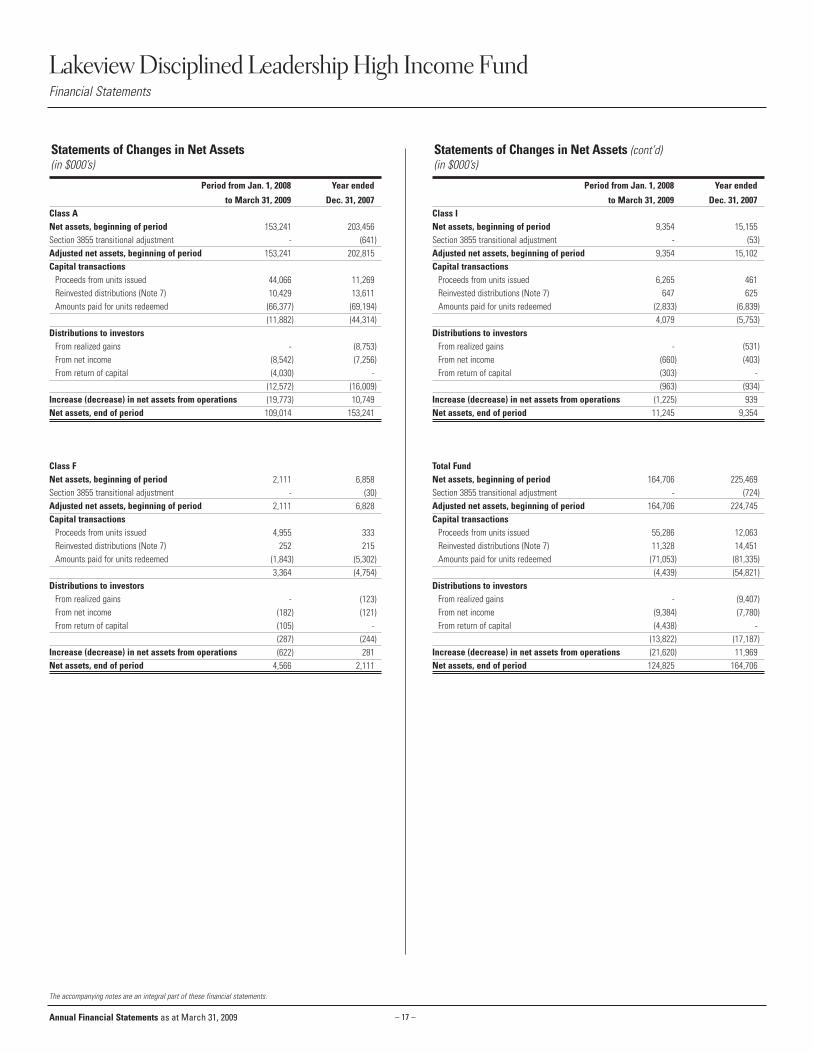
Class ANet assets, beginning of periodSection 3855 transitional adjustment Adjusted net assets, beginning of period Capital transactions
Proceeds from units issued Reinvested distributions (Note 7)Amounts paid for units redeemed
Distributions to investorsFrom realized gainsFrom net incomeFrom return of capital
Increase (decrease) in net assets from operationsNet assets, end of period
Class FNet assets, beginning of periodSection 3855 transitional adjustment Adjusted net assets, beginning of period Capital transactions
Proceeds from units issued Reinvested distributions (Note 7)Amounts paid for units redeemed
Distributions to investorsFrom realized gainsFrom net incomeFrom return of capital
Increase (decrease) in net assets from operationsNet assets, end of period
Class INet assets, beginning of periodSection 3855 transitional adjustment Adjusted net assets, beginning of period Capital transactions
Proceeds from units issued Reinvested distributions (Note 7)Amounts paid for units redeemed
Distributions to investorsFrom realized gainsFrom net incomeFrom return of capital
Increase (decrease) in net assets from operationsNet assets, end of period
Total FundNet assets, beginning of periodSection 3855 transitional adjustment Adjusted net assets, beginning of period Capital transactions
Proceeds from units issued Reinvested distributions (Note 7)Amounts paid for units redeemed
Distributions to investorsFrom realized gainsFrom net incomeFrom return of capital
Increase (decrease) in net assets from operationsNet assets, end of period
9,354 15,155- (53)
9,354 15,102
6,265 461647 625
(2,833) (6,839)4,079 (5,753)
- (531)(660) (403)(303) -(963) (934)
(1,225) 93911,245 9,354
164,706 225,469- (724)
164,706 224,745
55,286 12,06311,328 14,451(71,053) (81,335)
(4,439) (54,821)
- (9,407)(9,384) (7,780)(4,438) -
(13,822) (17,187)(21,620) 11,969
124,825 164,706
153,241 203,456- (641)
153,241 202,815
44,066 11,26910,429 13,611
(66,377) (69,194)(11,882) (44,314)
- (8,753)(8,542) (7,256)(4,030) -
(12,572) (16,009)(19,773) 10,749
109,014 153,241
2,111 6,858- (30)
2,111 6,828
4,955 333252 215
(1,843) (5,302)3,364 (4,754)
- (123)(182) (121)(105) -(287) (244)(622) 281
4,566 2,111
Lakeview Disciplined Leadership High Income FundFinancial Statements
Annual Financial Statements as at March 31, 2009
Statements of Changes in Net Assets (in $000’s)
Period from Jan. 1, 2008 Year ended
to March 31, 2009 Dec. 31, 2007
The accompanying notes are an integral part of these financial statements.
Statements of Changes in Net Assets (cont’d)(in $000’s)
Period from Jan. 1, 2008 Year ended
to March 31, 2009 Dec. 31, 2007
– 18 –
Class ABalance, beginning of periodUnits issued for cash Units issued for reinvested distributions (Note 7)Units redeemedBalance, end of period
Class FBalance, beginning of periodUnits issued for cash Units issued for reinvested distributions (Note 7)Units redeemedBalance, end of period
Class IBalance, beginning of periodUnits issued for cash Units issued for reinvested distributions (Note 7)Units redeemedBalance, end of period
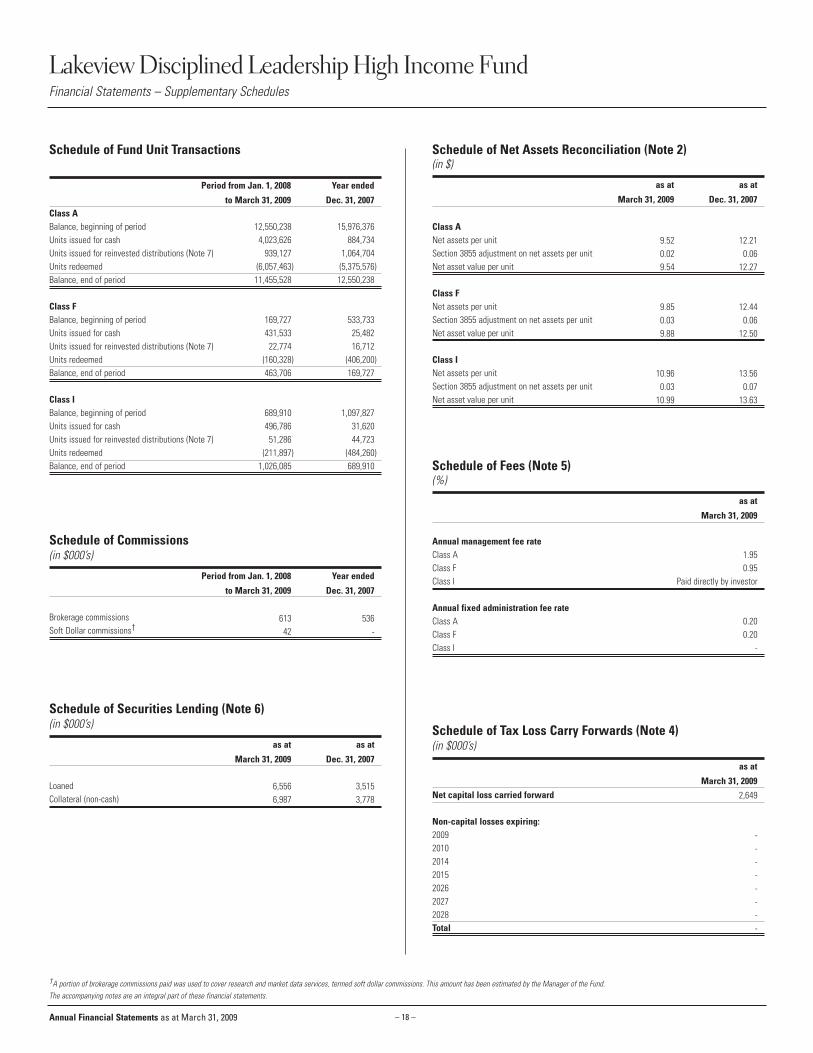
Schedule of Securities Lending (Note 6)(in $000’s)
as at as at
March 31, 2009 Dec. 31, 2007
LoanedCollateral (non-cash)
6,556 3,5156,987 3,778
Lakeview Disciplined Leadership High Income FundFinancial Statements – Supplementary Schedules
Schedule of Commissions(in $000’s)
Period from Jan. 1, 2008 Year ended
to March 31, 2009 Dec. 31, 2007
Brokerage commissionsSoft Dollar commissions†
613 53642 -
Schedule of Fund Unit Transactions
Period from Jan. 1, 2008 Year ended
to March 31, 2009 Dec. 31, 2007
12,550,238 15,976,3764,023,626 884,734
939,127 1,064,704(6,057,463) (5,375,576)
11,455,528 12,550,238
169,727 533,733431,533 25,482
22,774 16,712(160,328) (406,200)463,706 169,727
689,910 1,097,827496,786 31,620
51,286 44,723(211,897) (484,260)
1,026,085 689,910
Annual Financial Statements as at March 31, 2009
†A portion of brokerage commissions paid was used to cover research and market data services, termed soft dollar commissions. This amount has been estimated by the Manager of the Fund.The accompanying notes are an integral part of these financial statements.
Annual management fee rateClass AClass FClass I
Annual fixed administration fee rateClass AClass FClass I
1.950.95
Paid directly by investor
0.200.20
-
Schedule of Fees (Note 5)(%)
as at
March 31, 2009
Class ANet assets per unitSection 3855 adjustment on net assets per unitNet asset value per unit
Class FNet assets per unitSection 3855 adjustment on net assets per unitNet asset value per unit
Class INet assets per unitSection 3855 adjustment on net assets per unitNet asset value per unit
9.52 12.210.02 0.069.54 12.27
9.85 12.440.03 0.069.88 12.50
10.96 13.560.03 0.07
10.99 13.63
Schedule of Net Assets Reconciliation (Note 2)(in $)
as at as at
March 31, 2009 Dec. 31, 2007
Net capital loss carried forward
Non-capital losses expiring:2009201020142015202620272028Total
2,649
--------
Schedule of Tax Loss Carry Forwards (Note 4)(in $000’s)
as at
March 31, 2009
– 19 –
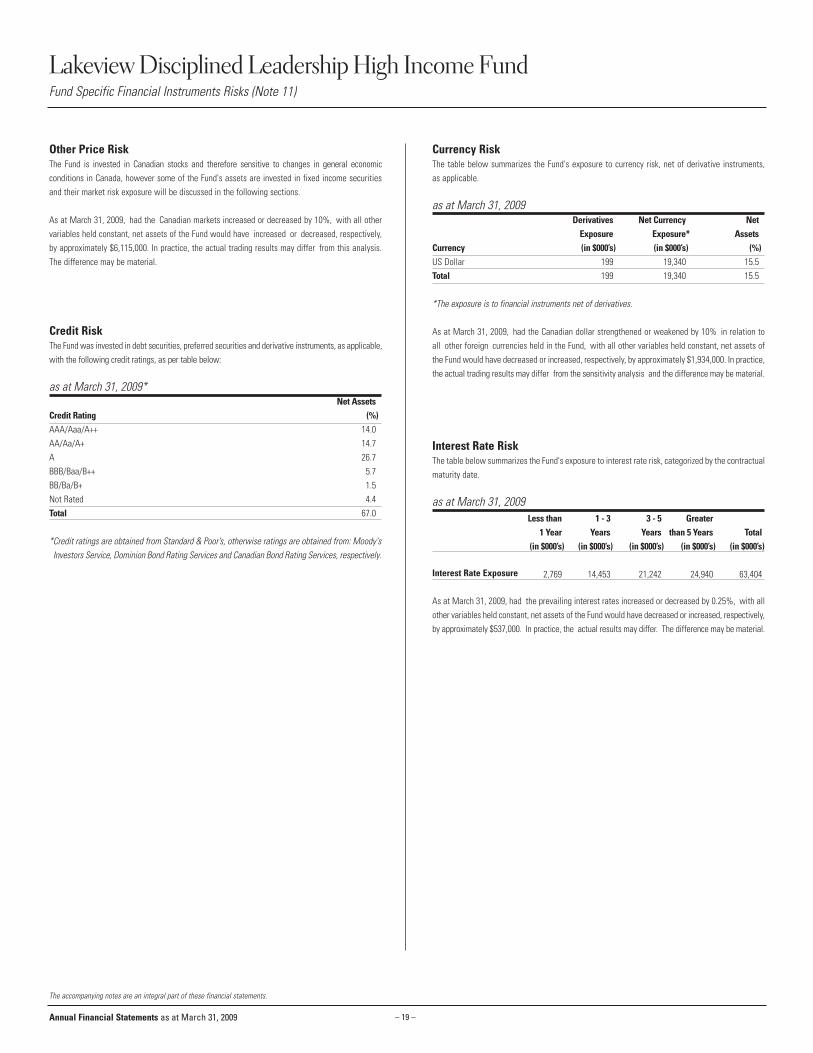
Lakeview Disciplined Leadership High Income FundFund Specific Financial Instruments Risks (Note 11)
Annual Financial Statements as at March 31, 2009
The accompanying notes are an integral part of these financial statements.
Other Price RiskThe Fund is invested in Canadian stocks and therefore sensitive to changes in general economicconditions in Canada, however some of the Fund's assets are invested in fixed income securitiesand their market risk exposure will be discussed in the following sections.
As at March 31, 2009, had the Canadian markets increased or decreased by 10%, with all othervariables held constant, net assets of the Fund would have increased or decreased, respectively,by approximately $6,115,000. In practice, the actual trading results may differ from this analysis.The difference may be material.
Credit RiskThe Fund was invested in debt securities, preferred securities and derivative instruments, as applicable,with the following credit ratings, as per table below:
as at March 31, 2009*Net Assets
Credit Rating (%)AAA/Aaa/A++ 14.0 AA/Aa/A+ 14.7 A 26.7 BBB/Baa/B++ 5.7 BB/Ba/B+ 1.5 Not Rated 4.4 Total 67.0
*Credit ratings are obtained from Standard & Poor’s, otherwise ratings are obtained from: Moody'sInvestors Service, Dominion Bond Rating Services and Canadian Bond Rating Services, respectively.
Currency RiskThe table below summarizes the Fund's exposure to currency risk, net of derivative instruments, as applicable.
as at March 31, 2009Derivatives Net Currency Net
Exposure Exposure* AssetsCurrency (in $000’s) (in $000’s) (%)US Dollar 199 19,340 15.5 Total 199 19,340 15.5
*The exposure is to financial instruments net of derivatives.
As at March 31, 2009, had the Canadian dollar strengthened or weakened by 10% in relation toall other foreign currencies held in the Fund, with all other variables held constant, net assets ofthe Fund would have decreased or increased, respectively, by approximately $1,934,000. In practice,the actual trading results may differ from the sensitivity analysis and the difference may be material.
Interest Rate RiskThe table below summarizes the Fund's exposure to interest rate risk, categorized by the contractualmaturity date.
as at March 31, 2009
Interest Rate Exposure
As at March 31, 2009, had the prevailing interest rates increased or decreased by 0.25%, with allother variables held constant, net assets of the Fund would have decreased or increased, respectively,by approximately $537,000. In practice, the actual results may differ. The difference may be material.
Less than 1 - 3 3 - 5 Greater 1 Year Years Years than 5 Years Total
(in $000’s) (in $000’s) (in $000’s) (in $000’s) (in $000’s)
2,769 14,453 21,242 24,940 63,404
– 20 –
1. THE FUND
The Lakeview Funds consist of Lakeview Disciplined Leadership High Income Fund, Lakeview
Disciplined Leadership Canadian Equity Fund, Lakeview Disciplined Leadership U.S. Equity Fund
collectively (“the Funds”) and are mutual fund trusts governed by the laws of Ontario pursuant to a
master declaration of trust. The Funds were established on June 15, 2004 and operations commenced
on July 5, 2004.
Since inception, the Funds have received portfolio advice from the Disciplined Leadership Team, a division
of Barometer Capital Inc. (“Barometer” formerly, Rockwater Asset Management Inc.). From June 17, 2005
to August 31, 2006 KBSH Capital Management Inc. (“KBSH”), an indirect wholly-owned subsidiary of
Rockwater Capital Corporation (“RCC”) acted as trustee and manager of the Funds and effective
September 1, 2006, Lakeview Asset Management Inc. (“LAM”), an indirect wholly-owned subsidiary of
RCC, became the trustee and manager of the Funds. Effective January 1, 2008, LAM, CI Investments Inc.
and Rockwater Asset Management Ltd. amalgamated. The amalgamated company continues under the
name "CI Investments Inc.". CI Investment Inc. is the manager (“Manager”) of the Funds.
The Funds Amended and Restated Master Declaration of Trust dated July 20, 2007 established the
creation of three classes for each Fund: Class A, Class F and Class I units.
Class A units are available to all investors. Class F units are available to investors who participate in
certain programs or are members of certain groups. Class I units are available to institutional clients
and investors who have been approved and have entered into a Class I Account Agreement with
CI Investments Inc.
Effective October 1, 2008, the Lakeview Funds changed their financial year end from December 31 to
March 31.
The Statement of Investment Portfolio and Schedule of Fees for each of the Funds are as at March 31,
2009 and the Statements of Net Assets, Schedule of Net Assets Reconciliation, Schedule of Securities
Lending and Tax Loss Carry Forwards for each Fund are as at March 31, 2009 and December 31, 2007.
The Statements of Operations, Statements of Changes in Net Assets, Schedule of Fund Unit
Transactions and Schedule of Commissions for each Fund are for the 15 month period from January 1,
2008 to March 31, 2009 and for the year ended December 31, 2007. The Fund Specific Financial
Instruments Risks for each of the Funds are as at March 31, 2009.
2. SIGNIFICANT ACCOUNTING POLICIES
The financial statements are prepared in accordance with Canadian Generally Accepted Accounting
Principles (“GAAP”).
(a) Adoption of New Accounting Standards
The Canadian Institute of Chartered Accountants (“CICA”) issued Section 3862 “Financial Instruments –
Disclosures” and Section 3863 “Financial Instruments – Presentation” in place of Section 3861 “Financial
Instruments – Disclosure and Presentation”. Sections 3862 and 3863 became effective for interim and
annual financial statements relating to fiscal years beginning on or after October 1, 2007, specifically
Jan. 1, 2008 for the Funds. These sections establish standards for disclosure of financial instruments
including the nature and extent of risks arising from financial instruments to which the Funds are exposed
during the reporting period. The adoption of the new accounting standards has no impact on valuation
policies, nor the way the Funds’ Net Assets are calculated.
Section 1535 “Capital Disclosures” establishes standards for disclosing information about an entity’s
capital and how it is managed. This new standard became effective for interim and annual financial
statements relating to fiscal years beginning on or after October 1, 2007, specifically January 1, 2008
for the Funds. The adoption of this new accounting standard has no impact on the Funds’ Net Assets.
(b) Valuation of Investments
The Canadian Institute of Chartered Accountants (“CICA”) issued Section 3855, “Financial Instruments –
Recognition and Measurement”, which requires the fair value of financial instruments to be measured
based on investments’ bid/ask price depending on investment position (long/short). For financial
reporting purposes, on January 1, 2007, the Funds adopted Section 3855 on a retrospective basis without
restatement of prior years’ numbers. Prior to adoption of Section 3855 the fair value of investments for
financial reporting purposes was measured based on the closing market price for the day.
The Canadian Securities Administrators (“CSA”) amended section 14.2 of National Instrument 81-106
on September 5, 2008. The amended section 14.2 requires the net asset value of an investment fund
to be calculated using the fair value of the fund's assets and liabilities. The adoption of Section 3855
results in a different valuation method for calculating net asset value for financial reporting purposes.
For the purpose of processing unitholder transactions, net asset value is calculated based on the
closing market price (referred to as “Net Asset Value”), while for financial statement purposes net
asset value is calculated based on bid/ask price (referred to as “Net Assets”). In accordance with
NI 81-106, a reconciliation between the Net Asset Value per unit and the Net Assets per unit is
disclosed in the Schedule of Net Assets Reconciliation as at March 31, 2009 and December 31, 2007.
Investments are categorized as held for trading in accordance with Section 3855, “Financial
Instruments – Recognition and Measurement” and are recorded at their fair value for financial
reporting purposes. Listed securities are valued based on the bid price for securities held long and the
ask price for securities held short on the financial reporting date. Unlisted securities are valued based
on price quotations from recognized investment dealers, or failing that, their fair value is determined
by the Manager on the basis of the latest reported information available. Fixed income securities,
debentures, money market investments and other debt instruments are valued at the bid quotation
from recognized investment dealers. Underlying funds are valued on each business day at their Net
Asset Value as reported by the fund manager.
(c) Commissions and other portfolio transaction costs
Transaction costs, such as brokerage commissions, incurred in the purchase and sale of securities, are
included in “Commissions and other portfolio transaction costs” in the Statements of Operations.
(d) Cost of Investments
Cost of investments represents the amount paid for each security and is determined on an average cost
basis excluding commissions and transactions costs.
(e) Investment Transactions and Income Recognition
Investment transactions are accounted for on the trade date for financial reporting purposes and any
realized gains and losses from such transactions are calculated on an average cost basis.
Dividend income and distributions from investment funds are recognized on the ex-dividend/ex-
distribution date and interest income on the accrual basis.
Notes to the Financial Statements - Lakeview Disciplined Leadership FundsAs at March 31, 2009
Annual Financial Statements as at March 31, 2009
– 21 –
Distributions received from income trust holdings are recorded as income, capital gains or a return
of capital, based on the best information available to the Manager. Due to the nature of these
investments, actual allocations could vary from this information. Distributions from income trusts that
are treated as a return of capital for income tax purposes reduce the average cost of the underlying
investment trust.
(f) Foreign Exchange
Foreign currency amounts are translated into Canadian dollars as follows: fair value of investments,
forward currency contracts, other assets and liabilities at the closing rate of exchange on each
business day and income, expenses and purchases, sales and settlements of investments at the rate
of exchange prevailing on the respective dates of such transactions. Foreign exchange gains (losses)
on completed transactions are included in “Foreign exchange gain (loss)” as reflected in the
Statements of Operations.
Units of Lakeview Disciplined Leadership U.S. Equity Fund may be purchased in either Canadian or
U.S. currency. The net asset value (“NAV”) per unit is translated at the rate of exchange prevailing on
the date the units are issued or redeemed.
(g) Increase (Decrease) in Net Assets from Operations per Unit
“Increase (decrease) in net assets from operations per unit” in the Statements of Operations is
calculated by dividing the increase (decrease) in net assets from operations per class of a Fund by the
weighted average number of units outstanding during the period for that class.
(h) Futures Contracts
Futures contracts are valued on each valuation day using the bid/ask price posted on the related public
exchange. All gains or losses arising from futures contracts are recorded as part of “Change in
unrealized appreciation (depreciation) of investments” in the Statements of Operations until the
contracts are closed out or expired, at which time the gains (losses) are realized and reported as
“Realized gain (loss) on investments” in the Statements of Operations.
(i) Cash and Short-Term Investments
Cash is comprised of cash on deposit. Short-term investments are comprised of short term-debt
instruments with maturity of less than one year at acquisition.
(j) Net Asset Value Per Unit
Net asset value per unit for each class is calculated at the end of each day on which the Toronto Stock
Exchange is open for business by dividing the net asset value of each class by its outstanding units.
The net asset value of each class is computed by calculating the value of that class’s proportionate
share of the Fund’s assets less that class’s proportionate share of the Fund’s common liabilities and
less class specific liabilities. Expenses directly attributable to a class are charged to that class. Other
income and expenses, and gains and losses are allocated to each class proportionately based upon the
relative net asset value of each class.
(k) Use of Estimates
The preparation of financial statements in accordance with Canadian Generally Accepted Accounting
Principles requires management to make estimates and assumptions that affect the reported amounts
of assets and liabilities at the reporting date and the reported amounts of income and expenses
during the reporting period. Actual results could differ from those estimates.
3. UNITHOLDERS’ EQUITY
Units issued and outstanding represent the capital of each Fund.
Each Fund is authorized to issue an unlimited number of redeemable, transferable units of each class.
Generally the Funds have no restrictions or specific capital requirements, except for the minimum
subscription/ redemption amounts. The relevant changes pertaining to subscription and redemption of
each Fund units are disclosed in the Statements of Changes in Net Assets. In accordance with the
objectives and risk management polices outlined in Note 11, the Funds endeavor to invest subscriptions
received in appropriate investments while maintaining sufficient liquidity to meet redemptions through
utilizing a short-term borrowing facility or disposal of investments when necessary.
The unitholder transactions are processed based on net asset value which is calculated daily based
on the closing market price on that day.
4. INCOME TAXES
The Funds qualify as mutual fund trusts under the provisions of the Income Tax Act (Canada) and are not
subject to tax on net income, including net realized capital gains for the taxation year, which is paid or
payable to unitholders at the end of the taxation year. However, such part of each Funds’ taxable income
and net realized capital gains that is not so paid or payable will be taxable to that Fund. Income tax on net
realized capital gains not paid or payable will generally be recoverable by virtue of refunding provisions
contained in the Income Tax Act (Canada) and provincial income tax legislation, as redemptions occur. It is
the intention of each Fund to pay all net taxable income and sufficient net realized capital gains so that
the Fund will not be subject to income tax. Occasionally, a Fund may distribute more than it earns. This
excess distribution is a return of capital and is not taxable to unitholders.
Net capital losses may be carried forward indefinitely to reduce future net realized capital gains.
Non capital losses arising in taxation years up to 2003 may be carried forward seven years. Non capital
losses arising in taxation years 2004 and 2005 may be carried forward ten years. Non capital losses
arising in taxation years after 2005 may be carried forward twenty years. Refer to fund specific
schedules in the financial statements for tax loss carried forward information.
5. MANAGEMENT FEE AND OTHER EXPENSES
Management Fees
CI Investments Inc. is the Manager of each Fund and in consideration of management fees provides
management services required in the day-to-day operations of the Funds including management of the
investment portfolios of the Funds.
The management fee is calculated as a fixed annual percentage of the net asset values of each class
of a Fund (other than Class I) at the end of each business day.
Investors in Class I units are charged a management fees directly as negotiated between the investor
and the Manager.
The Manager may reduce the effective management fee payable for unitholders who invest large
amounts in a particular Fund by reducing the management fee charged to that Fund and directing
the Fund to make a management fee distribution in the amount of the reduction. Management fee
distributions are automatically reinvested in additional units of the relevant class of the Fund.
Notes to the Financial Statements - Lakeview Disciplined Leadership FundsAs at March 31, 2009
Annual Financial Statements as at March 31, 2009
– 22 –
The Manager bears all of the operating expenses of the Funds (other than certain taxes, borrowing costs
and new governmental fees) in return for fixed annual administration fees (the “Administration Fees”).
Each Administration Fee is calculated as a fixed annual percentage of the net asset value of each class
of a Fund (other than Class I) at the end of each business day.
Refer to fund specific schedules in the financial statements for management fee and administration
fee rates applicable to each class.
Performance Fees
In addition to management fees, Class A and F units of the Funds pay the Manager a performance fee
equal to 20% of the amount by which the class of units of a Fund outperforms that Fund’s benchmark
and where the value of the class of units of the Fund exceeds the value of the class of units of that
Fund as at the date of the last performance fee payment in any given calendar quarter. The fee is
accrued and calculated daily and payable on a quarterly basis.
Performance fees for Class I units, if applicable, are negotiated between the Manager and the
unitholder and will be paid directly by the unitholder.
The applicable benchmarks are:
• Lakeview Disciplined Leadership High Income Fund: a 50/50 blend of the S&P/TSX Bond Broad
Market Index and S&P/TSX Capped Income Trust Total Return Index. Subject to receiving regulatory
approval, the fund intends to replace the S&P/TSX Bond Broad Market Index with the DEX Universe
Bond Index.
• Lakeview Disciplined Leadership Canadian Equity Fund: S&P/TSX Composite Total Return Index
• Lakeview Disciplined Leadership U.S. Equity Fund: S&P 500 Composite Total Return Index
6. SECURITIES LENDING
Certain Funds have entered into a securities lending program with their custodian, RBC Dexia Investor
Services Trust ("RBC Dexia"). The aggregate market value of all securities loaned by a Fund cannot
exceed 50% of the assets of the Fund. A Fund will receive collateral of at least 102% of the value of
securities on loan. Collateral will generally be comprised of cash and obligations of or guaranteed by
the Government of Canada or a province thereof, or by the United States government or its agencies,
but may include obligations of other governments with appropriate credit ratings. RBC Dexia has
indemnified the Funds against the credit risk of the borrowers. For those Funds participating in the
program, amounts for securities loaned, the collateral received, and the income collected appear on
the fund specific schedules in the financial statements and income from securities lending is included
in "Securities lending" in the Statements of Operations and any cash collateral received or cash
collateral payable is included in the Statements of Net Assets in “Cash collateral received for
securities on loan” or “Payable for cash collateral under securities lending”.
7. REINVESTMENT OF DISTRIBUTIONS
All distributions made by each class of the Funds are automatically reinvested in additional units of
that class at the current NAV per unit, without any acquisition charges. The unitholder may withdraw
from the automatic reinvestment plan by providing written notice to the Manager, and will thereafter
receive a cash distribution.
8. RELATED PARTY TRANSACTIONS
On October 6, 2008 Sun Life Financial Inc. sold its significant interest in CI Financial Corp. (formerly
CI Financial Income Fund) to The Bank of Nova Scotia. As CI Financial Corp. is the parent company of
the Manager, The Bank of Nova Scotia therefore is considered a related party to the Funds. The Bank
of Nova Scotia did not hold investments in the Funds as at March 31, 2009.
Blackmont Capital Inc. is a subsidiary of CI Financial Corp. As CI Financial Corp., is the parent company
of the Manager of the Funds, Blackmont Capital Inc. is thus considered a related party to the Funds.
The Funds paid the following brokerage commissions to Blackmont Capital Inc., an affiliated company
of CI Investments Inc. during the 15 month period from January 1, 2008 to March 31, 2009 and year
ended December 31, 2007:
15 month
period from
Jan. 1, 2008 to Year Ended
Fund Mar. 31, 2009 Dec. 31, 2007
($) ($)
Lakeview Disciplined Leadership Canadian Equity Fund 22,239 7,933
Lakeview Disciplined Leadership U.S. Equity Fund 2,090 2,958
Lakeview Disciplined Leadership High Income Fund 6,695 5,075
9. FUTURE ACCOUNTING STANDARDS
“International Financial Reporting Standards”
On February 13, 2008, the Canadian Accounting Standards Board (“AcSB”) confirmed that the use of
International Financial Reporting Standards (“IFRS”) will be required in 2011 for all publicly
accountable profit-oriented enterprises. IFRS will replace Canadian Generally Accepted Accounting
Principles (“GAAP”). IFRS becomes effective for interim and annual financial statements relating to
fiscal years beginning on or after January 1, 2011.
At March 31, 2009, the Manager is taking the following steps to transition to IFRS:
• Identification of areas where changes in disclosure will be required under IFRS standards.
• Identification of operational areas impacted by the adoption of IFRS.
• Identification of major differences between current accounting policies and IFRS standards.
• Assessment of impact, if any, on net asset value per share.
• Assessment of current reporting systems and their readiness for IFRS implementation.
• Implementation of an IFRS transition plan.
As at March 31, 2009, the Manager has determined that there is no expected impact to net asset value
per unit as a result of the transition to IFRS.
Amendments to Section 3862, “Financial Instruments - Disclosures”
Section 3862, was recently amended and requires publicly accountable enterprises to enhance their
disclosures about fair value measurements and the liquidity risk of financial instruments. The
amendments will be effective for annual financial statements relating to fiscal years ending after
September 30, 2009, specifically the March 31, 2010 financial statements of the Funds. These
amendments have been made to address the need for increased consistency and comparability in fair
value measurements, and to expand the disclosure surrounding fair value measurements, and do not
have any impact on the net assets of the Funds.
10. FINANCIAL INSTRUMENTS
The categorization of financial instruments in accordance with CICA 3855, Financial Instruments –
Recognition and Measurement (“CICA 3855”) are as follows: financial assets and financial liabilities
held for trading which include investments and derivative instruments are stated at fair value.
Due from brokers, interest and dividends receivable, subscriptions receivable and other receivables are
designated as loans and receivables. They are recorded at amortized cost which approximates their
fair value due to their short term nature. Similarly, redemptions payable, due to brokers, accrued
management fees, performance fees payable, accrued expenses and other payables are designated as
other liabilities and are carried at their amortized cost which approximates their fair value, due to their
short term nature.
Notes to the Financial Statements - Lakeview Disciplined Leadership FundsAs at March 31, 2009
Annual Financial Statements as at March 31, 2009
– 23 –
11. FINANCIAL INSTRUMENTS RISK
Risk Management
The Funds are exposed to a variety of financial instruments risks: credit risk, liquidity risk and market risk
(including interest rate risk, currency risk and other price risk). The level of risk to which each Fund is
exposed depends on the investment objective and the type of investments the Fund holds. The value of
the investments within the portfolio can fluctuate daily as a result of changes in prevailing interest rates,
economic and market conditions and company specific news related to investments held by the Funds.
The Manager of the Funds may minimize potential adverse effects of these risks on the Funds’
performance by, but not limited to, regular monitoring of the Funds’ positions and market events,
diversification of the investment portfolio by asset type, country, sector, term to maturity within the
constraints of the stated objectives, and through the usage of derivatives to hedge certain risk exposures.
Details of each individual Fund’s exposure to financial instruments risks are available in the “Fund
Specific Financial Instruments Risks” section of the financial statements of each Fund.
Other Price Risk
Other price risk is the risk that the value of financial instruments will fluctuate as a result of changes
in market prices (other than those arising from interest rate risk or currency risk). The value of each
investment is influenced by the outlook of the issuer and by general economic and political conditions,
as well as industry and market trends. All securities present a risk of loss of capital. Except for options
written, future contracts sold short and investments sold short, the maximum risk resulting from
financial instruments is equivalent to their fair value.
Other assets and liabilities are monetary items that are short-term in nature and therefore are not
subject to significant other price risk.
Interest Rate Risk
Interest rate risk is the risk that the fair value of interest-bearing investments will fluctuate due to
changes in prevailing levels of market interest rates. As a result, the value of the Funds that invest in
debt securities and income trusts will be affected by changes in applicable interest rates. If interest
rates fall, the fair value of existing debt securities may increase due to the increase in yield. On the
other hand, if interest rates rise, the yield of existing debt securities decrease which may then lead to
a decrease in their fair value. The magnitude of the decline will generally be greater for long-term debt
securities than for short-term debt securities.
Interest rate risk also applies to Funds that invest in convertible securities. The fair value of these
securities varies inversely with interest rates, similar to other debt securities. However, since they may
be converted into common shares, convertible securities are generally less affected by interest rate
fluctuations than other debt securities.
All fixed income securities rated BBB/Baa/B++ or above are considered investment grade and have a
lower credit risk than below investment grade bonds.
Currency Risk
Currency risk arises from financial instruments that are denominated in a currency other than the
functional currency of the Funds. As a result, the Funds may be exposed to the risk that the value
of securities denominated in other currencies will fluctuate due to changes in exchange rates.
The Statement of Investment Portfolio identifies all bonds and derivative instruments denominated in
foreign currencies, if applicable. Equities traded in foreign markets are also exposed to currency risk
as the prices denominated in foreign currencies are converted to the Funds’ functional currency to
determine their fair value.
Credit Risk
Credit risk is the risk that a security issuer or counterparty to a financial instrument will fail to meet
its financial obligations. The fair value of a debt instrument includes consideration of the credit
worthiness of the debt issuer. The carrying amount of debt instruments as presented on the Statement
of Investment Portfolio represent credit risk exposure of each Fund. Credit risk exposure for derivative
instruments is based on each Fund’s unrealized gain on the contractual obligations with the
counterparty as at the reporting date. The credit rating of a counterparty to derivative instrument is
disclosed in Statement of Investment Portfolio of each Fund, if applicable. The credit risk exposure of
the Fund’s other assets are represented by their carrying amount as disclosed in the Statements of
Net Assets.
Significant cash balances may be maintained at the custodian and the manager monitors the credit
worthiness of the custodian on an regular basis.
All transactions executed by a Fund in listed securities are settled / paid for upon delivery using
approved brokers. The risk of default is considered minimal, as delivery of securities sold is only made
once the broker has received payment. Payment is made on a purchase once the securities have been
received by the broker. The trade will fail if either party fails to meet its obligation.
Liquidity Risk
Liquidity risk is the risk that the Funds may not be able to settle or meet their obligations, on time or
at a reasonable price. The Funds are exposed to daily cash redemption of redeemable units. Therefore,
the Funds aim to invest the majority of their assets in investments that are traded in active markets
and can be readily disposed of. In addition, the Funds aim to retain sufficient cash and cash
equivalents positions to maintain liquidity. From time to time, the Funds may enter into derivative
contracts or invest in unlisted securities that may not trade in an organized market and may be illiquid.
Illiquid securities are identified in the Statement of Investment Portfolio of each Fund, if applicable.
Notes to the Financial Statements - Lakeview Disciplined Leadership FundsAs at March 31, 2009
Annual Financial Statements as at March 31, 2009
– 24 –
Legal Notice
Notice: Should you require additional copies of this Annual Report or have received more than one copy,please contact CI Investments Inc. (the “Manager”) or your financial advisor.
Commissions, trailing commissions, management fees and expenses all maybe associated with mutual fundinvestments. Please read the prospectus before investing. Unless otherwise indicated and except forreturns for periods less than one year, the indicated rates of return are the historical annual compoundedtotal returns including changes in security value. All performance data assume reinvestment of alldistributions or dividends and do not take into account sales, redemption, distribution or optional charges orincome taxes payable by any securityholder that would have reduced returns. Mutual funds are notguaranteed, their values change frequently and past performance may not be repeated. Mutual fundsecurities are not covered by the Canada Deposit Insurance Corporation or by any other governmentdeposit insurer.
The commentaries contained herein are provided as a general source of information and should not beconsidered personal investment advice or an offer or solicitation to buy or sell securities. Every effort hasbeen made to ensure that the material contained in these commentaries is accurate at the time ofpublication. However, the Manager cannot guarantee its accuracy or completeness and accepts noresponsibility for any loss arising from any use of or reliance on the information contained herein.
Simplified Prospectus: The Simplified Prospectus and Annual Information Form of a Fund are renewedannually. The Manager would be pleased to provide, without charge, the most recent SimplifiedProspectus upon request to its Toronto office.
TMLakeview is a trademark of CI Investments Inc.
Annual Financial Statements as at March 31, 2009

– 25 –
Notes

2 Queen Street East, Twentieth Floor, Toronto, Ontario M5C 3G7 I www.ci.com
LAKEVIEW_AR_06/09E
Head Office / Toronto416-364-1145 1-800-268-9374
Calgary 403-205-43961-800-776-9027
Montreal 514-875-00901-800-268-1602
Vancouver 604-681-33461-800-665-6994
Client Services English: 1-800-563-5181French: 1-800-668-3528