Embed Size (px)
DESCRIPTION
Lake Victoria Region: Past, Present and Future. Bukola Johnson LUMA-GIS, Sweden. Outline. Objectives Background Datasets Methodology Results Conclusion. Objectives. - PowerPoint PPT Presentation
Citation preview

Bukola Johnson
LUMA-GIS, Sweden

Objectives
Background
Datasets
Methodology
Results
Conclusion

EEffective planning and management of finite natural
resources for sustainable development in Lake Victoria
Region

Lake Victoria: World’s 2nd largest fresh water body
Surface boundary: Tanzania (49%), Uganda (45%) and Kenya(6%)
Economic contribution worth USD 3-4 billion annually
Sustenance for 25 million people (1/3 of the region population)
Economic activities:
Agriculture (Tea and Coffee plantation) & Fishing,
Source of water for industry & Transportation,
Recreation &Tourists attraction

Adm. Boundaries:Shape files for Kenya, Tanzania & Uganda from FAO AfricoverShape file for Lake Victoria region (3 countries) from UNEP
ClimatePrecipitation data for Africa in text (ASCII) formatPeer- reviewed journal (New et al, 2002)
DEMTwo tiles from GTOPO30E020N40.DEM covering Kenya and Uganda E020S10.DEM covering SE of Tanzania
Land cover/ Land useIGBP raster in .bsq format for Africa. PopulationRaster files (.TIF format) for Africa population(1990 and 2000) from UNEP
Protected AreasPersonal Geodatabase (.mdb) for Africa from UNEP & World Conservation Union
Conceptual planning and modeling.
Data previewed in Arc Catalog
Convert data to ESRI GRID format
Define data projection
Re-project data to WGS84 and Lambert Azimuthal Equal
Area projection
The Study Area clipped from the Africa dataset.
Loading project data in Personal Geodatabase
Data Analysis

CountryArea
(Sq. Km)Population
Yr. 2000Population
Yr. 1990Annual GR (%)
Kenya 582164 30,536,278 23,465,996 3.0
Tanzania 941757 34,522,944 25,782,720 3.4
Uganda 241278 22,961,634 17,582,136 3.1
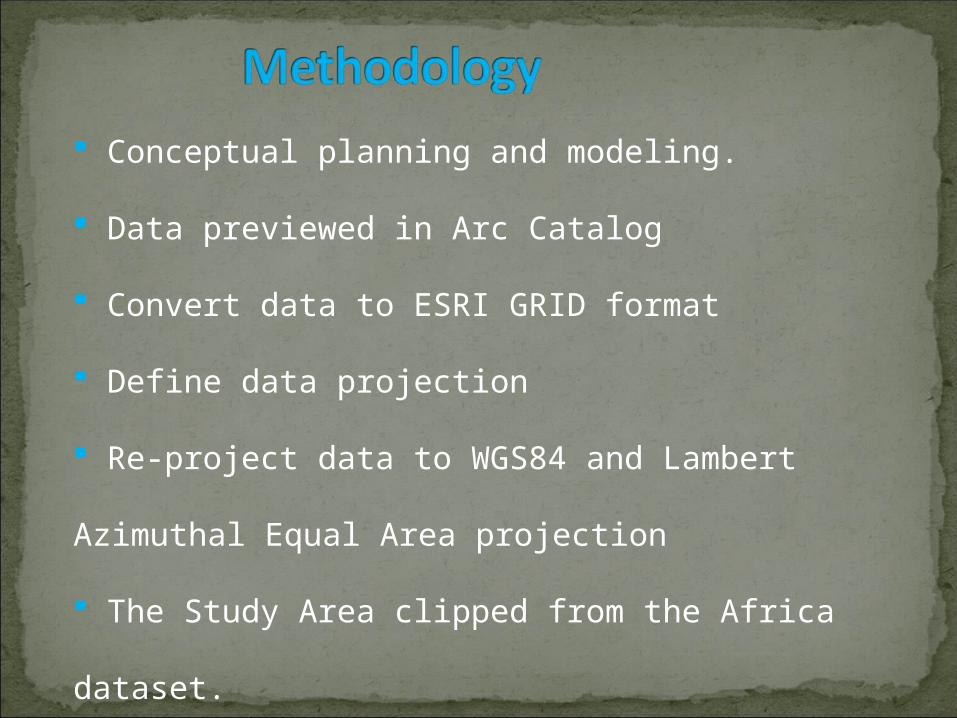
Table 1: Population Growth in Lake Victoria RegionTable 1: Population Growth in Lake Victoria Region
Land cover Kenya % Tanzania % Uganda %
Forest 8904 4 103519 23 8967 5Shrubland 67786 32 34934 8 8254 5Savanna 64470 30 52960 12 56845 34Grassland 16090 8 60444 13 2011 1Permanent Wetland
11052 5 55568 12 56 0
Croplands 22847 11 97002 22 61729 37Urban and built-up 6455 3 19118 4 73 0Barren and Sparsely vegetated
10481 5 1606 0 1993 1
Water Bodies 4529 2 23489 5 28411 17Total 212614 100 448640 100 168339 100
Table 2: Land Cover Statistics for Kenya, Tanzania and Table 2: Land Cover Statistics for Kenya, Tanzania and UgandaUganda

Country Pop 2000 Area of Cropland
Pop 2030Area of
Cropland Required
Additional Cropland
Kenya 30,536,278 22,847 916,101,840 685,244 662,397Tanzania 34,522,944 97,002 950,153,040 2,669,930 2,572,928Uganda 22,961,634 61,729 774,384,990 2,081,547 2,019,818
Table 3: Additional Cropland for Population in Year Table 3: Additional Cropland for Population in Year 20302030

Crop needs sufficient and effective rain to grow and produce yields.
Croplands were located in the region with middle range precipitation.
Croplands were found around Lake Victoria.
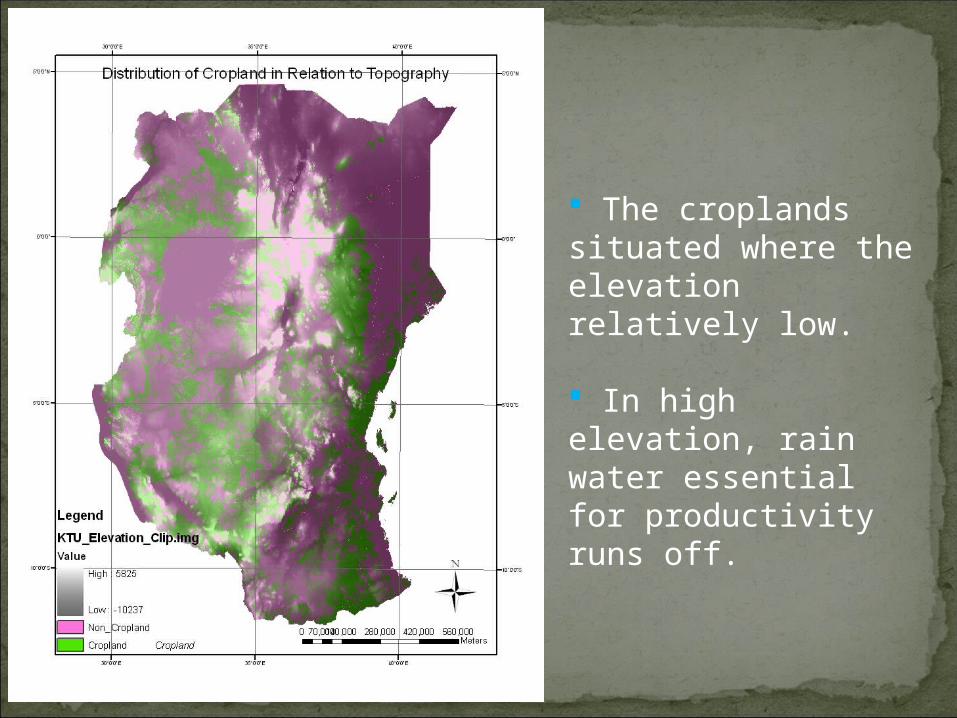
The croplands situated where the elevation relatively low.
In high elevation, rain water essential for productivity runs off.

Croplands are largely located in elevation range of 0-1999

Finite natural resources with competing demands.
Sufficient rainfall in the region with Lake Victoria as a reservoir.
Biophysical constraint such as topography that affect land use.
Elevation influences geographical distribution of croplands.
The mean annual population growth rate is about 3% for the region.
Attendant decline in cropland per capita with population growth.

To ensure food security and social development:
Implement landuse regulation
Convert parts of forest land to croplands
Exploit species and hybrid plants with high yield
and short maturity time
Promote Family Planning to control population
explosion.