Embed Size (px)
Citation preview

LAKE SARAH STAKEHOLDERS COMMITTEE Joint meeting with cities Monday, March 2, 2009
6:30 pm Independence City Hall
Agenda
1. Call to order – Harold Burrows
2. Updated progress reports from cities Corcoran Greenfield Independence Loretto Medina 3. TMDL progress update – John Barten, Randy Lehr
4. Explanation of the responsibilities for cities – John Barten, Randy Lehr 5. Updated expected allocation for reduction of phosphorus for each city – John Barten, Randy Lehr 6. Possible ways each city could allocate the reduction to each landowner class i.e. residential, farm, animals, etc. – John Barten (Repeat) 7. Potential sources of funding and current progress. – Dan Cady, Jerry Horazuk 8. Set next meeting date 11. Adjourn – Harold Burrows
wq-iw8-13m

Lake Sarah Stakeholders’ Committee (LSSC) Board Meeting 3/2/09 Independence City Hall Present: John Barten (Three Rivers Park District (TRPD,) Randy Lehr (Water Resource Manager TRPD,) Fred Bills (Lake Sarah Improvement Association (LSIA,) Harold Burrows (LSIA,) Brenda Daniels (Loretto Council,) Elizabeth Weir (Medina Council,) Barb Peichel Minnesota Pollution Control Agency,) Sylvia Walsh (Greenfield Resident,) Brent Foster (LSIA,) Mark Holten (LSIA,) Nick Proulx (Minnesota DNR,) Bob Berens (LSIA,) Fred Bills (LSIA,) James Kujawa (Hennepin Co. DES/ PSCWMC,) Rob and Donna Sheeley (LSIA. Chair, Harold Burrows called the meeting to order at 6:35 p.m. and asked for progress reports from the TMDL cities. TMDL City Updates: Corcoran: Lehr reported that his presentation to Corcoran City Council was well received. Corcoran is open to collaborate on the Lake Sarah TMDL but has yet to appoint someone to attend LSSC meetings. Burrows to follow up and encourage participation. Greenfield: Lehr to contact Greenfield Council. Sylvia Walsh, a former city council member, attends LSSC meetings, but no official Greenfield representative as yet. Independence: Has missed the last three meetings. Burrows to follow up. Loretto and Medina: Staff will seek grant money and work together on the planned re-meander of a border ditch and the enlargement of a catchment pond. Burrows reported that LSIA has submitted a grant proposal for whole lake Curly Leaf Pondweed (CLP) treatment. John Barten warned that it is likely that the amount of the grant will be less than half the total needed. Wide ranging discussion followed regarding homeowner permits and the costs to apply herbicides to the invasive curly leaf pondweed infestation of Lake Sarah. Barten reported that Clean Water Legacy funds are not available for invasive aquatic weed control. He also stated that DNR and other state agency grant monies cannot be successfully applied for, until there is a Lake Management Plan in place. (Lake Sarah has no management Plan, although a draft document has been written.) Proulx of the DNR stated that only 50 feet of shoreline per homeowner can be treated with aquatic herbicides, since herbicides also kill native aquatic plants, and unfragmented lake vegetation is essential for fish spawning success and also for oxygenation of the lake water. The 50 feet allows for boat ingress and egress. Proulx said that a lake-wide variance to this rule can be sought. The home owners who were present stated that this restriction on herbicide application felt like a backwards step in efforts to control CLP and Eurasian Water Milfoil (EWM.) Lehr showed a presentation of the three main catchment areas of the lake watershed, the Eastern, Western and Shoreland areas. The Western Area is responsible for 1,670 lbs of phosphorous loading each year; the Eastern, 1,200 lbs; the Shoreline 420 lbs. He also
wq-iw8-13m

showed graphs of phosphorous loading month by month in relation to rainfall events for the years 2007 and 2008, both relatively dry years. The graphs demonstrate that heavy rainfall events wash phosphorous into the lake; and early, heavy snowmelt and rainfall events cause a significant rise in total annual pollution. With this knowledge, the approach is to remediate heavy rainfall events by slowing run-off. One example would be the planned re-meander of the ditched stream in Loretto and the enlargement of the catchment pond, so that sediment and phosphorous settles out from the run-off before flowing into the lake. Lehr and Barten summarized the phosphorous loading formula. Lehr enlarged upon the reasoning behind the Margin of Safety calculation of 36 ug/l of phosphorous loading goal per year for cities that is slightly reduced from state standards of 40ug/l. He also addressed the 100 ug/l Reserve Capacity of loading in the formula to highlight that the stakeholder group and MPCA will have to agree on how future land-use changes and development will be incorporated into the final TMDL document. It was suggested that The Reserve Capacity be consistent with proposed development in 2030 Comprehensive Plans. There was discussion of MS4 designation of cities that mandates reduction of phosphorous loading in impaired lakes and streams. Greenfield is not yet a declared MS4 city, although Lehr believes it will be named an MS4 in the near future. Barten asked cities in the Lake Sarah TMDL to identify a staff person who will be responsible for overseeing the remediation of phosphorous run-off into Lake Sarah. Road salt use and chloride pollution, particularly of streams, was discussed. Peichel said that a busy intersection is going to be built with porous pavement as a demonstration project; porous pavement absorbs moisture and dries quickly, reducing the need for salt application in winter. Peichel also stated that MPCA web site is up-to-date and has valuable informational links. Meeting adjourned at 7:55 p.m. Next meeting May 18, 2009 at Independence City Hall at 6:30 p.m.

LAKE SARAH STAKEHOLDERS COMMITTEE Joint meeting with cities Monday, May 18, 2009
6:30 pm Independence City Hall
Agenda
1. Call to order – Harold Burrows
2. Updated progress reports from cities Corcoran Greenfield Independence Loretto Medina 3. TMDL progress update – John Barten, Randy Lehr
4. Explanation of the responsibilities for cities – John Barten, Randy Lehr 5. Updated expected allocation for reduction of phosphorus for each city – John Barten, Randy Lehr 6. Possible ways each city could allocate the reduction to each landowner class i.e. residential, farm, animals, etc. – John Barten (Repeat) 7. Potential sources of funding and current progress. – Dan Cady, Jerry Horazuk 8. Set next meeting date 11. Adjourn – Harold Burrows
wq-iw8-13m

Lake Sarah TMDL Lake Sarah TMDL Stakeholder MeetingStakeholder Meeting
May 18May 18thth, 2009, 2009
wq-iw8-13m

§§ Total Maximum Daily LoadTotal Maximum Daily Load§§ Maximum amount of pollutant that can be received by (or Maximum amount of pollutant that can be received by (or
discharged into) a waterbody without impairing beneficial discharged into) a waterbody without impairing beneficial usesuses§§ Beneficial Uses Water Quality Standards Beneficial Uses Water Quality Standards TMDLTMDL
What in the heck is a TMDL?What in the heck is a TMDL?

TMDL “Equation”TMDL “Equation”
TMDL = TMDL = ∑ ∑ WLAWLA + ∑ + ∑ LALA + MOS + RC+ MOS + RC
WLA = Wasteload Allocation (Point sources)WLA = Wasteload Allocation (Point sources)LA = Load Allocation (Nonpoint sources)LA = Load Allocation (Nonpoint sources)LA = Load Allocation (Nonpoint sources)LA = Load Allocation (Nonpoint sources)MOS = Margin of SafetyMOS = Margin of SafetyRC = Reserve CapacityRC = Reserve Capacity

TMDL ProcessTMDL Process
TMDL = TMDL = ∑ ∑ WLAWLA + ∑ + ∑ LALA + MOS + RC+ MOS + RC
Science
1000 = 1000 = 800800 + + 600600 + 100 + 100+ 100 + 100
1000 = 1000 = 500500 + + 300300 + 100 + 100+ 100 + 100
Policy and Technology
Current Conditions
Desired Conditions

TMDL RequirementsTMDL Requirements§§ LocationLocation§§ 303(d) Listing Information303(d) Listing Information§§ Water Quality StandardsWater Quality Standards§§ Loading CapacityLoading Capacity§§ Wasteload AllocationWasteload Allocation§§ Wasteload AllocationWasteload Allocation§§ Load AllocationLoad Allocation§§ Margin of SafetyMargin of Safety§§ Seasonal VariationSeasonal Variation§§ Reasonable AssurancesReasonable Assurances§§ MonitoringMonitoring§§ ImplementationImplementation§§ Public ParticipationPublic Participation

LocationLocation§§ Lake SarahLake Sarah
§§ IndependenceIndependence§§ GreenfieldGreenfield§§ CorcoranCorcoran§§ MedinaMedina§§ LorettoLoretto§§ LorettoLoretto

303(d) Listing & WQ Standards303(d) Listing & WQ Standards
§§ Excessive PhosphorusExcessive Phosphorus§§ GoalGoal
§§ Growing Season AverageGrowing Season Average§§ 40 ug/L40 ug/L
§§ Current ConditionsCurrent Conditions
Observed WQ - Summer meanTP ppb (CV) 101 (0.22)Chl-a ppb (CV) 41.9 (0.30)Secchi m (CV) 1.52 (0.33)
§§ Current ConditionsCurrent Conditions
0
20
40
60
80
100
120
140
160
Tota
l Phosp
horu
s,
g/l
1991 1996 1997 1998 2000 2002 2004 2005 2006 2007 2008
Lake Sarah Average Epilimnion Total Phosphorus
State standardtotal
phosphorus= 40 µg/l

Loading CapacityLoading Capacity§§ BATHTUB ModelBATHTUB Model
§§ Army Corps EngineersArmy Corps Engineers§§ Canfield Bachman, 1981Canfield Bachman, 1981
§§ Preliminary GoalPreliminary Goal§§ ~1067 lbs. P/year~1067 lbs. P/year§§ Critical ConditionsCritical Conditions
§§ Summer growing seasonSummer growing season§§ Summer growing seasonSummer growing season
§§ LoadingLoading§§ External loadExternal load
§§ MeasuredMeasured§§ Internal loadInternal load
§§ ModeledModeled§§ Surface TP ConcentrationSurface TP Concentration
§§ PredictedPredicted

Pollutant SourcesPollutant Sources
§§ Wasteload AllocationWasteload Allocation§§ Points SourcesPoints Sources
§§ StormwaterStormwater§§ MS4 communitiesMS4 communities
§§ Load AllocationLoad Allocation§§ NonNon--point Sourcespoint Sources
§§ AtmosphereAtmosphere§§ Internal LoadingInternal Loading
§§ SedimentsSediments§§ Curlyleaf PondweedCurlyleaf Pondweed

Wasteload AllocationsWasteload Allocations§§ Soil Water Assessment Soil Water Assessment
Tool (SWAT)Tool (SWAT)§§ Land use informationLand use information§§ Phosphorus literature valuesPhosphorus literature values
Land use Ave lbs P/Acre
Cattle * 3.74
Horse * 2.66
HW55 1.78
Commercial/Industrial 1.00
Corn 1.00
Soybean 1.00
Alfa 0.60
Wheat 0.60
Pumpkins 0.53
Residential 0.53
Road 0.53
Rural Residential 0.53
Pasture 0.36
Grassland 0.27
Orchard 0.27
Parkland/Vacant 0.17
Forest 0.13
Wetland 0.13
* Estimated based on animal units

Model Confidence Model Confidence -- HydrologyHydrology
0
2
4
6
8
10
12
14
16
18
4/15/07 6/15/07 8/15/07 10/15/07
Ave
rage D
aily S
trea
mflo
w, cfs Monitored flow, cfs
Modeled flow, cfs
0
2
4
6
8
10
12
14
16
18
4/15/08 6/15/08 8/15/08 10/15/08
Ave
rage
Daily S
trea
mflo
w, cfs
Monitored flow, cfs
Modeled flow, cfs
Monitored Modeled Difference Daily Goodness-of-Fit
2007 0.71 0.81 -15% 0.632008 0.91 0.88 3% 0.91
Total Volume, hm3

Model Confidence Model Confidence -- PhosphorusPhosphorus
y = 1.1342x
R2 = 0.8766
500
600
700
800
Modele
d T
ota
l Phosp
horu
s, g/l
0
100
200
300
400
0 100 200 300 400 500 600 700
Monitored Total Phosphorus, µg/l
Modele
d T
ota
l Phosp
horu
s,

Greenfield Corcoran
.Lake Sarah Phosphorus Yields
Independence
Medina
Loretto
0 0.4 0.8 1.2 1.60.2Miles
Phosphorus Yield lbs/acre0 - 0.2
0.2 - 0.5
0.5 - 1.0
1.0 - 2.0
2.0 +


West Watershed~1670 lbs
ShorelandWatershed~420 lbs
East Watershed~1200 lbs
Relative Watershed ContributionsRelative Watershed ContributionsTotal = 3290
~65% reduction1,982.21,067.33049.5Total
1,119.4602.71722.1Greenfield
40.321.762.1Loretto
254.7137.2391.9Medina
272.1146.5418.5Independence
295.7159.2454.9Corcoran
Load ReductionTMDL GoalAnnual P Load (lbs.)CityPreliminary Data

Load AllocationLoad Allocation
§§ Sediments & Sediments & AtmosphereAtmosphere§§ Calculated indirectlyCalculated indirectly
§§ BATHTUBBATHTUB§§ Lake areaLake area§§ Lake areaLake area
§§ Curlyleaf PondweedCurlyleaf Pondweed§§ 373 Littoral Acres373 Littoral Acres
§§ Average 5 lbs P/acreAverage 5 lbs P/acre§§ ~ 1865 lbs P from ~ 1865 lbs P from
curlyleafcurlyleaf

Margin of SafetyMargin of Safety§§ InIn--lake goalslake goals
§§ TMDL requiredTMDL required§§ 40 ug/L40 ug/L§§ 36 ug/L (Stakeholder Goal)36 ug/L (Stakeholder Goal)
y = 1.1342x
R2 = 0.8766
0
100
200
300
400
500
600
700
800
0 100 200 300 400 500 600 700
Monitored Total Phosphorus, µg/l
Modele
d T
ota
l Phosp
horu
s, g/l
0
4
8
12
16
20
20 30 40 50 60 70 80 90TSI
kg per net
Northern pikeBlack bullhead
C
Lake Sarah
TMDL
Reserve CapacityReserve Capacity
§§ Allowance for future growthAllowance for future growth§§ Set aside WLA and LA to account for future Set aside WLA and LA to account for future
increasesincreases
§§ PioneerPioneer--Sarah Creek WMO RuleSarah Creek WMO Rule§§ NonNon--degradationdegradation
§§ Development/redevelopment standards establish a noDevelopment/redevelopment standards establish a no--netnet--increase in phosphorus loadingincrease in phosphorus loading

Seasonal VariationSeasonal Variation
§§ Base TMDL on 10Base TMDL on 10--year average conditionyear average condition

2007 Monitored Loads
0
100
200
300
400
500
600
700
800
Janu
ary
Februa
ry
March
April
May
June Ju
ly
Augu
st
Septem
ber
Octobe
r
Nove
mbe
r
Decembe
r
Tota
lPhosp
horu
sLo
ad,lb
s
West Cumulative Load
East Cumulative Load
Land Use
Topography
Landscape
2008 Monitored Loads
0
200
400
600
800
1000
1200
1400
Janu
ary
Februa
ry
March
April
May
June Ju
ly
Augu
st
Septem
ber
Octobe
r
Novembe
r
Decembe
r
Tota
lPhosp
horu
sLo
ad,lb
s
West Cumulative Load
East Cumulative Load
Pollutant Runoff and
Lake Condition
Weather

2,000
2,500
3,000
3,500
Tota
lPhosp
ho
West Cumulative Load
East Cumulative Load
1010--year Average Conditionsyear Average Conditions
0
500
1,000
1,500
2,000
Janu
ary
Februa
ry
March
April
May
June Ju
ly
Augu
st
Septem
ber
October
November
December
horu
sLo
ad,lbs

Reasonable AssurancesReasonable Assurances
§§ Ongoing Public ParticipationOngoing Public Participation
§§ WMO Track RecordWMO Track Record
§§ Proposed implementation effortsProposed implementation efforts
§§ Strong Implementation PlanStrong Implementation Plan

MonitoringMonitoring
§§ WatershedWatershed§§ 22--year blocksyear blocks
§§ Every 5Every 5--yearsyears
§§ Capture early seasonCapture early season
§§ InIn--LakeLake§§ ChemistryChemistry
§§ BiBi--weeklyweekly§§ 1010--year periodyear period
§§ VegetationVegetation§§ PrePre--post controlpost control

ImplementationImplementation
§§ LandLand--use based recommendationsuse based recommendations§§ Based on supplemental reportsBased on supplemental reports
§§ Implementation PlanImplementation Plan§§ Implementation PlanImplementation Plan§§ Scenario validationScenario validation
§§ Specific projectSpecific project§§ SoilSoil--testingtesting§§ FilterFilter--stripstrip

“In“In--stream” Managementstream” Management
Best Management PracticeExpected reduction in
total phosphorus export Approximate cost
Stormwater Pond 40-75%$75,000 (1 acre-ft) - $1,930,000 (100 acre-ft)
Pond volume, acre-feet Pond cost Pond size, acres Towns Phosphorus removal, lbs
101 $2,000,000 15 Greenfield, Corcoran 660 - 1238
Pond volume, acre-feet Pond cost Pond size, acres Towns Phosphorus removal, lbs
48 $1,000,000 7Medina, Loretto,
Independence, Corcoran 302 - 568
Western Lake Sarah stream
Eastern Lake Sarah stream

Row Crop Agriculture BMPsRow Crop Agriculture BMPs
Best Management PracticeExpected reduction in total
phosphorus export Approximate cost
Row crop agricultureConversion from moldboard plow to continuous no-till 40-80% $20/acre 78 acres 31 - 62 $1,556Conversion from moldboard plow to ridge till 50% $20/acre 78 acres 39 $1,556Conversion from moldboard plow to chisel plow (at least 30% surface residue at planting)
30-35% $20/acre78 acres 23 $1,556
Conversion from chisel plow to continuous no-till 10%-50% $20/acre 78 acres 8 - 39 $1,556
Phosphate placement, broadcast to surface banding 20% $9/acre 156 acres 31 $1,400Phosphate placement, broadcast to injection/subsurface banding 30-50% $9/acre 156 acres 47 - 78 $1,400Nutrient management based on soil test phosphorus up to 40% $10/acre 160 acres up to 64 $1,597Setback zones for phosphorus fertilizer up to 25% $10/acre 52 acres up to 13 $519
Edge-of-field filter strips (buffers) 8-90% $210-$300/acre 156 acres 12 - 140 $4,901 - $7,002Hill contour farming 30% $7/acre 78 acres 23 $545Grassed waterways 22-89% $3700-$4300/acre 156 acres 34 - 138 $28,786 - $33,454Critical area planting up to 25% $0-$300/acre 156 acres up to 39 $46,680Stripcropping up to 70% $7-$25/acre 156 acres up to 109 $1,089 - $3,890
Cover cropping 7-15% $15/acre 157 acres 11 - 24 $2,355Add wheat into corn-soybean rotation 60% $30-$50/ac 156 acres 23 $4,668 - $7,780Add alfalfa into corn-soybean rotation 50% $30-$50/ac 156 acres 23 $4,668 - $7,780Permanent vegetative cover up to 80% $500/acre 160 acres up to 128 $79,850
Corcoran
Area available for treatment
Total P reduction possible, lbs
Cost for best possible case

Public ParticipationPublic Participation§§ City of IndependenceCity of Independence
§§ City of MedinaCity of Medina
§§ City of LorettoCity of Loretto
§§ City of GreenfieldCity of Greenfield
§§ City of CorcoranCity of Corcoran
§§ Hennepin CountyHennepin County
§§ Independence Horse OwnersIndependence Horse Owners
§§ Summary of RepresentativesSummary of Representatives
§§ Summary of Stakeholder Group Summary of Stakeholder Group MeetingsMeetings
§§ Summary of Individual City Council Summary of Individual City Council MeetingsMeetings§§ Independence Horse OwnersIndependence Horse Owners
§§ PioneerPioneer--Sarah Creek Watershed Sarah Creek Watershed CommissionCommission
§§ Agricultural CommunityAgricultural Community
§§ Local CitizensLocal Citizens
§§ Lake Sarah Improvement AssociationLake Sarah Improvement Association
§§ Three Rivers Park DistrictThree Rivers Park District
§§ Minnesota Department of TransportationMinnesota Department of Transportation
MeetingsMeetings

Reports from CitiesReports from Cities

1
Lake Sarah Stakeholders Committee (LSSC) Meeting 1-25-2010 at Independence City Hall, 6:30 PM Meeting Minutes Harold Burrows, LSSC chair, called the meeting to order at approximately 6:35. Purpose of the meeting is to discuss the draft TMDL (Total Maximum Daily Load) that was made available several weeks earlier. He introduced Randy Lehr, Three Rivers Park District (TRPD). Randy and TRPD staff created the TMDL Report. Barb Peichel, Minnesota Pollution Control Agency (MPCA), and Marylee Murphy, TRPD, were also present to answer questions on the TMDL report. Randy asked how many had read the draft report. A few had. Randy’s goal is to summarize what’s in the document, summarize the process, explain what’s going to happen next, and field questions. Randy explained that the purpose of the TMDL was to determine what amount of phosphorous can get into the lake without causing algae blooms which are recreational nuisances. The TMDL helps provide a “line in the sand” to strive for in developing and implementing a phosphorous reduction strategy - with the goal being to get phosphorous loading below the line. He explained that the TMDL is a combination of a scientific and political process, and because of this, has to be divided into (4) segments based on the regulatory components that apply.
1. Waste Load Allocation (WLA) = Stormwater runoff from Municipal Separate Storm Sewer Systems (MS4) cities and other regulated entities.
2. Load Allocation (LA) = Stormwater runoff from Non-MS4 cities, internal phosphorus loading (recycled within the lake itself), plus atmospheric deposition.
3. Margin of Safety (MOS) = Factors applied to offset the uncertainty in models and analysis used.
4. Reserve Capacity (RC) = Factors applied to offset changes projected in the future. He showed a chart with a line representing the TMDL and a line representing where the lake is now. He stated that the goal is to get below the line, which will lead to water quality improvements. Randy explained that the TMDL will help identify policy ideas and technology that will help us get to from where we are to where we want to be. The TMDL is a summary of all the components required by the MPCA and U.S. Environmental Protection Agency (EPA). Some basic information was covered (cities involved, statistics about Lake Sarah, etc.). Where is phosphorous coming from? More than two years of monitoring water flow entering Lake Sarah via tributaries helps us understand the answer to this question. Note that both Total Phosphorous (TP) and Soluble Reactive Phosphorous (SRP) were monitored. TRPD used the following models to help determine where the phosphorous is coming from in an average year:

2
• Soil Water Assessment Tool (SWAT) - model for assessing agricultural areas and various other land uses.
• Program for Predicting Polluting Particle Passage thru Pits, Puddles, & Ponds (P8) - model for assessing urban areas
• Source Loading and Management Model (SLAMM) - model for determining runoff from roads & suburban developments
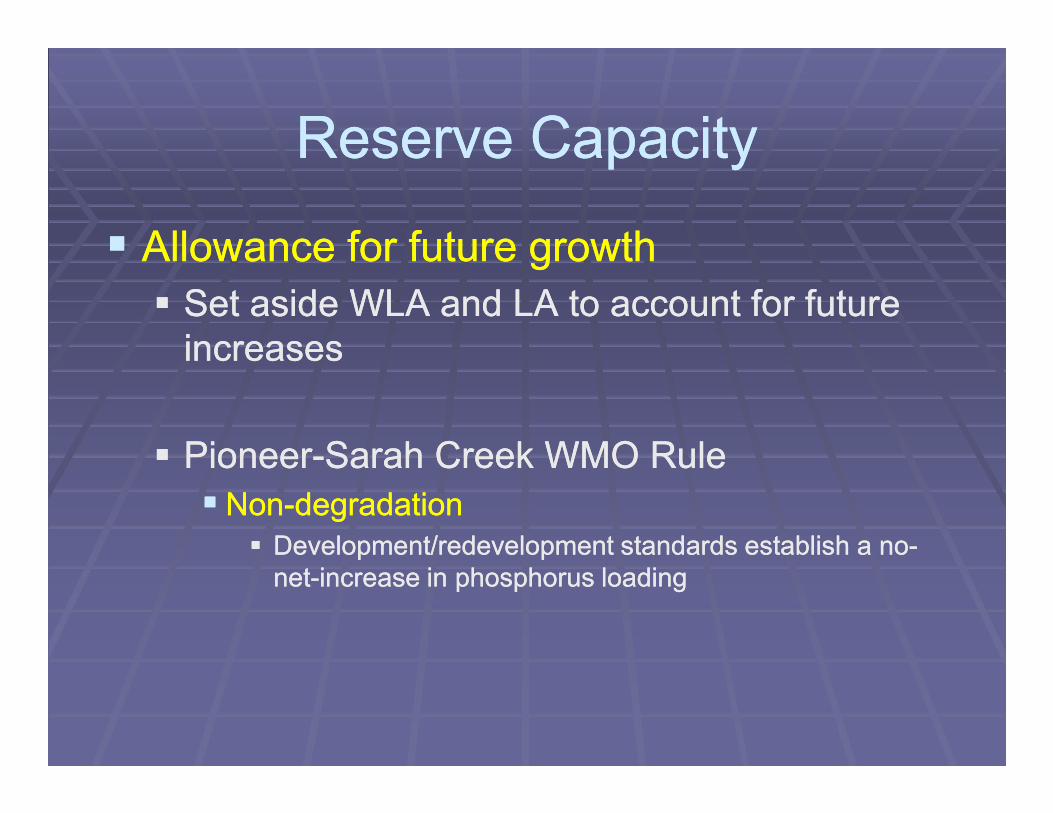
Monitoring data helps determine if the models are accurate. Randy was very comfortable with the numbers matching the models and reality – there was about a 1 to 20% deviation depending on the model used. He explained internal loading was coming from wind-blown elements getting into the lake, rain, sediments in the lake releasing phosphorous, and Curly Leaf Pondweed (CLP) releasing phosphorous into the water when it dies off. Phosphorous reductions each city needs to achieve in order to reach the TMDL goal were reviewed. The BATHTUB model was discussed. Numbers in the bathtub model projected and observed numbers were very similar. 1,356 lbs is Lake Sarah’s magic number. If we can get below that number, water quality will improve. Part of the Margin of Safety (MOS) was determined by LSSC. The State requires less than or equal to 40 micrograms per liter (ug/L) for phosphorus in a deep lake (North Central Hardwood Forest Ecoregion); LSSC established 36 ug/L as a target which is equal to about 198 lbs per year. Reserve Capacity. The Lake Sarah watershed is covered by the Pioneer-Sarah Creek Watershed Management Commission (PSCWMC) which has a non-degradation requirement which says that if land is converted from one use to another there will be no increase in phosphorous runoff. PSCWMC reviews permits to be certain they conform. Randy discussed concerns from some people that numbers did not add up to 100%, a point of confusion that’s come up on virtually every TMDL he’s been involved with. It does not mean to imply that, at the end of this, there is no phosphorous released from the sediments. Referring to the BATHTUB model, he said that there is always a background level of phosphorous that is automatically built into the model.
• Reduce phosphorous from MS4s – about 59%. • Reduce phosphorus from Non-MS4s - about 49%. • Reduce phosphorous from internal loading – about 1,800 lbs.
Randy explained that land area in the watershed was the criteria LSSC felt was most appropriate to use for allocation. Elizabeth Weir questioned differences in the figures from last year’s to now. Medina & Loretto stayed the same, while others went down. She questioned confidence in the models given the substantial difference. Randy credited the difference to their getting a better understanding of what the actual TMDL number was. Again he referred to the BATHTUB model and inputs to that model. He referred the question to Marylee. She said there had been a problem in the watershed model where at very low flows there was no phosphorous being transmitted into the stream. They had to recalibrate the model because they felt there was a lot more phosphorous

3
coming off the landscape than they were seeing in their data. Randy offered to discuss this further with Elizabeth when he had the information and figures in hand. Mike Peterson asked if runoff from lakeshore property was considered internal or external loading. It is considered external, part of the watershed. Brad Spencer asked why the report shows about 60% of the loading coming from external sources and 40% from internal, yet the targeted reductions are 60% for internal and 40% for external. Can the reductions be achieved? Randy answered that he felt both were accomplishable. He was encouraged by figures that showed the amount of phosphorous that could be removed was higher than what had to be removed to accomplish the water quality goals. Brad Spencer asked if Randy felt the projected expense for internal loading of $850,000 to $900,000 over 5 years was feasible and if it would accomplish the goal of reducing 1,800 lbs of phosphorous. He answered that with respect to the feasible numbers side, that he had almost no influence. If the folks around the lake feel it’s achievable, then it’s achievable. From a technical perspective, removing 1,800 lbs of phosphorous from the lake is no problem. Brad Spencer asked, is it was reasonable to allocate 1,800 lbs of reductions from internal sources and only 1,100 lbs from external, especially given there was excess capacity to make reductions in external loading. He asked if it was reasonable to expect reductions in internal loading to get back to baseline levels. Randy referred to the BATHTUB model and explained how it considered the relationship of phosphorous running off the landscape and the resulting phosphorous concentration in the lake. Adding that they knew how much phosphorous was washing off the landscape, because they’ve measured it, and modeled it, and the numbers are in pretty good alignment, that the internal loading percentage for Lake Sarah had to be increased to make the models work. Brad asked if reducing internal loading by 50% had ever been accomplished and can we have reasonable expectations that we can accomplish that? Randy answered yes and yes. He cited Lake Calhoun which had some of the worst water quality in the Metro over the last 50 years. They have an average now of 25 micrograms/liter. Calhoun received an alum treatment and other treatments and Bryant Lake is going to also. Elizabeth Weir asked how the internal loading was going to be funded. Randy replied funding was from a multitude of areas, and could come from Federal, State or Local sources. Examples are federal pass-through grants such as the 319 program (EPA) and state grants (some of which is from the new state constitutional amendment) from the Board of Water & Soil Resources (BWSR) or MPCA. Right now TRPD has a 319 grant for work on Lake Independence. There is also state constitutional amendment funding through the Lessard-Sams Outdoor Heritage Council most of which is habitat focused. Local funding could also be a source of funding (i.e. watershed commission and individual municipalities). The required phosphorus reduction in the legal component of this report is the Waste Load Allocation (WLA). For example, that reduction number goes into each regulated MS4 city permit. They have to demonstrate progress. There is no regulatory requirement for the Load Allocation portion to reduce phosphorus loading to Lake Sarah.

4
Elizabeth Weir mentioned that grant funding for internal and external reductions did not match the projected costs. Randy said that was a pretty realistic way of looking at it. Sylvia Walsh asked what would be the most likely funding for reducing internal phosphorus loading and treatment of CLP. Randy said the Minnesota Department of Natural Resources (DNR) has programs for treatment of CLP and invasive species, which generally falls short of wide-spread implementation. He cited a restoration project in Lake Rebecca that’s getting funding from the Lessard-Sams Outdoor Heritage Council. He also stated that the Clean Water Fund (as mentioned above) will also have implementation funds available through BWSR. Funds from the DNR are not likely without a Lake Vegetation Management Plan, and funds from other sources are not likely without a completed TMDL and the Implementation Plan that goes along with it. Brad Spencer questioned what determines whether a city becomes a regulated MS4. Barb Peichel answered that population and growth projections were the criteria (for example, Greenfield is not in the “Twin Cities urban area” according to the most recent Census data and their current and projected population is less than 5,000 people). He asked if there was a trigger besides the 5,000 population (according to MPCA, there is also a petition process that could be used to designate Greenfield as a regulated MS4. Barb said there were a lot of non-MS4 cities that were making progress on pollution reductions. Randy mentioned that he felt it was in Greenfield’s best interest to do what they could in response to the TMDL. Harold Burrows asked what happens if Greenfield does nothing. Randy’s response was that he didn’t think that would be the case. Especially given that funding dollars were more readily available now than they will likely be years from now. Concerns were raised that if Greenfield doesn’t participate we won’t reach the targeted goals. Mike Peterson asked how Lake Sarah’s ratios for watershed runoff and lake residence times compared with other lakes in MN and Hennepin County. Randy said comparable. Mike also asked if more current macrophyte (aquatic plant) studies than 2006 existed and Randy said yes. Randy discussed the proposed Best Management Practices (BMPs) for the land areas in the individual municipalities. Then he discussed in-lake control, namely reducing CLP and sequestration of phosphorous in the lake by doing an Alum treatment. An alum treatment binds the phosphorous that is in the lake water column and this “floc” sinks it to the bottom. The Alum treatment would be done in the deeper portions of Lake Sarah, approximately 200 acres. He referred to the implementation section and Appendix B in the draft TMDL document. He explained that reducing CLP & Alum treatments are the most common treatments for reducing internal lake sources of phosphorus. Randy also mentioned some other alternatives that could be discussed in future implementation plans if needed for in-lake phosphorus loading treatments. These include:
• Aeration, where air is pumped into the water. There is a project on Sweeney Lake that’s using this technique. It is achieving mixed results and is expensive.
• Hypolimnetic Withdrawal, which uses the fact that sediments release phosphorous into the water. You would run a pipe to the deeper parts of the lake, which are phosphorous
5
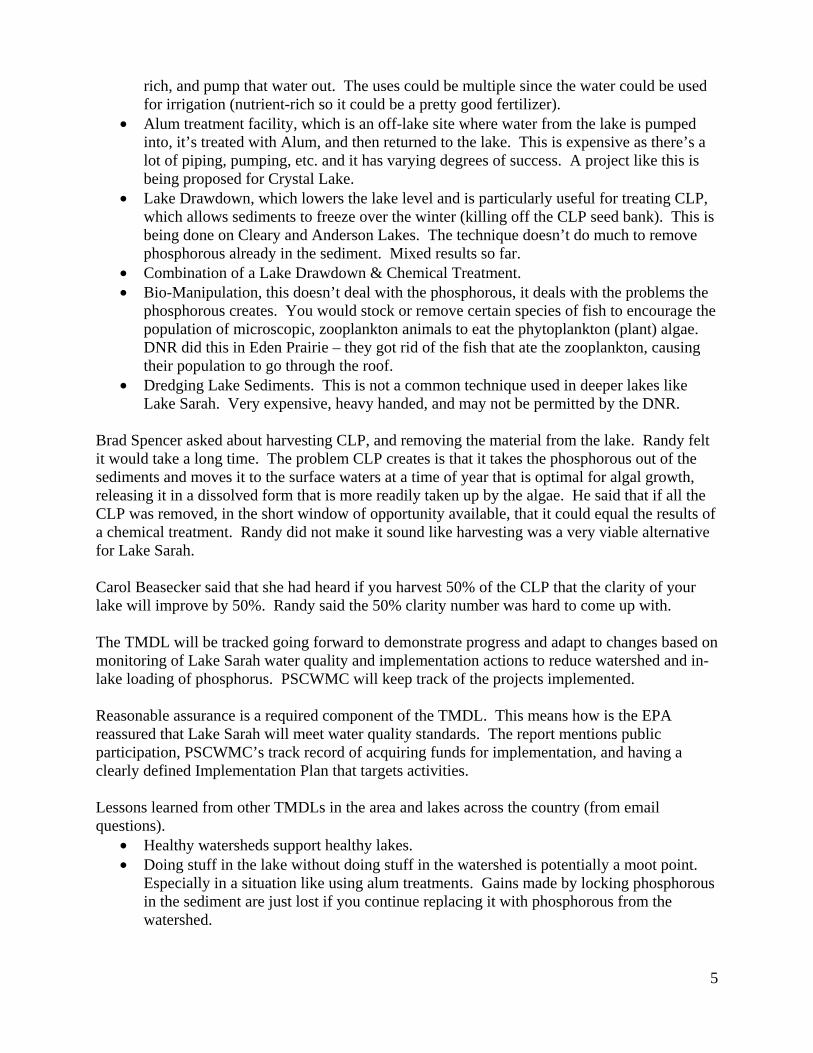
rich, and pump that water out. The uses could be multiple since the water could be used for irrigation (nutrient-rich so it could be a pretty good fertilizer).
• Alum treatment facility, which is an off-lake site where water from the lake is pumped into, it’s treated with Alum, and then returned to the lake. This is expensive as there’s a lot of piping, pumping, etc. and it has varying degrees of success. A project like this is being proposed for Crystal Lake.
• Lake Drawdown, which lowers the lake level and is particularly useful for treating CLP, which allows sediments to freeze over the winter (killing off the CLP seed bank). This is being done on Cleary and Anderson Lakes. The technique doesn’t do much to remove phosphorous already in the sediment. Mixed results so far.
• Combination of a Lake Drawdown & Chemical Treatment. • Bio-Manipulation, this doesn’t deal with the phosphorous, it deals with the problems the
phosphorous creates. You would stock or remove certain species of fish to encourage the population of microscopic, zooplankton animals to eat the phytoplankton (plant) algae. DNR did this in Eden Prairie – they got rid of the fish that ate the zooplankton, causing their population to go through the roof.
• Dredging Lake Sediments. This is not a common technique used in deeper lakes like Lake Sarah. Very expensive, heavy handed, and may not be permitted by the DNR.
Brad Spencer asked about harvesting CLP, and removing the material from the lake. Randy felt it would take a long time. The problem CLP creates is that it takes the phosphorous out of the sediments and moves it to the surface waters at a time of year that is optimal for algal growth, releasing it in a dissolved form that is more readily taken up by the algae. He said that if all the CLP was removed, in the short window of opportunity available, that it could equal the results of a chemical treatment. Randy did not make it sound like harvesting was a very viable alternative for Lake Sarah. Carol Beasecker said that she had heard if you harvest 50% of the CLP that the clarity of your lake will improve by 50%. Randy said the 50% clarity number was hard to come up with. The TMDL will be tracked going forward to demonstrate progress and adapt to changes based on monitoring of Lake Sarah water quality and implementation actions to reduce watershed and in-lake loading of phosphorus. PSCWMC will keep track of the projects implemented. Reasonable assurance is a required component of the TMDL. This means how is the EPA reassured that Lake Sarah will meet water quality standards. The report mentions public participation, PSCWMC’s track record of acquiring funds for implementation, and having a clearly defined Implementation Plan that targets activities. Lessons learned from other TMDLs in the area and lakes across the country (from email questions).
• Healthy watersheds support healthy lakes. • Doing stuff in the lake without doing stuff in the watershed is potentially a moot point.
Especially in a situation like using alum treatments. Gains made by locking phosphorous in the sediment are just lost if you continue replacing it with phosphorous from the watershed.

6
• Lakeshore habitat is the single best indicator of lake quality. The riparian or shoreline habitat quality is a stronger predictor of lake quality than any other measure. Habitat for fish and zooplankton help control the algal blooms.
• Proactive development is more efficient than reactive development. That’s good for Lake Sarah, because the watershed is still relatively undeveloped, making it more economical and efficient to develop and implement plans. Medicine Lake was referred to as a developed watershed with high implementation costs.
• Ecosystem based restoration is a long-term solution. It specifically targets phosphorous, which is what impairs Lake Sarah. We know a lot about how healthy lakes and watersheds function. And it’s not only about phosphorous. Looking upstream for solutions can provide the benefit of killing two birds with one stone, for lack of a better term. This is the situation Medicine Lake is looking at. It’s critical to look at the ecosystem as a whole, into the future, and address multiple problems so we don’t have to revisit them down the road.
• Community support is essential. Their buy-in is essential to getting projects off the ground.
A question was asked about accuracy of models used during 2 years of low flow. Randy replied that’s why we have follow-up monitoring proposed, to validate the models. He also stated that very-early-season runoff, primarily from snowmelt in the immediate stream flows, is responsible for some of the highest loading during the year, adding that this was somewhat factored into the models but not completely. Brad Spencer mentioned that this isn’t the first time we’ve tried to fix this lake, Hennepin Conservation District (HCD) tried in 1995. We didn’t get too far, but we did dig two settling ponds on Loretto Creek in the East watershed. Did your monitoring show any benefits from these ponds? Randy answered yes, stating that the new proposed project between Loretto and Medina will tie into it. Someone stated that Medina is involved with four formal TMDLs. They asked what happens if they can’t get the money to make these pollution reductions? Randy replied that some TMDL projects require immediate funding, others, like some of the BMPs in this report can be approached more during redevelopment. For example, you could come up with a goal for phosphorous reduction during redevelopment activities where we convert the land from this to that, and in the process, state that we want this amount of phosphorous coming off of it. It can be a win-win for development. As a different example, you could do a soil test for phosphorous and compare the results to the needs of a crop. If the phosphorous already existing in the soil is all the crop needs, you could save costs by not adding more nutrients and there would be less in the runoff. Several questions were asked about implementation plans and costs relating to CLP treatment. Randy said that he believed homeowners could opt-out of having their property treated in the event of a whole-lake chemical treatment for CLP. Brad Spencer asked who was responsible for future monitoring. Randy replied that there is nobody that’s legally responsible for doing it, but felt that current funding sources and TRPD would play a role in the future.

7
Someone asked if there was a plan to do a lake-wide treatment for weeds (CLP) in 2010. Randy said there was not an approved LVMP (Lake Vegetation Management Plan) for Lake Sarah, which would need to happen in order for a lake-wide treatment to take place (to get a permit from DNR). Also, someone would have to secure funding to support a lake-wide chemical treatment of CLP so individuals should continue to treat their own shoreline if they wish. Randy discussed what happens next:
• They will collect comments from citizens and various agencies, revise the Draft TMDL Report, and send it to EPA for “preliminary review”.
• Then the document will be revised based on EPA preliminary comments if needed. • Then, the report goes out for a 30-day official public comment period that is announced
in the State register. • After revising the document based on public comments, it will need to be reviewed and
officially approved by both MPCA and EPA. • During that process, TRPD will be fleshing out the Implementation Plan - providing more
detail and supporting material to go along with the Appendix B (of the Draft TMDL) and the summarized implementation strategies section. So that information will become a stand-alone document that we will be looking at for more input. This Implementation Plan will try to articulate specific implementation projects that have been identified during the process. It will be particularly important that entities consider listing these activities in their Capital Improvement Program (CIP).
Elizabeth Weir asked a multi-part question about the estimated $8,600 cost for buffer strips. She asked if that was per year, what it buys, how it works — we have no say in how farmers manage their land. Randy explained that the $8,600 figure is the average cost per acre to build a buffer and that the figure did not include any payments to the farmer to compensate them for the land used. Elizabeth then asked, what happens when the farmer has no interest in building a buffer? Randy responded that there are different strategies, some offer compensation, like the Conservation Reserve Enhancement Program (CREP), tax breaks may be given when land is taken out of production. Others have looked at mixed-use riparian areas where instead of a corn crop they might have a more perennial crop, like a fast-growing poplar tree, that’s harvested every 15 to 20 years versus every year. Elizabeth expressed concern about lack of funds, and the difficulty in matching requirements for grant money, especially as Medina is facing three additional TMDLs. Barb Peichel responded that a lot of the constitutional amendment money that’s going through BWSR does not require the same amount of matching funds. She suggested looking at the funding rounds from last year and the types of projects BWSR was approving. She suggested grant proposals combine surface water projects with internal-loading projects because internal-loading projects are not likely to be considered as strongly by BWSR, because of the way the legislative language is written. Someone said, the reality is, it’s so competitive that if you don’t have a match. He’d just looked at the last round of BWSR funding and the match was over 50%. He said there trying to get as much bang for the buck with the State money and local money. Barb explained that the match can be in-kind and a lot of different things; that it doesn’t have to be cost on the table from a city fund. She knows that the cities are strapped.

8
Elizabeth Weir asked who receives information about the grants. Randy said your watershed representative should have all the grant forms. He went on to say, particularly in areas where redevelopment is occurring, that achieving the goals of the TMDL will have to be approached in a combination of ways. He said that while he could not say how the MPCA would interpret (projects undertaken by Medina), that if they could demonstrate efforts to reduce the phosphorous long-term on redevelopment projects that he felt they would look at if favorably. That showing efforts to get there faster would be a pretty compelling argument. A question was asked, how long do the cities have to demonstrate results before the MPCA and EPA come in and tell the cities what has to be done? Barb Peichel responded - the way the stormwater language reads presently for a Phase-2 MS4 permit is to show progress. She stated that the MPCA was working on the revising the permit language and that she expected it would become more specific for MS4 cities. Harold Burrows asked when the expected time for the next public forum was. Barb Peichel responded that she felt it would be when the Implementation Plan was drafted. Randy said that they would be considering feedback from this meeting and agencies involved, and at the same time would be working on developing the Implementation Plan. When they have the plan fleshed out and the detail that they plan on having would be a good time for a public meeting. It will probably take at least 30-60 days for a finalized draft of the TMDL document to send to EPA for preliminary review. Brad Spencer asked if the meeting should be after the MPCA and other agencies have reviewed it, but before it’s sent to the EPA. Barb Peichel said that they were trying as a State to send TMDLs to the EPA for informal comments first, which takes 30 days, and that it would be a good time to have a public meeting after the EPA’s comments were incorporated. At that time the TMDL would be put up for official public notice for 30 days and that Randy would have the Implementation Plan drafted. At that time the TMDL will be more shaped up and we will have a draft Implementation Plan and that would be a good time for a public meeting. Harold Burrows added that he’s been doing this for more than five years and that he would like someone to take his place as chair. He felt that this was going to be turned over to Randy and Barb’s groups (TRPD & MPCA) so if someone would be interested in taking over for him he’d appreciate it. Notes compiled by Mike Peterson. *Note that not all questions/answers were noted in this summary as some were not picked up by the audio equipment. Meeting was adjourned.