Embed Size (px)
Citation preview

Final Report Nutrient TMDLs for Lake Alma (WBID 2986D) and Lake Searcy
(WBID 2986E) and Documentation in Support of
Development of Site-Specific Numeric Interpretations
of the Narrative Nutrient Criterion Kyeongsik Rhew
Water Quality Evaluation and TMDL Program Division of Environmental Assessment and Restoration
Florida Department of Environmental Protection
March 2018
Page 2 of 73
2600 Blair Stone Road Tallahassee, FL 32399-2400
www.dep.state.fl.us Acknowledgments
This analysis could not have been accomplished without significant contributions from staff in the Florida Department of Environmental Protection's Watershed Assessment Section, Standards Development Section, and Watershed Evaluation and TMDL Section; and Seminole County.
Editorial assistance was provided by Erin Rasnake, Ansel Bubel, Daryll Joyner, Jessica Mostyn, Kevin ODonnell, Robert Wiwi, Moira Homann, and Linda Lord.
Map production assistance was provided by Andrew Morris.
Access to all data used in the development of this report can be obtained by contacting:
Kyeongsik Rhew Florida Department of Environmental Protection Water Quality Evaluation and TMDL Program Watershed Evaluation and TMDL Section 2600 Blair Stone Road, Mail Station 3555 Tallahassee, FL 32399-2400 Email: Kyeongsik Rhew Phone: (850) 245–8461 For additional information on the watershed management approach and impaired waters in the Middle St. John River Basin, contact:
Moira Homann Florida Department of Environmental Protection Watershed Planning and Coordination Section 2600 Blair Stone Road, Mail Station 3565 Tallahassee, FL 32399-2400 Email: Moira Homann Phone: (850) 245–8460

Page 3 of 73
Contents
Acknowledgments _________________________________________________ 2
Contents _________________________________________________________ 3
Chapter 1: Introduction ____________________________________________ 9 1.1 Purpose of Report _______________________________________________________9 1.2 Identification of Waterbody _______________________________________________9 1.3 Background ___________________________________________________________10
Chapter 2: Description of Water Quality Problem _____________________ 12 2.1 Statutory Requirements and Rulemaking History ___________________________12 2.2 Information on Verified Impairment ______________________________________12
Chapter 3. Description of Applicable Water Quality Standards and Targets 14 3.1 Classification of the Waterbody and Criterion Applicable to the TMDLs ________14 3.2 Applicable Water Quality Standards and Numeric Water Quality Target _______14
3.2.1 Numeric Interpretation of the Narrative Nutrient Criterion __________________14 3.2.2 Target Chlorophyll a Concentrations and Nutrient Criteria (TN and TP loads)
Established Based on the Modeling Approach ____________________________16 3.2.3 Downstream Protection _____________________________________________18
Chapter 4: Assessment of Sources ___________________________________ 19 4.1 Types of Sources _______________________________________________________19 4.2 Potential Nutrient Sources in the Lake Alma and Lake Searcy Watersheds ______19
4.2.1 Point Sources _____________________________________________________19 4.2.2 Nonpoint Sources __________________________________________________20
Chapter 5: Determination of Assimilative Capacity ____________________ 34 5.1 Determination of Loading Capacity _______________________________________34 5.2 Historical TN, TP, and Chlorophyll a Trends in Lake Alma and Lake Searcy ____34 5.3 Hydrodynamic and Water Quality Models for Lake Alma and Lake Searcy _____44
5.3.1 EFDC Model _____________________________________________________45 5.3.2 WASP Model _____________________________________________________46 5.3.3 Natural Background Conditions _______________________________________50 5.3.4 Setting up the Chlorophyll a Criteria ___________________________________51 5.3.5 Load Reduction Scenarios in the WASP Model to Determine the TMDLs______52 5.3.6 Calculation of the TMDLs ___________________________________________53 5.3.7 Critical Conditions and Seasonal Variation ______________________________53
Chapter 6: Determination of the TMDL ______________________________ 58 6.1 Expression and Allocation of the TMDLs __________________________________58 6.2 Load Allocation ________________________________________________________59 6.3 Wasteload Allocation ___________________________________________________59

Page 4 of 73
6.3.1 NPDES Wastewater Discharges _______________________________________59 6.3.2 NPDES Stormwater Discharges _______________________________________59
6.4 Margin of Safety _______________________________________________________60
Chapter 7: TMDL Implementation __________________________________ 61 7.1 Implementation Mechanisms _____________________________________________61 7.2 BMAPs 61 7.3 Implementation Considerations for Lake Alma and Lake Searcy _______________61
References ______________________________________________________ 63
Appendices ______________________________________________________ 64 Appendix A: Summary of Information in Support of Site-Specific Interpretations of the Narrative Nutrient Criterion for Lake Alma and Lake Searcy ____________________64 Appendix B: Background Information on Federal and State Stormwater Programs __71 Appendix C: Important Links _______________________________________________73

Page 5 of 73
List of Tables
Table 2.1. Calculated AGM of chlorophyll a, TN, and TP concentrations in Lake Alma and Lake Searcy, 2003–14 ........................................................................... 13
Table 3.1. Chlorophyll a, TN, and TP criteria for Florida lakes (Subparagraph 62-302.531[2][b]1., F.A.C.)......................................................................................... 15
Table 3.2. Site-specific interpretations of the narrative nutrient criterion .............................. 17 Table 4.1. SJRWMD land use categories and their corresponding acreage in the Lake
Alma and Lake Searcy Watersheds ........................................................................ 23 Table 4.2. Acreage of hydrologic soil groups in the Lake Alma and Lake Searcy
Watersheds ............................................................................................................. 26 Table 4.3. Annual rainfall in the Lake Alma and Lake Searcy Watersheds, 2003–14 ........... 30 Table 4.4a. Summary of inflows to the Lake Alma Watershed by source and year ................. 30 Table 4.4b. Summary of inflows to the Lake Searcy Watershed by source and year ............... 31 Table 4.5a. Summary of TN loading to Lake Alma by source and year ................................... 32 Table 4.5b. Summary of TN loading to Lake Searcy by source and year ................................. 32 Table 4.6a. Summary of TP loading to Lake Alma by source and year ................................... 33 Table 4.6b. Summary of TP loading to Lake Searcy by source and year ................................. 33 Table 5.1a. AGMs for TN, TP, and chlorophyll a in Lake Alma, 2004–14 ............................. 37 Table 5.1b. AGMs for TN, TP, and chlorophyll a in Lake Searcy, 2003–14 ........................... 37 Table 5.2a. Seasonal variation of TN, TP, and chlorophyll a in Lake Alma; long-term
mean of monthly means ......................................................................................... 38 Table 5.2b. Seasonal variation of TN, TP, and chlorophyll a in Lake Searcy; long-term
mean of monthly means ......................................................................................... 38 Table 5.3. Lake Searcy WASP model water quality parameters ............................................ 47 Table 5.4a. Lake Alma existing simulation results for TN, TP, and chlorophyll a
concentrations (AGMs) using the WASP model ................................................... 48 Table 5.4b. Lake Searcy existing simulation results for TN, TP, and chlorophyll a
concentrations (AGMs) using the WASP model ................................................... 48 Table 5.5a. Summary of WASP calibration statistics for water quality parameters for
Lake Alma .............................................................................................................. 49 Table 5.5b. Summary of WASP calibration statistics for water quality parameters for
Lake Searcy ............................................................................................................ 49 Table 5.6a. Lake Alma natural background simulation results for TN, TP, and
chlorophyll a concentrations (AGMs) using the WASP model ............................. 50 Table 5.6b. Lake Searcy natural background simulation results for TN, TP, and
chlorophyll a concentration s (AGMs) using the WASP model ............................ 51 Table 5.7a. Load reduction scenarios for TN under the existing (from the HSPF model)
and TMDL condition (37 % reduction) in Lake Alma. Red highlighting and asterisk represent the TMDL. ................................................................................. 56

Page 6 of 73
Table 5.7b. Load reduction scenarios for TP under the existing (from the HSPF model) and TMDL condition (15 % reduction) in Lake Alma. Red highlighting and asterisk represent the TMDL. ................................................................................. 56
Table 5.8a. Load reduction scenarios for TN under the existing (from the HSPF model) and TMDL condition (61 % reduction) in Lake Searcy. Red highlighting and asterisk represent the TMDL. .......................................................................... 57
Table 5.8b. Load reduction scenarios for TP under the existing (from the HSPF model) and TMDL condition (36 % reduction) in Lake Searcy. Red highlighting and asterisk represent the TMDL. .......................................................................... 57
Table 6.1. TMDL components for nutrients in Lake Alma (WBID 2986D) and Lake Searcy (WBID 2986E) ........................................................................................... 59
Table A-1. Spatial extent of the waterbody where the site-specific numeric interpretation of the narrative nutrient criterion will apply .................................... 64
Table A-2. Default NNC, site-specific interpretations of the narrative criterion developed as TMDL targets, and data used to develop the site-specific interpretation of the narrative criterion .................................................................. 65
Table A-3. History of nutrient impairment, quantitative indicators of designated use support, and methodologies used to develop the site-specific interpretation of the narrative criterion ......................................................................................... 67
Table A-4. Site-specific interpretation of the narrative criterion and the protection of designated use for downstream segments .............................................................. 69
Table A-5. Public participation and legal requirements of rule adoption ................................. 70

Page 7 of 73
List of Figures Figure 1.1. Location of Lake Alma (WBID 2986D) and Lake Searcy (WBID 2986E) in
the Middle St. Johns River Basin and major geopolitical and hydrologic features in the area .................................................................................................. 11
Figure 4.1. Delineation of the Lake Alma and Lake Searcy Watersheds ................................. 22 Figure 4.2. Spatial distribution of land uses in the Lake Alma and Lake Searcy
Watersheds ............................................................................................................. 25 Figure 4.3. Soil hydrologic groups in the Lake Alma and Lake Searcy Watersheds
(NRCS 2010) .......................................................................................................... 27 Figure 4.4. OSTDS distribution in the Lake Alma and Lake Searcy Watersheds .................... 28 Figure 5.1. Locations of water quality stations in Lake Alma and Lake Searcy ...................... 36 Figure 5.2a. TN concentrations measured in Lake Alma, 2004–14 ........................................... 39 Figure 5.2b. TP concentrations measured in Lake Alma, 2004–14 ............................................ 39 Figure 5.2c. Chlorophyll a concentrations measured in Lake Alma, 2004–14. ......................... 39 Figure 5.3a. TN concentrations measured in Lake Searcy, 2003–14 ......................................... 41 Figure 5.3b. TP concentrations measured in Lake Searcy, 2003–14 .......................................... 41 Figure 5.3c. Chlorophyll a concentrations measured in Lake Searcy, 2003–14. ....................... 41 Figure 5.4a. Monthly variations in TN, TP, (2004–14) and chlorophyll a (2009–14)
concentrations measured in Lake Alma. Bars indicate standard errors. ................ 42 Figure 5.4b. Monthly variations in TN, TP, (2003–14) and chlorophyll a (2012 and
2014) concentrations measured in Lake Searcy. Bars indicate standard errors. ...................................................................................................................... 43
Figure 5.5a. Lake Alma EFDC model grid ................................................................................ 45 Figure 5.5b. Lake Searcy EFDC model grid .............................................................................. 46 Figure 5.6. WASP Model Simulated chlorophyll a concentration in time series for
existing (blue line), natural background (black line), and 37 % TN and 15 % TN reductions (red line) in Lake Alma .............................................................. 54
Figure 5.7. AGMs of chlorophyll a for existing (purple bars), natural background (gray bars), and TMDL conditions (blue bars) in Lake Alma. The red lines represent the chlorophyll a target of 30 µg/L. ........................................................ 54
Figure 5.8. WASP Model Simulated chlorophyll a concentration in time series for existing (blue line), natural background (black line), and 61 % TN and 36 % TN reductions (red line) in Lake Searcy ............................................................ 55
Figure 5.9. AGMs of chlorophyll a for existing (purple bars), natural background (gray bars), and TMDL conditions (blue bars) in Lake Searcy. The red lines represent the chlorophyll a target of 20 µg/L. ........................................................ 55

Page 8 of 73
Websites Florida Department of Environmental Protection
TMDL Program Identification of Impaired Surface Waters Rule Florida STORET Program 2016 Integrated Report Criteria for Surface Water Quality Classifications Surface Water Quality Standards
U.S. Environmental Protection Agency
Region 4: TMDLs in Florida National STORET Program

Page 9 of 73
Chapter 1: Introduction
1.1 Purpose of Report This report presents the total maximum daily loads (TMDLs) developed to address the nutrient impairments of Lake Alma and Lake Searcy, located in the Middle St. John River Basin. The TMDLs constitute the site-specific numeric interpretation of the narrative nutrient criterion set forth in Paragraph 62-302.530(90)(b), Florida Administrative Code (F.A.C.), that will replace the otherwise applicable numeric nutrient criteria (NNC), for the Lakes, pursuant to Paragraph 62-302.531(2)(a), F.A.C. The waterbodies were verified as impaired for nutrients using the methodology in the Identification of Impaired Surface Waters Rule (IWR) (Chapter 62-303, F.A.C.), and were included on the Verified List of Impaired Waters for the Middle St. John River Basin adopted by Secretarial Order on May 27, 2004.
The TMDL process quantifies the amount of a pollutant that can be assimilated in a waterbody, identifies the sources of the pollutant, and provides water quality targets needed to achieve compliance with applicable water quality criteria based on the relationship between pollution sources and water quality in the receiving waterbody. The TMDLs establish the allowable loadings to Lake Alma and Lake Searcy that would restore these waterbodies so that they meet the applicable water quality criteria for nutrients.
1.2 Identification of Waterbody Lake Alma is a 3-acre lake located in the Soldier Creek Watershed in unincorporated Seminole County, 15 miles north of Orlando. Lake Searcy is a 13-acre lake located in the City of Longwood and to the south of Lake Alma. The lakes are less than a mile apart. Lake Alma drains a watershed of 258 acres (0.40 square miles) and Lake Searcy a 284-acre watershed (0.44 square miles). Lake Alma is surrounded mainly by pasture and wetland. Lake Searcy is surrounded by a thick wetland area (180 to 1,207 feet from the edge of the lake) that limits direct access to the lake, while the rest of the watershed is mostly residential.
According to the U.S. Census Bureau, the population in Seminole County and the City of Longwood in 2015 is 449,149 and 14,085, respectively. From 2010 through 2015, the population of Seminole County and Longwood increased by 6.3 % and 3.1 %, respectively. Population growth in the area continues but remains lower than the statewide average increase of 7.8 %.
There are no major inlet streams to either lake. The major sources of water include surface runoff from the watersheds, seepage flow from groundwater, and direct rainfall onto the lakes.
For assessment purposes, the Florida Department of Environmental Protection (DEP) divided the Middle St. John River Basin (Hydrologic Unit Code [HUC] 03080101) into watershed assessment polygons with a unique waterbody identification (WBID) number for each watershed or surface water segment. Lake Alma is WBID 2986D and Lake Searcy is WBID 2986E. This

Page 10 of 73
TMDL report addresses the nutrient impairment of the lakes. Figure 1.1 shows the location of the WBIDs in Seminole County, along with the major geopolitical and hydrologic features in the area.
1.3 Background This report was developed as part of DEP's watershed management approach for restoring and protecting state waters and addressing TMDL Program requirements. The watershed approach, which is implemented using a cyclical management process that rotates through the state's 52 river basins over a 5-year cycle, provides a framework for implementing the TMDL Program–related requirements of the 1972 federal Clean Water Act (CWA) and the Florida Watershed Restoration Act (FWRA).
A TMDL represents the maximum amount of a given pollutant that a waterbody can assimilate and still meet water quality standards, including its applicable water quality criteria and its designated uses. TMDLs are developed for waterbodies that are verified as not meeting their water quality standards and provide important water quality goals that will guide restoration activities.
This TMDL report will be followed by the development and implementation of a restoration plan to reduce the amount of nutrients that caused the verified impairments of Lake Alma and Lake Searcy. These activities will depend heavily on the active participation of the St. Johns River Water Management District (SJRWMD), local governments, businesses, and other stakeholders. DEP will work with these organizations and individuals to undertake or continue reductions in the discharge of pollutants and achieve the established TMDLs for impaired waterbodies.

Page 11 of 73
Figure 1.1. Location of Lake Alma (WBID 2986D) and Lake Searcy (WBID 2986E) in the Middle St. Johns River Basin and major geopolitical and hydrologic features in the
area
Page 12 of 73
Chapter 2: Description of Water Quality Problem
2.1 Statutory Requirements and Rulemaking History Section 303(d) of the CWA requires states to submit to the U.S. Environmental Protection (EPA) a list of surface waters that do not meet applicable water quality standards (impaired waters) and establish a TMDL for each pollutant source in each of these impaired waters on a schedule. DEP has developed these lists, commonly referred to as 303(d) lists, since 1992. The list of impaired waters in each basin is also required by the FWRA (Subsection 403.067[4], Florida Statutes [F.S.]), and the list is amended annually to include updates for each basin statewide.
Florida's 1998 303(d) list included 22 waterbodies in the Middle St. Johns River Basin. However, the FWRA (Section 403.067, F.S.) stated that all previous Florida 303(d) lists were for planning purposes only and directed DEP to develop, and adopt by rule, a new science-based methodology to identify impaired waters. After a long rulemaking process, the Environmental Regulation Commission adopted the new methodology as Chapter 62-303, F.A.C. (the IWR), in April 2001. The rule was modified in 2006, 2007, 2012, and 2013. The list of waters for which impairments have been verified using the methodology in the IWR is referred to as the Verified List.
2.2 Information on Verified Impairment DEP used the IWR to assess water quality impairments in Lake Alma and Lake Searcy. Both lakes were verified as impaired for nutrients based on elevated annual average Trophic State Index (TSI) values during Cycle 1 (verified period, January 1, 1996–June 30, 2003) for the Middle St. Johns Basin, a Group 2 basin. When the Cycle 1 assessment was performed, the IWR methodology used the water quality variables total nitrogen (TN), total phosphorus (TP), and chlorophyll a (a measure of algal mass) to calculate annual TSI values that were used to interpret Florida's narrative nutrient threshold.
The TSI is calculated based on concentrations of TP, TN, and chlorophyll a. The TSI thresholds were set based on annual mean color, where high-color lakes (> 40 platinum cobalt units [PCU]) had a TSI threshold of 60, and lower color lakes (≤ 40 PCU) had a TSI threshold of 40. Exceeding the TSI threshold in any single year of the verified period was sufficient to identify a lake as impaired for nutrients. For the Cycle 1 assessment, Lake Alma and Lake Searcy were classified as high-color lakes and were assessed against the TSI threshold of 60. For Lake Alma, annual mean TSI values exceeded the impairment threshold of 60 from 1997 to 2000. For Lake Searcy, annual mean TSI values exceeded the impairment threshold of 60 from 1998 to 2002.
Both lakes initially remained impaired for the Cycle 2 assessments (verified period, January 1, 2001–June 30, 2008). However, in 2010, both were removed by amendment from the Verified List based on a flaw in the original analysis, because the original listing was based predominantly on LakeWatch data. LakeWatch data could not be used for regulatory purposes

Page 13 of 73
because they did not meet Quality Assurance (QA) Rule requirements (i.e., they were not collected using approved methods). However, in 2013, DEP approved alternative methods for LakeWatch projects, including data usability. Based on those assessment results and the coinciding amendment in 2014, both lakes ultimately remained on the Verified List. The Cycle 2 data were insufficient to calculate annual means in the verified period, but for both Lake Alma and Lake Searcy the planning period assessment indicated potential impairments (the TSI of 60 was exceeded in 2005 for the former, and from 1998 to 2002 for the latter).
In 2012, the IWR was amended to incorporate the numeric interpretations of Florida's narrative criterion (Rule 62-302.531, F.A.C.). Under the revised methodology, lakes are assessed for chlorophyll a, TN, and TP as individual parameters and the TSI is no longer used. In Cycle 3 the IWR methodology reflected this rule amendment. Each lake was determined to be a high color lake and assessed using an annual geometric mean (AGM) corrected chlorophyll a criterion of 20 micrograms per liter (µg/L), a TN criterion range of 1.27 to 2.23 milligrams per liter (mg/L) and a TP criterion range of 0.05 to 0.16 mg/L. These numeric interpretations vary annually depending on chlorophyll a data.
At the time of the Group 2 Cycle 3 assessments, waterbodies previously impaired for TSI were delisted per Paragraph 62-303.720(2)(l), F.A.C. and reevaluated using the NNC for lakes. Lake Alma was found to be impaired for chlorophyll a (exceeding the AGM of 20 µg/L in 2005, 2011, 2012, 2014), TN (exceeding the AGM of 1.27 mg/L in 2005–12, 2014), and TP (exceeding the AGM of 0.05 mg/L in 2006–12, 2014) (Table 2.1). Lake Searcy was assessed as meeting the listing requirements for the planning list for chlorophyll a and verified list as impaired for TP (2003–04, 2009, 2012). TN was assessed as not impaired for the lake (Table 2.1).
Table 2.1. Calculated AGM of chlorophyll a, TN, and TP concentrations in Lake Alma and Lake Searcy, 2003–14
ND = No data; ID = Insufficient data; Shaded cells and bold numbers represent the exceedance.
Year
Lake Alma AGM Chlorophyll a
(µg/L)
Lake Alma AGM TN
(mg/L)
Lake Alma AGM TP
(mg/L)
Lake Searcy AGM Chlorophyll a
(µg/L)
Lake Searcy AGM TN
(mg/L)
Lake Searcy AGM TP
(mg/L) 2003 ND ND ND 48 1.11 0.06 2004 ND ID ID 22 0.97 0.06 2005 30 1.95 0.04 24 1.01 0.05 2006 ND 2.57 0.12 16 0.84 0.04 2007 ND 2.84 0.14 ND 1.16 0.05 2008 ND 1.90 0.15 ND 1.04 0.05 2009 ID 2.89 0.20 ND 1.08 0.06 2010 ID 2.19 0.12 ND 1.26 0.05 2011 26 2.05 0.09 ID ID ID 2012 27 2.24 0.07 47 1.26 0.06 2013 ID ID ID ND ND ND 2014 89 2.58 0.18 ID ID ID

Page 14 of 73
Chapter 3. Description of Applicable Water Quality Standards and Targets
3.1 Classification of the Waterbody and Criterion Applicable to the TMDLs Florida's surface waters are protected for six designated use classifications, as follows:
Class I Potable water supplies Class II Shellfish propagation or harvesting Class III Fish consumption; recreation, propagation, and
maintenance of a healthy, well-balanced population of fish and wildlife
Class III-Limited Fish consumption; recreation or limited recreation; and/or propagation and maintenance of a limited population of fish and wildlife
Class IV Agricultural water supplies Class V Navigation, utility, and industrial use (there are no state
waters currently in this class) Lake Alma and Lake Searcy are Class III waterbodies, with a designated use of fish consumption, recreation, and propagation and maintenance of a healthy, well-balanced population of fish and wildlife. The Class III water quality criterion applicable to the verified impairment (nutrients) for both waterbodies is Florida's nutrient criterion in Paragraph 62-302.530(90)(b), F.A.C.
3.2 Applicable Water Quality Standards and Numeric Water Quality Target
3.2.1 Numeric Interpretation of the Narrative Nutrient Criterion The NNC for lakes were adopted on December 8, 2011, and have been effective since October 27, 2014. DEP assessed the data for Lake Alma and Lake Searcy using the NNC. Neither attained the NNC, and both lakes remain on the Verified List as impaired for nutrients. The nutrient TMDLs presented in this report constitute for TN and TP site-specific numeric interpretations of the narrative nutrient criterion set forth in Paragraph 62-302.530(90)(b), F.A.C., that will replace the otherwise applicable NNC in Subsection 62-302.531(2), F.A.C., for both lakes.
Appendix A summarizes the relevant information to support the determination that the TMDLs provide for the protection of Lakes Alma and Searcy, and the attainment and maintenance of water quality standards in downstream waters (pursuant to Subsection 62-302.531[4], F.A.C.), and to support using the nutrient TMDLs as the site-specific numeric interpretations of the narrative nutrient criterion.

Page 15 of 73
TMDL targets and water quality criteria are generally very similar, as both measures are used to protect the designated uses of surface waters. In fact, for many non-nutrient TMDLs, the TMDL target is the applicable water quality criterion, and the TMDL identifies the load that will attain the concentration-based criteria. This is the case for some nutrient TMDLs in which the target is to attain the generally applicable NNC (for a lake, for example), and the TMDL establishes the allowable nutrient load. Under Florida's nutrient standard in Rule 62-302.531, F.A.C., the allowable load becomes the applicable NNC for a lake when the TMDL is adopted.
3.2.1.1 NNC Values Adopted by the State
The adopted lake NNC include criteria for chlorophyll a, TN, and TP, with the specific values depending on the color and alkalinity of a given lake. Table 3.1 lists the NNC for Florida lakes specified in Subparagraph 62-302.531(2)(b)1., F.A.C.
Table 3.1. Chlorophyll a, TN, and TP criteria for Florida lakes (Subparagraph 62-302.531[2][b]1., F.A.C.)
AGM = Annual geometric mean; CaCO3 = Calcium carbonate 1 For lakes with color > 40 PCU in the West Central Nutrient Watershed Region, the maximum TP limit shall be the 0.49 mg/L TP streams threshold for the region. Lake Group Long-Term
Geometric Mean Lake Color and
Alkalinity
Lake Group AGM
Chlorophyll a Minimum NNC
AGM TP Minimum NNC
AGM TN Maximum NNC
AGM TP Maximum NNC
AGM TN > 40 PCU 20 µg/L 0.05 mg/L 1.27 mg/L 0.16 mg/L1 2.23 mg/L
≤ 40 PCU and > 20 mg/L CaCO3 20 µg/L 0.03 mg/L 1.05 mg/L 0.09 mg/L 1.91 mg/L
≤ 40 PCU and ≤ 20 mg/L CaCO3 6 µg/L 0.01 mg/L 0.51 mg/L 0.03 mg/L 0.93 mg/L
Based on Subparagraph 62-302.531(2)(b)1., F.A.C., if a given lake has a long-term geometric mean color greater than 40 PCU, or if the long-term geometric mean color is less than 40 PCU but the long-term geometric mean of alkalinity (represented as CaCO3) is greater than 20 mg/L, the chlorophyll a criterion is 20 µg/L. For a lake with long-term geometric mean color less than 40 PCU and long-term geometric mean alkalinity less than 20 mg/L CaCO3, the chlorophyll a criterion is 6 µg/L. For a lake to attain the chlorophyll a criterion, the AGM of chlorophyll a should not exceed the criterion more than once in any consecutive 3-year period. These chlorophyll a criteria were established by taking into consideration results from paleolimnological studies, expert opinions, biological responses, user perceptions, and chlorophyll a concentrations in a set of carefully selected reference lakes (DEP 2012).
If there are sufficient data to calculate the AGM for chlorophyll a and the mean does not exceed the chlorophyll a criterion for the lake type listed in Table 3.1, then the TN and TP criteria for that calendar year are the AGMs of lake TN and TP samples, subject to the minimum and maximum limits in the table. However, for lakes with color > 40 PCU in the West Central

Page 16 of 73
Nutrient Watershed Region, the maximum TP criterion is the 0.49 mg/L TP streams nutrient threshold for the region. If there are insufficient data to calculate the AGM for chlorophyll a for a given year, or if the AGM chlorophyll a concentration exceeds the chlorophyll a target concentration specified in Table 3.1 for the lake type, then the TN and TP criteria are the minimum values in the table.
For the purpose of Subparagraph 62-302.531(2)(b)1., F.A.C., color is assessed as true color and should be free from turbidity. Lake color and alkalinity are set at the long-term geometric mean, based on a minimum of 10 data points over at least 3 years with at least 1 data point in each year. If insufficient alkalinity data are available, the long-term geometric mean specific conductance value is used, with a value of <100 micromhos/centimeter (µohms/cm) used to estimate the 20 mg/L CaCO3 alkalinity concentration until alkalinity data are available.
Based on the data retrieved from IWR Database Run_52, the long-term geometric mean colors for Lake Alma and Lake Searcy are 85 and 56 PCU, respectively, higher than the 40 PCU value that distinguishes high color lakes from clear lakes. The generally applicable chlorophyll a criterion for both lakes, therefore, is 20 µg/L.
Based on Subsection 62-302.531(6), F.A.C., to calculate an AGM for TN, TP, or chlorophyll a, there must be at least four temporally independent samples per year, with at least one sample taken between May 1 and September 30 and at least one sample taken during the other months of the calendar year. To be treated as temporally independent, samples must be taken at least one week apart.
3.2.2 Target Chlorophyll a Concentrations and Nutrient Criteria (TN and TP loads) Established Based on the Modeling Approach
When establishing target chlorophyll a concentrations, a critical consideration is to avoid abating the natural background condition. Lake Alma and Lake Searcy are high color lakes. If the modeled chlorophyll a concentration under the natural background condition is lower than or equal to the generally applicable chlorophyll a criterion (20 µg/L), the calibrated watershed–receiving water model set will be used to simulate the in-lake TN and TP concentrations and TN and TP loads from the watershed that will achieve an in-lake chlorophyll a concentration of 20 µg/L. Since DEP has demonstrated that the chlorophyll a criterion of 20 μg/L is protective of designated uses and maintains a balanced aquatic flora and fauna (DEP 2012), this value will be used as the water quality target to address the nutrient impairment for high color lakes (above 40 PCU) and clear lakes with alkalinity above 20 mg/L CaCO3. These TN and TP loads and chlorophyll a concentration will be considered the site-specific interpretation of the narrative criterion.
However, if the modeled chlorophyll a concentration (average of AGM for the modeling period) for the natural background condition is higher than the 20 µg/L criterion, the 80th percentile of

Page 17 of 73
the chlorophyll a concentration under the natural background condition will be used as the TMDL target. Natural background conditions are inherently protective of designated uses. It can be expected with 90% confidence that the 80th percentile geometric mean concentration will be exceeded no more than once in a three-year period, based on the binomial distribution and assumption of inter-annual independence (i.e., no or minimal autocorrelation between years). In other words, it is expected that the 80th percentile would be exceeded more than once (i.e., two or three times) in a three-year period only 10% of the time on a long-term basis, which represents an acceptable type I error rate (DEP 2012). The one-in-three-year approach was designed to test whether the frequency of exceedance is consistent with random variability around a healthy well-balanced condition (DEP 2012). The modeled chlorophyll a concentration under the natural background condition was lower than the generally applicable chlorophyll a criterion of 20 µg/L for Lake Searcy but higher than 20 µg/L for Lake Alma. The averages of AGM under the natural background condition were 8 µg/L for Lake Searcy and 23 µg/L for Lake Alma, respectively.
Based on several lines of evidence, DEP developed a chlorophyll a criterion of 20 μg/L for high-color lakes (above 40 PCU) and clear lakes with alkalinity above 20 mg/L CaCO3. Since DEP has demonstrated that the chlorophyll a criterion of 20 μg/L is protective of designated uses and maintains a balanced aquatic flora and fauna, this value will be used as the water quality target to address the nutrient impairment of Lake Searcy, because Lake Searcy is a high-color lake. There is no information suggesting that Lake Searcy differs from the lakes used as reference for the development of the NNC, and therefore DEP has determined that the generally applicable NNC criteria for high-color lakes is the most appropriate site-specific chlorophyll a criterion. The TN and TP loads identified as the site-specific TN and TP standards were determined by using models to determine watershed TN and TP loadings that will achieve the chlorophyll a criterion of 20 μg/L.
For Lake Alma, 30 µg/L of chlorophyll a, which is the 80th percentile of natural background condition, was selected as the target. The site-specific interpretations of the narrative nutrient criterion for TN and TP were determined by model simulation to achieve the in-lake chlorophyll a criteria every year (see more detailed information in Chapter 5). Table 3.2 summarizes the chlorophyll a concentration and the TMDL loads for TN and TP.
Table 3.2. Site-specific interpretations of the narrative nutrient criterion Note: Chlorophyll a, are not to be exceeded more than once in any consecutive three-year period.
WBID
AGM Chlorophyll a
(µg/L)
7-Year Annual Average TN
(lbs/yr)
7-Year Annual Average TP
(lbs/yr) 2986D 30 1,036 91
2986E 20 845 96
Page 18 of 73
The TN and TP concentrations necessary for restoration are presented for informational purposes only and represent the simulated in-lake TN and TP concentrations corresponding to the target chlorophyll a concentrations of 20 µg/L for Lake Searcy and 30 µg/L for Lake Alma. These restoration AGM concentrations are 0.45 mg/L of TN and 0.05 mg/L of TP for Lake Searcy, and 1.41 mg/L of TN and 0.13 mg/L of TP for Lake Alma (see more detailed information in Chapter 5).
3.2.3 Downstream Protection There is no data to indicate discharge from Lake Alma, but according to the Lake Jesup HSPF model, Lake Alma and Lake Searcy discharge the surface water to Soldier Creek (WBID 2986), a Class III freshwater stream. Based on the most recent assessment, completed on April 27, 2016, for the Group 2 basins, Soldier Creek is not impaired for nutrients. As evidenced by the healthy existing condition in Soldier Creek, the existing loads from Lake Searcy and Lake Alma to the creek have not led to an impairment of the downstream water. Therefore, the reductions in nutrient loads prescribed in the TMDLs are not expected to cause nutrient impairments downstream.
Soldier Creek discharges its surface water to Lake Jesup (WBID 2981). When compared average TN and TP concentrations (2007–2014) between Soldier Creek (TN: 1.00 mg/L, TP: 0.11 mg/L) and Lake Jesup (TN: 2.81mg/L, TP: 0.13 mg/L), the former has lower concentrations. Therefore, the TN and TP loads from Soldier Creek will be protective of the nutrient conditions in the downstream water, Lake Jesup. The nutrient load reductions in Lake Alma and Lake Searcy described in this TMDL analysis are not expected to cause nutrient impairments downstream but will result in water quality improvements to downstream waters.

Page 19 of 73
Chapter 4: Assessment of Sources
4.1 Types of Sources An important part of the TMDL analysis is the identification of pollutant source categories, source subcategories, or individual sources of the pollutant of concern in the target watershed and the amount of pollutant loading contributed by each of these sources. Sources are broadly classified as either point sources or nonpoint sources. Historically, the term "point sources" has meant discharges to surface waters that typically have a continuous flow via a discernable, confined, and discrete conveyance, such as a pipe. Domestic and industrial wastewater treatment facilities (WWTFs) are examples of traditional point sources. In contrast, the term "nonpoint sources" was used to describe intermittent, rainfall-driven, diffuse sources of pollution associated with everyday human activities, including runoff from urban land uses, agriculture, silviculture, and mining; discharges from failing septic systems; and atmospheric deposition.
However, the 1987 amendments to the CWA redefined certain nonpoint sources of pollution as point sources subject to regulation under the EPA's National Pollutant Discharge Elimination System (NPDES) Program. These nonpoint sources included certain urban stormwater discharges, such as those from local government master drainage systems, construction sites over five acres, and a wide variety of industries (see Appendix B for background information on the federal and state stormwater programs).
To be consistent with CWA definitions, the term "point source" is used to describe traditional point sources (such as domestic and industrial wastewater discharges) and stormwater systems requiring an NPDES stormwater permit when allocating pollutant load reductions required by a TMDL (see Section 6.1 on Expression and Allocation of the TMDL). However, the methodologies used to estimate nonpoint source loads do not distinguish between NPDES and non-NPDES stormwater discharges, and as such, this source assessment section does not make any distinction between the two types of stormwater.
4.2 Potential Nutrient Sources in the Lake Alma and Lake Searcy Watersheds
4.2.1 Point Sources 4.2.1.1 Wastewater Point Sources
When this analysis was conducted, no NPDES-permitted wastewater facilities were identified in the Lake Alma and Lake Searcy Watersheds that discharge directly to surface waters.
4.2.1.2 Municipal Separate Storm Sewer System (MS4) Permittees
MS4s may also discharge pollutants to waterbodies in response to storm events. To address stormwater discharges, the EPA developed the NPDES stormwater permitting program in two phases. Phase I, promulgated in 1990, addresses large and medium-size MS4s located in
Page 20 of 73
incorporated areas and counties with populations of 100,000 or more. Phase II permitting began in 2003. Regulated Phase II MS4s are defined in Rule 62-624.800, F.A.C., and typically cover urbanized areas serving jurisdictions with a population of at least 1,000 or discharging into Class I or Class II waters, or into Outstanding Florida Waters (OFWs).
The stormwater collection systems in the Lake Alma and Lake Searcy Watersheds, which are owned and operated by Seminole County and co-permittees (Florida Department of Transportation [FDOT] District 5 and the City of Longwood), are covered by an NPDES Phase I MS4 permit (FLS000038).
4.2.2 Nonpoint Sources Pollutant sources that are not NPDES wastewater or stormwater dischargers are generally considered nonpoint sources. The majority of the nutrient loadings to Lake Alma and Lake Searcy come from nonpoint sources, including surface runoff, groundwater input, areas where best management practices (BMPs) are used, and atmospheric deposition directly onto the surface of the lakes. The TMDLs are based on the TN and TP loadings from the watersheds simulated by the HSPF model, which was originally developed by the SJRWMD and revised by Tetra Tech.
HSPF is a comprehensive package that can be used to develop a combined watershed and receiving water model. It can simulate various species of nitrogen and phosphorus, chlorophyll a, biochemical oxygen demand (BOD), coliform bacteria, metals, and dissolved oxygen (DO) concentrations in receiving waters. The model has three major modules that simulate pollutant loadings from the watershed and in-water transport of the pollutants and their effects on chlorophyll a and DO concentrations:
• The PERLND Module performs a detailed analysis of surface runoff, interflow, and groundwater flow for pervious land areas based on the Stanford Watershed Model. Water quality calculations for sediment in pervious land runoff can include sediment detachment during rainfall events and reattachment during dry periods, with the potential for washoff during runoff events. For other water quality constituents, runoff water quality can be determined using buildup-washoff algorithms, "potency factor" (e.g., factors relating constituent washoff to sediment washoff), or a combination of both.
• The IMPLND Module analyzes surface runoff only from impervious land areas and uses buildup-washoff algorithms to determine runoff quality.
• The RCHRES Module is used to simulate flow routing and water quality in receiving waters, which are assumed to be one-dimensional. Receiving water constituents can interact with suspended and bed sediments through soil-water partitioning. The HSPF model can incorporate "special actions" that use user-

Page 21 of 73
specified algorithms to account for occurrences such as the opening or closing of water control structures to maintain seasonal water stages or other processes beyond the normal scope of the model code.
4.2.2.1 Delineation of the Lake Alma and Lake Searcy Watersheds
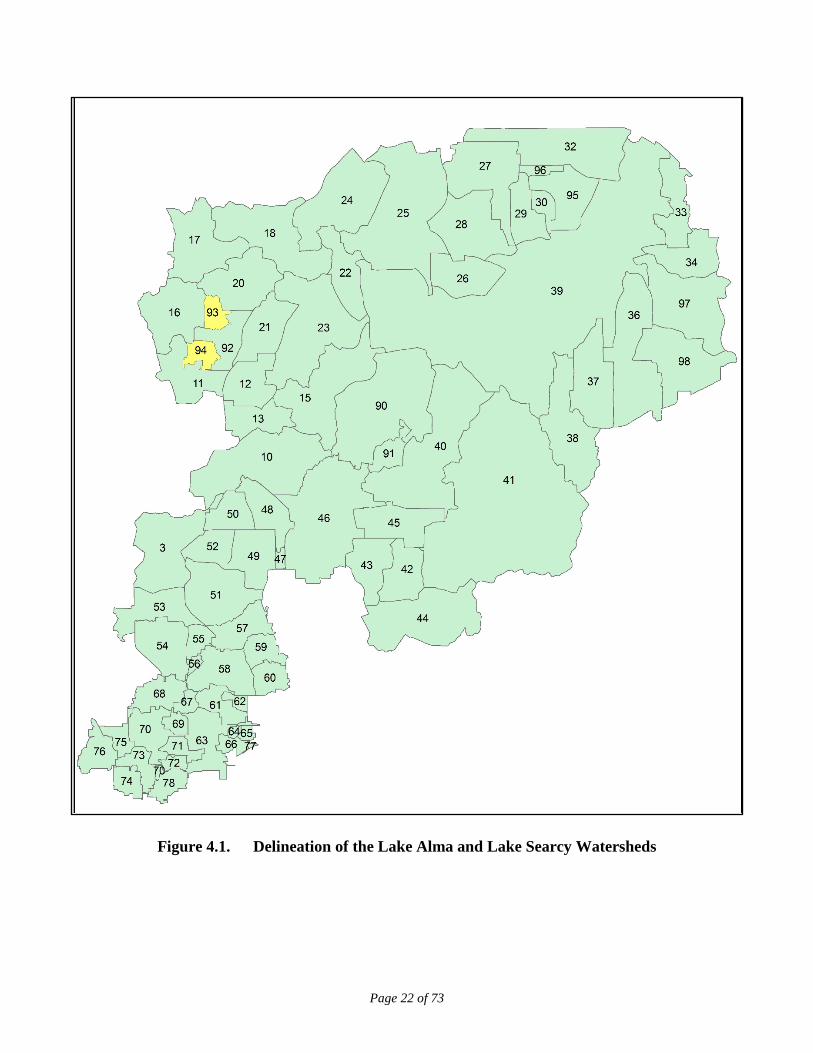
For modeling purposes, DEP used drainage basin boundaries that were originally delineated into 39 subwatersheds by the SJRWMD (Jia 2015), and subsequently used the 73 subwatersheds delineated by Tetra Tech (2017a), Inc. at the request of stakeholders after the Lake Jesup Basin Management Action Plan (BMAP) was adopted. Lake Alma is Subwatershed 93 and Lake Searcy is Subwatershed 94 (Figure 4.1).
Page 22 of 73
Figure 4.1. Delineation of the Lake Alma and Lake Searcy Watersheds

Page 23 of 73
4.2.2.2 Land Uses
Land use is one of the most important factors in determining the nutrient loadings created in the Lake Alma and Lake Searcy Watersheds. Nutrients can be flushed into a receiving water through surface runoff and stormwater conveyance systems during stormwater events. Both human land use areas and natural land areas generate nutrients. However, human land use areas typically generate more nutrient loads per unit of land surface area than natural lands.
The land use information used in developing the TMDLs was obtained from the SJRWMD's 2009 land use shape files, which define land use types based on the classification system adopted in the Florida Land Use and Cover Classification System (FLUCCS) (FDOT 1999). The land use classes in this coverage were grouped into 13 major categories in this study for modeling purposes (Jia 2015). Table 4.1 lists these land use categories and their corresponding acreages in the Lake Alma and Lake Searcy Watersheds.
Table 4.1. SJRWMD land use categories and their corresponding acreage in the Lake Alma and Lake Searcy Watersheds
Land Use
Lake Alma Watershed
(acres) Lake Alma % Acreage
Lake Searcy Watershed
(acres) Lake Searcy % Acreage
Low-Density Residential (LDR) 60.8 24 0.0 0
Medium-Density Residential (MDR) 63.3 25 182.4 64
High-Density Residential (HDR) 0.0 0 0.0 0
Industrial and Commercial (IND) 0.0 0 32.1 11
Mining (MIN) 0.0 0 0.0 0
Open Land (OPE) 2.5 1 0.0 0
Pasture (PAS) 80.4 31 0.0 0
Agriculture General (AGR) 13.7 5 0.0 0
Agriculture Tree Crop (AGT) 0.0 0 0.0 0
Rangeland (RAN) 1.1 0 3.5 1
Forest (FOR) 8.1 3 0.3 0
Water (WAT) 3.9 2 14.8 5
Wetlands (WET) 23.7 9 50.6 18
Total 257.5 100 283.7 99

Page 24 of 73
Based on Table 4.1 and Figure 4.2, the total area of the Lake Alma Watershed is 258 acres. The dominant land use type is pasture, which covers 80 acres and accounts for 31 % of the total watershed area. The second largest type, medium-density residential, covers 63 acres and accounts for 25 % of the watershed area. The third largest land use, low-density residential, occupies 61 acres of land and accounts for 24 % of the total watershed. Overall, human land uses, including all the residential, commercial, industrial, and agricultural areas, occupy 222 acres of the watershed and account for 86 % of the total watershed.
The total area of the Lake Searcy Watershed is 284 acres (Table 4.1 and Figure 4.2). The dominant land use type, medium-density residential, covers 182 acres and accounts for 64 % of the total watershed area. The second largest type, wetlands, covers 51 acres and accounts for 18 % of the watershed area. Overall, human land uses, including all the medium-density residential, commercial, industrial, and rangeland areas, occupy 218 acres of the watershed and account for 77 % of the total watershed. There are no agricultural areas in the watershed.
4.2.2.3 Hydrologic Soil Groups
The hydrologic characteristics of soil can significantly influence the capability of a watershed to hold rainfall or produce surface runoff. Soils are generally classified as one of four major types, as follows, based on their hydrologic characteristics (Viessman et al. 1989):
• Type A soil (low runoff potential): Soils having high infiltration rates even if thoroughly wetted and consisting chiefly of deep, well-drained to excessively drained sands or gravels. These soils have a high rate of water transmission.
• Type B soil: Soils having moderate infiltration rates if thoroughly wetted and consisting chiefly of moderately deep to deep, moderately well-drained to well-drained soils with moderately fine to moderately coarse textures. These soils have a moderate rate of water transmission.
• Type C soil: Soils having slow infiltration rates if thoroughly wetted and consisting chiefly of soils with a layer that impedes the downward movement of water, or soils with moderately fine to fine texture. These soils have a slow rate of water transmission.
• Type D soil (high runoff potential): Soils having very slow infiltration rates if thoroughly wetted and consisting chiefly of clay soils with a high swelling potential, soils with a permanent high-water table, soils with a clay pan or clay layer at or near the surface, and shallow soils over nearly impervious materials. These soils have a very slow rate of water transmission.

Page 25 of 73
Figure 4.2. Spatial distribution of land uses in the Lake Alma and Lake Searcy Watersheds

Page 26 of 73
The soil hydrologic characteristics of the Lake Alma and Lake Searcy Watersheds used in this TMDL analysis were based on the soil hydrologic classifications in the U.S. Department of Agriculture (USDA) Natural Resources Conservation Service (NRCS) 2010 Soil Survey Geographic (SSURGO) Database geographic information system (GIS) shapefile. Figure 4.3 shows the spatial distribution of soil hydrologic groups in the Lake Alma and Lake Searcy Watersheds. Type A soil is predominant in the Lake Alma Watershed. Type A and A/D soils coexist in the Lake Searcy Watershed. Type A/D soil has Type A soil characteristics when unsaturated but behaves like Type D soil when saturated. Table 4.2 lists the soil hydrologic groups in the watersheds and their corresponding acreages.
Table 4.2. Acreage of hydrologic soil groups in the Lake Alma and Lake Searcy Watersheds
Soil Hydrologic Group
Lake Alma Watershed
Acreage
Lake Alma Watershed % Acreage
Lake Searcy Watershed
Acreage
Lake Searcy Watershed % Acreage
A 229.4 89 68.5 24
A/D 23.1 9 69.3 24
No Data 5.0 2 145.9 52
Total 257.5 100 283.7 100
4.2.2.4 Onsite Sewage Treatment and Disposal Systems (OSTDS)
OSTDS, including septic tanks, are a safe means of disposing of domestic waste when properly sited, designed, constructed, maintained, and operated. The effluent from a well-functioning septic tank is comparable to secondarily treated wastewater from a sewage treatment plant. When not functioning properly, however, OSTDS can be a source of nutrients (nitrogen and phosphorus), pathogens, and other pollutants to both groundwater and surface water, when not functioning properly.
OSTDS loads were input to the HSPF model as point source time series ("direct pipes") only for those parcels intercepting the 50-foot buffer around streams and lakes. Loads to streams and lakes from OSTDS in parcels more than 50 feet away from streams and lakes are implicitly grouped into the overall pollutant loadings from residential land uses (Jia 2015).
As part of the model update, Tetra Tech (2017a) added the representation of all septic systems in the watersheds, both failing and properly functioning. The total number of OSTDS in each subwatershed was estimated using the septic system coverages provided by Seminole County (Figure 4.4).

Page 27 of 73
Figure 4.3. Soil hydrologic groups in the Lake Alma and Lake Searcy Watersheds (NRCS 2010)

Page 28 of 73
Figure 4.4. OSTDS distribution in the Lake Alma and Lake Searcy Watersheds

Page 29 of 73
4.2.2.5 BMP Coverage
The BMP coverage used in the updated Lake Jesup HSPF model includes urban structural BMPs in the Lake Jesup BMAP from 2006 through May 31, 2013 (the end of the 2013 BMAP annual progress report period). The BMPs in the model include baffle boxes, inlet baskets, continuous deflective separation (CDS) units, swales, dry detention ponds, wet detention ponds, City of Orlando 100 % onsite retention, City of Orlando private BMPs, and lake drainage wells. For modeling purposes, these BMPs were grouped into 8 categories based on their pollutant removal efficiencies. In the Lake Alma Watershed, 8 acres, or 3 %, are treated by BMPs in the HSPF model. In the Lake Searcy Watershed, 38 acres, or 13 %, are treated by BMPs.
4.2.2.6 Atmospheric Deposition
The simulation of atmospheric deposition in the updated Lake Jesup HSPF model is the same as in the SJRWMD model (Jia 2015). Atmospheric deposition to the land surface is lumped into the nonpoint source loading from land uses. Atmospheric deposition to the surface of streams and lakes in the watershed is modeled explicitly. The model assumes that atmospheric deposition only contributes inorganic forms of nitrogen and phosphorus. Total active metal (TAM), nitrate (NO3), and phosphorus (PO4) concentrations from wet deposition are set at 0.15 mg N/L, 0.74 mg N/L, and 0.04 mg P/L, respectively. These are the precipitation-weighted mean concentrations from Site FL32 of the National Atmospheric Deposition Program located in Orange County. TAM, NO3, and PO4 dry deposition rates are set at 37 mg N/m2/yr, 149 mg N/m2/yr, and 10 mg P/m2/yr, respectively, based on the SJRWMD's dry deposition samples measured at Lake Lochloosa in Alachua County. The annual atmospheric deposition loadings are evenly allocated as monthly inputs in the HSPF model.
4.2.2.7 Estimating Nonpoint Loadings from the Lake Alma and Lake Searcy Watersheds
The Lake Jesup HSPF model provides the watershed inputs to Lake Alma from various sources, including surface runoff, baseflow, surface runoff and baseflow treated by BMPs, and atmospheric deposition.
The meteorological data for the HSPF model include precipitation, potential evaporation, air temperature, wind speed, solar radiation, dew point temperature, and cloud cover. Precipitation data were obtained from the SJRWMD's Next-Generation Radar (NEXRAD) Doppler radar rainfall database, and these data are collected on a 2 x 2 kilometer grid. Potential evapotranspiration data and solar radiation data are from Geostationary Operational Environmental Satellites (GOES) datasets maintained by the U.S. Geological Survey (USGS). The GOES data are collected daily. Other meteorological data were obtained from the Orlando International Airport weather station and were downloaded from the Integrated Surface Database maintained by the National Oceanic and Atmospheric Administration (NOAA).

Page 30 of 73
Table 4.3 summarizes annual rainfall in the Lake Alma and Lake Searcy Watersheds from 2003 through 2012. In this period, total rainfall ranged from 34.3 to 66.7 inches a year. The long-term average annual rainfall for the period was 51.0 inches.
Table 4.3. Annual rainfall in the Lake Alma and Lake Searcy Watersheds, 2003–14
Year Annual Rainfall
(inches) 2003 54.4 2004 65.2 2005 54.1 2006 34.3 2007 48.2 2008 66.7 2009 43.3 2010 41.1 2011 47.8 2012 48.9 2013 47.6 2014 61.0
Average 51.0 Tables 4.4a and 4.4b list the total water flows into the Lake Alma and Lake Searcy Watersheds by year and by source from the HSPF model. For the modeling period from 2003 to 2014, inflows averaged 148 and 233 acre-feet per year (ac-ft/yr), respectively.
Table 4.4a. Summary of inflows to the Lake Alma Watershed by source and year * The flows in the BMPs category represent the portion of surface runoff and baseflow treated by BMPs.
Year
Surface Runoff
(ac-ft/yr)
Surface Runoff
(%) Baseflow (ac-ft/yr)
Baseflow (%)
BMPs* (ac-ft/yr)
BMPs* (%)
Total Inflow
(ac-ft/yr) 2003 109 68 45 28 5 3 160 2004 114 71 40 25 6 4 160 2005 87 64 45 33 5 4 137 2006 38 65 18 31 3 5 59 2007 46 66 21 30 3 4 70 2008 319 84 46 12 13 4 378 2009 104 75 29 21 6 4 139 2010 77 71 27 25 4 4 108 2011 124 77 30 19 6 4 161 2012 87 74 26 22 5 4 118 2013 92 75 26 21 5 4 123 2014 134 79 29 17 7 4 170
Average 111 72 32 24 6 4 148
Page 31 of 73
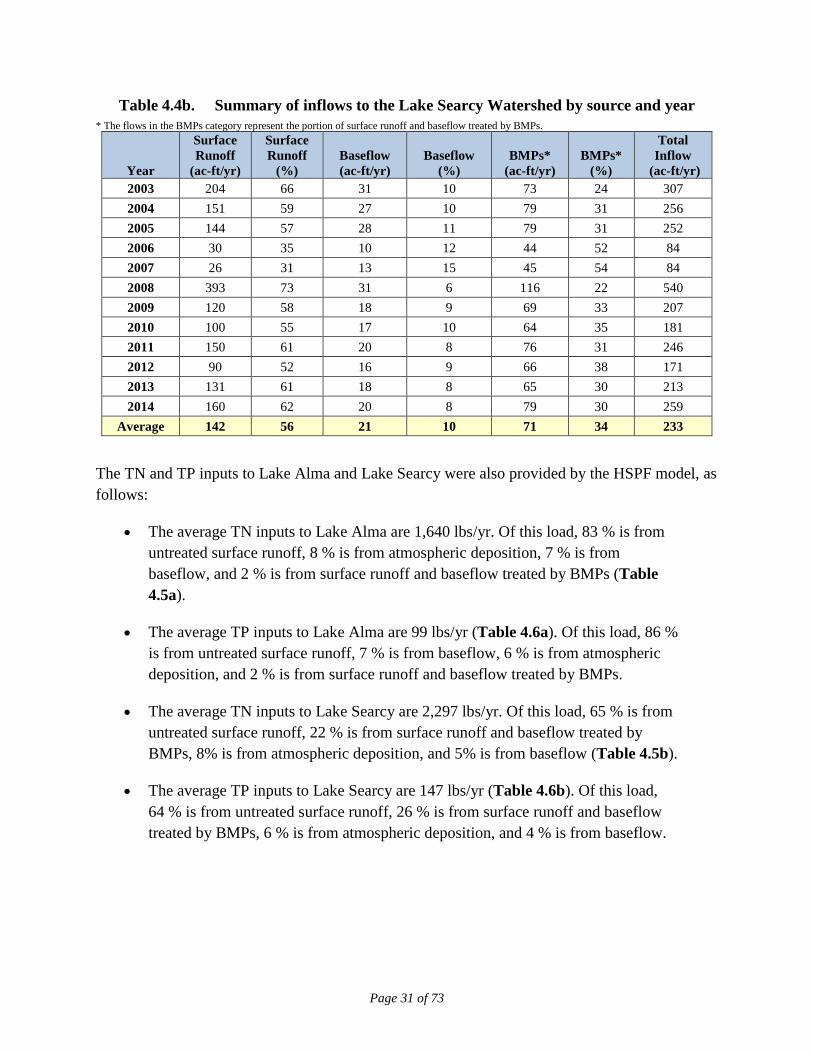
Table 4.4b. Summary of inflows to the Lake Searcy Watershed by source and year * The flows in the BMPs category represent the portion of surface runoff and baseflow treated by BMPs.
Year
Surface Runoff
(ac-ft/yr)
Surface Runoff
(%) Baseflow (ac-ft/yr)
Baseflow (%)
BMPs* (ac-ft/yr)
BMPs* (%)
Total Inflow
(ac-ft/yr) 2003 204 66 31 10 73 24 307 2004 151 59 27 10 79 31 256 2005 144 57 28 11 79 31 252 2006 30 35 10 12 44 52 84 2007 26 31 13 15 45 54 84 2008 393 73 31 6 116 22 540 2009 120 58 18 9 69 33 207 2010 100 55 17 10 64 35 181 2011 150 61 20 8 76 31 246 2012 90 52 16 9 66 38 171 2013 131 61 18 8 65 30 213 2014 160 62 20 8 79 30 259
Average 142 56 21 10 71 34 233 The TN and TP inputs to Lake Alma and Lake Searcy were also provided by the HSPF model, as follows:
• The average TN inputs to Lake Alma are 1,640 lbs/yr. Of this load, 83 % is from untreated surface runoff, 8 % is from atmospheric deposition, 7 % is from baseflow, and 2 % is from surface runoff and baseflow treated by BMPs (Table 4.5a).
• The average TP inputs to Lake Alma are 99 lbs/yr (Table 4.6a). Of this load, 86 % is from untreated surface runoff, 7 % is from baseflow, 6 % is from atmospheric deposition, and 2 % is from surface runoff and baseflow treated by BMPs.
• The average TN inputs to Lake Searcy are 2,297 lbs/yr. Of this load, 65 % is from untreated surface runoff, 22 % is from surface runoff and baseflow treated by BMPs, 8% is from atmospheric deposition, and 5% is from baseflow (Table 4.5b).
• The average TP inputs to Lake Searcy are 147 lbs/yr (Table 4.6b). Of this load, 64 % is from untreated surface runoff, 26 % is from surface runoff and baseflow treated by BMPs, 6 % is from atmospheric deposition, and 4 % is from baseflow.

Page 32 of 73
Table 4.5a. Summary of TN loading to Lake Alma by source and year * The flows in the BMPs category represent the portion of surface runoff and baseflow treated by BMPs.
Year
Surface Runoff (lbs/yr)
Surface Runoff
(%) Baseflow (lbs/yr)
Baseflow (%)
BMPs* (lbs/yr)
BMPs* (%)
Atmospheric Deposition
(lbs/yr)
Atmospheric Deposition
(%)
Total TN Input
(lbs/yr) 2003 1,625 83 163 8 31 2 131 7 1,949 2004 1,371 82 148 9 26 2 127 8 1,672 2005 1,479 82 161 9 30 2 136 8 1,806 2006 495 78 60 9 16 3 68 11 638 2007 710 80 72 8 20 2 83 9 885 2008 2,217 84 180 7 37 1 219 8 2,653 2009 1,452 85 102 6 26 2 119 7 1,699 2010 1,077 83 95 7 24 2 101 8 1,297 2011 1,692 86 111 6 30 2 131 7 1,965 2012 1,413 86 91 6 27 2 109 7 1,641 2013 1,295 85 96 6 25 2 114 7 1,531 2014 1,673 86 108 6 30 2 128 7 1,939
Average 1,375 83 116 7 27 2 122 8 1,640
Table 4.5b. Summary of TN loading to Lake Searcy by source and year * The flows in the BMPs category represent the portion of surface runoff and baseflow treated by BMPs.
Year
Surface Runoff (lbs/yr)
Surface Runoff
(%) Baseflow (lbs/yr)
Baseflow (%)
BMPs* (lbs/yr)
BMPs* (%)
Atmospheric Deposition
(lbs/yr)
Atmospheric Deposition
(%)
Total TN Input
(lbs/yr) 2003 1,825 67 163 6 511 19 208 8 2,707 2004 1,470 64 150 7 476 21 200 9 2,296 2005 1,766 66 165 6 532 20 212 8 2,675 2006 836 60 61 4 392 28 113 8 1,403 2007 952 60 77 5 420 27 132 8 1,582 2008 1,991 66 175 6 561 18 308 10 3,034 2009 1,468 66 102 5 460 21 181 8 2,211 2010 1,425 66 99 5 464 22 162 8 2,151 2011 1,696 68 113 5 493 20 202 8 2,504 2012 1,463 66 94 4 492 22 166 7 2,214 2013 1,507 67 99 4 463 21 186 8 2,256 2014 1,678 66 112 4 537 21 206 8 2,533
Average 1,506 65 118 5 483 22 190 8 2,297

Page 33 of 73
Table 4.6a. Summary of TP loading to Lake Alma by source and year * The flows in the BMPs category represent the portion of surface runoff and baseflow treated by BMPs.
Year
Surface Runoff (lbs/yr)
Surface Runoff
(%) Baseflow (lbs/yr)
Baseflow (%)
BMPs* (lbs/yr)
BMPs* (%)
Atmospheric Deposition
(lbs/yr)
Atmospheric Deposition
(%)
Total TP Input
(lbs/yr) 2003 100 86 9 8 2 2 6 5 117 2004 85 85 8 8 2 2 6 6 101 2005 91 84 9 8 2 2 6 6 108 2006 34 82 3 8 1 3 3 8 42 2007 47 84 4 7 1 2 4 7 56 2008 131 86 10 6 2 1 10 6 153 2009 90 88 6 5 2 2 5 5 103 2010 70 86 5 6 1 2 5 6 81 2011 106 88 6 5 2 2 6 5 120 2012 88 88 5 5 2 2 5 5 100 2013 80 87 5 6 2 2 5 6 92 2014 106 89 6 5 2 2 6 5 120
Average 86 86 6 7 2 2 6 6 99
Table 4.6b. Summary of TP loading to Lake Searcy by source and year * The flows in the BMPs category represent the portion of surface runoff and baseflow treated by BMPs.
Year
Surface Runoff (lbs/yr)
Surface Runoff
(%) Baseflow (lbs/yr)
Baseflow (%)
BMPs* (lbs/yr)
BMPs* (%)
Atmospheric Deposition
(lbs/yr)
Atmospheric Deposition
(%)
Total TP Input
(lbs/yr) 2003 112 67 8 5 38 23 9 5 168 2004 91 63 8 5 36 25 9 6 144 2005 108 65 9 5 39 24 9 6 165 2006 56 58 3 3 32 33 5 5 97 2007 63 60 4 4 32 31 6 6 106 2008 128 64 9 5 48 24 14 7 198 2009 89 64 5 4 36 26 8 6 138 2010 90 64 5 4 38 27 7 5 139 2011 108 67 6 4 39 24 9 5 162 2012 89 64 5 4 37 27 7 5 138 2013 94 66 5 4 35 24 8 6 142 2014 106 64 6 3 44 27 9 5 165
Average 95 64 6 4 38 26 8 6 147

Page 34 of 73
Chapter 5: Determination of Assimilative Capacity
5.1 Determination of Loading Capacity Nutrient enrichment and the resulting problems related to eutrophication tend to be widespread and are frequently manifested far (in both time and space) from their sources. Addressing eutrophication involves relating water quality and biological effects such as photosynthesis, decomposition, and nutrient recycling as acted on by environmental factors (i.e., rainfall, point source discharge, etc.) to the timing and magnitude of constituent loads supplied from various categories of pollution sources. Assimilative capacity should be related to some specific hydrometeorological condition during a selected period or to some range of expected variation in these conditions.
The goal of this TMDL analysis is to determine the assimilative capacity of Lake Alma and Lake Searcy, and to identify the maximum allowable TN and TP loadings from the watersheds, so that the lakes will meet the TMDL targets and thus maintain their function and designated use as Class III waters. To achieve the goal, DEP decided to use a combination of the HSPF model for watershed simulation, and EFDC and WASP models for waterbody simulation by focusing on the in-lake processes and the water and nutrient budgets of the lakes. These models were updated or set up by Tetra Tech, and detailed model inputs and configuration were addressed in the final report (Tetra Tech 2017a).
5.2 Historical TN, TP, and Chlorophyll a Trends in Lake Alma and Lake Searcy
Data for TN, TP, and corrected chlorophyll a concentrations for Lake Alma and Lake Searcy from 2003 through 2014 were retrieved from IWR Run_52. Figure 5.1 shows the locations of the individual stations where water quality data were collected. Data analysis indicated that the spatial variation between stations across Lake Alma was not significant. Therefore, data from all the stations in the lake were pooled and treated as data collected from one station.
Water quality data for Lake Searcy were treated in the same way as listed above. AGM values for TN, TP, and chlorophyll a concentrations were calculated based on all sampling data for the year (Tables 5.1a and 5.1b). Monthly mean values for TN, TP, and chlorophyll a concentrations were calculated using data sorted by month in the 2003–14 period. Seasonal trends for TN, TP, and chlorophyll a were examined using monthly mean values (Tables 5.2a and 5.2b).
As shown in Tables 5.1a and 5.1b, the long-term average AGM TN, TP, and chlorophyll a concentrations are 2.23 mg/L, 0.106 mg/L, and 35 µg/L for Lake Alma and 1.05 mg/L, 0.056 mg/L, and 34 µg/L for Lake Searcy, respectively.
Table 5.1a shows that the AGMs of TN concentrations in Lake Alma ranged from 1.40 to 2.89 mg/L, averaging 2.23 mg/L from 2004 through 2014. TN concentrations fluctuated throughout

Page 35 of 73
the period, increasing from 2005 to 2007, decreasing through 2008, and peaking in 2012 (Figure 5.2a). The lowest TN concentration observed during the sampling period was 1.23 mg/L and the highest was 5.50 mg/L.
The AGM TP concentration ranged from 0.028 to 0.198 mg/L and averaged 0.106 mg/L (Table 5.1a). TP concentrations in Lake Alma also fluctuated throughout the period. The lowest TP concentration was 0.012 mg/L and the highest was 0.74 mg/L (Figure 5.2b). The AGM corrected chlorophyll a concentration ranged from 3 to 63 µg/L (Table 5.1a).
The chlorophyll a concentration was high in 2009, decreased 2013, and then increased in 2014. (Figure 5.2c). The lowest chlorophyll a concentration throughout the sampling period was 1 µg/L and the highest was 260 µg/L (Figure 5.2c).
In general, TN, TP, and chlorophyll a concentrations showed no obvious increasing or decreasing trend throughout the sampling period. The chlorophyll a concentration showed a statistically positive co-relationship with both TN concentration (R2 = 0.55, P < 0.0001) and TP concentration (R2 = 0.50, P < 0.0001) from 2009 to 2014.

Page 36 of 73
Figure 5.1. Locations of water quality stations in Lake Alma and Lake Searcy

Page 37 of 73
Table 5.1a. AGMs for TN, TP, and chlorophyll a in Lake Alma, 2004–14
Year TN
(mg/L) TP
(mg/L) Chlorophyll a
(µg/L) 2004 2.29 0.080 2005 1.95 0.052 2006 2.57 0.116 2007 2.84 0.139 2008 1.90 0.150 2009 2.89 0.198 63 2010 2.19 0.121 60 2011 2.05 0.087 26 2012 2.24 0.071 28 2013 1.40 0.028 3 2014 2.23 0.120 33 Mean 2.23 0.106 35
Table 5.1b. AGMs for TN, TP, and chlorophyll a in Lake Searcy, 2003–14
Year TN
(mg/L) TP
(mg/L) Chlorophyll a
(µg/L) 2003 1.10 0.068 2004 0.97 0.062 2005 1.01 0.053 2006 0.84 0.039 2007 1.16 0.048 2008 1.04 0.053 2009 1.08 0.056 2010 1.21 0.053 2011 0.91 0.073 2012 1.26 0.060 47 2013 2014 1.00 0.052 21 Mean 1.05 0.056 34

Page 38 of 73
Table 5.2a. Seasonal variation of TN, TP, and chlorophyll a in Lake Alma; long-term mean of monthly means
Quarter (month)
TN (mg/L)
TP (mg/L)
Chlorophyll a (µg/L)
Jan Feb 2.03 0.126 25 Mar 2.75 0.188 79 Apr 3.19 0.153 136 May 2.25 0.099 32 Jun 2.82 0.141 137 Jul Aug 1.92 0.096 30 Sep 2.16 0.090 35 Oct Nov 1.98 0.286 6 Dec 2.39 0.084 19
Mean 2.39 0.140 55
Table 5.2b. Seasonal variation of TN, TP, and chlorophyll a in Lake Searcy; long-term mean of monthly means
Quarter (month)
TN (mg/L)
TP (mg/L)
Chlorophyll a (µg/L)
Jan 0.87 0.053 Feb 1.02 0.061 11 Mar 1.07 0.058 23 Apr 1.10 0.053 40 May 1.14 0.052 23 Jun 1.35 0.050 53 Jul 1.02 0.052 Aug 1.31 0.059 73 Sep 1.05 0.070 23 Oct 1.07 0.060 83 Nov 1.01 0.058 48 Dec 0.90 0.050
Mean 1.08 0.056 42

Page 39 of 73
Figure 5.2a. TN concentrations measured in Lake Alma, 2004–14
Figure 5.2b. TP concentrations measured in Lake Alma, 2004–14
Figure 5.2c. Chlorophyll a concentrations measured in Lake Alma, 2004–14.
Page 40 of 73
Table 5.1b shows that the AGMs of TN concentrations in Lake Searcy ranged from 0.84 to 1.26 mg/L, averaging 1.05 mg/L from 2003 to 2014. TN concentrations fluctuated throughout the period, decreasing from 2003 to 2006, increasing in 2008, and then decreasing again through 2014 (Figure 5.3a). The lowest TN concentration observed during the sampling period was 0.53 mg/L and the highest was 2.10 mg/L.
The AGM TP concentration ranged from 0.039 to 0.073 mg/L and averaged 0.056 mg/L (Table 5.1b). TP concentrations in Lake Searcy also fluctuated throughout the period, with the lowest TP concentration at 0.019 mg/L and the highest at 0.211 mg/L (Figure 5.3b). The AGM chlorophyll a concentrations were available in 2012, 47 µg/L and 2014, 21 µg/L (Table 5.1b).
The chlorophyll a concentrations showed higher concentration in 2012 than those in 2014. The lowest chlorophyll a concentration throughout the sampling period was 2 µg/L and the highest was 138 µg/L (Figure 5.3b). In general, TN concentrations showed an increasing statistical trend (p = 0.0283) from 2003 to 2014, but TP showed no obvious increasing or decreasing trend.
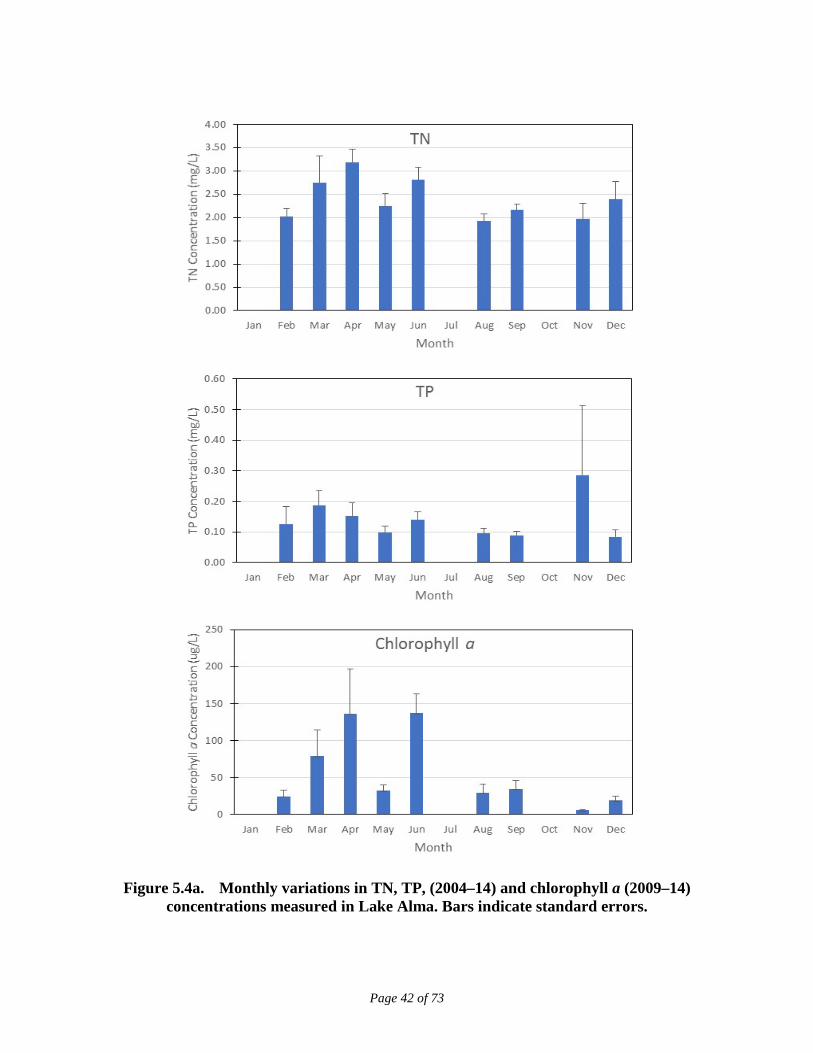
Figure 5.4a shows the monthly variation for TN, TP (data from 2004 to 2014), and chlorophyll a (data from 2009 to 2014) concentrations in Lake Alma. All months of data except January, July, and October were available. Chlorophyll a and TN concentrations showed a similar pattern, increasing in spring (March, April, and May) and decreasing in fall (September and November). The TP concentration was highest in November and lowest in December. There was no distinct seasonality in the TP concentration.
Figure 5.4b shows the monthly variation for TN, TP (data from 2003 to 2014), and chlorophyll a (data from 2012 and 2014) concentrations in Lake Searcy. TN and TP data were available for all months of the period. Chlorophyll a data were absent in January, July, and December. The TN concentrations demonstrated a pattern, increasing toward summer (June, July, and August) and decreasing toward winter (December and January). The TP concentration was lower in spring and summer (April, May, June, and July) and higher in fall (September and October). The chlorophyll a concentration fluctuated through the year but in general trend, it increased from spring to fall and decreased in winter.

Page 41 of 73
Figure 5.3a. TN concentrations measured in Lake Searcy, 2003–14
Figure 5.3b. TP concentrations measured in Lake Searcy, 2003–14
Figure 5.3c. Chlorophyll a concentrations measured in Lake Searcy, 2003–14.
Page 42 of 73
Figure 5.4a. Monthly variations in TN, TP, (2004–14) and chlorophyll a (2009–14) concentrations measured in Lake Alma. Bars indicate standard errors.

Page 43 of 73
Figure 5.4b. Monthly variations in TN, TP, (2003–14) and chlorophyll a (2012 and 2014) concentrations measured in Lake Searcy. Bars indicate standard errors.

Page 44 of 73
5.3 Hydrodynamic and Water Quality Models for Lake Alma and Lake Searcy
The HSPF model simulates the hydrology and water quality conditions in the watersheds. The EFDC model simulates hydrodynamics and the WASP model simulates water quality in the lakes. The three models were used together to represent the watershed loading and the resulting conditions in the lakes.
The HSPF model provided watershed flows and temperature to the EFDC model, as well as the watershed water quality concentrations to the WASP model. The EFDC and WASP models were linked through the hydrodynamic linkage file. The EFDC model hydrodynamic linkage file provided the intercell flow and velocities, as well as cell volume and temperature at each simulation time step, representing the circulation and transport patterns in the lakes. This file was subsequently used by the WASP model to evaluate the fate and transport of the different water quality variables under analysis.
The goal of nutrient TMDL development for Lake Alma and Lake Searcy is to identify the maximum allowable TP and TN loadings to the lakes so that they will meet water quality standards and maintain their function and designated uses. In general, the process used for identifying water quality targets and establishing the nutrient TMDLs was divided into four main steps, as follows:
1. Flows, TP and TN loadings from the Lake Alma and Lake Searcy Watersheds were estimated using the HSPF model (see Chapter 4). The model also includes atmospheric deposition directly onto the lake surface and input from OSTDS.
2. Watershed flows and loading estimates from all sources from the HSPF model were entered into the EFDC model and the WASP model, to establish the relationship between TN and TP loadings and in-lake TN, TP, and chlorophyll a concentrations by calibrating the model against the measured in-lake TN, TP, and chlorophyll a concentrations. The calibrated model was then used to predict in-lake existing TN, TP, and chlorophyll a concentrations.
3. All human land uses in the watersheds were then converted to natural land uses in the HSPF model—in this case, forest/wetlands—to simulate the natural background flow, TN and TP loadings. Again, the output from the HSPF model was entered into the EFDC and WASP models. In-lake concentrations in the natural background condition were simulated and compared with the generally applicable NNC to determine the appropriate chlorophyll a criterion for the TMDLs.
4. The TN and TP loads that achieved the chlorophyll a criteria for each lake were considered the TMDLs for Lake Alma and Lake Searcy.

Page 45 of 73
5.3.1 EFDC Model The Lake Alma EFDC model grid is based on the contour map from the updated bathymetry collected by DEP in October 2015. The EFDC model was divided into 54 cells, as shown in Figure 5.5a.
The Lake Searcy EFDC model grid is based on the contour map from Seminole County. The EFDC model was divided into 73 cells, as shown in Figure 5.5b. Daily inflows and outflows, as well as the temperatures from Subwatershed 93 and 94 of the Lake Jesup HSPF model. were used in the Lake Alma and Searcy EFDC models, respectively, to drive the hydrodynamics. The EFDC model was set up for the period from 2003 through 2014. The simulated lake levels were compared with the measured water levels in Lake Searcy, but no measured lake level data were available for the additional calibration of water surface elevation in Lake Alma. The simulated temperatures were compared with the in-lake temperature data for both lakes. Additional details about EFDC calibration and results can be found in the Lake Alma modeling report and Lake Searcy modeling report (Tetra Tech 2017b and 2017c, respectively).
Figure 5.5a. Lake Alma EFDC model grid

Page 46 of 73
Figure 5.5b. Lake Searcy EFDC model grid
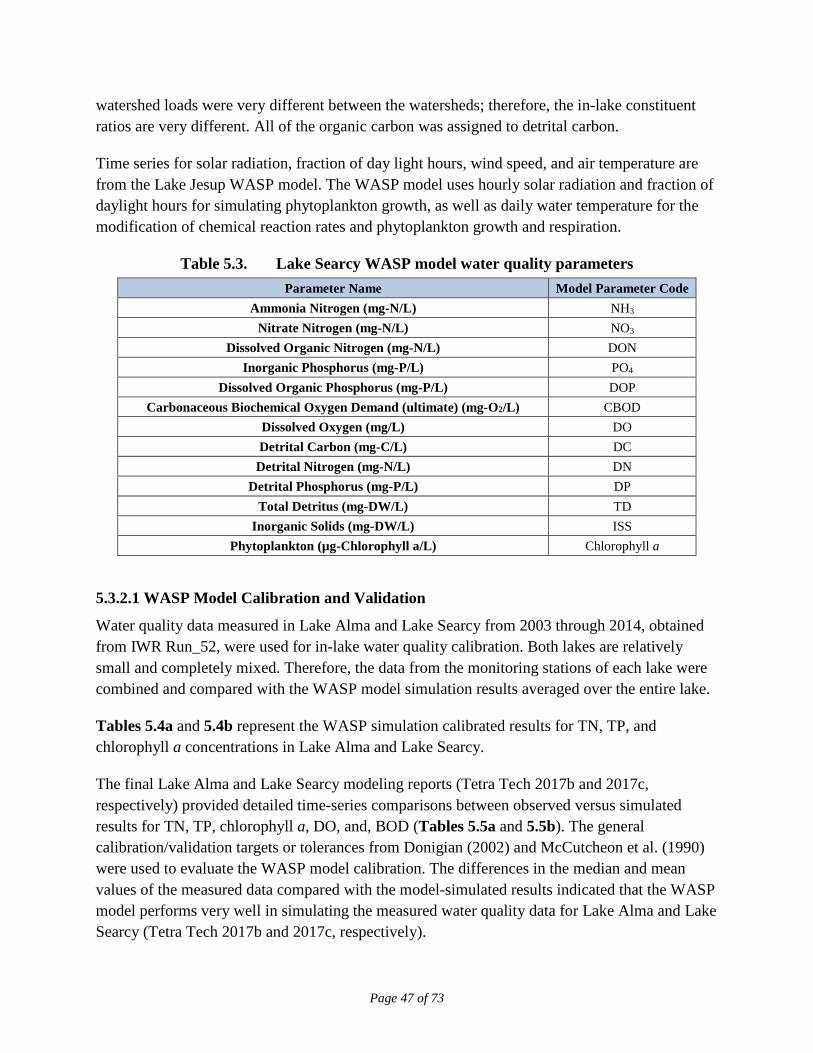
5.3.2 WASP Model The Lake Alma and Lake Searcy EFDC model hydrodynamic results (flows, velocities, volumes, and temperatures) were used to drive the Lake Alma and Searcy WASP models, respectively. The advanced eutrophication module of WASP 8.0 was used to simulate water quality in Lake Alma and Lake Searcy, which was the same approach used for the Lake Jesup WASP model. The Lake Jesup modeling report (Tetra Tech 2017a) provides additional details about the Lake Jesup EFDC and WASP models.
The Lake Jesup watershed HSPF model (Subwatersheds 93 and 94) provided the Lake Alma and Lake Searcy water quality inputs (Table 5.3), which were input into the WASP model as concentrations (mg/L) at a daily time step. The total organic nitrogen loads were divided between dissolved organic nitrogen and detrital nitrogen at a 40:60 ratio for Lake Alma at a 60:40 ratio for Lake Searcy. The total organic phosphorus loads were divided between dissolved organic phosphorus and detrital phosphorus at a 65:35 ratio for Lake Alma and at a 10:90 ratio for Lake Searcy. The split in nutrient constituents is a calibration point in the model, and the ratio was adjusted to achieve the best calibration to the measured data for each lake. As these are small lakes, they are greatly influenced by the watershed loading from the HSPF model. The
Page 47 of 73
watershed loads were very different between the watersheds; therefore, the in-lake constituent ratios are very different. All of the organic carbon was assigned to detrital carbon.
Time series for solar radiation, fraction of day light hours, wind speed, and air temperature are from the Lake Jesup WASP model. The WASP model uses hourly solar radiation and fraction of daylight hours for simulating phytoplankton growth, as well as daily water temperature for the modification of chemical reaction rates and phytoplankton growth and respiration.
Table 5.3. Lake Searcy WASP model water quality parameters Parameter Name Model Parameter Code
Ammonia Nitrogen (mg-N/L) NH3 Nitrate Nitrogen (mg-N/L) NO3
Dissolved Organic Nitrogen (mg-N/L) DON Inorganic Phosphorus (mg-P/L) PO4
Dissolved Organic Phosphorus (mg-P/L) DOP Carbonaceous Biochemical Oxygen Demand (ultimate) (mg-O2/L) CBOD
Dissolved Oxygen (mg/L) DO Detrital Carbon (mg-C/L) DC
Detrital Nitrogen (mg-N/L) DN Detrital Phosphorus (mg-P/L) DP
Total Detritus (mg-DW/L) TD Inorganic Solids (mg-DW/L) ISS
Phytoplankton (µg-Chlorophyll a/L) Chlorophyll a
5.3.2.1 WASP Model Calibration and Validation
Water quality data measured in Lake Alma and Lake Searcy from 2003 through 2014, obtained from IWR Run_52, were used for in-lake water quality calibration. Both lakes are relatively small and completely mixed. Therefore, the data from the monitoring stations of each lake were combined and compared with the WASP model simulation results averaged over the entire lake.
Tables 5.4a and 5.4b represent the WASP simulation calibrated results for TN, TP, and chlorophyll a concentrations in Lake Alma and Lake Searcy.
The final Lake Alma and Lake Searcy modeling reports (Tetra Tech 2017b and 2017c, respectively) provided detailed time-series comparisons between observed versus simulated results for TN, TP, chlorophyll a, DO, and, BOD (Tables 5.5a and 5.5b). The general calibration/validation targets or tolerances from Donigian (2002) and McCutcheon et al. (1990) were used to evaluate the WASP model calibration. The differences in the median and mean values of the measured data compared with the model-simulated results indicated that the WASP model performs very well in simulating the measured water quality data for Lake Alma and Lake Searcy (Tetra Tech 2017b and 2017c, respectively).

Page 48 of 73
Table 5.4a. Lake Alma existing simulation results for TN, TP, and chlorophyll a concentrations (AGMs) using the WASP model
Year TN
(mg/L) TP
(mg/L) Chlorophyll a
(µg/L) 2003 2.27 0.156 45 2004 1.87 0.124 40 2005 2.06 0.136 44 2006 2.02 0.137 48 2007 2.14 0.155 47 2008 1.94 0.129 36 2009 2.08 0.131 44 2010 1.96 0.137 40 2011 1.86 0.130 37 2012 1.95 0.131 41 2013 2.05 0.136 43 2014 1.75 0.124 34 Mean 2.00 0.136 42
Table 5.4b. Lake Searcy existing simulation results for TN, TP, and chlorophyll a concentrations (AGMs) using the WASP model
Year TN
(mg/L) TP
(mg/L) Chlorophyll a
(µg/L) 2003 0.92 0.063 40 2004 0.97 0.062 43 2005 1.05 0.065 46 2006 0.86 0.069 38 2007 0.57 0.075 25 2008 0.80 0.059 38 2009 0.91 0.057 40 2010 1.13 0.073 50 2011 1.09 0.074 51 2012 0.91 0.064 44 2013 0.97 0.066 44 2014 1.05 0.072 50 Mean 0.93 0.067 42
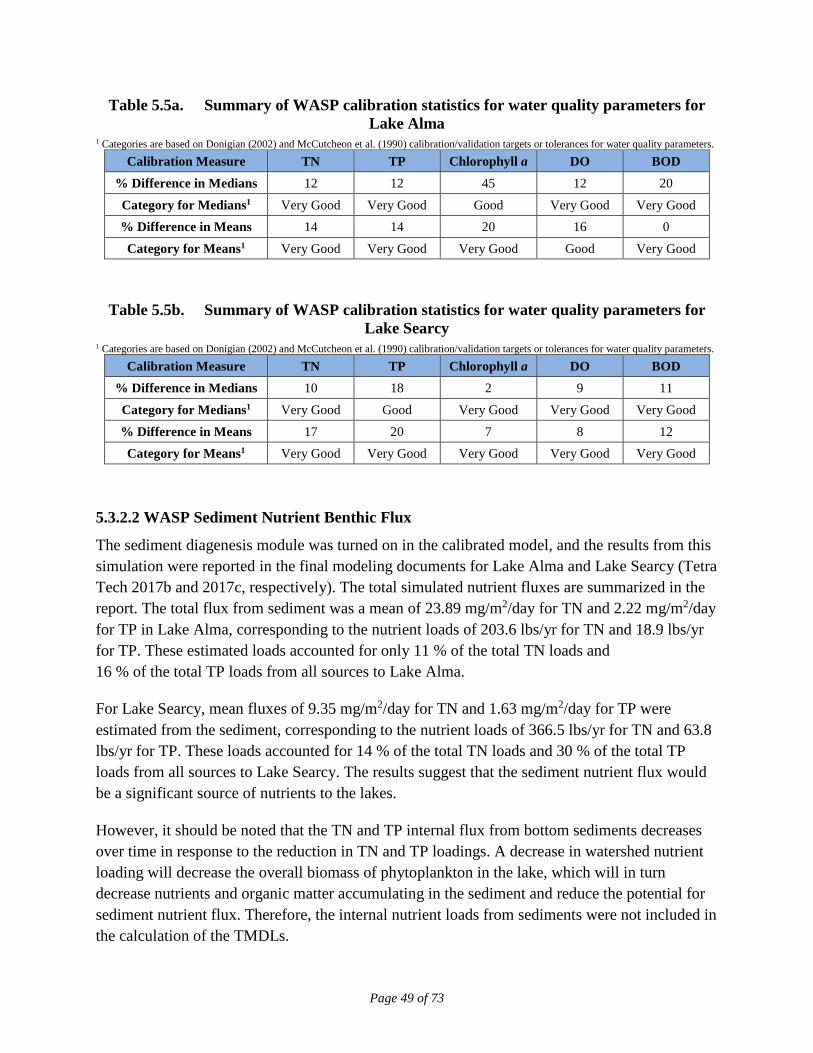
Page 49 of 73
Table 5.5a. Summary of WASP calibration statistics for water quality parameters for Lake Alma
1 Categories are based on Donigian (2002) and McCutcheon et al. (1990) calibration/validation targets or tolerances for water quality parameters.
Calibration Measure TN TP Chlorophyll a DO BOD % Difference in Medians 12 12 45 12 20 Category for Medians1 Very Good Very Good Good Very Good Very Good % Difference in Means 14 14 20 16 0 Category for Means1 Very Good Very Good Very Good Good Very Good
Table 5.5b. Summary of WASP calibration statistics for water quality parameters for Lake Searcy
1 Categories are based on Donigian (2002) and McCutcheon et al. (1990) calibration/validation targets or tolerances for water quality parameters.
Calibration Measure TN TP Chlorophyll a DO BOD % Difference in Medians 10 18 2 9 11 Category for Medians1 Very Good Good Very Good Very Good Very Good % Difference in Means 17 20 7 8 12 Category for Means1 Very Good Very Good Very Good Very Good Very Good
5.3.2.2 WASP Sediment Nutrient Benthic Flux
The sediment diagenesis module was turned on in the calibrated model, and the results from this simulation were reported in the final modeling documents for Lake Alma and Lake Searcy (Tetra Tech 2017b and 2017c, respectively). The total simulated nutrient fluxes are summarized in the report. The total flux from sediment was a mean of 23.89 mg/m2/day for TN and 2.22 mg/m2/day for TP in Lake Alma, corresponding to the nutrient loads of 203.6 lbs/yr for TN and 18.9 lbs/yr for TP. These estimated loads accounted for only 11 % of the total TN loads and 16 % of the total TP loads from all sources to Lake Alma.
For Lake Searcy, mean fluxes of 9.35 mg/m2/day for TN and 1.63 mg/m2/day for TP were estimated from the sediment, corresponding to the nutrient loads of 366.5 lbs/yr for TN and 63.8 lbs/yr for TP. These loads accounted for 14 % of the total TN loads and 30 % of the total TP loads from all sources to Lake Searcy. The results suggest that the sediment nutrient flux would be a significant source of nutrients to the lakes.
However, it should be noted that the TN and TP internal flux from bottom sediments decreases over time in response to the reduction in TN and TP loadings. A decrease in watershed nutrient loading will decrease the overall biomass of phytoplankton in the lake, which will in turn decrease nutrients and organic matter accumulating in the sediment and reduce the potential for sediment nutrient flux. Therefore, the internal nutrient loads from sediments were not included in the calculation of the TMDLs.

Page 50 of 73
5.3.3 Natural Background Conditions The Lake Alma and Lake Searcy EFDC and WASP models were used to estimate the hydraulic and water quality dynamics for the lakes under a natural background scenario. For this purpose, both models were forced with the flows and water quality loads predicted for the simulation of natural background conditions by the HSPF watershed model (see Chapter 4). Only the land uses in the HSPF model were changed. No other modifications were made to the models for the natural background scenario. Additional details about EFDC and WASP natural background simulation can be found in the Lake Alma and Lake Searcy modeling reports (Tetra Tech 2017b and 2017c, respectively).
Tables 5.6a and 5.6b list the results of the WASP natural background simulation for TN, TP, and chlorophyll a concentrations in Lake Alma and Lake Searcy, respectively. When compared with the existing condition (Table 5.6a), for Lake Alma, the long-term average AGMs of TN, TP, and chlorophyll a concentrations decreased from 2.00 mg/L, 0.136 mg/L, and 42 µg/L in the existing condition to 1.01 mg/L, 0.105 mg/L, and 23 µg/L in the natural background condition, respectively. This represents a 49 % decrease in TN, a 23 % decrease in TP, and a 44 % decrease in chlorophyll a concentrations from the existing condition. For Lake Searcy (Table 5.6b), the long-term average AGMs of TN, TP, and chlorophyll a concentrations decreased from 1.00 mg/L, 0.067 mg/L, and 42 µg/L in the existing condition to 0.22 mg/L, 0.039 mg/L, and 8 µg/L in the natural background condition, respectively. This represents a 78 % decrease in TN, a 42 % decrease in TP, and an 81 % decrease in chlorophyll a concentrations from the existing condition.
Table 5.6a. Lake Alma natural background simulation results for TN, TP, and chlorophyll a concentrations (AGMs) using the WASP model
Year TN
(mg/L) TP
(mg/L) Chlorophyll a
(µg/L) 2003 1.40 0.122 34 2004 0.97 0.095 22 2005 0.86 0.086 21 2006 0.60 0.085 14 2007 0.55 0.093 13 2008 0.87 0.096 19 2009 1.77 0.123 42 2010 1.12 0.109 24 2011 0.83 0.106 19 2012 1.01 0.110 22 2013 1.11 0.114 24 2014 1.02 0.117 23 Mean 1.01 0.105 23
80th percentile 30

Page 51 of 73
Table 5.6b. Lake Searcy natural background simulation results for TN, TP, and chlorophyll a concentration s (AGMs) using the WASP model
Year TN
(mg/L) TP
(mg/L) Chlorophyll a
(µg/L) 2003 0.46 0.050 18 2004 0.17 0.042 8 2005 0.16 0.040 7 2006 0.12 0.035 5 2007 0.08 0.032 4 2008 0.17 0.033 8 2009 0.33 0.037 14 2010 0.17 0.043 7 2011 0.13 0.040 6 2012 0.14 0.036 6 2013 0.15 0.036 6 2014 0.13 0.035 6 Mean 0.18 0.038 8
5.3.4 Setting up the Chlorophyll a Criteria Chlorophyll a concentrations in the natural background condition were compared with the NNC. As explained in Chapter 3, when the natural background condition is lower than the NNC, the chlorophyll a criterion is selected as TMDL target. However, when the natural background chlorophyll a is higher than the chlorophyll a criterion, the 80th percentile of the natural background condition is selected as the TMDL target.
For Lake Alma, the modeled chlorophyll a concentration under the natural background condition averaged 23 µg/L and ranged from 13 to 42 µg/L during the modeling period (Table 5.6a), exceeding 20 µg/L 8 times out of 12. Therefore, the 20 µg/L target was not pursued in the Lake Alma nutrient TMDLs. Instead, the 80th percentile of the modeled natural background chlorophyll a concentration was 30 µg/L and it was established as the site-specific chlorophyll a criterion and TMDL target.

Page 52 of 73
The 80th percentile chlorophyll a concentration of the natural background condition was calculated using the following equation:
en
nt
nLnAG SDSDC ∑= −+
1
22 ))*((
Where,
C is the chlorophyll a concentration exceeded at a frequency of one in three years.
LnAG is the natural log of the AGM of chlorophyll a concentration.
n is the number of years that the AGM of chlorophyll a concentration can be calculated.
t is the inverse of the student's t distribution.
SD is the standard deviation of the natural log of the AGM.
For Lake Searcy, the modeled chlorophyll a concentrations under the natural background condition averaged 8 µg/L and ranged from 4 to 18 µg/L and were never exceeded 20 µg/L during the modeling period (Table 5.6b). Therefore, the 20 µg/L target for chlorophyll a will be used in the Lake Searcy nutrient TMDLs.
5.3.5 Load Reduction Scenarios in the WASP Model to Determine the TMDLs For the Lake Alma load reduction scenarios, when the existing total TN and TP loads were iteratively reduced in the WASP model until the AGMs of simulated chlorophyll a did not exceed the target (30 µg/L). Figure 5.6 shows the daily average concentrations for chlorophyll a, model simulation under the existing, natural background, and TMDL conditions. For the final load reduction scenario, referred to as the TMDL condition, the existing TN and TP loads were reduced by 43 % and 17 %, respectively (Figure 5.7).
For the Lake Searcy load reduction scenarios, when the existing total TN and TP loads were also iteratively reduced until the AGMs of simulated chlorophyll a did not exceed the target (20 µg/L). Figure 5.8 shows the daily average concentrations for chlorophyll a, model simulation under the existing, natural background, and TMDL conditions. For the TMDL condition, the existing TN and TP loads were reduced by 65 % and 38 %, respectively (Figure 5.9).
The TN and TP concentrations necessary for restoration are presented for informational purposes only and represent the simulated in-lake TN and TP concentrations corresponding to the target chlorophyll a concentrations of 30 µg/L for Lake Alma and 20 µg/L for Lake Searcy. The TN

Page 53 of 73
and TP restoration concentrations for Lake Alma are AGM concentrations of 1.41 mg/L and 0.13 mg/L, respectively and for Lake Searcy 0.45 mg/L and 0.05 mg/L, respectively. These TN and TP restoration concentrations are provided for comparative purposes only.
5.3.6 Calculation of the TMDLs The final allowable TMDLs for Lake Alma and Lake Searcy should be calculated by including all incoming TN and TP loads such as watershed loads and atmospheric loads, as listed in Tables 5.7a, 5.7b, 5.8a, and 5.8b, respectively. A 7-year rolling average was applied to the distribution of yearly TN and TP loads, and the maximum of the resulting 7-year averages of TN and TPs loads were chosen as the site-specific interpretations of the narrative nutrient criterion pursuant to Paragraph 62-302.530(90)(b), F.A.C. However, the direct atmospheric deposition of TN and TP on the lake surface is not regulated by the CWA and was kept the same for the TMDL load calculation as the existing atmospheric TN and TP deposition.
The TMDL condition loads for TN and TP were used in the derivation of the nutrient TMDL values to be used as the site-specific interpretations of the narrative nutrient criterion for TN and TP. For Lake Alma, a 43 % reduction in the existing TN loads and an 17 % reduction in the existing TP loads are necessary to meet the chlorophyll a criterion (30 µg/L), not to be exceeded. The nutrient TMDL values, which are expressed as a 7-year average load not to be exceeded, address the anthropogenic nutrient inputs that contribute to the exceedances of the chlorophyll a criterion. The TMDLs for TN and TP are 1,036 lbs/yr and 91 lbs/yr, respectively.
For Lake Searcy, a 65 % reduction in the existing TN loads and an 38 % reduction in the existing TP loads are necessary to meet the chlorophyll a criterion (20 µg/L), not to be exceeded more than once in any consecutive three-year period. The nutrient TMDL values, which are expressed as a 7-year average load not to be exceeded, address the anthropogenic nutrient inputs that contribute to the exceedances of the chlorophyll a criterion. The TMDLs for TN and TP are 845 lbs/yr and 96 lbs/yr, respectively.
5.3.7 Critical Conditions and Seasonal Variation The estimated assimilative capacity is based on annual conditions, rather than critical/seasonal conditions, because (1) the methodology used to determine assimilative capacity does not lend itself very well to short-term assessments, (2) DEP is generally more concerned with the net change in overall primary productivity in the segment, which is better addressed on an annual basis, and (3) the methodology used to determine impairment is based on annual conditions (AGMs or arithmetic means).

Page 54 of 73
Figure 5.6. WASP Model Simulated chlorophyll a concentration in time series for existing (blue line), natural background (black line), and 43 % TN and 17 % TP reductions
(red line) in Lake Alma
Figure 5.7. AGMs of chlorophyll a for existing (purple bars), natural background (gray
bars), and TMDL conditions (blue bars) in Lake Alma. The red lines represent the chlorophyll a target of 30 µg/L.

Page 55 of 73
Figure 5.8. WASP Model Simulated chlorophyll a concentration in time series for existing (blue line), natural background (black line), and 65 % TN and 38 % TP reductions
(red line) in Lake Searcy
Figure 5.9. AGMs of chlorophyll a for existing (purple bars), natural background (gray
bars), and TMDL conditions (blue bars) in Lake Searcy. The red lines represent the chlorophyll a target of 20 µg/L.

Page 56 of 73
Table 5.7a. Load reduction scenarios for TN under the existing (from the HSPF model) and TMDL condition (43 % reduction) in Lake Alma. Red highlighting and asterisk
represent the TMDL.
Year
Existing Total TN Loads
(lbs/yr)
Allowable Total TN Loads
under 43 % Reduction
(lbs/yr)
Atmospheric TN Deposition
(lbs/yr)
Allowable Watershed TN Loads under
43 % Reduction (lbs/yr)
7-Year Rolling Average To
Determine TN TMDL (lbs/yr)
2003 1,949 1,111 131 980
2004 1,672 953 127 826
2005 1,806 1,029 136 893
2006 638 364 68 296
2007 885 504 83 421
2008 2,653 1,512 219 1,293
2009 1,699 968 119 849 920 2010 1,297 739 101 638 867 2011 1,965 1,120 131 989 891 2012 1,641 935 109 826 878 2013 1,531 873 114 759 950 2014 1,939 1,105 128 977 1,036*
Average 1,640 935 122 812 924
Table 5.7b. Load reduction scenarios for TP under the existing (from the HSPF model) and TMDL condition (17 % reduction) in Lake Alma. Red highlighting and asterisk
represent the TMDL.
Year
Existing Total TP Loads
(lbs/yr)
Allowable Total
TP Loads under 17 % Reduction
(lbs/yr)
Atmospheric TP Deposition
(lbs/yr)
Allowable Watershed TP Loads under
17 % Reduction (lbs/yr)
7-Year Rolling Average To
Determine TP TMDL (lbs/yr)
2003 117 97 6 91
2004 101 84 6 78
2005 108 90 6 84
2006 42 35 3 32
2007 56 46 4 42
2008 153 127 10 117
2009 103 85 5 80 81 2010 81 67 5 62 76 2011 120 100 6 94 79 2012 100 83 5 78 78 2013 92 76 5 71 84 2014 120 100 6 94 91*
Average 99 83 6 77 81

Page 57 of 73
Table 5.8a. Load reduction scenarios for TN under the existing (from the HSPF model) and TMDL condition (65 % reduction) in Lake Searcy. Red highlighting and asterisk
represent the TMDL.
Year
Existing Total TN Loads
(lbs/yr)
Allowable Total TN Loads under 65 % Reduction (lbs/yr)
Atmospheric TN
Deposition (lbs/yr)
Allowable Watershed TN
Loads under 65 % Reduction (lbs/yr)
7-Year Rolling Average To
Determine TN TMDL (lbs/yr)
2003 2,707 947 208 739
2004 2,296 804 200 604
2005 2,675 936 212 724
2006 1,403 491 113 378
2007 1,582 554 132 422
2008 3,034 1,062 308 754
2009 2,211 774 181 593 795 2010 2,151 753 162 591 768 2011 2,504 876 202 674 778 2012 2,214 775 166 609 755 2013 2,256 790 186 604 798 2014 2,533 887 206 681 845*
Average 2,297 804 190 614 790
Table 5.8b. Load reduction scenarios for TP under the existing (from the HSPF model) and TMDL condition (38 % reduction) in Lake Searcy. Red highlighting and asterisk
represent the TMDL.
Year Existing Total
TP Loads
Allowable Total
TP Loads under 38 % Reduction
(lbs/yr)
Atmospheric TP
Deposition (lbs/yr)
Allowable Watershed TP Loads under
38 % Reduction (lbs/yr)
7-Year Rolling Average To
Determine TP TMDL (lbs/yr)
2003 168 104 9 95
2004 144 89 9 80
2005 165 102 9 93
2006 97 60 5 55
2007 106 66 6 60
2008 198 123 14 109
2009 138 86 8 78 90 2010 139 86 7 79 87 2011 162 100 9 91 89 2012 138 86 7 79 87 2013 142 88 8 80 91 2014 165 102 9 93 96*
Average 147 91 8 83 90

Page 58 of 73
Chapter 6: Determination of the TMDL
6.1 Expression and Allocation of the TMDLs The objective of a TMDL is to provide a basis for allocating acceptable loads among all the known pollutant sources in a watershed so that appropriate control measures can be implemented and water quality standards achieved. A TMDL is expressed as the sum of all point source loads (wasteload allocations, or WLAs), nonpoint source loads (load allocations, or LAs), and an appropriate margin of safety (MOS), which takes into account any uncertainty concerning the relationship between effluent limitations and water quality:
TMDL = ∑ WLAs + ∑ LAs + MOS
As discussed earlier, the WLA is broken out into separate subcategories for wastewater discharges and stormwater discharges regulated under the NPDES Program:
TMDL ≅ ∑ WLAswastewater + ∑ WLAsNPDES Stormwater + ∑ LAs + MOS
It should be noted that the various components of the revised TMDL equation may not sum up to the value of the TMDL because (1) the WLA for NPDES stormwater is typically based on the percent reduction needed for nonpoint sources and is also accounted for within the LA, and (2) TMDL components can be expressed in different terms (for example, the WLA for stormwater is typically expressed as a percent reduction, and the WLA for wastewater is typically expressed as mass per day).
WLAs for stormwater discharges are typically expressed as a "percent reduction" because it is very difficult to quantify the loads from MS4s (given the numerous discharge points) and to distinguish loads from MS4s from other nonpoint sources (given the nature of stormwater transport). The permitting of stormwater discharges also differs from the permitting of most wastewater point sources. Because stormwater discharges cannot be centrally collected, monitored, and treated, they are not subject to the same types of effluent limitations as wastewater facilities, and instead are required to meet a performance standard of providing treatment to the "maximum extent practical" through the implementation of BMPs.
This approach is consistent with federal regulations (40 Code of Federal Regulations § 130.2[I]), which state that TMDLs can be expressed in terms of mass per time (e.g., pounds per day), toxicity, or other appropriate measure. The TMDLs for Lake Alma and Lake Searcy are expressed in terms of lbs/yr and percent reduction of TN and TP, and represent the maximum long-term annual average TN and TP loadings the lake can assimilate and maintain a balanced aquatic flora and fauna (Table 6.1).

Page 59 of 73
Based on an EPA memorandum (2006), daily loads of TN and TP from point and nonpoint sources were also calculated. These daily loads were calculated by dividing the annual loads by 365 days/yr and are only provided in this report for informational purposes. The implementation of the TMDLs in this report should be carried out using an annual time scale.
Table 6.1. TMDL components for nutrients in Lake Alma (WBID 2986D) and Lake Searcy (WBID 2986E)
N/A = Not applicable Note: The daily loading targets for TN and TP are 2.8 and 0.2 lbs/day for Lake Alma and 2.3 and 0.3 lbs/day for Lake Searcy, respectively. * The required percent reductions listed in this table represent the reduction from all sources. The needed percent reduction to each individual source type can be calculated based on the relative load contribution from each source type provided in Chapter 5.
WBID Parameter TMDL (lbs/yr)
WLA Wastewater
(lb/yr)
WLA* Stormwater
(% reduction) LA*
(% reduction) MOS 2986D TN 1,036 N/A 43 43 Implicit 2986D TP 91 N/A 17 17 Implicit 2986E TN 845 N/A 65 65 Implicit 2986E TP 96 N/A 38 38 Implicit
6.2 Load Allocation To achieve the load allocation (LA), current TN and TP loads require reductions of 43 % and 17 % for Lake Alma (WBID 2986D) and 65 % and 38 % for Lake Searcy (WBID 2986E), respectively. As these percent reductions are for the total loads from all sources, and load reductions are not required from natural land uses, the percent reductions for anthropogenic sources may be greater. It should be noted that the LA may include loads from stormwater discharges regulated by DEP and the SJRWMD that are not part of the NPDES Stormwater Program (see Appendix A).
6.3 Wasteload Allocation
6.3.1 NPDES Wastewater Discharges No NPDES-permitted wastewater discharges were identified in the Lake Alma and Lake Searcy Watersheds.
6.3.2 NPDES Stormwater Discharges The stormwater collection systems in the watersheds, which are owned and operated by Seminole County and co-permittees (FDOT District 5 and the City of Longwood), are covered by an NPDES Phase I MS4 permit (FLS000038). The MS4 permittees are responsible for a 43 % reduction in TN and a 17 % reduction in TP from the current anthropogenic loading in the Lake Alma Watershed. Likewise, a 65 % reduction in TN and a 38 % reduction in TP is necessary in the Lake Searcy Watershed. It should be noted that any MS4 permittee is only responsible for reducing the anthropogenic loads associated with stormwater outfalls that it owns or otherwise has responsible control over.

Page 60 of 73
6.4 Margin of Safety TMDLs must address uncertainty issues by incorporating an MOS into the analysis. The MOS is a required component of a TMDL and accounts for the uncertainty about the relationship between pollutant loads and the quality of the receiving waterbody (CWA, Section 303[d][1][c]). Considerable uncertainty is usually inherent in estimating nutrient loading from nonpoint sources, as well as predicting water quality response. The effectiveness of management activities (e.g., stormwater management plans) in reducing loading is also subject to uncertainty. The MOS can either be implicitly accounted for by choosing conservative assumptions about loading or water quality response, or explicitly accounted for during the allocation of loadings.
Consistent with the recommendations of the Allocation Technical Advisory Committee (DEP 2001), an implicit MOS was used in the development of the Lake Alma and Lake Searcy TMDLs, because the TMDLs were based on the conservative decisions associated with a number of the modeling assumptions in determining assimilative capacity (i.e., loading and water quality response) for Lake Alma and Lake Searcy. TMDLs were determined as the maximum annual average loads of TN and TP from 7-year average loads as the site-specific TN and TP interpretations of the narrative nutrient criterion, as well as modeled to attain the chlorophyll a in all years, for Lake Alma and Lake Searcy. The TMDLs were also developed using water quality results from both high- and low-rainfall years.

Page 61 of 73
Chapter 7: TMDL Implementation
7.1 Implementation Mechanisms Following the adoption of a TMDL, implementation takes place through various measures. The implementation of TMDLs may occur through specific requirements in NPDES wastewater and MS4 permits, and, as appropriate, through local or regional water quality initiatives or BMAPs.
Facilities with NPDES permits that discharge to the TMDL waterbody must respond to the permit conditions that reflect target concentrations, reductions, or wasteload allocations identified in the TMDL. NPDES permits are required for Phase I and Phase II MS4s as well as domestic and industrial wastewater facilities. MS4 Phase I permits require that the permit holder prioritize and take action to address a TMDL unless management actions are already defined in a BMAP. MS4 Phase II permit holders must also implement responsibilities defined in a BMAP.
7.2 BMAPs BMAPs are discretionary and are not initiated for all TMDLs. A BMAP is a TMDL implementation tool that integrates the appropriate management strategies applicable through existing water quality protection programs. DEP or a local entity may develop a BMAP that addresses some or all of the contributing areas to the TMDL waterbody.
Section 403.067, F.S. (FWRA), provides for the development and implementation of BMAPs. BMAPs are adopted by the DEP Secretary and are legally enforceable.
BMAPs describe the management strategies that will be implemented, as well as funding strategies, project tracking mechanisms, water quality monitoring, and fair and equitable allocations of pollution reduction responsibilities to the sources in the watershed. BMAPs also identify mechanisms to address potential pollutant loading from future growth and development. The most important component of a BMAP is the list of management strategies to reduce pollution sources, as these are the activities needed to implement the TMDL. The local entities who will conduct these management strategies are identified and their responsibilities are enforceable. Management strategies may include wastewater treatment upgrades, stormwater improvements, and agricultural BMPs. Additional information about BMAPs is available on the DEP website.
7.3 Implementation Considerations for Lake Alma and Lake Searcy Since a BMAP is already adopted (May 2010) for Lake Jesup in the Middle St. Johns River Basin to provide the conceptual plan for restoration, the TMDLs for Lake Alma and Lake Searcy may be incorporated into this effort. Restoration activities developed and implemented under the BMAP, would depend heavily on the active participation of the St. Johns River Water Management District (SJRWMD), the Florida Department of Transportation (FDOT), Seminole

Page 62 of 73
County Public Works, the City of Longwood, businesses, and other stakeholders. FDEP is working with these organizations and individuals to undertake reductions in the discharge of pollutants and achieve the established TMDLs for Lake Alma and Lake Searcy. Seminole County and Lake Watch have already been actively involved in data collection and analysis. In addition to addressing reductions in watershed pollutant contributions to impaired waters during the implementation phase, it may also be necessary to consider the impacts of any associated remediation projects on surface water quality.

Page 63 of 73
References
Donigian, A.S. 2002. Watershed model calibration and validation: The HSPF experience. Mountain View, CA: AQUA TERRA Consultants.
Florida Department of Environmental Protection. 2001. A report to the Governor and the Legislature on the allocation of total maximum daily loads in Florida. Tallahassee, FL: Allocation Technical Advisory Committee, Division of Water Resource Management, Bureau of Watershed Management.
———. 2012. Development of numeric nutrient criteria for Florida lakes, spring vents, and streams. Technical support document. Tallahassee, FL: Division of Environmental Assessment and Restoration, Standards and Assessment Section.
Florida Department of Transportation. 1999. Florida Land Use, Cover and Forms Classification System (FLUCCS). Tallahassee, FL: Florida Department of Transportation Thematic Mapping Section.
Jia, Y. 2015. Hydrologic and water quality modeling of the Lake Jesup Watershed. Palatka, FL: St. Johns River Water Management District.
McCutcheon, S.C., J.L. Martin, and R.B. Ambrose. 1990. Technical guidance manual for performing waste load allocations, Book III: Estuaries, Part 2: Application of estuarine waste load allocation models. Washington, DC: U.S. Environmental Protection Agency.
Tetra Tech, Inc. 2017a. Hydrology and water quality modeling report for the Lake Jesup Watershed, Florida. Report to the Florida Department of Environmental Protection, Tallahassee, FL.
———. 2017b. Hydrology and water quality modeling report for the Lake Alma Watershed, Florida. Report to the Florida Department of Environmental Protection, Tallahassee, FL.
———. 2017c. Hydrology and water quality modeling report for the Lake Searcy Watershed, Florida. Report to the Florida Department of Environmental Protection, Tallahassee, FL.
U.S. Environmental Protection Agency. 2006. Establishing TMDL "daily" loads in light of the decision by the U.S. Court of Appeals for the D.C. Circuit in Friends of the Earth, Inc. v. EPA, et al., No.05-5015, (April 25, 2006) and implications for NPDES permits. Memorandum from Benjamin Grumbles, Assistant Administrator, Office of Water. Washington, DC: U.S. Environmental Protection Agency.
Viessman, W. Jr., G.L. Lewis, and J.W. Knapp. 1989. Introduction to hydrology. Third edition. New York: Harper Collins.

Page 64 of 73
Appendices
Appendix A: Summary of Information in Support of Site-Specific Interpretations of the Narrative Nutrient Criterion for Lake Alma and Lake Searcy
Table A-1. Spatial extent of the waterbody where the site-specific numeric interpretation of the narrative nutrient criterion will apply Location Descriptive Information
Waterbody name Lake Alma and Lake Searcy Waterbody type(s) Lake
Waterbody ID (WBID) WBIDs 2986D and 2986E (see Figure 1.1 of this report)
Description
Lake Alma and Lake Searcy are located in Seminole County, Florida.
The surface area of Lake Alma is 3 acres. The lake receives runoff from a watershed of 258 acres occupied by residential areas and pasture. There are no obvious inflows to the lake.
The lake is characterized by high nutrients, high chlorophyll a concentration, and low transparency.
The surface area of Lake Searcy is 13 acres. The lake receives
runoff from a watershed area of 284 acres occupied by wetlands and residential land uses. There is no obvious surface
inflow to the lake. Lake Searcy is predominantly high color eutrophic lake.
Specific location (latitude/longitude or river miles)
The center of Lake Alma is located at Latitude N: 28°43'4.12," Longitude W: - 81°21'12.66" and the center of Lake Searcy is
located at Latitude N: 28°42'21.44," Longitude W: - 81°21'20.95"
Map
Figures 1.1 and 4.2 show the general location of Lake Alma and Lake Searcy and their watersheds, and land uses in the
watersheds, respectively. For Lake Alma, watershed land uses include residential (49 %), agriculture (36 %), wetlands (9 %), and forest (3 %). For Lake Searcy, watershed land uses include
urban and residential (75 %) and wetland (18 %). Classification(s) Class III Freshwater
Basin name (HUC-8) Middle St. John River Basin (03080101)

Page 65 of 73
Table A-2. Default NNC, site-specific interpretations of the narrative criterion developed as TMDL targets, and data used to develop the site-specific interpretation of the
narrative criterion Narrative Nutrient Criterion Description
NNC summary
Lake Alma and Lake Searcy are high-color lakes, and the default NNC, expressed as AGM concentrations not to be
exceeded more than once in any 3-year period, are chlorophyll a of 20 µg/L, TN of 1.27 to 2.23 mg/L, and TP of 0.05 to 0.16
mg/L.
Proposed TN, TP, and chlorophyll a,
Numeric interpretations of the narrative nutrient criterion: The NNC for chlorophyll a in Lake Alma is 30 µg/L, expressed
as an AGM concentration not to be exceeded. TN and TP NNC are expressed as 7-year annual average loads not to be exceeded. The Lake Alma TN and TP loads are 1,036
and 91 lbs/yr, respectively. Nutrient concentrations are provided for comparative purposes only. The TN and TP restoration concentrations for Lake Alma
are 1.41 and 0.13 mg/L, respectively. These restoration concentrations represent the in-lake concentrations that would
meet the target chlorophyll a concentration of 30 µg/L.
The NNC for chlorophyll a in Lake Searcy is the generally applicable chlorophyll a criterion for high color lakes, 20 µg/L, expressed as an AGM concentration not to be exceeded more
than once in any consecutive three-year period. TN and TP NNC are expressed as 7-year annual average loads not to be exceeded. The Lake Searcy TN and TP loads are 845
and 96 lbs/yr, respectively. Nutrient concentrations are provided for comparative purposes
only. The TN and TP restoration concentrations for Lake Searcy are 0.45 and 0.05 mg/L, respectively. These restoration concentrations represent the in-lake concentrations that would
meet the target chlorophyll a concentration of 20 µg/L.
Period of record used to develop the numeric interpretations of the narrative nutrient
criterion for TN and TP criteria
The criteria were developed based on the application of the HSPF watershed model, the receiving water EFDC model that
simulated hydrodynamics, and the receiving water WASP model that simulated water quality conditions over the 2003–14
period. The primary datasets for this period include water quality data from the IWR Database (IWR_Run 52), rainfall
and evapotranspiration data obtained from the SJRWMD, and lake stage data for Lake Searcy from 2003 to 2014 obtained from Seminole County. Land use data were used to establish
the watershed nutrient loads. For the model simulation period, the SJRWMD 2009 land use coverage was used.

Page 66 of 73
Narrative Nutrient Criterion Description
Indicate how criteria developed are spatially and temporally representative of the
waterbody or critical condition
The model simulated the 2003–14 period, which included both wet and dry years. During this period, total annual average rainfall ranged from 34.3 to 66.7 inches and averaged 51.0 inches. A comparison with long-term average rainfall data
indicated that 2006 and 2010 were dry years, while 2004, 2008, and 2014 were considered wet years.
The SJRWMD used the National Weather Service NEXRAD rainfall data as the model input for estimating nutrient loads from the watersheds. These rainfall datasets have a spatial
resolution of two kilometers by two kilometers, which properly represents the spatial heterogeneity of rainfall in the targeted
watershed area. The model simulated each lake's entire watershed to evaluate how changes in watershed loads impact
lake nutrient and chlorophyll a concentrations.
In addition, model calibration for the Lake Alma and Lake Searcy TMDLs was based on water quality data collected
across each lake. Figure 5.1 shows the locations of the water quality sampling stations used in the Lake Alma and Lake
Searcy model calibration process. These properly represent the spatial distribution of the lakes' nutrient dynamics.

Page 67 of 73
Table A-3. History of nutrient impairment, quantitative indicators of designated use support, and methodologies used to develop the site-specific interpretation of the narrative
criterion Designated Use Description
History of assessment of designated use support
DEP used the IWR (Chapter 62-303, F.A.C.) to assess water quality in Lake Alma and Lake Searcy. The lakes were initially verified as impaired for nutrients during the Cycle 1 assessment
(verified period January 1, 1996–June 30, 2003) using the methodology in the IWR, and were included on the Cycle 1
Verified List of impaired waters for the Middle St. John River Basin adopted by Secretarial Order on May 27, 2004.
Subsequently, the nutrient impairments were confirmed in the Cycle 2 assessment (January 1, 2001–June 30, 2008).
DEP also assessed water quality in Lake Alma and Lake Searcy using the lake NNC. The results confirmed that both lakes were
impaired for nutrients.
Lake Alma was found to be impaired for chlorophyll a (years when the AGM of 20 µg/L was exceeded: 2005, 2011, 2012,
and 2014), TN (years when the AGM of 1.27 mg/L was exceeded: 2005–12 and 2014), and TP (years when the AGM
of 0.05 mg/L was exceeded: 2006–12 and 2014).
Lake Searcy was found to be impaired for chlorophyll a (2003-05 and 2012) and TP (2003–05, 2009, and 2012) but was not
impaired for TN
Basis for use support
For Lake Searcy, the basis for use support is the NNC chlorophyll a concentration of 20 µg/L, which is protective of
designated uses for high-color lakes.
The chlorophyll a target for Lake Alma is based on an estimate of natural background condition, which is inherently protective
of designated uses.

Page 68 of 73
Designated Use Description
Summarize approach used to develop criteria and how it protects uses
For the Lake Alma and Lake Searcy nutrient TMDLs, DEP created loading-based criteria using an HSPF watershed
loading model to simulate loading from both watersheds. This information was fed into the receiving water models (EFDC
and WASP) for the lakes.
For the Lake Searcy nutrient TMDLs, DEP established the generally applicable chlorophyll a criterion as the TMDL target because in-lake chlorophyll a AGM concentrations were lower
than 20 µg/L at the natural background condition. The generally applicable chlorophyll a criterion demonstrated to be protective of the designated use for high-color lakes and the TN and TP loads established to achieve the 20 µg/L concentration
target will also be protective of the designated use.
For the Lake Alma nutrient TMDLs, DEP established the chlorophyll a target concentration using the 80th percentile of the model-simulated natural background condition because in-lake chlorophyll a AGM concentrations were higher than 20
µg/L at the natural background condition. The 80th percentile of the natural background concentrations of chlorophyll a was
30 µg/L for Lake Alma
Because the site-specific chlorophyll a criterion and nutrient loads are based on natural background condition, the site-specific interpretations of chlorophyll a, TN, and TP are protective of designated uses. Setting the chlorophyll a
criterion at the 80th percentile of concentrations of natural background condition is consistent with consistent with a 1-in-3-year exceedance rate used in developing the Florida NNC.
For the two lakes, the maximum of the seven-year averages of TN and TP loadings to achieve the chlorophyll a criteria was determined by incrementally decreasing the TN and TP loads
from anthropogenic sources into the lakes until the chlorophyll a criterion was achieved. Chapter 5 of this report contains a
more detailed description of the derivation of the TMDLs and criteria.
Discuss how the TMDL will ensure that nutrient-related parameters are attained to
demonstrate that the TMDL will not negatively impact other water quality criteria.
DEP notes that no other impairments were verified for Lake Alma and Lake Searcy that may be related to nutrients (such as
DO or un-ionized ammonia). Reducing the nutrient loads entering the lake will not negatively impact other water quality
parameters in the lake.

Page 69 of 73
Table A-4. Site-specific interpretation of the narrative criterion and the protection of designated use for downstream segments
Downstream Protection and Monitoring Description
Identification of downstream waters
There is no data to indicate discharge from Lake Alma, but according to the Lake Jesup HSPF model, Lake Alma and Lake
Searcy discharge the surface water to Soldier Creek (WBID 2986), a Class III freshwater stream. Based on the most recent
assessment, completed on April 27, 2016, for the Group 2 basins, Soldier Creek is not impaired for nutrients. As evidenced by the healthy existing condition in Soldier Creek, the existing loads
from Lake Searcy and Lake Alma to the creek have not led to an impairment of the downstream water. Therefore, the reductions in nutrient loads prescribed in the TMDLs are not expected to
cause nutrient impairments downstream. Soldier Creek discharges its surface water to Lake Jesup (WBID
2981). When compared average TN and TP concentrations (2007–2014) between Soldier Creek (TN: 1.00 mg/L, TP: 0.11
mg/L) and Lake Jesup (TN: 2.81mg/L, TP: 0.13 mg/L), the former has lower concentrations. Therefore, the TN and TP loads from Soldier Creek will be protective of the nutrient conditions
in the downstream water, Lake Jesup. The nutrient load reductions in Lake Alma and Lake Searcy described in this
TMDL analysis are not expected to cause nutrient impairments downstream but will result in water quality improvements to
downstream waters.
Provide summary of existing monitoring and assessment related to implementation of
Paragraph 62-302.531(4), F.A.C., and trends tests in Chapter 62-303, F.A.C.
Water quality data were collected in Lake Alma by DEP and Seminole County, and in Lake Searcy, by DEP, Seminole
County, and LakeWatch. These organizations will continue to carry out monitoring activities in the lakes to evaluate future
water quality trends. The data collected will be used to evaluate the effect of BMPs implemented in the watersheds on lake TN and TP concentrations in subsequent water quality assessment
cycles.

Page 70 of 73
Table A-5. Public participation and legal requirements of rule adoption Administrative Requirements Descriptive Information
Notice and comment notifications
DEP published a Notice of Development of Rulemaking on April 6, 2015, to initiate TMDL development for impaired waters in the Middle St. Johns River Basin. Technical workshops for the Lake Alma and Lake Searcy TMDLs were held on April 13,
2017, to present the general TMDL approach to local stakeholders. A rule development public workshop for the TMDLs was held on September 29, 2017. A 30-day public
comment period was provided to the stakeholders. No public comments were received for the TMDLs. DEP published an
updated Notice of Development of Rulemaking on January 17, 2017, covering the Middle St. Johns River Basin, to address the need for TMDLs to be adopted within 1 year after the Notice of
Development of Rulemaking is published.
Hearing requirements and adoption format used; responsiveness summary
Following the publication of the Notice of Proposed Rule, DEP will provide a 21-day challenge period and a public hearing that
will be noticed no less than 45 days prior.
Official submittal to the EPA for review and General Counsel certification
If DEP does not receive a challenge, the certification package for the rule will be prepared by DEP's program attorney. DEP will prepare the TMDLs and submittal package for the TMDL to be considered a site-specific interpretation of the narrative nutrient
criterion, and submit these documents to the EPA.

Page 71 of 73
Appendix B: Background Information on Federal and State Stormwater Programs
In 1982, Florida became the first state in the country to implement statewide regulations to address the issue of nonpoint source pollution by requiring new development and redevelopment to treat stormwater before it is discharged. The Stormwater Rule, as authorized in Chapter 403, F.S., was established as a technology-based program that relies on the implementation of BMPs designed to achieve a specific level of treatment (i.e., performance standards) as set forth in Chapter 62-40, F.A.C. In 1994, DEP's stormwater treatment requirements were integrated with the stormwater flood control requirements of the water management districts, along with wetland protection requirements, into the Environmental Resource Permit (ERP) regulations, as authorized under Part IV of Chapter 373, F.S.
Chapter 62-40, F.A.C., also requires the state's water management districts to establish stormwater pollutant load reduction goals (PLRGs) and adopt them as part of a Surface Water Improvement and Management (SWIM) Program plan, other watershed plan, or rule. Stormwater PLRGs are a major component of the load allocation part of a TMDL. To date, they have been established for Tampa Bay, Lake Thonotosassa, the Winter Haven Chain of Lakes, the Everglades, Lake Okeechobee, and Lake Apopka.
In 1987, the U.S. Congress established Section 402(p) as part of the federal CWA Reauthorization. This section of the law amended the scope of the federal NPDES permitting program to designate certain stormwater discharges as "point sources" of pollution. The EPA promulgated regulations and began implementing the Phase I NPDES Stormwater Program in 1990 to address stormwater discharges associated with industrial activity, which includes 11 categories of industrial activity, construction activities disturbing 5 or more acres of land, and large and medium MS4s located in incorporated places and counties with populations of 100,000 or more.
However, because the master drainage systems of most local governments in Florida are physically interconnected, the EPA implemented Phase I of the MS4 permitting program on a countywide basis, which brought in all cities (incorporated areas), Chapter 298 special districts; community development districts, water control districts, and FDOT throughout the 15 counties meeting the population criteria. DEP received authorization to implement the NPDES Stormwater Program in 2000. Its authority to administer the program is set forth in Section 403.0885, F.S.
The Phase II NPDES stormwater program, promulgated in1999, addresses additional sources, including small MS4s and small construction activities disturbing between 1 and 5 acres, and urbanized areas serving a minimum resident population of at least 1,000 individuals. While these urban stormwater discharges are technically referred to as "point sources" for the purpose of regulation, they are still diffuse sources of pollution that cannot be easily collected and treated by

Page 72 of 73
a central treatment facility, as are other point sources of pollution such as domestic and industrial wastewater discharges. It should be noted that Phase I MS4 permits issued in Florida include a reopener clause that allows permit revisions to implement TMDLs when the implementation plan is formally adopted.

Page 73 of 73
Appendix C: Important Links Cover page: DEP website: http://www.dep.state.fl.us Acknowledgments: Email for Kyeongsik Rhew: [email protected] Email for Moira Homann: [email protected] Websites: DEP TMDL Program: http://www.dep.state.fl.us/water/tmdl/index.htm DEP Identification of Impaired Surface Waters Rule: https://www.flrules.org/gateway/ChapterHome.asp?Chapter=62-303 Florida STORET Program: https://floridadep.gov/dear/watershed-services/content/winstoret 2016 Integrated Report: https://floridadep.gov/dear/water-quality-assessment DEP Criteria for Surface Water Quality Classifications: https://www.flrules.org/gateway/ChapterHome.asp?Chapter=62-302 DEP Surface Water Quality Standards: https://www.flrules.org/gateway/ChapterHome.asp?Chapter=62-302 EPA Region 4: TMDLs in Florida: https://archive.epa.gov/pesticides/region4/water/tmdl/web/html/index-2.html EPA National STORET Program: https://www.epa.gov/waterdata/storage-and-retrieval-and-water-quality-exchange Chapter 4: National Atmospheric Deposition Program: http://nadp.sws.uiuc.edu/ Chapter 7: DEP BMAP website: https://floridadep.gov/dear/water-quality-restoration/content/basin-management-action-plans-bmaps