Embed Size (px)
Citation preview

Lafayette Boulevard
Corridor Study
Fredericksburg
Amtrak / VRE Lot Access
September 25, 2019

Lafayette Boulevard
Corridor Study
▪ Introductions
▪ Lafayette Blvd Evaluation • Purpose: Determine Optimal Configuration
• Study Area
• Crash Summary
• Existing Operations Summary
• Field Review Observations
• Next Steps
‒ Growth Rate Discussion
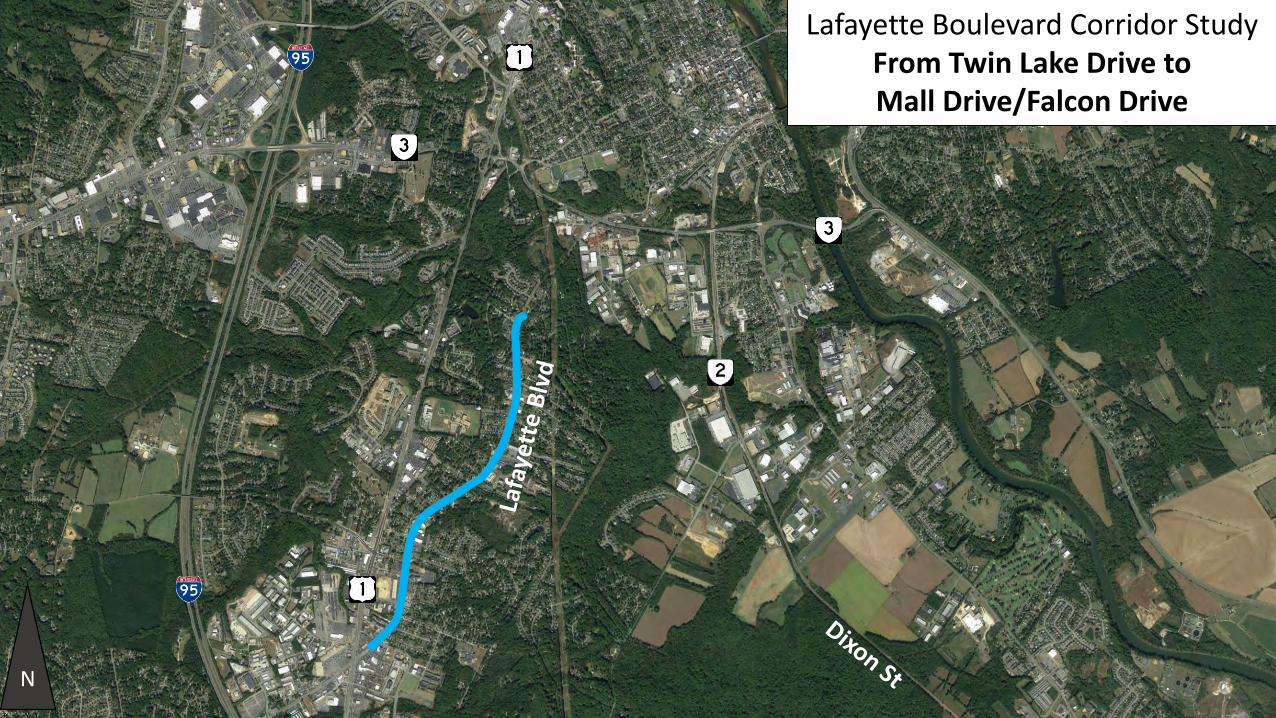
Lafayette Boulevard Corridor StudyFrom Twin Lake Drive to Mall Drive/Falcon Drive
N

Study Intersections
Signalized Intersections
Unsignalized IntersectionsN
Lafayette Boulevard Corridor StudyStudy Intersections
Twin Lake Drive

N
Lafayette Boulevard Corridor StudyCrash Summary
Lafayette Blvd. Crash Rate: 327 per 100 million VMT
Statewide Avg. Crash Rate: 234 per 100 million VMT Urban Minor Arterial
Crash Type Total
Rear End 206
Angle 88
Fixed Object 31
Sideswipes 16
Head-On 9
Other 22
Total 372
Crash Type Total
Fatality 0
Disabling Injury 22
Evident Injury 75
Non-visible Injury 55
Propoerty Damage 220
Total 372

N
Travel Time compared to Base Free-Flow
< 5%
5% to 15%
15% to 25%
>25%
Lon
ger
Pea
k Tr
avel
Tim
e
Lafayette Boulevard Corridor StudyAM Peak Hour Travel Times
Twin Lake Drive

N
Travel Time compared to Base Free-Flow
< 5%
5% to 15%
15% to 25%
>25%
Lafayette Boulevard Corridor StudyPM Peak Hour Travel Times
Lon
ger
Pea
k Tr
avel
Tim
e
Twin Lake Drive

Study Intersections
Signalized Intersections
Unsignalized Intersections
AM
PM
AM
PMN
Intersection LOS
A, B
C
D
E, F
LOS
Dec
reas
es
Lafayette Boulevard Corridor StudyExisting Intersection Operations
Twin Lake Drive

N
Lafayette Boulevard Corridor StudyPM Peak Hour Field Observations
Queue
Longest Observed Queue
Typically Observed Queue

Queue
Longest Observed Queue
Typically Observed Queue
N
Lafayette Boulevard Corridor StudyPM Peak Hour Field Observations
800’
3400’

Vehicle FacingNorthbound
Camera Zone Detection Issue?Random calls for northbound left-turn
N
Queue
Longest Observed Queue
Typically Observed Queue
Lafayette Boulevard Corridor StudyPM Peak Hour Field Observations
170’
570’

Lafayette Boulevard
Corridor Study
▪ Next Steps
• Determine Annual Background Growth Rate‒ Bowman Study: +1.5%
‒ VDOT Historic Data: -1.0%
‒ FAMPO Regional Travel Demand Model: -1.0%
• Future Evaluation‒ Two Northbound Lanes
‒ Two Southbound Lanes
‒ Roundabouts
‒ Keep Existing

Fredericksburg
Amtrak / VRE Lot Access
▪Fredericksburg Amtrak/VRE Lot Access
• Purpose: Investigate New Southern Access
• Study Area
• Field Observations
• Constraints
• New Access Considerations‒ Short Term/Long Term
• Next Steps

N
Fredericksburg Amtrak/VRE Lot AccessStudy Area Location

Main VRE Parking Area
N
Fredericksburg Amtrak/VRE Lot AccessStudy Area

Heavy Right-Turn Volume due to turn restrictions
Queue
Observed QueueN
Fredericksburg Amtrak/VRE Lot AccessField Observations

“Fair” vehicle progression on southbound Dixon St to Route 3 interchange
Westbound queue extends to interchange on Route 3 starting after 4 PM due to downstream signals on Route 3 at Lafayette Blvd and Belman Rd
Queue
Observed QueueN
Queue at Dixon St southbound left-turn to westbound Route 3 begins a little after 5 PM or after VRE arrival
Main VRE Parking Area
Fredericksburg Amtrak/VRE Lot AccessPM Peak Field Observations

VRE: Considerations – New AccessFredericksburg Amtrak/VRE Lot AccessConstraints

N
Fredericksburg Amtrak/VRE Lot AccessLong-Term Considerations
Main VRE Parking Area

Intersection improvements along Charles St and permit VRE lot to travel north or south
Intersection improvements at intersection of Lafayette Blvd and Caroline St
Funded SMART SCALE Project – FY20
N
Fredericksburg Amtrak/VRE Lot AccessShort-Term Considerations

Franklin Street – Richmond, VAOne-way street with Onstreet Parking: Bike Path Conversion
Before After
Fredericksburg Amtrak/VRE Lot AccessMulti-Modal Considerations

Fredericksburg
Amtrak / VRE Lot Access
▪ Next Steps
• Finalize Recommendations
• Develop Cost Estimates

Lafayette Boulevard
Corridor Study
Fredericksburg
Amtrak / VRE Lot Access
September 25, 2019
Questions?