Embed Size (px)
Citation preview
Performance diagnosticsPerformance diagnosticsPerformance diagnosticsPerformance diagnostics
Date of birth:
Weight:Height:
Gregor PowerSample road48149 Sample city
11.12.1971
70,0 kg182,9 cm
30.07.2008
Meine FirmaLeistungsdiagnostik
Mendelstr. 1148149 Münster
Test remarksTest remarksTest remarksTest remarks
BiometricsBiometricsBiometricsBiometrics
BMI [kg/m²]: 20,9
Gender:
from
for
0382983
Body fat [%] 15,0
maleSport category: Running
Gregor PowerStep test analysis 30.07.2008 © mesics GmbHLactate EXPRESS 1 of 4

Graphical resultsGraphical resultsGraphical resultsGraphical resultsLoad diagram
Speed [km/h]98765
Lac
[mm
ol/l]
6,2
6
5,8
5,6
5,4
5,2
5
4,8
4,6
4,4
4,2
4
3,8
3,6
3,4
3,2
3
2,8
2,6
2,4
2,2
2
1,8
1,6
1,4
Heartrate [1/m
in]
200
190
180
170
160
150
140
130
120
110
100
90
80
70
60
50
40
Recov ExtEnd IntEnd AZ
LT OBLA
Time [min]18:0017:0016:0015:0014:0013:0012:0011:0010:0009:0008:0007:0006:0005:0004:0003:0002:0001:0000:00
Lac
[mm
ol/l]
6,5
6
5,5
5
4,5
4
3,5
3
2,5
2
1,5
Heartrate [1/m
in]
200
190
180
170
160
150
140
130
120
110
100
90
80
70
60
50
40
Spe
ed [k
m/h
]
9
8
7
6
5
4
3
2
1
0
2,6 mmol/l
145 BPM
7,4 km/h
Recov
Recov
ExtEnd
ExtEnd
IntEnd
IntEnd
AZ
AZ
00
5
6
7
8
9
0
LT OBLA
Time diagram
LeistungsdiagnostikMendelstr. 11
48149 Münster0382983
Meine Firma
[km/h][km/h][km/h][km/h] Tim
e po
int [
mm
:ss]
Hear
trate
Lac
[mm
ol/l
]
Borg
/RPE
Load dataLoad dataLoad dataLoad data
0,0 00:00 90 1,00 65,0 03:00 110 1,30 76,0 06:00 120 1,40 97,0 09:00 140 2,20 128,0 12:00 160 3,80 139,0 15:00 205 6,10 160,0 18:00 150 2,00 7
Gregor PowerStep test analysis 30.07.2008 © mesics GmbHLactate EXPRESS 2 of 4

Mendelstr. 1148149 Münster
0382983
LeistungsdiagnostikMeine Firma
km/h
Lac
Heartrate
% max. perf.
kCal/h
per 1000 m
2 mmol/l
6,8
2,0
136
75,5
476
00:08:49
4 mmol/l
8,1
4,0
163
89,6
565
00:07:26
6 mmol/l
8,8
6,0
200
97,6
615
00:06:49
LT
6,2
1,5
124
69,2
436
00:09:37
OBLA
7,4
2,6
145
82,2
518
00:08:06
MAX
9,0
6,1
205
100,0
630
00:06:40
ThresholdsThresholdsThresholdsThresholds
km/hLac
HeartratekCal/h
per 1000 m
Recov5,2 - 5,91,3 - 1,4112 - 119363 - 414
11:34 - 10:08
ExtEnd5,9 - 6,71,4 - 1,9119 - 134414 - 466
10:08 - 09:00
IntEnd6,7 - 7,41,9 - 2,6134 - 145466 - 518
09:00 - 08:06
AZ7,4 - 8,12,6 - 4,2145 - 167518 - 570
08:06 - 07:22
Training zonesTraining zonesTraining zonesTraining zones
The following results are calculated from the threshold analysis:
These training intensity ranges are derived from the threshold analysis:
used abbreviations:
Recov: Recovery ZoneExtEnd: Extensive EnduranceIntEnd: Intensive EnduranceAZ: Anaerobic Zone
Bike Beginner (3 x per week)
ResultsResultsResultsResults
LT = Lactate thresholdOBLA = Onset of blood lactate
Gregor PowerStep test analysis 30.07.2008 © mesics GmbHLactate EXPRESS 3 of 4
Mendelstr. 1148149 Münster
0382983
LeistungsdiagnostikMeine Firma
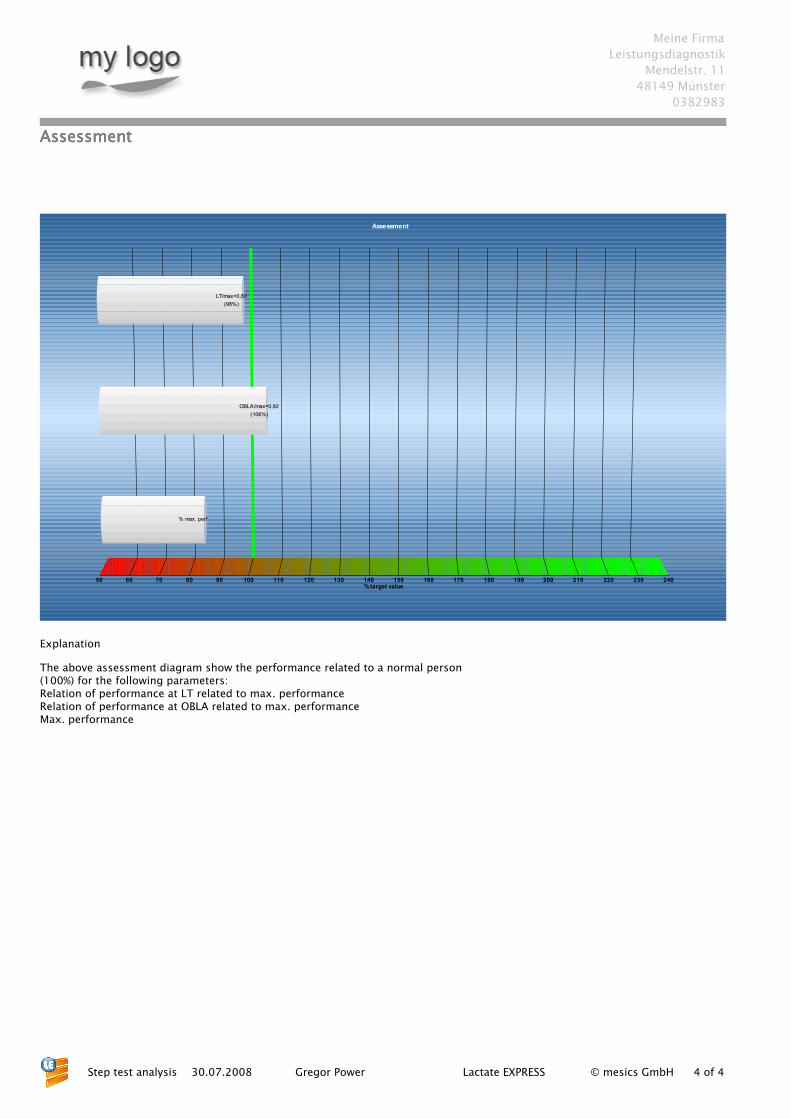
AssessmentAssessmentAssessmentAssessment
Assessment
% target value2402302202102001901801701601501401301201101009080706050
% max. perf .% max. perf .
OBLA/max=0,82OBLA/max=0,82
(106%)(106%)
LT/max=0,69LT/max=0,69
(98%)(98%)
Explanation
The above assessment diagram show the performance related to a normal person(100%) for the following parameters:Relation of performance at LT related to max. performanceRelation of performance at OBLA related to max. performanceMax. performance
Gregor PowerStep test analysis 30.07.2008 © mesics GmbHLactate EXPRESS 4 of 4


