Embed Size (px)
Citation preview

transit service policy
2011

2011 Metro Transit Service Policy
TABLE OF CONTENTS
SECTION 1: INTRODUCTION, PURPOSE & BACKGROUND 1
1.1 Introduction 11.2 Purpose 21.3 Background 2
SECTION 2: DESIGNING A REGIONAL TRANSIT NETWORK 5
2.1 Key Principles of Network Design 52.2 Markets Served 92.3 Transit Service Classifications 102.4 Metro Transit Service Types 102.5 Alternative Service Delivery Options 132.6 Facilities 13
SECTION 3: SERVICE DESIGN GUIDELINES 14
3.1 Metro Service Council 143.2 Service Design 163.3 Rail Service Guideline 263.4 Customer Information & Amenities 28
SECTION 4: SERVICE PERFORMANCE EVALUATION 32
4.1 Route Performance Index 324.2 Service Performance Indicators 33
SECTION 5: SERVICE CHANGE PROCESS 35
5.1 Impact Analysis for Proposed Changes 365.2 Title VI Review Process for Major Service Changes 375.3 Public Hearing Process 375.4 Public Outreach 395.5 Implementing Minor Changes on an Interim Basis 39
SECTION 6: CONCLUSION 40
APPENDICES
Appendix A Blue Ribbon Committee Policy Guidance for ServiceDevelopment
Appendix B Metro’s Bus Line Identification, Route Numbering, and ColorConvention

Appendix C Metro Rapid Program Service WarrantsAppendix D Bus Stops Standards and GuidelinesAppendix E School Tripper Service Change ProceduresAppendix F Route Performance IndexAppendix G Performance Measures Definitions and Performance
ThresholdsAppendix H Service Change Process Work Flow

2011 Metro Transit Service Policy
1
SECTION 1: INTRODUCTION, PURPOSE & BACKGROUND
1.1 INTRODUCTION
The Los Angeles County Metropolitan Transportation Authority (Metro) is at a criticalplanning juncture as the agency seeks to create a better regional transportationsystem. This vision can be achieved through better coordination between the BusRapid Transit (BRT) network, Metrolink, and other local and regional transportationproviders, leveraging the expansion of a robust rail network, and improved servicequality.
In times of fewer resources, Metro’s success to meet challenges related to serving thediverse needs of current and potential passengers, communities, and operators willbe contingent on innovative thinking that stems from a solid base of sound planningprinciples. Critical elements for consideration are regional multimodal systemintegration and coordination, provision of world-class services that are safe, reliable,effective, convenient, intuitive, user-friendly and focused on both customer andemployee needs, and an emphasis on long-term sustainability. Therefore, Metromust plan carefully how to allocate resources to maximize the benefits of service totransit riders, while at the same time ensure that service delivery is efficient and costeffective. Achieving this delicate balance requires establishing policy guidance andservice standards that are designed to target levels of productivity, efficiency, andquality.
To help develop policy guidance for service development, Metro established a BlueRibbon Committee (BRC) in November 2009 represented by key stakeholders whoserve as regional operators as well as beneficiaries of transit service. The BRCrecommended a service concept, conveyed as a set of overarching policy statementssummarized and detailed in Appendix A that provides a blueprint to build a bettertransit system for greater regional mobility with fewer resources. The service conceptalso defines the roles of Metro bus, rail, and municipal operations, identifies andprioritizes essential service quality attributes, and recommends policy guidance onservice coordination, bus-rail integration, and reduction of duplicative services. Thekey principles of the service concept set policy direction for Service Priorities, ServiceDesign, Service Quality Attributes, and Governance:
Summary Position StatementIncreased regional coordination and integration of service, and improved reliabilityare essential to having a seamless system that is convenient, intuitive and of highquality – and provides maximum benefit in light of scarce resources.
Service Priorities: Service should be focused first in high-density areas and be scaledto fit the overall density and passenger demand in the service area.
Service Design: The network should be coordinated and designed to be simple andintuitive to increase trip-making by existing riders and attract new riders.

2011 Metro Transit Service Policy
2
Service Attributes: The system should provide high quality service to better serveexisting riders and attract new riders. Service quality priorities include:
Reliability - "I can count on it" Fast travel options Real-time, readily-available information Clean and safe transit vehicles, stops, and all transit facilities (e.g. Transit
Centers, Park and Ride, Rail Stations, etc.)
Governance: Metro should serve as a facilitator to coordinate services amongoperators in the region.
Ultimately, the policy guidance is reflected in the Transit Service Policy as a set ofregional network and service design guidelines, performance criteria and standards,and service change process that provides the quantitative tools to evaluate the system,identify opportunities for service improvements and ensure the regional transitsystem is adjusted accordingly to achieve the goals and objectives of the serviceconcept.
1.2 PURPOSE
The 2011 Metro Transit Service Policy establishes the following: (1) a formal processfor evaluating existing services; (2) a methodology and process for developing andimplementing service adjustments; and, (3) service design guidelines to ensure thatthe transit system is developed consistent with policy guidance approved by the MetroBoard of Directors.
The policy was originally adopted in 1986 and is reviewed on an annual basis to betterreflect agency goals and objectives, major initiatives, and changes in local, state, andfederal regulations and funding. The policy is organized into six sections:
Introduction, Purpose & Background Designing a Regional Transit Network Service Design Guidelines Service Performance Evaluation Service Change Process Conclusion
1.3 BACKGROUND
Metro is responsible for operating an efficient and effective transportation system inLos Angeles County. As the principal transit provider in the Southern Californiaregion, Metro serves about 75 percent of all transit trips within its 1,433 square-mileservice area, carrying an estimated 1.1 million passengers per day on buses and297,000 passengers on rail.

2011 Metro Transit Service Policy
3
In addition to the bus and rail services provided by Metro, Metro also funds 40 othermunicipal operators that offer fixed-route service and more than 100 other localreturn and non-profit agencies provide community-based transportation for a totalinvestment in regional transit service of $1.6 billion, according to the FY2011 adoptedbudget.
Metro operates bus, BRT, light rail, and heavy rail with an annual operating budget of$922 million for the bus system, and $257 million for rail.
The Metro bus system spans more than 185 routes and serves approximately 16,000bus stops, including two premium BRT dedicated busways known as the MetroOrange Line and Metro Silver Line. The premium BRT, Metro Rapid and MetroExpress services have attributes that may include signal priority, right-of-way, HOVand prepay fare collection that enable these buses to operate with faster travel timesthan local routes. Also, Metro’s eco-friendly fleet of more than 2,500 CompressedNatural Gas (CNG) buses is the largest in the world. Systemwide, Metro Busprovides more than 7.2 million revenue service hours annually with an average of 1.1million boardings per weekday.
The Metro Rail system consists of 275 light and heavy rail cars that operate on fivelines to 70 stations across approximately 76.7 route miles in heavily congested travelcorridors. Three light rail lines – Blue, Gold and Green – serve 56 stations along 60.7miles of track with the Blue Line being one of the most heavily patronized light raillines in the nation. The Red and Purple Lines are heavy rail that serve 16 stationsalong 17.4 miles of track. Metro Rail provides connections to many key multi-modaltransportation hubs and accounts for 300,000 weekday boardings.
Measure R and the 30/10 InitiativeMetro will continue to expand its bus and rail network across the region underMeasure R and the 30/10 Initiative. In November 2008, Los Angeles County votersapproved Measure R, a half-cent sales tax. The measure is expected to generate $40billion for countywide transportation projects over the next 30 years. In April 2011Metro’s Board of Director adopted the 30/10 Initiative to use the revenue fromMeasure R as collateral for long-term bonds and a federal loan, which will allowMetro to build 12 major transit projects in 10 years instead of 30 years. Part of thefunds from Measure R will be used to expand Metro Rail projects throughout theregion:
Gold Line Foothill Extension to Azusa Exposition Line – Phase II Crenshaw/LAX Extension Regional Transit Corridor connecting the Blue, Exposition, and Gold Lines Purple Line Extension to Westwood Gold Line Eastside Extension from East Los Angeles – Phase II Green Line Extension to LAX Green Line Extension – South Bay

2011 Metro Transit Service Policy
4
The Go Metro map below shows Metro Rail and Metro Liner services. Also visibleare construction projects for the Orange Line Extension to the Chatsworth MetrolinkStation in San Fernando Valley, the Gold Line Foothill Extension in the San GabrielValley, and the Expo Rail Line from Downtown Los Angeles to Culver City.

2011 Metro Transit Service Policy
5
SECTION 2: DESIGNING A REGIONAL TRANSIT NETWORK
Transit network design must take into account both the needs of the passengers andoperators, as well as the practical ability to provide the service. From the passenger’sperspective, the transit network should provide convenient service when and wherethey need to go, operate on time and safely, with good customer service andinformation. From a systemwide transit operations perspective, the transit networkmust be manageable, operable, and sustainable – all within the constraints of a fixedoperating budget.
2.1 KEY PRINCIPLES OF NETWORK DESIGN
At times, competing service interests result in unproductive use of scarce transitresources. As such, the BRC was charged with identifying and prioritizing the needsof the customer and operator. Based on recommendations from the BRC, criticalfactors to consider in network design should be reliability, network simplicity, speed,and safety, followed by vehicle cleanliness and timely, relevant, accurate customerinformation.
The following key principles are critical in building an efficient and effective transitnetwork based on the BRC policy guidance:
A. Develop a Network of Services Rather than a Collection of IndividualRoutes
Individual routes do not need to serve all market needs. Rather, routesshould be designed to serve a specific purpose within the network.Combined, the network should provide service between all majordestinations and densely populated areas throughout the day. Thetransit network includes integration of other public transportationservices within Los Angeles County, as well as with other modes, suchas bikes, carpool/vanpool, car share, and private shuttles that providefirst and last mile transportation to better access the transit network.
B. Integrate Services to be “Seamless to the User”
Transfer penalties should be minimizedIn developing an integrated network, it is essential that the system isseamless to use from a customer’s perspective. The need to create asimple and convenient system that minimizes transfer penalties iscritical. An integrated regional network should emphasize highfrequency service, timed transfers on less frequent services, and sharedstops for ease of transfers. Trip information, wayfinding, and anintegrated fare structure also are important elements of a customer-focused transit network.
Services must be better coordinatedAlthough Metro bus service levels have remained fairly stagnant for thelast two decades, bus seat capacity in the region has increased 31

2011 Metro Transit Service Policy
6
percent and revenue service hours have increased 42 percent, if thesignificant growth in municipal bus operations is included. With theaddition of Metro Rail, seat capacity increased 45 percent and revenueservice hours increased 50 percent.
Given the significant growth in municipal and local return operators aswell as Metro Rail, improved coordination between all operators andmodes is vital to establishing an integrated regional transit network.Metro serves as a regional coordinator of transit services. In addition,Metro operates within a hierarchy of services, in which Metrolinkprovides the region’s commuter rail to serve high volume intra-countytrips. Metro Rail and Metro Liner (Orange Line and Silver Line) serveas the backbone of the urban transit network, which is augmented bylocal, limited stop, and rapid bus service on key corridors operated byMetro along with municipal operators. LADOT and local returnoperators complement the system with community and shuttle busesthat serve specific neighborhood needs.
Coordination of service changes is achieved through standingcommittees, such as the Technical Advisory Committee (TAC), BusOperations Subcommittee (BOS), and the Local Transit SystemsSubcommittee (LTSS). In addition, Metro meets quarterly with variousmunicipal and local return operators impacted by Metro’s servicechanges. (Section 5 discusses the service change process in greaterdetail.)
Minimize duplication and increase shared stopsFrom a patron and operator point of view, operating overlappingservices may be costly, confusing and unproductive. Through betterservice coordination, duplication between Metro and municipal busservices, as well as between bus and rail service, can be reduced. Inaddition, this concept will result in a more intuitive and simple to usetransit network. Finally, opportunities to share stops also will helpreduce confusion.
Customer trip information must be timely and readily availableTimely, relevant, accurate and readily-available trip information isnecessary to minimize a rider’s confusion about using transit service.Patrons should always be kept informed about the status of their trip.Real-time information is useful for reassuring passengers when thenext transit vehicle will arrive, or if there has been a service disruptionand how long is the expected delay time. It should provide themwithoptions, such as whether to continue their wait time for the nexttransit vehicle, or take another mode of transit to complete their trip.

2011 Metro Transit Service Policy
7
C. Keep the service simple and intuitive
An intuitive, or easy to understand and use, transit system relies onsimple network and route design. Consolidating services on thesame or parallel corridors within a quarter-mile to a half-miledistance apart provides an opportunity to simplify the network forease of use and reduce unused capacity. This concept requires bettercoordination of schedules and transfer points, and will result in aneasier to use and more convenient system, while reducing wait timeand overall travel time. These enhancements to service quality areexpected to help increase ridership and revenue at no additional cost.
Furthermore, consistent headways that are predictable for patronsalso help to reduce the unknown about next bus arrival times.Consistent headways should be a priority for lines that operateheadways of less than 15 minutes.
D. Ensure high quality services
Establishing a world-class transportation system requires identifyingand prioritizing service quality attributes of highest priority thatsupport a reliable, effective and sustainable operation. The followingare critical service quality attributes to consider when designingservice:
ReliabilityWhen it comes to key service quality attributes, reliability should begiven highest priority. Reliability can be impacted by poor scheduleadherence, vehicle breakdowns, and missed trips. Therefore,controlling service reliability requires a coordinated effort betweenestablishing reasonable running times and schedules, maintenanceand management of vehicles, and operator availability andperformance. Service levels are scheduled to meet passenger levels.Late or missed trips result in capacity issues and eventually pass-ups.Therefore, it is essential that service is on time and reliable to avoidthe misperception that service levels are inadequate to meet demand.
Passengers generally maintain a level of confidence that transitservice should depart a stop or station and arrive at a destination asstated on the timetable. However, instances of poor reliability thatcould cause passengers to arrive late to work or school, miss medicalappointments or critical transit connections would result in an overalllack of confidence in the system. Furthermore, poor reliability wouldcreate unnecessary travel delays and greater concerns about safetyand comfort due to longer waits at the stops and stations.
For high frequency service with headways of every 15 minutes orbetter, schedules should be written to allow operators to be on time

2011 Metro Transit Service Policy
8
without excessive running time that can slow the service substantiallyand result in additional operating cost. Passengers missing a trip onhigh frequency services can be comforted knowing that another busor train will be available within a reasonable wait time, minimizingthe consequences of reliability.
For low frequency service with headways of every 20 to 60 minutes,reliability becomes even more critical. Missing trips on lowfrequency service increases the consequences to the passenger giventhe significant travel delays and wait times. Therefore, specialattention should be placed on ensuring low frequency services aredesigned and operated to the greatest reliability.
Achieve higher network speedsIncreasing the speed of transit service improves the competitiveness oftransit with other modes, such as automobiles. In addition, fasterservice requires fewer resources to operate and thus reduces operatingcost. Several factors cause a reduction of speed along a route,including turns, particularly left turns, an increased number of stops,traffic-congested corridors, and long dwell times at stops and stations.
While the advantages to increase bus system speed include attractingnew riders and reducing operating cost, the disadvantage is reducedaccess to the transit network due to the streamlining of routes andlimiting the number of stops. Therefore, adjustments to a route thatresults in slower speeds are warranted when the ridership benefitoutweighs the negative impacts to speed.
Passenger CapacityPassenger capacity, the amount of seats and standing room onboard avehicle, is an important consideration when designing transit service.The utilization of vehicle capacity should be maximized to make themost use of resources. However, capacity should not exceed athreshold that deters ridership due to uncomfortably crowdedconditions or excessive stop and station dwell times from blockedpassageways on board.
Capacity thresholds are expressed as a load factor indicating the ratio ofavailable capacity to seats. This indicator is used to determine howmany trips must be scheduled for each direction of travel duringspecified time periods.
Other considerations that may influence design capacity include theduration that passengers must stand based on passenger turnoveralong the line and operating conditions, such as on a freeway route inwhich standees should be minimized.

2011 Metro Transit Service Policy
9
Safe Routing and StopsPerceptions of safety and security, as well as actual conditions, enterinto a customer’s mode choice decisions. Safety includes the potentialfor being involved in a crash, slips and falls, or other elements such asaggressive passengers or poor passenger conduct. Security covers bothreal and potential incidents of crime that may contribute to apassenger’s unease, even if the actual risk is minimal or non-existent.Measures must be taken to alleviate a passenger’s unease both at stopsand onboard transit vehicles. Whenever possible, stops should belocated at well-lit areas with ample sidewalk space for ADA complianceand queuing for buses. Other measures to enhance security at stopsand onboard transit vehicles include police officers in uniformed andplainclothes who ride transit, two-way radios, silent alarms foremergency communications, and surveillance cameras at stops and on-board transit vehicles.
Cleanliness and CourtesyClean and well-maintained transit stops, stations, and vehicles improvethe general public’s perception of Metro and their desire to take transitas a viable mode of travel that is comfortable, convenient and of highquality. Many elements make transit more comfortable for passengers,including climate-controlled vehicles, seat comfort, courteousoperators, and ride comfort.
2.2 MARKETS SERVED
Given the current financial climate, service should be placed when andwhere the maximum benefit can be provided to the general public. Inaddition, productive service lowers the net cost per hour, resulting inmore service per dollar.
In general, service should be focused on corridors and within areaswhere high density population, employment, and activity centers exist.These corridors and areas usually generate high levels of transit ridersto justify frequent service (15 minute or better headway) that providesconvenient access to key origins and destinations. Corridors and areaswith dense ridership should be served throughout the day and week.As ridership potential decreases, the emphasis on service should beduring peak periods, base day, weekends, and late night, in priorityorder.
While service should focus on when and where significant demandexists, there is still a need to provide basic lifeline service in areas andtimes of day with low demand. Therefore, a basic lifeline networkshould be provided on critical corridors during the owl period and toconnect low density areas to the transit network.

2011 Metro Transit Service Policy
10
2.3 TRANSIT SERVICE CLASSIFICATIONS
Metro classifies its bus services into two categories to provide the framework forevaluation and planning of the various components of the transit network.
Tier 1: Core Regional Network
Core regional service consists of Metro Liner, Metro Rapid, Metro Local (bus linesaveraging 10,000 or more boardings per weekday), and Metro Rail. Togetherthese lines form the basic network of the region’s service and serve the region’smajor activity centers and market areas.
Tier 2: Inter-Community and Community Service
Inter-Community and Community Service supplements the core service, providesprimary coverage in outlying areas, feeds the fixed-route system, and providescommunity circulation focusing on local travel.
2.4 METRO TRANSIT SERVICE TYPES
Metro operates six types of bus service and two types of rail service to better match thetransit mode with specific passenger demand and needs. (See Appendix B for Metro’sBus Line Identification, Route Numbering, and Color Convention.)
Metro RailMetro Rail is high capacity rapid transit service using rail technology. It operates along adedicated right-of-way, serves full scale transit stations, and is powered by electricity.The rail system serves as a backbone of public transportation in the greater Los Angelesregion, linking many key multi-modal transportation centers and destinations together.
Service operates in high-demand travel corridors and is offered in two forms – heavy railand light rail. Metro’s heavy rail is the subway system served by the Red and PurpleLines. Metro’s three light rail lines – Blue, Gold and Green – use shorter trains thanheavy rail, and generally operate at slower speeds powered by overhead wires. Unlikeheavy rail, the light rail lines run along a right-of-way ranging from complete gradeseparation to at grade in mixed flow traffic. Rail routes are designated with routenumbers between 800 and 899.
Metro LinerMetro Liner service is expedited BRT service operated on its own exclusive right-of-wayon either arterials or freeways with dedicated transit stations. Metro operates two MetroLiner routes: Metro Orange Line and Metro Silver Line. Metro Liner service is numberedbetween 900 and 910. As a form of BRT, Metro incorporates a series of design featuresto reduce delays, increase reliability and improve passenger comfort:
Dedicated Bus Lanes – This right of way provides fewer traffic conflicts andobstructions and reduces delays and travel time.
2011 Metro Transit Service Policy
11
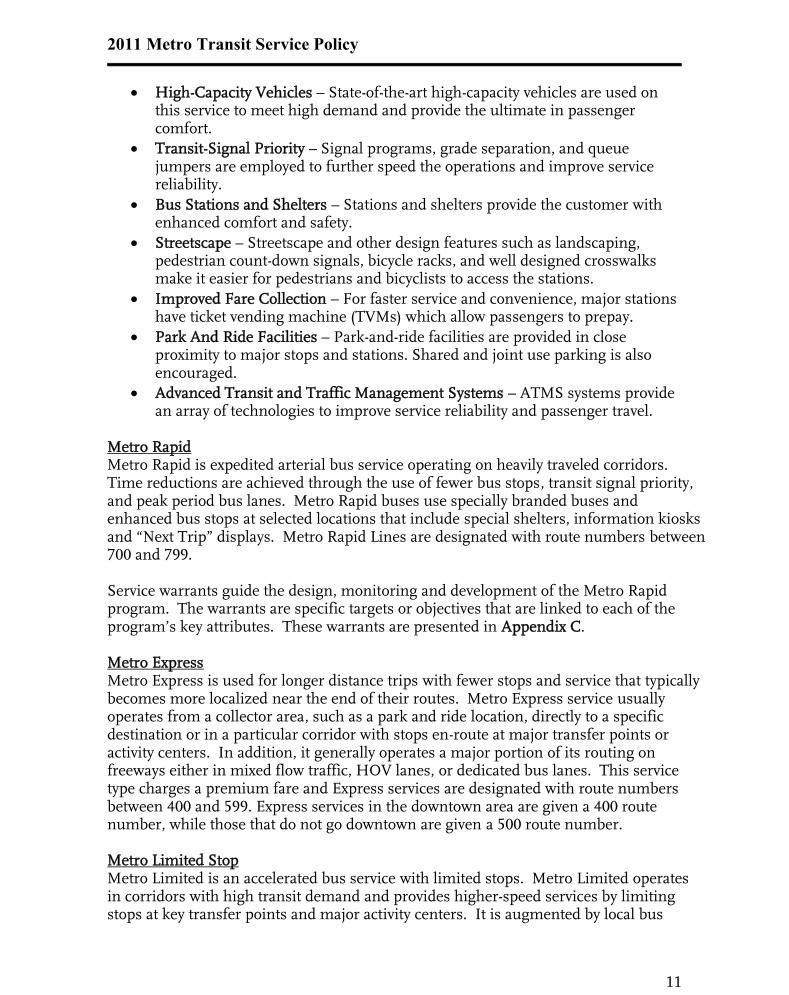
High-Capacity Vehicles – State-of-the-art high-capacity vehicles are used onthis service to meet high demand and provide the ultimate in passengercomfort.
Transit-Signal Priority – Signal programs, grade separation, and queuejumpers are employed to further speed the operations and improve servicereliability.
Bus Stations and Shelters – Stations and shelters provide the customer withenhanced comfort and safety.
Streetscape – Streetscape and other design features such as landscaping,pedestrian count-down signals, bicycle racks, and well designed crosswalksmake it easier for pedestrians and bicyclists to access the stations.
Improved Fare Collection – For faster service and convenience, major stationshave ticket vending machine (TVMs) which allow passengers to prepay.
Park And Ride Facilities – Park-and-ride facilities are provided in closeproximity to major stops and stations. Shared and joint use parking is alsoencouraged.
Advanced Transit and Traffic Management Systems – ATMS systems providean array of technologies to improve service reliability and passenger travel.
Metro RapidMetro Rapid is expedited arterial bus service operating on heavily traveled corridors.Time reductions are achieved through the use of fewer bus stops, transit signal priority,and peak period bus lanes. Metro Rapid buses use specially branded buses andenhanced bus stops at selected locations that include special shelters, information kiosksand “Next Trip” displays. Metro Rapid Lines are designated with route numbers between700 and 799.
Service warrants guide the design, monitoring and development of the Metro Rapidprogram. The warrants are specific targets or objectives that are linked to each of theprogram’s key attributes. These warrants are presented in Appendix C.
Metro ExpressMetro Express is used for longer distance trips with fewer stops and service that typicallybecomes more localized near the end of their routes. Metro Express service usuallyoperates from a collector area, such as a park and ride location, directly to a specificdestination or in a particular corridor with stops en-route at major transfer points oractivity centers. In addition, it generally operates a major portion of its routing onfreeways either in mixed flow traffic, HOV lanes, or dedicated bus lanes. This servicetype charges a premium fare and Express services are designated with route numbersbetween 400 and 599. Express services in the downtown area are given a 400 routenumber, while those that do not go downtown are given a 500 route number.
Metro Limited StopMetro Limited is an accelerated bus service with limited stops. Metro Limited operatesin corridors with high transit demand and provides higher-speed services by limitingstops at key transfer points and major activity centers. It is augmented by local bus

2011 Metro Transit Service Policy
12
service. Metro Limited bus service does not include signal priority and unique branding.Limited stop routes are designated with route numbers between 300 and 399.
Metro LocalMetro Local services operate on city streets and provide service to all stops along a route.Metro Local provides the bulk of Metro’s transit service and ridership. Local routes aredesignated with route numbers between 1 and 299.
Metro ShuttleShuttle routes operate on secondary streets and serve short-distance trips. Theseservices specialize in local community circulation, connect residential neighborhoodswith local trunk-line transit services, including rail. Typically these services carry lessthan 2,000 passengers a day. These bus routes are designated with route numbersbetween 600 and 699. The chart below highlights Metro’s bus service types andfeatures.
METRO BUS SERVICE TYPES AND FEATURES
BUS SERVICE TYPESLocal/
FEATURES Shuttle Limited Express Rapid Metro Liner
Right of Way Local StreetsMajor
Arterials
MajorArterials and
FwysMajor
ArterialsDedicated Right-
of-WayAverage Stop
Spacing ¼ mile ¼ - ½ mile 1+ mile .7 mile 1+ mile
Target TravelMarket Neighborhood
Inter-Community
Inter-Community
RegionalInter-
CommunityInter-
Community
Vehicle Type40-foot bus or
smaller 40/60-foot bus 40-foot bus 40/60-foot bus 60-foot bus
Color Coded BusesCalifornia
PoppyCalifornia
Poppy Business Blue Rapid Red Silver
CommunitiesServed 1 - 2 Multiple Multiple Multiple Multiple
Signal Priority No No No Yes Yes
Fare Collection On board On board On Board On BoardOn Board/Pre
PayPassengerAmenities
Benches andShelters
Benches andShelters
Shelters andStations
Shelters andStations
Shelters andStations
Real-timePassenger Info No No No Yes Yes
Route NumberDesignations 600-699 1-399 400-599 700-799 900-910

2011 Metro Transit Service Policy
13
2.5 ALTERNATIVE SERVICE DELIVERY OPTIONS
Alternative service delivery options are services not directly operated by Metro,including van service, taxicabs, flexible destination operations, contracted services,scrip programs and beginning tier/wages operators. These transportation options
may be viable alternatives to marginally performing fixed-route options and cancomplement traditional transit service.
2.6 FACILITIES
Transit services are supported by facilities, including bus stops, transit centers andstations. These locations are often the first and last points of contact with thepassenger. The BRC considered these facilities to be an essential component oftransit infrastructure that serve to orient passengers to existing transit services,provide a safe and comfortable environment in which to wait for service, and facilitatesafe and efficient transfer movements between services. Given the importance oftransit facilities, it is vital that transit routes and schedules are developed withconsideration for the quality, appropriateness, and availability of facilities.
Bus stops are places where passengers safely wait, board and alight along a route in-service. They consist of route line number, destination and service qualificationsignage, curb markings or parking restriction signage and may include passengeramenities such as shelters, benches, telephones, trash receptacles, lighting andinformation displays installed by the appropriate municipality. Most bus stops arelocated along the curb of a street while others are at offsite facilities such as at transitcenters that may be owned and maintained by the local municipality or by Metro.Transit stations are stops along a fixed guideway with features, such as loadingplatforms, ticket vending machines for fare pre-payment and a host of passengeramenities including shelters, benches, lighting, information displays, trashreceptacles, bike racks and lockers and emergency call boxes. Many of them also areconnected to park-and-ride and passenger pick-up/drop off areas.
Transit centers are high volume transfer points for multiple transit services andlayover space for end of line bus storage and turn around. Features includepassenger loading and alighting areas, benches, shelters, lighting, informationdisplays, bicycle racks and lockers, trash receptacles, and bus layover bays.On-street bus layover zones are designated stopover points for a bus at or near theend of the line. They may or may not allow for passenger boarding and alighting.Bus terminals are major offsite layover areas for multiple bus lines and may or maynot allow for passenger boarding and alighting.

2011 Metro Transit Service Policy
14
3.0 SERVICE DESIGN GUIDELINES
The BRC’s policy guidance states that Metro’s transit network should be wellintegrated, coordinated, and designed to be simple and intuitive to increase tripmaking. To ensure an integrated and not duplicative system, Metro Rail, MetroRapid, and other exclusive guideway services (e.g. Metro Orange Line and MetroSilver Line) should serve as the backbone of the transit system, fed andcomplemented by a regional bus network of key travel corridors that provide high-frequency service for easy transfers. Less-frequent localized services shouldaugment the regional network to provide geographic coverage.
For network simplicity and to create a more intuitive system, closely-spaced servicesshould be consolidated into fewer, more frequent services at a half-mile to one-mileroute spacing. For ease of use, transfers should be as seamless as possible byproviding high frequency routes on the regional network, timed transfers for lessfrequent services, and consolidated bus stops at the same intersection.
Finally, since the regional transit network consists of more than 40 fixed routeoperators and many more local return transit services, coordination of services andalignment of schedules should be a high priority. Coordinated planning andscheduling between Metro, Muni, Local Return, and Metrolink operations areessential towards achieving this service integration.
3.1 METRO SERVICE COUNCIL
Metro is the primary transit provider in Los Angeles County, operating within a1,433 square mile service area. In conjunction with Metro are reserved serviceareas in operation since March 1, 1971, and the Foothill Transit Zone created in1988 by a joint powers authority consisting of 22 member cities in the San Gabrieland Pomona Valleys.
In 1971, State Legislation granted cities that operate fixed route transit withinMetro’s service area the right to continue being the main provider for theirrespective municipalities and keep serving corridors and destinations outside theircity boundaries without fear of encroachment by Metro. However, if theseoperators wish to extend their operations beyond the existing service since 1971then an agreement must be reached with Metro. These operators includeCommerce, Culver City, Gardena, Long Beach, Montebello, Santa Monica andTorrance.
During the late 1980s, there was a desire for subregions to operate their own localservices in lieu of Metro. Metro passed an ordinance whereby a city or group ofcities can apply to provide transit service under specific conditions set forth byMetro and state statute. This became known as Transit Zones. In 1988, a group of22 cities in the San Gabriel Valley took advantage of this opportunity and formedthe Foothill Transit Zone.

2011 Metro Transit Service Policy
15
Metro decentralized its bus operations in 2002, dividing them into five localizedsectors or councils. More recently however since 2010, Metro restructured andestablished a centralized organization, while maintaining the role and responsibilityof the councils to help coordinate service changes. Metro Service Councilsrecommend and approve changes to bus service that may impact each respectivegeographical area within Metro’s purview, as shown in the map on next page.
These community-based councils provide the following role and responsibilities:
Greater community involvement: Regionalized outreach gives residentsmore opportunities for direct input into service issues in theircommunities.
Improved service: Local service evaluation to better understand passengerneeds and recommend the appropriate response.
Subregional perspective: Advise and approve the planning andimplementation of service within their area; call and conduct publichearings; evaluate Metro bus programs related to their service area; reviewproposed service changes; and make policy recommendations to the MetroBoard.

2011 Metro Transit Service Policy
16
3.2 SERVICE DESIGN
A. Service Type Determination
Metro operates a local, limited, and rapid bus grid network system overlaidby point-to-point services, such as rail and express bus services, andsupported by shuttle bus feeder/community services.
Determining the most appropriate transit service in a corridor depends on anumber of factors, including level of demand, resource availability, site orcorridor characteristics, environmental considerations, and communityacceptance. The table below shows desirable characteristics considered duringthe initial review of proposals to upgrade existing operations. The demandthresholds include the combined ridership levels for all services operating inthe corridor.
SERVICE TYPE DETERMINATION
Heavy Rail Operating 100 % within anexclusive right of way.
2,500 boardings per route mile ormore than 50,000 boardings per day.
Ability to construct a fully grade-separated facility.
Light Rail Operating in mixed flow trafficor an exclusive right of way
1,000 boardings per route mile ormore than 25,000 boardings per day.
Ability to construct a guideway withinor adjacent to the corridor.
ExpeditedTransit Bus
A regular or articulated busoperating in a fixed guide wayor a limited stop service inmixed flow with signal prioritytreatment.
300 or more boardings during peak-hour and in peak direction of travel.
Daily average of more than 500boardings per route mile or morethan 10,000 total daily boardings.Ability to implement operating speedimprovements in the corridor.
Standard TransitBus
A 30-40 foot bus operating fixedroute/fixed schedule in eitherlocal or express mode.
80 or more passengers during peak-hour and in a single direction oftravel.Total daily boardings greater than2,000.

2011 Metro Transit Service Policy
17
B. Physical Routing Guidelines
Metro primarily operates three types of buses: a standard 40-foot bus, a 45-footbus, and a 60-foot “articulated” bus. To ensure that buses can adequatelynavigate route alignments and serve bus stops, Metro established the followingstandards:
Transit Centers /Bus Terminals
Layover zones should be designed to accommodate varioussizes of buses (40-foot, 45-foot, and 60-foot).
Re-striping of layover zones should be implemented on an asneeded basis based on needs and size of buses scheduled.
Scheduled routes should be scheduled in such a way that theamount of layover space can be accommodated.
Minimum turning radius clearance required for each type size busmovement
44 feet for both 40-foot and 60-foot articulated buses 47.5 feet for 45-foot buses
Street lane widths for bus operations must be 12 feet or more
Bus Stop Curb Lengths and Zone
40-foot buses should at minimum be:a. Farside – 90 feetb. Nearside – 100 feetc. Mid-block –150 feet
Note: For two 40-foot buses servicing a stop simultaneously, add 50 feet.Additional bus stop curb length may be needed for 45-foot buses.
60-foot bus should at a minimum be:a. Farside and mid-block – 120 feetb. Nearside – 170 feet
Note: For two 60-foot buses servicing a stop simultaneously, add 70 feet.
Bus Layover Zone general space requirements for serviceoperating on schedule:
a. One Space – 15 minutesb. Two Spaces – 12 minutesc. Four spaces – 6 minutes

2011 Metro Transit Service Policy
18
Appendix D provides additional information on Transit CooperativeResearch Program bus stop standards and guidelines.
C. Bus Service Guidelines
Corridor/ Route Duplication refers to a collection of parallel routesserving several common destinations. If the route spacing was suchthat patrons could walk to one or the other within the same amount oftime and distance then relatively speaking these routes can beconsidered duplicative services. Route Duplication occurs when two ormore bus routes operate on the same alignment by one or morecarriers in a transit corridor. While service duplication should beminimized, exceptions apply, such as Metro Rapid bus corridors thatsupport an underlying local route, on approaches to business districts,major terminals, and transit centers, or if serving key destinationsalong a corridor from several directions.
Frequency of Service refers to the level of service provided. Frequencyis driven by the amount of time separation between scheduled trips,otherwise known as the headway. Service frequencies are dictated byridership demand and should be set in such a manner that it providessufficient capacity to adequately meet this demand and ensure areasonable and attractive level of service is provided throughout theday. There are instances when the frequency in a corridor is sofrequent that operating a high-capacity bus makes more senseoperationally on-street and is more efficient in their use.
Metro policy headway is that all local service should operate 60 minutesor better and that Metro Rapid service should operate at least every 20minutes between the hours of 6:00 a.m. and 6:00 p.m.
Limited-Stop Service makes significantly fewer stops than localservice, and the key design objective is to operate at a minimum of10% faster than local service. Limited service will be considered incorridors where the demands require a 10-minute headway or less onthe local line prior to implementation of a limited-stop service.
Load Ratio is the average ratio of passengers to seats commonlymeasured over a one-hour period. The load ratio determines what theproper scheduled headway should be. Metro’s Load Factor Policy is1.30, which is significantly lower than industry peer agencies.
Network Spacing, also called “route spacing,” refers to the averagedistance between two or more parallel bus routes. It is generallyaccepted that patrons are willing to tolerate walking no more than aquarter mile to a bus stop. In general bus routes operating parallel toone another in an urban area should be spaced a half-mile apart fromone another and bus routes operating parallel to rail should be spaced

2011 Metro Transit Service Policy
19
a half-mile apart on either side of a rail route. Bus routes operatingparallel in a suburban area should be spaced no more than one-mileapart from one another; and bus routes operating in low density orunderdeveloped areas should be operated where needed in such away that it is cost-effective. When possible, alternative deliverymethods should be considered.
Route Alignment should be direct for network simplicity and tomaximize average speed and minimize travel time. In general thereshould be no more than 2 branches per trunk-line routes. Routedeviation, also referred to as “out of direction movement,” is when aroute is realigned to operate in close proximity of a new activitycenter such as a rail station or transit center. Route deviation shouldonly be considered if the diversion time in one direction is 5 minutesor less, and there is a net travel time benefit for riders who areconnecting or traveling through.
Route Length should be as short as possible to reduce a vehicle’sexposure to events that may delay service (e.g. accidents, roadconstruction, or poor weather conditions) and to maintain scheduledtravel times to maximize on-time performance.
Span of Service refers to the hours that service is available on a givenday and defines the minimum period of time that service shouldoperate at any point in the system. This provides customers with theconfidence that direct and connecting service will be provided.General span of service guidelines by service type are identifiedbelow.
Some of the criteria used to determine the span of service on a busroute include:
Existing ridership and productivity levels. Span of service on connecting and alternative services with
expanded service. Resource availability. Hours of operation of major job sites or activity centers
along the alignment.

2011 Metro Transit Service Policy
20
STANDARD SPAN OF SERVICE BY SERVICE TYPE
Service Type Weekday WeekendsMetro Liner 5am - 9pm 6am - 9pmMetro Express Peak-hours Only N/AMetro Rapid 5am - 9pm 6am - 8pmMetro Local 5am - 11pm 6am - 9pmMetro Rail Feeder/Shuttle 5am - 9pm 6am - 9pm
Transfers occur when passengers change from one transit unit toanother (bus or rail), which occur at a common stop location such asan intersection, station, or transit center. Metro’s goal is thattransfers should be seamless minimizing wait times as much as ispossible. Metro accomplishes this through time transfers andpositive transfers.
Timed Transfers are when wait times are built into theschedule of a route to provide convenient connectionsbetween two routes for passengers who wish to transfer at acommon stop location. In these instances it is preferable thatwait times be built into the schedule of a low frequency routewith headways greater than 20-minutes and owl routes thatoperate every 30 minutes or greater.
Positive Transfers are when one route is scheduled to arrive 2-5 minutes before or after another route at a common stoplocation to enhance connections and reduce wait times forpassengers who wish to transfer such as connections betweenrail and bus.
In addition to timed and positive transfers Metro will workwith other municipal transit operators to better coordinateservices and schedules to minimize transfer impacts.
D. Bus Stops
Bus Stops allow for boarding and alighting of passengers. There are instanceswhen two or more routes operate along the same corridor, such as a MetroRapid Line and an underlying Metro Local line, which serve different stops.In these cases it is desirable their stops be consolidated to avoid unnecessarycrosswalk movements and minimize confusion as to which stop riders shouldwait to catch their bus. However, there are instances when stops cannot beconsolidated:
Would cause unsafe right turn movements

2011 Metro Transit Service Policy
21
Adjacent businesses objections Loading Zones (business & passenger) Jurisdiction refusal to allow extending current stop zone Lack of available space
Stop Location is the proper location of a transit stop requires on-siteinvestigation of the stop(s) under consideration and must be concurredwith by the municipality the stop is located in. No standard type ofstop can be recommended for all locations, as each intersection isunique in its characteristics. An inventory of land uses within a quarter-mile corridor of the road under consideration should be developed;noting uses that serve as major trip producers and attractions.
Stops should be located within a short walk from schools, major retailmalls, office buildings and multi-unit apartments. These stops provideaccess to the transit system for uses that generally attract a largenumber of transit riders. Bus stops should be located to balance goodrider access with pedestrian safety. Stop locations should supportefficient transfer movements minimizing rider walking distance andavoiding unnecessary crosswalk movements as well as the potential forjaywalking.
In addition, all bus stops and rail station stops along a route shouldbe fully accessible in accordance with the Americans with DisabilitiesAct. For example there should be no obstructions preventing theboarding and alighting of patrons who use a wheelchair or otherassistive mobility devices. In addition, pathways to and from a busstop and rail station should be unobstructed. If obstructions do existevery effort must be made to resolve this with respectivemunicipalities. In the case of bus stops they can either be moved to anew location on a permanent basis or temporary basis dependent onthe situation such as construction.
Stop Spacing refers to the average distance between consecutive stopsalong a bus route. Guidelines for bus stop spacing are established at alevel where service is within a reasonable walking distance and stopdelays do not significantly reduce travel time. Ideally, stops should beas far apart as possible without adversely affecting passengerconvenience.
Decisions regarding bus stop spacing and location call for careful analysisof the safety of passengers, Operators, equipment, passenger servicerequirements, the type of service provided, and the interaction ofstopped buses with general traffic flow. Achieving a balance ofconvenience to both the transit passenger and the auto user is a primeobjective.

2011 Metro Transit Service Policy
22
Bus stop spacing should be related to ridership density. Stops shouldbe closer together in the major commercial districts and farther apartin the outlying areas.
As shown below, the primary determinants for stop spacing are busservice type and population densities. Stop spacing for shuttles shouldbe determined on a case-by-case basis as these services can be operatedin a variety of environments and in a number of different ways.
BUS STOP SPACING GUIDELINES
Population Density (Persons per SquareMile)
RouteAverage
ServiceType
Over20,000
10,000-20,000
Under10,000
(Stops perone-way
mile)MetroLiner
1,500-4,000 ft.
1,500-4,000ft.
2,600-5,200ft. 1
Express500-2,600
ft.1,500-4,000
ft.2,600-5,200
ft. 1
Rapid800-1,500
ft.1,000-4,000
ft.2,600-5,200
ft. 0.7
Limited750-1,000
ft. 750-1,500 ft.1,000-4,000
ft. 0.5
Local 500-800 ft. 500-1,000 ft.500-1,300
ft. 0.25Shuttle TBD TBD TBD TBD
E. Bus Lanes
A bus lane is an exclusive lane used by transit on urban streets along a roadwaythrough widening or dedication of one or more existing general traffic orparking lanes for transit use. These lanes can be designated for transit useduring peak periods only or all day. These lanes typically allow use by generaltraffic for right turn movements and local access to and from driveways. Buslanes are most effective in those areas where there are very high bus volumes orpassenger volumes and where operational efficiencies can be achieved.
Bus lanes are a key desired attribute for Metro Rapid lines and an importantstrategy for improving traffic congestion, mobility, and air quality. They maketransit usage more attractive by reducing transit travel times, increasing servicereliability, and improving safety. They are considered beneficial to the customerin situations where the average trip time can be reduced by at least 15%. Thistranslates into a travel time savings of approximately 40 seconds per mile usingthe average bus speed of 11.5 mph and an average trip length of 20 minutes.The bus lane guidelines shown below suggest that a project meet either thepeak-hour passenger or bus volume thresholds, and the trip time savings. In

2011 Metro Transit Service Policy
23
addition to the guidelines, factors such as traffic and parking impacts, overalltravel time savings, and street design considerations must be considered.
BUS LANE GUIDELINES
Treatment
Minimum One-Way Peak-hour Bus
Volumes
Minimum One-WayPeak-hour Passenger
VolumesMinimum AverageTrip Time Savings
Curbside buslanes 25 1,000 15%
F. High Capacity Bus
Metro operates two high-capacity vehicle types: 45-foot buses with 46 seats andarticulated 60-foot buses with 57 seats. Ideally these high-capacity vehiclesshould primarily be operated on high-volume trunk service routes such asWilshire Blvd. (Line 720), Vermont Blvd. (Lines 204, and 754), and OlympicBlvd. (Line 66), which currently operate 60-foot articulated buses.
One advantage to their deployment is the opportunity to reduce vehiclerequirements and service hours; however their deployment should not increaseservice intervals to the point where riders notice degradation in service quality.For this reason, bus lines with peak headway of five minutes or less (frequencyof 12 trips or more an hour) are ideal candidates for this type of vehicle. Inevaluating services for higher capacity vehicles other factors must beconsidered, including: facility compatibility, street design, and potential impactsto services where schedules have been interlined.
G. Bus / Rail Interface
As the Metro Rail system expands, adjustments are made to the bus system toimprove access to rail stations, take advantage of new transfer facilities, andreduce bus and rail service duplication. The following guidelines providedirection to routing and scheduling changes that will be necessary as the MetroRail system is expanded:
Cancellation of Parallel Limited and Express ServiceCompeting limited stop and express service that parallel the rail corridorwill be discontinued when duplication exists.
Diverting ServiceBus routes that run parallel to a rail line may be diverted to a stationwhen:
The walk time from the nearest station is greater than 3minutes.
The diversion time in one direction is 5 minutes or less.

2011 Metro Transit Service Policy
24
The average three-hour peak load factor is less than 50percent.
There is a net travel time benefit for connecting and throughtraveling riders.
Intersecting bus lines or bus lines that travel in a perpendicular directionto a rail line will be diverted to serve the closest rail station when:
The diversion time in one direction is 5 minutes or less. The average three-hour peak load factor is less than 75
percent. There is a net travel time benefit for connecting and through
traveling riders.
Extending Terminating LinesBus routes that end within one mile of a rail station will be extended toterminate at the station. Routes that terminate at distances greater thanone mile may be extended if the rerouting will create a valuable link tothe rail system or will result in a reduction in travel time for a significantnumber of riders.
New Bus RoutesNew rail feeder service will be considered as part of the service changeprocess if a need is demonstrated and if funding is available as part ofthe service change process.
Scheduling Bus Interface During peak travel periods, bus arrival and departure times
should be governed by the rail arrival and departure timeswhen predominant movement is from bus to rail.
During off-peak times, bus routes with frequencies of 20minutes or greater ending at a rail station should bescheduled to arrive 2-5 minutes before the rail departure time.
When the predominant movement is from rail to bus,terminal buses should be scheduled to depart 2-5 minutesafter the scheduled rail arrival time.
H. School Trippers
School trippers are extra service operated to protect against overcrowding on busroutes serving schools. Metro’s policy on school trippers is based on FTAregulations (49 CFR Part 605). These regulations are directed at protecting theprivate sector against unfair competition and ensuring that FTA funding isfocused on providing services that meet the needs of the “general public.”

2011 Metro Transit Service Policy
25
School tripper service may be operated if it meets the following criteria:
There is sufficient demand to warrant the operation of a tripper; There are sufficient resources to operate a tripper; The school tripper will not result in a significant increase in travel
time for regular customers; and The school tripper is operated as part of the regularly scheduled
public transportation service.
School tripper service must meet the following requirements:
All school trippers must fully comply with established policies andprocedures;
All regularly scheduled school trippers must be published on publictimetables;
All locations where trippers board or alight passengers, including thebus stops at deviated routes, must be marked with Metro signageincluding the bus line numbers servicing the stop;
School tripper changes must be provided to the general public by aservice change notice or on the Metro website at www.metro.net;;
Requests for new school trippers or modifications to existing schooltrippers will be considered when a minimum notice is given at leasttwo weeks prior giving ample time to complete an appropriateanalysis of the request and to allow appropriate notification ofchanges.
School Tripper Service Change Procedures are listed in Appendix E.
I. Special Event Service
Special event services are bus routes designed to take passengers to a specificvenue and are not part of the regular scheduled operation. Metro will provideservice under contract to other entities only if the provision of these servicesdoes not interfere with Metro’s ability to meet its regularly scheduled serviceobligations and fits within the scope of the agency’s regular operation in termsof route structure, fares and span of service. Special events service will beprovided on a full cost recovery basis and in conformance with the agency’scharter bus policy.
J. Charter Bus Policy
Charter Service is the use of buses, vans or facilities (rail system) to provide agroup of persons under a single contract, at a fixed charge, with the exclusiveuse of the vehicle or service to travel together under an itinerary either specifiedin advance or modified after having left the place of origin. Generally, for servicenot to be considered charter, it must meet the following tests:

2011 Metro Transit Service Policy
26
Be available to the general public; operate within the system’s normalscope (existing routings, fit within normal hours of operation andestablished fare structure).
Have a published timetable. Customers must pay their own fare.
Charter Service PolicyAs a grantee of Federal funds, Metro is prohibited from using its federally-funded equipment and facilities to provide charter service except on anincidental basis and when one or more of applicable exceptions discussed belowapply:
Charter service shall be incidental to the mass transportation serviceand shall be provided only during times of the day when vehicles arenot needed for regularly scheduled service.
Charter service will only be considered when one of the followingexceptions applies:
There are no willing or able private charter operators. For special events to the extent that private operators are not
capable of providing the service. When there is a formal agreement regarding the provision of
charter services between the recipient and all private charteroperators that have been determined to be willing and able.For government or certain non-profit organizations, if the tripinvolves a significant number of handicapped persons, or ifthe organization is a qualified social service agency, or if itreceives public welfare assistance funds whoseimplementation may require transportation services.
All requests for Charter Service must be approved by the ChiefExecutive Officer and it may require a waiver from the FederalTransit Administration. Petitions for a waiver should be requested inwriting 90 days in advance of the event whenever possible.
The rates for charter service shall equal or exceed the annual fullyallocated cost, including depreciation, of providing charter busoperations, and Metro shall deduct the mileage and hours from theuseful life of the buses.
The operation of charter service must also comply with relevant statelaws, including Section 30630.5 of the California Public UtilitiesCode.
3.3 RAIL SERVICE GUIDELINE
Rail service planning efforts is multi-layered with a primary focus on matchingservice levels and capacity with demand. Key rail policies address the frequency of

2011 Metro Transit Service Policy
27
service, span of service and passenger loading. Additional efforts focus uponcoordination among lines sharing common track or stations, public safety, andenabling allotments of time for regularly occurring preventive maintenance.
A. Rail Headway/Frequency
Headway refers to the interval of time, expressed in minutes, between consecutivetrips on a transit line. Headways are based on policy and demand. Frequencyrefers to how often the arrival of a trip occurs in a given time. For instance if theheadway of a line is 10-minutes the frequency is six trips arrive every hour.Service frequencies are set in a manner that ensures a reasonable and attractivelevel of service is provided throughout the day and to provide sufficient capacity toadequately meet ridership demand. The table below defines the maximumheadways for each service period operated by Metro along the trunk portion of aline. Service along branches may be less frequent.
RECOMMENDED MAXIMUM HEADWAY
Service AM/PM Midday Evening Night Weekends
Peak(9am-3pm)
(6pm-9pm)
(9pm-2am)
Light Rail 10 15 15 20 12-15(Blue Line,Green Line,Gold Line)Heavy Rail 10 15 15 20 12-15(Red/PurpleLines)
B. Span of Service
Span of service refers to the hours of the day and days of the week that service isoperated. For the rail system, the span of service is determined based on thehours of key activity centers located along the alignment and ridership demand.A key factor in determining the span of service on individual lines is systemconnectivity. Evening schedules are designed to provide connections at the 7th
St./Metro Center/Julian Dixon Station, Union Station andImperial/Wilmington/Rosa Parks Station. The approximate span of service forlight and heavy rail service is summarized on next page.

2011 Metro Transit Service Policy
28
MAXIMUM SPAN OF SERVICE
Service Weekdays Weekends
Light Rail3:50 am - 2:00
am3:50 am - 2:00
am(Blue Line, GreenLine,Gold Line)
Heavy Rail4:30 am - 1:30
am4:30 am - 1:30
am(Red/Purple Lines)
C. Passenger Loading
Passenger loading is a measure of seating capacity. It is typically expressed as apercentage of the total passengers compared to the seats available. Thesestandards are set at a level to offer sufficient seating capacity on the Metro Raillines to meet the need of Metro’s current and future riders, and ensureovercrowded vehicles do not discourage patronage or adversely affect planneddwell times at stations. The current load standard for light rail is 175% based on76 seats and heavy rail is 230% based on 55 seats. Currently these standards areunder review and subject to change.
PASSENGER LOAD STANDARDS
Service StandardLight Rail 175%Heavy Rail 230%
The above table shows the current passenger loading standards for peak periodsfor each service type. The standards vary to reflect differences in seating andavailable space for standees by vehicle type.
3.4 CUSTOMER INFORMATION & AMENITIES
Providing customer information assists both regular riders and infrequent riderson how to use transit as a viable mode of transportation to and from theirdestinations. The BRC determined that clear, concise, and timely information is animportant adjunct to service quality, particularly when bus and rail services are notoperating as planned. Amenities aid in the comfort and security of riders.
Customer InformationPassengers need to know how to use transit, where to go to access it, where to alightto access their destination, whether transfers are required, and when transitservices are scheduled to depart and arrive. Infrequent users particularly need thisinformation and even regular transit users may require information about specificroute when they need to travel to a location they rarely visit or is new to them.

2011 Metro Transit Service Policy
29
Information must be provided in accessible formats. Metro provides customer tripplanning and help information via telephone, in person with a customerrepresentative, on-board comments, by mail, online at the metro.net website and byemail.
At Transit Infrastructure, such as shelters, signs directing motorists to park-and-ride lots, and bus stop signs that indicate the presence of service to peoplenot currently using transit.
Audible Announcements at bus stops, rail stations and on board vehicles toassist not only passengers with visual impairments, but also passengersunfamiliar with the route or area.Internet Information available 24 hours per day to anyone with Internet accesssuch as:
Route Maps & Timetables, Fare Information, and Trip Planner Specialized Guides (Bikes, Riders with Disabilities, Safety and Security,
etc.) Commuting Information (Carpools, Vanpools, School Pools, and
Employer Programs) News and Media Information Latest Projects and Programs Contact Information Special Event Information
Next Bus or Train Real-Time Information, both audible and visual, to reassurewhen the next scheduled vehicle will arrive.
Printed, Distributable Information, such as timetables, maps, service changenotices, rider newsletters, etc., preferably available at a number of locations.
Posted Information, such as system maps, bus cubes posted at stops, stations,and on-board transit vehicles.
Route Numbering Convention at stops and transit vehicle head signs to assistpassengers to quickly identify what stops to wait at and what transit vehicle toboard related to printed and posted information. See Appendix C.
Wayfinding is the process of communicating information to support our patronswith the ability to navigate through the use of signage, system / route maps,kiosk, bus cubes, directions, etc. so they can easily determine where they are,where they want to go, and how to get there.
Visual Displays to assist passengers with hearing impairments and to supplementon-board announcements that may be muffled by other noise.

2011 Metro Transit Service Policy
30
Customer AmenitiesPassenger amenities are those elements provided at a transit stop, transit center,and station stops to enhance comfort, convenience, and security. Metro willprovide customer amenities where applicable and have available resources. Insome instances, Metro will partner up municipalities to provide the appropriateamenities. Amenities include such items as shelters, benches, vending machines,trash receptacles, lighting, restrooms, and telephones.
Benches provide comfort for waiting passengers, helps identify the stop orstation, and are lower cost when compared to installing shelters.
Elevator/Escalators provide accessibility for those who otherwise cannot use stairsto elevated station stops.
Lighting increases visibility, increases perceptions of comfort and security,discourages use of bus stops once transit operations are no longer in-service.
Public Restrooms may be provided at transit centers and maintained for publicsafety and convenience.
Shelters provide comfort for waiting passengers, shelter from climate conditions,and helps identify the stop or station.
Telephones/Intercoms provide access to transit information and emergencies.
Trash receptacles provide a place to discard trash and keeps bus stop andsurroundings clean.
Vending machines can provide newspapers for reading while waiting with for atransit vehicle or on-board and snacks as well.
When transit service is not provided near one’s origin, driving to a park-and-ride lotor riding a bicycle to transit may be viable alternatives. Park and rides are especiallyimportant amenity for choice riders.
Bicycle StorageBicycle storage may be provided at transit stations where demand exists and spaceallows and on transit vehicles. Bicycle racks and lockers may be provided at transitcenter and stations. On transit vehicles bicycles may be bus-mounted racks locatedin front of a bus or on-board a transit vehicle in a designated space.
Bike racks provide a simple, relatively low-cost approach and can hold a largenumber of bicycles in a relatively small space, but the bicycles are subject topotential damage and theft. Enclosed bicycle lockers provide added protection fromtheft and from weather, but are more costly and require more space.

2011 Metro Transit Service Policy
31
Park and Rides/Station ParkingA park and ride facility provides a place for choice riders to park their cars beforeboarding a bus or train. Park and ride facility are usually provided at station stopsor transit centers such as Metro’s El Monte and Artesia Centers and at various railstations. Park and rides can also be found at lower density suburbs serving as astaging area for commuter riders.
2011 Metro Transit Service Policy
32
SECTION 4: SERVICE PERFORMANCE EVALUATION
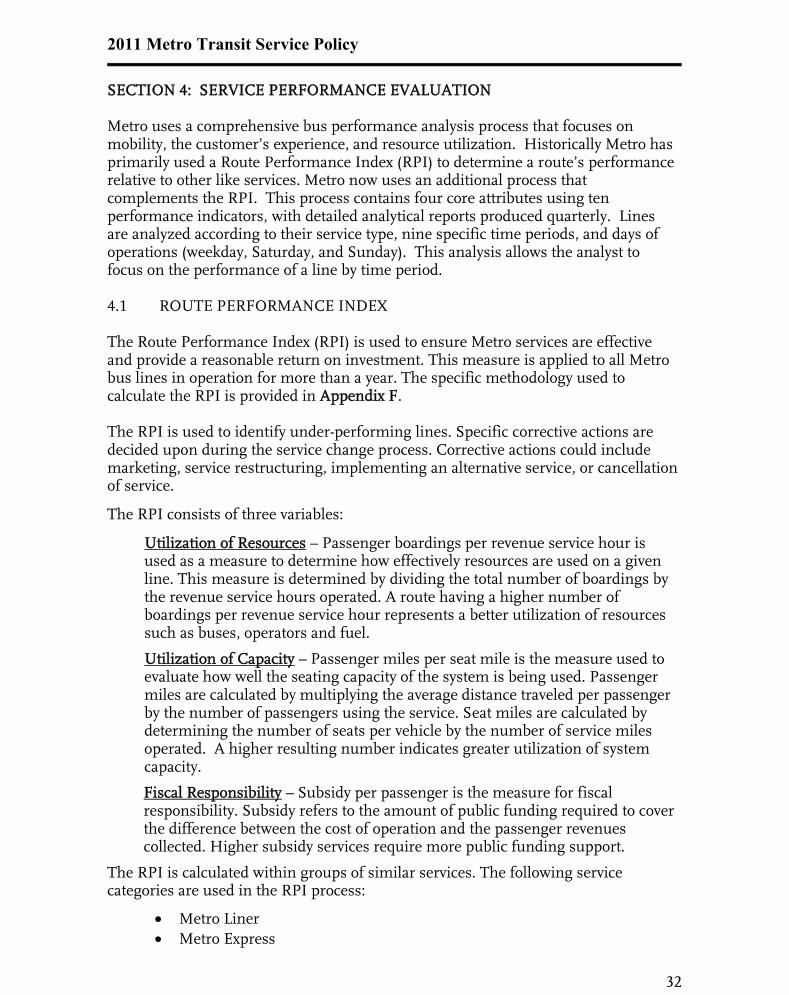
Metro uses a comprehensive bus performance analysis process that focuses onmobility, the customer’s experience, and resource utilization. Historically Metro hasprimarily used a Route Performance Index (RPI) to determine a route’s performancerelative to other like services. Metro now uses an additional process thatcomplements the RPI. This process contains four core attributes using tenperformance indicators, with detailed analytical reports produced quarterly. Linesare analyzed according to their service type, nine specific time periods, and days ofoperations (weekday, Saturday, and Sunday). This analysis allows the analyst tofocus on the performance of a line by time period.
4.1 ROUTE PERFORMANCE INDEX
The Route Performance Index (RPI) is used to ensure Metro services are effectiveand provide a reasonable return on investment. This measure is applied to all Metrobus lines in operation for more than a year. The specific methodology used tocalculate the RPI is provided in Appendix F.
The RPI is used to identify under-performing lines. Specific corrective actions aredecided upon during the service change process. Corrective actions could includemarketing, service restructuring, implementing an alternative service, or cancellationof service.
The RPI consists of three variables:
Utilization of Resources – Passenger boardings per revenue service hour isused as a measure to determine how effectively resources are used on a givenline. This measure is determined by dividing the total number of boardings bythe revenue service hours operated. A route having a higher number ofboardings per revenue service hour represents a better utilization of resourcessuch as buses, operators and fuel.
Utilization of Capacity – Passenger miles per seat mile is the measure used toevaluate how well the seating capacity of the system is being used. Passengermiles are calculated by multiplying the average distance traveled per passengerby the number of passengers using the service. Seat miles are calculated bydetermining the number of seats per vehicle by the number of service milesoperated. A higher resulting number indicates greater utilization of systemcapacity.
Fiscal Responsibility – Subsidy per passenger is the measure for fiscalresponsibility. Subsidy refers to the amount of public funding required to coverthe difference between the cost of operation and the passenger revenuescollected. Higher subsidy services require more public funding support.
The RPI is calculated within groups of similar services. The following servicecategories are used in the RPI process:
Metro Liner Metro Express

2011 Metro Transit Service Policy
33
Metro Rapid Metro Local Metro Shuttles
Specific indices are developed for each measure within each category of service.Lines with an index of 1.0 perform at the category average, while lines with an indexof less than 1.0 perform below the average. Lines with an RPI lower than 0.6 aredefined as performing poorly and targeted for corrective action. Lines that have beensubjected to corrective actions and do not meet the 0.60 productivity index after sixadditional months of operation may be canceled, subject to Metro Service Council orBoard approval, unless a funding agreement with a city or other agency is in place tooffset the poor performance of the service. Such agreements need to be for a periodof one year or more and in an amount sufficient to bring the farebox recovery ratio ofthe poorly performing service up to the service category (Metro Local, Metro Express,etc.) average.
4.2 SERVICE PERFORMANCE INDICATORS
Beginning in FY2009, Metro introduced a more comprehensive internal monitoringprocess that focuses on four core service attributes using ten performance indicators.A detail of each of the indicators and their standard for performance is provided inAppendix G.
AvailabilityTwo indicators are used to measure the extent to which transit service is available:Accessibility and Connectivity. The accessibility indicator mandates that 99% ofcensus tracts with three or more households and/or four or more jobs per acreshould be within a quarter-mile of transit. The connectivity indicator states thatdirect transfers should be available for all Rapid-to-Rapid and Tier 1 Local-to-Tier 1Local connections. At the present time only one isolated census tract does not meetthe standard for Availability, and a short list of exceptions to the Connectivitystandard is maintained.
QualityQuality is important in retaining existing customers and attracting new ones. Twoperformance indicators measure quality: In-Service On-Time Performance andCustomer Complaints. In-Service On-Time Performance uses a standard of one-minute early and five-minutes late as the range of on-time achievement. Thebaseline performance target is 80% on-time or better. Since this measure has beenmonitored, performance has been consistently improving. Customer Complaintsmonitors the frequency with which customers are dissatisfied with some attribute ofservice delivery (Commendations are excluded from this performance measure). Thestandard of performance varies by service type and was established at the level of thepoorest 15% of services within each type during FY2008.
QuantityQuantity is important in establishing minimum service levels for any serviceoperated as well as ensuring that demand is adequately served when higher volumes

2011 Metro Transit Service Policy
34
of patronage are achieved. Two performance indicators are used: Frequency ofService and Average Load Factor. Frequency of Service ensures that service willoperate at least hourly in any corridor in which Metro operates fixed route service.Metro Rapid service is held to a demand driven standard that ensures service at leastevery 20 minutes between 6:00 a.m. and 6:00 p.m. The Average Load Factormeasure ensures that an average of not more than 30% of bus patrons is standingduring any hour. This standard is subject to reevaluation, and is not applicable to railtransit which uses differing standards that tolerate higher levels of standees bydesign.
EffectivenessEffectiveness measures are used to ensure that service is provided in the most cost-effective manner given scarce resources. Four performance indicators are used:Boardings per Service Hour, Cost per Passenger Mile, Passenger Miles per Seat Mileand the Route Performance Index (previously described). The standards ofperformance for the first three of these measures are established by the performanceof the lowest 15% of services within each service type during FY2008. The RPIestablishes its performance threshold at 0.60. Boardings per Service Hour measuresthe level of passenger activity, or passenger turnover, during each hour of operation.Cost per Passenger Mile measures the cost effectiveness of the service provided, andPassenger Miles per Seat Mile establishes the extent to which provided capacity isactually used.

2011 Metro Transit Service Policy
35
SECTION 5: SERVICE CHANGE PROCESS
Metro traditionally implements service changes every six months. Schedule changesare conducted to modify service based on patronage and/or budget fluctuations.Service changes follow an established timeline and are highlighted with additionaldetails in Appendix H.
SERVICE CHANGE TIMELINE
Key Activities
Required Lead Time(Months Prior toImplementation)
Initiate Planning Process 12Develop PreliminaryRecommendations 7-8
Public Review and Input 4-7Impact Analysis for Proposed
Changes 4-7Finalize Program 4-5Program Approval 4-4
Develop New Service Schedules 3-5
Print Public Time Tables andOperator Assignments 1-2
Fabricate decals for bus blades 1-4
Print bus cube/bus baby inserts 1-4
Metro Service Councils provide a forum for the community and local municipaloperators to express needs and priorities, and evaluate opportunities and issues withservice coordination. Service change programs are developed based on inputgenerated by a wide variety of sources. Sources include customer and employeeinput, service restructuring studies, requests from other local operators andperformance monitoring results. The evaluation process includes public review ofthe proposals, a technical evaluation of ridership and resource impacts,environmental considerations, coordination with key stakeholders in the regional bussystem, and review and approval by Metro Service Councils and/or Board ofDirectors. Once a program is approved, the public is notified of the upcomingchanges and new public timetables and bus operator work assignments aredeveloped.
Changes to the rail system occur less frequently. They generally relate to the openingof a new line or adjustments to the frequency or hours of operation for existing

2011 Metro Transit Service Policy
36
service. Changes in rail and bus service follow the same planning andimplementation process.
Service Change Measures
Federal guidelines and Metro policy require that a public hearing be held when majorservice changes to the bus system are considered. These changes are detailed in thetable below:
Item Measures to Determine Major Service ChangesA A change of 25% or more in the transit route miles.
B A change of 25% or more in the revenue vehicle miles.
C A new transit route is proposed.
D Experimental service changes that meet or exceed the measures specified in items A, Band/or C above may be instituted for 180 days or less without prior notification. A publichearing must be held during that time if the experiment is to remain in effect for morethan 180 days.
E If the number of changes on a route in an operator’s fiscal year add up to the percentagenoted in A, B or C above, a hearing must be held prior to the last change.
F Standard seasonal variations in transit service are exempt from public hearingrequirements unless the number, timing and type of service changes meet the abovecriteria.
G Emergency service changes may be instituted for 180 days or less without priornotification. A public hearing must be held during that time if the emergency service isto remain in effect for more than 180 days.
H It will not be a major service change if service is replaced without interruption at a levelthat would not otherwise constitute a major change.
5.1 IMPACT ANALYSIS FOR PROPOSED CHANGES
Prior to approval, proposed service changes undergo a technical evaluation. Thepurpose of the evaluation is two-fold: 1) to define and evaluate the impact on riders;and 2) to develop appropriate mitigation measures if needed. Factors considered areservice performance, availability of alternatives and special mitigation strategies. Aspart of this evaluation process, resource impacts including in-service hours andvehicles are also tracked to ensure compliance with budget parameters.

2011 Metro Transit Service Policy
37
5.2 TITLE VI REVIEW PROCESS FOR MAJOR SERVICE CHANGES
Title VI of the 1964 Civil Rights Act states that "No person in the United States shall,on the ground of race, color, or national origin, be excluded from participation in, bedenied the benefits of, or be subjected to discrimination under any program oractivity receiving Federal financial assistance." Title VI bars intentionaldiscrimination as well as disparate impact discrimination (i.e., a neutral policy orpractice that has a disparate impact on protected groups).
Chapter V part 4 of the Federal Transit Administration Circular 4702.1A, requirestransit agencies serving large urbanized areas to evaluate significant system-wideservice and fare changes at the planning and programming stages to determinewhether proposed changes would have a discriminatory impact. For service changes,this requirement applies to “major service changes” only and the recipient shouldestablish guidelines or thresholds for what it considers a “major service change” tobe.
Metro must ensure that there is Title VI consideration whenever there is a change inservice that could impact minority communities. Metro must describe significantservice changes relating to hours or days of operation, headways or fares, etc., andprovide an analysis of the effect that any proposed changes may have on minority,low-English proficiency (LEP), and low-income communities. This policy provides adelineation of that service review. Service changes covered by this policy are thoseindicated as “Major Adjustments of Transit Service” under Board Policy (Chapter 2-50 Public Hearings of the Administrative Code). Major service adjustments aregenerally those that constitute an aggregate change of 25 percent or more in routemiles or hours when compared on a daily basis. This includes system wide routerestructuring, or adding and deleting service.
All major service changes will be screened to determine if they have adisproportionate impact on minority, poor and LEP communities (targetpopulations). The routing of those services, for which major changes arerecommended, will be overlaid on top of GIS demographic information to determineif the route serves a large share of the target population(s). If it does, than the impactsof the change will be determined, and if they are significant, mitigation may berecommended, alternative services identified, and the change could be withdrawn. Ifthe route does not serve a large share of the target populations, no further review willbe required.
5.3 PUBLIC HEARING PROCESS
Metro Service Councils oversee the planning and implementation of service withintheir service area, while coordination of the overall Service Change Program is anagency function within the purview of Metro Service Planning staff. The servicecouncil by-laws require service changes to Tier 1 and Metro Rapid bus routes to bereviewed and approved by the Metro Board of Directors.

2011 Metro Transit Service Policy
38
Tier 1 bus routes generally operate along the major corridors in the County. Theresponsibilities of Metro Service Councils include calling and conducting publichearings for area bus lines, review and development of policy recommendations tothe Metro Board, and ensuring compliance with Metro policies procedures and legalagreements.
After a Service Change Program has been developed by Metro Service Planning staffMetro Service Councils are asked to set a date, time and place for their publichearings. During the period between publication of the hearing notices and theconduct of the hearings each service council is provided with a detailed presentationand an opportunity to discuss each of the changes that will be the subject of publiccomment. Subsequent to each hearing, each service council will meet to consider andapprove all proposed service changes. These actions will then be summarized andpresented in an informational report to the Metro Board of Directors.
TIMELINE FOR KEY PUBLIC NOTIFICATION ACTIVITIES
Activity Months Prior to the ServiceChange
Service Planning staff reviews preliminary proposals. 7
Metro Service Councils set dates of public meetings,publish hearing notices in local newspapers and sendLEP and minority communities written notification toelected officials, other operators and key stakeholdergroups.
5-6
Service Planning staff provides information onproposed changes to the Metro Bus OperatorsSubcommittee and at quarterly meetings held with theregions municipal and local operators
3
Communication Department posts informationproposed changes on Metro’s website.
5
Operations staff distributes meeting notices on-boardvehicles. Public outreach at key transportation centers,bus stops, and on-board patron interface occurs as well.
At least one month prior topublic hearings
Metro Service Councils conduct public hearings. 4
Metro Service Councils approve final service changeprogram.
3
Communication Department prepares press releaseson final program and program brochures aredistributed on-board Metro vehicles and other outlets.
1

2011 Metro Transit Service Policy
39
5.4 PUBLIC OUTREACH
Prior to the public hearing, a number of public outreach efforts are made so that thegreatest number of patrons may respond to the changes at either a public hearing, orby submitting written comments via email, mail, or fax. The public out reach effortsinclude:
Distribution of 5,000 information brochures on Metro buses and atinformation centers, which include line number, line name and route changeinformation. Five public hearings are held at a regularly scheduled servicecouncil meeting.
Placement of 8 1/2 by 11 information cards in holders located behind theOperator.
Public outreach at key transportation centers, bus stops, bus and rail stations,and on-board vehicles occurs up to one month before the public hearing isheld. This effort reaches patrons who may not have time to attend a publichearing, and informs them of other communication methods available forfiling public comment.
Public participation in the public hearing process is an important step in assistingstaff and Metro Service Councils in developing and approving final service changes.
5.5 IMPLEMENTING MINOR CHANGES ON AN INTERIM BASIS
Minor service changes are generally route modifications that can be accommodatedwithout impacting the vehicle or operator requirements of the service. Each servicecouncil can make minor route modifications (not requiring a public hearing) not toexceed an annual cost based on the annual CEO signature authority.

2011 Metro Transit Service Policy
40
SECTION 6: CONCLUSION
Metro’s vision to establish world-class transportation services and meet challengesrelated to serving the diverse needs of passengers, communities, and operators willbe contingent on innovative thinking that stems from a solid base of sound planningprinciples. To meet the changing needs of a growing population in Los AngelesCounty, Metro will continue to expand its high-speed bus and rail network across theregion under Measure R and the 30/10 Initiative. As the regional transit coordinatorof transit services, Metro must provide safe, reliable, effective, and convenientservices focused on both customer and employee with an emphasis on long-termsustainability. Achieving this delicate balance between maximizing the benefits ofservice to transit riders, while ensuring that service delivery is efficient and costeffective requires policy guidance and service standards that are designed to targetlevels of productivity, efficiency, and quality.
Given the significant growth in municipal and local return operators as well as MetroRail, Metro’s vision can be achieved through better coordination between alloperators and modes in the region, leveraging the expansion of a robust rail andMetro Liner (Orange Line and Silver Line) as the backbone of the urban transitnetwork, and reducing service duplication. These measures will make the transitsystem more efficient and manageable, resulting in better service quality and asimpler, more intuitive system to use.
Overall, the 2011 Metro Transit Service Policy establishes a set of performancecriteria and standards, a service change process that provides the quantitative tools toevaluate the system, identify opportunities for service improvement, and servicedesign guidelines to ensure that the transit system is developed consistent with policyguidance approved by the Metro Board of Directors.
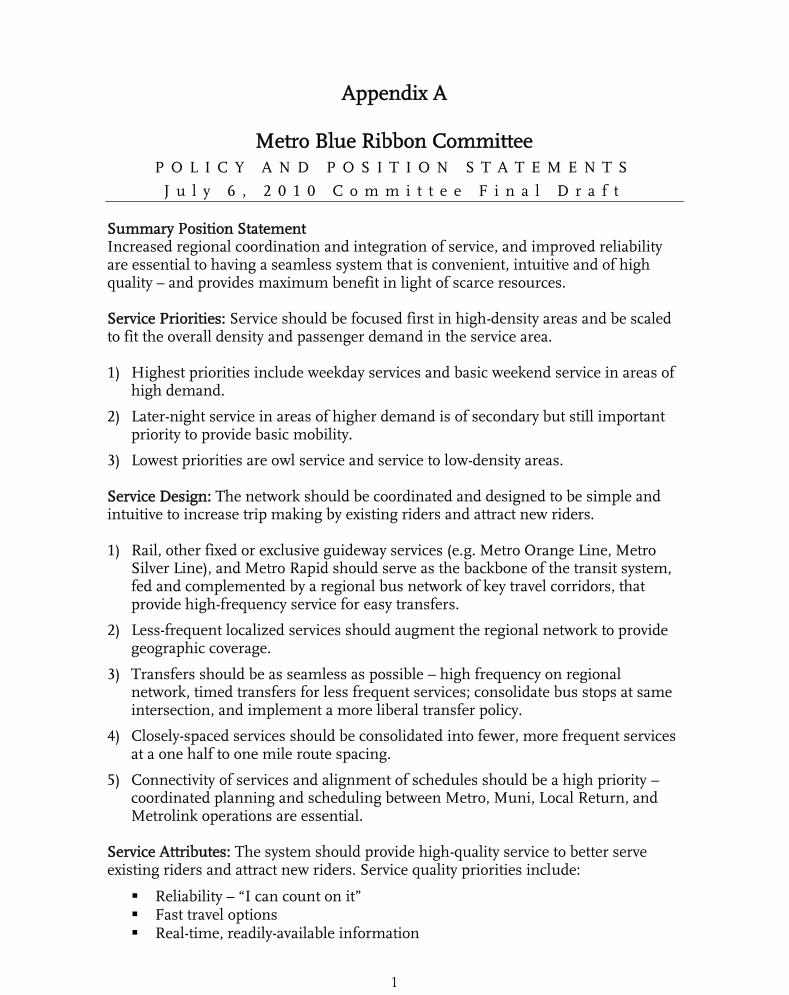
1
Appendix A
Metro Blue Ribbon CommitteeP O L I C Y A N D P O S I T I O N S T A T E M E N T S
J u l y 6 , 2 0 1 0 C o m m i t t e e F i n a l D r a f t
Summary Position StatementIncreased regional coordination and integration of service, and improved reliabilityare essential to having a seamless system that is convenient, intuitive and of highquality – and provides maximum benefit in light of scarce resources.
Service Priorities: Service should be focused first in high-density areas and be scaledto fit the overall density and passenger demand in the service area.
1) Highest priorities include weekday services and basic weekend service in areas ofhigh demand.
2) Later-night service in areas of higher demand is of secondary but still importantpriority to provide basic mobility.
3) Lowest priorities are owl service and service to low-density areas.
Service Design: The network should be coordinated and designed to be simple andintuitive to increase trip making by existing riders and attract new riders.
1) Rail, other fixed or exclusive guideway services (e.g. Metro Orange Line, MetroSilver Line), and Metro Rapid should serve as the backbone of the transit system,fed and complemented by a regional bus network of key travel corridors, thatprovide high-frequency service for easy transfers.
2) Less-frequent localized services should augment the regional network to providegeographic coverage.
3) Transfers should be as seamless as possible – high frequency on regionalnetwork, timed transfers for less frequent services; consolidate bus stops at sameintersection, and implement a more liberal transfer policy.
4) Closely-spaced services should be consolidated into fewer, more frequent servicesat a one half to one mile route spacing.
5) Connectivity of services and alignment of schedules should be a high priority –coordinated planning and scheduling between Metro, Muni, Local Return, andMetrolink operations are essential.
Service Attributes: The system should provide high-quality service to better serveexisting riders and attract new riders. Service quality priorities include:
Reliability – “I can count on it” Fast travel options Real-time, readily-available information

2
Clean and safe transit vehicles, stops, and all transit facilities (e.g. Park andRide, Transit Hubs, Rail Stations, etc.).
1) Less frequent services must be held to a higher standard of on-time performanceto minimize passenger waiting time for missed trips or connections.
2) Clear, accurate, and timely customer information is an important adjunct toservice quality, especially when and where service is less available and whenservice is not provided as expected. (e.g. bus stop signage should include website,phone number, basic service characteristics)
Governance: Metro should serve as a facilitator to coordinate services amongoperators in the region.
1) Metro should develop a formal process for working with Muni, Local Return, andMetrolink operators to arrive at mutually agreed-upon service coordination plans.
2) Metro should offer technical assistance to local operators and facilitate morecooperative, coordinated funding approaches.
3) Metro Governance Councils should broaden their perspective beyond Metro busto include all public operators that provide services within their jurisdictions, andprovide a forum for the community to express needs and priorities, and operatorsto evaluate opportunities and issues with service coordination.
Unresolved Issues
Blue Ribbon Committee members have flagged some unresolved issues that couldpreclude certain BRC recommendations on service coordination, and need to beaddressed in order to fully implement the regional transit vision.
1) Supporting coordination of service by facilitating a working group consisting ofMetro, Muni, and included Operators to resolve any funding impediments toservice coordination.
2) Achieving our desire for local system identity at the operator and city level, whileproviding seamless, coordinated services.
3) Addressing “first mile/last mile” issues by integrating other modes (e.g. bicycles,bikeshare/carshare systems, taxi, pedestrian networks, etc.).
4) Coordinating information among operators, keeping information current,maintaining signage, etc.
5) Developing the TAP program to achieve its full potential.
6) Working closely with labor to identify strategies, solutions, and agreements thatresult in better coordination and efficiencies of service provision.
7) Providing funding flexibility and addressing the need for increased advocacyefforts at the federal level to allow use of federal capital funding for operatingpurposes.

3
Next Steps
Blue Ribbon Committee members recommend the following actions forconsideration by the Metro Board.
1. Update the Transit Service Policy to include specific service design guidelines,performance metrics and standards to reflect BRC policy recommendations bySeptember 2010 for Metro Board approval.
2. Develop future service change proposals based on the updated Transit ServicePolicy.
3. Establish operator working groups to identify specific service coordinationopportunities.
4. Revise Governance Council By Laws to expand the scope of responsibility toinclude identification and recommendations for inter-operator and multi modalservice coordination.
5. Clarify the mission and purpose of the Citizens Advisory Council and utilize theCouncil to further promote the vision of a seamless regional transit system.
6. Coordinate the efforts of Governance Councils and CAC.
7. Establish working group to resolve any funding impediments to servicecoordination.
8. Establish formal process for coordinating inter-operator service plans.
9. Convene the BRC on a periodic basis to review the status of BRCrecommendations.

4
BRC Membership Roster
Name Title OrganizationNeil Bjornsen Council Member Metro Citizens Advisory
CouncilCathi Cole Transit Manager Pasadena Area Rapid
Transit System (ARTS)Donald Camph Executive Director El Segundo Employers
AssociationDiana Ho for LarryEisenberg
Executive Director ofFacilities Planning
Los Angeles CommunityCollege District
Genevieve Giuliano Professor of Policy,Planning, andDevelopment
University of SouthernCalifornia
Alex Gonzalez Council Member Metro San Gabriel ValleySector GovernanceCouncil
Rena Kambara Council Member Metro South Bay SectorGovernance Council
Jim Lefton Chief of Transit Los Angeles Departmentof Transportation
Antonio LeMons Executive Vice-Presidentof Operations
FAME AssistanceCorporation
Stephanie Negriff Director of TransitServices
Santa Monica Big BlueBus
Jim Parker Director of Transportation Norwalk Transit SystemKymberleigh Richards Service Sector
RepresentativeMetro San FernandoValley Sector GovernanceCouncil
Joyce Rooney Transportation & TransitOperations Supervisor
City of West Hollywood
Wally Shidler Council Member Metro Gateway CitiesSector GovernanceCouncil
Stuart Waldman President Valley Industry &Commerce Association
Jerard Wright Council Member Metro Westside/CentralSector GovernanceCouncil
Kelly Norris Executive Director Valley IndustrialAssociation of SantaMonica

APPENDIX B
Metro’s Line Identification Standards
The purpose of establishing transit service line identification standards is to create asimple way for passengers to identify, locate, and reference Metro services, andthereby make the services easier for patrons to use.
The line identification standards shall be adhered to when identifying Metro Bus andMetro Rail lines by name. The standards shall be implemented across all internaland external mediums including, but not limited to, bus stop signs, bus station signs,vehicle headsigns, timetables, the Metro Transit Trip Planner, HASTUS and ATMS.The descriptions and chart below help explain the standards, and how and when theyshould be implemented.
General Standards− Transit service lines will be identified using a combination of line number,
destinations (both terminals) and the corridor(s) the line travels along, withthe exception of Metro Rail and Metro Liner service which will use theestablished operational name (e.g., Metro Red Line, Metro Purple Line, MetroOrange Line).
− Acceptable destination names include a city, community, major landmark,transit center or rail station. Street intersections are no longer to be used as adestination, unless the intersection is required to identify short-line service.
− The destination points will be listed in a West to East or North to South order,consistent with how the line would be read on a map.
− Lines that have Downtown Los Angeles as one of the line’s end points will listits first, as Downtown LA.
− The name of the line will also list at least one major corridor on which ittravels.
− Name abbreviations, street extensions and other topics will be dictated by theMetro Signage Guidelines.
Printed Materials and Electronic Customer Information− The line will be presented using the full name, listing both the
destinations and major corridor(s).− The printed materials include, but are not limited to, timetables, service
change announcements, brochures, system maps, and service reports.− Electronic customer information includes the line information presented on
metro.net and underlying electronic databases such as HASTUS and ATMS.− The Metro Transit Trip Planner will present the line name similarly to what
will be shown on the vehicle headsign and bus stop sign, so patrons can easilylocate the appropriate line at the stop.

Bus Stop Signage:
− The line will be presented using the line number, service brand, color anddestination point that the vehicle is traveling to in each direction.
− The main corridor(s) will also be listed as well as special service qualifiersincluding, but not limited to, rush-hour service and weekday-only service.
− Short-line trip destinations will not be shown on bus stop signs.
Vehicle Headsigns− Headsigns will list the destination in which the vehicle is traveling towards in
one frame.− For short-line trips, the line number and destination shown will be the
destination of that trip and not of the entire line.− When the line is not in service, the sign will read “Not in Service” and display
the route number per Operations Notice #09-18.
Automatic Voice AnnouncementsExternal On-Board Announcements:
− The line will be identified in automatic external voice announcements usingthe line number and destination point that the vehicle is traveling to in eachdirection.
− For short-line trips, the destination noted will be the destination of that tripand not of the entire line.
Internal On-Board Announcements:− When the automatic voice announcement system identifies a stop, the end
destination of that line will follow.− The stops and stations announced onboard should be consistent with names
used on maps, timetables and other printed materials.
Assigning Line Identifiers
− It is expected that the standards will be easily applied to the majority of lines;however, it is also understood that exceptions will have to be made for somelines due to unfamiliar end points or corridors. In these limited cases, ServicePlanning staff and Communications must be in consensus regarding thesechanges before deciding to deviate from the standards.

Metro’s Bus Line Identification, Route Numbering and Color Conventions
Service Type Numbering Primary Route Direction Color SchemeLocal 1-99 Serves Downtown LA -
counterclockwise from NWquadrant.
California Poppy
100-149 Primarily EW operation inareas S of LACBD
California Poppy
150-199 Primarily EW operation inareas N of LACBD
California Poppy
200-249 Primarily NS operation inareas W of LACBD
California Poppy
250-299 Primarily NS operation inareas E of LACBD
California Poppy
Limited 300-399 Branch of local line. California Poppy
Express 400-499 Serves Downtown LA --numbered counterclockwisefrom NW quadrant.
California Poppy /450X Blue
500-599 Does not serve LACBD. California Poppy /577X Blue
Shuttles &Circulators
601-649 Generally circuitous routingwithin service area.
California Poppy
650-659 Generally scheduled serviceoperating point-to-point.
California Poppy
660-699 Generally serves a rail linewithin service area.
California Poppy
Rapid Bus 700-799 Usually operated incombination with anunderlying local line.
Red
SpecializedServices
901 Metro Liner: Orange Line(BRT)
Silver
902 Local Complementary Serviceto BRT
Silver
910 Silver Line: El Monte Busway(ExpressLanes) / DowntownLA/Harbor Transitway(ExpressLanes)
California Poppy

APPENDIX C
METRO RAPID PROGRAM SERVICE WARRANTS
The Metro Rapid program came into being in March 1999 with the approval of the initial implementation plan. Over the pastdecade, Metro has instituted 31 Rapid routes along with 3 Muni operated routes (one additional Muni operated route is plannedfor early 2011). During the implementation period two routes were cancelled for poor performance (Rapid 724 – Lankershimand Rapid Express 940 – Hawthorne).
During 2010 Metro carried out an extensive review of the performance of the Rapid network. Initially, this review was guided byperformance standards expressed in the form of Rapid Warrants which are detailed in this Appendix. The Rapid Warrants wereadopted in August 2004 to provide a framework for monitoring performance, and determining when changes to a route wouldlikely be beneficial or not. It was determined during the review that some of the Rapid Warrants were unrealistic. For example, aRapid seeks to achieve a 25% or better traveltime reduction over an associated local bus line. In fact, only three Rapid lines wereable to reach this level of performance, though most were able to attain 18-20% savings. The review also found it necessary toestablish additional means of assessing performance that were not addressed by the Rapid Warrants. In order to determinewhether or not each Rapid was serving a distinct portion of the travel market in its corridor, the average trip lengths of Rapidand local riders were compared. Unless these were found to be materially different (one more than 25% greater than the other)it would be assumed that the Rapid and the local were serving essentially the same riders and not offering a distinctly differentservice.
In view of these findings, while the Rapid Warrants have been used as a guide for designing and implementing these services, amodified set of standards has been used to assess the long term viability of each route. As a consequence, 5 additional Rapidroutes were to be cancelled in December 2010, and one route is planned for cancellation in June 2011 leaving a network of 23Rapid routes that will continue to be operated by Metro.
PROGRAM PRINCIPLE: Improve OperatingSpeed and Frequency.
PROGRAM GOAL: Minimum operating speed improvement is 20% overexisting limited-stop service or 25% over existing local service.

Program Element ProgramComponent Program Objective
PLANNING DEPARTMENT RESPONSIBILITIES
Maximize patronage andminimize costs
Identify core segment of corridor for Metro Rapid operation to maximize patronage (500 passengersper route mile or greater) and minimize operating costs.
Linear corridor alignment Minimize corridor turning movements to maximize safe and reliable operating speeds, improvecustomer understanding and confidence in service structure, and provide reliable service operations.
OPERATIONS DEPARTMENT RESPONSIBILITIES
Alignment modificationChanges to the alignment that affect one-way revenue route miles or which impact planned or existinginfrastructure (stations and TPS) require a technical memorandum analyzing impacts on customers,line performance, operating costs, and capital costs.
Addition of shortlines andbranches
Proposed shortlines and branches must occur at a point where less than 30% of the maximumpassenger load remains so as to avoid passenger pass-ups on through-trips. Shortlines or branchesmust occur every other trip to avoid confusion and bunching due to erratic loading of passengers. Allshortlines and branches require a technical memorandum analyzing impacts on customers, lineperformance, operating costs, and capital costs.
Addition of express tripsConsideration of express service can be undertaken only as a separate route and where justified in atechnical memorandum analyzing impacts on customers, line performance, operating costs, andcapital costs.
Corridor Alignment
Maintenance of operating speed
Maintenance of the Program Goal is required. Corridor vehicle run times will be monitored.Improvements in operating speed are encouraged through improved stop placement, signal prioritysoftware, elimination of unproductive stops, introduction of bypass lanes, and improved BOCC andTOS management.

Program Element ProgramComponent Program Objective
PLANNING DEPARTMENT RESPONSIBILITIES
Station spacing average no lessthan 0.70 miles
Station spacing will average no less than 0.70 miles per corridor and be based on existing ridershipand connections with other bus and rail service. Station locations must be planned to accommodateeither 45-foot or 60-foot buses.
Far-side station location
Far-side stop locations are required to realize TPS and must be planned at all intersections for bothMetro Rapid and Local service. The only exceptions are where far-side stop locations are not possiblewithin a reasonable walk from the intersection or where nearside locations facilitate access for greaterthan 75% of the boardings, e.g., intersecting Metro Rail station portals.
Full separation from local stop
Shared Metro Rapid and local bus stop locations must be avoided to reduce delay, minimize buscongestion at the stop, and eliminate passenger confusion with “next trip” displays. Circumstancesthat may warrant stop consolidation include the following: a) Stops are outside the core segment of theline where core is defined as greater than 30% of the maximum passenger load, b) Metro Rapid andLocal combined headways are greater than 10 minutes in the peak period, or c) Extended stop zone isnot available.
OPERATIONS DEPARTMENT RESPONSIBILITIES
Addition of new stop
Stops may be added only if they exceed 250 all-day boardings and alightings (100 boardings if withinone mile of line terminal) and only where the Time Delay Index of existing on-board passengers to theadditional riders expected at the new stop is (a) less than 3 for the addition of a new stop that is lessthan 0.5 miles from an existing stop; (b) less than 5 for the addition of a new stop that is between 0.5and 0.7 miles; (c) less than 7.5 for the addition of a new stop that is between 0.7 and 1.0 miles; or (d)less than 10 for the addition of a new stop that is over 1 mile from an existing stop. Stops less than 0.5miles from an existing stop can only be added in extraordinary circumstances. Added stops require atechnical memorandum that analyzes the impacts on customers, line performance, operating costs,and capital costs. Station construction costs associated with stops added beyond those approved in theSeptember 2002 Metro Rapid Board report will be paid by the Managing Sector.
Stop Location
Elimination of stop
Stops may have construction deferred or be eliminated if (a) after the first 12 months the Time DelayIndex is greater than 15; or (b), where use of the station results in operating speed, reliability, or safetyproblems. A technical memorandum is required that analyzes the impacts on customers, lineperformance, operating costs, and capital costs.
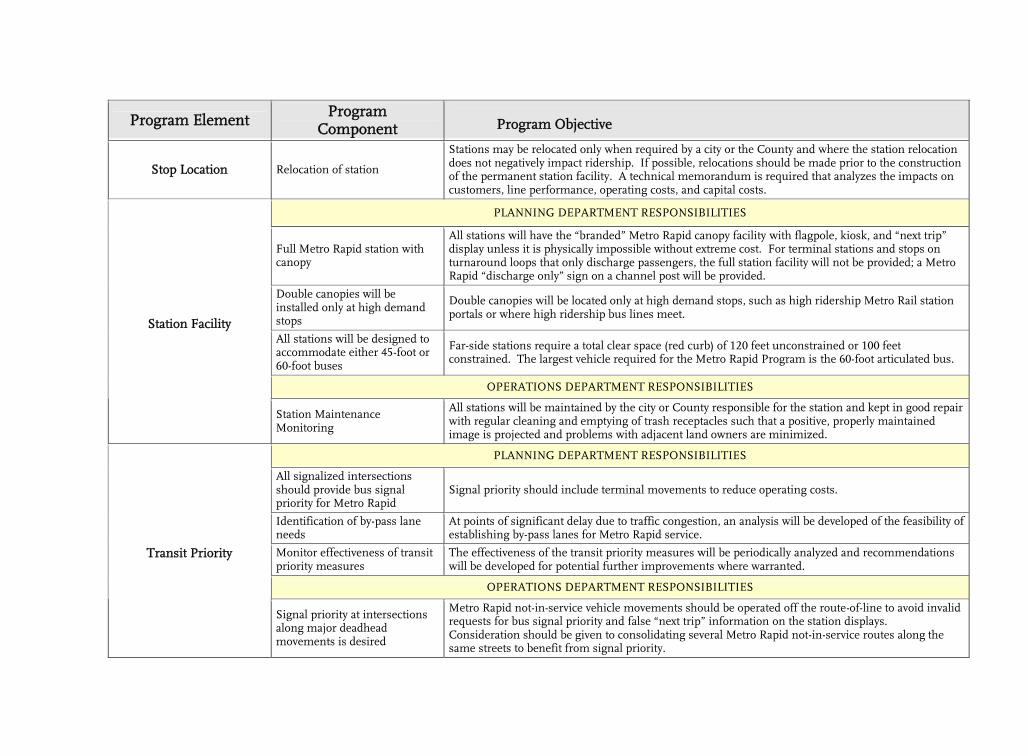
Program Element ProgramComponent Program Objective
Stop Location Relocation of station
Stations may be relocated only when required by a city or the County and where the station relocationdoes not negatively impact ridership. If possible, relocations should be made prior to the constructionof the permanent station facility. A technical memorandum is required that analyzes the impacts oncustomers, line performance, operating costs, and capital costs.
PLANNING DEPARTMENT RESPONSIBILITIES
Full Metro Rapid station withcanopy
All stations will have the “branded” Metro Rapid canopy facility with flagpole, kiosk, and “next trip”display unless it is physically impossible without extreme cost. For terminal stations and stops onturnaround loops that only discharge passengers, the full station facility will not be provided; a MetroRapid “discharge only” sign on a channel post will be provided.
Double canopies will beinstalled only at high demandstops
Double canopies will be located only at high demand stops, such as high ridership Metro Rail stationportals or where high ridership bus lines meet.
All stations will be designed toaccommodate either 45-foot or60-foot buses
Far-side stations require a total clear space (red curb) of 120 feet unconstrained or 100 feetconstrained. The largest vehicle required for the Metro Rapid Program is the 60-foot articulated bus.
OPERATIONS DEPARTMENT RESPONSIBILITIES
Station Facility
Station MaintenanceMonitoring
All stations will be maintained by the city or County responsible for the station and kept in good repairwith regular cleaning and emptying of trash receptacles such that a positive, properly maintainedimage is projected and problems with adjacent land owners are minimized.
PLANNING DEPARTMENT RESPONSIBILITIES
All signalized intersectionsshould provide bus signalpriority for Metro Rapid
Signal priority should include terminal movements to reduce operating costs.
Identification of by-pass laneneeds
At points of significant delay due to traffic congestion, an analysis will be developed of the feasibility ofestablishing by-pass lanes for Metro Rapid service.
Monitor effectiveness of transitpriority measures
The effectiveness of the transit priority measures will be periodically analyzed and recommendationswill be developed for potential further improvements where warranted.
OPERATIONS DEPARTMENT RESPONSIBILITIES
Transit Priority
Signal priority at intersectionsalong major deadheadmovements is desired
Metro Rapid not-in-service vehicle movements should be operated off the route-of-line to avoid invalidrequests for bus signal priority and false “next trip” information on the station displays.Consideration should be given to consolidating several Metro Rapid not-in-service routes along thesame streets to benefit from signal priority.

Program Element ProgramComponent Program Objective
PLANNING DEPARTMENT RESPONSIBILITIES
Metro Rapid lines are assignedone vehicle size, i.e., 40-ft, 45-ft,or 60-ft articulated
The planned service frequency will be based on deployment of a particular size bus and these vehicleswill need to be assigned to the particular line and operating Division. Only one size vehicle should bescheduled and operated on each line in order to avoid passenger overcrowding and service bunching.
OPERATIONS DEPARTMENT RESPONSIBILITIESVehicles and Vehicle
Planning
Vehicles must be in Metro Rapidlivery
Metro Rapid vehicles may be operated only on Metro Rapid routes. On the rare occasion that a redbus is unavailable for pullout, a local bus may be substituted to ensure pullout. Operation of“branded” Metro Rapid buses is integral to the operating speed, simplicity of service, and customerexperience.
OPERATIONS DEPARTMENT RESPONSIBILITIES
Weekday peak frequency The minimum weekday peak frequency is 10 minutes or less.
Weekday off-peak frequency The preferred minimum weekday off-peak frequency is 12 minutes or less. Minimum frequency issubject to funding availability and may be relaxed to no more than 20 minutes.
Local service frequency at start-up 75-100% of planned MetroRapid
Initial local service levels (trips) must be set at 75-100% of Metro Rapid service levels based onindividual corridor needs; adjustments can be initiated after a one-year trial period once actualridership splits are known.
Service Frequencies
Operating expense Initial service levels are specified in the New Service Plan. Service levels thereafter may be adjustedbased on passenger demand after a year of operation.
OPERATIONS DEPARTMENT RESPONSIBILITIES
Service SpanService Span
Metro Rapid span of service is 5:00 a.m. to 9:00 p.m. on weekdays. Metro Rapid service shouldoperate on weekends when warranted by passenger demand. Five Metro Rapid corridors may beexempted from operation within the service span and frequency criteria if approved by the MetroBoard.
OPERATIONS DEPARTMENT RESPONSIBILITIES
Schedule DevelopmentTerminal departure timepoints
Operating schedules and running boards must be developed for free running time by operators withschedule adherence timepoints for terminal departure only; no other timepoints will be shown on theoperator running board.
OPERATIONS DEPARTMENT RESPONSIBILITIES
Operating Protocols Headway interval-managedservice operation
Metro Rapid service allows for dynamic optimization of operating speeds through the utilization offree running time operation after scheduled departure times from terminals; vehicle spacing and on-time departure from terminals must be managed in real-time by the BOCC and/or assigned TOSs.

APPENDIX D
BUS STOP STANDARDS AND GUIDELINES
Transit Cooperative Research Program
SPONSORED BY
The Federal Transit Administration
TCRP Report 19
Guidelines for the Location andDesign of Bus Stops
Transportation Research BoardNational Research Board

CHAPTER 3 STREET-SIDE FACTOR
BUS STOP ZONE DESIGN TYPES-Curb-Side Bus Stop Zone Dimensions
A bus stop zone is the portion of a roadway marked or signed for use by buses when loading orunloading passengers. The lengths of bus stop zones vary among different transit agencies. In general, bus stop zones for far-side and near-side stops are a minimum of 90 and 100 feet, respectively, and midblock stops are a minimum of 150 feet. Far-side stops after a turn typically have a minimum 90-foot zone, however, a longer zone will result in greater ease for a busdriver to position the bus. Bus stop zones are increased by 20 feet for articulated buses. Representative dimensions for busstop zones are illustrated in Figure 3.
More than one bus may be at a stop at a given time. The number of bus-loading positions required at a given location dependson 1) the rate of bus arrivals and 2) passenger service time at the stop. Table 3 presents suggested bus stop capacityrequirements based on a range of bus flow rates and passenger service times. For example, if the service time at a stop is 30seconds and there are 60 buses expected in the peak-hour, two bus loading positions are needed. The arrival rate is based on aPoisson (random) arrival rate and a 5 percent chance the bus zone will be exceeded.
Table 3. Recommended Bus Stop Bay Requirements.
Capacity Required (Bays) When Service Time at Stop Is
Peak-Hour BusFlow
10 Seconds 20 Seconds 30 Seconds 40 Seconds 60 Seconds
15 1 1 1 1 130 1 1 1 1 245 1 1 2 2 260 1 1 2 2 375 1 2 2 3 390 1 2 2 3 4
105 1 2 3 3 4120 1 2 3 3 5150 2 3 3 4 5180 2 3 4 5 6
Policy # 22 2 of 6

CHAPTER 3 STREET-SIDE FACTOR
BUS STOP ZONE DESIGN TYPES-Curb-Side Bus Stop Zone Dimensions
Crosswalk Stop Bar
100’Minimum No Parking Zone 90’ Minimum No Parking Zone
x x o o o o
NEAR-SIDE STOP FAR-SIDE STOP
x60’ 50’
End of Radius o 90’ Minimum No Parking Zone
FAR-SIDE STOPAFTER TURN o
50’50’
o MID BLOCK STOP
o 100’
150’ Minimum No Parking Zone
LEGEND
Parking
o o 40 - foot bus
x = 5 feet from edge of crosswalk or end of radius, whichever is further from the intersection.
Notes:1) Add 20 feet to bus stop zones for an articulated bus.2) Increase bus stop zone by 50 feet for each additional standard 40-foot bus or 70 feet for each additional 60-foot
articulated bus expected to be at the stop simultaneously. See Table 3 for the suggested bus stop capacityrequirements based on a range of bus flow rates and passenger service times.
Figure 3. Typical Dimensions for On-Street Bus Stops
Policy # 22

3 of 6
CHAPTER 3 STREET-SIDE FACTOR
BUS STOP ZONE DESIGN TYPES--Bus Bay Dimensions
Exit Acceleration Stopping Deceleration EntranceTaper Lane Area Lane Taper
(3) (4 ) (1) (4) (3) T L T
12’ min (2)
Notes:
1) Stopping area length consists of 50 feet for each standard 40-foot bus and 70 feet for each 60-foot articulated bus expectedto be at the stop simultaneously. See Table 3 for the suggested bus stop capacity requirements based on a range of busflow rates and passenger service times.
2) Bus bay width is desirably 12 feet. For traffic speeds under 30 mph, a 10-foot minimum bay width is acceptable. Thesedimensions do not include gutter width.
3) Suggested taper lengths are listed in table below. Desirable taper length is equal to the major road through speedmultiplied by the width of the turnout bay. A taper of 5:1 is a desirable minimum for an entrance taper to an arterial streetbus bay while the merging or re-entry taper should not be sharper than 3:1.
4) Minimum design for a busy bay does not include acceleration or deceleration lanes. Recommended acceleration anddeceleration lengths are listed in the table below.
Through Speed(mph)
Entering Speed a
(mph)Length of
Acceleration Lane(Feet)
Length of De-celeration Lane b
(Feet)
Length of Taper(Feet)
35 25 250 184 17040 30 400 265 19045 35 700 360 21050 40 975 470 23055 45 1400 595 25060 50 1900 735 270
a Bus speed at end of taper, desirable for buses to be within 10 mph of travel lane vehicle speed atthe end of the taper.
b Based on 2.5 mph/sec deceleration rate.
Figure 5. Typical Bus Bay Dimensions.Policy # 22
4 of 6

CHAPTER 3 STREET-SIDE FACTOR
BUS STOP ZONE DESIGN TYPES—Partial Open Bus Bay
Another alternative to the bus bay design is a partial open bus bay (or a partial sidewalk extension). This alternative allowsbuses to use the intersection approach in entering the bay and provides a partial sidewalk extension to reduce pedestrian street-crossing distance. It also prevents right-turning vehicles from using the bus bay for acceleration movements. Figure 7illustrates the design for a partial open bus bay.
Exit Acceleration Stopping Entrance Taper Lane Area Taper
T (3) (4) L (1) T (3)
SidewalkSidewalk
12’ min (2)6’
Sidewalk Sidewalk
Figure 7. Partial Open Bus BayPolicy # 22
5 of 6

CHAPTER 3 STREET-SIDE FACTOR
BUS STOP ZONE DESIGN TYPES—Queue Jumper Bus Bay
According to the transit agencies that use the queue jumper bus bays, these bays should be considered at arterial streetintersections when the following factors are present:
High-frequency bus routes have an average headway of 15 minutes or less; Traffic volumes exceed 250 vehicles per hour in the curb lane during the peak-hour; The intersection operates at a level of service “D” or worse (see the Transportation Research Board’s Highway Capacity
Manual for techniques on evaluating the operations at an intersection); and Land acquisitions are feasible and costs are affordable.
An exclusive bus lane, in addition to the right-turn lane, should be considered when right-turn volumes exceed 400 vehicles perhour during the peak-hour.
* Extend lane as necessary tobypass traffic queue
Exit Taper Acceleration Stopping Taper Lane Area 240’ Min*
(3) (4) (1) Right Turn Lane (Buses Excepted)
[]
(2)
[]Bus Stop
Notes for Comments 1,2,3, and 4 are on page 29.
Figure 9. Queue Jumper Bus Bay Layout.
Policy # 226 of 6

APPENDIX E
SCHOOL TRIPPER SERVICE CHANGE PROCEDURES
1. Service Development Managers (SDMs) are responsible for certifying that all schooltrippers in their service area fully comply with Metro’s School Tripper Policy (Section3.2 of the Transit Service Policy). Each SDM will submit a report prior to each majorservice change program that details all existing and proposed school tripper service tothe Service Planning & Scheduling Department.
2. All regularly scheduled school trippers must be published on public timetables toensure that both the general public, as well as the student population, are aware ofthe services.
3. School tripper “pink letters” require notification to the general public through the useof a service change notice or on www.metro.net.
4. Uniform standards for the documentation of school tripper pink letters must beemployed by all sectors. This includes standardizing the pink letter form andoversight of the pink letter information being input into the SLS 2000 system toensure accuracy. All requests for new school trippers and modifications to existingschool trippers must be logged into the SLS2000 regardless if the requested new ormodified school tripper is actually implemented.
5. Request for new school trippers or modifications to existing school trippers will beconsidered only if at least two weeks prior notice is provided to complete appropriateanalysis of the request and to allow appropriate notification of changes to the generalpublic.
6. SDMs are responsible for working with school districts in their service area whichuse school tripper service. For example, a specific protocol has been established withLAUSD in which their monthly Operations Coordinators’ Meeting has a standingagenda item, “Metro Coordination,” where special events and bell-time changes aredisseminated to Metro through communication with staff and the meeting’sminutes.

APPENDIX F
ROUTE PERFORMANCE INDEX
The route performance index is designed to provide an objective measure of a bus route’sperformance relative to other similar types of service. The index is based on system ridershipand financial targets from the current fiscal year Metro Budget. The following categories areused during the performance evaluation process:
Metroliner Metro Express Metro Rapid and Rapid Express Metro Local Metro Shuttles
The evaluation process focuses on three factors:
Utilization of Resources – Boardings per service hour is used as a measure todetermine how effectively resources are being used. This measure is determined bydividing the total number of boardings on the line by the service hours operated.Routes having a higher number of passengers per hour represent a better utilizationof resources such as buses, operators and fuel.
Utilization of Capacity - Passenger miles per seat miles is the measure used toevaluate how well the seating capacity of the system is being used. Passenger milesare calculated by multiplying the average distance traveled per passenger by thenumber of passengers using the service. Seat miles are calculated by determining thenumber of seats per vehicle and multiplying by the number of service miles operated.The higher the resulting number, the greater the utilization of system capacity.
Fiscal Responsibility - Subsidy per passenger is the measure for fiscal responsibility.Subsidy refers to the amount of public funding required to cover the differencebetween the cost of operation and the passenger revenues collected. Higher subsidyservices require more public funding support.
The indices for passengers per service hour and passenger miles per seat mile arenormalized measures where the performance of each individual route is divided by thestandard set for the category. The subsidy per passenger measure is an inverse relationship(higher values represent poorer performance) and therefore is calculated by dividing thecategory standard by each route’s performance.
The following formula is used to develop the route performance index:
Route Performance Index = [(BSHi/ BSH) +(PMSMi/PMSM) + (SUB/SUBi)] / 3
Explanation of Variables
BSH & BSHi Category average and line specific boardings per service hour
PMSM & PMSMi Category average and line specific passenger miles per seat mile
SUB & SUBi Category average and line specific subsidy per passenger

The route performance index is calculated and reported annually. The performancemeasurement standards for each route category are set annually relative to the percentageimprovement of overall system performance relative to the previous years performance. Thispercentage improvement will be based on the performance objectives outlined in the MetroOperating Budget.

APPENDIX G
PERFORMANCE MEASURES DEFINITIONS AND PERFORMANCE THRESHOLDS
P E R F O R M A N C E M E A S U R E S D E F IN IT IO N S & P E R F O R M A N C E T H R E S H O L D SA V A IL A B IL IT Y
- - A c c e s s ib i l i t y S e r v ic e is to b e p r o v id e d to w ith in 1 /4 m ile o f a l l c e n s u s t r a c ts h a v in g a t le a s t 3 h o u s e h o ld s /a c r e a n d /o r 4 jo b s /a c r e
- - C o n n e c t iv i t y D ir e c t t r a n s fe r s s h o u ld b e a v a ila b le f o r a l l R a p id - to - R a p id a n d T ie r 1 L o c a l- to - T ie r 1 L o c a l c o n n e c t io n s
Q U A L IT Y
- - In S e r v ic e O n - T im e P e r f . [ In S e r v ic e O n - T im e P e r fo r m a n c e ] A t le a s t 6 0 % o f t r ip s in e a c h t im e p e r io d s h o u ld b e n o m o r e th a n ( IS O T P ) o n e m in u te e a r ly o r f iv e m in u te s la te a t a l l n o n - te r m in a l t im e p o in ts
- - C u s to m e r C o m p la in ts C o m p la in ts p e r 1 0 0 ,0 0 0 b o a r d in g s s h o u ld b e le s s th a n th e r a t io a c h ie v e d b y th e p o o r e s t 1 5 % o f b u s l in e s in e a c h s e r v ic e ty p e in F Y 2 0 0 8
L o c a l S e r v ic e 8 .7 0E x p r e s s S e r v ic e 3 0 .0 0S h u t t le S e r v ic e 2 4 .0 0R a p id S e r v ic e 4 .0 0
Q U A N T IT Y
- - F r e q u e n c y o f S e r v ic e S e r v ic e s h o u ld b e o p e r a te d a t le a s t e v e r y 6 0 m in u te s , a n d R a p id s e r v ic e a t le a s t e v e r y 2 0 m in u te s b e tw e e n 6 a m - 6 p m
- - L o a d F a c to r T h e r a t io o f p a s s e n g e r s to s e a ts s h o u ld n o t e x c e e d 1 .2 0 d u r in g a n y h o u r a t th e p e a k lo a d p o in t o f a l in e
E F F E C T IV E N E S S
- - B o a r d in g s p e r S e r v ic e H o u r S h o u ld b e a t le a s t th e r a t io a c h ie v e d b y th e p o o r e s t 1 5 % o f b u s l in e s in e a c h s e r v ic e ty p e in F Y 2 0 0 8
D X4 - 6 a m
D X6 - 9 a m
D X9 a m - 3 p m
D X3 - 7 p m
D X7 - 9 p m
D X9 p m - M id
D XM id - 4 a m S A S U
L o c a l S e r v ic e 1 8 .5 0 2 9 .5 0 2 6 .0 0 2 4 .0 0 1 1 .5 0 1 2 .0 0 1 2 .5 0 2 3 .0 0 1 8 .6 0E x p r e s s S e r v ic e 1 3 .0 0 1 5 .0 0 1 4 .0 0 1 6 .0 0 1 2 .0 0 2 .0 0 1 7 .0 0 1 3 .0 0S h u t t le S e r v ic e 8 .5 0 1 1 .0 0 1 4 .0 0 9 .0 0 6 .0 0 7 .0 0 1 2 .0 0 1 1 .0 0R a p id S e r v ic e 2 6 .0 0 3 9 .0 0 4 1 .0 0 3 9 .0 0 2 6 .0 0 2 5 .0 0 3 0 .0 0 3 0 .0 0
- - C o s t p e r P a s s e n g e r M ile S h o u ld b e le s s th a n th e r a t io a c h ie v e d b y th e p o o r e s t 1 5 % o f b u s l in e s in e a c h s e r v ic e ty p e in F Y 2 0 0 8
D X4 - 6 a m
D X6 - 9 a m
D X9 a m - 3 p m
D X3 - 7 p m
D X7 - 9 p m
D X9 p m - M id
D XM id - 4 a m S A S U
L o c a l S e r v ic e $ 2 .0 0 $ 1 .2 0 $ 1 .3 0 $ 1 .4 3 $ 2 .4 7 $ 2 .5 0 $ 3 .0 0 $ 1 .1 4 $ 1 .4 2E x p r e s s S e r v ic e 1 .0 0 1 .0 0 0 .7 5 0 .9 0 1 .2 5 1 .7 5 1 .1 8 1 .3 7S h u t t le S e r v ic e 6 .5 0 3 .6 0 2 .9 5 4 .0 0 6 .0 0 6 .0 0 4 .0 5 5 .4 2R a p id S e r v ic e 1 .1 5 0 .9 0 0 .8 0 0 .9 5 1 .1 0 1 .0 0 0 .8 5 0 .9 5
- - P s g r M ile s p e r S e a t M ile S h o u ld b e a t le a s t th e r a t io a c h ie v e d b y th e p o o r e s t 1 5 % o f b u s l in e s in e a c h s e r v ic e ty p e in F Y 2 0 0 8
D X4 - 6 a m
D X6 - 9 a m
D X9 a m - 3 p m
D X3 - 7 p m
D X7 - 9 p m
D X9 p m - M id
D XM id - 4 a m S A S U
L o c a l S e r v ic e 0 .1 2 0 .2 2 0 .2 1 0 .2 0 0 .0 9 0 .0 8 0 .0 7 0 .2 0 0 .1 7E x p r e s s S e r v ic e 0 .1 9 0 .2 4 0 .2 1 0 .2 5 0 .1 3 0 .0 3 0 .2 0 0 .1 6S h u t t le S e r v ic e 0 .0 5 0 .0 8 0 .1 0 0 .0 7 0 .0 4 0 .0 5 0 .0 6 0 .0 4R a p id S e r v ic e 0 .1 5 0 .2 1 0 .2 9 0 .2 8 0 .1 9 0 .1 7 0 .3 1 0 .2 5
- - R o u te P e r f o r m a n c e In d e x S h o u ld b e 0 .6 0 o r g r e a te r . ( A v e r a g e v a lu e f o r s e r v ic e ty p e is 1 .0 . )

APPENDIX H
Service Change Process Work Flow
Analyze System− Data Collection− Service Performance Analysis− Identify Issues
Develop Initial Proposals− Review Analysis− Generate Ideas & Proposals− Perform Impact Analysis− Review Proposals with the Metro Service Councils (MSC)− Modify / Revise Proposals based on MSC’s Feedback.
Revise Proposals Based Upon Feedback from:− MSC− Public Comments
Service Change Notification− Prepare Public Notices− Perform Community Outreach− Conduct Public Hearings
Minor Service Change− Less than $100,000
Annual Impact− Delegated to Staff.
Normal Service Change− Requires MSC
Approval
Significant Service Change− Impacts greater than 25% of
Route Miles & RevenueVehicle Miles
− Fare Change− New Service− Title VI Analysis Required− Requires MSC Approval− Requires Board Approval− Requires Public Hearings
Approval of Service Changes− MSC− Board
Scheduling Process: Schedule building, Runcutting, Rostering, and developing schedule relatedreports.
Implement Approved Service Change− Stops & Zones− Time Tables− Public Information

One Gateway Plaza Los Angeles, CA 90012-2952
213.922.2000 Tel metro.net
11-0
404t
r ©
2010
LA
CM
TA