Embed Size (px)
Citation preview

Reference Number: 800.510-86.2014
Lac La Hache Cariboo Regional District
Summer 2014
Strengthening Farming Program Ministry of Agriculture
Updated: May 21, 2015
Phot
o cr
edit:
G. J
aspe
r, M
inis
try o
f Agr
icul
ture

AAcckknnoowwlleeddggmmeennttss This project was made possible by a partnership between the Cariboo Regional District and the British Columbia Ministry of Agriculture. Both organizations provided extensive in-kind resources to prepare and conduct the Agricultural Land Use Inventory (ALUI). We would like to express appreciation to the farmers who stopped to talk to the survey crew and answered questions about farming in the Lac La Hache area. This project was funded by the Cariboo Regional District, Agriculture and Agri-Food Canada, and the BC Ministry of Agriculture through programs delivered by the Investment Agriculture Foundation of BC. Additional funding was provided by Agriculture and Agri-Food Canada and the BC Ministry of Agriculture. Funding Partners: Disclaimer: Agriculture and Agri-Food Canada, the BC Ministry of Agriculture and the Investment Agriculture Foundation of BC, are pleased to participate in the delivery of this project. We are committed to working with our industry partners to address issues of importance to the agriculture and agri-food industry in British Columbia. Opinions expressed in this report are those of the authors and not necessarily those of the Investment Agriculture Foundation or Agriculture and Agri-Food Canada. CCiittaattiioonn BC Ministry of Agriculture. (2014). Agricultural Land Use Inventory: Lac La Hache, Cariboo Regional District, Summer 2014. (Reference No. 800.510-86.2014).
CCoonnttaacctt IInnffoorrmmaattiioonn For further information on the content and development of this report please contact: Ministry of Agriculture Innovation & Adaptation Services Branch, Strengthening Farming Program 1767 Angus Campbell Rd, Abbotsford, BC V3G 2M3 (604) 556-3001 or 1-888-221-7141 (toll free)
Lac La Hache Agricultural Land Use Inventory - Page i

TTaabbllee ooff CCoonntteennttss Acknowledgments........................................................................................................................................ i Citation ......................................................................................................................................................... i Contact Information ..................................................................................................................................... i Table of Contents .........................................................................................................................................ii List of Tables ............................................................................................................................................... iii List of Figures ............................................................................................................................................. iiv
List of Maps – Appendix A - Maps ............................................................................................................... v
Acronyms ..................................................................................................................................................... v
Executive Summary ..................................................................................................................................... 1
Agrologist Comments .................................................................................................................................. 4
1. General Information ............................................................................................................................. 6 Agricultural Land Reserve ..............................................................................................................................7 Inventory Area ...............................................................................................................................................8 Parcel Ownership ..........................................................................................................................................9
2. Methodology ....................................................................................................................................... 10 Inventory Methodology .............................................................................................................................. 10 Description of the Data .............................................................................................................................. 11 Presentation of the Data ............................................................................................................................ 12 Determination of Parcels within the ALR ................................................................................................... 13
3. Land Cover and Farmed Area.............................................................................................................. 14
4. Land Use and Farm Use ...................................................................................................................... 16 Privately Owned Parcels ............................................................................................................................. 17 Crown Owned Parcels ................................................................................................................................ 19
5. Availability of Land for Farming .......................................................................................................... 21 Agricultural Capability ................................................................................................................................ 24 Characteristics of Not Farmed but Available Lands ................................................................................... 28
6. Farming Activities ................................................................................................................................ 32 Cultivated Field Crops ................................................................................................................................. 32 Irrigation ..................................................................................................................................................... 35 Natural Pasture & Rangeland ..................................................................................................................... 36 Livestock ..................................................................................................................................................... 38
7. Condition of ALR Lands ....................................................................................................................... 43 Parcel Inclusion in the ALR ......................................................................................................................... 43 Parcel Size & Farming in the ALR ................................................................................................................ 44 Residential Use in the ALR .......................................................................................................................... 48
Appendix A – Maps ................................................................................................................................... 51
Appendix B – Riparian Areas ..................................................................................................................... 52
Appendix C – Agricultural Capability ........................................................................................................ 60
Appendix D – Indian reserves ................................................................................................................... 61
Appendix E – Glossary ............................................................................................................................... 62
Lac La Hache Agricultural Land Use Inventory - Page ii

LLiisstt ooff TTaabblleess Table 1. Land cover and farmed area .................................................................................................................. 15 Table 2. Parcel ownership summary ................................................................................................................... 16 Table 3. Land use and farming use on privately owned parcels ......................................................................... 17 Table 4. Parcel use and land cover in the ALR on privately owned parcels ........................................................ 18 Table 5. Land use and farming use on Crown owned parcels ............................................................................. 19 Table 6. Parcel use and land cover in the ALR on Crown owned parcels ............................................................ 20 Table 7. Status of the land base with respect to farming .................................................................................... 22 Table 8. ALUI identified site limitation on ALR land that is available for cultivation .......................................... 22 Table 9. Agricultural capability on actively farmed cultivated crops .................................................................. 25 Table 10. Agricultural capability on land available for cultivation ........................................................................ 26 Table 11. ALR land available for cultivation by agricultural capability class on privately owned parcels ............. 27 Table 12. ALR land available for cultivation by agricultural capability class on Crown owned parcels ................ 27 Table 13. Land use and cover on parcels “Used for farming” with ALR land available for farming but not
farmed .................................................................................................................................................... 28 Table 14. Land use and cover on “Not used for farming” parcels with ALR land available for farming ............... 29 Table 15. Main field crop types by area ................................................................................................................ 32 Table 16. Forage & pasture crops by area ............................................................................................................. 33 Table 17. All crop types by area ............................................................................................................................. 34 Table 18. All crop types and irrigation ................................................................................................................... 35 Table 19. Natural pasture and rangeland by parcel ownership ............................................................................ 36 Table 20. Natural pasture and rangeland by vegetation types ............................................................................. 37 Table 21. Livestock and equine activities .............................................................................................................. 39 Table 22. Equine activities ..................................................................................................................................... 39 Table 23. Equine homesite infrastructure ............................................................................................................. 39 Table 24. Beef activities ......................................................................................................................................... 40 Table 25. Number of farmed and not farmed parcels in the ALR – privately owned ........................................... 45 Table 26. Number of farmed and not farmed parcels in the ALR – Crown owned ............................................... 47 Table 27. Farming and residences in the ALR – privately owned .......................................................................... 49
Lac La Hache Agricultural Land Use Inventory - Page iii

LLiisstt ooff FFiigguurreess Figure 1. General location map ............................................................................................................................... 6 Figure 2. Agricultural Land Reserve location map .................................................................................................. 7 Figure 3. Inventory area and Agricultural Land Reserve location map................................................................... 8 Figure 4. Inventory area and parcel ownership map .............................................................................................. 9 Figure 5. Parcel inclusion in the ALR ..................................................................................................................... 13 Figure 6. Land cover and farmed area in the ALR ................................................................................................. 15 Figure 7. Availability of ALR lands for farming ...................................................................................................... 23 Figure 8. Agricultural capability on actively farmed cultivated crops in the ALR ................................................. 25 Figure 9. Agricultural capability on land available for cultivation in the ALR ....................................................... 26 Figure 10. ALR land cover that is available for cultivation on “Used for farming” parcels ..................................... 28 Figure 11. ALR land cover that is available for cultivation on “Not used for farming” parcels .............................. 30 Figure 12. Vegetation type on natural pasture or rangeland in the ALR and on parcels “Not used for farming” . 30 Figure 13. Size of areas available for cultivation on privately owned “Not used for farming” parcels with ALR
land ........................................................................................................................................................ 31 Figure 14. Forage & pasture fields by size .............................................................................................................. 34 Figure 15. Forage & pasture fields by size and type ............................................................................................... 34 Figure 16. Irrigation systems by percentage of cultivated land ............................................................................. 35 Figure 17. Natural pasture and rangeland areas by size ........................................................................................ 37 Figure 18. Livestock and equine activities by scale and type ................................................................................. 40 Figure 19. Livestock and equine activities by parcel size and type......................................................................... 40 Figure 20. Livestock and equine activities by parcel size and scale ........................................................................ 41 Figure 21. Livestock and equine activities by parcel size ........................................................................................ 41 Figure 22. Average area in forage, pasture, farm infrastructure, and natural pasture or rangeland on parcels
with livestock activities (excluding very small scale) ............................................................................. 42 Figure 23. Total area in forage, pasture, farm infrastructure, and natural pasture or range on parcels with
livestock activities (excluding very small scale) ..................................................................................... 42 Figure 24. Percent of parcel area utilized for forage, pasture, farm infrastructure, and natural pasture or range
on parcels with livestock activities (excluding very small scale)............................................................ 42 Figure 25. Parcel inclusion in the ALR ..................................................................................................................... 43 Figure 26. Number of parcels in the ALR by parcel size – privately owned ............................................................ 44 Figure 27. Total area in the ALR by parcel size – privately owned ......................................................................... 44 Figure 28. Number of farmed and not farmed parcels in the ALR by parcel size – privately owned ..................... 45 Figure 29. Number of farmed and not farmed parcels in the ALR by parcel size (line chart) – privately owned .. 45 Figure 30. Proportion of parcels farmed and not farmed by parcel size in the ALR – privately owned ................. 46 Figure 31. Proportion of land cover by parcel size in the ALR – privately owned .................................................. 46 Figure 32. Number of parcels in the ALR by parcel size – Crown owned ............................................................... 47 Figure 33. Total area in the ALR by parcel size – Crown owned ............................................................................. 47 Figure 34. Total area in residential footprint by parcel size ................................................................................... 49 Figure 35. Proportion of parcels with residences by parcel size ............................................................................ 50 Figure 36. Average percent of parcel area in residential footprint by parcel size.................................................. 50
Lac La Hache Agricultural Land Use Inventory - Page iv

LLiisstt ooff MMaappss –– AAppppeennddiixx AA -- MMaappss Map 1. Land cover & farmed area Map 2. Land use & farmed area Map 3. Availability of land for farming Map 4. Farming activities - Cultivated crops, livestock, irrigation, grazed land Map 5. ALR parcel size AAccrroonnyymmss AGRI BC Ministry of Agriculture ALR Agricultural Land Reserve ALUI Agricultural Land Use Inventory CRD Cariboo Regional District GIS Geographic Information Systems OCP Official Community Plan
Lac La Hache Agricultural Land Use Inventory - Page v

EExxeeccuuttiivvee SSuummmmaarryy The Cariboo Regional District (CRD) is located in the central interior of BC and consists of 12 electoral areas (A-L) and 4 member municipalities. CRD is responsible for providing many services to the electoral areas, including land use planning and the development of Official Community Plans. The Agricultural Land Use Inventory (ALUI) will provide background information for updating Official Community Plans in the region. In the summer of 2014, the BC Ministry of Agriculture and the Cariboo Regional District partnered to conduct an ALUI in the Lac La Hache region. Lac La Hache is located within CRD Electoral Area G and is approximately 65 km from Williams Lake and 25 km from 100 Mile House. The ALUI was funded by the CRD, Agriculture and Agri-Food Canada, and the BC Ministry of Agriculture through programs delivered by the Investment Agriculture Foundation of BC. Additional funding was provided by Agriculture and Agri-Food Canada and the BC Ministry of Agriculture through Growing Forward 2 (GF2), a federal-provincial-territorial initiative. ALUIs help to understand the type and extent of agricultural activities in the inventory area and provide a baseline which can be used to measure land use change over time. The data can be used to determine the capacity for agricultural expansion, as well as to quantify the amount of land within the Agricultural Land Reserve (ALR) that is unavailable for agriculture. The data allows the estimation of agricultural water demand with the use of an irrigation water demand model. Included in the inventory were all parcels i) completely or partially within the ALR; ii) classified by BC Assessment as having “farm” status for tax assessment; iii) zoned by local government bylaws to permit agriculture and showing signs of agriculture on aerial photography; iv) with an active water licence for farming or irrigation purposes. Indian reserves were inventoried if they met one of the above criteria. Due to differences in levels of governance, planning, and decision making, ALUI results for land on Indian reserves are presented separately from the main inventory totals. The ALR in Lac La Hache consists of 11,528 ha. Of this area, 11,082 ha (96%) met one of the above criteria and was included in the inventory. A total of 436 ha (4%) of ALR was not inventoried as it was outside of legally surveyed parcels in rights of ways, water, or unsurveyed Crown land. The remaining 10 ha of ALR was on Canim Lake 4 Indian reserve and is not included in the main inventory totals. Of the inventoried 11,082 ha in the ALR, 8,019 ha (70%) is on Crown owned parcels and 3,063 ha (26%) is on privately owned parcels. An additional 1,131 ha of non-ALR land was inventoried. In total, 307 parcels were inventoried with a combined area of 12,213 ha. The inventory area consists of 8,826 ha of Crown owned land (8,019 ha in the ALR and 807 ha outside the ALR) and 3,387 ha of privately owned land (3,063 ha in the ALR and 324 outside the ALR). The ALUI was conducted using visual interpretation of aerial imagery combined with a drive-by “windshield” survey method to capture a “snapshot in time” of land use and land cover. Land cover is defined as the biophysical material at the surface of the earth while land use is defined by how people utilize the land. These two types of data allow for different forms of analysis. In the ALR by land cover, 420 ha (4%) was farmed, 62 ha (<1%) was anthropogenically modified (not farmed), and 10,600 ha (92%) was in a natural or semi-natural state. Included in the natural or semi-
Lac La Hache Agricultural Land Use Inventory - Page 1

natural land is 9,395 ha (81% of the ALR) in natural pasture or rangeland. The remaining 4% of ALR was outside of legally surveyed parcel and is considered unavailable for farming. An additional 52 ha outside of the ALR was farmed. See Table 1 and Map 1 for more details. For land use, the entire parcel was examined and a “Used for farming” definition was applied based on the percentage of the parcel in cultivated crops, farm infrastructure, and/or the scale of livestock production. In the ALR by land area, a total of 1,407 ha (12%) is on parcels “Used for farming” (all have private ownership), 9,254 ha is on parcels “Used for grazing” (1,280 ha have private ownership & 7,974 ha have Crown ownership), and 421 ha is on parcels not used for farming or grazing (375 ha have private ownership & 46 ha have Crown ownership). See Tables 2 - 6 and Map 2 for more details. The inventory provided insight into ALR land available for farming by looking at land cover and land use, Of the 11,528 ha of ALR land in Lac La Hache, 420 ha (4%) is actively farmed, 9 ha (<1%) supports farming (e.g. houses, farm roads, farm buildings, etc.) and 566 ha (5%) are unavailable for farming due to existing land use or land cover. That leaves 10,087 ha (87%) of the ALR that is available for cultivation. Of this available land 9,395 ha (81% of the ALR) is currently used for natural pasture or rangeland, 2,719 ha have private ownership and 8,404 ha have Crown ownership. Agricultural capability was assessed for lands that are available for cultivation. Of the 10,087 available ha in the ALR 1,564 ha (16%) is Class 3, 930 ha ( 9%) is Class 4, and 8,78 (82%) is Class 5 land. See Table 7, Table 10 and Figure 7 for details. There are 429 ha of cultivated field crops in Lac La Hache (379 ha in the ALR and 50 ha outside the ALR). Forage & pasture was the only crop type recorded. In total, there were 247 ha in forage, 179 ha in pasture and 3 ha in forage & pasture. The majority of the cultivated land (370 ha or 86%) occurs on agricultural capability Class 5 land. See Table 9 and Tables 15-16 for details. Irrigation use was captured by crop type and irrigation system type to aid in developing a water demand model for agriculture. Only 110 ha or 26% of the cultivated crops were irrigated. See Table 18 and Map 4 for details. Natural pasture and rangeland is a critical component to the beef industry in Lac La Hache. A total of 10,232 ha of natural pasture & rangeland were recorded in the inventory area. This includes 8,229 ha (80%) on Crown owned parcels and 2,094 (20%) on privately owned parcels. The majority of all natural pasture and rangeland is in “treed closed” land cover (>60% vegetation cover is treed). Treed land cover offers lower forage yields to grazing livestock than open grasslands. See Table 20 and Map 4 for details. Livestock activities were recorded, but are very difficult to measure using a windshield survey methodology. Livestock may not be visible if they are in barns, are on another land parcel, or on Crown range tenures. The inventory data does not identify animal movement between parcels that make up a farm unit, but reports livestock at the parcel where the animals or related structures are observed. No actual livestock numbers were obtainable through the inventory, so the results were reported as a range in terms of animal unit equivalents for each parcel. Equine and beef are the most common livestock types in Lac La Hache. There are 10 beef operations in the inventory area including 4 large (>100 cattle), 2 medium (25 -100 cattle), and 4 small (2 – 25 cattle) operations. Also recorded were 21 equine homesite activities. Although equines are not important for food production, they contribute greatly to the rural life style. All recorded equine activities were “non-intensive” and only 1 had more than 25 animals. Also recorded were 5 very small poultry activities (<100 birds) and 1 very small sheep activity (< 10 sheep). See Tables 23 – 26 for more information.
Lac La Hache Agricultural Land Use Inventory - Page 2

ALR parcel size analysis was conducted on 249 parcels with 11,039 ha of ALR land. Of these parcels, 137 with 3,050 ha were under private ownership and 112 parcels with 7,989 ha were under Crown ownership. On privately owned parcels, the average parcel size is 23 ha, the median parcels size is 5.5 ha. Twelve percent (12%) of the privately owned ALR parcels are less than 1 ha, 37% are less than 4 ha, and 54% are less than 8 ha. Of the privately owned ALR parcels, 39 parcels (28%) are “Used for farming”, 36 parcels (26%) are “Used for grazing”, and 62 parcels (45%) are “Not used for farming or grazing”. In general, the proportion of parcel “Used for farming” and “Used for grazing” increases as the parcel size increases. Although parcels of all sizes are “Used for farming”, Small parcels are far less likely to be farmed or grazed than larger parcels. See Figures 27 – 31 for more information. This report provides some insight into the current status of agriculture. This baseline information can be used to inform decisions on how to best manage the agricultural land base in order to support and strengthen farming in the future.
Lac La Hache Agricultural Land Use Inventory - Page 3

AAggrroollooggiisstt CCoommmmeennttss Agriculture has been ongoing in the Lac La Hache area since the Cariboo Gold Rush in the late 1800’s. The Cariboo was filled with roadhouses along the gold rush trail which served as stop overs for miners traveling to and from the gold fields in the North Cariboo. The roadhouses included mixed farms to supply many of the travelers’ needs. These mixed farms included: Equine (driving and pack horses), Dairy (milk, cheese, and butter), Poultry (broilers and eggs), mixed livestock (beef, sheep and goats) and vegetable production. By 1887, several producers were located within the survey area. The British Columbia Directory for Lac La Hache included 5 stock breeders, 2 stockmen, 2 farmers, and 1 stock grower from 115 Mile House to 122 Mile house. At that time the Lac La Hache Valley produced 4,000 cattle, 500,000 lbs of natural hay, and 4,000 to 5, 000 lbs of butter1.
Today, the Lac La Hache OCP area maintains its agricultural history. Although dairy and vegetable production has diminished, the survey area still includes several beef and equine farms. In 2011, Statistics Canada indicated that Cariboo Regional District Area G (in which Lac La Hache is located), generated $3,384,796.00 in gross farm cash receipts, $187,473.00 in wages and salaries, and had $87,997,043.00 in Farm Capital on 73 farms. These farms are supported by producer involved organizations such as the Lac La Hache Livestock Association, the South Cariboo Regional Cattlemen’s Association, South Cariboo Agri-Culture Enterprise Centre and the Cariboo Chilcotin Coast Invasive Plant Committee. The area also hosts a garlic festival in August on the Felker Homestead that generates Agritourism revenue.
Figure 27 and Figure 29 of this report give an indication of the number of privately owned parcels in the ALR by parcel size and agricultural use. Of the privately owned ALR parcels:
• 37% (51 parcels) are less than 4 ha. Of these parcels, 12% are farmed and 14% are grazed • 24% (33 parcels) are between 4 and 16 ha. Of these parcels, 30% are farmed and 15% are grazed • 39% (53 parcels) are greater than 16 ha. Of these parcels, 43% are farmed and 45% are grazed
These findings are consistent with findings from other interior regions of the province where the smaller the parcel size is, the less likely the parcel is to be farmed. In the survey area, this result also indicates that many privately owned parcels are grazed rather than cultivated. This could be a factor of the abundant grasslands within the Lac La Hache area and/or the cost of production to establish forage crops as compared to grazing natural pastures and rangelands. The inventory also found that 90% of the total Agricultural Land Reserve (ALR) area on privately owned land is on parcels greater than 16 hectares (Figure 28). These numbers show that the majority of the ALR area on private land is still in large tracts and is currently being farmed and/or grazed.
• Of the total privately owned ALR area, 88% was farmed and/or grazed • Of the privately owned ALR area on parcels greater than 16 ha, 93% was farmed and/or grazed
Overall farm size could not be determined with this inventory as many beef and equine operations own and/or lease multiple parcels. Possible farming options for smaller parcels which are currently “not used for farming” include market gardens and/or greenhouses to meet the local produce demand in the south and central Cariboo areas. Parcels with potential for farming would need to be assessed for irrigation potential and soil amendment requirements.
1 http://www.vpl.ca/bccd/index.php/browse/title/1887/British_Columbia_Directory Lac La Hache Agricultural Land Use Inventory - Page 4

Grasslands are an important part of BC’s ecosystem. They currently make up <1 % of the province, yet are home to a large proportion of species at risk2. These grasslands are also vital to the ranching sector. Agriculture in the Cariboo was established primarily because of the vast grasslands within the region. Within the Agricultural Land Use Inventory (ALUI), grassland vegetation cover is defined as areas where the dominant vegetation is native grasses, sedges or rushes with <10% tree cover and < 20% shrubs. With this definition, the ALUI land cover does not match the grassland benchmark definition in the Cariboo Chilcotin Land Use Plan. The ALUI captures existing vegetative cover regardless of whether or not a site is classified as a grassland ecosystem. Despite this difference in classification methodology, the ALUI still gives an indication of how the grassland is being used. Eighty percent of the grassland vegetation cover in Lac La Hache was identified on private land. Current agriculture practices appear to be keeping grasslands intact.
The majority of the Agriculture Land Capability for the survey area is Class 3, Class 4 and 5. Class 3 land is defined as land capable of producing a wide range of crops. Class 4 lands are defined as land that requires special management practices or severally restricts the range of possible crops or both. Class 5 land is defined as land that is restricted in its capability to producing perennial forage crops3. Seventy-four percent of the 11,133 ha available for cultivation was Class 5, 9% was Class 4, and 16% was Class 3. Although there are limitations to the type of soil bound agriculture that is suited to Class 5 lands, these areas are not necessarily excluded from potential cultivation. The application of regular management practices such as drainage, irrigation, stone picking and/ or irrigation can improve the agricultural capability rating to class 2 and 3 in some areas of the survey. The inventory found that the majority of the cultivated crops in Lac La Hache occur on Class 5 land (86%). It is beyond the scope of the ALUI to determine if or how these lands have been improved.
Since most of the ALR in the survey area is held by the Crown (72%), expansion of the agriculture sector is dependent on Crown Land policies. Currently, applications for agriculture expansion through acquisition of Crown Lands requires Class 4 or better and that a Crown Land application will not result in more than 50% of the applicants total farm unit (the applicant’s privately owned farm land and the Crown land under application) being comprised of land that is class 5 or poorer. This inventory has identified that it would be challenging to meet policy requirements to increase production capacity through Crown Land expansion in this area. As well, expansion would also be limited by other resource priorities such as timber, old growth management areas and wildlife habitat areas.
The Cariboo area has variable requirements for irrigation. Historically, ranches used ditching with flood irrigation and created fields on poorly drained soils. Today these types of fields still exist and the ALUI attempted to capture them by labeling them as fields with sub-surface irrigation or riparian meadow fields. Over time as ranches expanded sprinkler irrigation systems were added. These systems are designed for peak requirements and the system is utilized over a larger area. The survey found that 26% of all cultivated field crops were irrigated. Irrigation may have been under reported as the spring of 2014 had an above average precipitation for the area (therefore producers may have chosen not to use irrigation) and it is difficult to see handmove systems on fields when they are not running. Without water for irrigation, the possibility of expanding agriculture will be limited. Even existing water rights and licenses for agriculture are linked to the original field not the title so expansion of fields is hampered unless they can utilize their existing license more efficiently.
2 http://www.bcgrasslands.org/index.php/index.php 3 http://www.alc.gov.bc.ca/alc/content.page?id=CE6EED0FBDBE4701AE0B3A0BF72CBC05
Lac La Hache Agricultural Land Use Inventory - Page 5

11.. GGeenneerraall IInnffoorrmmaattiioonn Cariboo Regional District (CRD) is a regional government that consists of 12 electoral areas (A through L) and 4 incorporated member municipalities. CRD is responsible for providing many services to the electoral areas, including land use planning and the development of Official Community Plans (OCP). The Agricultural Land Use Inventory (ALUI) will provide background information for updating OCPs in the region. Lac La Hache is located within Electoral Area G and is situated along the Cariboo Highway approximately 65 kilometers from Williams Lake and 25 kilometers from 100 Mile House. Lac La Hache is French for ‘Axe Lake’. The name comes from a story about a trapper losing his only axe in the lake while chopping a hole in the ice4. The area has a rich history involving the fur trade, the gold rush, and the ranching industry. The Lac La Hache inventory area is defined by the Lac La Hache Official Community Plan (OCP) boundaries. Figure 1. General location map
4 Government of British Columbia; Ministry of Environment, BC Parks. http://www.env.gov.bc.ca/bcparks/explore/parkpgs/laclahache/ Lac La Hache Agricultural Land Use Inventory - Page 6
AGRICULTURAL LAND RESERVE
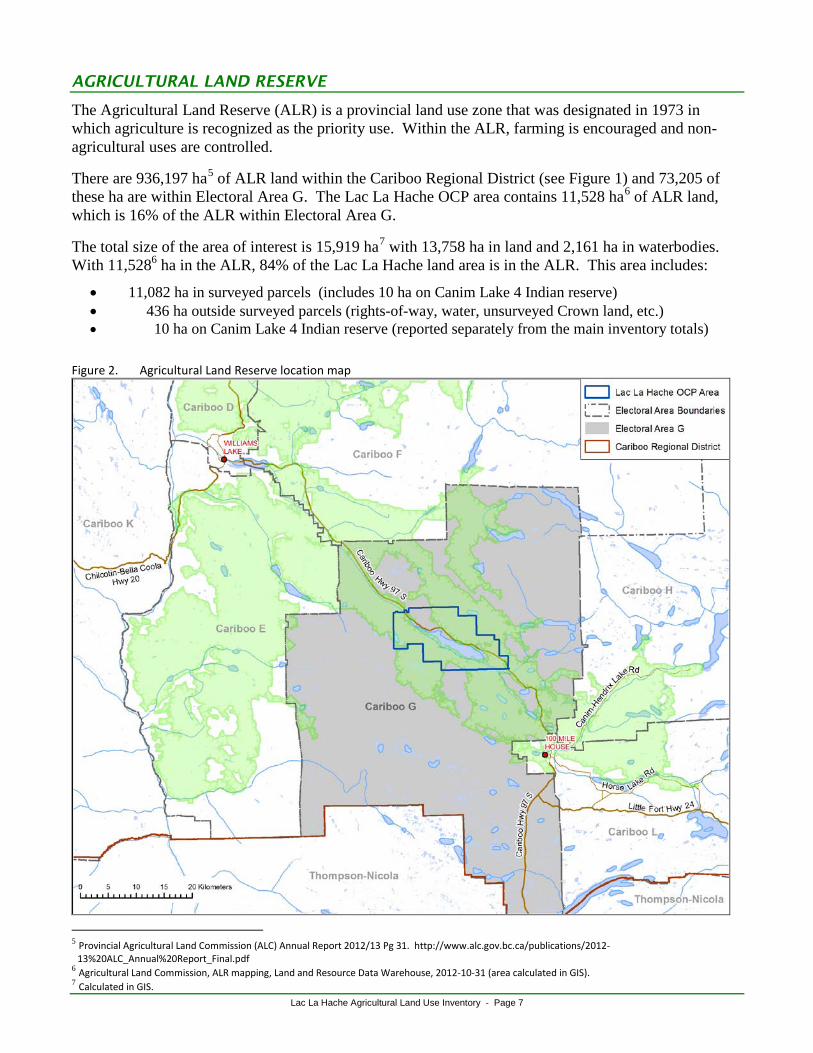
The Agricultural Land Reserve (ALR) is a provincial land use zone that was designated in 1973 in which agriculture is recognized as the priority use. Within the ALR, farming is encouraged and non-agricultural uses are controlled.
There are 936,197 ha5 of ALR land within the Cariboo Regional District (see Figure 1) and 73,205 of these ha are within Electoral Area G. The Lac La Hache OCP area contains 11,528 ha6 of ALR land, which is 16% of the ALR within Electoral Area G.
The total size of the area of interest is 15,919 ha7 with 13,758 ha in land and 2,161 ha in waterbodies. With 11,5286 ha in the ALR, 84% of the Lac La Hache land area is in the ALR. This area includes:
• 11,082 ha in surveyed parcels (includes 10 ha on Canim Lake 4 Indian reserve) • 436 ha outside surveyed parcels (rights-of-way, water, unsurveyed Crown land, etc.) • 10 ha on Canim Lake 4 Indian reserve (reported separately from the main inventory totals)
Figure 2. Agricultural Land Reserve location map
5 Provincial Agricultural Land Commission (ALC) Annual Report 2012/13 Pg 31. http://www.alc.gov.bc.ca/publications/2012-13%20ALC_Annual%20Report_Final.pdf
6 Agricultural Land Commission, ALR mapping, Land and Resource Data Warehouse, 2012-10-31 (area calculated in GIS). 7 Calculated in GIS.
Lac La Hache Agricultural Land Use Inventory - Page 7

INVENTORY AREA
The total inventory area encompasses 307 parcels with a combined area of 12,213 ha, or 89% of Lac La Hache’s total land area (major waterbodies excluded). Included are all parcels:
• completely or partially within the Agricultural Land Reserve • classified by BC Assessment as having “Farm” status for property tax assessment • zoned by local government bylaws to permit agriculture and exhibiting signs of agriculture on
aerial photography • with an active water licence for farming or irrigation purposes
The amount of ALR land included in the inventory area is 11,082 ha located on 281 parcels. This area is 96% of the ALR within Lac La Hache. The remaining 4% of the ALR was excluded from the inventory as it is outside of surveyed land parcels in rights-of ways, water, or unsurveyed Crown land.
Also surveyed was 11 hectares of land on Canim Lake 4 Indian Reserve. The Canim Lake 4 Indian reserve was surveyed as 94% or 10.4 ha of its area is within the Agricultural Land Reserve. Land inventoried on reserves in not included in main inventory totals due to differences in levels of governance, planning, and decision making process. Figure 3. Inventory area and Agricultural Land Reserve location map
Lac La Hache Agricultural Land Use Inventory - Page 8

PARCEL OWNERSHIP
Crown owned land is separated from privately owned land throughout this report. The agricultural activities likely to occur on Crown owned land are limited and may be subject to specific restrictions. Of the 307 parcels surveyed as part of the inventory:
• 123 parcels are Crown owned. This includes: o 8,826 ha or 72% of the entire survey area
8,019 ha in the ALR or 70% of the entire ALR area 807 ha outside of the ALR
• 184 parcels are privately owned o 3,387 ha or 28% of the entire survey area
3,063 ha or 26% of the entire ALR area 324 ha outside of the ALR
Parcels owned by Cariboo Regional District are included in the private ownership category as they are not subject to the same restrictions as other Crown owned parcels. Indian reserves are excluded from the above totals. Figure 4. Inventory area and parcel ownership map
Lac La Hache Agricultural Land Use Inventory - Page 9

22.. MMeetthhooddoollooggyy INVENTORY METHODOLOGY
AgFocus is an Agricultural Land Use Inventory System developed by BC Ministry of Agriculture’s Strengthening Farming Program. AgFocus employs a “windshield” survey method designed to capture a snapshot in time of land use and land cover on legal parcels. For more information on AgFocus, please refer to these documents available from the Strengthening Farming Program:
• AgFocus – A Surveyor’s Guide to Conducting an Agricultural Land Use Inventory • AgFocus – Field Guide to Conducting an Agricultural Land Use Inventory • AgFocus – A GIS Analyst’s Guide to Agricultural Land Use Inventory Data
The Lac La Hache agricultural land use inventory was conducted in the summer of 2014 by BC Ministry of Agriculture agrologists with the assistance of a GIS technician8. The survey crew visited each property and observed land use, land cover, and agriculture activity from the road. Where visibility was limited, data was interpreted from aerial photography in combination with local knowledge. The technician entered the survey data into a database on a laptop computer. Field survey maps provided the basis for the survey and included:
• The legal parcel boundaries (cadastre)9 • Unique identifier for each legal parcel • The preliminary land cover polygon boundaries (digitized
prior to field survey using aerial photography) • Unique identifier for each preliminary land cover polygon • The boundary of the Agricultural Land Reserve (ALR) • Base features such as streets, street names, watercourses and
contours • Aerial photography
8 Technician provided by Cariboo Regional District. 9 Cadastre mapping (2013) provided by Cariboo Regional District.
Lac La Hache Agricultural Land Use Inventory - Page 10

DESCRIPTION OF THE DATA
For each property in the study area, data was collected on general land use and land cover. For properties with agriculture present, data was collected on agricultural practices, irrigation, crop production methods, livestock, agricultural support (storage, compost, waste), and activities which add value to raw agricultural products. Once acquired through the survey, the data was brought into a Geographic Information System (GIS) to facilitate analysis and mapping. Digital data, in the form of a tabular database and GIS spatial layers (for maps), may be available with certain restrictions through a terms of use agreement. General land use: Up to two general land uses (e.g. residential, commercial) were recorded for each property based on an assessment of overall economic importance, the property’s tax status, and/or the extent of the land use. The survey for general land use focuses solely on human use and considers:
• The actual human use of land and related structures and modifications to the landscape
• Use-related land cover (where land cover implies a use or is important to interpreting patterns of use)
• Declared interests in the land (which may limit use) such as parks
In addition, the availability of properties for future farming was assessed based on the amount of potential land for farming on the property and the compatibility of existing uses with future farming activities. Land cover: Land cover refers to the biophysical features of the land (e.g. crops, buildings, forested areas, woodlots, streams). Land cover was surveyed by separating the parcel into homogeneous components and assigning each a description. Prior to field survey, polygons were delineated in the office using orthophotography. Further delineation occurred during the field survey until one of the following was achieved:
• Minimum polygon size (500 sq m ~5400 sq ft) or minimum polygon width (10 m ~33 ft)
• Polygon is homogeneous in physical cover and homogeneous in irrigation method
• Maximum level of detail required was reached In most cases, more than one land cover was recorded for each parcel surveyed.
Agriculture Use Livestock Dairy Milking
Other Use
Residential Single Family Household
Anthropogenic Terrestrial Bare or Built Farm
Natural & Semi Natural Terrestrial Vegetated Open Treed
Anthropogenic Terrestrial Vegetated Cultivated Grass
Anthropogenic Terrestrial Bare or Built Built Residential Single Family Small house
Lac La Hache Agricultural Land Use Inventory - Page 11

Agricultural practices: Surveyors recorded agricultural practices associated with crops or livestock activities. For example, if a forage crop was being harvested for hay, it was recorded. Irrigation was also recorded, including the type of system used. Agricultural crop production: Crop production and crop protection methods observed on the parcel were recorded such as wildlife scare devices, temperature or light control, or organic production. Organic production is not always visible and may have been recorded based on local knowledge or farmer interviews. Livestock: Livestock operations and confinement methods along with the scale of the activity were estimated and recorded. Livestock not visible at the time of survey may have been inferred based on grazed pastures, manure storage, size of barn and other evidence. Agricultural support: Ancillary agricultural activities, such as storage, compost or waste, supporting the production of a raw commodity on a farm unit were recorded. Agricultural value added: Activities that add value to a raw commodity where at least 50% of the raw commodity is produced on the farm unit were recorded. This value-added activity included processing, direct sales and agri-tourism activities. PRESENTATION OF THE DATA
The data is presented in the form of summarized tables and charts. Absolute data values are preserved throughout the summarization process to maintain precision. In the final formatting of the summarized tables and charts, data values are rounded to the nearest whole number. As a result, data presented in the summarized tables and charts may not appear to add up correctly.
Lac La Hache Agricultural Land Use Inventory - Page 12

DETERMINATION OF PARCELS WITHIN THE ALR
Since much of the following analysis is parcel based, it is important to note that the ALR boundaries do not always align with parcel boundaries. As a result, many parcels have only a portion of their area in the ALR. Figure 5 illustrates the frequent misalignment between parcel boundaries and the ALR boundary. Given that the dark green line represents the ALR boundary, Lot A is completely in the ALR and Lots B and C have a portion of their area in the ALR. Lot D is completely outside the ALR. Many of the results presented in this report include 3 separate totals: the total parcel area, the portion of the parcel inside the ALR, and the portion of the parcel outside the ALR. Figure 5. Parcel inclusion in the ALR
Lac La Hache Agricultural Land Use Inventory - Page 13

33.. LLaanndd CCoovveerr aanndd FFaarrmmeedd AArreeaa Land cover describes the biophysical material at the surface of the earth and is distinct from land use which describes how people utilize the land. Land use is surveyed by assigning the parcel up to two land uses. Some examples of land use are residential, commercial, and industrial. Refer to Section 4 of this report for more information on land use. Land cover is surveyed by separating the parcel into homogeneous components and assigning each a description such as landscape lawn, natural open treed, natural waterbody, blueberries, road, or small single family house. Most surveyed parcels have numerous different land cover types with each describing a different area of the parcel. Land cover more closely approximates the actual area of land in agricultural production or “Farmed” than land use. Four land cover types are considered “Farmed”:
• Cultivated field crops: vegetation under cultivation for harvest or pasture including land temporarily set aside from farming and perennial crops that were not harvested or grazed in the current growing season
• Farm infrastructure: built structures associated with farming such as barns, stables, corrals, riding rings, and their associated yards
• Greenhouses: permanent enclosed glass or poly structures with or without climate control facilities for growing plants and vegetation under controlled environments
• Crop barns: permanent enclosed structures with non-translucent walls for growing crops such as mushrooms or bean sprouts
Forage and pasture field crops which have not been cut or grazed during the current growing season (unused), unmaintained field crops, and unmaintained greenhouses are considered “Farmed” land covers but are considered inactive. Natural pasture or rangelands are fenced areas with uncultivated (not sown) natural or semi-natural vegetation used for grazing domestic livestock. These areas are considered “Grazed” rather than “Farmed” although these areas are usually extensions of more intensive farming areas. Land cover types which may support farming, such as farm residences, vegetative buffers and farm road access, are not considered “Farmed” land cover. Land cover on Indian reserves is presented in Appendix D.
Lac La Hache Agricultural Land Use Inventory - Page 14

Table 1. Land cover and farmed area
In ALR (ha)
% of ALR
Total area (ha)
Privately owned (ha)**
Crown owned (ha)**
Cultivated field crops 379 3% 50 429 425 4Farm infrastructure 41 < 1% 2 43 43 <1
420 4% 52 472 467 5Managed vegetation 19 < 1% 13 32 31 <1Non Built or Bare 10 < 1% 17 27 8 19Residential footprint 17 < 1% 7 25 25 -Settlement 2 < 1% 1 4 4 -Transportation 11 < 1% <1 11 4 7Built up - Other 3 < 1% <1 4 4 -
62 < 1% 40 102 76 26Natural pasture or rangeland 9,395 81% 928 10,323 2,094 8,229Vegetated 670 6% 81 751 596 156Wetlands 396 3% 12 408 116 292Natural bare areas 2 < 1% - 2 1 1Waterbodies 135 1% 19 155 37 118
10,600 92% 1,040 11,639 2,844 8,79611,082 96% 1,131 12,213 3,387 8,826
Indian reserves 10 < 1% <1 11Outside parcels 436 4%Parcels with < 100 sq m of ALR <1 < 1%
446 4%11,528 100%
* See the glossary for terms used in this table.** In Crown ownership. This total does not include land in Indian reserves.
TOTAL
FARMED SUBTOTAL
SUBTOTAL
SUBTOTALTOTAL
SUBTOTAL
Natural & Semi-natural
Anthropogenic(not farmed)
Not surveyed
Surveyed
Land cover*Outside ALR (ha)
ALR Inventory area
Actively farmed
Figure 6. Land cover and farmed area in the ALR
Actively farmed-Cultivated field crops, 3%
Anthropogenic, 1%Natural & Semi-natural -
natural pasture or rangeland, 81%
Natural & Semi-natural, 11%
Not surveyed (outside parcels, etc.), 4%
Table 1 shows the extent of different land cover types across the entire inventory area.
There are 472 ha of land in “Farmed” land cover and 10,323 ha of land in “natural pasture or rangeland”.
Land cover on inventoried Indian reserves is presented in Appendix D.
Figure 6 shows the proportion of different land cover types across the ALR in Lac La Hache.
Of the ALR land, 81% is in “natural pasture or rangeland” while 3% is in cultivated field crops.
Land used in support of farming such as farm residences, vegetative buffers or roadways is not included as “Farmed”.
Lac La Hache Agricultural Land Use Inventory - Page 15

44.. LLaanndd UUssee aanndd FFaarrmm UUssee Land use focuses solely on human use and describes the economic function or type of establishment using the parcel. A parcel can have a variety of activities on the land, yet serve a single use. For example, two parcels are said to be “Used for farming”, even if one is a dairy farm and the other is in blueberries. Another example is “commercial” land use; if one parcel is a hotel, another is a retail store, and a third is a gas station, all area considered to have “commercial” land use. Up to two general land uses (e.g. residential, commercial, protected area) are recorded for each parcel. Evaluation of land uses are based on overall economic importance, the property’s tax status, and/or the extent of the land use. Parcels where the majority of the parcel area is utilized for farming or parcels which exhibit significant evidence of intensive farming are considered “Used for farming”. For a complete definition of “Used for farming”, refer to the definitions section of this report. Parcels that do not meet the “Used for farming” criteria, but have a significant portion of their area in natural pasture or rangeland and have evidence of active domestic livestock grazing are considered “Used for grazing”. Many parcels “Used for farming” or “Used for grazing” are also used for other purposes such as “residential” or “industrial”. This report does not attempt to determine which use is primary. Privately owned land is reported separately from Crown owned land in this section of the report. The agricultural activities likely to occur on Crown owned land are limited and may also be subject to specific restrictions, depending on the government entity owning it. Land use is not assessed for land on Indian reserves. Table 2. Parcel ownership summary
In ALR (ha)
% of ALR area
3,063 26 % 324 3,387 28 % 184 60 % 188,019 70 % 807 8,826 72 % 123 40 % 72
11,082 96 % 1,131 12,213 100 % 307 100 %Surveyed Indian reserves 10 <1 %
Outside parcels 436 4 %Parcels with < 100 sq m of ALR < 1 <1 %
446 4 %11,528 100 %TOTAL
CROWN OWNED SUBTOTALTOTAL
Not surveyed
SUBTOTAL
% of parcels
Average parcel
size (ha)
PRIVATELY OWNED SUBTOTAL
Parcel land use
ALROutside ALR (ha)
Total area (ha)
% of inventory
area
Number of
parcels
Table 2 summarizes the area and number of parcels in Crown and private ownership in Lac La Hache. Ninety six percent of the Lac La Hache’s ALR was inventoried; 26% of the ALR area is on privately owned parcels while 70% is on Crown owned parcels.
Lac La Hache Agricultural Land Use Inventory - Page 16

PRIVATELY OWNED PARCELS
Table 3. Land use and farming use on privately owned parcels
In ALR (ha)
% of ALR area
600 5 % 24 624 18 35Residential 746 6 % 124 870 31 28Utilities 61 <1 % < 1 61 1 61
1,407 12 % 148 1,555 50Used only for grazing - no other use 1,023 9 % 60 1,082 28 39
Residential 241 2 % 8 249 10 25Utilities 17 <1 % 5 22 1 22
1,280 11 % 73 1,353 39Residential 224 2 % 48 272 73 4No apparent use 104 <1 % 19 122 15 8Forestry 24 <1 % < 1 24 1 24Transportation 18 <1 % 17 36 3 12Recreation & leisure 3 <1 % 3 7 1 7Institutional & community 2 <1 % < 1 2 1 2Gravel extraction - - 16 16 1 16
375 3 % 103 479 953,063 26 % 324 3,387 184
* See "Land Use" in the glossary for terms in this table.
Total area (ha)
NOT USED FOR FARMING/ GRAZING SUBTOTALTOTAL
USED FOR GRAZING SUBTOTAL
Grazing - Mixed use
Not used for farming/ grazing
Average parcel
size (ha)
Used only for farming - no other use
Number of parcels
USED FOR FARMING SUBTOTAL
Parcel land use*
ALROutside ALR (ha)
Farming - Mixed use
Table 3 shows that 1,555 ha or 13% of the inventory area is on privately owned parcels that are “Used for farming”. Eighteen of these parcels are exclusively “Used for farming” with no other use and 31 of these parcels have the mixed use “Used for farming” and “Residential”.
There are 39 privately owned parcels comprising 11% of the inventory area that are “Used for grazing”. The majority of these parcels are exclusively “Used for grazing” with no other land use.
Refer to Map 2 for more information.
Lac La Hache Agricultural Land Use Inventory - Page 17

Table 4. Parcel use and land cover in the ALR on privately owned parcels
In ALR (ha)
% of ALR area
In ALR (ha)
% of ALR area
In ALR (ha)
% of ALR area
In ALR (ha)
% of ALR area
155 1 % < 1 <1 % 445 4 % 600 5 %Residential 208 2 % 12 <1 % 526 5 % 746 6 %Utilities 19 <1 % - - 42 <1 % 61 <1 %
382 3 % 12 <1 % 1,013 9 % 1,407 12 %11 <1 % 4 <1 % 1,008 9 % 1,023 9 %
Residential 18 <1 % 3 <1 % 220 2 % 241 2 %Utilities - - 1 <1 % 15 <1 % 17 <1 %
29 <1 % 9 <1 % 1,243 11 % 1,280 11 %5 <1 % 30 <1 % 341 3 % 375 3 %
416 4 % 50 <1 % 2,597 23 % 3,063 26 %Not used for farming or grazing
* Some parcels that are "Not used for farming" have "Farmed" land cover, however, the extent or intensity is insufficient for the parcel to be considered "Used for farming". For a complete definition of “Used for farming” refer to the glossary.
Used for grazing -mixed use
Total
USED FOR FARMING SUBTOTAL
SUBTOTAL
Used only for farming - no other use
Parcel Land Use
Land Cover CategoryAnthropogenic (not farmed)
Natural & Semi-natural
Farmed *
USED FOR GRAZING SUBTOTAL
Used only for grazing - no other use
Used for farming -mixed use
Table 4 combines land use and ALR land cover on privately owned parcels in Lac La Hache. For example, privately owned parcels with the mixed use “Used for farming” and “Residential” have a total of 208 ha in “Farmed” land cover, 12 ha in “Anthropogenic” (not farmed) land cover, and 526 ha in “Natural & Semi-natural” land cover.
Although 1,407 ha or 12% of Lac La Hache’s ALR is on parcels “Used for farming” (refer to Table 3), only 416 ha or 4% of the ALR is actually in “Farmed” land cover.
In total, there are 1,013 ha of ALR land in “Natural & Semi-natural” land cover on privately owned “Used for farming” parcels. Of this area, 887 ha (88%) are in “natural pasture or rangeland”.
Lac La Hache Agricultural Land Use Inventory - Page 18

CROWN OWNED PARCELS
Table 5. Land use and farming use on Crown owned parcels
In ALR (ha)
% of ALR area
Used only for grazing - no other use 6,661 58 % 732 7,393 95 78Utilities 500 4 % < 1 500 6 83Forestry 386 3 % < 1 386 4 97Recreation & leisure 251 2 % < 1 251 1 251Transportation 130 1 % < 1 131 2 65Gravel extraction 45 <1 % 72 117 2 58
7,974 69 % 804 8,778 110No apparent use 29 <1 % 2 31 9 3Industrial 14 <1 % - 14 1 14Garbage dumps 3 <1 % - 3 1 3Transportation < 1 <1 % < 1 < 1 2 < 1
46 <1 % 3 48 138,019 70 % 807 8,826 123
* See "Land Use" in the glossary for terms in this table.
Used for grazing -
Mixed use
Total area (ha)
NOT USED FOR FARMING/ GRAZING SUBTOTALTOTAL
USED FOR GRAZING SUBTOTALNot
used for farming/ grazing
Average parcel
size (ha)
Number of
parcels Parcel land use*
ALROutside ALR (ha)
Table 5 details the land use on Crown owned parcels in Lac La Hache. In total 7,974 ha of Lac La Hache’s ALR (69%) is on Crown owned parcels that are “Used for grazing”. Most Crown owned parcels are exclusively “Used for grazing” with no other use.
There are also 15 “Used for grazing” parcels with a mixed use: 6 parcels are also used for “utilities”, 4 parcels are associated with “forestry”, 1 parcel is used for “recreation & leisure” and is associated with a portion of the Trans Canada snowmobile trail, 2 parcels are in “transportation”, and 2 parcels are also used for “gravel extraction”.
Refer to Map 2 for more information.
Lac La Hache Agricultural Land Use Inventory - Page 19

Table 6. Parcel use and land cover in the ALR on Crown owned parcels
In ALR (ha)
% of ALR area
In ALR (ha)
% of ALR area
In ALR (ha)
% of ALR area
In ALR (ha)
% of ALR area
5 <1 % < 1 <1 % 6,656 58 % 6,661 58 %Utilities - - - - 500 4 % 500 4 %Forestry - - - - 386 3 % 386 3 %Recreation & leisure - - < 1 <1 % 251 2 % 251 2 %Transportation - - 1 <1 % 129 1 % 130 1 %Gravel extraction - - - - 45 <1 % 45 <1 %
5 <1 % 2 <1 % 7,967 69 % 7,974 69 % - - 10 <1 % 36 <1 % 46 <1 %5 <1 % 12 <1 % 8,003 69 % 8,019 70 %
Not used for farming or grazing
* Some parcels that are "Not used for farming" have "Farmed" land cover, however, the extent or intensity is insufficient for the parcel to be considered "Used for farming". For a complete definition of “Used for farming” refer to the glossary.
Grazed-mixed use
Total
SUBTOTAL
Parcel Land Use
Land Cover CategoryAnthropogenic (not farmed)
Natural & Semi-natural
Farmed *
USED FOR GRAZING SUBTOTAL
Used only for grazing - no other use
Table 6 combines land use and ALR land cover on Crown owned parcels in Lac La Hache. For example, Crown owned parcels exclusively “Used for grazing” have a total of 5 ha in “Farmed” land cover and 6,656 ha in “Natural & Semi-natural” land cover. Of these 6,656 ha in “Natural & Semi-natural” land cover, 6,179 or 93% is in “natural pasture or rangeland”.
There is little “Farmed” or “Anthropogenic (not farmed)” land cover on Crown owned parcels. The 10 ha of “Anthropogenic” land cover on “not used for farming or grazing” Crown owned parcels is comprised of roads, railroads, bare areas, and 2 houses on Canim Lake 4 Indian reserve.
Lac La Hache Agricultural Land Use Inventory - Page 20

55.. AAvvaaiillaabbiilliittyy ooff LLaanndd ffoorr FFaarrmmiinngg There is currently a strong demand for local agricultural products that is expected to increase with population growth10. This demand along with a number of other factors, such as commodity types and farm management requirements (nutrient management, bio-security), will influence agricultural land needs in the future. Lands suitable for agricultural development may not be available and agricultural sectors that require large land bases, such as dairy or berry, may find it difficult to access sufficient land. Future agriculture growth may come from new commodity types and intensifying land use rather than finding new land for development. The analysis of the availability of land for farming examines how much land is available for farming, has the potential to be farmed, and the characteristics of this land. Properties currently “Used for farming” or with some agriculture present are considered available for farm expansion. Properties currently “Not used for farming” but with an existing use compatible with agriculture, such as residential, are considered available for farming. In both cases, it is assumed that existing non-farm land uses will be maintained and will not be displaced by agriculture expansion. Properties that are currently “Not used for farming” and with an established non-farm use that is incompatible with agriculture (e.g. a golf course, a school, or small lot residential) are considered to be unavailable for farming. These properties usually have little land available and tend to have very high land values. It is uneconomical for a farmer to acquire and convert these properties to farmland given the limited farming potential. Land is further assessed for its farming potential based on physical and environmental characteristics. It is assumed that removing built structures and fill piles, filling in water bodies, or remediating slopes/soils to create land with cultivation potential would likely not occur. In addition, areas with operational constraints such as a very small size are considered not to have potential for cultivation. Only areas in natural and semi-natural vegetation, areas in managed vegetation (managed for landscaping, dust or soil control), and non-built or bare areas are considered to have potential for cultivation. Availability of land is not assessed for land on Indian reserves.
10 In BC, the regulated marketing system requires that over 95% of our milk, eggs, chicken and turkey be produced in BC. The need to produce these products increases in direct proportion to the population growth.
In the Lac La Hache OCP area, properties in the ALR and “Used for farming” have an average assessed land and improvement value of $19,262 per ha.
Properties in the ALR that are considered “Unavailable for farming” have an average assessed land and improvement value of $209,157 per ha.
(Calculated using 2012 BC Assessment)
Lac La Hache Agricultural Land Use Inventory - Page 21

Table 7. Status of the land base with respect to farming
In ALR (ha)
% ALR Area
Total area (ha)
Privately owned (ha)*
Crown owned (ha)*
Cultivated field crops 379 3 % 50 429 425 4Farm infrastructure 41 <1 % 2 43 43 < 1
420 4 % 52 472 467 5Residential footprint 6 <1 % 2 8 8 -Transportation 3 <1 % < 1 3 3 -
9 <1 % 2 11 11 -Residential 5 <1 % 4 9 9 -Transportation 3 <1 % < 1 3 3 < 1Institutional & community 2 <1 % < 1 2 2 -Wetlands 394 3 % 12 406 114 292Waterbodies 135 1 % 19 154 37 118Residential footprint 11 <1 % 4 15 15 -Transportation 8 <1 % < 1 8 < 1 7Built up - Other 5 <1 % 2 8 8 -Natural bare areas 2 <1 % - 2 1 1
566 5 % 41 607 190 418Natural pasture or rangeland 9,395 81 % 928 10,323 2,094 8,229Natural & Semi-natural - Vegetation 667 6 % 80 748 592 155Anthropogenic - Managed vegetation 15 <1 % 10 26 25 < 1Anthropogenic - Non Built or Bare 9 <1 % 17 26 8 19
10,087 87 % 1,036 11,123 2,719 8,40411,082 96 % 1,131 12,213 3,387 8,826
Surveyed Indian reserves 10 <1 %Outside parcels 436 4 %Parcels areas < 100 sq m < 1 <1 %
446 4 %11,528 100 %
Supporting farming
SUBTOTAL
TOTAL
Not surveyed
UNAVAILABLE FOR FARMING
Inventory area
* In Crown ownership. This total does not include land in Indian reserves.
AVAILABLE FOR CULTIVATION
Unavailable for farming due to
existing land use
Available for cultivation
SUPPORTING FARMING
Unavailable for farming due to
existing land cover
Actively farmed
TOTAL
Land status
ALROutside ALR (ha)
ACTIVELY FARMED
Table 8. ALUI identified site limitation on ALR land that is available for cultivation
Soils &/or topography
Flooding &/or drainage
Operational
Natural pasture or rangeland 45 139 63 247Natural & Semi-natural - Vegetation 98 30 6 135Anthropogenic - Non Built or Bare 4 - < 1 4Anthropogenic - Managed vegetation - - < 1 < 1
TOTAL 146 169 70 386
Available for farming - land cover type
Site limitations in the ALRTotal ALR area (ha)
Table 7 shows that 420 ha or 4% of the ALR is actively used for farming; 5% is unavailable for farming due to existing land use or land cover; and 87% is available for cultivation. The majority of the land that is available for cultivation (81% of the ALR) is currently utilized as natural pasture or rangeland.
Land that is available for cultivation may have other factors that limit the potential for soil bound agriculture. Operational constraints such as very small size or awkward shape as well as agricultural capability may limit the potential for available land to be brought into agricultural production.
Refer to Maps 2 and 3 for more information.
Table 8 details the site limitations identified as part of the agricultural land use inventory. These limitations will likely reduce the potential of some types of agriculture. Nearly two-thirds (64% or 247 ha) of the ALR land with identified site limitations is currently in natural pasture or rangeland.
Lac La Hache Agricultural Land Use Inventory - Page 22

Figure 7. Availability of ALR lands for farming AG CAP NOT UPDATED
ALR 11,528 ha Non - ALR, 2,230 ha
0 ha 2,000 ha 4,000 ha 6,000 ha 8,000 ha 10,000 ha 12,000 ha
Lac La Hache Land Area 13,758
11,082 ha or 96% of the ALR 436ha
0 ha 2,000 ha 4,000 ha 6,000 ha 8,000 ha 10,000 ha
Areas not surveyed11,528
ALR Surveyed Outside surveyed parcels (Rights- of-way, water & foreshore)
Indian reserves
11,083 ha or 96% of the ALR
0 ha 2,000 ha 4,000 ha 6,000 ha 8,000 ha 10,000 ha
11,528
ALR Land Use - Availability for farming
Residential, transportation, institutional& community
Not available for farming
10,518 ha or 91% of the ALR 532ha
0 ha 2,000 ha 4,000 ha 6,000 ha 8,000 ha 10,000 ha
11,528
ALR Land Cover - Availability for farming
Wetlands, waterbodies, natural bare areas
Built up (includes farm suppport)
Not available for farming
702ha9,395 ha or 82% of the ALR 420
ha
0 ha 2,000 ha 4,000 ha 6,000 ha 8,000 ha 10,000 ha
11,528
ALR - Farming status Land currently grazed & available forcultivation (9,395 ha)
Land not farmed or grazed & available forcultivation (702 ha)
Land currently farmed (420 ha)
grazed
Land available for cultivation (currently grazed, or not farmed or grazed) - 10,097 ha
87%
11%
2%
0%
Treed (> 10% Trees)
Grassland
Shrubland, herbaceous
Anthropogenic
Land cover type
75%
25%On Crown owned parcels
On private owned parcels
Parcel ownership
16%
82%
Class 573%
2% Class 3
Class 4
Class 5
Class 6
Agricultural capability class
Figure 7 demonstrates that 10,518 ha or 91%, of the ALR is currently available for farming once land uses and land covers incompatible with agriculture are taken into account.
Of the 10,518 ha available for cultivation, 9,395 ha are currently in grazed land cover, 420 ha is in farmed land cover, and 702 ha is not farmed or grazed.
Much of the land available for cultivation is currently in natural pasture or rangeland. Although this land could be brought into production under ideal conditions, much of this land is limited by soil or climate (indicated by agricultural capability class).
Lac La Hache Agricultural Land Use Inventory - Page 23

AGRICULTURAL CAPABILITY
Not all lands that are available for agriculture have the same capability or suitability for producing soil based agricultural products. The main factors limiting agricultural capacity in British Columbia are climate and topography. Soils are also a key limiting factor. The “Land Capability Classification for Agriculture in British Columbia”11 is used to determine agricultural capability. The classification describes seven land capability classes for agriculture (Class 1 through 7). Class 1 land is considered the best possible land for agricultural as it has minimal limitations and has the potential to support the widest range of crops. As the class number increases, the range of crops suited to the soil and climate conditions decreases. Class 7 lands have severe limitations and are considered to have no potential for soil bound agriculture. Agricultural capability classes are summarized in Appendix C. Associated with each capability class is a subclass that identifies limitations or special management practices that are needed to improve the land capability. Limitations include factors such as topography, stoniness, soil moisture deficiency and low fertility. Management practices can include improving drainage, irrigation, removing stones, and fertilization. Although Class 6 and 7 lands have limited capability for soil bound agriculture, they may be agriculturally productive where topography and climate allow. Class 6 & 7 lands can additionally be utilized for non-soil based agriculture such as greenhouse production. Agricultural capability in Lac La Hache is currently digitized at a scale of one to fifty-thousand. The agricultural land use inventory is digitized and surveyed at a scale of one to five thousand or less. This means that the agricultural capability data is more generalized than the ALUI data. Capability class can be used as a general indication of the soils and conditions in a particular area, but it does not definitively indicate the capability of a particular land parcel. Agricultural capability classes were generalized to the dominant class type, and the class with the highest capability on a land cover was assigned to the land cover polygon. Land cover type was then summarized according to agricultural capability class.
11 Ministry of Agriculture and Food, Ministry of Environment, Land Capability Classification For Agriculture in British Columbia (1983) http://www.alc.gov.bc.ca/alc/content.page?id=C553220B18A34F46B9CBBCD53E629DC4#
Lac La Hache Agricultural Land Use Inventory - Page 24

Table 9. Agricultural capability on actively farmed cultivated crops
In ALR (ha)Outside ALR (ha)
Total area (ha)
Class 3 X - cumulative conditions 2 13 152 13 15
Class 4 TP - topography &/or stoniness 38 4 4238 4 42
TP - topography &/or stoniness 337 27 364MT - soil moisture deficiency / topography < 1 6 6
338 33 370Class 6 X - cumulative conditions 2 - 2
2 - 2379 50 429
SUBTOTAL
SUBTOTAL
Class 5
SUBTOTAL
SUBTOTALTOTAL
Agricultural capability class & subclassArea in actively cultivated crops
Figure 8. Agricultural capability on actively farmed cultivated crops in the ALR
Class 3, 1%
Class 4, 10%Class 5, 89%
Class 6, <1%
Table 9 details the agricultural capability class and subclass on cultivated land in the Lac La Hache OCP area.
Of the 429 ha of actively farmed cultivated crops, (refer to Table 7), nearly all occur on Class 5 land (370 ha or 86%).
Cultivated crops were also identified on Class 3, Class 4 and Class 6 land, as well as on land with topography and stoniness limitations.
Figure 8 shows the proportion of each agricultural capability class on actively farmed cultivated crops in the ALR.
The majority of all cultivated land in the ALR (89%) occurs on Class 5 land.
Lac La Hache Agricultural Land Use Inventory - Page 25

Table 10. Agricultural capability on land available for cultivation
In ALR (ha)Outside ALR (ha)
Total area (ha)
Class 3 X - cumulative conditions 1,564 122 1,6861,564 122 1,686
P - stoniness 869 43 912T - topography 16 5 21TP - topography / stoniness 45 22 67
930 70 999M - soil moisture deficiency 11 34 45TP - topography &/or stoniness 7,354 786 8,140
7,364 820 8,185T - topography 190 2 192X - cumulative conditions 28 - 28
219 2 220Class 7 TR - topography / shallow soil 10 22 32
10 22 3210,087 1,036 11,123TOTAL
SUBTOTAL
SUBTOTAL
Class 5
SUBTOTAL
Class 6
SUBTOTAL
SUBTOTAL
Agricultural capability class & subclassLand available for cultivation
Class 4
Figure 9. Agricultural capability on land available for cultivation in the ALR
Class 3, 16%
Class 4, 9%
Class 5, 73%
Class 6, 2%
Table 10 details the agricultural capability class and subclass of land in Lac La Hache that is available for cultivation.
Of the 10,087 ha in the ALR that is available for cultivation (refer to Table 7), all has some type of agricultural capability limitation. In some areas, these limitations can be overcome with special management practices.
Figure 9 shows the proportion of land available for cultivation in the ALR by agricultural capability class.
The majority of all available ALR land is Class 5 (73%).
Lac La Hache Agricultural Land Use Inventory - Page 26

Table 11. ALR land available for cultivation by agricultural capability class on privately owned parcels
Class 3 Class 4 Class 5 Class 6
Natural pasture or rangeland 126 456 1,274 86 1,942Natural & Semi-natural - Vegetation 45 26 441 1 512Anthropogenic - Managed vegetation 2 3 9 - 15Anthropogenic - Non Built or Bare - 4 < 1 - 4
TOTAL 173 489 1,724 87 2,474
Available for cultivation -land cover type
Total ALR area (ha)
Agricultural capability class
Table 12. ALR land available for cultivation by agricultural capability class on Crown owned parcels
Class 3 Class 4 Class 5 Class 6 Class 7
Natural pasture or rangeland 1,351 437 5,524 130 10 7,453Natural & Semi-natural - Vegetation 40 2 112 1 - 155Anthropogenic - Non Built or Bare - 1 4 - - 5Anthropogenic - Managed vegetation - - < 1 - - < 1
TOTAL 1,391 441 5,640 132 10 7,613
Available for cultivation -land cover type
Total ALR area (ha)
Agricultural capability class
Table 11 shows that of the 2,474 ha of privately owned ALR land that is available for cultivation, 1,724 ha (70%) has an agricultural capability rating of Class 5.
Table 12 shows that of the 7,613 ha of Crown owned ALR land that is available for cultivation, 1,391 ha (18%) has an agricultural capability rating of Class 3, 441 ha (6%) is Class 4 and 5,640 ha (74%) is Class 5 land.
Lac La Hache Agricultural Land Use Inventory - Page 27

CHARACTERISTICS OF NOT FARMED BUT AVAILABLE LANDS
The potential for future agriculture expansion is affected by the size of the area available. Small areas can effectively be used for some intensive agricultural operations such as mushrooms, floriculture, greenhouses, poultry, and container nurseries. Small areas are also suitable for start-up farmers, horse enthusiasts, farmers testing new technologies, or established farmers wanting to expand through leases. Despite these opportunities, small areas provide fewer farming choices than large lots. They generally exclude dairy, hogs, and vegetable greenhouses. A dairy cow, for example, produces sufficient manure per year to fertilize 0.4 ha of forage production which means a dairy operation consisting of 50 cows would require access to 20 ha of land. Without sufficient land area to utilize the manure as a fertilizer, the dairy operation would have to find other, more expensive, methods to handle the manure produced on the farm. In addition, working farms require sufficient space to operate in order to avoid odour, dust, and noise conflicts with nearby non-farm land uses.
On Parcels “Used For Farming”
Parcels “Used for farming” do not always utilize 100% of their land area. Land not farmed but available and with potential for cultivation can offer opportunities to expand faming activities. Table 13. Land use and cover on parcels “Used for farming” with ALR land available for farming but not farmed
Residential 24 486 76 562 197 32 228 116 %Agriculture 17 430 20 449 153 4 157 102 %Utilities 1 42 < 1 42 19 - 19 10 %
42 958 95 1,053 369 36 405 228 %
Parcel Owenrship
TOTAL
PRIVATE
Mixed land use on "Used for farming" parcels
Number of parcels
Land not farmed but with available for farming
Land currently farmed % potential increase to total ALR
farmed areaIn ALR
(ha)Outside ALR (ha)
Total area (ha)
In ALR (ha)
Outside ALR (ha)
Total area (ha)
Figure 10. ALR land cover that is available for cultivation on “Used for
farming” parcels
877
81
<1
0 200 400 600 800 1000
Natural pastureor rangeland
Natural & Semi-natural vegetation
Anthropogenicmanaged vegetation
ALR area (ha)
Curr
ent
land
cov
er
In ALR - Private ownership (958 ha)
Figure 10 indicates that privately owned land currently in “Natural pasture or rangeland” could provide the greatest gains in cultivated land on parcels that are already “Used for farming”. These gains in cultivated land would have to be measured against the loss of natural pasture or rangeland.
Converting non-grazed “Natural & Semi-natural vegetation” to farming may be better supported by the ranchers in the area.
Table 13 demonstrates the potential to increase the amount of cultivated land on parcels that are already “Used for farming”. This increase would come from expanding farm operations toward a more complete utilization of the available parcel area. There are no Crown owned parcels that meet the “Used for farming” definition.
Lac La Hache Agricultural Land Use Inventory - Page 28

On Parcels “Not Used For Farming”
This section includes parcels that are “Used for grazing”. Table 14. Land use and cover on “Not used for farming” parcels with ALR land available for farming
Used for grazing - no other use 28 956 59 1,015 227 %Residential 9 199 7 207 47 %Utilities 1 15 5 20 4 %
38 1170 71 1242 278 %Residential 55 202 34 236 48 %No apparent use 15 100 13 113 24 %Forestry 1 24 - 24 6 %Transportation 2 16 16 32 4 %Recreation & leisure 1 3 2 5 <1 %Gravel extraction 1 - 14 14 -
75 345 79 424 82 %113 1,516 150 1,666 361 %
Used for grazing - no other use 95 6,271 719 6,990 1492 %Utilities 6 499 - 499 119 %Forestry 4 386 - 386 92 %Recreation & leisure 1 246 - 246 58 %Transportation 2 128 < 1 128 30 %Gravel extraction 2 44 71 115 10 %
110 7573 791 8364 1801 %No apparent use 9 29 <0.1 29 7 %Industrial 1 8 - 8 2 %Garbage dumps 1 3 - 3 <1 %
11 40 <0.1 40 9 %121 7,613 791 8,404 1811 %234 9,129 941 10,069 2171 %
TOTAL CROWN OWNED ALR
Used for grazing
Parcel Ownership
Used for grazing
Subtotal
PRIVATE
TOTAL
Parcel Land use
% potential increase to total ALR
farmed area
Number of parcels
Land not farmed but with potential for farming
In ALR (ha)Outside ALR (ha)
Total area (ha)
Not used for farming or
grazing
SubtotalTOTAL PRIVATLEY OWNED ALR
CROWNSubtotal
Not used for farming or
grazingSubtotal
Table 14 illustrates potential to increase the amount of cultivated land on parcels that are “Not used for farming”. This increase would come from prioritizing agriculture over other non-farm land uses and full utilization of the available parcel area for farming. It is assumed that existing non-farm land uses would be maintained.
The greatest potential to increase cultivated land could come from Crown owned parcels that are currently “Used only for grazing”. Privately owned parcels “Used only for grazing” also offer significant potential for increasing actively farmed land.
Lac La Hache Agricultural Land Use Inventory - Page 29

Figure 11. ALR land cover that is available for cultivation on “Not used for farming” parcels
1,065 7,453 8,518
597
15
9
0 2,000 4,000 6,000 8,000
Natural pastureor rangeland
Natural & Semi-natural vegetation
Anthropogenicmanaged vegetation
Anthropogenicnon built or bare
ALR area (ha)
Curr
ent
land
cov
er
In ALR - Private ownership (1,516 ha)
In ALR - Crown ownership (7,623 ha)
Figure 12. Vegetation type on natural pasture or rangeland in the ALR and
on parcels “Not used for farming”
523
503
7,182 7,705
671
100
43
0 2,000 4,000 6,000 8,000
Treed (> 10% Trees)
Grassland
Shrubland
Herbaceous
ALR area (ha)
Curr
ent
land
cov
er o
n na
utra
l pa
sutr
e &
rang
elan
d
In ALR - Private ownership
In ALR - Crown ownership
Figure 11 indicates that developing Crown and privately owned land currently used for natural pasture or rangeland would provide the greatest gains in cultivation on available parcels.
These gains in cultivation would have to be measured against the loss of natural pasture and rangeland.
Figure 12 details the land cover type on land in natural pasture & rangeland that is available for cultivation.
The majority of grazed land cover is “treed”. Dense tree cover offers less forage material for grazing cattle than open grassland areas.
Lac La Hache Agricultural Land Use Inventory - Page 30

Figure 13. Size of areas available for cultivation on privately owned “Not used for farming” parcels with ALR land
1
12
20
6
10
16
11
8
17
1 11 8 30 12 36 79
112 16
4
759
66
262
0
100
200
300
400
500
600
700
800
0
5
10
15
20
25
0.2
- 0.4
0.4
- 1
1 - 2
2 - 3
3 - 4
4 - 8
8 - 1
6
16 -
32
32 -
64
64 -
128
>= 1
28
Total area (ha)Num
ber
of a
reas
Area (ha)
Number of areas
Total area (ha)
Figure 13 illustrates the number of areas available for cultivation on privately owned parcels in Lac La Hache. The area of all adjacent available and cultivated land covers on a parcel are summed to arrive at the total area that could potentially be farmed. An area is available if it is free from built structures, cover limitation, incompatible land uses, cultivated crops, and is greater than 0.4 ha (1 acre). A single ‘area’ may be comprised of multiple land covers on the same parcel.
Of the 103 areas available for farming, 33 (39%) are less than 2 ha, 49 (48%) are less than 4 ha and 65 (63%) are less than 8 ha. Fewer options are available to efficiently farm small parcels. In general, areas should be at least 4 ha to provide the widest range of farming options.
There are 54 areas greater than 4 ha and available for cultivation in the Lac La Hache OCP region. These areas have a total of 1,442 ha, or 87% of the 1,666 ha available on privately owned parcels (refer to Table 14).
Lac La Hache Agricultural Land Use Inventory - Page 31

66.. FFaarrmmiinngg AAccttiivviittiieess CULTIVATED FIELD CROPS
Cultivated field crops are captured in a geographical information system (GIS) at the field or land cover polygon level by crop type (vegetables, forage or pasture, berries, etc.). Each crop type is then summarized to total land area and evaluated for field size characteristics. Included with cultivated field crops is fallow farmland, inactively farmed land (i.e. forage or pasture crops which have not been harvested or grazed this season) and land temporarily set aside for wildlife or other purposes. Also included is bare cultivated land or land under preparation for planting as it is assumed these lands will be planted during the survey season. Excluded are crops grown in crop cover structures such as greenhouses or mushroom barns. Cultivated field crops in Lac La Hache are described by one crop grouping:
• Forage & pasture: grass, mixed grass/legume, grass hydrophytic
Hydrophytic grass occurs on organic soils with a high water table and includes species such as Reed canary and Meadow foxtail. Fields of harvested hydrophytic grass are often referred to as riparian meadows. No crops were recorded on Indian reserves in Lac La Hache. Table 15. Main field crop types by area
In ALR (ha) % of ALR
Forage & pasture 379 3% 50 429 100% 53TOTAL 379 3% 50 429 100% 53
TypeALR
Outside ALR (ha)
Total area (ha)
% of cultivated
land
Number of parcels with
crop type
Table 15 shows that “forage & pasture” is the only crop type found in Lac La Hache.
Refer to Map 4 for more information.
Lac La Hache Agricultural Land Use Inventory - Page 32

Forage & pasture crops
Forage is a cultivated crop that is cut and made into silage or hay for livestock feed. Three levels of forage management are described:
• Forage (intensively managed): Management includes weed control & fertilizer / manure applications and crop is cut 4-8 times per year. Often there is no fencing and crop growth is vigorous, even and thick.
• Forage (managed): Management includes weed control & fertilizer / manure applications and crop is cut several times per year. Often there is no fencing and crop growth is generally healthy and even.
• Forage (unmanaged): Weed management & fertilizer / manure applications are minimal. Crop is cut only once per year. Crop growth is uneven with weeds.
Pasture is a cultivated crop that is used only for grazing and is not cut. Two levels of management are described:
• Pasture (managed): Management includes weed control & fertilizer / manure applications. Usually fields are large to accommodate equipment. Fencing is in good condition and crop growth is vigorous with few weeds.
• Pasture (unmanaged): Weed management & fertilizer / manure applications are minimal. Fencing is in good condition. Crop is varied (some weeds) and growth is uneven with signs of animal dung.
Some areas are used for both forage & pasture:
• Forage & pasture (managed): Crop is cut 1 to 3 times per year and made into silage or haylage. Also used for grazing for 1 to 3 months per season. Fencing is in good condition and crop growth is reasonably even with few weeds. Usually associated with dairy operations.
Areas previously used for forage or pasture are considered inactively farmed:
• Unused refers to forage or pasture which has not been cut or grazed during the current growing season. • Unmaintained refers to forage or pasture which has not been cut or grazed during the current growing season, has
not been maintained for several years, and probably would not warrant harvest. Table 16. Forage & pasture crops by area
In ALR (ha)
% of ALR
Forage (managed) Grass 19 < 1% 6 25 6%Forage (managed) Mixed grass / legume 169 1% 11 180 42%Forage (unmanaged) Grass 26 < 1% - 26 6%Forage (unmanaged) Mixed grass / legume 9 < 1% 1 10 2%Forage (unmanaged) Grass hydrophytic 7 < 1% - 7 2%
229 2% 18 247 58%Pasture (unmanaged) Grass 129 1% 29 157 37%Pasture (unmanaged) Mixed grass / legume 22 < 1% < 1 22 5%
150 1% 29 179 42%Forage & pasture (managed) Mixed grass / legume < 1 < 1% 3 3 < 1%
< 1 < 1% 3 3 < 1%379 3% 50 429 100%
% of cultivated
land
Total area (ha)
TOTAL
ALROutside ALR (ha)
Forage & pasture crops
Subtotal
Subtotal
Subtotal
Table 16 shows there are 247 ha in forage crops, 179 ha in pasture crops, and 3 ha in forage & pasture in Lac La Hache. Grass is the main pasture crop type, while mixed grass/ legume is the main forage crop type.
Refer to Map 4 for more information.
Lac La Hache Agricultural Land Use Inventory - Page 33

Figure 14. Forage & pasture fields by size12
0
2
4
6
8
10
12
14
16
18
< 1
1 -2
2 -4
4 -8
8 -1
6
16 -
32
32 -
64
64 -
128
>= 1
28
Num
ber o
f cro
p fie
lds
Field size (ha)
Forage & pasture
Figure 15. Forage & pasture fields by size and type
0
2
4
6
8
10
12
14
< 1
1 -2
2 -4
4 -8
8 -1
6
16 -
32
32 -
64
64 -
128
>= 1
28
Num
ber o
f cro
p fie
lds
Field size (ha)
Forage
Pasture
Forage & pasture
All Crop types
Table 17. All crop types by area
In ALR (ha) % of ALR
Forage (managed) 188 2% 17 204 48%Pasture (unmanaged) 150 1% 29 179 42%Forage (unmanaged) 41 < 1% 1 43 10%Forage & pasture (managed) < 1 < 1% 3 3 < 1%
TOTAL 379 3% 50 429 100%
% of cultivated
landCultivated field crop
Total area (ha)
ALROutside ALR (ha)
12 Each distinct forage or pasture activity on one parcel is counted as one activity. Each activity will include at least one and perhaps more fields. A parcel may have more than one activity if there is more than one distinct type of forage or pasture activity on that parcel.
Table 17 shows the 4 individual crops/management practices that account for all of the cultivated land in Lac La Hache
Figure 14 shows that “Forage & pasture” fields occur on a variety of field sizes. Sixty-two percent (62%) of all “Forage & pasture” fields are less than 4 hectares.
In total, there are 63 individual “Forage & pasture” fields with an average crop area of 7 hectares and a median crop area of 3 hectares.
These fields occur on 53 parcels with an average parcel size of 28 hectares and a median parcel size of 15 hectares.
Figure 15 illustrates that there are far more pasture than forage fields.
There are 41 pasture fields with an average crop area of 4 hectares, a median crop area of 3 hectares, and an average parcel size of 28 hectares.
In comparison, there are 21 forage fields with an average crop area of 12 hectares, a median crop area of 4 hectares, and an average parcel size of 44 hectares.
On average, forage fields have a larger cultivated area than pasture fields. This is generally to allow for efficient harvesting practices.
Lac La Hache Agricultural Land Use Inventory - Page 34

IRRIGATION
Irrigation is the artificial application of water to the land or soil and may be used to assist in the growing of agricultural crops, maintenance of managed vegetation, and control of soil erosion or dust. The potential to irrigate is often limited by the quality and quantity of available irrigation water. High salinity or microbial contamination renders water unsuitable for irrigation. Insufficient water sources or water delivery infrastructure limits the potential to increase agricultural production through irrigation. Irrigation is captured at the field or land cover level by system type (sub-surface, sprinkler, giant gun, trickle) and then summarized by crop type to the total land area under irrigation. Irrigated land includes all irrigated field crops and may also include irrigated fallow farmland, land set temporarily set aside for wildlife or other purposes, and land under preparation for planting. Also included are crops grown in greenhouses and crop barns. In addition, individual cultivated field crops are evaluated for percent of crop area under irrigation. Table 18. All crop types and irrigation
Sub-surface SprinklerCentre pivot
Forage (managed) 6 61 19 85 42%Pasture (unmanaged) 9 9 - 18 10%Forage (unmanaged) 5 2 - 7 16%Forage & pasture (managed) - - - - -
TOTAL 20 71 19 110
Cultivated field cropTotal area irrigated
(ha)
% crop area irrigated
Irrigation system in use (ha)
Figure 16. Irrigation systems by percentage of cultivated land
Sprinkler, 17%
Sub-surface, 5%
Centre pivot, 4%Not irrigated,
74%
Figure 16 shows that 26% of the cultivated land in Lac La Hache is irrigated. Sprinkler irrigation is the most widely used system found on 17% of cultivated land followed by sub surface systems on 5% of cultivated land, and centre pivot systems on 4%.
Table 18 outlines the types of irrigation systems used on the cultivated field crops in Lac La Hache.
A total of 110 ha were irrigated: 20 ha were irrigated using sub-surface systems, 71 ha using sprinkler systems, and 19 ha using centre pivot systems.
Refer to Map 1 for more information.
Lac La Hache Agricultural Land Use Inventory - Page 35

NATURAL PASTURE & RANGELAND
Natural pastures and rangelands are fenced areas with uncultivated (not sown) natural or semi-natural vegetation used for grazing domestic livestock such as cattle, sheep or equines. Natural pastures are smaller fenced areas usually occurring on private land while rangeland refers to larger blocks of land (extensive areas from hundreds to thousands of acres in size) with perimeter fencing that may encompass many parcels or district lots. Rangelands tend to be on provincial Crown land.
Natural pastures are usually on land not suited for cultivation due to poor soils (stoniness), seasonal flooding, or slope. In many cases, these areas are remote from the infrastructure necessary to facilitate agriculture improvements such as irrigation. Although some of these natural areas could be used for hay, most are grazed since the quality of hay is usually not worth the harvesting costs.
Most natural pastures and rangelands are influenced by humans to some degree. Fire may be used to control woody plants and remove over mature herbage. Introduction of livestock or equines has an effect on natural vegetation and can lead to changes in vegetation composition. Bush-clearing, fencing, drainage, application of fertilizers and trace elements are more intensive methods which influence natural vegetation as pasture. The introduction of grasses and legumes, without cultivation, is yet a further stage in influencing a natural area.
Natural pastures and rangelands were captured in a geographical information system at the field or land cover polygon level by the natural vegetation type that dominates the upper canopy (grassland, open treed, etc.). Each vegetation type is then summarized to total land area and evaluated for field size characteristics.
Table 19. Natural pasture and rangeland by parcel ownership
In ALR (ha)
% of ALR
Rangeland 7,196 62% 776 7,973 65% 77%Natural pasture 257 2% - 257 2% 2%
7,453 65% 776 8,229 67% 80%Natural pasture 1,498 13% 99 1,597 < 1% 15%Rangeland 444 4% 52 497 < 1% 5%
1,942 17% 152 2,094 < 1% 20%9,395 81% 928 10,323 67% 100%
% of rangeland & natural pasture
Parcel ownership
ALROutside ALR (ha)
Total area (ha)
% of suveyed
area
Subtotal
SubtotalTOTAL
Crown
Private
Table 19 shows that of the natural pasture and rangeland in the Lac La Hache inventory area, 80% or 8,229 hectares is on Crown owned parcels while 20% or 2,094 hectares is on privately owned parcels.
Natural pasture or rangeland occurring outside of legally surveyed parcels is not accounted for as part of the inventory.
Refer to Maps 3 & 4 for more information.
Lac La Hache Agricultural Land Use Inventory - Page 36

Table 20. Natural pasture and rangeland by vegetation types
In ALR (ha)
% of ALR
Treed - closed 6,654 58% 721 7,375 60% 71%Treed - open 379 3% 3 382 3% 4%Grassland 256 2% 49 305 2% 3%Treed - regenerating 240 2% 54 294 2% 3%Shrubland 82 < 1% 2 84 < 1% < 1%Herbaceous 30 < 1% < 1 30 < 1% < 1%
7,641 66% 829 8,470 69% 82%Grassland 785 7% 27 813 7% 8%Treed - closed 626 5% 9 634 5% 6%Treed - open 283 2% 62 345 3% 3%Shrubland 44 < 1% 2 45 < 1% < 1%Herbaceous 17 < 1% - 17 < 1% < 1%
1,755 15% 99 1,854 15% 18%9,395 81% 928 10,323 85% 100%
% of rangeland & natural pasture
Natural pasture and rangeland
ALROutside ALR (ha)
Total area (ha)
% of suveyed
area
Rangeland
Subtotal
Natural pasture
SubtotalTOTAL
Figure 17. Natural pasture and rangeland areas by size
2 4 3 1
128
52
28
16
0
10
20
30
40
50
60
< 1
1 -2
2 -4
4 -8
8 -1
6
16 -
32
32 -
64
64 -
128
>= 1
28
Num
ber o
f are
as
Area (ha)
Pasture (natural)
Rangeland (natural)
Figure 17 shows that the majority of parcels used for rangeland are greater than 32 hectares in size.
Rangeland was recorded on 126 parcels where the average parcel size is 67 hectares. It is important to note that rangelands typically utilize more than one parcel. Range activities occurring outside of legally surveyed parcels are beyond the scope of this report.
Table 20 details the type of natural pasture & rangeland vegetation.
“Treed – closed” is the most abundant land cover type on rangeland areas.
“Grass” is the most abundant land cover type utilized for natural pasture.
Vegetation type is important for natural pasture or rangeland as grassland offers a higher grazing yield than “treed – closed”.
Lac La Hache Agricultural Land Use Inventory - Page 37

LIVESTOCK
Livestock activities are very difficult to measure using windshield survey methodology. Livestock are often confined to structures making it difficult for the surveyor to see the animals. Local knowledge and other indicators such as animal confinement type (barn type), feeder system type, manure handling system type, and other visible elements may be used to infer the type of livestock and scale of activity that exist on a parcel. In addition, livestock are mobile and may utilize more than one land parcel. Livestock visible on a certain parcel one day may be visible on a different parcel the next day. This inventory does not attempt to identify animal movement between parcels that make up a farm unit but reports livestock at the parcel where the animals or related structures were observed. "Main Type" and "Secondary Type" of livestock are determined by comparing the scale of different livestock activities on a parcel. The “Main Type” of livestock does not represent the primary agricultural activity, but only the main type of livestock activity on a particular parcel. "Intensive" livestock activities utilize specialized structures such as barns, feedlots and stockyards designed for confined feeding at higher stocking densities. "Non Intensive" livestock activities allow animals to graze on a pasture and often utilize non intensive barns and corrals/paddocks. “Unknown livestock” refers to activities where non specialized livestock related structures were present but the livestock were not visible and therefore the specific type of livestock could not be determined. "Homesite" refers to the location of the main ranch or main barn of a livestock operation or farm unit13. Often, other types of farm infrastructure, such as corrals, paddocks, barns, and feeding/watering facilities, as well as the farm residence, are also at this location. This is the primary location of the farm unit where most livestock management occurs. "Non Homesite" refers to a location where livestock are present but related infrastructure is minimal. Often pasture fencing and watering are the only apparent infrastructure improvements. This location is often used only for pasturing livestock and is secondary to an operation’s primary (or homesite) location. The scale system used to describe livestock operations relies on animal unit equivalents which is a standard measure used to compare different livestock types. One animal unit equivalent is approximately equal to one adult cow or horse. The scale system includes 4 levels:
• “Very Small” Approximately 1 cow or horse or bison, 3 hogs, 5 goats or deer, 10 sheep, 50 turkeys, 100 chickens (1 animal unit equivalent)
• “Small” LESS THAN 25 cows or horses or bison, 75 hogs, 125 goats or deer, 250 sheep, 1250 turkeys, 2500 chickens (2 - 25 animal unit equivalents)
• “Medium” LESS THAN 100 cows or horses or bison, 300 hogs, 500 goats or deer, 1000 sheep, 5000 turkeys, 10,000 chickens (25 - 100 animal unit equivalents)
• “Large” MORE THAN 100 cows or horses or bison, 300 hogs, 500 goats or deer, 1000 sheep, 5000 turkeys, 10,000 chickens (over 100 animal unit equivalents).
13 Farm unit includes all the property belonging to a farm and may incorporate more than one parcel. Lac La Hache Agricultural Land Use Inventory - Page 38

Table 21. Livestock and equine activities
Maintype
Secondary type
IntensiveNon
IntensiveBeef Beef total 10 - 10 - 10
Chicken Chicken total 4 1 5 - 5Sheep / lamb Sheep / lamb total - 1 1 - 1
Horse 21 1 22 - 22
Miniature horse 1 - 1 - 1
Equine total 22 1 23 - 2336 3 39 - 39TOTAL
Livestock groupBy parcel
Total activities
By activity typeLivestock detail
Equine
Table 22. Equine activities
Main TypeSecondary
TypeIntensive
Non intensive
HomesiteNon
homesiteVery small scale (1 horse) 10 1 11 - 11 11 -Small scale (2-25 horses) 9 - 9 - 9 9 -Medium scale (2-25 horses) 3 - 3 - 3 1 2
TOTAL 22 1 23 - 23 21 2
By locationScale of equine activity
By parcel Total number of activities
By activity type
Table 23. Equine homesite infrastructure
Non intensive infrastructure 14Riding ring - covered 3Riding ring - uncovered 3Racetrack 1
TOTAL 21
Type of equine infrastructureNumber of
parcels
Table 21 shows equine is the most common type of livestock activity accounting for 23 of 39 or 59% of all livestock activities. Beef is the second most common livestock type with 10 activities or 26%.
All livestock activities are “non-intensive”.
Table 22 details the 23 equine activities recorded in Lac La Hache. Only 21 activities are located on animal “homesites” and most activities are “small” or “very small” scale.
There is one “medium” scale homesite (25 -100 equines) that is associated with the Patchwork/ EasyGo/ Equine Educational Lakeside Ranch. Two “non-homesite” equine activities associated with this operation were also recorded.
Table 23 details the largest or most intensive type of infrastructure recorded on parcels with equine “homesite” activities.
Most equine activities are very small or small scale (refer to Table 22) and have non intensive types of infrastructure.
Non intensive infrastructure includes fields & pasture fencing, corrals & paddocks, and barns and open shelters.
There are 3 equine activities that have a covered riding ring as the most prominent type of infrastructure. This type of intensive infrastructure generally indicates a commercial operation.
The 3 uncovered riding rings and 1 one racetrack all appear to be associated with non-commercial equine operations.
Lac La Hache Agricultural Land Use Inventory - Page 39

Table 24. Beef activities
Main typeSecondary
typeIntensive
Non Intensive
HomesiteNon
homesite
Cow / calf Small scale ( 2 -25 cattle ) 2 - 2 - 2 2 -Small scale ( 2 -25 cattle ) 2 - 2 - 2 2 -Medium scale ( 25 -100 cattle ) 2 - 2 - 2 2 -Large scale ( > 100 cattle ) 4 - 4 - 4 4 -
10 - 10 - 10 10 -
Unknown
TOTAL
Type of beef activity
By locationBy parcel
Scale of beef activityTotal
number of activities
By activity type
Figure 18. Livestock and equine activities by scale and type
4
2
45
1
11
9
3
0
2
4
6
8
10
12
Very small scale Small scale Medium scale Large scale
Num
ber
of a
ctiv
ities
Scale of activity
Beef Chicken
Sheep / lamb Equine
Figure 19. Livestock and equine activities by parcel size and type
0
1
2
3
4
5
6
7
8
< 1 1 - 2 2 - 4 4 - 8 8 - 16 16 - 32 32 - 64 64 - 128 >= 128
Num
ber
of a
ctiv
ities
Parcel size (ha)
Beef Chicken
Sheep / lamb Equine
Figure 18 illustrates the scale of equine and livestock activities.
Beef and equine are the only significant livestock activities in Lac La Hache. There are also 5 recorded poultry activities and 1 sheep/goat activity, all of which are “very small” scale.
Most equine activities are “small” or “very small” scale, with only 3 “medium” scale activities.
Beef is the only activity to occur on a “large” scale.
Table 24 details the 10 beef activities recorded in Lac La Hache. All activities occur on animal homesites, indicating there are 10 beef operations in the Lac La Hache OCP area.
Figure 19 compares the distribution of livestock and equine types across parcel size categories.
Equine activities occurs across all parcels sizes including parcels <1 hectare. All activities occurring on parcels less than 2 hectares are “very small” scale.
All beef activities occur on parcels greater than 8 hectares.
Lac La Hache Agricultural Land Use Inventory - Page 40

Figure 20. Livestock and equine activities by parcel size and scale
0123456789
10
< 1 1 - 2 2 - 4 4 - 8 8 - 16 16 - 32 32 - 64 64 - 128 >= 128
Num
ber
of a
ctiv
ities
Parcel size (ha)
Very small scale Small scale
Medium scale Large scale
Scale of activity
Figure 21. Livestock and equine activities by parcel size
1
2
4
7
2
4
1
2
1 1 1
3
2
3
5
0
1
2
3
4
5
6
7
8
< 1
1 - 2
2 - 4
4 - 8
8 - 1
6
16 -
32
32 -
64
64 -
128
>= 1
28
Num
ber
of a
ctiv
ities
Parcel size (ha)
Equine
Livestock
Figure 20 illustrates the distribution of equine and livestock activities by scale across parcel size categories.
All “medium” and “large” scale activities occur on parcels greater than 8 hectares. “Very small” scale activities occur on most parcels size categories less than 32 ha. Seven out of the ten “very small” scale activities that occur on parcels larger than 4 hectares are associated with equines.
“Small” scale livestock activities occur on all parcel size categories greater than 2 ha and less than 128 hectares.
Figure 21 compares the distribution of equine and livestock activities across parcel size categories.
Both equine and livestock activities occur on all parcel size categories less than 128 ha including on parcels < 1 ha.
The majority of all equine activities (61%) occur on parcels less than 8 ha, while the majority of other livestock activities (63%) occur on parcels greater than 8 hectares.
Lac La Hache Agricultural Land Use Inventory - Page 41

Figure 22. Average area in forage, pasture, farm infrastructure, and natural pasture or rangeland on parcels with livestock activities (excluding very small scale)
80
33
0102030405060708090
Beef Equine
Aver
age
are
a (h
a)
Main livestock type
Farm infrastructure
Natural pasture, rangeland
Forage, pasture
Figure 23. Total area in forage, pasture, farm infrastructure, and natural pasture
or range on parcels with livestock activities (excluding very small scale)
576
251
0
100
200
300
400
500
600
Beef Equine
Tota
l are
a (h
a)
Main livestock type
Farm infrastructure
Natural pasture,rangeland
Forage, pasture
Figure 24. Percent of parcel area utilized for forage, pasture, farm infrastructure, and
natural pasture or range on parcels with livestock activities (excluding very small scale)
0% 20% 40% 60% 80% 100%
Beef
Equine
Parcel area utilization
Forage, pasture Farm infrastructure Natural pasture, rangeland
Figure 22 shows that on average, a beef activity is associated with 80 hectares of forage, pasture, farm infrastructure, and natural pasture or rangeland.
An equine activity on average is associated with 33 hectares of forage pasture, farm infrastructure, and natural pasture or rangeland.
Figure 23 shows that beef activities use more than double the total area used by equine activities for forage, pasture and natural pasture or rangeland.
Figure 24 shows that on average, equine activities use 89% of their parcel area for forage, pasture, farm infrastructure, and natural pasture or range while beef activities on average, utilize 96% of their parcel area.
Lac La Hache Agricultural Land Use Inventory - Page 42

77.. CCoonnddiittiioonn ooff AALLRR LLaannddss This section presents a parcel based analysis of parcel size and residential uses in the ALR. Land ownership can impact the type of agricultural activities that occur on a parcel, therefore privately owned land is reported separately from Crown owned land. The agricultural activities likely to occur on Crown owned land are limited and may also be subject to specific restrictions. PARCEL INCLUSION IN THE ALR
The inventory area included 11,082 hectares of ALR on 281 parcels which is 96.2% of the ALR within Lac La Hache. The remaining 4% of the ALR was excluded from the inventory as it is outside of legally surveyed parcels. ALR boundaries do not always align with parcel boundaries which results in many parcels having only a portion of their area in the ALR. To achieve an accurate picture of the ALR land in Lac La Hache, only parcels that meet the following criteria are included in this section of the report:
• parcels > 0.05 hectares in size with at least half their area (>= 50%) in the ALR, or • parcels with at least 10 hectares (>= 10 hectares) of ALR land.
In total, 249 parcels, with 11,039 hectares or 95.7% of the ALR land meets the above criteria and is included in the further analysis of the ALR. This includes 3 parcels that have less than 50% of their area in the ALR but each has greater than 10 hectares of ALR land. These 3 parcels have a combined ALR area of 74 hectares. Of these 249 parcels, 137 parcels with 3,050 hectares of ALR land are privately owned and 112 parcels with 7,989 hectares are Crown owned. Figure 25. Parcel inclusion in the ALR
Figure 25 illustrates the distinction between parcels considered to be within or outside the ALR:
Considered to be within the ALR: • lot A is completely in the ALR • lot B has 50% or more of its area
in the ALR.
Considered to be outside the ALR: • lot C has less than 50% of its
area and less than 10 hectares in the ALR
• lot D is completely outside the ALR.
Lac La Hache Agricultural Land Use Inventory - Page 43

PARCEL SIZE & FARMING IN THE ALR
Parcel size must be considered when determining the agricultural potential of a land parcel. Larger parcels usually allow farmers greater flexibility to expand or change their type of operation as the economy and markets change. Although some types of agriculture can be successful on small parcels, (e.g. intensive market gardens, greenhouse operations, nurseries), generally the smaller the parcel is, the fewer viable options there are for farming. A farming operation may utilize more than one parcel as a farm unit14, however it is generally more efficient to run a farm on fewer larger parcels than many smaller parcels. Larger parcels accommodate equipment more efficiently and reduce the need to move farm equipment on public roads. Smaller parcels are more impacted by bylaws designed to reduce potential land use conflicts, such as setbacks from lot lines and road allowances, and may encourage alternative land uses such as residential.
Privately Owned
Figure 26. Number of parcels in the ALR by parcel size – privately owned
1718
16
23
10
14
21
17
1
0
5
10
15
20
25
30
< 1
1 -2
2 -4
4 -8
8 -1
6
16 -
32
32 -
64
64 -
128
>= 1
28Tota
l num
ber
of p
arce
ls
Parcel size (ha)
Number of privately owned parcels in the ALR
Figure 27. Total area in the ALR by parcel size – privately
owned
8 29 43111 118
267
1,006
1,210
258
0
200
400
600
800
1,000
1,200
1,400
< 1
1 - 2
2 - 4
4 - 8
8 - 1
6
16 -
32
32 -
64
64 -
128
>= 1
28Tota
l are
a (h
a)
Parcel size (ha)
Area of privately owned parcels in the ALR (ha)
14Farm Unit – An area of land used for a farm operation consisting of one or more contiguous or non-contiguous parcels, that may be owned, rented or leased, which form and are managed as a single farm.
In Lac La Hache, nearly all of the privately owned ALR areas are in larger parcels.
Figure 27 illustrates that of the 3,050 hectares on privately owned parcels in the ALR:
• <1% (8 hectares) is on parcels less than 1 hectare. • 3% (80 hectares) is on parcels less than 4 hectares. • 4% (111 hectares) is on parcels between 4 and 8 hectares. • 4% (118 hectares) is on parcels between 8 and 16 hectares. • 90% (2,741 hectares) is on parcels greater than 16 hectares.
The average privately owned ALR parcel size in Lac La Hache is 23.3 hectares and the median parcel size is 5.5 hectares.
Figure 26 illustrates that of the 137 privately owned parcels in the ALR:
• 12% (17 parcels) are less than 1 hectare. • 37% (51 parcels) are less than 4 hectares. • 17% (23 parcels) are between 4 and 8 hectares. • 7% (10 parcels) are between 8 and 16 hectares. • 39% (53 parcels) are greater than 16 hectares.
Refer to Map 5 for more information.
Lac La Hache Agricultural Land Use Inventory - Page 44

Table 25. Number of farmed and not farmed parcels in the ALR – privately owned
Used for farming 39 28 %Used for grazing 36 26 %Not used for farming or grazing 62 45 %
TOTAL 137 100 %
Parcel status with respect to farmingNumber
of parcels
% of parcels in the ALR
Figure 28. Number of farmed and not farmed parcels in the ALR by parcel size –
privately owned
12
3
5 5
3
10 10
2
54
1
89
6
1
0
2
4
6
8
10
12
14
16
18
< 1
1 -2
2 -4
4 -8
8 -1
6
16 -
32
32 -
64
64 -
128
>= 1
28
Num
ber o
f par
cels
in th
e AL
R
Parcel Size (ha)
Used for farming
Used for grazing
Not used for farming or grazing
Figure 29. Number of farmed and not farmed parcels in the ALR by parcel size
(line chart) – privately owned
0
2
4
6
8
10
12
14
16
18
< 1
1 -2
2 -4
4 -8
8 -1
6
16 -
32
32 -
64
64 -
128
>= 1
28
Num
ber o
f par
cels
Parcel size (ha)
Used for farming
Used for grazing
Not used for farming or grazing
Figure 28 compares the distribution of “Used for farming” parcels with other parcels in the ALR.
The proportion of parcels that are “Used for farming” generally increases with parcel size.
“Used for grazing” parcels occur across all parcel size categories greater than 1 hectare.
Table 25 demonstrates that of the 137 privately owned parcels in the ALR, only 39 parcels or 28% are “Used for farming”.
Figure 29 illustrates that although parcels of all sizes are “Used for farming”, small parcels have a much greater likelihood of not being “Used for farming”
Lac La Hache Agricultural Land Use Inventory - Page 45

Figure 30. Proportion of parcels farmed and not farmed by parcel size in the ALR – privately owned
0% 20% 40% 60% 80% 100%
< 1
1 - 2
2 - 4
4 - 8
8 - 16
16 - 32
32 - 64
64 - 128
>= 128
Parcels in the ALR
Parc
el si
ze (h
a)
Used for farming Used for grazing Not used for farming or grazing
Figure 31. Proportion of land cover by parcel size in the ALR – privately owned
0% 10% 20% 30% 40% 50% 60% 70% 80% 90% 100%
< 1
1 - 2
2 - 4
4 - 8
8 - 16
16 - 32
32 - 64
64 - 128
>= 128
% land cover
Parc
el si
ze (h
a)
Farmed Natural pasture or rangelandAnthropogenic (not farmed) Natural or semi-natural
Figure 30 shows that the proportion of parcels “Used for farming” generally increases as the parcel size increases. The proportion of parcels “Used for grazing” also increases with increased parcel size.
Only 6% of parcels less than 1 hectare are “Used for farming”.
There is 1 privately owned parcel of 262 hectares that is associated with natural pasture/rangeland.
There are 53 privately owned parcels larger than 16 hectares of which, 47 or 89% are “Used for farming” or “Used for grazing”.
Figure 31 illustrates the proportion of land cover types in the ALR by parcel size on privately owned parcels.
The proportion of natural pasture or rangeland generally increases as the parcel size increases.
The largest proportions of “anthropogenic” (not farmed) land cover occur on parcels less than 1 hectares.
Lac La Hache Agricultural Land Use Inventory - Page 46

Crown Owned
Figure 32. Number of parcels in the ALR by parcel size – Crown owned
42 3
76
33
37
20
0
5
10
15
20
25
30
35
40<
1
1 - 2
2 - 4
4 - 8
8 - 1
6
16 -
32
32 -
64
64 -
128
>= 1
28Tota
l num
ber
of p
arce
ls
Parcel size (ha)
Number of Crown ownedparcels in the ALR
Figure 33. Total area in the ALR by parcel size – Crown
owned
<1 6 18 78 150
1,664
2,608
3,464
0
500
1,000
1,500
2,000
2,500
3,000
3,500
4,000
< 1
1 - 2
2 - 4
4 - 8
8 - 1
6
16 -
32
32 -
64
64 -
128
>= 1
28
Tota
l ALR
are
a (h
a)
Parcel size (ha)
Area of Crown owned parcels in the ALR (ha)
Table 26. Number of farmed and not farmed
parcels in the ALR – Crown owned
Used for farming - -Used for grazing 103 92 %Not used for farming or grazing 9 8 %
TOTAL 112 100 %
Parcel status with respect to farmingNumber
of parcels
% of parcels in the ALR
In Lac La Hache nearly all of the Crown owned ALR area is in larger parcels.
Figure 33 illustrates that of the 7,989 hectares on Crown owned parcels in the ALR:
• <1% (<1 hectares) is on parcels less than 1 hectare. • <1% (6 hectares) is on parcels less than 4 hectares. • <1% (18 hectares) is on parcels between 4 and 8 hectares. • 1% (78 hectares) is on parcels between 8 and 16 hectares. • 99% (7,886 hectares) is on parcels greater than 16 hectares.
Table 26 demonstrates that of the 112 Crown owned parcels in the ALR, 103 or 91% are “Used for grazing”.
The average Crown owned ALR parcel size in Lac La Hache is 73.6 hectares and the median parcel size is 64.3 hectares.
Figure 32 shows that of the 112 Crown owned parcels in the ALR:
• 3.5% (4 parcels) are less than 1 hectare. • 5% (6 parcels) are less than 4 hectares. • 3% (3 parcels) are between 4 and 8 hectares. • 6% (7 parcels) are between 8 and 16 hectares. • 86% (96 parcels) are greater than 16 hectares.
Refer to Map 5 for more information.
Lac La Hache Agricultural Land Use Inventory - Page 47

RESIDENTIAL USE IN THE ALR
The ALR is a provincial zone in which agriculture is the priority use and some “Residential” use is considered a necessary accessory to the agricultural use of a property. However “Residential” use which is not an accessory to agriculture can effectively limit the ability of agriculture to grow, intensify and respond to market demands. When the primary motivation for ownership of ALR land is residential use, the residence is often placed to maximize privacy and views, with little consideration for agricultural opportunities on the parcel. Houses that are not adjacent to the frontage road alienate portions of land from future agriculture. If the occupants are non-farmers, they are more likely to be affected by noise, odour, or dust from neighbouring farm operations. The size of the residence may be another factor to consider. Properties with larger residences have higher property values making it more difficult for a farmer to acquire and convert this land to farmland in the future. In the following analysis cabins/cottages, mobile homes, single-family houses, duplexes, townhouses, apartments, motels, dormitories, and institutional living buildings are included. Single-family houses are further described by estimated size of the building:
• Small single-family house < 1,500 sq. ft. • Medium single-family house 1,500 – 3,500 sq. ft. • Large single-family house 3,500 – 5,000 sq. ft. • Estate (very large) single-family house > 5,000 sq. ft.
Residential footprint includes the main residence plus its associated yard, driveway, parking and any auxiliary buildings or structures. When two residences are on a property, areas associated to both (such as shared driveways, parking or yard), are assigned to the closest residence. Properties “Available for farming” are properties not currently “Used for farming” with either no apparent use or an existing non-farm use that is compatible with agriculture, such as Residential. Properties “Unavailable for farming” are properties not currently “Used for farming” that have an established non-farm use that is incompatible with agriculture. There is one Crown owned parcel associated with Canim Lake 4 Indian reserve that is within the ALR and has 2 small residences. This parcel is not included in further analysis of residential use in the ALR.
Average land improvement values of Lac La Hache properties with residences in the ALR were as follows: • large single family house $1,116,500 • medium single family house $ 209,640 • small single family house $106,612 • single mobile home $55,166
(Calculated using 2012 BC Assessment database - Last improvement value)
Lac La Hache Agricultural Land Use Inventory - Page 48

Privately owned parcels
Table 27. Farming and residences in the ALR – privately owned
Used for farming 23 17% 16 12% 39Used for grazing 9 7% 27 20% 36Not used for farming/grazing but available 36 26% 15 11% 51Not used for farming/grazing and unavailable 7 5% 4 3% 11
TOTAL 75 55% 62 45% 137
Parcel statusWith residence Without residence Total
number of parcelsNumber
of parcels% of
parcels Number
of parcels% of
parcels
Figure 34. Total area in residential footprint by parcel size
10,747
11,737
24,506
18,137
12,347
10,472
19,858
10,801
0
0 5,000 10,000 15,000 20,000 25,000
< 1
1 - 2
2 - 4
4 - 8
8 - 16
16 - 32
32 - 64
64 - 128
>= 128
Total residential footprint (m²)
Parc
el s
ize
(ha)
Figure 34 illustrates that there are nearly 12 hectares (118,606 m²) of ALR land in residential footprints distributed across all parcel sizes less than 128 hectares.
Table 27 shows that 75 parcels or 55% of ALR parcels have residences.
Of the ALR parcels with residences, 43 or 57% are “Not used for farming or grazing”.
Lac La Hache Agricultural Land Use Inventory - Page 49

Figure 35. Proportion of parcels with residences by parcel size
65% 67%
44%
65%
60%
50%
43%47%
0%0%
10%
20%
30%
40%
50%
60%
70%
< 1
1 -2
2 -4
4 -8
8 -1
6
16 -
32
32 -
64
64 -
128
>= 1
28
% o
f par
cels
with
resi
denc
e
Parcel size (ha) Figure 36. Average percent of parcel area in residential footprint by parcel size
17%
6%
15%
2%
2%
<1%
<1%
<1%
0% 5% 10% 15% 20%
< 1
1 - 2
2 - 4
4 - 8
8 - 16
16 - 32
32 - 64
64 - 128
>= 128
% Parcel area
Parc
el si
ze (h
a)
Average percent of parcel area in residential footprint
Figure 35 shows that there is a high proportion of parcels with residences across most parcel sizes in the ALR.
There are no parcels >=128 hectares with a residence.
Figure 36 demonstrates that residential footprints on smaller parcels use a greater proportion of the parcel area than those on larger parcels.
Lac La Hache Agricultural Land Use Inventory - Page 50

AAppppeennddiixx AA –– MMaappss See the Cariboo Regional District, Lac La Hache, 2014 ALUI Maps http://www2.gov.bc.ca/gov/topic.page?id=EE5F36F0026F43BEB740F05ED13CD3C6 Map 1. Land cover & farmed area Map 2. Land use & farmed area Map 3. Availability of land for farming Map 4. Farming activities - Cultivated crops, livestock, irrigation, grazed land Map 5. ALR parcel size Maps are 22 x 34 inches (ANSI D).
Lac La Hache Agricultural Land Use Inventory - Page 51

AAppppeennddiixx BB –– RRiippaarriiaann AArreeaass Lakes and riparian areas are important aquatic resources in the Cariboo Regional District (CRD). In 2004 CRD developed a Shoreland Management Policy15 to help ensure that shoreland development would not threaten the health and water quality of the regions abundant lakes and watercourses. The policy requires, in part, that lake sensitivity to trophic changes be considered as part of rezoning and development applications. The policy allows for riparian covenants and requires a 15 meter vegetated buffer between most land developments and waterbodies. This riparian buffer can help to protect water quality and fish and wildlife habitat from additional nutrients and degradation. The buffer area is to remain in a primarily undisturbed state. Riparian management areas, riparian management zones, and riparian reserve zones are terms defined by the BC Forest and Range Practices Act16. A riparian management zone, by definition, is established to conserve fish, wildlife or biodiversity, and to protect the riparian reserve zone. The BC Forest and Range Practices Act details the required width of the riparian management zones for lakes, streams, and wetlands based on the attributes of each water feature and its adjacent terrestrial ecosystem. Lakes, streams, and wetlands in riparian management areas each have several classifications which are detailed in the BC Forest & Range Practices Act – Forest Practices & Planning Regulation excerpt on page 56. A riparian buffer was created using the required setbacks for riparian reserve zones16 and the CRD’s 15 meter vegetated buffer requirement. See Table B1 for details. Land cover within the riparian buffer was then summarized by riparian class and land cover category. Table B1. Buffer distance by riparian class type
Riparian ClassBuffer distance
(m)
Lake 1 (L1) 15Stream Class 1 (S1) 50Stream Class 2 (S2) 30Stream Class 3 (S3) 20Swamp Class 1( W1) 15Swamp Class 5 (W5) 15
15 Cariboo Regional District, Shoreland Management Policy, http://www.cariboord.bc.ca/services/planning/shoreland-management-policy/shoreland-management-policy-2
16 Ministry of Forests, Lands, and Natural Resource Operations, Forest & Range Practices Act, http://www.bclaws.ca/Recon/document/ID/freeside/14_2004
Table B1 lists the buffer distance applied to each riparian class to create the riparian buffer zone.
Lac La Hache Agricultural Land Use Inventory - Page 52

Table B2. Land cover in riparian areas by riparian class type
Farmed (ha)
Anthropogenic (not farmed)
(ha)
Natural & Semi-natural
(ha)Lake Lake 1 (L1) 1 1 237 240
1 1 237 240Stream Class 1 (S1) 13 2 32 48Stream Class 2 (S2) - - 6 6Stream Class 3 (S3) 4 <1 84 89
18 2 122 142Swamp Class 1 (W1) <1 <1 156 158Swamp Class 5 (W5) 2 <1 185 187
3 1 341 34522 5 700 727
Total area (ha)
SUBTOTAL
Land Cover Category
Riparian Class
TOTAL
Stream
SUBTOTAL
Wetlands
SUBTOTAL
Table B3. Land cover in riparian areas
Cultivated field crops 19 3%Farm infrastructure 3 < 1%
22 3%Managed vegetation <1 < 1%Non Built or Bare 2 < 1%Residential footprint <1 < 1%Transportation 1 < 1%Built up - Other <1 < 1%
5 < 1%Natural pasture or rangeland 225 31%Vegetated 55 8%Wetlands 280 39%Natural bare areas 1 < 1%Waterbodies 139 19%
700 96%727 100%
* See "Land Cover" in the definitions section for terms used in this table.
Land cover*Total area
(ha)% inventoried riparian area
TOTAL
Actively farmed
FARMED SUBTOTAL
Anthropogenic(not farmed)
SUBTOTAL
Natural &Semi-natural
SUBTOTAL
Lac La Hache Agricultural Land Use Inventory - Page 53

Riparian Areas Information and Definitions BC Forest & Range Practices Act – Forest Practices & Planning Regulation Excerpt http://www.bclaws.ca/Recon/document/ID/freeside/14_2004
"riparian class" means the riparian class of a stream, wetland or lake as determined under Division 3 [Riparian areas] of Part 4 [Practice requirements];
"riparian management area" means an area described under Division 3 [Riparian areas] of Part 4 [Practice requirements], that consists of a riparian management zone and a riparian reserve zone;
"riparian management zone" means an area described under Division 3 [Riparian areas] of Part 4 [Practice requirements], that
(a) is a portion of the riparian management area, and
(b) is established to
(i) conserve the fish, wildlife habitat, biodiversity and the water values of the riparian management zone, and
(ii) protect the riparian reserve zone, if any, within the riparian management area;
"riparian reserve zone" means an area described under Division 3 [Riparian areas] of Part 4 [Practice requirements], that
(a) is a portion of a riparian management area, and (b) is established to protect fish, wildlife habitat, biodiversity and the water values of the riparian reserve zone;
Division 3 — Riparian Areas
Stream riparian classes
47 (1) In this section, "active flood plain" means the level area with alluvial soils, adjacent to streams, that is flooded by stream water on a periodic basis and is at the same elevation as areas showing evidence of
(a) flood channels free of terrestrial vegetation,
(b) rafted debris or fluvial sediments, recently deposited on the surface of the forest floor or suspended on trees or vegetation, or
(c) recent scarring of trees by material moved by flood waters.
(2) A stream that is a fish stream or is located in a community watershed has the following riparian class:
Lac La Hache Agricultural Land Use Inventory - Page 54

(a) S1A, if the stream averages, over a one km length, either a stream width or an active flood plain width of 100 m or greater;
(b) S1B, if the stream width is greater than 20 m but the stream does not have a riparian class of S1A;
(c) S2, if the stream width is not less than 5 m but not more than 20 m;
(d) S3, if the stream width is not less than 1.5 m but is less than 5 m;
(e) S4, if the stream width is less than 1.5 m.
(3) A stream that is not a fish stream and is located outside of a community watershed has the following riparian class:
(a) S5, if the stream width is greater than 3 m;
(b) S6, if the stream width is 3 m or less.
(4) Subject to subsections (5) and (6), for each riparian class of stream, the minimum riparian management area width, riparian reserve zone width and riparian management zone width, on each side of the stream, are as follows:
Riparian
Class
Riparian
Management Area
(metres)
Riparian
Reserve Zone
(metres)
Riparian
Management Zone
(metres)
S1-A 100 0 100
S1-B 70 50 20
S2 50 30 20
S3 40 20 20
S4 30 0 30
S5 30 0 30
Lac La Hache Agricultural Land Use Inventory - Page 55

S6 20 0 20
(5) If the width of the active flood plain of a stream exceeds the specified width for the riparian management zone, the width of the riparian management zone extends to the outer edge of the active flood plain.
(6) The minister may specify a riparian reserve zone for a stream with a riparian class of S1-A if the minister considers that a riparian reserve zone is required.
(7) The riparian reserve zone for a stream begins at the edge of the stream channel bank and extends to the width described in subsection (4) or (6).
(8) The riparian management zone for a stream begins at
(a) the outer edge of the riparian reserve zone, or
(b) if there is no riparian reserve zone, the edge of the stream channel bank,
and extends to the width described in subsection (4) or (5).
[am. B.C. Reg. 580/2004, s. 36.]
Wetland riparian classes
48 (1) Wetlands have the following riparian classes:
(a) W1, if the wetland is greater than 5 ha in size;
(b) W2, if the wetland is not less than 1 ha and not more than 5 ha in size and is in one of the following biogeoclimatic zones or subzones:
(i) Ponderosa Pine;
(ii) Bunch Grass;
(iii) Interior Douglas-fir, very dry hot, very dry warm or very dry mild;
(iv) Coastal Douglas-fir;
(v) Coastal Western Hemlock, very dry maritime, dry maritime or dry submaritime;
(c) W3, if the wetland is not less than 1 ha and not more than 5 ha in size and is in a biogeoclimatic zone or subzone other than one referred to in paragraph (b);
(d) W4, if the wetland is
(i) not less than 0.25 ha and less than 1 ha in size and is in a biogeoclimatic zone or subzone referred to in paragraph (b) (i), (ii) or (iii), or
Lac La Hache Agricultural Land Use Inventory - Page 56

(ii) not less than 0.5 ha and less than 1 ha in size and is in a biogeoclimatic zone or subzone referred to in paragraph (b) (iv) or (v).
(2) Despite subsection (1), an area is to be treated as a single wetland with a riparian class of W5 if
(a) the area contains
(i) two or more W1 wetlands located within 100 m of each other,
(ii) a W1 wetland and one or more non-W1 wetlands, all of which are within 80 m of each other, or
(iii) two or more non-W1 wetlands located within 60 m of each other, and
(b) the combined size of the wetlands, excluding the upland areas, is 5 ha or larger.
(3) Subject to subsections (4) and (5), for each riparian class of wetland, the minimum riparian management area width, riparian reserve zone width and riparian management zone width for the wetland are as follows:
Riparian
Class
Riparian
Management Area
(metres)
Riparian
Reserve Zone
(metres)
Riparian
Management Zone
(metres)
W1 50 10 40
W2 30 10 20
W3 30 0 30
W4 30 0 30
W5 50 10 40
(4) No riparian reserve zone or riparian management zone extends onto any enclosed upland areas in a W1 wetland if the wetland is
Lac La Hache Agricultural Land Use Inventory - Page 57

(a) located in a boreal, subboreal or hyper-maritime climate, and
(b) greater than 1 000 ha in size.
(5) If the minister considers it necessary for a riparian reserve zone or riparian management zone to extend onto an enclosed upland area, the minister may require either or both of the following:
(a) a riparian reserve zone of a width of 10 m or less;
(b) a riparian management zone of a width of 40 m or less.
(6) The riparian reserve zone for a wetland begins at the edge of the wetland and extends to the width described in subsection (3) or (5).
(7) The riparian management zone for a wetland begins at
(a) the outer edge of the riparian reserve zone, or
(b) if there is no riparian reserve zone, the edge of the wetland,
and extends to the width described in subsection (3) or (5).
[am. B.C. Regs. 580/2004, s. 37; 62/2005, s. 7.]
Lake riparian classes
49 (1) Lakes have the following riparian classes:
(a) L1-A, if the lake is 1 000 ha or greater in size;
(b) L1-B, if
(i) the lake is greater than 5 ha but less than 1 000 ha in size, or
(ii) the minister designates the lake as L1-B;
(c) L2, if the lake is not less than 1 ha and not more than 5 ha in size and is located in a biogeoclimatic zones or subzone that is
(i) Ponderosa Pine,
(ii) Bunch Grass,
(iii) Interior Douglas-fir, very dry hot, very dry warm or very dry mild,
(iv) Coastal Douglas-fir, or
(v) Coastal Western Hemlock, very dry maritime, dry maritime or dry submaritime;
(d) L3, if the lake is not less than 1 ha and not more than 5 ha in size and is in a biogeoclimatic zone or subzone other than one referred to in paragraph (c);
Lac La Hache Agricultural Land Use Inventory - Page 58

(e) L4, if the lake is
(i) not less than 0.25 ha and not more than 1 ha in size and is in a biogeoclimatic zone or subzone referred to in paragraph (c) (i), (ii) or (iii), or
(ii) not less than 0.5 ha and not more than 1 ha in size and is in a biogeoclimatic zone or subzone referred to in paragraph (c) (iv) or (v).
(2) Subject to subsection (3), for each riparian class of lake, the minimum riparian management area width, riparian reserve zone width and riparian management zone width are as follows:
Riparian
Class
Riparian
Management Area
(metres)
Riparian
Reserve Zone
(metres)
Riparian
Management Zone
(metres)
L1-A 0 0 0
L1-B 10 10 0
L2 30 10 20
L3 30 0 30
L4 30 0 30
(3) If the minister considers it necessary, the minister may specify a riparian management area and a riparian reserve zone for a lake with a riparian class of L1-A.
(4) The riparian reserve zone for a lake begins at the edge of the lake and extends to the width described in subsection (2) or (3).
(5) The riparian management zone for a lake begins at
(a) the outer edge of the riparian reserve zone, or
(b) if there is no riparian reserve zone, the edge of the lake, and extends to the width described in subsection (2) or (3).
Lac La Hache Agricultural Land Use Inventory - Page 59

AAppppeennddiixx CC –– AAggrriiccuullttuurraall CCaappaabbiilliittyy
Agricultural capability classes are summarized from the “Land Capability Classification for Agriculture in British Columbia”17. Information on agricultural capability is also available from the Agricultural Land Commission18. Agricultural Capability Classes Class 1 Class 1 land is capable of producing the very widest range of crops. Soil and climate conditions are optimum, resulting in easy management.
Class 2 Class 2 land is capable of producing a wide range of crops. Minor restrictions of soil or climate may reduce capability but pose no major difficulties in management.
Class 3 Class 3 land is capable of producing a fairly wide range of crops under good management practices. Soil and/or climate limitations are somewhat restrictive.
Class 4 Class 4 land is capable of a restricted range of crops. Soil and climate conditions require special management considerations.
Class 5 Class 5 land is capable of production of cultivated perennial forage crops and specially adapted crops. Soil and/or climate conditions severely limit capability.
Class 6 Class 6 land is important in its natural state as grazing land. These lands cannot be cultivated due to soil and/or climate limitations.
Class 7 Class 7 land has no capability for soil bound agriculture. NOTE: if class contains value X , it is an urban area with no agricultural capability. If class contains value O# (where # = a number value) - it is an organic soil classification Agricultural Capability Subclasses A & M Soil moisture deficiency N Salinity
C Adverse climate (excluding precipitation)
P Stoniness
D Undesirable soil structure R Shallow soil over bedrock and/or bedrock outcroppings
E Erosion T Topography
F Low fertility W Excess water (groundwater)
I Inundation (flooding by streams, etc.)
S & X Cumulative and minor adverse conditions
17Ministry of Agriculture and Food, Ministry of Environment, Land Capability Classification For Agriculture in British Columbia (1983) http://www.alc.gov.bc.ca/alc/content.page?id=CE6EED0FBDBE4701AE0B3A0BF72CBC05
18 Agricultural Land Commission, Agricultural Capability Classification in BC http://www.alc.gov.bc.ca/alc/content.page?id=CE6EED0FBDBE4701AE0B3A0BF72CBC05
Lac La Hache Agricultural Land Use Inventory - Page 60

AAppppeennddiixx DD –– IInnddiiaann rreesseerrvveess
Land cover on Canim Lake 4 Indian reserve
Table D1 Land cover and farmed area on Canim Lake 4 Indian reserve
In ALR (ha) % of ALR
Residential footprint <1 < 1% - <1Built up - Other <1 < 1% - <1
<1 1% - <1Vegetated 10 < 1% <1 10Waterbodies <1 < 1% <1 <1
10 < 1% <1 1110 1% <1 11
Land cover*
ALROutside ALR (ha)
Total area (ha)
TOTAL
Natural &Semi-natural
Anthropogenic(not farmed)
SUBTOTAL
SUBTOTAL
Canim Lake 4 Indian reserve was included in the inventory as 94% of its area is within the ALR.
Table D1 details the 11 hectares of inventoried land. No “Farmed” land cover or “natural pasture or rangeland” was recorded.
Lac La Hache Agricultural Land Use Inventory - Page 61

AAppppeennddiixx EE –– GGlloossssaarryy
Actively farmed – Land cover considered Farmed but excludes unused / unmaintained field crops, and unmaintained greenhouses. Does not include natural pasture or rangeland.
Agricultural Land Reserve (ALR) – A provincial zone in which agriculture is recognized as the priority use. Farming is encouraged and non-agricultural uses are controlled.
Animal Unit Equivalent – A standard measurement used to compare different livestock types. One animal unit equivalent is approximately equal to one adult cow or horse.
Anthropogenic – The term anthropogenic describes an effect or object resulting from human activity. In this report, the term anthropogenic refers to land cover originating and maintained by human actions but excludes farmed land cover; cultivated field crops, farm infrastructure, and crop cover structures.
Anthropogenic – Built up - Other – Lands covered by various unused or unmaintained built objects (structures) and associated yards that are not directly used for farming.
Anthropogenic – Managed vegetation – Lands seeded or planted for landscaping, dust or soil control but not cultivated for harvest or pasture. Includes parklands, golf courses, landscaping, lawns, vegetated enclosures, remediation areas.
Anthropogenic – Non Built or Bare – Human created bare areas such as extraction or disposal sites. Includes piles, pits, fill dumps, dirt parking or storage areas.
Anthropogenic – Residential – Lands covered by built objects (structures) and their associated auxiliary buildings, yards, roads, and parking. Includes single family dwellings, multifamily dwellings, and mobile homes.
Anthropogenic – Residential footprint – Includes the main residence plus its associated yard, driveway, parking and any auxiliary buildings or structures. When two residences are on a property, areas associated to both (such as shared driveways, parking or yard), are assigned to the closest residence.
Anthropogenic – Settlement – Lands covered by built objects (structures) and their associated yards, roads, and parking. Includes institutional, commercial, industrial, sports / recreation, military, non linear utility areas and storage / parking.
Anthropogenic – Transportation – Lands covered by built objects (structures). Includes roads, railways, airports and associated buffers and yards.
Anthropogenic – Utilities – Lands covered by built objects (structures). Includes linear features such as pipelines or transmission lines.
Anthropogenic Waterbodies – Areas covered by water, snow or ice due to human construction. Includes reservoirs, canals, ditches, and artificial lakes - with or without non cultivated vegetation.
Available for farming – Parcels that can be used for agricultural purposes without displacing a current use. Includes all parcels that do not meet the “Unavailable for farming” criteria.
BC Assessment – The Crown corporation which produces annual, uniform property assessments that are used to calculate local and provincial taxation. The database purchased from BC Assessment
Lac La Hache Agricultural Land Use Inventory - Page 62

contains information about property ownership, land use, and farm classification, which is useful for land use surveys.
Cadastre – The GIS layer containing parcel boundaries, i.e. legal lot lines.
Crop cover structures – Land covered with built objects including permanent enclosed glass or poly structures (greenhouses) with or without climate control facilities for growing plants and vegetation under controlled environments, and barns used for growing crops such as mushrooms. Excludes non- permanent structures such as hoop or tunnel covers.
Crown ownership – Crown ownership includes parcels which are owned by provincial or federal governments. Parcel ownership is determined by the Integrated Cadastre Fabric maintained by the Parcel Fabric Section of the BC Government.
Cultivated field crops - Land under cultivation for harvest or pasture. Includes crop land, fallow farmland, unused forage or pasture, un-housed container crops and crops under temporary covers. Excludes natural pasture, rangeland, greenhouses, mushroom barns and other crop houses.
Farm classification for tax assessment – Applies to parcels producing the minimum dollar amount to be classified as a farm by BC Assessment. Local governments apply a tax rate to farmland which is usually lower than for other land. To receive and maintain the farm classification, the land must generate annual income from agricultural production.
Farm infrastructure – Land covered by farm related built objects (structures) and their associated yards, roads, parking. Includes barns, storage structures, paddocks, corrals, riding rings, farm equipment storage, and specialized farm buildings such as hatcheries. Excludes greenhouses, mushroom barns and other crop houses.
Farm Unit – An area of land used for a farm operation consisting of one or more contiguous or non-contiguous parcels, that may be owned, rented or leased, which form and are managed as a single farm.
Farmed – Land cover directly contributing to agricultural production (both actively farmed and inactively farmed) and intentionally planted or built. Includes land in Cultivated field crops, Farm infrastructure and Crop cover structures (see individual definitions). Does not include natural pasture or rangeland.
Grazed – Land in natural pasture or rangeland that is used for grazing domestic livestock. These areas are considered separate from Farmed land cover.
Homesite (livestock) – The homesite is the primary location of a farm unit or livestock operation where most livestock management occurs. It is the location of the main ranch or main barn of a farm unit.
Inactively farmed – Land cover considered “Farmed” but is currently inactive. Includes unused / unmaintained forage and pasture, unmaintained field crops, and unmaintained greenhouses or crop barns. Does not include natural pasture or rangeland.
Intensive livestock – Intensive livestock have specialized structures such as barns, feedlots, or stockyards designed for confined feeding at high stocking densities.
Land use – Institutional & community – Parcels with churches, cemeteries, hospitals, medical centers, education facilities, correctional facilities, or government and First Nation administration.
Lac La Hache Agricultural Land Use Inventory - Page 63
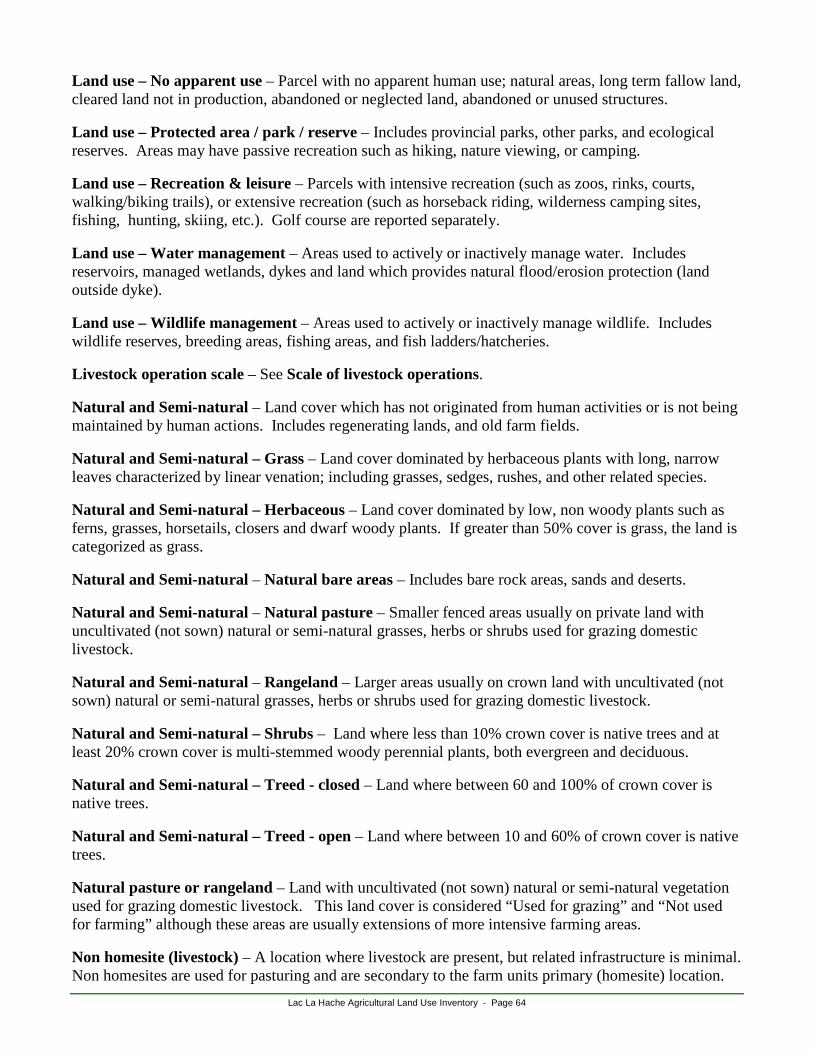
Land use – No apparent use – Parcel with no apparent human use; natural areas, long term fallow land, cleared land not in production, abandoned or neglected land, abandoned or unused structures.
Land use – Protected area / park / reserve – Includes provincial parks, other parks, and ecological reserves. Areas may have passive recreation such as hiking, nature viewing, or camping.
Land use – Recreation & leisure – Parcels with intensive recreation (such as zoos, rinks, courts, walking/biking trails), or extensive recreation (such as horseback riding, wilderness camping sites, fishing, hunting, skiing, etc.). Golf course are reported separately.
Land use – Water management – Areas used to actively or inactively manage water. Includes reservoirs, managed wetlands, dykes and land which provides natural flood/erosion protection (land outside dyke).
Land use – Wildlife management – Areas used to actively or inactively manage wildlife. Includes wildlife reserves, breeding areas, fishing areas, and fish ladders/hatcheries.
Livestock operation scale – See Scale of livestock operations.
Natural and Semi-natural – Land cover which has not originated from human activities or is not being maintained by human actions. Includes regenerating lands, and old farm fields.
Natural and Semi-natural – Grass – Land cover dominated by herbaceous plants with long, narrow leaves characterized by linear venation; including grasses, sedges, rushes, and other related species.
Natural and Semi-natural – Herbaceous – Land cover dominated by low, non woody plants such as ferns, grasses, horsetails, closers and dwarf woody plants. If greater than 50% cover is grass, the land is categorized as grass.
Natural and Semi-natural – Natural bare areas – Includes bare rock areas, sands and deserts.
Natural and Semi-natural – Natural pasture – Smaller fenced areas usually on private land with uncultivated (not sown) natural or semi-natural grasses, herbs or shrubs used for grazing domestic livestock.
Natural and Semi-natural – Rangeland – Larger areas usually on crown land with uncultivated (not sown) natural or semi-natural grasses, herbs or shrubs used for grazing domestic livestock.
Natural and Semi-natural – Shrubs – Land where less than 10% crown cover is native trees and at least 20% crown cover is multi-stemmed woody perennial plants, both evergreen and deciduous.
Natural and Semi-natural – Treed - closed – Land where between 60 and 100% of crown cover is native trees.
Natural and Semi-natural – Treed - open – Land where between 10 and 60% of crown cover is native trees.
Natural pasture or rangeland – Land with uncultivated (not sown) natural or semi-natural vegetation used for grazing domestic livestock. This land cover is considered “Used for grazing” and “Not used for farming” although these areas are usually extensions of more intensive farming areas.
Non homesite (livestock) – A location where livestock are present, but related infrastructure is minimal. Non homesites are used for pasturing and are secondary to the farm units primary (homesite) location.
Lac La Hache Agricultural Land Use Inventory - Page 64

Non intensive livestock – Non intensive livestock have the ability to graze on pasture and often utilize non intensive barns and corrals/paddocks.
Not used for farming – Parcels that do not meet the “Used for farming” criteria.
Not used for farming but available – Parcels that do not meet the “Used for farming” criteria but can be used for agricultural purposes without displacing a current use.
Scale of livestock operations – The scale system used in this report to describe livestock operations includes 4 levels:
• “Very Small Approximately 1 cow or horse or bison, 3 hogs, 5 goats or deer, 10 sheep, 50 turkeys, 100 chickens (1 animal unit equivalent)
• “Small” LESS THAN 25 cows or horses or bison, 75 hogs, 125 goats or deer, 250 sheep, 1250 turkeys, 2500 chickens (2 - 25 animal unit equivalents)
• “Medium” LESS THAN 100 cows or horses or bison, 300 hogs, 500 goats or deer, 1000 sheep, 5,000 turkeys, 10,000 chickens (25 - 100 animal unit equivalents)
• “Large” MORE THAN 100 cows or horses or bison, 300 hogs, 500 goats or deer, 1000 sheep, 5,000 turkeys, 10,000 chickens (over 100 animal unit equivalents)
Potential for farming – Land without significant topographical, physical or operational constraints to farming such as steep terrain, land under water, or built structures. For example, land with little slope, sufficient soils and exhibiting a natural treed land cover would be considered as having potential for farming. Areas less than 1 acre in size are considered to have limited potential for farming.
Unavailable for farming – “Not used for farming” parcels where future agricultural development is improbable because of a conflicting land use or land cover that utilizes the majority of the parcel area. For example, most residential parcels are considered unavailable for farming if the parcel size is less than 0.4 hectares (approximately 1 acre) since most of the parcel is covered by built structures, pavement and landscaping.
Unmaintained field crops – Land under cultivation for field crops which has not been maintained for several years and probably would not warrant harvest.
Unmaintained forage or pasture – Land under cultivation for forage or pasture which has not been cut or grazed during the current growing season and has not been maintained for several years.
Unused forage or pasture – Land under cultivation for forage or pasture which has not been cut or grazed during the current growing season.
Used for farming – See final page of glossary.
Used for grazing – Parcels “Not used for farming” with a significant portion of their area in natural pasture or rangeland and evidence of active grazing domestic livestock.
Lac La Hache Agricultural Land Use Inventory - Page 65

Used for farming – Parcels where the majority of the parcel area is farmed OR parcels which exhibit significant intensity of farming are considered “Used for farming”. Specifically, parcels that meet at least one of the following criteria:
• medium or large scale livestock, apiculture or aquaculture operations, • at least 40% parcel area in cultivated field crops (excluding unused forage or pasture), • at least 40% parcel area built up with farm infrastructure, • at least 50% parcel area in cultivated field crops (excluding unused forage or pasture) or farm infrastructure, • at least 25% parcel area built up with crop cover structures (excluding unmaintained structures), • at least 25% parcel area in cultivated field crops (excluding unused forage or pasture) or farm infrastructure and at
least one small scale livestock, apiculture or aquaculture operations, • at least 30% parcel area in cultivated field crops (excluding unused forage or pasture) or farm infrastructure and any
livestock, apiculture or aquaculture operations, • at least 23% parcel area in cultivated field crops (excluding unused forage or pasture) and at least 45% parcel area in
cultivated field crops (excluding unused forage or pasture) or farm infrastructure, • at least 10% parcel area in crop cover structures (excluding unmaintained structures) and at least 30% parcel area in
cultivated field crops (excluding unused forage or pasture) or farm infrastructure, • at least 15% parcel area and at least 15 ha in cultivated field crops (excluding unused forage or pasture), • at least 20% parcel area and at least 10 ha in cultivated field crops (excluding unused forage or pasture), • at least 25% parcel area and at least 5 ha in cultivated field crops (excluding unused forage or pasture), • at least 10% parcel area and at least 2 ha built up with crop cover structures (excluding unmaintained structures), • at least 20% parcel area and at least 1 ha built up with crop cover structures (excluding unmaintained structures), • at least 50% parcel area in cultivated field crops (excluding unused forage or pasture) or farm infrastructure or
natural pasture and any livestock, apiculture or aquaculture operations, • at least 25% parcel area or 5 ha in cultivated field crops (excluding unused forage or pasture) or farm infrastructure
and farm classification, • at least 10% parcel area in cultivated field crops (excluding unused forage or pasture) or farm infrastructure and at
least 40% parcel area in cultivated field crops (excluding unused forage or pasture) or farm infrastructure or natural pasture and farm classification,
• at least 50% parcel area in cultivated field crops (excluding unused forage or pasture) or farm infrastructure or natural pasture and farm classification,
• at least 20% parcel area in cultivated field crops (excluding unused forage or pasture) or farm infrastructure or natural pasture and at least one small scale livestock, apiculture or aquaculture operations and farm classification.
Lac La Hache Agricultural Land Use Inventory - Page 66


![Quique Hache Detective[1]](https://img.dokumen.tips/doc/110x75/5572001749795991699ec67d/quique-hache-detective1-55ab4f05ed531.jpg)


