Embed Size (px)
Citation preview
CHAPTER V
LABOUR WELFARE FACILITIES AND JOB SATISFACTION IN
INDIAN PHARMACEUTICAL COMPANIES AND MULTINATIONAL
PHARMACEUTICAL COMPANIES IN GOA:
A COMPARATIVE ANALYSIS
5.1 INTRODUCTION
5.2 COMPARISON OF LABOUR WELFARE FACILITIES PROVIDED
IN INDIAN PHARMACEUTICAL COMPANIES AND
MULTINATIONAL PHARMACEUTICAL COMPANIES IN GOA
5.3 COMPARISON OF JOB SATISFACTION EXPERIENCED IN
INDIAN PHARMACEUTICAL COMPANIES AND
MULTINATIONAL PHARMACEUTICAL COMPANIES IN GOA
5.4 PERCENTAGE OF EMPLOYEES IN PHARMACEUTICAL
COMPANIES IN GOA EXPERIENCING HIGH, MODERATE AND
LOW LEVELS OF JOB SATISFACTION
5.5 RELATIONSHIP BETWEEN LABOUR WELFARE FACILITIES
PROVIDED AND JOB SATISFACTION EXPERIENCED IN
PHARMACEUTICAL COMPANIES IN GOA
5.6 CONCLUSIONS

CHAPTER V
LABOUR WELFARE FACILITIES AND JOB SATISFACTION IN
INDIAN PHARMACEUTICAL COMPANIES AND
MULTINATIONAL PHARMACEUTICAL COMPANIES IN GOA:
A COMPARATIVE ANALYSIS
5.1 INTRODUCTION
Labour welfare is an important facet of industrial relations, the extra dimension, giving
satisfaction to the worker in a way that even a good wage cannot. With the growth of
industrialization, mechanization and globalization, it has acquired added importance. The
aim of welfare activities is both 'humanitarian' - to enable workers to enjoy a fuller and
richer life, and 'economic' - to improve the efficiency of the workers. Labour welfare
facilities are a useful adjunct to motivational approach and helps in maintaining positive
attitudes towards the job and the organization, once such attitudes have been fostered.
Job satisfaction is the general attitude towards one's job and the degree of pleasure
derived from it. Job satisfaction, which is an attitude one has towards one's job, is
governed to a large extent by perception and expectations of the employees. It is the end
result of the degree to which job needs are perceived as being fulfilled by the job.
Labour welfare aims at job satisfaction. Providing labour welfare facilities to the work
force in industries could satisfy many of their needs. The provision of labour welfare
facilities can facilitate job satisfaction, which in turn can help to curb absenteeism, labour
turnover, attrition and foster peaceful industrial relations with high labour efficiency,
productivity and profits to the enterprise. Satisfaction on the job carries over to the
employee's off-the-job hours. Thus labour welfare and job satisfaction are important in
203

terms of both monetary gains and social responsibility. Industries therefore need to
provide labour welfare facilities that will not only improve the economic and social
conditions of employees but also increase their job satisfaction.
The pharmaceutical industry is the sunrise industry in Goa. It is a multibillion-dollar
industry. In Goa it is a fast growing industry with increasing number of domestic and
multinational companies established in the State. The incentives, policies and investment
environment created by the Government of Goa has played a major role in luring
investments from pharmaceutical companies, both Indian and multinational, to the State.
The pharmaceuticals industry has emerged as a major component in the development of
the State and has an impressive track record. The industry today is backed with high
technical manpower. Since the pharmaceutical industry is emerging as a big player in the
industrial set up in Goa, the researcher found it apt to select this sector for the present
study. The researcher has made an attempt in this chapter, to study and compare the
labour welfare facilities provided and the job satisfaction experienced by employees
(managers and workers) in Indian and multinational pharmaceutical companies in Goa.
The present chapter seeks to draw a comparison between:
➢ The labour welfare facilities provided in Indian pharmaceutical companies and
multinational pharmaceutical companies in Goa.
➢ The job satisfaction experienced in Indian pharmaceutical companies and
multinational pharmaceutical companies in Goa.
➢ The labour welfare facilities provided and the job satisfaction experienced by
managers and workers in Indian pharmaceutical companies and multinational
pharmaceutical companies in Goa.
204

➢ Determine the relationship between labour welfare and job satisfaction in
pharmaceutical companies in Goa.
5.2 COMPARISON OF LABOUR WELFARE FACILITIES PROVIDED IN
INDAIN PHARMACEUTICAL AND MULTINATIONAL
PHARMACEUTICAL COMPANIES IN GOA
In this section of the chapter a comparative study is made of the labour welfare facilities
offered in Indian and multinational pharmaceutical companies in Goa. The total sample
(N=201) comprising of managers and workers in Indian and multinational pharmaceutical
companies in Goa were administered the Labour Welfare Inventory by S.K. Srivastava
(2002). The research attempted to compare the labour welfare facilities provided to the
respondents in Indian pharmaceutical companies (IPCs) and multinational pharmaceutical
companies (MPCs) in Goa.
Studies conducted earlier emphasize that labour welfare has its own prominence in
industrial research. Quite a few researchers have shown an interest in studying the nature
and types of labour welfare facilities provided in different industries (Moorthy and
Narayan, 1970; Rao et.al ., 1991; Gani, 1993; Rahman et.al ., 1995; Chelliah, 1998; Kumar
and Yadav, 2002; Srivastava, 2004; Thomas and Priyadarsini, 2004; Srimannarayana and
Srinivas, 2005). However these studies on labour welfare are restricted to Indian
industries and no attempt has been made to compare the labour welfare facilities provided
by Indian and multinational pharmaceutical companies.
205
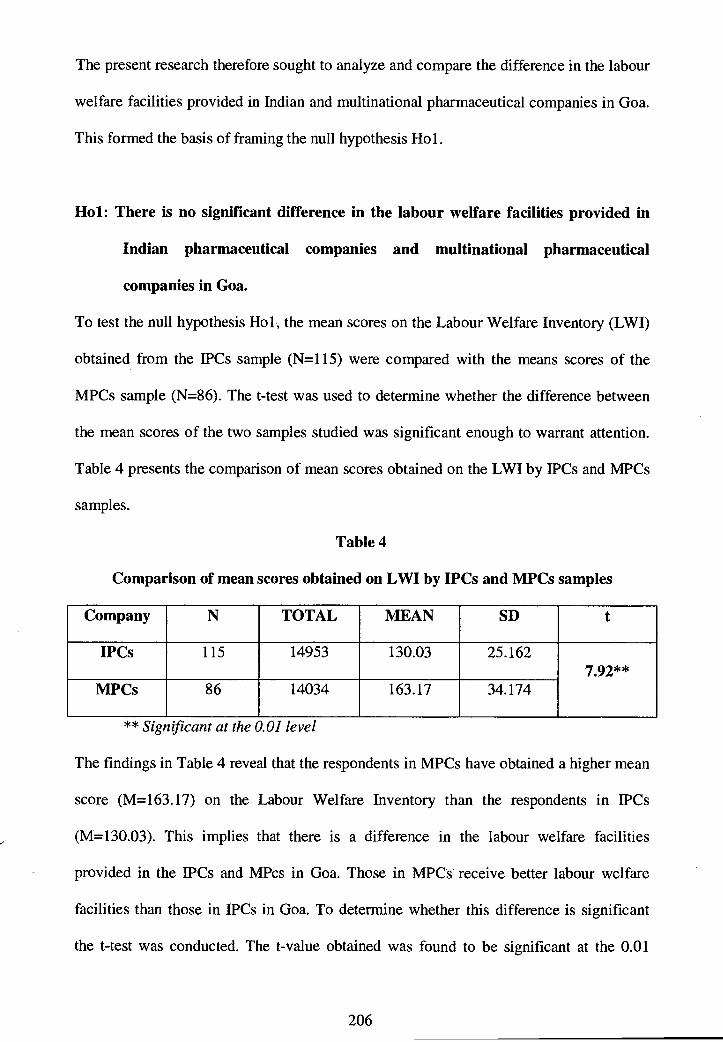
The present research therefore sought to analyze and compare the difference in the labour
welfare facilities provided in Indian and multinational pharmaceutical companies in Goa.
This formed the basis of framing the null hypothesis Hol.
Hol: There is no significant difference in the labour welfare facilities provided in
Indian pharmaceutical companies and multinational pharmaceutical
companies in Goa.
To test the null hypothesis Hol, the mean scores on the Labour Welfare Inventory (LWI)
obtained from the IPCs sample (N=115) were compared with the means scores of the
MPCs sample (N=86). The t-test was used to determine whether the difference between
the mean scores of the two samples studied was significant enough to warrant attention.
Table 4 presents the comparison of mean scores obtained on the LWI by IPCs and MPCs
samples.
Table 4
Comparison of mean scores obtained on LWI by IPCs and MPCs samples
Company N TOTAL MEAN SD t
IPCs 115 14953 130.03 25.162 7.92**
MPCs 86 14034 163.17 34.174
** Significant at the 0.01 level
The findings in Table 4 reveal that the respondents in MPCs have obtained a higher mean
score (M=163.17) on the Labour Welfare Inventory than the respondents in IPCs
(M=130.03). This implies that there is a difference in the labour welfare facilities
provided in the IPCs and MPcs in Goa. Those in MPCs receive better labour welfare
facilities than those in IPCs in Goa. To determine whether this difference is significant
the t-test was conducted. The t-value obtained was found to be significant at the 0.01
206
level (t = 7.92, P<0.01). This implies that the labour welfare facilities provided by the
MPCs are significantly different from those provided by the IPCs in Goa. The
respondents in MPCs perceive the labour welfare facilities offered to them as
significantly better than their fellow mates in IPCs. One possible reason could be that the
MPCs due to their better financial standing compared to IPCs are able to offer superior
labour welfare facilities to their employees, which in turn keeps the employees happy.
The IPCs on the other hand, due to their financial constraints may find it difficult to make
provisions for better welfare facilities. Moreover in the era of cut-throat competition and
in the effort to retain labour, the MPCs may have realized the importance of labour
welfare facilities, and provide these to a greater extent than IPCs in Goa. Consequently
labour welfare facilities provided by MPCs to their employees are superior than those
provided to their counterparts in IPCs. It can therefore be stated that the labour welfare
facilities provided by MPCs is significantly different from those provided by IPCs. Hence
the null hypothesis Hol that states there is no significant difference in the labour welfare
facilities provided in Indian pharmaceutical companies and multinational pharmaceutical
companies in Goa is not accepted.
Studies have reported differences in labour welfare facilities provided in public and
private sectors in India (Moorthy and Narayan, 1970; Kumar and Yadav, 2002; and
Srivastava, 2004).
Difference between IPCs and MPCs on the eight dimensions of the LWI
- Since the study found a significant difference in the labour welfare facilities provided by
IPCs and MPCs Goa, it only seemed logical to further analyze and compare the difference
between the IPCs and MPCs on the eight dimensions of the LWI and test the level of
207
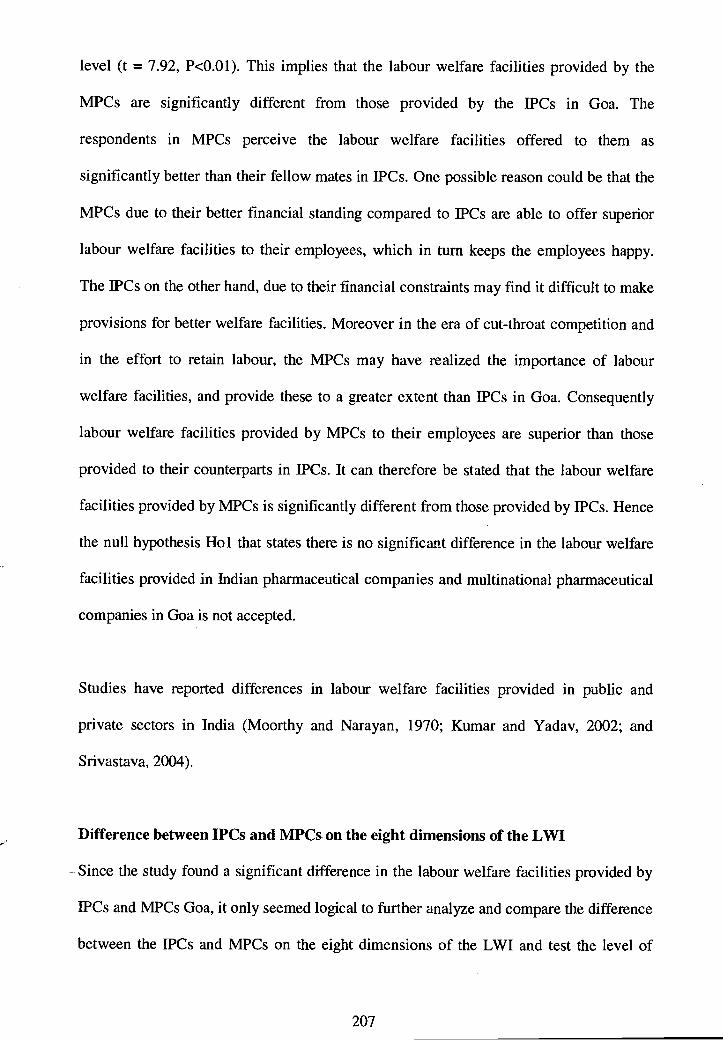
significance between them. Table 5 presents a comparison of the dimension wise mean
scores on LWI for IPCs and MPCs. It also shows the t-values obtained on each dimension
of the LWI that indicates the level of significance.
Table 5
Comparison of IPCs and MPCs dimension-wise mean scores on LWI
COMPANY ED/TR REC MED SUB LNS CAN HSG SAF OTHERS
IPCs
(N=115)
Mean 13.95 11.44 17.19 9.77 9.19 9.57 23.05 35.85
SD 4.63 5.09 3.34 4.33 3.28 3.72 3.41 6.73
t value 6.58** 5.28** 5.92** 6.48** 9.22** 5.98** 4.70** 5.34**
MPCs
(N=86)
Mean 18.64 15.91 20.12 14.02 14.05 13.93 25.37 41.14
SD 5.46 6.88 3.61 4.92 4.18 6.52 3.52 7.20
** Signif cant at the 0.01 level
A glance at Table 5 shows that the respondents in MPCs have obtained higher mean
scores on the eight dimensions of the LWI compared to those in IPCs. This implies that
these dimensions of labour welfare offered by the MPCs are realized as better than those
offered in IPCs. The t-test was carried out to examine whether the difference between
MPCs and IPCs on each dimension of the LWI is statistically significant. It was found
that on all eight dimensions of the LWI, there was a significant difference at the 0.01
level. This indicates that employees in MPCs perceive superior labour welfare facilities
and enjoy better welfare than their counter parts in IPCs.
208
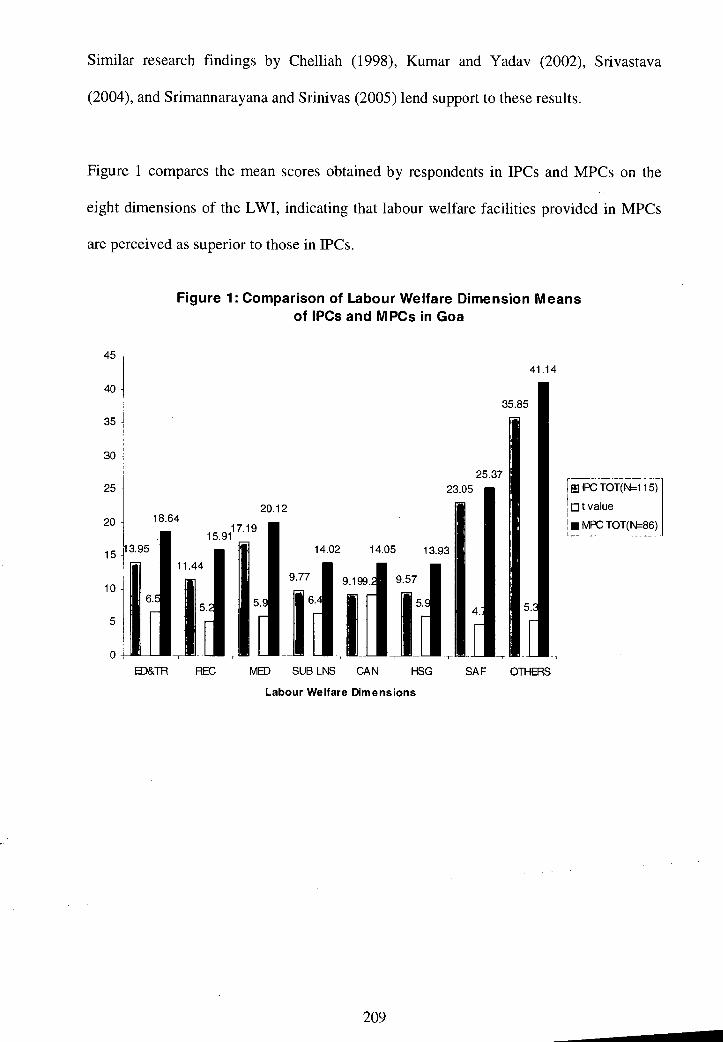
Similar research findings by Chelliah (1998), Kumar and Yadav (2002), Srivastava
(2004), and Srimannarayana and Srinivas (2005) lend support to these results.
Figure 1 compares the mean scores obtained by respondents in IPCs and MPCs on the
eight dimensions of the LWI, indicating that labour welfare facilities provided in MPCs
are perceived as superior to those in IPCs.
Figure 1: Comparison of Labour Welfare Dimension Means of IPCs and MPCs in Goa
45 41.14
40 -
35 -
30
25 -
20.12 20 -
15.9117.19
10 I 9.77
I
9.199. 9.57
6.
0
1 5.
IPC TOT(N=115) t' ❑ t value
■ MPC TOT(186) 18.64
15 -13'95 4.0 3.9 14.02 15 13
1 11.44
ED&TR REC MED SUB LNS CAN HSG
Labour Welfare Dimensions
SA F OTHERS
209
5.2.1 Difference in Labour Welfare Facilities Provided to Managers and Workers in
Indian Pharmaceutical Companies and Multinational Pharmaceutical Companies in
Goa
Having determined that there is a significant difference in the labour welfare facilities
provided to employees in IPCs and MPCs in Goa, and that on all dimensions of LWI a
significant difference exists, the researcher was further interested to analyze and compare
the differences in the labour welfare facilities provided to the sample sub groups -
managers and workers - in IPCs and MPCs in Goa.
Difference in the labour welfare facilities provided to managers in IPCs and MPCs
in Goa
Table 6 compares the mean scores obtained by managers in IPCs (N=36) and managers in
MPCs (N=46) on the LWI and presents the t-value.
Table 6
Comparison of mean scores obtained LWI by
Managers on in IPCs and MPCs
Managers N TOTAL MEAN SD t value
IPCs 36 5090 141.39 23.46 3.01**
MPCs 46 7782 169.17 40.3211
**Significant at the 0.01 level
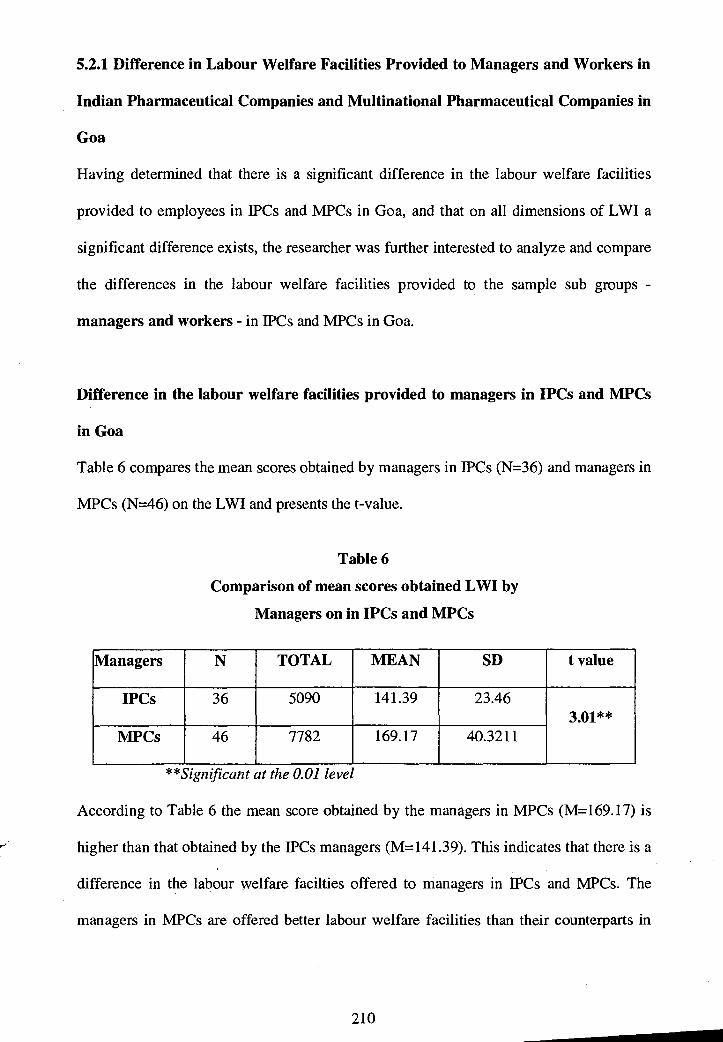
According to Table 6 the mean score obtained by the managers in MPCs (M=169.17) is
higher than that obtained by the IPCs managers (M=141.39). This indicates that there is a
difference in the labour welfare facilties offered to managers in IPCs and MPCs. The
managers in MPCs are offered better labour welfare facilities than their counterparts in
210
200 -
150 -
100
50
0
141.39
IPCs Managers MPCs Managers
3.01
t value
169.17
IPCs. Moreover, this difference is found to be statistically significant at the 0.01 level
(t=3.01, P<0.01).
This is depicted in Figure 2, which graphically presents the mean scores of managers in
IPCs and MPCs on LWI, as also the t-value.
Figure 2: Comparison of LWI Mean Scores of Managers in IPCs and MPCs in
Goa
Thus managers in MPCs are provided with significantly better labour welfare facilities
than IPCs in Goa. Perhaps the MPCs have realized the importance of the managerial class
for the efficient functioning of the company, especially in the era of global competition.
They need to be provided with good welfare facilities so that they will be motivated to
give their best to the company. The employers in MPCs may have therefore taken the
extra effort to provide better welfare facilities to their managers than that received by
their counterparts in IPCs.
Difference in the labour welfare facilities provided to workers in IPCs and MPCs in
Goa
The study further went on to find out whether the workers in IPCs (N=79) and MPCs
(N=40) in Goa differed on the labour welfare facilities offered to them. Table 7 compares
the mean scores obtained on LWI by workers in IPCs and MPCs and gives the t-value.
211
Table 7
Comparison of mean scores obtained on the LWI of IPCs and MPCs workers
Workers N TOTAL MEAN SD t
IPCs 79 9863 124.85 24.32 6.61**
MPCs 40 6252 156.3 24.10
** Significant at the 0.01 level
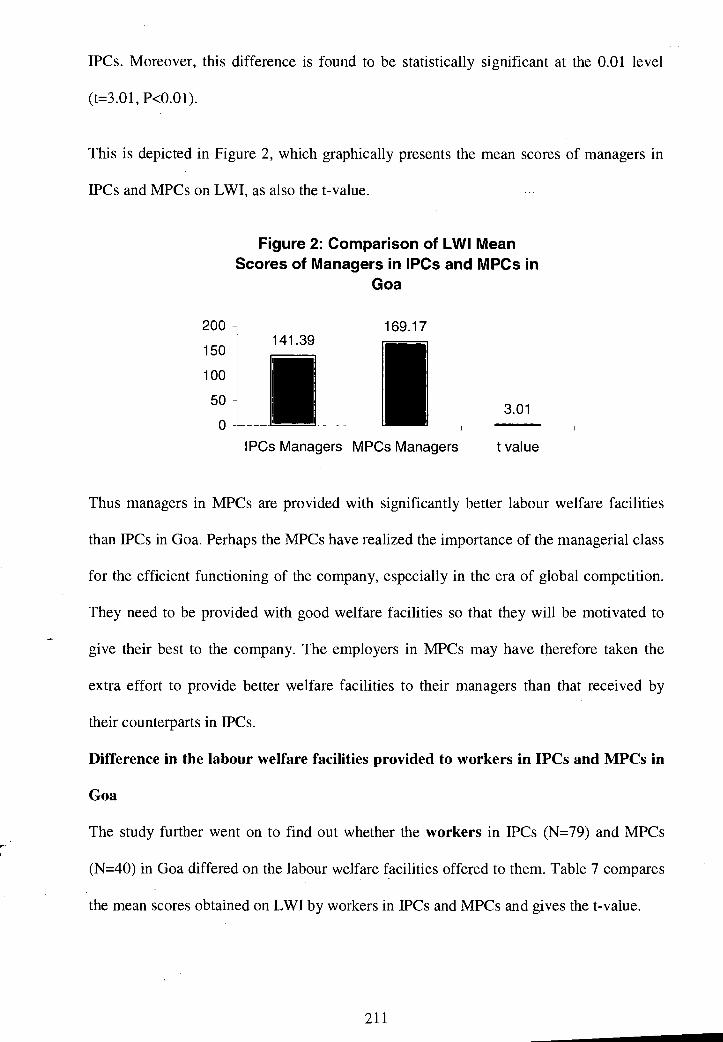
The results of the Table show that the mean score of workers in MPCs (M=156.3) is
higher than that of IPCs workers (M=124.85). This indicates that the workers in MPCs
perceive better labour welfare facilities offered to them that their fellow mates in IPCs.
Moreover this difference in the labour welfare facilities provided to workers in IPCs and
MPCs in Goa is statistically significant at the 0.01 level (t-value =6.61, P< 0.01).
Figure 3 is a graphical representation of this finding. It presents the mean scores of
workers in IPCs and MPCs on LWI, as also the t-value.
Figure 3: Comparison of LWI Mean Scores of Workers in !PCs and MPCs
in Goa
200
150
100
50
0
124.85
156.3
6.61 --- T-
IPC Workers MPC Workers
t value
212

It highlights that the workers in MPCs perceive the labour welfare facilities offered to
them as far superior than those perceived by the respondents in IPCs in Goa. One
explanation could be that the MPCs attach more importance towards the welfare of their
workers. They perhaps acknowledge that workers are the ones who keep the wheels of the
industry moving and hence should be taken care of by providing them with fine labour
welfare facilities. This would keep the workers happy and also attract well-qualified,
experienced and efficient workers. The IPCs in Goa probably still need to realize the
importance of providing better labour welfare facilities to their workers, which would go
a long way in improving the welfare of the workers and the progress of the company.
Similar studies on workers in private and public sectors were conducted by researchers
(Kumar and Yadav, 2002; and Srivastava, 2005). These researchers found that labour
welfare facilities in private sectors were better provided than in public sectors.
It can be summarized from the findings that the labour welfare facilities provided in
MPCs (N=86) significantly differ from those provided in IPCs (N=115) in Goa. The
MPCs provide significantly superior labour welfare facilities than that provided by the
IPCs. Moreover the managers and workers in MPCs perceive the labour welfare facilities
provided to them as being significantly much better than those perceived by their fellow
mates in IPCs. It follows that there is a significant difference in the labour welfare
facilities provided in Indian pharmaceutical companies and multinational pharmaceutical
companies in Goa. Thus the null hypothesis Hol, which states that there is no significant
difference in the labour welfare facilities provided in Indian pharmaceutical companies
and multinational pharmaceutical companies in Goa, is not accepted.
213

5.3 COMPARISON OF JOB SATISFACTION EXPERIENCED IN INDIAN
PHARMACEUTICAL COMPANIES AND MULTINATIONAL
PHARMACEUTICAL COMPANIES IN GOA
Employee satisfaction is one of the most researched topics of organizational behaviour in
India and abroad (Hoppock, 1935; Herzberg, 1959; Ganguli, 1964; Pestonjee, 1967;
Sinha, 1972; Locke, 1976; Sinha, 1981; Khandwalla, 1988; Ganesh, 1990; Sinha and
Singh, 1995; Chelliah, 1997).
Studies have revealed job satisfaction to be of great significance for the effective
functioning of any organization. It has found to be intimately related to morale, is often a
factor in worker productivity, influences workers attendance and stability, has a spill over
effect on employee relations and accidents (Vroom, 1964; Rajgopal, 1965; Jawa, 1971;
Locke, 1976; Mirvis and Lawler, 1977; Khaleque, 1979; Mowday, 1981; Prakasam, 1982;
Scarpello and Campbell, 1983; Bhattacharaya and Gosh, 1984; Srivastava and Roy,
1996).
Studies have also been conducted on job satisfaction in private and public sectors (Sinha,
1973; Srivastava and Sinha, 1980; Verma and Sinha, 1983; Pratap and Srivastava, 1985;
Daftuar and Prasad, 1986; Sinha, 1988; Choudhry, 1989; Goyal, 1995; Joshi, 2001).
However no study has been done to determine and compare the level of job satisfaction
experienced in IPCs and MPCs.
The present research is an attempt to compare the job satisfaction experienced by the
respondents in IPCs and MPCs in Goa. For this purpose, the Job Satisfaction Scale by
Rita Shreshtya and H.C. Ganguli (1994) was administered to the total sample (N=201)
214

comprising of managers and workers in Indian and multinational pharmaceutical
companies in Goa.
In this section a comparative study is made of the level of job satisfaction experienced by
employees in IPCs and MPCs in Goa. Accordingly the null hypothesis Ho2 was framed.
Ho2: There is no significant difference in the level of job satisfaction experienced in
Indian pharmaceutical companies and multinational pharmaceutical
companies in Goa.
The testing of the null hypothesis Ho2 would reveal whether there is a significant
difference in the level of job satisfaction experienced by the employees in IPCs and
MPCs in Goa. To test Ho2, the mean scores on the Job Satisfaction Scale (JSS) for the
IPCs sample (N=115) and MPCs sample (N=86) in Goa were compared, which would
highlight any difference in their level of job satisfaction. To test if this difference is
significant, the t-test was used. Table 8 compares the mean scores obtained on JSS by the
IPCs (N=115) and MPCs (N=86) samples in Goa and shows the t-value.
Table 8
Comparison of JSS mean scores obtained by IPCs and MPCs samples
Company N TOTAL MEAN SD t
IPCs 115 9024 78.47 16.17 9.076**
MPCs 86 8395 97.62 12.77
**Significant at the 0.01 level
The job satisfaction experienced by the respondents in MPCs is higher than that of those
in IPCs, since the mean value obtained on the JSS by the MPCs sample (M=97.62) is
higher than that obtained by the IPCs sample (M=78.47). To determine whether this
difference is statistically significant, a t-test was conducted. The t-value calculated is
215
significant at the 0.01 level (t=9.076, P<0.01). Thus, statistically, the difference in the
level of job satisfaction experienced between the samples in the Indian pharmaceutical
companies (N=115) and multinational pharmaceutical companies (N=86) in Goa is
significant.
This tells us that the level of job satisfaction experienced by employees in the MPCs is
significantly higher than that experienced by employees in the IPCs. The higher level of
job satisfaction experienced in MPCs could probably be because the job facets offered by
these companies may be better than that offered by the IPCs. This finding prompted the
researcher to compare the dimensions in the JSS in the IPCs and MPCs in Goa, which is
discussed in the following section.
Comparative studies on the job satisfaction of employees in private and public sectors
have been drawn by researchers, which have shown that the employees in the private
sectors are more satisfied with their job than their countereparts in the public sectors
(Sinha, 1973; Pratap and Srivastava, 1985; Mishra 1992; Joseph, 2001; Gha and Pathak,
2003; Srivastava, 2004).
Difference between IPCs and MPCs on the dimensions of the Job Satisfaction Scale
Various researchers have conducted studies to determine the factors influencing job
satisfaction and dissatisfaction (Herberzg, 1959; Ganguli, 1964; Blum, 1968; Blum and
Naylor, 1968; Poter, 1973; Daley, 1986; Seymaour and Busherhof, 1991; Sharma and
Bhaskar, 1991; Emmert and Taher, 1992; Kiriccki, et. al., 1992; Srivastava et. al 1992;
Sinha and Singh, 1995; De Santis and Drust, 1996; Chelliah, 1998; Nazir, 1998; Panda,
2001; Rao, et. al., 2002; Maheshwaran, et. al., 2003; Thomas, 2003; Sharma and Jyoti,
2006).
216

The researcher went on to study the dimensions in the JSS that influence the level of job
satisfaction of the respondents in the IPCs (N=115) and MPCs (N=86) in Goa. Table 9
presents the dimension-wise mean scores and the respective t-values.
Table 9
Comparison of IPCs and MPCs dimension-wise JSS mean scores
COMPANY WI PFB P1'0 J Sec SU CCW CP
IPCs
(N=115)
Mean
SD
9.59 9.27 8.40 11.98 13.82 7.34 18.07
2.65 3.56 2.27 3.35 3.04 1.50 4.45
t value 6.69** 8.32** 8.21** 5.12** 7.57** 6.08** 6.32**
MPCs
(N=86)
Mean
SD
11.86 13.56 11.10 14.20 16.65 8.69 21.67
1.95 3.68 2.36 2.54 1.90 1.61 3.28
** Significant at the 0.01 level
The results of Table 9 illustrate that the mean values on all the dimensions of the JSS are
higher in MPCs than IPCs in Goa. This indicates that the respondents in the MPCs enjoy
greater satisfaction on these job facets than their counterparts in IPCs. Moreover the
difference between IPCs and MPCs on all these dimensions of the JSS namely, work
itself, pay and financial benefits, promotional and training opportunities, job security,
supervision, colleagues and coworkers, and company practices are found to be
statistically significant at the 0.01 level. This implies that the employees in MPCs in Goa
(N=86) experience a significantly greater degree of job satisfaction on the dimensions of
the JSS than their counterparts in the IPCs (N=115).
Figure 4 shows the differences in the mean scores of the IPCs and MPCs samples on the
dimensions of the JSS.
217

▪ IPC (N=115)
❑ t value
• MPC (N=86)
Figure 4: Comparison of Job Satisfaction Dimension Means of IPCs and MPCs in Goa
25
21.67
WI
PFB
PTO JSec SU
CCW
CP
Dimensions of Job Satisfaction
r-
The bar graph indicates that the MPCs (N=86) sample has scored higher on the
dimensions of the JSS than the IPCs sample (N=115). Thus the respondents in MPCs are
more satisfied with these job facets than their counterparts in IPCs.
This may be because the respondents in MPCs when compared to those in IPCs probably
find their work more challenging, work with the latest technology, receive better
monetary incentives, are sent on foreign assignments and trained regularly, promoted in
accordance to their efficiency, enjoy a good rapport with their superiors, colleagues and
co-workers, and are satisfied with the company practices such as appreciation of
employees, personal growth of employees, provision of good working conditions. In IPCs
the monetary incentives are usually lower, training is mostly in-house, limited
communication with superiors, and company practices are shallow. Thus respondents in
218

MPCs experience greater satisfaction on the dimensions of the JSS than the respondents
in IPCs in Goa.
It should be noted that these dimensions in the JSS that are statistically significant include
both the hygiene and motivator factors mentioned in Herzberg's two-factor theory (1957),
thus implying that the level of job satisfaction in these companies is influenced by the
hygiene and motivator factors. Herzberg's theory of job satisfaction (1957) supports the
findings of this study. Studies by Aggarwal (1978), Kanungo (1991), Sinha (1981), have
shown that motivators and hygiene factors are more or less similar in promoting job
satisfaction/dissatisfaction of employees.
Various studies by researchers (Ganguli, 1954; 1958; Sinha, 1958; Desai, 1968;
Mukerjee, 1968; Rao and Ganguli, 1971; Dolke, 1974; Lal and Bhardwaj, 1981;
Prakasan, 1982; Kovach, 1987; Sinha, 1990; Goyal, 1995; Sinha and Singh, 1995; Nazir,
1998; Manichavasagam and Sumathi, 2000; Sayadain, 2002; Islam, 2003; Sharma and
Sharma, 2003; Thomas and Pryadarsini, 2004) have supported the findings that pay and
financial benefits, promotion and training opportunities, job security, supervision, and
colleagues and co-workers, and company practices influence the level of job satisfaction
of employees.
From the above discussion of this section, it is realized that there is a significant
difference in the level of job satisfaction experienced by the respondents in IPCs (N=
115) and MPCs (N=86) in Goa.
Thus, the null hypothesis Ho 2 which states that there is no significant difference in the
level of job satisfaction experienced in Indian pharmaceutical companies and multi-
national pharmaceutical companies in Goa is not accepted.
219

5.3.1 Difference in the Job Satisfaction of Managers and Workers in Indian
Pharmaceutical Companies and Multinational Pharmaceutical Companies in
Goa
The researcher further investigated whether this difference in job satisfaction experienced
was also true of the sub samples — managers and workers — in IPCs and MPCs in Goa.
Difference in the level of job satisfaction experienced by managers in IPCs and
MPCs in Goa
Managers are a link between the company and the workers. They are an important entity
in ensuring peaceful industrial relations and progress of the organization. Naturally it is
important to study and understand the job satisfaction experienced by managers in IPCs
and MPCs in Goa. Accordingly the difference in the level of job satisfaction experienced
by managers in IPCs and MPCs was studied. A comparison of the mean scores on JSS
obtained by managers in IPCs (N=36) and MPCs (N=46) and the test of significance (t-
test) determining whether this difference is significant is presented in Table 10.
Table 10
Comparison of JSS mean scores obtained by IPCs and MPCs managers
Company N TOTAL MEAN SD t value
IPCs 36 3331 92.53 12.93 3.47**
MPCs 46 4737 102.98 13.98331
**Significant at the 0.01 level
From Table 10, it can be realized that the mean scores of managers in MPCs is higher
(M=102.98) than that of the managers in IPCs (M=92.53), indicating that managers in
MPCs (N=46) experience a higher level of job satisfaction than managers in IPCs (N=36)
220

in Goa. The difference between the mean scores is statistically significant at the 0.01 level
(t-value=3.47, P<0.01). This could be because the MPCs may have become responsive to
the job expectations of their managers and accordingly catered to these expectations. The
IPCs, on the other hand, may not have realized the potential in fulfilling the job
expectation of their managers.
Figure 5 is a graphical representation of these findings.
Figure 5: Comparison of JSS Means for Managers in IPCs and MPCs in Goa
120 - 100 80 -
60 40 - 20
92.53
102.98
3.47 0
IPC Managers MPC Managers t value
It is evident from the same that a significant difference exists between the JSS mean
scores of managers in MPCs and managers in IPCs. Managers in MPCs experience a
significantly higher level of job satisfaction than managers in IPCs.
Studies by Joshi and Sharma (1997), Chelliah (1998), and Sharma and Kaur (2000) have
revealed that managers, in general, experience a high level of job satisfaction. Moreover it
would be interesting to recall that even when the labour welfare facilities for managers in
IPCs and MPCs were studied similar results were observed.
221

Difference in the level of job satisfaction experienced by workers in IPCs and MPCs
in Goa
The study moves on to determining the difference in the level of job satisfaction
experienced by workers in IPC (N=79) and MPC (N=40) in Goa. Table 11 outlines the
comparison of mean scores obtained on JSS by workers in IPCs and MPCs and the
corresponding t-value.
Table 11
Comparison of JSS mean scores obtained by IPCs and MPCs workers
WORKERS N TOTAL MEAN SD t value
IPCs 79 5693 72.06 13.20 8.58**
MPCs 40 3658 91.45 7.53
** Significant at the 0.01 level
Table 11 makes it clear that there is a difference in the mean scores of IPCs and MPCs,
with the MPCs obtaining a higher mean value (M=91.45) than the IPCs (M=72.06). This
indicates that workers in MPCs (N=40) experience a higher level of job satisfaction than
those in IPCs (N=79). Moreover statistically there is a significant difference in the job
satisfaction experienced by workers in IPCs and MPCs in Goa, as the t-value is
significant at the 0.01 level (t=8.58, P<0.01). Thus it goes to show that workers in MPCs
enjoy a significantly higher level of job satisfaction than workers in IPCs. This may
perhaps be because in MPCs, the job may be satisfying many of the workers expectations
as compared to their fellow workers in IPCs. Hence the workers in MPCs have a positive
attitude towards their job, leading to them experiencing a higher level of job satisfaction
than their counterparts in 'Ks. The MPCs recognize that workers are assets to the
company, and in order to retain their efficient and productive workers, make the
necessary efforts to provide them with better job facets that meet their job expectations.
222
91.44
72.06
IPC Workers MPC Workers
100
80
60 -
40 -
20 -
0
8.58
t value
With a good work environment that caters to their expectations and needs, workers in
MPCs feel highly satisfied with their job than their counterparts in IPCs in Goa.
There are studies that have found a significant difference in the job satisfaction of
workers in private and public sectors (Pratap and Srivastava, 1985; Goyal, 1995; Mishra
1992; Joseph, 2001; and Srivastava, 2005).
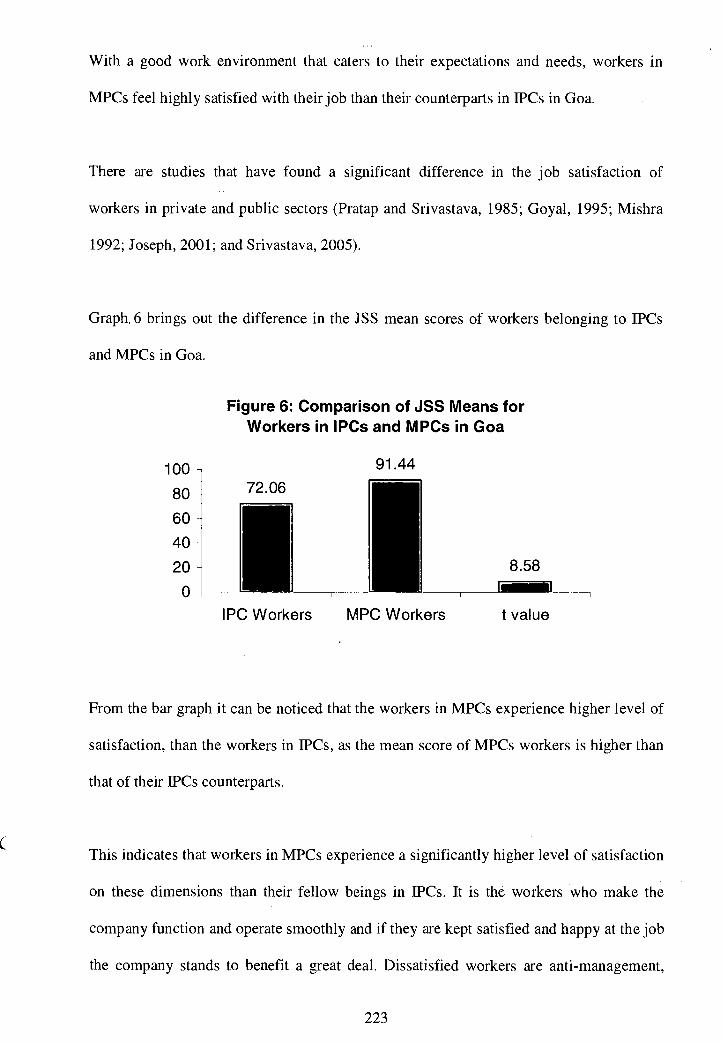
Graph. 6 brings out the difference in the JSS mean scores of workers belonging to IPCs
and MPCs in Goa.
Figure 6: Comparison of JSS Means for Workers in IPCs and MPCs in Goa
From the bar graph it can be noticed that the workers in MPCs experience higher level of
satisfaction, than the workers in IPCs, as the mean score of MPCs workers is higher than
that of their IPCs counterparts.
This indicates that workers in MPCs experience a significantly higher level of satisfaction
on these dimensions than their fellow beings in IPCs. It is the workers who make the
company function and operate smoothly and if they are kept satisfied and happy at the job
the company stands to benefit a great deal. Dissatisfied workers are anti-management,
223
work against the management and the goals of the company. MPCs may have realized
this and have probably made efforts to create an environment that would enhance the
satisfaction of the workers with the job facets offered to them. On the other hand, in the
IPCs, probably these job facets do not adequately satisfy the job expectations and so the
workers feel a low level of satisfaction on these job dimensions.
It would be interesting to note that when workers in IPCs and MPCs were studied on their
perception of the LWI (Table 7), similar findings were observed. Workers in MPCs
reported being provided significantly better labour welfare facilities than did their
counterparts in IPCs. Similar results are reflected in the current finding that workers in
MPCs experience a higher level of job satisfaction than their fellow workers in IPCs.
To conclude, there is a statistically significant difference among workers in MPCs (N=40)
and in IPCs (N=79) in Goa on their level of job satisfaction. The workers in MPCs have
experienced a significantly greater level of job satisfaction than workers in IPCs,
including those on the dimensions of the JSS. Thus the MPCs workers are more satisfied
than their IPCs counterparts with their overall job as well as the job facets.
5.4 PERCENTAGE OF EMPLOYEES IN PHARMACEUTICAL COMPANIES IN
GOA EXPERIENCING HIGH, MODERATE AND LOW LEVELS OF JOB
SATISFACTION
Another interesting aspect while studying job satisfaction is to determine the percentage
of employees experiencing different levels of job satisfaction based on the scores
obtained on the JSS. The researcher was curious to find out the percentage of respondents
in the total sample (N=201) that experienced high, moderate, and low levels of job
224
satisfaction based on the scores obtained on the JSS. Moreover the percentage of
employees that experienced high, moderate, and low levels of job satisfaction was also
calculated for the sub samples - managers and workers - in IPCs and MPCs, and a
comparison was drawn. The level of job satisfaction experienced by the total sample of
employees (N=120) in the selected pharmaceutical companies in Goa is revealed in Table
12.
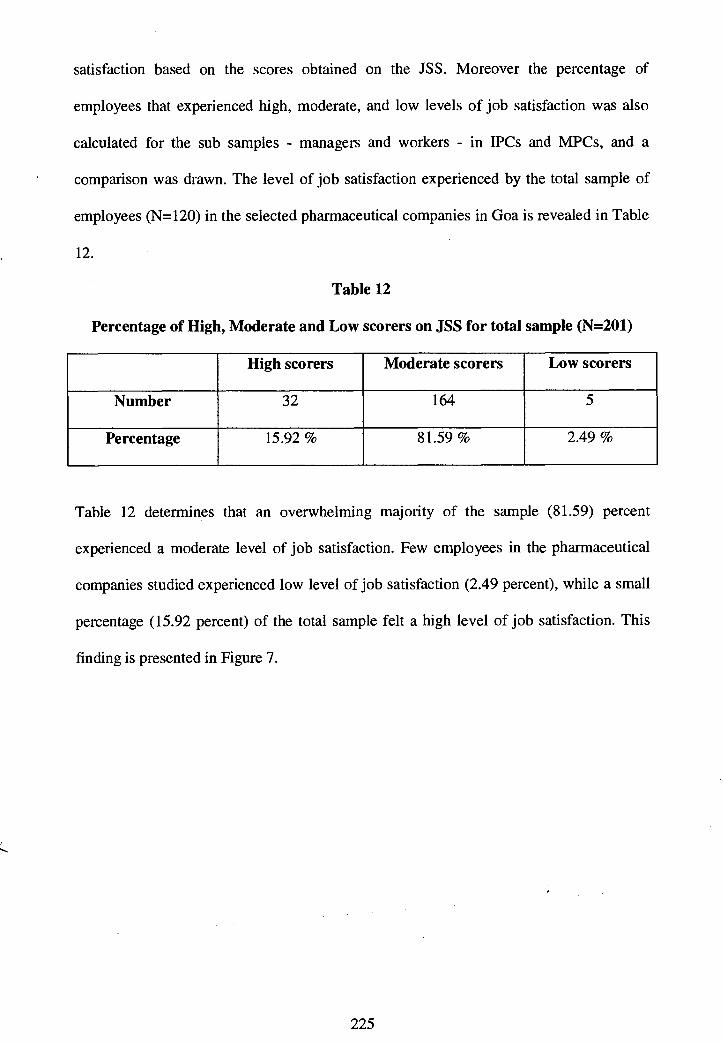
Table 12
Percentage of High, Moderate and Low scorers on JSS for total sample (N=201)
High scorers Moderate scorers Low scorers
Number 32 164 5
Percentage 15.92 % 81.59 % 2.49 %
Table 12 determines that an overwhelming majority of the sample (81.59) percent
experienced a moderate level of job satisfaction. Few employees in the pharmaceutical
companies studied experienced low level of job satisfaction (2.49 percent), while a small
percentage (15.92 percent) of the total sample felt a high level of job satisfaction. This
finding is presented in Figure 7.
225

Figure 7: Percentage of High, Moderate and Low scorers on JSS (Total Sample)
2.49%
15.92%
81.59%
High scorers III Moderate scorers ❑ Low scorers
Thus in the pharmaceutical companies in Goa, majority of employees have reported being
moderately satisfied with their jobs. This perhaps could be because the job facets offered
to the respondents by the pharmaceutical companies studied may just be modest enough
to ensure moderate level of job satisfaction but not adequate enough to ensure a high job
satisfaction. The job facets may not be meeting all the needs and aspirations of the
respondents. The pharmaceutical companies in Goa therefore require to improve working
conditions, job facets and work environments that will in turn make the majority of their
employees experience high levels of job satisfaction.
The findings of this study are supported by the research work done by scholars who found
that majority of the employees experience moderate level of job satisfaction in their
organizations (Rahad, 1995; Tyagi and Tripathi, 1996; Shinde, 1997; Pavani and Devi,
2003; Suchitra and Devi, 2003; Hague, 2004).
226
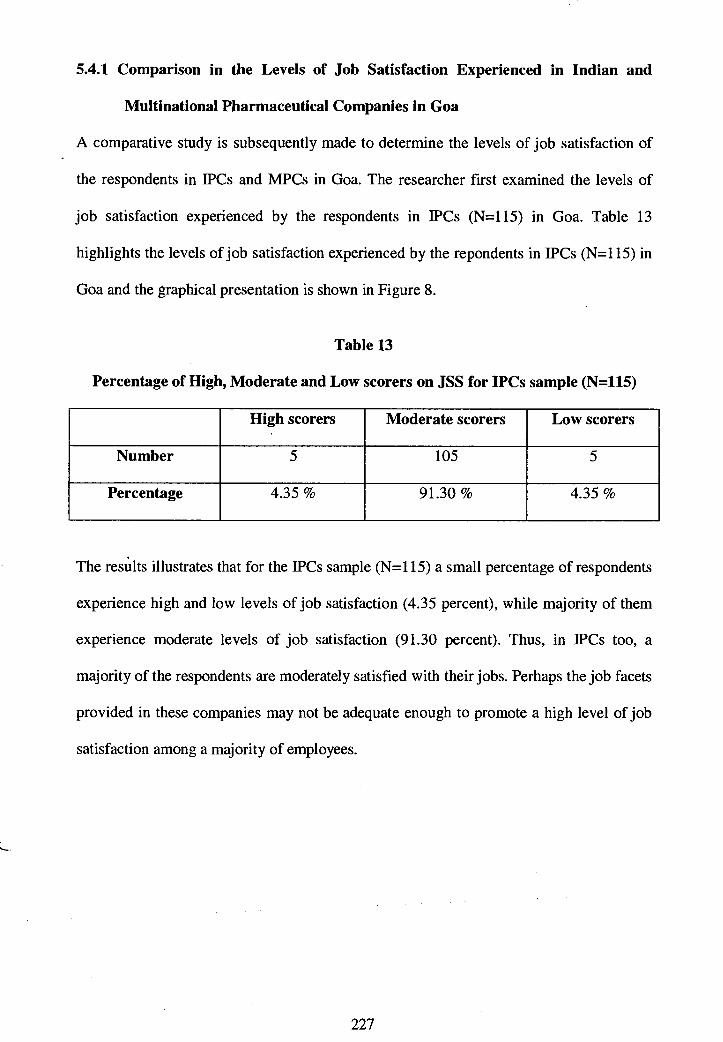
5.4.1 Comparison in the Levels of Job Satisfaction Experienced in Indian and
Multinational Pharmaceutical Companies in Goa
A comparative study is subsequently made to determine the levels of job satisfaction of
the respondents in IPCs and MPCs in Goa. The researcher first examined the levels of
job satisfaction experienced by the respondents in IPCs (N=115) in Goa. Table 13
highlights the levels of job satisfaction experienced by the repondents in IPCs (N=115) in
Goa and the graphical presentation is shown in Figure 8.
Table 13
Percentage of High, Moderate and Low scorers on JSS for IPCs sample (N=115)
High scorers Moderate scorers Low scorers
Number 5 105 5
Percentage 4.35 % 91.30 % 4.35 %
The results illustrates that for the IPCs sample (N=115) a small percentage of respondents
experience high and low levels of job satisfaction (4.35 percent), while majority of them
experience moderate levels of job satisfaction (91.30 percent). Thus, in IPCs too, a
majority of the respondents are moderately satisfied with their jobs. Perhaps the job facets
provided in these companies may not be adequate enough to promote a high level of job
satisfaction among a majority of employees.
227

Figure 8: Percentage of High, Moderate and Low scorers on JSS for IPCs (N=115)
4.35% 4.35%
High scorers
IN Moderate scorers
❑ Low scorers
91.30%
Percentage of managers and workers in the IPCs experiencing different levels of job
satisfaction
Further the researcher was curious to find out the percentage of managers and workers in
the IPCs experiencing different levels of job satisfaction. The results are revealed in Table
14.
Table 14
Percentage of High, Moderate and Low scorers on JSS for
IPCs managers and workers
IPCs High scorers Moderate scorers Low scorers
Managers (N=36) 13.89% 83.33% 2.78%
Workers (N=79) 0% 94.94% 5.06%
It can be observed from Table 14 that majority of the managers (83.33 percent) reported a
moderate level of job satisfaction, while a small percentage of managers experienced high
228

level of job satisfaction (13.89 percent) and a very small percentage of managers
experienced low level of job satisfaction (2.78 percent). Thus, the majority of managers in
IPCs reported moderate satisfaction with their jobs. Overall, a large percent of managers
are satisfied with their jobs while a small percent experience low level of job satisfaction
in the lPC (N= 36) in Goa.
Among workers in the IPCs (N=79), a majority of the respondents are moderately
satisfied with their job (94.94 percent), while few of the respondents experience a low
level of job satisfaction (5.06 percent). It is interesting to note that none of the workers
studied experienced high level of job satisfaction. Studies by Islam (2003) and Sharma
and Jyoti (2006) have reported similar findings.
Thus the findings of the study demonstrate that majority of the respondents - managers
and workers - in IPCs experience a moderate level of job satisfaction. Various researchers
through their studies have supported this finding (Khaleque and Wadud, 1984; Khaleque
and Rehman, 1987; Goyal, 1995; Hariharamahadevan and Amirtharajan, 1997; Panda,
2001; Raj agopalrao, 2002-03; Maheshwari and Gupta, 2004).
The moderate level of job satisfaction experienced by the majority of managers and
workers in IPCs may be because the job facets and work environment may not be vibrant
enough to enable most of them experience high levels of job satisfaction. The IPCs must
therefore work upon improving the job facets and environment that will improve the
levels of job satisfaction of their managers and workers.
229

Percentage of managers and workers in the MPCs experiencing different levels of
job satisfaction
The researcher further investigated the level of job satisfaction of the respondents
(N=86), including those of managers and workers, in MPCs in Goa. Table 15 presents the
percentage scores on JSS for the entire MPCs sample (N=86).
Table 15
Percentage of High, Moderate and Low scorers on JSS for MPCs sample (N=86)
High scorers Moderate scorers Low scorers
Number 27 59 0
Percentage 31.40% 68.60%
The results of Table 15 indicate that of the total sample in MPCs (N=86) majority of the
respondents (68.60 percent) experienced a moderate level of job satisfaction, while a
small percentage of respondents (31.40 percent) experienced a high level of job
satisfaction. What is interesting to note is that in the MPCs sample (N=86) none of the
respondents experienced low level of job satisfaction, which goes to show that the
respondents in MPCs are quite satisfied with their jobs. One explanation perhaps could be
that the MPCs create a work environment and provides job facets that enhance the level
of job satisfaction of their employees. The Figure 9 is a graphically presentation of the
results.
230

31.40%
68.60%
❑ High scorers ❑ Moderate scorers El Low scorers
Figure 9: Percentage of High, Moderate and Low scorers on JSS for MPCs (N=86)
0%
A further analysis was made of the percentage of managers (N=46) and workers (N=40)
experiencing different levels of job satisfaction in MPCs. The findings are indicated in
Table 16.
Table 16
Percentage of High, Moderate and Low scorers on JSS for
MPCs managers and workers
MPCs High scorers Moderate scorers Low scorers
Managers (N=46) 52.17% 47.83%
Workers (N=40) 7.50% 92.50%
From the above Table, it can be interestingly observed that none of the managers and
workers in MPCs reported a low level of job satisfaction. In fact majority of the managers
enjoy a high level of job satisfaction (52.17 percent), while others experienced a moderate
level of job satisfaction (47.83 percent). Hence in MPCs, a majority of the managers are
231
highly satisfied with their jobs, which probably could be because most of the job facets
perhaps satisfy their job expectations resulting in a high level of job satisfaction.
In the case of workers too in MPCs (N=40) none of them experienced a low level of job
satisfaction. Majority of them feel a moderate level of job satisfaction (92.50 percent) and
a small percent of workers experienced a high level of job satisfaction (7.50 percent).
Thus it can be said that in MPCs most of the workers enjoy a moderate level of job
satisfaction.
Goyal (1995), Sharma and Jyoti (2006) have pointed out that maximum numbers of
workers in the private sector are satisfied with their jobs, thus supporting the finding of
this study.
Comparison in the levels of job satisfaction experienced in IPCs and MPCs in Goa
Having illustrated the levels of job satisfaction experienced by the entire sample in IPCs
(N=115) and MPCs (N=86) in Goa including that of managers and workers in the
respective companies, the researcher drew a comparison the levels of job satisfaction
experienced by the entire sample of IPCs (N=115) and MPCs (N=86) in Goa, including
that of managers and workers in these companies.
Table 17 shows the comparison of job satisfaction for the IPCs (N=115) and MPCs
(N=86) samples.
232
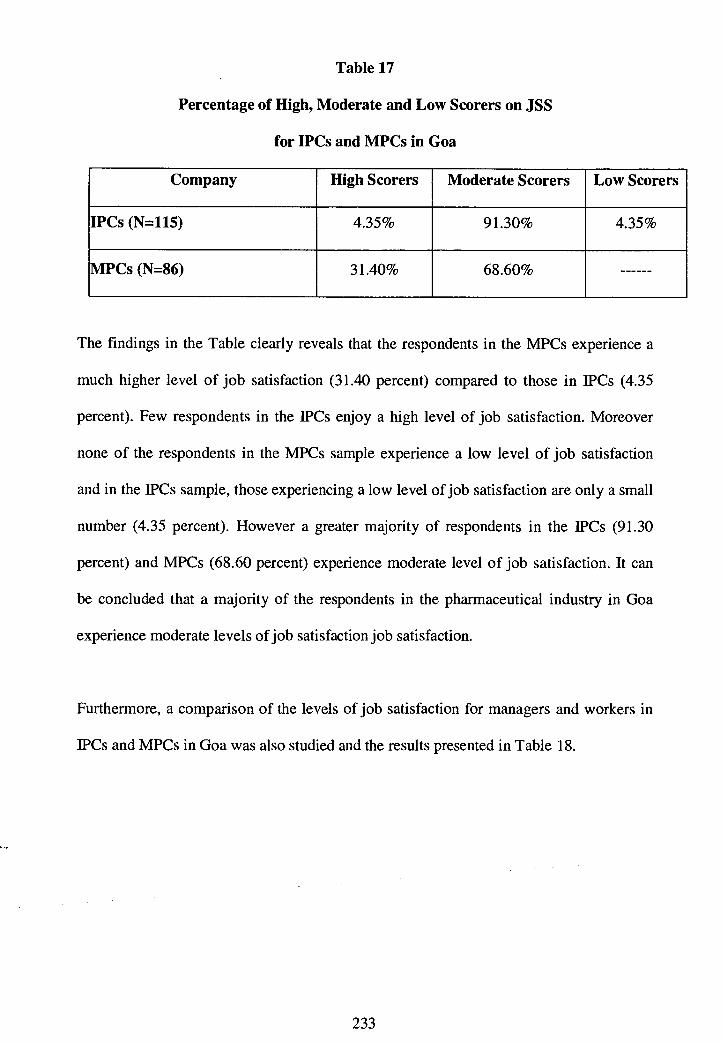
Table 17
Percentage of High, Moderate and Low Scorers on JSS
for IPCs and MPCs in Goa
Company High Scorers Moderate Scorers Low Scorers
IPCs (N=115) 4.35% 91.30% 4.35%
MPCs (N=86) 31.40% 68.60%
The findings in the Table clearly reveals that the respondents in the MPCs experience a
much higher level of job satisfaction (31.40 percent) compared to those in IPCs (4.35
percent). Few respondents in the IPCs enjoy a high level of job satisfaction. Moreover
none of the respondents in the MPCs sample experience a low level of job satisfaction
and in the IPCs sample, those experiencing a low level of job satisfaction are only a small
number (4.35 percent). However a greater majority of respondents in the IPCs (91.30
percent) and MPCs (68.60 percent) experience moderate level of job satisfaction. It can
be concluded that a majority of the respondents in the pharmaceutical industry in Goa
experience moderate levels of job satisfaction job satisfaction.
Furthermore, a comparison of the levels of job satisfaction for managers and workers in
IPCs and MPCs in Goa was also studied and the results presented in Table 18.
233

Table 18
Percentage of High, Moderate and Low Scorers on JSS for IPCs and MPCs
Managers and Workers in Goa
High Scorers Moderate Scorers Low Scorers
IPCs Managers (N=36) 13.89% 83.33% 2.78%
MPCs Managers (N=46) 52.17% 47.83%
IPCs Workers (N=79) 94.94% 5.06%
MPCs Workers (N=40) 7.50% 92.50%
The results indicate that majority of the managers in MPCs experience a high level of job
satisfaction (52.17 percent), while majority of the managers in IPCs (83.33 percent)
experience moderate level of job satisfaction. While in MPCs none of the managers
experience a low level of job satisfaction, in IPCs the percentage of managers
experiencing low level of job satisfaction is also very low (2.78 percent). It can be
observed that in IPCs just a few managers (13.89 percent) experience high level of joib
satisfaction.
Overall, it can be concluded that in the case of managers in MPCs majority of them
experience high level of job satisfaction; while in IPCs majority of them experience
moderate level of job satisfaction. The managers in MPCs seem to be more satisfied with
their jobs compared to their counterparts in IPCs.
For the workers, Table 18 illustrates that while none of the workers in MPCs experience
low level of job satisfaction, in IPCs none of the workers experience high level of job
satisfaction. In MPCs the percentage of workers highly satisfied with their jobs is very
234
small (7.50 percent). However a greater majority of workers in the IPCs (94.94 percent)
and MPCs (92.50 percent) experience moderate level of job satisfaction.
From Tables 17 and 18 it can be concluded that in MPCs, none of the respondents
experience low level of job satisfaction and even in the IPCs, those experiencing low
level of job satisfaction is small. Most of the respondents in pharmaceutical companies in
Goa are moderately satisfied with their job. When comparing managers and workers in
IPCs and MPCs on their levels of job satisfaction, it is found that managers in MPCs
experience a higher level of job satisfaction than their fellow mates in IPCs and majority
of workers in IPCs and MPCs have moderate level of job satisfaction.
Thus the overall picture that unfolds on the level of job satisfaction in IPCs and MPCs in
Goa is that majority of the respondents are moderately satisfied with their jobs. Hence it
is important for the pharmaceutical companies to analyze the needs and aspirations of
their employees and accordingly provide them with those job facets that will gratify these
needs and aspirations. This would in turn bring about a higher level of job satisfaction, to
a majority of employees in this industry.
5.5 RELATIONSHIP BETWEEN LABOUR WELFARE FACILITIES PROVIDED
AND JOB SATISFACTION EXPERIENCED IN PHARMACEUTICAL
COMPANIES IN GOA
Labour welfare facilities play a significant role in influencing the level of job satisfaction
of employees. Studies on the relationship between labour welfare and job satisfaction
have been done by various researchers (Rao, et. al., 1991; Goyal, 1995; Agnihotri, 2002;
Srivastava, 2004). This created an interest in the researcher to find out if there is a
235
relationship between labour welfare and job satisfaction in the pharmaceutical companies
in Goa. This gave rise to the null hypothesis Ho3.
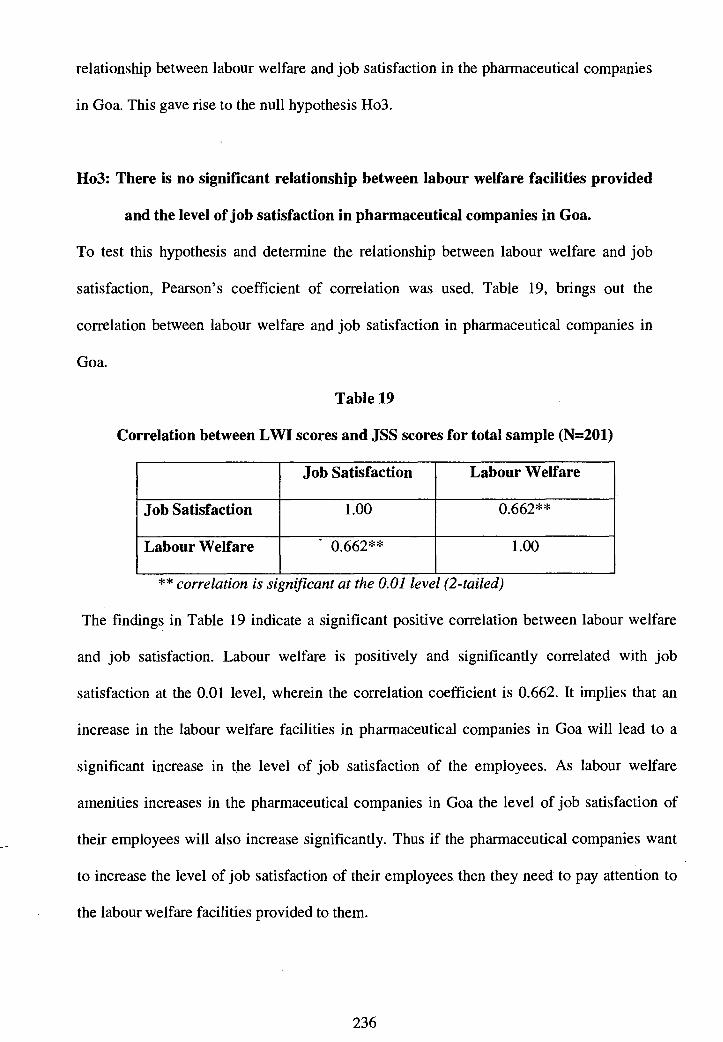
Ho3: There is no significant relationship between labour welfare facilities provided
and the level of job satisfaction in pharmaceutical companies in Goa.
To test this hypothesis and determine the relationship between labour welfare and job
satisfaction, Pearson's coefficient of correlation was used. Table 19, brings out the
correlation between labour welfare and job satisfaction in pharmaceutical companies in
Goa.
Table 19
Correlation between LWI scores and JSS scores for total sample (N=201)
Job Satisfaction Labour Welfare
Job Satisfaction 1.00 0.662**
Labour Welfare - 0.662** 1.00
** correlation is significant at the 0.01 level (2-tailed)
The findings in Table 19 indicate a significant positive correlation between labour welfare
and job satisfaction. Labour welfare is positively and significantly correlated with job
satisfaction at the 0.01 level, wherein the correlation coefficient is 0.662. It implies that an
increase in the labour welfare facilities in pharmaceutical companies in Goa will lead to a
significant increase in the level of job satisfaction of the employees. As labour welfare
amenities increases in the pharmaceutical companies in Goa the level of job satisfaction of
their employees will also increase significantly. Thus if the pharmaceutical companies want
to increase the level of job satisfaction of their employees then they need to pay attention to
the labour welfare facilities provided to them.
236
Research studies that lend support to this finding include those done by Srivastava (1989),
Rao, et. al. (1991), Mishra (1992), Goyal (1995), Agnihotri, (2002), Srivastava (2004), Sinha
and Singh (1995), and Maheshwari and Gupta (2004).
Since there is a significant positive correlation between labour welfare and job satisfaction,
the null hypothesis Ho3 which states that there is no significant relationship between labour
welfare facilities provided and the level of job satisfaction in pharmaceutical companies in
Goa is not accepted.
5.6 CONCLUSIONS
From the deliberations in this chapter, it can be summarized that the study drew a comparison
between Indian and multinational pharmaceutical companies in Goa on the labour welfare
facilities provided and the job satisfaction experienced by the respondents in these
companies. The findings in this chapter have lead to the following conclusions.
• The labour welfare facilities provided by MPCs is significantly different from
those provided by IPCs. Labour welfare facilities offered by MPCs to their
employees were significantly superior to those provided to their counterparts in
IPCs.
• On all eight dimensions of the LWI there was a significant difference observed
between IPCs and MPCs in Goa. The respondents in the MPCs perceived these
dimensions to be significantly better provided than perceived by their fellow=
mates in IPCs. Thus those working in MPCs identify the various labour welfare
237
facilities offered to them to be much better than that received by their counterparts
in IPCs in Goa.
• In the case of managers in IPCs and MPCs, a statistically significant difference
was found on the labour welfare facilities provided to the mangers in these
companies. Managers in MPCs perceived their welfare facilities to be
significantly better than that perceived by their fellow-beings in IPCs.
• For the workers as well, the findings revealed that there was a statistically
significant difference in the labour welfare facilities provided to workers in IPCs
and MPCs in Goa. It was brought to light that workers in MPCs perceived the
labour welfare facilities offered to them as far superior than those perceived by the
workers in IPCs in Goa.
• Another observation made from the findings was the significant difference in the
level of job satisfaction of the respondents in IPCs and MPCs in Goa. Those
working in MPCs were at a significantly higher level of job satisfaction than those
in IPCs.
• On all the seven dimensions of the JSS the MPCs sample experienced a
significantly higher level of satisfaction than their counterparts in the IPCs.
• The job satisfaction between managers in IPCs and MPCs in Goa revealed a
statistically significant difference. Managers in MPCs experienced a significantly
higher level of job satisfaction than managers in IPCs.
238
• In the case of workers in IPCs and MPCs in Goa there was a statistically
significant difference in the job satisfaction experienced by them. Overall the
MPCs workers are significantly more satisfied with their job than their IPCs
counterparts.
• In IPCs as well as MPCs a majority of the respondents were found to be
moderately satisfied with their jobs. Except for a majority of managers in MPCs
who experienced a high level of job satisfaction, the rest of managers and workers
in these companies showed moderate levels of job satisfaction. Another
interesting aspect of job satisfaction in IPCs and MPCs was that none of the
managers and workers in MPCs experienced a low level of job satisfaction, while
in IPCs none of the workers felt a high level of job satisfaction, as for managers
very few of them showed high levels of job satisfaction.
• The study brought to light the positive significant relationship between labour
welfare and job satisfaction in pharmaceutical companies in Goa. An increase in
labour welfare is likely to increase the level of job satisfaction of employees in
pharmaceutical companies in Goa.
239