Embed Size (px)
Citation preview

Labour mobility in the Euro area during the Great
Recession
Florence Huart* Medede Tchakpalla��
This draft: June 15, 2015
Abstract
During the Euro area crisis, national disparities in labour markets widened.
According to the theory of optimum currency areas, labour mobility could be an
adjustment mechanism to shocks and help reducing regional imbalances. In real-
ity, there has recently been a perceptible increase in migration flows in Europe.
Without these migration flows, the rise in unemployment in the most-hit countries
would have been worse. In this paper, we examine the extent of these flows for
EA countries and estimate their response to unemployment and wage differentials
between these countries.
Keywords: optimum currency areas, adjustment mechanisms, labour mobility,
intra-EU migration
JEL Classification: F45, F66, F22
*LEM-CNRS (UMR 9921), Universite de Lille - Sciences et Technologies, Batiment SH2, 59655 Vil-leneuve d’Ascq Cedex, France ; [email protected]
�LEM-CNRS (UMR 9921), Universite de Lille - Sciences et Technologies, Batiment SH2, 59655 Vil-leneuve d’Ascq Cedex, France ; [email protected]
�We thank Etienne Farvaque for helpful comments. The usual disclaimer applies.
1
1 Introduction
The Euro area (EA) member countries underwent a large common shock in 2007-2008,
namely the global financial crisis. This shock caused a Great Recession in 2008-2009, and
was followed by the sovereign debt crisis in 2010, which had asymmetric effects on their
economies. Some countries, in particular the peripheric countries (Greece, Italy, Portugal,
Spain), are still struggling for economic recovery. Macroeconomic adjustments have been
slow and painful because of a lack of instruments at the country level (Eichengreen, 2014;
Gibson et al., 2014).
In this paper, we want to examine the role of labour mobility as an adjustment
mechanism in a currency union such as the Euro area. How can labour mobility help
adjustment to shocks? What is the extent of labour mobility between member countries
of the Euro area? Are migration flows going in the right direction?
In theory, according to the literature of optimum currency areas, factor mobility, and
in particular, labour mobility could be an alternative instrument to the flexible exchange
rate in adjustment to shocks (Mundell, 1961; Kenen, 1969). The mechanism is simple, at
least on paper: labour mobility could help prevent the emergence of regional problems
as long as unemployed people move from the depressed region to a booming (or less
depressed) one. As labour supply decreases in the depressed home region and increases
in the booming host region, regional unemployment disparities are expected to diminish.
In reality, the rise in unemployment in the depressed countries has been not only huge
but also persistent. Besides, a considerable increase in the dispersion of unemployment
rates has been observed in the Euro area since 2008 (European Commission, 2013). Yet,
this does not imply that labour mobility is non-existent in the Euro area nor that it has
decreased. There has just been a clearly perceptible increase in migration flows since
2009 within the Euro area. For instance, the entry of Spanish citizens in Germany was
2
about 23,000 in 2012 against an average of inflows of about 8,000 per year before the
crisis.1 This suggests focusing a little more closely on labour mobility as an adjustment
mechanism in the Euro area.
We thus study the extent of labour mobility for Euro area countries during the recent
crisis and we examine how labour mobility reacts to labour market national dispari-
ties.2 We follow the method proposed by Pissarides and McMaster (1990) and used by
Eichengreen (1993) to analyze the response of migration flows to a change in relative
unemployment and wage rates. These authors used regional data and net migration of
people of all ages, though ideally one should examine households of working age. We
overcome this shortcoming by using data on migration flows of working age population
and active foreign population from Labour Force Survey (Eurostat). We use national
data and consider Euro area countries as regions. We also use migration data directly
instead of using proxy. Our sample period is 2007-2014. In contrast, the European Com-
mission (2011) considers migrants of all ages and flows with the rest of the world over
the 1991-2009 period. In our empirical analysis, we compare flows with the rest of the
world with flows with the EU. In Jauer et al. (2014), mobility is proxied by population
change as in the European Commission (2011). In Dao et al. (2014), the adjustment of
interregional migration to regional employment shocks is treated as a residual in a system
of VAR equations as in Blanchard and Katz (1992).
The paper is organized as follows. In section 2, we explain how labour mobility can
help countries/regions adjust to macroeconomic shocks in theory. We also discuss the
drawbacks of labour mobility as an adjustment mechanism. One should actually not
underestimate the impediments to migration, the costs of migration and some additional
1Source: OECD International Migration Outlook Database.2We focus on the impact of unemployment differentials across countries on labour mobility. The
analysis of how labour mobility in turn influences labour market adjustment is beyond the scope of thispaper. We nevertheless make a short review of this subject in section 3.
3
limitations in the role of labour mobility as an adjustment mechanism to shocks. In
section 3, we review empirical insights regarding labour mobility. In section 4, we proceed
to the empirical analysis. In section 5, we conclude.
2 Theoretical considerations
In his seminal paper, Mundell (1961) advocates the role of factor mobility in a currency
union as an alternative instrument to the flexible exchange rate in adjustment to shocks.
He does not elaborate on the effects of labour mobility though. Kenen (1969) uses
Mundell’s example of a demand shock in order to explain them. Suppose that the East
produces cars and the West produces lumber products. And suppose that there is a
demand shift from cars to lumber products. The East suffers from a fall in output, a
trade deficit and unemployment while the West enjoys a rise in output, a trade surplus
but inflationary pressures (that is a rise in the prices of home-produced goods). With
labour mobility, unemployed people could migrate from East to West. As a result, labour
supply could decrease in the East and this would alleviate the unemployment problem.
In contrast, labour supply would increase in the West and this would lessen the increase
in wages and prices there. From the point of view of balance of payments, the migrants
in the West would consume: their purchases of lumber products would increase home
demand in the West and their purchases of cars would increase exports of the East to
the West, and this would reduce the trade deficit in the East and the trade surplus in
the West.3 In terms of stabilisation of output, more exports of cars to the West would
increase output in the East.
Farhi and Werning (2014) look at the impact of interregional migration on those
3Migration additionally increases the capital-labour ratio at home which lessens the required fall inreal wages for workers who stay at home (Eichengreen, 1990).
4

who stay in the depressed region in a static version of a NOEM model (New Open
Economy Macroeconomics) describing a two-region currency union with sticky prices. In
the benchmark case, it is assumed that migration causes a reduction in the demand for
non-traded goods only: as a result, there is no spillover on the situation of stayers because
the decrease in the labour supply is matched by a decrease in the labour demand (in the
non-tradable sector). In contrast, if the decline in demand is localised in the tradable
sector (and assuming that there is no home bias in the demand for traded goods), stayers
benefit from an increase in the demand for traded goods from those who left, and thus
enjoy an improvement in employment, income and consumption. The authors conclude
that the macroeconomic spillover effects depends on the degree of trade openness between
the regions within the currency union.
There are however some drawbacks in relying on labour mobility as an adjustment
mechanism to shocks. Kenen (1969) notes that the good working of this adjustment
mechanism depends on consumption patterns and methods of production in both re-
gions, and on the occupational mobility of workers. The labour-market problems cannot
be solved if the skills of workers in the car industry are not suitable to jobs in the lumber
industry. In reality, labour is not homogeneous. Similarly, the balance-of-payment prob-
lems are not easily solved if prices are not allowed to rise in the West (authorities could
act in order to prevent prices from rising). Then, the burden of adjustment in terms of
the needed change in the terms of trade would fall primarily on the East. This would
require a painful decline in output and employment. Moreover, according to the absorp-
tion approach to balance-of-payments, if one category of total domestic spending falls,
then expenditures decline, and so does output. If the multiplier is larger than one, then
real income falls more than absorption, and as a result, the current account worsens. In
this case, the fall in private consumption following the emigration of unemployed would
not be an effective instrument to attenuate the fall in output and correct the external
5

imbalance in the East.
Finally, one should not ignore the obstacles to labour mobility and the costs of mobility
for migrants. First, there are some impediments to geographical mobility across European
countries: besides linguistic and cultural barriers, there are administrative difficulties in
transferring social security rights from one country to an other, and inefficiencies in
the housing/renting markets. Some policies may also diminish incentives to move out,
such as state-aid to declining industries or regions or (extended) unemployment benefits.
Second, there are costs of migration which are borne by migrants and which depend
on their characteristics (gender, age, education, skills, household composition, housing).
There might also be some long-term negative consequences for regions of origin, such as
the loss of human capital. Eichengreen (2014) points to some good and bad in labour
mobility, and refers to the concern of brain drain about Spanish emigrants.
3 Empirical insights from the literature
In terms of incentives, individuals, who contemplate migrating, compare the gains and
the costs of migration. In principle, the latter can be reduced within a currency union as
long as countries and regions share a single currency and thus benefit from a reduction in
transaction costs. As for the gains from moving, they are increasing with the probability
of being hired and earning a higher income in the host region. For given migration
costs, the greater the difference between regional unemployment rates or wage rates,
the greater labour mobility is expected to be. Thus, the empirical method consists of
regressing the net migration rate on the relative wage and the unemployment differential.
In Pissarides and McMaster (1990), the net migration rate for each region i at each time
t is regressed on the first difference of the relative wage rate (the regional wage rate
divided by the national average wage rate) and on the unemployment ratio (the regional
6

unemployment rate divided by the national unemployment rate). Both variables enter
the equation with a one-year lag. The lagged dependent variable and regional dummies
are also included. They use pooled data for nine regions in Great Britain for the period
1961-1982. Eichengreen (1993) uses the Pissarides-McMaster model to compare how
migration responds to regional labour-market disiquilibria in Great Britain, Italy, and
the United States. He finds that for Italy, the specification of the wage variable should
be in levels and not in first difference.
In European Commission (2011), the net migration rate is based on total flows with
the rest of the world while the explanatory variables (relative unemployment and wage)
are defined by the difference between country i and the rest of the European Union (EU).
Using a panel of 22 EU countries over the 1991-2009 period, the European Commission
finds a significant relationship between net migration and the unemployment and wage
difference: an increase of one percentage point in the unemployment rate difference leads
to a decrease of 0.25 percentage point in the net migration rate (net inflows) and an
increase of one percentage point in the real wage difference leads to an increase of 0.07
percentage point in the net migration rate. There is a bias in the specification used by
the European Commission though, because emigrants from EU countries to the rest of
the world are likely to take into account labour conditions in the rest of the world too,
and not solely those in the EU. As a consequence, in our estimates, we also take into
account flows within the EU and compare the results with those obtained from flows with
the rest of the world.
Jauer et al. (2014) use data on working age population from the European Labour
Force Survey (LFS) and regional data (Eurostat REGIO database). They measure mo-
bility indirectly by the migration-induced population growth. Real wage is proxied by
GDP per capita. They compare three groups of regions at NUTS-1 and NUTS-2 levels
(Eurostat regional classification): a panel of EU27/EFTA countries, the Euro area and
7

the United States, over the period 2006-2011. For the Euro area, the estimated coefficient
on log relative unemployment rate is significant (-0.017) but that on log relative income
is not (0.005). They conclude that up to 27% of an unemployment increase may be offset
by a population change/migration.
Dao et al. (2014) also consider regional data for a sample of 21 European countries
over the period 1998-2009. They estimate a sytem of panel vector autoregressive (VAR)
equations following Blanchard and Katz (1992). Precisely, they estimate the dynamic
effects of a 1 percent decrease in regional employment on regional relative unemployment
rate, labour force participation rate, and net migration rate, the latter being treated as
a residual. In the first year following the shock, out of 100 workers who lose their jobs,
10 are unemployed, 60 drop out of the labour force and the remaining 30 migrate out of
the region. By comparison, in the United States, 20% of the the shock is absorbed by an
increase in unemployment, 20% by a decrease in participation and 60% by migration.4
All in all, labour mobility in Europe seems to react to unemployment differentials but
not to income differentials (at a regional level) or little to wage differentials (at a country
level). Our work is close to that of the European Commission (2011), but we go further
by using data on working age population instead of all ages. Our sample covers the crisis
years, and we distinguish flows with the rest of the world from those within the EU.
4In Blanchard and Katz (1992), over the period 1978-1990, the role of migration in the United Stateswas also about 60%. However, extending the sample period until 2011, Dao et al. (2014) find that labourmobility has been more than halved since the mid 1980’s. Furthermore, to control for endogeneity instate-specific labour demand shocks, they use an instrumental variable (IV) two-stage least squares(2SLS) identification with a state-specific industry share of employment (industry mix variable) as theprefered instrument. In doing so, they find that the role of migration is far lower (13% instead of 60%).
8

4 Migration flows in the Euro area
Labour mobility within Europe remains low compared with the United States, Canada
or Australia (Heinz and Ward-Warmindeger, 2006 ; Eichengreen, 2014).
The net migration rate of a country is the difference between inflows (immigration) and
outflows (emigration) expressed as a proportion of its population. During the recent crisis,
migration in the Euro area (EA), taken as a whole, has halved: net migration amounted
to 4% of total population on average between 2000 et 2007 and 2% between 2008 and 2013
(Figure 1). The picture is somethat different though if one looks at individual countries:
some countries that were host countries before the crisis (positive net migration rate)
have become origin countries (negative net migration rate). In particular, this is the case
for Ireland (a migration-induced loss of population of 4% on average during 2008-2013
against a gain of 13% in the previous period), Greece (-3% against +3%) and Portugal
(-1% against +3%). As for Spain, even if she did not record a net outflow over the period
2008-2013, there has still been a sharp decline of her net inflows (from 15% to 1%).
Note that emigrants from EA countries do not necessarily move to another country
in the Euro area. For instance, inflows of Irish people in Australia were on average 1,600
per year before the crisis (2002-2008) and average 3,500 per year during the crisis (2009-
2012), with a peak at 5,000 in 2012.5In any case, immigrants from outside the EU have
outnumbered immigrants from the rest of the EU in most EA countries, even after the
2007 EU enlargement (Anderton et al., 2012). In Figure 1, one can notice that in Italy,
the net migration rate increased from 4% to 7% of population between both periods.
This is partly due to a sharp increase in inflows of asylum seekers.
5Source: OECD International Migration Outlook Database.
9
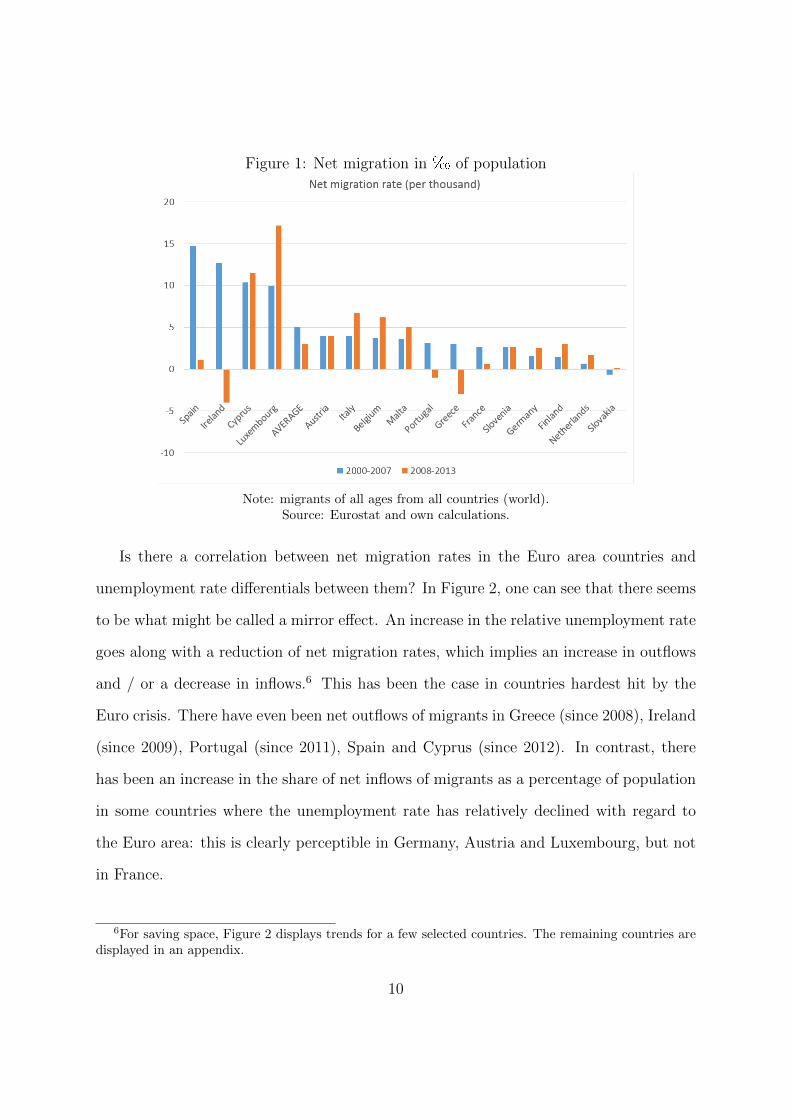
Figure 1: Net migration in� of population
Note: migrants of all ages from all countries (world).Source: Eurostat and own calculations.
Is there a correlation between net migration rates in the Euro area countries and
unemployment rate differentials between them? In Figure 2, one can see that there seems
to be what might be called a mirror effect. An increase in the relative unemployment rate
goes along with a reduction of net migration rates, which implies an increase in outflows
and / or a decrease in inflows.6 This has been the case in countries hardest hit by the
Euro crisis. There have even been net outflows of migrants in Greece (since 2008), Ireland
(since 2009), Portugal (since 2011), Spain and Cyprus (since 2012). In contrast, there
has been an increase in the share of net inflows of migrants as a percentage of population
in some countries where the unemployment rate has relatively declined with regard to
the Euro area: this is clearly perceptible in Germany, Austria and Luxembourg, but not
in France.
6For saving space, Figure 2 displays trends for a few selected countries. The remaining countries aredisplayed in an appendix.
10
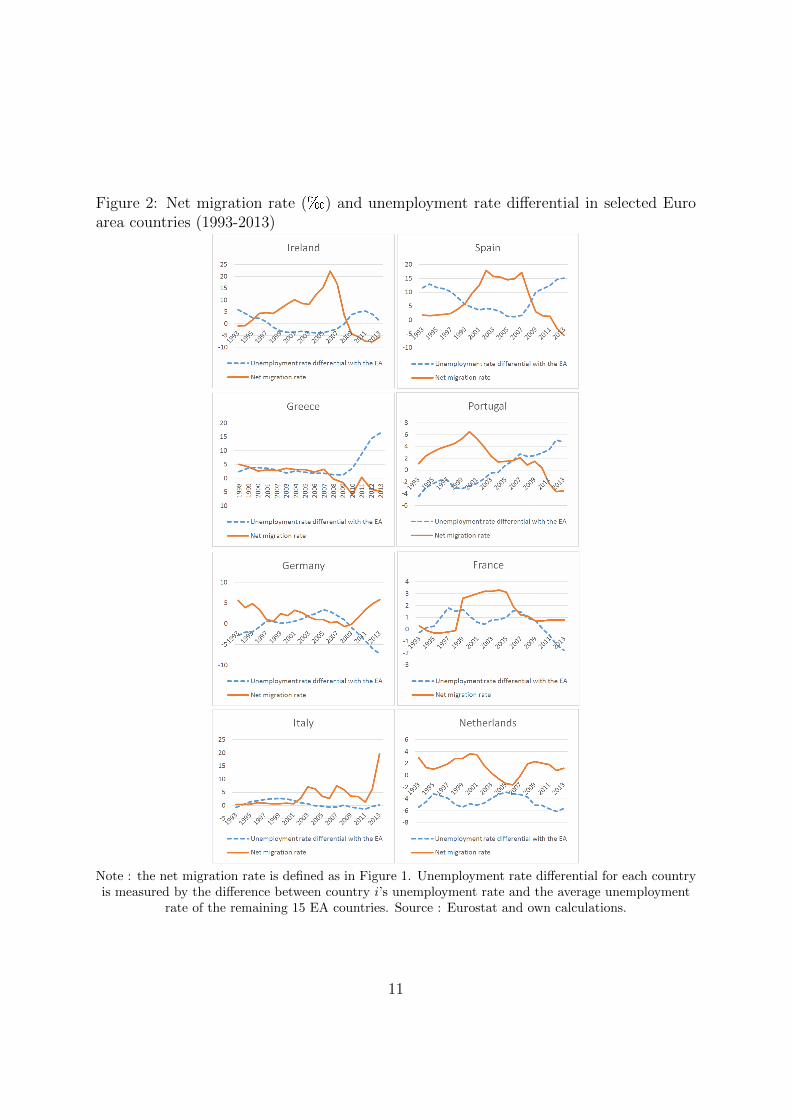
Figure 2: Net migration rate (�) and unemployment rate differential in selected Euroarea countries (1993-2013)
Note : the net migration rate is defined as in Figure 1. Unemployment rate differential for each countryis measured by the difference between country i’s unemployment rate and the average unemployment
rate of the remaining 15 EA countries. Source : Eurostat and own calculations.
11
Admittedly, the decision to migrate does not depend only on relative unemployment.
Italy is the main point of entry by sea to the EU for foreign migrants and refugees, so
that the net migration rate has increased much recently despite an unemployment rate
close to the average of the EA.
Following the method by Pissarides and McMaster (1990), we regress the net migra-
tion rate on its own lagged, the relative unemployment rate and the relative wage growth
rate:
mit = α0 + α1mit−1 + α2
(uiuEA
)t−1
+ α3∆ln
(wi
wEA
)t−1
where mit denotes the net migration rate (inflows minus outflows) of country i with
the rest of the Euro area at time t, ui/uEA is the ratio of the unemployment rate of
country i to the average unemployment rate of other EA countries, and ∆ln (wi/wEA) is
the real wage growth differential between country i and the rest of the Euro area.7
Our regression analysis is carried out for sixteen countries of the Euro area. We use the
data of the European Labour Force Survey for migration, Eurostat for the unemployment
rate, and the AMECO database of the European Commission for the real wage. For each
country, we compute net migration rate using migration flows with the EU-27. We also
consider flows with the rest of the world for checking purposes. Contrary to Pissarides
and McMaster (1990) and the European Commission (2011), where migration of people
of all ages is analysed, we consider both working age population (15-64 years old) and
active foreign population. However, due to a lack of data, choosing these kinds of flows
with the EU restricts our sample period to 2007-2013 (or 2007-2014). The real wage
variable is computed by deflating nominal compensation per employee with consumer
price indices. We use ordinary least squares for the estimates.8
7We also did the regressions with unemployment rate differentials measured as a difference (ui−uEA).Results were similar and are available upon request.
8We tried various regression methods. For choosing between the fixed effects model and the randomeffects model, the Hausman test was run. The fixed effects model was valid, but the matrix was not
12

Results with migrants of working age population in the EU-27 are reported in Table
1. As a comparison, results with migrants of all ages from all countries are also displayed.
We find that unemployment significantly affects workers migration decisions in the EU.
The estimated coefficient (-1.62) has the expected sign and is significant.9 The more
unemployment increases, and the more people leave the country, or the fewer people
move in the country. Wage differential does not significantly impact net migration. The
coefficient of lagged migration reveals some persistence. When migration flows concern
each EA country with the rest of the world, the migration response to unemployment
differentials is lower (-0.21) and close to the estimates by the European Commission
(2011). However, contrary to what the European Commission (2011) found, the response
of these net migration flows with the rest of the world to wage differentials is not significant
(and has the wrong sign). Finally, the impact of unemployment rate differentials is even
stronger if one considers foreign active migrants, be it with the EU or the rest of the
world (Table 2).
positive definite. Moreover, given our sample, there are no time fixed effects. We finally chose theordinary least squares estimation after running the Breusch-Pagan test.
9A regression over the period 2008-2013 instead of 2007-2013 gives a significant estimated coefficientof -1.67.
13
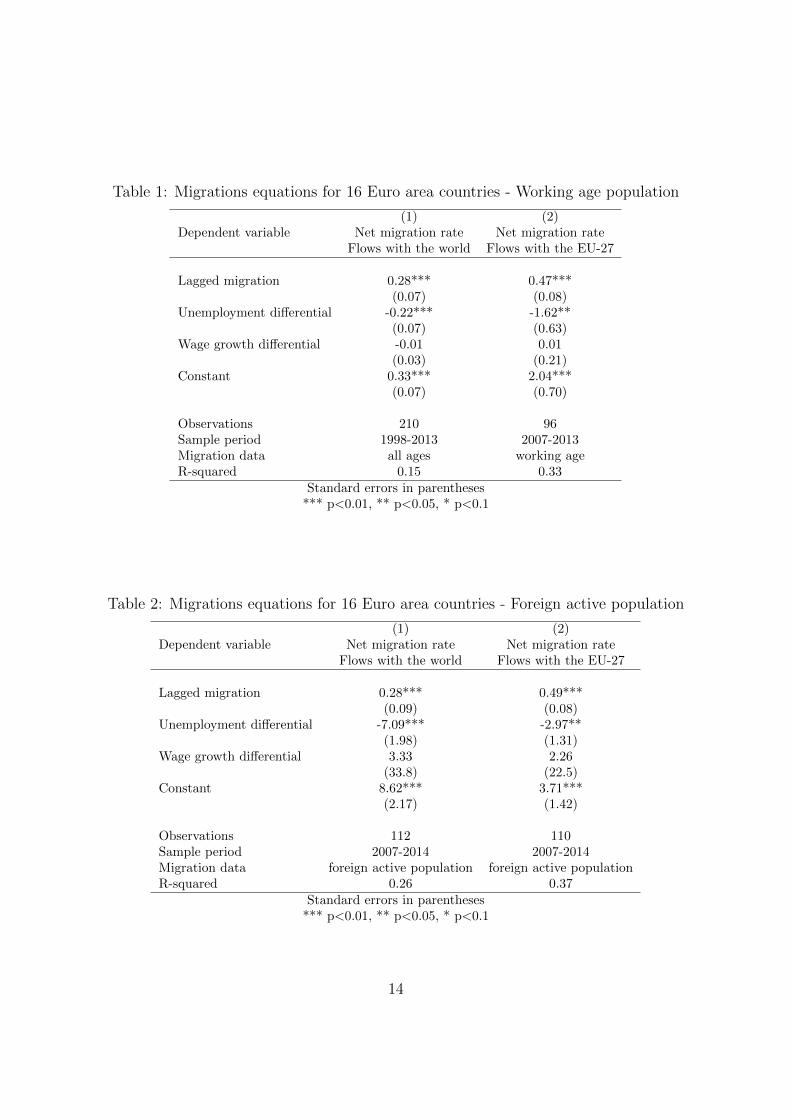
Table 1: Migrations equations for 16 Euro area countries - Working age population
(1) (2)Dependent variable Net migration rate Net migration rate
Flows with the world Flows with the EU-27
Lagged migration 0.28*** 0.47***(0.07) (0.08)
Unemployment differential -0.22*** -1.62**(0.07) (0.63)
Wage growth differential -0.01 0.01(0.03) (0.21)
Constant 0.33*** 2.04***(0.07) (0.70)
Observations 210 96Sample period 1998-2013 2007-2013Migration data all ages working ageR-squared 0.15 0.33
Standard errors in parentheses*** p<0.01, ** p<0.05, * p<0.1
Table 2: Migrations equations for 16 Euro area countries - Foreign active population
(1) (2)Dependent variable Net migration rate Net migration rate
Flows with the world Flows with the EU-27
Lagged migration 0.28*** 0.49***(0.09) (0.08)
Unemployment differential -7.09*** -2.97**(1.98) (1.31)
Wage growth differential 3.33 2.26(33.8) (22.5)
Constant 8.62*** 3.71***(2.17) (1.42)
Observations 112 110Sample period 2007-2014 2007-2014Migration data foreign active population foreign active populationR-squared 0.26 0.37
Standard errors in parentheses*** p<0.01, ** p<0.05, * p<0.1
14

5 Conclusion
The reaction of migration flows in EA countries to unemployment differentials in the Euro
area has significantly been strong during the late few years, and far stronger than what
was estimated by the European Commission (2011). This conclusion applies to migration
flows with the EU either for migrants of working age or for foreign active migrants. We
did not find any evidence of a response of migration flows to wage differentials in either
case (with the EU/rest of the world).
Labour mobility in Euro area countries has increased but remains limited. Labour
mobility, not surprisingly, is not likely to be an option when all countries are faced with
a common severe shock at the same time. Unemployed people have little incentive to
migrate, but they ultimately may choose to move to places abroad where labour market
prospects are less bad. In other respect, unemployment differentials may persist across
countries over time if industrial structure differs greatly across countries. Our work tells
how labour mobility responds to economic disparities across Euro area member countries.
However, it does not tell to what extent migration helps correcting regional disiquilibria.
The next step of our research work is to examine this latter aspect.
References
[1] Anderton R. et al (2012), “Euro Area Labour Markets and the Crisis”, Task Force
of the Monetary Policy Committee of the European System of Central Banks, ECB
Occasional Paper No. 138, October.
[2] Blanchard O. and L. Katz (1992), “Regional Evolutions”, Brookings Papers on Eco-
nomic Activity, No. 1, 1-75.
15
[3] Dao M., D. Furceri and P. Loungani (2014), “Regional Labor Market Adjustments
in the United States and Europe”, IMF Working Paper No14/26, February.
[4] Eichengreen Barry (1990), “One money for Europe? Lessons from the US currency
union”, Economic Policy, Vol.10. April, 117-87.
[5] Eichengreen B. (1993), “Labor Markets and European Monetary Unification,” in P.
Masson and M. Taylor (Eds.), Policy Issues in the Operation of Currency Unions,
Cambridge and New York, Cambridge University Press, 130-162.
[6] Eichengreen B. (2014), “The eurozone crisis: the theory of optimum currency areas
bites back”, Notenstein Academy White Paper Series.
[7] European Commission (2011), “Labour Market Developments in Europe 2011”, Eu-
ropean Economy 2/2011.
[8] European Commission (2013), “Labour Market Developments in Europe 2013”, Eu-
ropean Economy 6/2013.
[9] Farhi E. and I. Werning (2014), “Labor mobility within currency unions”, NBER
Working Paper No. 20105, May.
[10] Gibson H. D., T. Palivos and G. S. Tavlas (2014) “The Crisis in the Euro Area: An
Analytic Overview”, Journal of Macroeconomics, 39, 233-239.
[11] Heinz F.F. and M. Ward-Warmedinger (2006), “Cross-border labour mobility within
an enlarged EU”, ECB Occasional Paper No. 52, October.
[12] Jauer J., T. Liebig, J. Martin and P. Puhani (2014), “Migration as an adjustment
mechanism in the crisis? A comparison of Europe and the United States”, OECD
Social, Employment and Migration Working Papers, No. 155.
16

[13] Kenen P. (1969), “The theory of optimum currency areas: an eclectic view”, in
R.A. Mundell and A.K. Swoboda (Eds.), Monetary Problems of the International
Economy, Chicago University Press, 41-60.
[14] Mundell R. (1961), “A Theory of Optimum Currency Areas”, American Economic
Review, Vol.51, No. 4, September, 657-65.
[15] Pissarides C. and I. McMaster (1990), “Regional Migration, Wage and Unemploy-
ment: Empirical Evidence and Implications for Policy”, Oxford Economic Papers,
42, No. 4, October, 812-831.
17
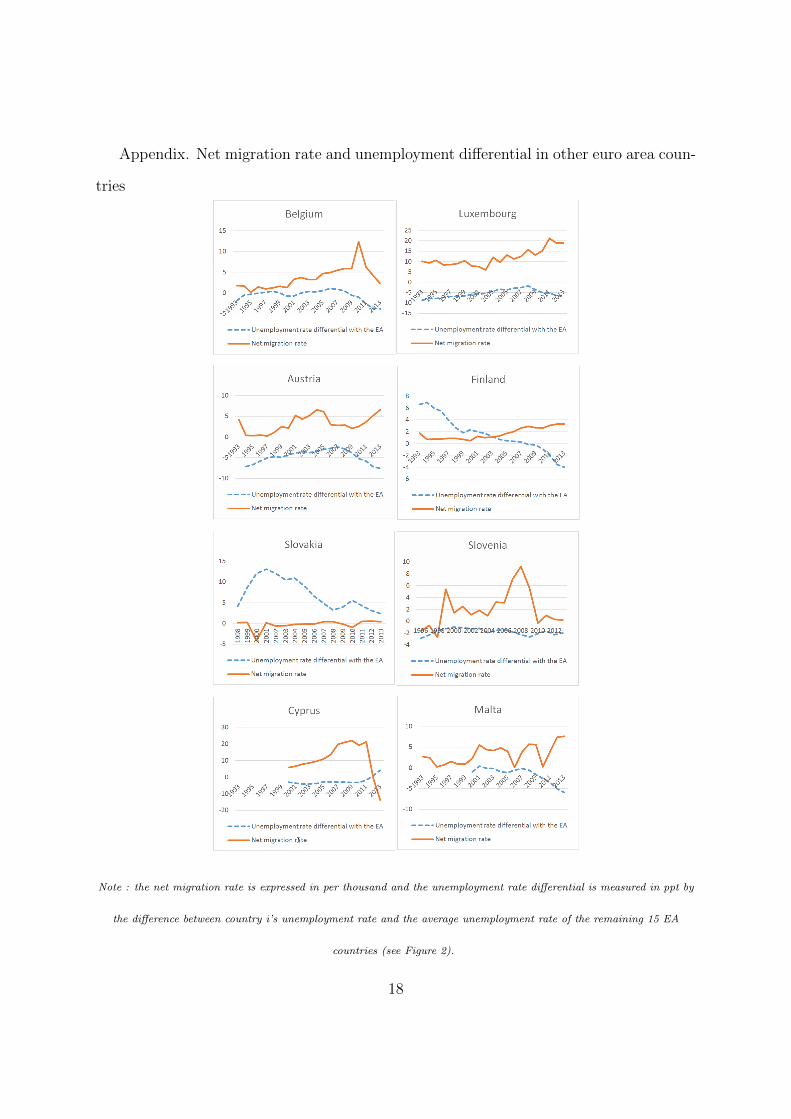
Appendix. Net migration rate and unemployment differential in other euro area coun-
tries
Note : the net migration rate is expressed in per thousand and the unemployment rate differential is measured in ppt by
the difference between country i’s unemployment rate and the average unemployment rate of the remaining 15 EA
countries (see Figure 2).
18