Embed Size (px)
Citation preview

Population-E, 66 (3-4), 2011, 473-518
Franck TEMPORAL,* Claude-Valentin MARIE,*with Stéphane BERNARD*
Labour Market Integration of Young People from the French Overseas Départements:
At Home or in Metropolitan France?
Since the mid-twentieth century, France’s overseas départements (dépar-tement d’outre-mer, DOM)(1) have seen intense migration, with criss-crossing fl ows of DOM native-borns(2) leaving and returning, alongside migrants from France and other countries. While these migration fl ows have little impact on the total population size of the DOMs, they have signifi cant effects on the population structure by age, sex and origin, as well as on youth employment and unemployment.
The salient feature of these migration fl ows is that they almost exclusively involve people of working age. They therefore alter the composition of the working-age population in the DOMs, with a strong impact in terms of educational levels, employment rates and unemployment rates of the populations concerned.
This article endeavours to identify the factors underpinning these fl ows. It focuses on selection mechanisms, actors’ strategies and new competition on the labour market. The aim is to shed light on the complexity of these migration fl ows, to take account of the dynamics at play between mobility, education and employment of DOM native-borns, to identify their conditions of integration in the place of destination and to assess how much those who return home have really benefi ted from migration.
(1) France has fi ve overseas départements: Guadeloupe, Martinique, French Guiana, Réunion and Mayotte (not studied here), which became a DOM in March 2011.
(2) The term “DOM native-born” refers to anyone born in one of the four French overseas dépar-tements considered.
* Institut national d’études démographiques, Paris.
Correspondence: Claude-Valentin Marie, Institut national d’études démographiques, 133 boulevard Davout, 75980 Paris Cedex 20 - France, Tel: +33 (0)1 56 06 21 83, e-mail: [email protected]

F. TEMPORAL, C-V. MARIE, S. BERNARD
474
After describing the size and structure of the DOM native-born population in their home départements and in metropolitan France,(3) we attempt to capture the complexity of these migration fl ows and their dynamics, their pathways and the selection processes involved. We begin by asking: Who migrates and who doesn’t? For what reasons? We then explore the following questions: Who returns home and who settles in metropolitan France? Under what conditions and for what benefi ts?
To better identify the selection mechanisms at play, we take a global approach to the DOM native-born population, regardless of where they are living (DOM or metropolitan France), rather than a “conventional” approach by territory. Our analysis is based on data from censuses conducted in the DOMs and in metro-politan France, supplemented by the very recent fi ndings of the MFV and TeO surveys (Box 1), which give insights into the dynamics at work. Special attention is paid to the younger age group (18-34), which exhibits very high net out-migration. This group is compared with an older group (aged 35-64) in order to highlight the changes which, from one generation to the next, have marked this long-standing tradition of intense migration between the DOMs and metropolitan France.
For more than 50 years, this tradition has been supported by public policies specifi cally encouraging emigration (Constant, 1987; Labache, 2007) and driven by constraints such as an inadequate education provision, slack labour markets and very high unemployment, which create insurmountable barriers to workforce integration for young people that bear no comparison with the situation in metropolitan France (ONPES, 2006).
The population of the DOMs: “here and there”I.
In the 2007 census, the four DOMS had a combined population of 1,805,000, of which 81% (or 1,460,000) were born in those départements. In-migrants(4) born in metropolitan France accounted for 10% of the total DOM population, and those born in other countries(5) made up roughly 7%. This average distribution conceals large differences between the DOMs, however. In French Guiana, the percentage of foreign-born immigrants is more than 32% (compared with less than 5% in the other DOMS), and the percentage of DOM native-borns is consequently only 55%, while the percentage of in-migrants from metropolitan France is the same as the overall average (10%). On the same date, 364,000 DOM native-borns were living in metropolitan France (Figure 1), i.e. one in fi ve of all DOM native-borns (20%).(6)
(3) Metropolitan France comprises mainland France and Corsica.
(4) In this article, “in-migrants” are all persons born outside the DOM(s) considered. They may have French or foreign nationality.
(5) On the same date, people born in another DOM or in another French overseas territory (COM) made up less than 2% of the population of those départements.
(6) Percentage of DOM native-borns living in metropolitan France among total DOM native-borns (whether living in their home département or in metropolitan France). This fi gure does not include DOM native-borns who live in a foreign country, in another DOM or in another overseas territory.

LABOUR MARKET INTEGRATION OF YOUNG PEOPLE FROM THE FRENCH DOMS
475
The population pyramid of all DOM native-borns, whether living in their home DOM, in metropolitan France or in another DOM (Figure 1), has a specifi c shape. Only a fraction of the narrowing observed at ages 20-34 can be attributed to the numbers of young DOM native-borns living abroad (Appendix A.1); it is mainly the result of past population trends, and refl ects the record numbers of births recorded in the DOMS between the 1950s and the early 1970s (Marie and Temporal, 2011). The cohorts born during that period, now aged 35-55, are very large and, despite a decline in fertility, have many children themselves. Rather than a “dent”, it is actually a “double bulge”. In the 1950s, the fertility rate in the DOM was 6 children per woman and natural increase was 3%, and even above that in Réunion (Rallu and Diagne, 2005). Fertility and birth rates then declined rapidly (Charbit and Leridon, 1980; Festy and Hamon, 1983), before stabilizing in recent years (Temporal, 2011).
Figure 1. Population pyramid of DOM native-borns by place of residence (DOM of birth, metropolitan France or other DOM) in 2007 (per 1,000)
3545 25 15 540 30 20 10 0 0 10 20 30 405 15 25 35 45
Share of age group with respect to total DOM-born population (per 1,000)
Share of age group with respect to total DOM-born population (per 1,000)
100+
95-99
85-89
75-79
65-69
55-59
45-49
35-39
30-34
20-24
90-94
80-84
70-74
60-64
50-54
40-44
25-29
15-19
10-14
05-09
00-04
AgesMales Females Ined 2011
Native-borns in home DOM Native-borns in met. France Native-borns in other DOM
Source: INSEE, population census 2007; authors’ calculations.
While one DOM native-born in fi ve lives in metropolitan France, the percentage varies considerably by département, age, gender, educational level and employment status, as indicated by the detailed breakdown of the census data (DOMS and metropolitan France). In the working-age population (ages 15-64), almost one-third of working-age adults from the Caribbean (Guadeloupe and Martinique) are living in metropolitan France, one-quarter of those from French Guiana and one-fi fth of those from Réunion. Proportions appear to be even higher for the younger group (ages 18-34), among whom 36% of native-borns from Guadeloupe,

F. TEMPORAL, C-V. MARIE, S. BERNARD
476
Figure 2. Share of DOM native-borns living in metropolitan France, per 100 native-borns, by age group and selected characteristics
Percentage
0
35
25
20
15
10
50
5
45
30
40
Ined 2011
Age groupBelow 15
65+35-39
30-3455-59
45-4920-24
60-6425-29
50-5440-44
15-19
Réunion
Guadeloupe
French Guiana
Martinique
2A. By DOM of birth
Percentage
0
35
25
20
15
10
50
5
45
30
40
Ined 2011
Females
Males
2B. By sex
Age groupBelow 15
65+35-39
30-3455-59
45-4920-24
60-6425-29
50-5440-44
15-19
Population: DOM native-borns living in their home DOM and in metropolitan France.Source: INSEE, 2007 population census; authors’ calculations.
LABOUR MARKET INTEGRATION OF YOUNG PEOPLE FROM THE FRENCH DOMS
477
Figure 2 (cont’d). Share of DOM native-borns living in metropolitan France, per 100 native-borns, by age group and selected characteristics
Age groupBelow 15
65+35-39
30-3455-59
45-4920-24
60-6425-29
50-5440-44
15-19
Age groupBelow 15
65+35-39
30-3455-59
45-4920-24
60-6425-29
50-5440-44
15-19
Percentage
0
40
35
30
25
20
50
10
15
5
45
Ined 2011
All DOM native-borns
Degree in higher education
Few or no qualifications
2C. By educational level
Percentage
0
40
35
30
25
20
50
10
15
5
45
Ined 2011
Active in employment
Students
Unemployed
All DOM native-borns
2D. By employment status
Population: DOM native-borns living in their home DOM and in metropolitan France.Source: INSEE, 2007 population census; authors’ calculations.

F. TEMPORAL, C-V. MARIE, S. BERNARD
478
33% of those from Martinique, 30% of those from French Guiana and 19% of those from Réunion were living in metropolitan France in 2007. This breakdown by age also refl ects the past and more recent migration history of DOM native-borns (Domenach and Picouet, 1992). Indeed, in every period, most out-migrants leave at ages 15-25 (Appendix A.2). This age group is also the most numerous currently living in metropolitan France (Figure 2A). Numbers fall after age 30, when returns outnumber departures.
An examination of the percentages(7) by sex shows that men aged 25-34 more frequently move to metropolitan France than women of the same age (Figure 2B), confi rming the research based on the population censuses of 1999 and 2006 (Marie and Temporal, 2011; Monteil and Rallu, 2010), which already highlighted extremely high net out-migration among native-borns aged 15-34, three-fi fths of whom were men (32,000 men and 22,000 women).
For young DOM native-borns, employment and education have always been important reasons for migrating (Appendix A.2), giving rise to strong selection by educational level and employment status. There is even a double selection (at depature and return), which gives a specifi c structure to the DOM-born population living in metropolitan France: a far higher proportion of DOM native-borns with the highest educational level and in employment move to metropolitan France and live there long-term than DOM native-borns with low or no educational qualifi cations and/or who are unemployed (Figures 2C and 2D). In 2007, 38% of DOM native-borns with higher education were living in metropolitan France, compared with only 15% of those with low or no educational qualifi cations.(8) The selection is even stronger in the younger
(7) Share of DOM native-borns in metropolitan France among total native-borns (whether living in their home département or in metropolitan France).
(8) No qualifi cation, primary certifi cate (CEP) or lower secondary certifi cate (BEPC).
Table 1. Percentage of DOM native-borns living in metropolitan France per 100 native-borns aged 18-34 by educational level and employment status, 2007
Educational level Employment status
OverallNo qualifi -cations
Lower secon-dary
Upper secon-dary
Higher educa-
tion degree
In employ-
ment
Un-employed
Student
Guadeloupe 22.4 34.3 40.0 50.2 47.9 20.3 33.0 36.3
Martinique 19.6 27.8 36.8 48.1 42.4 19.4 30.6 33.1
French Guiana 15.6 28.7 39.3 48.2 37.3 23.9 29.8 29.6
Réunion 9.5 17.7 23.5 34.0 26.6 9.7 22.7 19.2
Overall 14.4 24.7 32.1 42.7 36.3 14.8 28.1 27.1
Population: DOM native-borns living in their home DOM and in metropolitan France.Source: INSEE, 2007 population census; authors’ calculations.

LABOUR MARKET INTEGRATION OF YOUNG PEOPLE FROM THE FRENCH DOMS
479
group (ages 18-34): 43% of those with higher education in this age group live in metropolitan France, and only 14% with the least education (Table 1).
Even more signifi cantly, in the younger group, a similar number of native-borns with higher education from Guadeloupe, Martinique and French Guiana live in metropolitan France as in their home département. The general increase in educational levels in the overseas départements has had the positive effect of a steady increase in young DOM native-borns entering higher education in their home DOM or in metropolitan France. While the local supply of university courses has considerably increased, it is concentrated at undergraduate level, leading many students who wish to pursue postgraduate study to enrol at universities in metropolitan France. That situation partly explains the high percentage of highly educated young DOM native-borns in metropolitan France.
There is an equally strong selection by employment status. Despite the distances, more than one-third (36%) of young DOM native-borns (aged 18-34) who are employed live in metropolitan France. The percentages break down as 48% of Guadeloupeans, 42% of Martiniquans, 37% of Guianese, and 27% of Réunionese. Altogether in 2007, across all age groups, 34% of DOM native-borns in employment were living in metropolitan France, compared with only 13% of the unemployed. Those fi gures refl ect the reality of local job markets.
Box 1. Data sources (RRP07, MFV, TeO)
Three complementary data sources were used for this study: the detailed fi les from the 2007 census (based on annual census surveys) of the DOMS and metropolitan France; the Migration, Family and Ageing survey (Migrations, Famille and Vieillissement, MFV); and the TeO survey (Trajectories and Origins: Survey on Population Diversity in France). The population censuses provide fi gures for all the DOM native-borns living in France, whether they are living in their home département or in metropolitan France. The MFV survey usefully rounds out that information. Designed and prepared by Claude-Valentin Marie (lead researcher), Didier Breton, Franck Temporal and Stéphanie Condon (Breton et al., 2009), the MFV was conducted in 2009-2010 by INED in partnership with INSEE in the four DOMs, to record the socio-demographic changes underway and their potential impact on the future of those départements (Marie, 2011). Three research themes were chosen: changes to family life; the implications and consequences of migration; and the effects of population ageing on inter-generational solidarity (Marie et al., 2011). The TeO survey was conducted jointly by INED and INSEE between September 2008 and February 2009 in order to shed light on the social trajectories and living standards of migrants and their descendants in French society. The aim was to verify the effects of migrant origins on access to rights, and to goods and services in society, and to identify any inequalities between individuals and/or population groups. It covers the population aged 18-60 living in metropolitan France, including DOM native-borns and their descendants (Beauchemin et al., 2010; Borrel et al., 2010).By combining the weighted data from the MFV and TeO surveys, both representative of DOM native-borns living in their home départements and in metropolitan France, it was possible to constitute cohorts of DOM native-borns and to monitor their migration patterns at different ages. The cohorts of DOM native-borns were based on years of birth. Ages at departure and return provided the information used to describe migration trajectories.

F. TEMPORAL, C-V. MARIE, S. BERNARD
480
Despite their apparent dynamism,(9) the DOM economies do not provide enough jobs for the working-age population, and unemployment rates are much higher than in metropolitan France, especially among young people.(10)
Selection at departure and returnII.
Now that the population distribution between the DOMS and metropolitan France is known, two questions arise: what are the factors that infl uence the labour market integration of young DOM native-borns, and how does the decision or opportunity to move to and stay long-term in metropolitan France arise in their life course? By exploring these questions, we are in fact seeking to address the issue of the double selection that occurs within this population, at departure and then at return. Who migrates and who doesn’t? For which reasons? And of those who decide to migrate, who returns and who doesn’t?
1. Who migrates and who doesn’t?
The MFV survey gives new information about the migration histories of people living in the DOMs which provides a useful complement to the census data. It enables us to divide these native-borns into three groups: those who have never left the département where they were born; those who have only left on short trips; and those who have migrated in the past (for at least six months) and have returned to settle in the département (returned native-borns). The census of metropolitan France includes the number of DOM native-borns who live there. By combining the two sources (MFV/census), we can assess – from a completely new angle – the importance of migration in the life courses of DOM native-borns (Box 2). Rather than a territory-based approach, we examine all DOM native-borns, both those living in metropolitan France and those living in the département where they were born.
These fi gures reveal the scale of migration by DOM native-borns. Only a small minority has never left the département where they were born: one in six on average (Table 2). The percentage is much smaller in the Caribbean (9% and 10%) than in French Guiana (16%) and Réunion (22%).
Conversely, a high percentage have lived or are still living long-term outside their département. This is the case for more than half of Caribbeans (56% from Guadeloupe and 53% from Martinique): 43% have returned and 57% are currently living in metropolitan France. A total of 47% of DOM native-borns aged 18-79 have experienced long-term migration.
In the younger group (aged 18-34), the percentage is slightly lower (Table 3). We can safely assume that some of the youngest sub-group (aged 18-24) will
(9) Job creation in the DOMs outpaced metropolitan France in the 2000s (Parain, 2011).
(10) According to the 2009 employment survey, ILO-defi ned youth unemployment at ages 15-24 was 61% in Martinique, 57% in Guadeloupe, 52% in Réunion and 40% in Guiana, compared with 24% in metropolitan France.

LABOUR MARKET INTEGRATION OF YOUNG PEOPLE FROM THE FRENCH DOMS
481
leave in the future. In any case, the percentage is still high (42%) and illustrates the extent of mobility in that group too.
We also observe substantial differences between the départements. Réunion has the smallest percentage of young native-borns (aged 18-34) who have experienced migration. Only one-third of young Réunionese have left their island for more than six months, (including those who have returned and those who have settled in metropolitan France), compared with half of Caribbeans and just over two-fi fths of Guianese.
As well as these differences by territory, there are even bigger divergences in terms of educational level: the higher it is, the larger the percentage of long-term migrants (Figure 3). While just one-quarter of native-borns aged 18-34 with low or no educational qualifi cations have experienced long-term migration, two-thirds of those with higher education have migrated (ranging from 56% in Réunion to 77% in Guadeloupe).(11) For intermediate qualifi cations, the
(11) For those with the least education, the percentages range from 19% to 35% in the same départements.
Box 2. Four groups of DOM native-borns in terms of migration experience
From the DOM native-born population – aged 18-79 living in the département where they were born – provided by the 2007 census, the MFV survey proposes a percentage breakdown into three groups based on migration experience: DOM native-borns who have never left the département; native-borns who have left their département for short trips (less than six months); and returned native-borns. The survey defi nes “returned native-borns” as individuals who left their département for at least six consecutive months before returning to settle in the département. DOM native-borns who reported having left their DOM for less than six months are not considered here to be migrants. Those short stays are recorded, but are not described in detail. They encompass a wide variety of situations in terms of reasons for travel (holiday, language study, training, internships, etc.), length (from less than a week to several months) and destination (metropolitan France, country in the region, other country, other DOM). In each of the DOMS, this is the biggest group. Among DOM native-borns who, at the time of the survey, reported never having left their département even for a few days, some, particularly the youngest, will probably leave in the future, whereas others will certainly never leave. If we take the population of DOM native-borns living in their département as indicated by the censuses and divide them into these three groups according to the results of the MFV survey, and then add them to the numbers living in metropolitan France (also indicated by the censuses of metropolitan France), we can ascertain the status of all DOM native-borns, regardless of where they live. By redistributing that number across a total of 100%, we can estimate the size of each of the four sub-populations. Using this method, the estimated population of DOM native-borns aged 18-79 is 1,257,000, of which 410,700 are aged 18-34.In this study, the term “long-term migrants” comprises all returned DOM native-borns who migrated in the past and all those currently living in metropolitan France. They make up 47% of the population of DOM native-borns aged 18-79, i.e. 594,000 individuals in that age range.

F. TEMPORAL, C-V. MARIE, S. BERNARD
482
percentages are 44% of those with upper secondary education and 39% of those with vocational lower secondary education.
Concentrating on native-borns who have never left their département, we observe that they have an extremely vulnerable socioeconomic profi le and stand out sharply from all the other groups, with a very low educational level, a very high unemployment rate, a high percentage living below the poverty line, etc. (Marie et al., 2011). This suggests that their serious economic and social diffi culties limit their employment opportunities, ruling out any prospect of mobility, even for a short trip.
2. Who returns and who doesn’t?
Education thus appears to be a decisive factor in migration by young DOM native-borns. The higher their educational qualifi cations, the more likely they are to experience long-term migration. But how many of them settle in metropolitan France and how many return home?
Table 2. Migration experience of DOM native-borns aged 18-79 (%)
Native-borns who have never left
Native-borns who have left for short visits
Returned native-borns
Native-borns in
metropolitan France
All native-borns
Guadeloupe 10.0 34.1 24.1 31.9 100.0
Martinique 9.0 38.3 22.0 30.7 100.0
French Guiana 16.4 42.1 15.4 26.2 100.0
Réunion 21.8 39.0 21.8 17.4 100.0
Overall 15.1 37.7 22.1 25.2 100.0
Population: DOM native-borns living in their home DOM and in metropolitan France.Sources: INED-INSEE, MFV 2009-2010 and 2007 population census.
Table 3. Migration experience of DOM native-borns aged 18-34 (%)
Native-borns who have never left
Native-borns who have left for short visits
Returned native-borns
Native-borns in
metropolitan France
All native-borns
Guadeloupe 8.7 38.2 16.0 37.1 100.0
Martinique 10.1 41.8 14.3 33.8 100.0
French Guiana 17.3 40.0 12.4 30.3 100.0
Réunion 25.7 40.4 14.7 19.2 100.0
Overall 17.9 40.0 14.6 27.5 100.0
Population: DOM native-borns living in their home DOM and in metropolitan France.Sources: INED-INSEE, MFV 2009-2010 and 2007 population census.

LABOUR MARKET INTEGRATION OF YOUNG PEOPLE FROM THE FRENCH DOMS
483
A combination of survey and census data is also highly instructive here. It shows fi rst that more young migrants, irrespective of their qualifi cations, live in metropolitan France than have returned to their home département. Here again, the breakdown depends on educational level. Among DOM native-borns aged 18-34 who have experienced long-term migration, those with the lowest qualifi cations tend to return home more (41%) than those with higher education (34%).(12) The smaller percentage (26%) of those with upper secondary education who have already returned refl ects the fact that many are still in education.
While the two sources (MFV and censuses) can be combined in order to estimate the percentage of returnees in the total population of DOM native-borns who have experienced long-term migration, the MFV data permits a more specifi c analysis of the factors that might have infl uenced return migration in each of the départements. A fi rst statistical model(13) analysing the factors that infl uence whether a migrant returns or not was constructed for this purpose (Appendix Table A.3.1). It is applied here to young native-borns living in their département aged 26-34, an age by which most have completed their education and when return migrants are the most numerous.
(12) The percentage is 36.5% for holders of a vocational lower secondary qualifi cation.
(13) Some binary logistic regressions that complement the descriptive analysis are shown in the Appendix.
Figure 3. Migration experience of DOM native-borns aged 18-34 by educational level (%)
Percentage
0
70
50
40
30
20
100
10
90
60
80
Ined 2011
No qualificationsHigher education Lower secondaryUpper secondary
Non-migrant native-borns Long-term migrants
66.7
44.139.3
24.5
33.3
55.960.7
75.5
Population: DOM native-borns living in their home DOM and in metropolitan France.Sources: INED-INSEE, MFV 2009-2010 and 2007 population census.

F. TEMPORAL, C-V. MARIE, S. BERNARD
484
Family social capital seems to play a major role here. The parents’ social category appears to be the main factor infl uencing long-term emigration followed by a return home. The children of persons in higher-level occupations are much more likely to return home than those with a parent who is a clerical/sales worker (odds ratio of 5.6). The same is true when the parent is a farmer or manual worker. The migration experience (past or current) of close relatives(14) is another factor infl uencing out-migration followed by a return. The odds ratio is two or three times higher in this kind of family than in a family where no one has experienced migration.
Sex and age have a smaller effect. Men are slightly more likely than women to return (OR = 1.4) and those aged 30-34 slightly more likely than those aged 26-29 (OR = 1.4). Last, for equivalent characteristics, there are no substantial differences between the overseas départements.
When applied to older native-borns (35-64) living in the DOMS, the same model yields practically the same probabilities of returning, although with some differences with respect to the younger groups. Having parents in a high social category has a positive impact, although its infl uence is smaller for the older group (OR = 1.8). This seems to indicate that, far from becoming democratized, current mobility has accentuated the selection of DOM native-borns aged 26-34 who migrate and those who return. Having parents who belong to higher social categories has an even bigger positive impact on young people today than on their elders. The Family Survey of 1997 in Réunion reached the same conclusions (Dion and Bellot, 2004). Furthermore, for the older group (aged 35 and over) more than for young people, being a man strongly increases the probability of returning (OR = 2.7). This is explained by the large-scale out-migration of men from previous cohorts to perform their military service (now abolished).
An aspiration for mobility that remains high among young DOM native-borns
In addition to information on the determinants of mobility, the MFV survey also sheds light on the place of mobility in the life plans of young native-borns living in their DOM, through the intentions and wishes they express. Half(15) of DOM native-borns aged 18-34 said they would be willing to leave (or to leave again) if they were offered a job somewhere else.(16) The percentage varies considerably between départements: it reaches 67% in Martinique, 58% in Guadeloupe and 56% in French Guiana, but only 41% in Réunion.
(14) “Close relatives” refers to the spouse, parents and siblings of the MFV respondent.
(15) This fi gure only covers the answers “Yes” and “No”. The indefi nite answer “Don’t know” was excluded to enhance readability. Of all young DOM native-borns aged 18-34 surveyed in the MFV about their employment mobility intentions, 49.1% said they were willing to leave their département, 48.4% said they were not and only 2.5% said they didn’t know.
(16) The question was worded: “If you had a job opportunity (or a more interesting job opportunity for people already in employment) outside the département, would you be willing to leave?”.
LABOUR MARKET INTEGRATION OF YOUNG PEOPLE FROM THE FRENCH DOMS
485
The youngest (aged 18-24) are the most determined: two-thirds say they are willing to leave, and men more than women. University and secondary students are more willing than others, with three-quarters saying yes. In contrast, family responsibilities seem to discourage mobility. People who are not in a relationship and do not have children are more enthusiastic than those already committed to family life. For the majority of those who say they are willing to leave, departure is conditional upon the possibility of returning (57.5%); very few consider migrating permanently (8%). Last, more than three-quarters (77%) choose metropolitan France; only a minority envisage moving to another country (12%).
The typical profi le of a migration candidate is therefore a young man, single with no children, who has an educational qualifi cation, and who plans to return home after migrating. With equivalent characteristics, young Martiniquans are the most attracted by this experience, followed by young Guianese and Guadeloupeans and, to a lesser extent, young Réunionese (Appendix Table A.3.2). We note also that returnees are even more willing to migrate again than those who have never left the département for a long period (OR = 1.4). Those who have an educational qualifi cation, especially an upper secondary qualifi cation or a degree in higher education, are also more interested in leaving than those with no qualifi cations. Being employed or not also affects decisions to leave. Overall, working-age people in employment report being less willing to leave their département than the unemployed (OR = 0.7). The descriptive analysis shows that students most frequently express the desire to leave. For the unemployed, the situation in Réunion differs from that of the other three DOMs. While in the Caribbean and French Guiana, more unemployed people report wanting to leave than the population average and than employed people, the pattern is reversed in Réunion.(17)
Those who wish to return home
It is interesting to compare the aspirations of those young native-borns living in their department with the intentions of those who were living in metropolitan France at the same date. Among DOM native-borns who expressed a fi rm intention,(18) 45% said they wanted to go and live one day in the département where they were born.(19) The data from the TeO survey, which offers new information on this point, do not show major differences by sex (47% of women
(17) This result is confi rmed by the statistical model on unemployed DOM native-borns aged 18-34 (Appendix Table A.3.2): young unemployed people from the Caribbean and Guiana much are more likely to report an intention to leave than unemployed Réunionese.
(18) Here again, only the responses “Yes” and “No” were retained, while the indefi nite responses “Maybe” and “Don’t know” were excluded from the calculation. Of all the young DOM native-borns aged 18-34 surveyed in the TeO survey about their intention to return to their home département, 34.9% said “Yes”, 43.1% said “No”, 17.8% said “Maybe” and 4.2% said “Don’t know”.
(19) The question was “Do you think one day you will go to live in another DOM, a TOM or a country other than France?”. The “yes” answers concerned only native-borns aged 18-34 who said they wish to return to their home département.

F. TEMPORAL, C-V. MARIE, S. BERNARD
486
and 43% of men) or age. Similarly, educational level does not seem to be a strong discriminating factor: slightly more of those with an upper secondary qualifi cation report intending to return home (48%), whereas slightly fewer of those with a lower secondary qualifi cation aspire to do so (41%).
Conversely, family status has a positive infl uence on the aspiration to return: 53% of people in a couple with children wish to return, versus only 37% of single people with no children. Employment status also has an infl uence. Individuals who have been employed the longest since they arrived have less intention of returning than those who have spent less time in employment.
Selection in migration: who benefi ts?III.
The previous results illustrate the selection that occurs: those who move to metropolitan France are young, highly educated and employed. The conditions of integration of young DOM native-borns, in their DOM and in metropolitan France, by educational level need to be assessed in order to better understand the dynamics at work. Does migration bring benefi ts? Does returning home benefi t everyone equally, irrespective of educational level? Is this also the case for those who settle long-term in metropolitan France?
1. Do DOM native-borns benefi t from out-migration?
DOM native-borns in metropolitan France are better educated than those who stay home
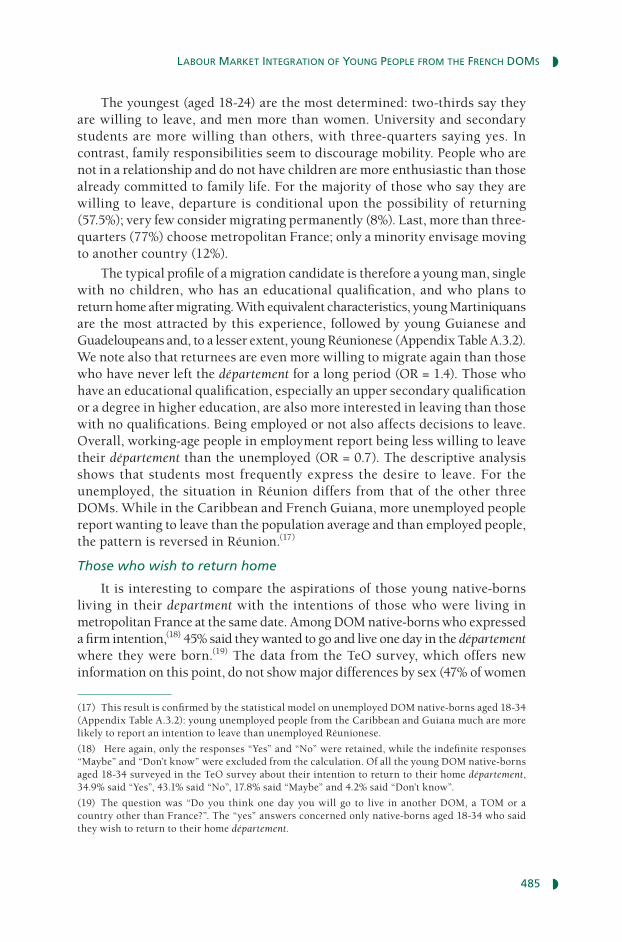
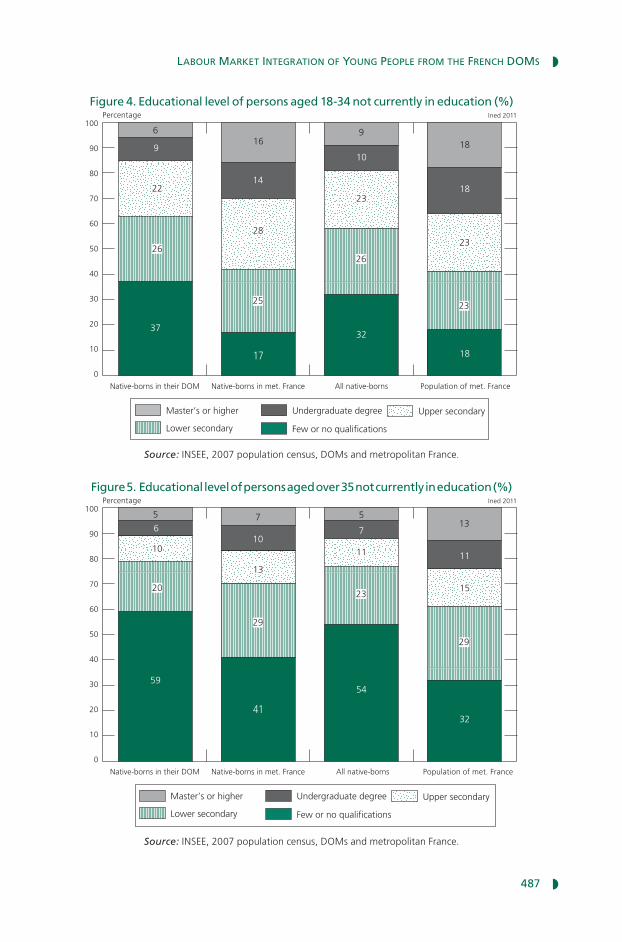
The educational level of DOM native-borns in metropolitan France is on a par with the national average. Their distribution by educational level is comparable to the metropolitan average and therefore much higher than that of their peers living in the département. The youngest(20) are even better off (Figures 4 and 5). Closer to the national average, they differ more strongly from those of the same age who still live in the home département: they twice as frequently have a degree in higher education and half as frequently have low or no qualifi cations. The oldest (aged 35 and over) more frequently have a degree in higher education than their peers living at home but less than the national average.
For all DOM native-borns not currently in education, we observe above all a sharp increase in educational level in the youngest group, regardless of where they live. A full 19% of those aged under 35 have a degree in higher education (Figure 4) compared with only 12% of their elders (Figure 5). However, we also fi nd that these increases have benefi ted metropolitan France much more than their home territories. Some 58% of young DOM native-borns in metropolitan France have at least an upper secondary level compared with
(20) This is the population who are not currently in education. Those who reported the status of “student” on the census date were excluded from the analysis.
LABOUR MARKET INTEGRATION OF YOUNG PEOPLE FROM THE FRENCH DOMS
487
Figure 4. Educational level of persons aged 18-34 not currently in education (%)Percentage
28
0
70
50
40
30
20
100
10
90
60
80
Ined 2011
Population of met. FranceNative-borns in their DOM All native-bornsNative-borns in met. France
Master’s or higher
Lower secondary
Undergraduate degree
Few or no qualifications
616
37
17
32
18
918
26
2223
23
18
10
14
9
25
26
23
Upper secondary
Source: INSEE, 2007 population census, DOMs and metropolitan France.
Figure 5. Educational level of persons aged over 35 not currently in education (%)Percentage
Population of met. FranceNative-borns in their DOM All native-bornsNative-borns in met. France
13
0
70
50
40
30
20
100
10
90
60
80
Ined 2011
Master’s or higher
Lower secondary
Undergraduate degree
Few or no qualifications
5 7
59
41
54
32
513
20
10 11
15
11
710
6
29
23
29
Upper secondary
Source: INSEE, 2007 population census, DOMs and metropolitan France.

F. TEMPORAL, C-V. MARIE, S. BERNARD
488
37% of those living in their home département (Figure 4). Young native-borns in metropolitan France now have an educational level comparable to the metropolitan average, which was not the case for their elders. The TeO survey shows that 88% of DOM native-borns with higher education and living in metropolitan France attained their qualifi cations during migration. According to the MFV, this is the case for 47% of returned DOM native-borns. These results highlight the importance for DOM native-borns of migration for educational purposes. Alongside the overall increase in the educational level of the youngest DOM native-borns, there is a double selection – at departure and then at return – to the detriment of the overseas départements: only those best equipped to enter the labour market settle long-term in metropolitan France. An overview of their employment conditions in the DOM and in metropolitan France will shed light on the mechanisms at work.
DOM native-borns in metropolitan France fi nd jobs more easily
Since the early 1960s, employment has been one of the main drivers of out-migration and, above all, of the long-term settlement of DOM native-borns in metropolitan France (Marie and Rallu, 2004). According to the 2007 census, the working-age population (aged 15-64) living in metropolitan France are now more frequently in employment and less affected by unemployment than DOM native-borns who have remained in or returned to their départements. The employment rate of DOM native-borns in metropolitan France is 70% (74% for men and 66% for women), which is higher than the metropolitan average (64% in total, 68% for men and 59% for women). Conversely, for DOM native-borns who remained in or returned to their départements, the employment rate is barely above 45% (50% for men and 41% for women). The differentials are the same for unemployment, which affects only 11.5% of DOM native-borns in metropolitan France, compared with 31% for those living in their DOM and 11% for the metropolitan population as a whole. These inequalities of access to employment by sex and place of residence are compounded by inequalities by age and educational level.
An examination of divergences by place of residence, with equivalent educational qualifi cations, is equally instructive. The most paradoxical result is that DOM native-borns with low or no educational qualifi cations have a higher employment rate in metropolitan France than the national average. They therefore stand out very strongly from those with the same educational level who remained or returned home:(21) the difference is almost 25 percentage points, with the biggest divergence in the 45-55 age group (Figure 6A). This is confi rmed by available data on unemployment. For the total working-age population (aged 15-64) with a low educational level, the average differential in the unemployment rate is 19 points in favour of native-borns living in
(21) We will see in Section III.2 that the more favourable situation for DOM native-borns in metropolitan France can be explained partly by this selection effect.

LABOUR MARKET INTEGRATION OF YOUNG PEOPLE FROM THE FRENCH DOMS
489
metropolitan France. For the youngest group (aged 20-24), it is 27 points.(22) The unemployment rate of young DOM native-borns in metropolitan France is thus in line with the national average, well below the rates in the four départements (Figure 6C), where the situation is particularly diffi cult for the least educated in that age group: more than 60% of economically active persons in this category were unemployed in 2007!
For DOM native-borns with higher education, the situation is completely different. Regardless of where they live, their employment rates are always very high (Figure 6B) and close to the national average. The employment curves for men and women, which sometimes converge, attest to this. Only the youngest group (aged under 30) have results below the metropolitan average; but the discrepancies are small and diminish with age. These results indicate fi rstly the successful labour market integration of the best educated DOM native-borns in metropolitan France. While they seem slightly more vulnerable to unemployment before age 35 (11.3% compared with a metropolitan average of 8.5%), this is no longer the case at older ages. Compared with those with the same educational level living in their DOM, the difference is small (Figure 6D). While the latter have slightly more diffi culty integrating the workforce (15.6% are unemployed), their situation is completely different from the virtual labour market exclusion experienced by those with no educational qualifi cations. An indication, if that were needed, that education continues to offer the best protection against unemployment everywhere (in metropolitan France and even more so in the DOMs).
The advantage of moving to metropolitan France is clearer for those with an intermediate qualifi cation and even more so for young people. Between ages 20 and 24, the employment rate of DOM native-borns with a lower secondary qualifi cation living in metropolitan France is 25 points higher than that of DOM native-borns with the same educational level living in their départements. The same applies to holders of an upper secondary qualifi cation, although the gap is smaller.
For DOM native-borns, the advantage of living in metropolitan France seems paradoxically to be the highest for those with the least education, even though, in relative terms, they are the group that move there the least (Table 1). In metropolitan France, they are less affected by unemployment than those living in their départements, and the gap widens as educational level decreases. The differential is 29 points for young adults (aged 20-34) with low or no qualifi cations; 24 points for those with a lower secondary qualifi cation; 16 points for those with an upper secondary qualifi cation; and only 4 points for those with a degree in higher education. The differential with the least educated is largest among Guadeloupeans: more than 31 points; it is 28 points among Réunionese, 24 points among Guianese and only 19 points among Martiniquans.
(22) The gap narrows to 19 points after age 25 and remains at that level until retirement age.

F. TEMPORAL, C-V. MARIE, S. BERNARD
490
Figures 6. Employment and unemployment rates of DOM native-borns by age, sex, educational level and place of residence (%)
Percentage
0
70
50
40
30
20
100
10
90
60
80
Ined 2011
Age group
35-3930-34
55-5945-49
20-2460-64
25-2950-54
40-44 15-19
Native-born women in their DOM
Native-born men in met. France
Native-born men in their DOM
Native-born women in met. France
6A. Employment rate – No or few qualifications
Age group
35-3930-34
55-5945-49
20-2460-64
25-2950-54
40-4415-19
Percentage
0
80
70
60
50
40
100
20
30
10
90
Ined 2011
Native-born men in met. France
Native-born women in met. France
Native-born women in their DOM
Native-born men in their DOM
6B. Employment rate – Degree in higher education
Population: DOM native-borns living in their home DOM or in metropolitan France.Source: INSEE, 2007 population census.

LABOUR MARKET INTEGRATION OF YOUNG PEOPLE FROM THE FRENCH DOMS
491
Figures 6 (cont’d). Employment and unemployment rates of DOM native-borns by age, sex, educational level and place of residence (%)
Age group
35-3930-34
55-5945-49
20-2460-64
25-2950-54
40-44 15-19
Age group
35-3930-34
55-5945-49
20-2460-64
25-2950-54
40-4415-19
Percentage
0
70
50
40
30
20
100
10
90
60
80
Ined 2011
Native-born women in their DOM
Native-born men in met. France
Percentage
0
80
70
60
50
40
100
20
30
10
90
Ined 2011
Native-born men in their DOM
Native-born women in met. France
Native-born men in met. FranceNative-born women in met. France
Native-born women in their DOM
Native-born men in their DOM
6C. Unemployment rate – No or few qualifications
6D. Unemployment rate – Degree in higher education
Population: DOM native-borns living in their home DOM or in metropolitan France.Source: INSEE, 2007 population census.

F. TEMPORAL, C-V. MARIE, S. BERNARD
492
Conversely, the difference between the DOMS and metropolitan France is smallest for those with the highest qualifi cations. The gap is only 7 points for the best educated Guadaloupeans and Martiniquans, and just 3 points for Réunionese of the same level, a sign that this département offers its educated native-borns more job opportunities than the Caribbean. This trend seems even clearer in French Guiana. Demand for skilled labour is so high there that French Guianese with higher education are the only group that seems less affected by unemployment at home (7%) than in metropolitan France (15%).
The statistical models constructed with census data to test these inequalities of access to employment confi rm the descriptive analyses (Appendix Table A.3.3). After controlling for sex, age, family status and specifi c educational level,(23) DOM native-borns living in metropolitan France are much more likely to be employed than those who stayed in or returned to their départements (the OR are 2.6 for Guadeloupeans, 2.5 for Réunionese, 2.3 for Martiniquans and 1.3 for Guianese). More broadly, the probability of being employed is higher for men, and increases with educational level and age (up to 55).(24)
Qualifi cation of jobs held by place of residence
An analysis of the qualifi cation of jobs held helps to refi ne the cost/benefi t approach to migration. Are DOM native-borns in metropolitan France also better off in this respect than their compatriots who stayed at home? In both cases, are differences observed by type of employment? The descriptive analysis gives more contrasting responses to these questions than for access to employment.
We fi rst observe that more of the highest educated access highly qualifi ed jobs in metropolitan France than in their DOM; the disparities are particularly wide for the youngest group. Among DOM native-borns aged under 35, 34% of men and 22% of women with higher education are in higher-level occupations in metropolitan France, compared with 19% and 13% in the DOMS (Figures 7 and 8).
This is well below the metropolitan average, however. DOM native-borns living in metropolitan France, but even more so those living in the DOM, generally hold less qualifi ed jobs. The percentage of graduates in a higher-level occupation is a good example. The metropolitan average is always higher (37% of men and 23% of women) than DOM native-borns with the same educational level living in metropolitan France, and even higher than for those living in their départements.
(23) Unlike the previous results where the “educational level” variable was grouped into four categories, the variable used in the statistical models comprises seven modalities (1. No qualifi cation; 2. Primary; 3. Lower secondary; 4. Mainstream upper secondary; 5. Vocational upper secondary; 6. Undergraduate degree; 7. Master’s or higher). This more detailed variable provides a means to control for interpretation biases that may be linked to a difference in qualifi cation level between sub-populations within grouped categories.
(24) After individuals with no qualifi cations, the least favourable status is a vocational upper secondary qualifi cation (Appendix Table A.3.3).

LABOUR MARKET INTEGRATION OF YOUNG PEOPLE FROM THE FRENCH DOMS
493
Figure 7. Qualifi cation level of jobs held by DOM native-born men aged 18-34 living in their DOM and in metropolitan France,
and of the metropolitan population in 2007 (%)Percentage
0
70
50
40
30
20
100
10
90
60
80
Ined 2011
Higher ed.
Few or no qualif.
Lower sec.
Upper sec.
Men
Upper sec.Lower sec. Higher ed.Few or no qualif.
Native-borns living in DOMsNative-borns living in met. FrancePopulation of met. France
Man
ual
Cle
rical
Hig
her-
leve
l.oc
cs.
Inte
rmed
.oc
cs.
Self-
empl
oyed
Man
ual
Cle
rical
Hig
her-
leve
l.oc
cs.
Inte
rmed
.oc
cs.
Self-
empl
oyed
Man
ual
Cle
rical
Hig
her-
leve
l.oc
cs.
Inte
rmed
.oc
cs.
Self-
empl
oyed
Source: INSEE, 2007 population census, DOMs and metropolitan France.
Figure 8. Qualifi cation level of jobs held by DOM native-born women aged 18-34 living in their DOM and in metropolitan France, and of the metropolitan
population in 2007 (%)Percentage
0
70
50
40
30
20
100
10
90
60
80
Ined 2011
Native-borns living in DOMsNative-borns living in met. FrancePopulation of met. France
Man
ual
Cle
rical
Hig
her-
leve
l.oc
cs.
Inte
rmed
.oc
cs.
Self-
empl
oyed
Higher ed.
Few or no qualif.
Lower sec.
Upper sec.
Women
Upper sec.Lower sec. Higher ed.Few or no qualif.
Man
ual
Cle
rical
Hig
her-
leve
l.oc
cs.
Inte
rmed
.oc
cs.
Self-
empl
oyed
Man
ual
Cle
rical
Hig
her-
leve
l.oc
cs.
Inte
rmed
.oc
cs.
Self-
empl
oyed
Source: INSEE, 2007 population census, DOMs and metropolitan France.

F. TEMPORAL, C-V. MARIE, S. BERNARD
494
These differences are not found among the least educated: percentages of clerical/sales workers and manual workers are very similar between DOM native-borns living at home, DOM native-borns living in metropolitan France and the metropolitan average. Only the youngest DOM native-borns in metropolitan France are slightly more frequently clerical/sales workers than manual workers.
To estimate possible differences in the recognition of educational qualifi cations, we looked at young DOM native-borns (aged under 35) with higher education in manual and clerical/sales occupations. Regardless of where they live, a higher percentage of these young people than the metropolitan average are in low-skillled jobs (manual workers or clerical/sales). For men, this is the case for 30% of those living in metropolitan France, 31% of those living in their DOM, compared with a metropolitan average of only 21%. For young women, 37% with higher education working in metropolitan France are in clerical/sales or manual jobs; 36% are in this situation in their DOM compared with a metropolitan average of 30%.
To limit structural effects, we tested the probability of holding wage employment in a higher-level or intermediate occupation among DOM native-borns with higher education and equivalent age, sex and family status. The model shows that DOM native-borns with similar characteristics less frequently access highly qualifi ed jobs in metropolitan France than in their département (Appendix Table A.3.4). Compared with their counterparts in their home département, Réunionese (OR = 0.7), Guadeloupeans (OR = 0.7) and Martiniquans (OR = 0.8) in metropolitan France less frequently hold such positions. French Guiana’s exception is confi rmed. For native-borns from that département, there does not appear to be a signifi cant difference by place of residence.
This overall result can be attributed largely to the situation of the older group, as confi rmed when the same model is applied to young adults (aged 18-34), and to their elders (aged 35 and over) (Appendix Table A.3.4). The older group with higher education in metropolitan France less often hold jobs in higher-level or intermediate occupations than their peers in their départements (OR = 0.6). But the gap narrows considerably for the youngest age group (OR = 0.9). This indicates both that the quality of education has increased and that younger native-borns with higher education are more demanding than their elders. It is as if, by choosing to live in metropolitan France, more of the older group accepted lower skilled jobs than those who remained in their départements. This unfavourable tradeoff occurs considerably less frequently among the younger group. All other things being equal, they occupy jobs with practically the same level of qualifi cation in the DOMS as in metropolitan France, and the gap with the metropolitan population has narrowed.
2. Increased selection of DOM native-borns in metropolitan France
Do these positive trends in the workforce integration of young DOM native-borns in metropolitan France refl ect an increasing capacity to adapt to the

LABOUR MARKET INTEGRATION OF YOUNG PEOPLE FROM THE FRENCH DOMS
495
metropolitan job market? Or do they refl ect strong selection, which results in a higher percentage of the least qualifi ed and most vulnerable young people being sent back to the DOMS?
In 2007, 43% of young DOM native-borns with higher education and in employment lived in metropolitan France, compared with only 25% of those with low or no educational qualifi cations (Table 4). Note that for the older group (aged 35 and over), the percentages are 35% and 30%, respectively, and therefore much more balanced. The higher qualifi cation of occupations held by the youngest DOM native-borns in metropolitan France certainly explains why a growing number of them, especially the best educated, are tempted by migration. While education is their primary motive for leaving, job opportunities in metropolitan France are the main reason for their decision to stay long-term; and this is especially true for those with the highest educational level.
Table 4. Distribution of DOM native-borns in employment by place of residence (DOM/metropolitan France), age group and educational level
Educational level
Place of residence by educational levelDistribution by
educational level
Lives in a DOM
Lives in metropolitan
FranceOverall
% living in metropolitan
FranceIn DOMs
In metropolitan
France
Age 18-34
No or low qualifi cation 29,007 9,685 38,692 25.0 23.2 13.6
Lower secondary 31,426 17,191 48,617 35.4 25.1 24.1
Upper secondary 33,117 20,712 53,829 38.5 26.4 29.0
Higher education 31,662 23,871 55,533 43.0 25.3 33.4
Overall 125,212 71,459 196,671 36.3 100.0 100.0
Age 35-64
No or low qualifi cation 125,204 52,831 178,035 29.7 43.6 36.9
Lower secondary 71,274 44,004 115,278 38.2 24.8 30.8
Upper secondary 42,087 19,814 61,901 32.0 14.7 13.9
Higher education 48,471 26,406 74,877 35.3 16.9 18.5
Overall 287,036 143,055 430,091 33.3 100.0 100.0
Source: INSEE, 2007 population census; authors’ calculations.
An examination of the numbers in employment by age group and the breakdown by educational level in the DOMs and in metropolitan France confi rm not only that a clear selection occurs to the detriment of the DOMs, but that this selection increases among the youngest group (Table 4). Selection by educational level has increased as overall educational levels have risen in the DOMS. These results are a good illustration of the changing profi le with age of DOM native-borns employed in metropolitan France, and especially the

F. TEMPORAL, C-V. MARIE, S. BERNARD
496
Figure 9. Proportion of DOM native-borns with experience of long-term migration by age in selected cohorts (%)
Percentage
0
50
40
30
20
60
10
Ined 2011
Age
0 5020 403010 60
1960-1961
1950-19511970-19711980-1981
1988-1989
Sources: INED-INSEE, MFV 2009-2010 and TeO 2008-2009.
Figure 10. Proportion of DOM native-borns living in metropolitan Franceby age in selected cohorts (%)
Percentage
0
50
40
30
20
60
10
Ined 2011
Age
0 5020 403010 60
1960-1961
1950-1951
1970-19711980-1981
1988-1989
Sources: INED-INSEE, MFV 2009-2010 and TeO 2008-2009.

LABOUR MARKET INTEGRATION OF YOUNG PEOPLE FROM THE FRENCH DOMS
497
general increase in their educational level. Selection can also be attributed to more frequent, earlier returns of young people who have diffi culty entering the workforce, especially the least educated (Section I.2); they often prefer a return to the family and the home community over an insecure status in metropolitan France.
By combining the data from the TeO and MFV surveys, we were able to reconstitute cohorts(25) of DOM native-borns living in metropolitan France or in their départements across different ages and to estimate the percentage of long-term migrants in each cohort, whether currently living in metropolitan France or having returned to their DOM (Box 1). This analysis enables us, for the fi rst time, to highlight the change in intensity of this migration for each cohort (Figure 9). It also provides the percentage of DOM native-borns living in metropolitan France at each age (Figure 10).
For all the cohorts studied (Figure 9), the percentage of DOM native-borns who have migrated increases sharply at ages 15-25, then continues to rise but at a more modest pace. At age 25, 33-43% have migrated, depending on the cohort. However, unlike the 1950-1951 and 1960-1961 cohorts, in which the number of long-term migrants only increased signifi cantly after age 15, migration takes place earlier in the most recent cohorts. This is mainly due to the migration of young children accompanying their parent(s), rarely observed in the past. As they are socialized from a very young age in metropolitan France, their life courses and their migration behaviour undoubtedly differ from those of the previous cohorts. After age 15, the trends by age at migration are fairly similar from one cohort to the next.
We note that for all the cohorts studied here, the percentage of DOM native-borns living in metropolitan France (Figure 10) follows the same broad trend by age. The highest percentage is reached around age 30 (age 27 for the 1960-1961 and 1980-1981 cohorts; 32 for the 1950-51 cohorts; and 37 for the 1970-1971 cohorts) before stabilizing, then decreasing gradually as the number of returns to the DOM outnumbers arrivals in metropolitan France. For the oldest cohorts (1950-1951 and 1960-1961), the decline is slow, refl ecting the fact that many DOM native-borns have settled very long-term in metropolitan France and that there are still signifi cant arrivals after age 40. We even note a slight increase for the 1970-1971 cohorts, indicating more numerous arrivals than returns at ages 30-37.
For the youngest cohorts, the percentage of long-term migrants is highest (Figure 9) at the very youngest ages (under 15), and the percentage of those living in metropolitan France (Figure 10) is also higher than before, indicating that returns are relatively low at those ages. After age 15, the increase is common to all the cohorts shown, highlighting the much higher number of arrivals than returns at ages 15-30.
(25) Each corresponds to a pair of birth cohorts: 1950 and 1951, 1960 and 1961, etc.

F. TEMPORAL, C-V. MARIE, S. BERNARD
498
These results confi rm that most DOM native-borns migrate before age 30, even if some move between their DOM and metropolitan France at older ages. The wider availability of mobility allowances covering some or all of the costs of travel to and/or from metropolitan France has undoubtedly spurred this trend, simultaneously contributing to increased movement between the DOMS and metropolitan France. The data from the MFV survey on the recipients of mobility allowances (Table 5) show that overall, compared with the older group (age 35 and over), the younger group stay for less time (fewer than half of stays exceed two years). But these results also show that the difference between generations is larger among recipients of mobility allowances. More than half of young people who receive a mobility allowance stay for less than two years, compared with less than 30% of the older group. For DOM native-borns aged 35-64, receiving an allowance is more frequently associated with long stays (more than two years), but this is less often the case among the younger group.
Table 5. Duration of stay in metropolitan France of returned DOM native-borns by age group and receipt of mobility allowance (%)
Less than
1 year1-2 years
More than 2 years
Total
Age 18-34
Allowance 20.7 30.4 48.9 100
No allowance 28.8 21.3 49.9 100
Overall 25.5 25.0 49.5 100
Age 35-64
Allowance 15.2 14.3 70.5 100
No allowance 21.9 21.3 56.8 100
Overall 20.5 19.8 59.7 100
Source: INED-INSEE, MFV 2009-2010.
It is these movements that are refl ected in the structural differences by educational level, employment and unemployment rates between DOM native-borns who live in metropolitan France and those who live in their départements.
3. What are the benefi ts of returning home?
Unlike their elders, younger DOM native-borns, especially those who have diffi culty integrating the metropolitan labour market, tend to return home after a short stay. What is their status when they return? Does migration benefi t everyone, irrespective of educational level and age? Are returned DOM native-borns better off than non-migrants, and, if so, in what way?
Among young people (aged 18-34) living in the DOMs, we fi nd in general that returned native-borns are less affected by unemployment than non-migrant native-borns. However, the results vary considerably with educational level

LABOUR MARKET INTEGRATION OF YOUNG PEOPLE FROM THE FRENCH DOMS
499
and sex (Table 6). The least educated returned DOM native-borns, and women with a lower secondary qualifi cation, have higher unemployment levels than non-migrant DOM native-borns.
Table 6. Unemployment rate of DOM native-borns aged 18-34 living in their DOM (%)
Men Women
Non-migrant native-borns
Returned native-borns
Non-migrant native-borns
Returned native-borns
No or low qualifi cation 56.8 63.2 77.4 78.3
Lower secondary 46.5 38.3 46.5 53.4
Upper secondary 30.8 19.1 52.5 38.4
Higher education 11.3 11.8 26.2 17.5
Overall 46.1 35.3 51.4 35.7
Source: INED-INSEE, MFV 2009-2010.
After controlling for sex, age, detailed educational level, family status and migration experience, we fi nd that returned DOM native-borns have no real advantage over non-migrants in terms of access to employment (Appendix Table A.3.5). On the contrary, returned DOM native-borns even seem – all other things being equal – to be in employment less frequently than non-migrant DOM native-borns (OR = 0.6). This shows that the experience of long-term migration alone is not suffi cient to account for differences in access to employment among the population of DOM native-borns.
Returned DOM native-borns do not form a homogeneous sub-group, and the experience of long-term migration is not in itself an advantage in fi nding employment. Beyond the shared migration experience, it is social (individual and family) characteristics and actual trajectories that make the difference and account for the diversifi cation of profi les. To examine this point in more detail, we sought to identify the factors infl uencing access to employment of returned migrants and non-migrants in their département (Appendix Table A.3.5).
Overall, education emerges as the main factor affecting the likelihood of being in employment for native-borns in their DOM. The higher the educational level, the bigger the impact. For DOM native-borns who hold a master’s degree or higher, the probability of being in employment is 19 times higher than for those with no qualifi cations. The place where the qualifi cation is attained is also a discriminating factor. For those who completed their education in metropolitan France, the probability of being in employment is higher than for those with qualifi cations from the DOM (OR = 1.6). Work experience (and especially time spent in employment) is equally important. The longer the experience, the higher the likelihood of having a job.

F. TEMPORAL, C-V. MARIE, S. BERNARD
500
These inequalities of access to employment seem to be greater in the younger group (ages 18-34). Compared with the older group, the infl uence of education appears stronger: for young higher education graduates the probability of being in employment is 23 times higher than for those of the same age without a qualifi cation; it is just 14 times higher among those aged 35 and over. Gender inequalities are also more pronounced in the younger group. By contrast, the place where the qualifi cation is obtained does not have any effect in the younger group, unlike among their elders, which is probably a sign of the expansion and improvement in education provision in the DOMs in recent decades.
The effect of work experience is much stronger for those aged 35 and over than for the younger group, for whom education is more important. Complementary models comparing access to employment of all DOM native-borns by educational level (lower or higher than completion of secondary) illustrate this point in more detail. They fi rst indicate that the effect of work experience on access to employment is positive in both sub-populations and is more important for those whose educational level is below upper secondary.
Applying the same model solely to the population of returned DOM native-borns offers additional insights (Appendix Table A.3.6). The effect of educational level on their access to employment in their département appears even more pronounced, especially for younger people. A young returning DOM native-born with a master’s degree or higher is much more likely to be in employment than a returnee with no qualifi cations. Having qualifi cations from metropolitan France further increases this likelihood, both in the younger group (OR = 1.5) and among those aged 35 and over (OR = 1.76).
Last, applying these models to each DOM highlights signifi cant differences between them, especially between Réunion and the other DOMS (Appendix Table A.3.7). While in all DOMs, returned native-borns aged 35 are less likely to be in employment than those of the same age who have not migrated, this is not always the case for younger people. With equivalent characteristics, it is only in Réunion that young returned DOM native-borns are less likely to have a job than non-migrants (OR = 0.4). In Martinique, Guadeloupe and French Guiana, differences between returned native-borns and non-migrants are not signifi cant at ages 18-34.
Réunion is also the only DOM in which the place where young returned native-borns attained their qualifi cations has a signifi cant effect on their access to employment. Young Réunionese returning from migration who attained their qualifi cations in metropolitan France are more frequently in employment than those who completed their education in the département (OR = 4.9). This advantage is not found in the other DOMS.
On the whole, these results show that migration alone is not suffi cient to guarantee labour market integration unless it is accompanied by an increase in the social capital of those concerned. Among returned DOM native-borns,

LABOUR MARKET INTEGRATION OF YOUNG PEOPLE FROM THE FRENCH DOMS
501
we fi nd real differences between those who took advantage of the migration experience to do further training, acquire qualifi cations or extend their work experience, and those who did not take advantage of the time spent outside the département. The latter group even risk fi nding themselves in a less favourable position than non-migrant native-borns.
The multiplication of short stays by the least educated and most precarious migrants could even accentuate the divide, because this type of mobility does not offer these young people real opportunities to improve their skills and consequently to build their social capital in a way that will help them fi nd employment when they return home. These “failed” returns do not favour their labour market integration. DOM native-borns who migrated to pursue their education but did not complete their courses fi nd themselves in a similar situation. Because they failed to increase their social capital, they seem to be even more disadvantaged than when they left. Their chances of fi nding a job are lower than those of non-migrants who graduated from local universities.
Regarding the qualifi cation level of jobs held by the best educated DOM native-borns in their département, we do not fi nd any signifi cant difference between returned native-borns and non-migrants (Appendix Table A.3.8). For all DOM native-borns living in their DOM, the most discriminating factor seems to be work experience. With 10 or more years of experience, the probability of holding a higher-level occupation is 3.6 times higher than for those who have less than two years’ experience. But the analysis also shows that a qualifi cation from metropolitan France increases the chances of attaining a higher social position. Compared with those who attained their qualifi cations in the DOM, native-borns who completed education in metropolitan France have a much higher chance of working in a higher-level or intermediate occupations (OR = 1.7).
Conclusion
After more than half a century of continuous migration, initiated and supported by specifi c public policies (BUMIDOM, ANT, LADOM(26)), institutional measures (military service) and private initiatives, we can draw three major conclusions.
The fi rst is the high percentage of DOM native-borns who have built, and who – more than ever – are now building their future prospects and life course in a dual economic and social space: their département and metropolitan France. Their strategies, choices and decisions are shaped by their social capital, by the opportunities that arise and by the constraints that they face: insuffi cient
(26) BUMIDOM: Bureau pour le développement des migrations dans les DOM (Bureau for the development of migration in the DOMs); ANT: (Agence nationale des travailleurs d’outre-mer (National agency for overseas workers); LADOM: L’agence d’outre-mer pour la mobilité (DOM mobility agency).

F. TEMPORAL, C-V. MARIE, S. BERNARD
502
educational provision, a slack labour market and high unemployment, especially among young people, with far more precarious conditions than in metropolitan France.
The MFV survey stresses the importance of migration in the life of DOM native-borns, more so among Caribbeans than among Réunionese. More than half of Caribbeans (56% in Guadeloupe and 53% in Martinique) have experienced long-term migration, and 43% have moved back to their départements, while 57% are still living in metropolitan France. Only a small minority have never left even for a short time (less than six months). Only 9% to 10% of DOM native-borns from the Caribbean have never left their islands. These are the most vulnerable group: they have low or no educational qualifi cations, are often unemployed, and many live below the poverty line. This profi le seems to exclude them from any prospect of mobility.
Among young people, the aspiration to leave remains strong, even if its intensity varies from one département to another. Asked about their mobility intentions (MFV survey), half of young adults from the DOMs aged 18-34 say they would be willing to leave if they were offered a job somewhere else. This breaks down as 67% in Martinique, 58% in Guadeloupe, 56% in French Guiana, versus 41% in Réunion. The youngest (aged 18-24) are even more determined.
Social and family origin is also very important, especially in migration choices. Having at least one parent in a qualifi ed occupation and/or a close relative who has experienced migration (currently or in the past) increase the chances of being a migrant. This family capital has an even bigger positive impact on young people now than on their elders, a sign that selection mechanisms have been reinforced. Educational level seems to be a determining factor in turning reported intentions into actual emigration. A higher educational level increases the likelihood of long-term settlement in metropolitan France and access to skilled employment.
The second conclusion is that a strong selection of the population occurs in migration, from which metropolitan France seems to draw the greater benefi t. In fact, there is a double selection – at departure and return – which mostly disadvantages the DOMS: only the best equipped to integrate the workforce settle long-term in metropolitan France, while the others (the less educated or less directly employable) return to their home DOM within a short time. It is this double selection that gives a particular structure to the population of DOM native-borns who have settled in metropolitan France.
The breakdown of this group by educational level and employment status refl ects this selection effect. In 2007, metropolitan France was home to 38% of all DOM native-borns with higher education, but to only 15% of DOM native-borns with low or no qualifi cations. The selection is even stronger among younger people. For those aged 18-34, the proportions are 43% for those with higher education and 14% of those with low or no qualifi cations. In this age group, the educational level of DOM native-borns in metropolitan France has

LABOUR MARKET INTEGRATION OF YOUNG PEOPLE FROM THE FRENCH DOMS
503
increased much more than in their home départements. Consequently, young DOM native-borns in metropolitan France now have a educational level comparable to the metropolitan average, which is not the case for their elders. This selection is played out again in employment: a higher percentage of young DOM native-borns are in employment in metropolitan France than in their DOM.
Our third conclusion is that those who return home do not always benefi t from having migrated. Indeed, returned DOM native-borns do not form a homogeneous group and their migration experience is not in itself an advantage. Despite this common experience, it is their social (individual and family) characteristics and actual migration history that really count. While those who took the opportunity to further their training, attain qualifi cations or extend their work experience can capitalize on this investment when they return, those who derived no gain from the time spent outside the département fi nd themselves in a worse situation than non-migrant native-borns in terms of access to employment when they return. The results obtained in Réunion are in line with those from a previous survey (Marie and Chevalier, 2001) which had already highlighted this strong heterogeneity.(27)
To follow up this research, it would be useful to analyse migration histories in more detail to better explain the factors that contribute to the heterogeneity between those for whom migration contributes to successful workforce integration or reintegration and those who, on the contrary, derive no benefi t from it. The effects of the migration of DOM native-borns on the job market and on social cohesion in the overseas départements could also be assessed in connection with labour immigrants settling there (metropolitan nationals, EU citizens and third-country foreigners). These issues open new areas for research. There are several outstanding questions about the competition that might arise between these different population categories (returned DOM native-borns, non-migrants, in-migrants born in metropolitan France and immigrants born abroad). Are these multiple layers of competition, which vary from one département to another, generating unequal opportunities in access to employment or in the qualifi cation of the jobs held? The same analyses should be conducted for DOM native-borns in metropolitan France. Do they enjoy the same opportunities as metropolitans or do they hold less qualifi ed jobs for comparable skill levels? Here again, the TeO and MFV surveys offer a wealth of material for new research.
(27) A factor analysis of the Démo97 survey in Réunion on the labour market integration of native-borns returning from migration has shown the heterogeneity of this population. Six groups of returned native-borns were identifi ed, ranging from “failed return” associated with extremely preciarous living conditions, to “successful return”, combining rapid labour market integration with favourable living conditions.
F. TEMPORAL, C-V. MARIE, S. BERNARD
504
APPENDICES
Appendix A.1. Estimated percentage of DOM native-borns living abroad, based on the information gathered on close relatives
who have migrated
The MFV survey provides data about the place of residence of family members – parent(s), children, spouse – of the respondents aged 18-79, which can be used to estimate the percentage of DOM native-borns living outside the département where they were born. This estimate gives equal weight to DOM native-borns living outside their département and to the respondents interviewed in the survey.
A comparison of the survey results with the French censuses yields very similar estimates for the population living outside the DOM where they were born. For the population aged 18-79, the censuses estimate the number of DOM native-borns living in metropolitan France or in another DOM at 334,500; the MFV survey, based on information provided by respondents, gives a total of 329,900, i.e. a difference of only 1.4% with respect to the census.
If we apply this difference to the number of DOM native-borns living abroad or in an overseas territory (TOM), we can estimate (based on information provided by the MFV respondents) that around 13,500 DOM native-borns aged 18-79 were living abroad at the time of the survey.
According to the MFV, 26% of DOM native-borns aged 18-79 live outside the département where they were born: 23% in metropolitan France, 2% in another DOM and only 1% in another country or in a TOM. In the younger age group (18-34), the percentage living in another country is almost 1.8%, refl ecting the recent but still moderate increase in migration to other countries in that age group.
We thus have confi rmation that migration (departures and returns) of DOM native-borns is largely limited to movements between the département where they were born and metropolitan France. We can therefore restrict the fi eld of this study to DOM native-borns living either in the département where they were born or in metropolitan France.

LABOUR MARKET INTEGRATION OF YOUNG PEOPLE FROM THE FRENCH DOMS
505
Appendix A.2. Main migration characteristics of returned DOM native-borns based on the MFV survey
Of DOM native-borns aged 18-79 who returned to their home département after more than six months away, 29% said they left for employment purposes, 24% for military service, 16% for education and 15% for family reasons.
This population of “returned native-borns” comprises more men (59%) than women. The over-representation of men and their high propensity to return can be attributed to the importance of military service as a factor of out-migration in previous years. Excluding military service, men make up only 46% of returned native-borns. At the same time, the data from population censuses indicate that women make up 51% of DOM native-borns settled in metropolitan France.
For the younger group, aged 18-34,(a) the dominant reasons for leaving are education and employment (34% and 23%, respectively) whereas for those aged 35 and over, the most frequently cited reasons are employment (31%) and military service (27%), well ahead of education (12%).
Whatever their current age, these returned native-borns left when they were young: 71% before the age of 25 (61% of those who left for employment and 89% of those who left for education). Those aged 18-34 at the time of the survey left earlier than the older group (85% before age 25 versus 67%), and some were children accompanying their parents who migrated.
In terms of length of stay, 57% of returned native-borns aged 18-34 who left for employment and 49% of those who left for education stayed away for less than two years before returning to their home département. The respective percentages were 18% and 30% in the group aged 35 and over. Mobility allowances have a stronger impact on the out-migration of younger returned native-borns: 52% of those who left for education and 40% of those who left for employment reported having received an allowance, compared with 29.5% and 24% of those aged 35 and over.
Metropolitan France is still the preferred destination (87%). Only 9% migrated to another DOM or COM, and only 4% to another country. We note, however, that return migration from other countries is increasing among young people: 8% compared with 3% among DOM native-borns aged 35 and over.
(a) These results are based on a cross-sectional analysis of the population of returned native-borns at the time of the MFV survey. Note that the data for the 18-34 age group are less “robust” than those for the older group because a higher percentage of young people have not yet migrated or have not yet returned. However, the trends observed (Figure 10) suggest that the differentials presented here should mostly persist.

F. TEMPORAL, C-V. MARIE, S. BERNARD
506
The statistical models used for tables A.3.1 to A.3.8
In order to neutralize any effects linked to differences in age structure, educational level, sex, département of origin, etc. and to avoid interpretation errors when comparing an indicator between several groups (e.g. unemployment rate or mobility intentions), the descriptive analyses were systematically backed up by statistical models. Their main results are given in the body of the text and presented in detail in the form of appendix tables.
They are binary logistic regression models. For each covariate – all presented in the tables – the results obtained can be used to compare the test modalities with a reference modality (Ref.) to estimate the probability of being concerned, or otherwise, by the modelled event (e.g. the fact of having a job with respect to not having one). These results, expressed as odds ratios (OR) make it possible to reason in terms of “all other things being equal”. For example, if we model the fact of being employed or not, a coeffi cient below 1 signifi es that probability of being in employment is lower for the population concerned (men in the analyses of the gender covariate) than for the reference population. Conversely, a coeffi cient above 1 signifi es a higher probability.
The statistical signifi cance of each test modality is identifi ed as follows:
*** p<0.001; ** p<0.01, * p<0.05
The higher the number of asterisks, the greater the signifi cance of the result. The absence of an asterisk indicates that the modality cannot be interpreted.
For the purposes of our analysis, these models comprise a number of different modalities (age group, educational level, département of residence, etc.) to assess intra-group variations in behaviour.
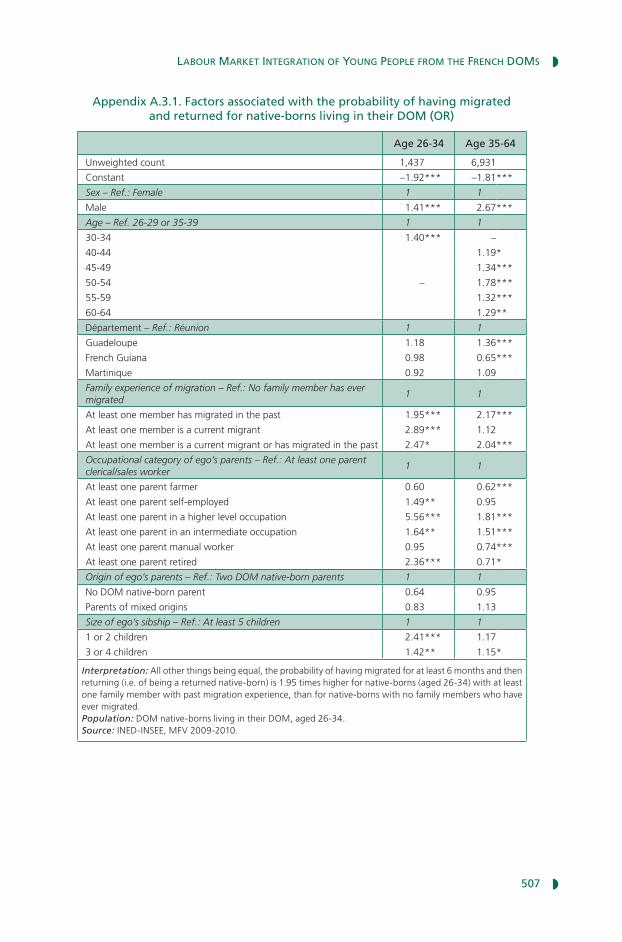
LABOUR MARKET INTEGRATION OF YOUNG PEOPLE FROM THE FRENCH DOMS
507
Appendix A.3.1. Factors associated with the probability of having migrated and returned for native-borns living in their DOM (OR)
Age 26-34 Age 35-64
Unweighted count 1,437 6,931
Constant –1.92 *** –1.81 ***
Sex – Ref.: Female 1.00 1.00
Male 1.41 *** 2.67 ***
Age – Ref. 26-29 or 35-39 1.00 1.00
30-34 1.40 *** –
40-44
–
1.19 *
45-49 1.34 ***
50-54 1.78 ***
55-59 1.32 ***
60-64 1.29 **
Département – Ref.: Réunion 1.00 1.00
Guadeloupe 1.18 1.36 ***
French Guiana 0.98 0.65 ***
Martinique 0.92 1.09
Family experience of migration – Ref.: No family member has ever migrated
1.00 1.00
At least one member has migrated in the past 1.95 *** 2.17 ***
At least one member is a current migrant 2.89 *** 1.12
At least one member is a current migrant or has migrated in the past 2.47 * 2.04 ***
Occupational category of ego’s parents – Ref.: At least one parent clerical/sales worker
1.00 1.00
At least one parent farmer 0.60 0.62 ***
At least one parent self-employed 1.49 ** 0.95
At least one parent in a higher level occupation 5.56 *** 1.81 ***
At least one parent in an intermediate occupation 1.64 ** 1.51 ***
At least one parent manual worker 0.95 0.74 ***
At least one parent retired 2.36 *** 0.71 *
Origin of ego’s parents – Ref.: Two DOM native-born parents 1.00 1.00
No DOM native-born parent 0.64 0.95
Parents of mixed origins 0.83 1.13
Size of ego’s sibship – Ref.: At least 5 children 1.00 1.00
1 or 2 children 2.41 *** 1.17
3 or 4 children 1.42 ** 1.15 *
Interpretation: All other things being equal, the probability of having migrated for at least 6 months and then returning (i.e. of being a returned native-born) is 1.95 times higher for native-borns (aged 26-34) with at least one family member with past migration experience, than for native-borns with no family members who have ever migrated.Population: DOM native-borns living in their DOM, aged 26-34.Source: INED-INSEE, MFV 2009-2010.

F. TEMPORAL, C-V. MARIE, S. BERNARD
508
Appendix A.3.2. Factors associated with the probability for native-borns living in their DOM of being willing to leave their département for employment
reasons (OR)
All DOM native-
borns (age 18-34)Unemployed (age 18-34)
Unweighted count 2,720 770
Constant –1.09*** –1.25 ***
Sex – Ref.: Female 1.00 1.00
Male 1.64 *** 1.57 **
Age – Ref.: 18-24 1.00 1.00
25-29 0.54 *** 0.74
30-34 0.49 *** 0.49 ***
Département – Ref.: Réunion 1.00 1.00
Guadeloupe 1.62 *** 2.59 ***
French Guiana 1.64 *** 2.85 ***
Martinique 2.51 *** 5.56 ***
Family status – Ref.: Adult in a couple with children 1.00 1.00
Adult in a childless couple 1.18 1.05
Adult in a lone-parent family 1.69 *** 1.15
Child of a couple 2.07 *** 2.64 ***
Child of a lone-parent family 1.75 *** 1.49
Living in a non-family household 3.73 *** 3.93 *
Living alone 1.75 *** 1.76
Highest qualifi cation – Ref.: No qualifi cation 1.00 1.00
Primary / lower secondary 1.67 *** 1.64
Lower secondary vocational 1.64 *** 1.27
General baccalauréat 2.00 *** 2.41 **
Vocational or technological baccalauréat 1.78 *** 0.97
Undergraduate degree 2.28 *** 2.12 *
Master’s degree or higher 1.73 *** 0.77
Ego’s migration experience – Ref.: Non-migrant native-born 1.00 1.00
Returned native-born 1.39 *** 1.18
Ego’s employment status – Ref.: Unemployed 1.00 1.00
In employment 0.73 *** –
Interpretation: All other things being equal, an unemployed man is 1.57 times more likely to be willing to leave his DOM for employment reasons than an unemployed woman.Population: DOM native-borns living in their DOM, aged 18-34.Source: INED-INSEE, MFV 2009-2010.

LABOUR MARKET INTEGRATION OF YOUNG PEOPLE FROM THE FRENCH DOMS
509
Appendix A.3.3. Factors associated with the probability of being in employment for native-borns living in their DOM or in metropolitan France (OR)
Guada-
loupeansMarti-
niquansFrench
GuianeseRéu-
nioneseOverall
age 18-34Overall age 35+
Unweighted count 99,988 103,429 18,640 169,264 126,213 265,108
Constant –0.91 *** –0.77 *** –1.24 *** –1.36 *** –1.47 *** –0.36 ***
Sex – Ref.: Female 1.00 1.00 1.00 1.00 1.00 1.00
Male 1.60 *** 1.65 *** 1.59 *** 2.32 *** 2.04 *** 1.83 ***
Age – Ref.: 18-24 1.00 1.00 1.00 1.00 1.00 1.00
25-29 1.54 *** 1.48 *** 1.43 *** 1.43 ***
– –
30-34 1.95 *** 1.86 *** 2.16 *** 1.67 ***
35-39 2.25 *** 2.22 *** 2.56 *** 1.99 ***
40-44 2.58 *** 2.59 *** 3.27 *** 2.35 ***
45-49 2.93 *** 2.84 *** 3.44 *** 2.34 ***
50-54 2.61 *** 2.71 *** 3.18 *** 1.90 ***
55-59 1.29 *** 1.20 *** 1.93 *** 0.83 ***
60-64 0.29 *** 0.24 *** 0.43 *** 0.23 ***
Ego’s nationality – Ref.: French by birth
1.00 1.00 1.00 1.00 1.00 1.00
Foreign 0.46 *** 0.54 *** 0.44 *** 0.68 0.51 *** 0.56 ***
Naturalized French 0.60 *** 0.80 0.91 0.68 *** 0.95 0.62 ***
Family status – Ref.: Adult in a couple with children
1.00 1.00 1.00 1.00 1.00 1.00
Adult in a childless couple 0.90 *** 0.86 *** 1.10 *** 1.08 *** 1.76 *** 0.81 ***
Adult in a lone-parent family 0.74 *** 0.70 *** 0.84 *** 0.74 *** 0.66 *** 0.86 ***
Child of a couple 0.53 *** 0.50 *** 0.60 *** 0.64 *** 0.79 *** 0.46 ***
Child of a lone-parent family 0.40 *** 0.44 *** 0.56 *** 0.46 *** 0.62 *** 0.41 ***
Living in a non-family household 0.54 *** 0.53 *** 0.69 *** 0.59 *** 0.80 *** 0.54 ***
Living alone 0.73 *** 0.75 *** 0.93 *** 0.79 *** 1.33 *** 0.71 ***
Highest qualifi cation – Ref.: No qualifi cation
1.00 1.00 1.00 1.00 1.00 1.00
Primary / lower secondary 3.30 *** 3.27 *** 6.91 *** 4.35 *** 4.01 *** 4.12 ***
Lower secondary vocational 3.20 *** 3.34 *** 6.83 *** 4.29 *** 3.99 *** 4.20 ***
General baccalauréat 2.03 *** 2.09 *** 3.72 *** 2.25 *** 2.26 *** 2.46 ***
Vocational or technological baccalauréat 1.63 *** 1.73 *** 2.32 *** 1.79 *** 1.81 *** 1.89 ***
Undergraduate degree 4.98 *** 5.18 *** 11.00*** 8.07 *** 7.69 *** 5.93 ***
Master’s degree or higher 6.80 *** 6.78 *** 12.29 *** 10.36 *** 8.61 *** 8.60 ***
Indicator of residence 5 years previously – Ref.: Same dép.(a) 1.00 1.00 1.00 1.00 1.00 1.00
Other département 0.73 *** 0.68 *** 0.72 *** 0.57 *** 0.71 *** 0.50 ***
Place of residence – Ref.: Lives in DOM of birth
1.00 1.00 1.00 1.00 1.00 1.00
Lives in another DOM or TOM 1.37 *** 1.09 *** 0.67 *** 0.83 *** – –
Lives in metropolitan France 2.58 *** 2.26 *** 1.28 *** 2.51 *** 2.26 *** 2.48 ***(a) For the purposes of this analysis, all départements of metropolitan France were considered as a single département.Interpretation: All other things being equal, a Guadaloupean man, wherever he lives is 1.6 times more likely to be in employment than a Guadaloupean woman.Population: DOM native-borns aged 18-64, living in their DOM or in metropolitan France; population not currently in education.Source: INSEE, 2007 population census.

F. TEMPORAL, C-V. MARIE, S. BERNARD
510
Appendix A.3.4. Factors associated with the probability for DOM native-borns with a degree in higher education living in their DOM or in metropolitan France of being a salaried employee in a higher-level or intermediate occupation (OR)
Guada-
loupeansMarti-
niquansFrench
GuianeseRéu-
nioneseOverall
age 18-34Overall age 35+
Unweighted count 12,968 14,254 2,672 15,265 20,342 24,817
Constant 0.34 *** 0.13 *** –0.07 *** 0.24 *** 0.09 ** 1.02 ***
Sex – Ref.: Female 1.00 1.00 1.00 1.00 1.00 1.00
Male 1.35 *** 1.25 *** 1.22 ** 1.39 *** 1.24 *** 1.37 ***
Age – Ref.: 18-24 1.00 1.00 1.00 1.00 1.00 1.00
25-29 1.56 *** 1.87 *** 1.93 *** 1.63 ***
– –
30-34 1.58 *** 1.97 *** 2.20 *** 1.80 ***
35-39 1.74 *** 2.06 *** 2.92 *** 2.12 ***
40-44 2.09 *** 2.12 *** 3.22 *** 2.41 ***
45-49 2.18 *** 2.30 *** 3.23 *** 2.27 ***
50-54 1.94 *** 2.22 *** 3.28 *** 2.08 ***
55-59 2.75 *** 2.74 *** 2.25 *** 1.94 ***
60-64 2.56 *** 3.88 *** 2.29** 2.08 ***
Ego’s nationality – Ref.: French by birth
1.00 1.00 1.00 1.00 1.00 1.00
Foreign 1.46 1.02 – 0.88 1.24 1.03
Naturalized French 0.40 ** 0.94 1.00 19.52 1.16 0.59
Family status – Ref.: Adult in a couple with children
1.00 1.00 1.00 1.00 1.00 1.00
Adult in a childless couple 1.20 *** 1.08 1.26 1.23 *** 1.41 *** 0.94
Adult in a lone-parent family 0.66 *** 0.69 *** 0.66 *** 0.72 *** 0.58 *** 0.72 ***
Child of a couple 0.56 *** 0.67 *** 0.82 0.66 *** 0.74 *** 0.60 ***
Child of a lone-parent family 0.56 *** 0.52 *** 0.60 ** 0.55 *** 0.63 *** 0.46 ***
Living in a non-family household 0.86 0.75 *** 0.67 ** 0.91 0.89 0.78 ***
Living alone 1.06 1.28 *** 1.38 ** 1.33 *** 1.36 *** 1.13 ***
Indicator of residence 5 years previously – Ref.: Same dép.(a) 1.00 1.00 1.00 1.00 1.00 1.00
Other département 0.90 1.06 1.34 0.91 0.78 *** 1.62 ***
Place of residence – Ref.: Lives in DOM of birth
1.00 1.00 1.00 1.00 1.00 1.00
Lives in another DOM or TOM 1.37 *** 1.60 *** 1.90 ** 1.11 – –
Lives in metropolitan France 0.73 *** 0.84 *** 0.89 0.71 *** 0.92 ** 0.62 ***(a) For the purposes of this analysis, all départements of metropolitan France were considered as a single département.Interpretation: All other things being equal, a Guadaloupean man with higher education, wherever he lives (DOM or metropolitan France) is 1.35 times more likely to be a salaried employee in a higher-level or intermediate occupation than a Guadaloupean woman.Population: DOM native-borns aged 18-64, with a degree in higher education and in salaried employment, living in their DOM or in metropolitan France; population not currently in education.Source: INSEE, 2007 population census.

LABOUR MARKET INTEGRATION OF YOUNG PEOPLE FROM THE FRENCH DOMS
511
Appendix A.3.5. Factors associated with the probability of being in employment for native-borns living in their DOM (OR)
OverallAge
18-34 Age
35-64
Lower secondary
or less
Bac-calauréat or higher
Unweighted count 8,644 2,255 6,389 6,496 2,148
Constant –2.97 *** –3.02 *** –4.10 *** –2.56 *** –0.70 ***
Sex – Ref.: Female 1.00 1.00 1.00 1.00 1.00
Male 1.91 *** 2.49 *** 1.46 *** 1.84 *** 2.00 ***
Département – Ref.: Réunion 1.00 1.00 1.00 1.00 1.00
Guadeloupe 1.19 *** 1.59 *** 1.12 1.28 *** 1.01
French Guiana 2.67 *** 2.78 *** 2.47 *** 3.14 *** 2.41 ***
Martinique 1.38 *** 1.63 *** 1.38 *** 1.60 *** 1.09
Highest qualifi cation – Ref.: No qualifi cation
1.00 1.00 1.00 1.00 1.00
Primary / lower secondary 1.72 *** 1.56 ** 1.62 ***
– –
Lower secondary vocational 2.84 *** 2.77 *** 2.51 ***
General baccalauréat 4.89 *** 5.69 *** 3.76 ***
Vocational or technological baccalauréat
5.41 *** 3.99 *** 6.25 ***
Undergraduate degree 9.60 *** 13.44 *** 5.86 ***
Master’s degree or higher 18.65 *** 22.87 *** 13.64 ***
Place where qualifi cation obtained – Ref.: In the DOM
1.00 1.00 1.00 1.00 1.00
Abroad 1.57 1.56 1.82 1.31 8.14
In another DOM or TOM 1.92 * 3.11 * 1.11 1.54 4.93 ***
In metropolitan France 1.62 *** 1.55 1.66 *** 2.04 *** 1.90 ***
Work experience – Ref.: 0-2 years 1.00 1.00 1.00 1.00 1.00
2-5 years 4.33 *** 4.73 *** 5.86 *** 4.36 *** 6.06 ***
5-10 years 6.47 *** 10.79 *** 10.88 *** 6.89 *** 5.48 ***
More than 10 years 15.30 *** 21.28 *** 55.75 *** 15.09 *** 9.97 ***
Ego’s migration experience – Ref.: Non-migrant native-born
1.00 1.00 1.00 1.00 1.00
Returned native-born 0.62 *** 0.50 *** 0.70 *** 0.70 *** 0.82
Interpretation: All other things being equal, a man is 1.9 times more likely to be in employment than a woman. Population: DOM native-borns living in their DOM, aged 18-64; population not currently in education, excluding retirees.Source: INED-INSEE, MFV 2009-2010.

F. TEMPORAL, C-V. MARIE, S. BERNARD
512
Appendix A.3.6. Factors associated with the probability of being in employment for returned native-borns (OR)
OverallAge
18-34 Age
35-64
Lower secondary
or less
Bac-calauréat or higher
Unweighted count 3,736 751 2,985 2,558 1,178
Constant –3.32 *** –3.56 *** –4.63 *** –2.99 *** –0.70 ***
Sex – Ref.: Female 1.00 1.00 1.00 1.00 1.00
Male 2.18 *** 2.14 *** 2.12 *** 2.12 *** 2.16 ***
Département – Ref.: Réunion 1.00 1.00 1.00 1.00 1.00
Guadeloupe 1.10 1.61 ** 1.06 1.05 1.25
French Guiana 2.52 *** 2.98 *** 2.31 ** 3.61 *** 1.68
Martinique 1.20 * 1.52 * 1.21 * 1.29 ** 1.10
Highest qualifi cation – Ref.: No qualifi cation
1.00 1.00 1.00 1.00 1.00
Primary / lower secondary 1.99 *** 2.04 1.95 ***
– –
Lower secondary vocational 2.67 *** 3.49 *** 2.44 ***
General baccalauréat 5.12 *** 6.13 *** 4.28 ***
Vocational or technological baccalauréat
8.31 *** 12.99 *** 5.96 ***
Undergraduate degree 10.31 *** 12.06 *** 8.52 ***
Master’s degree or higher 23.45 *** 32.86 *** 17.71 ***
Place where qualifi cation obtained – Ref.: In the DOM
1.00 1.00 1.00 1.00 1.00
Abroad 1.79 2.78 1.92 1.71 6.88
In another DOM or TOM 1.38 1.57 1.07 1.02 3.49 **
In metropolitan France 1.66 *** 1.51 * 1.76 *** 2.17 *** 1.86 ***
Work experience – Ref.: 0-2 years 1.00 1.00 1.00 1.00 1.00
2-5 years 3.11 *** 3.40 *** 5.05 ** 2.52 *** 4.54 ***
5-10 years 4.32 *** 6.49 *** 8.26 *** 6.54 *** 3.12 ***
More than 10 years 13.37 *** 20.39 *** 52.77 *** 16.89 *** 7.72 ***
Interpretation: All other things being equal, a man is 2.18 times more likely to be in employment than a woman. Population: Returned DOM native-borns living in their DOM, aged 18-64; population not currently in education, excluding retirees.Source: INED-INSEE, MFV 2009-2010.

LABOUR MARKET INTEGRATION OF YOUNG PEOPLE FROM THE FRENCH DOMS
513
Ap
pen
dix
A.3
.7. F
acto
rs a
sso
ciat
ed w
ith
th
e p
rob
abili
ty o
f b
ein
g in
em
plo
ymen
t fo
r n
ativ
e-b
orn
s liv
ing
in t
hei
r D
OM
(O
R)
Gu
adel
ou
pe
Mar
tin
iqu
eFr
ench
Gu
ian
aR
éun
ion
Ag
e 18
-34
Ag
e 35
-64
Ag
e 18
-34
Ag
e 35
-64
Ag
e 18
-34
Ag
e 35
-64
Ag
e 18
-34
Ag
e 35
-64
Unw
eigh
ted
coun
t44
01,
872
491
1,87
548
280
184
21,
841
Con
stan
t–2
.47 *
**–3
.71 *
**–2
.74 *
**–4
.11 *
**–1
.92 *
**–3
.02 *
**–3
.16 *
**–4
.09 *
**
Sex
– Re
f.: F
emal
e1.
001.
001.
001.
001.
001.
001.
001.
00
Mal
e2.
98 **
*1.
68 **
*2.
17 **
*1.
34 **
1.48
1.02
2.77
***
1.42
***
Hig
hest
qua
lifi c
atio
n –
Ref.
: No
qual
ifi ca
tion
1.00
1.00
1.00
1.00
1.00
1.00
1.00
1.00
Prim
ary
/ low
er s
econ
dary
2.63
*1.
46 **
2.11
1.33
*1.
191.
431.
491.
96 **
*
Low
er s
econ
dary
voc
atio
nal
2.76
***
2.44
***
4.97
***
2.99
***
4.15
***
3.39
***
2.29
***
2.19
***
Gen
eral
bac
cala
uréa
t3.
82 **
4.60
***
7.20
***
3.36
***
7.23
***
3.32
**6.
38 **
*3.
58 **
*
Voca
tiona
l or
tech
nolo
gica
l bac
cala
uréa
t1.
185.
56 **
*2.
85 *
5.17
***
6.03
**2.
72 *
7.43
***
10.7
3***
Und
ergr
adua
te d
egre
e 6.
96**
*10
.13*
**11
.27*
**7.
50**
*14
.57*
**4.
56**
*24
.64*
**4.
13**
*
Mas
ter’s
deg
ree
or h
ighe
r27
.16*
**13
.31*
**14
.21*
**12
.47*
**50
.86*
**24
.84*
**30
.93*
**15
.06*
**
Plac
e w
here
qua
lifi c
atio
n ob
tain
ed –
Ref
.: In
the
D
OM
1.00
1.00
1.00
1.00
1.00
1.00
1.00
1.00
Abr
oad
0.61
2.17
13.8
516
.66
0.23
5.45
–0.
67
In a
noth
er D
OM
or
TOM
2.10
5.43
*4.
450.
505.
53 *
––
–
In m
etro
polit
an F
ranc
e0.
891.
87 **
*0.
811.
200.
711.
904.
94 **
*1.
91 **
Wor
k ex
perie
nce
– Re
f.: 0
-2 y
ears
1.00
1.00
1.00
1.00
1.00
1.00
1.00
1.00
2-5
year
s4.
15 **
*4.
22 **
6.03
***
19.4
9***
6.70
***
14.0
4***
4.77
***
2.86
5-10
yea
rs7.
29 **
*9.
14 **
*14
.15*
**17
.93*
**9.
10 **
*22
.03*
**12
.70*
**8.
83 **
*
Mor
e th
an 1
0 ye
ars
40.0
3***
39.6
8***
10.7
7***
82.8
0***
10.2
5***
49.7
3***
26.1
2***
56.2
7***
Ego’
s m
igra
tion
expe
rienc
e –
Ref.
: Non
-mig
rant
na
tive-
born
1.00
1.00
1.00
1.00
1.00
1.00
1.00
1.00
Retu
rned
nat
ive-
born
0.68
0.63
***
0.65
0.64
***
0.67
0.54
**0.
39 **
*0.
78 *
No
te: A
das
h “–
” si
gnifi
es t
hat
the
para
met
er c
anno
t be
est
imat
ed.
In
terp
reta
tio
n:
All
othe
r th
ings
bei
ng e
qual
, a y
oung
Gua
dalo
upea
n m
an (a
ge 1
8-3
4),
is 3
tim
es m
ore
likel
y to
be
in e
mpl
oym
ent
than
a y
oung
Gua
dalo
upea
n w
oman
.
Pop
ula
tio
n: D
OM
nat
ive-
born
s liv
ing
in t
heir
DO
M, a
ged
18-6
4; p
opul
atio
n no
t cu
rren
tly
in e
duca
tion
, exc
ludi
ng r
etire
es.
Sou
rce
: IN
ED-I
NSE
E, M
FV 2
009
-201
0.

F. TEMPORAL, C-V. MARIE, S. BERNARD
514
Appendix A.3.8: Factors associated with the probability for DOM native-borns with a degree in higher education living in their DOM of being a salaried
employee in a higher-level or intermediate occupation (OR)
OverallAge
18-34 Age
35-64
Unweighted count 1,049 364 685
Constant 0.16 0.026 17.03
Sex – Ref.: Female 1.00 1.00 1.00
Male 1.60 *** 1.400 1.96 ***
Département – Ref.: Réunion 1.00 1.00 1.00
Guadeloupe 0.69 * 1.264 0.36 ***
French Guiana 1.134 1.281 0.690
Martinique 0.65 ** 0.617 0.50 **
Place where qualifi cation obtained – Ref.: In the DOM 1.00 1.00 1.00
Abroad – – –
In another DOM 7.10 ** 3.944 –
In metropolitan France 1.67 ** 2.02 * 1.570
Work experience – Ref.: 0-2 years 1.00 1.00 1.00
2-5 years 1.82 ** 1.474 1.336
5-10 years 2.01 *** 1.79 ** –
More than 10 years 3.58 *** 2.62 * –
Ego’s migration experience – Ref.: Non-migrant native-born 1.00 1.00 1.00
Returned native-born 1.203 1.437 0.946
Note: A dash “–” signifi es that the parameter cannot be estimated. Interpretation: All other things being equal, a man with is 1.6 times more likely to have a higher-level or intermediate occupation than a woman. Population: DOM native-borns aged 18-64, with a degree in higher education, in salaried employment and living in their DOM; population not currently in education, excluding retirees.Source: INED-INSEE, MFV 2009-2010.

LABOUR MARKET INTEGRATION OF YOUNG PEOPLE FROM THE FRENCH DOMS
515
REFERENCES
BEAUCHEMIN C., HAMEL., SIMON P., 2010, Trajectories and Origins. Survey on Population Diversity in France. Initial Findings, INED, Document de travail 168, 149 p.
BORREL C., LHOMMEAU B., 2010, “Être né en France d’un parent immigré”, Insee première 1287, 4 p.
BRETON D., CONDON S., MARIE C.-V., TEMPORAL F., 2009, “The challenges of population ageing and migration in the French overseas départements”, Population and Societies, 460, 4 p.,http: //www.ined.fr/en /resources_documentat ion /publicat ions /pop_soc /bdd /publication/1480/
CHARBIT Y., LERIDON H., 1980, Transition démographique et modernisation en Guadeloupe et en Martinique, Paris, INED, Cahier 89, 308 p.
CONTANT F., 1987, “La politique française de l’immigration antillaise de 1946 à 1987”, Revue européenne des migrations internationales, 3(3), pp. 9-30.
DION M., BELLOT S., 2004, “La migration pour études, atout à la Réunion ?”, Revue européenne des migrations internationales, 20(1), pp. 141-167.
DOMENACH H., PICOUET M., 1992, La dimension migratoire des Antilles, Paris, Economica, 254 p.FESTY P., HAMON C., 1983, Croissance et révolution démographiques à La Réunion, Paris, Ined/
PUF, Cahier 100, 116 p.LABACHE L., 2007, “La mobilité des jeunes Réunionnais vers la métropole et l’espace européen”,
Les 3e rencontres “Jeunes et sociétés en Europe et autour de la Méditerranée”, Marseille IUFM, 24, 25 and 26 October, 13 p.http://www.jeunes-et-societes.com/public/archives/2005/LABACHE.pdf
MARIE C.-V., 2011, “L’enquête Migrations, famille et vieillissement”, Politiques sociales et familiales. Réalités sociales et politiques publiques dans les DOM, 106, CNAF, 6 p.
MARIE C.-V., CHEVALIER F., 2001, “Migrants de retour : entre promotion et précarité”, Économie de la Réunion, 109, INSEE, pp. 14-17.
MARIE C.-V., TEMPORAL F., 2011, “Les DOM : terres de migrations”, Espace populations sociétés, 2011/3.
MARIE C.-V., TEMPORAL F., 2001, “Migrants de retour : une émigration très encadrée par les institutions”, Économie de la Réunion, 109, INSEE, pp. 12-14.
MARIE C.-V., RALLU J.-L., 2004, “Migrations croisées entre DOM et Métropole : l’emploi comme moteur de la migration”, Espace populations sociétés, 2004/2, pp. 237-252.
MARIE C-V., TEMPORAL F., BRETON D., CONDON S., ABDOUNI S., 2011, “Migrations, famille et vieillissement – Des défi s pour La Réunion de demain”, INSEE-Réunion, INSEE-Partenaires, 12, 6 p.
MONTEIL C., RALLU J.-L., 2010, “Migrations : l’impact démographique et économique”, Économie de La Réunion, 136, INSEE, p. 11-22.
OBSERVATOIRE NATIONAL DE LA PAUVRETÉ ET DE L’EXCLUSION SOCIALE (ONEPS), 2006, “Une approche de la pauvreté dans les départements d’outre-mer. Réfl exions sur la pauvreté dans les départements d’outre-mer. Annexe du rapport 2005-2006”, Les travaux de l’observatoire, La Documentation française, pp. 389-539.
PARAIN C., 2011, “Approche comparée des évolutions macro-économiques des Outre-mer” Créer de la valeur ajoutée et de l’emploi en outre-mer, Conference of the Agence française du développement in partnership with CEROM, Paris, Maison de la RATP, 25 November.

F. TEMPORAL, C-V. MARIE, S. BERNARD
516
RALLU J.-L., DIAGNE A., 2005, “La population des départements d’outre-mer depuis les années 1950”, in Bergouignan C., Blayo C., Parant A., Sardon J.-P., Tribalat M. (eds.), La Population de la France : évolutions démographiques depuis 1946, Pessac, CUPED, Volume 1, pp. 103-125.
TEMPORAL F., 2011, “L’évolution démographique récente dans les départements d’outre-mer”, Politiques sociales et familiales, 106, Synthèses et statistiques, CNAF, pp. 1-7.

LABOUR MARKET INTEGRATION OF YOUNG PEOPLE FROM THE FRENCH DOMS
517
Franck TEMPORAL, Claude-Valentin MARIE, with Stéphane BERNARD • LABOUR MARKET INTEGRATION OF YOUNG PEOPLE FROM THE FRENCH OVERSEAS DÉPARTEMENTS: AT HOME OR IN METROPOLITAN FRANCE?
Since the mid-twentieth century, France’s overseas départements (DOM) have seen intense migration, with criss-crossing fl ows of DOM native-borns leaving and returning, alongside migrants from France and other countries. Practically all of the DOM native-borns who emigrate – mainly towards metropolitan France – are working-age adults who leave their home for work or educational purposes. This study measures the scale of these migration fl ows and describes their complexity, focusing on the selection mechanisms at play among leavers and returners, notably in terms of educational level. We also examine the conditions of integration of DOM native-borns in their place of destination and assess the benefi ts of migration for those who return, the youngest especially (ages 18-34), by comparison with their elders (ages 35-64), the aim being to shed light on the changes which, from one age group to another, have marked this powerful and long-standing migration tradition. The original fi ndings of the Migrations, Family and Ageing survey (MFV), and of the Trajectories and Origins survey (TeO), associated with census data from the DOMs and metropolitan France, provide scope for detailed analysis of the population of DOM native-borns, whatever their place of residence, and for a better understanding of the dynamics involved.
Franck TEMPORAL, Claude-Valentin MARIE, avec la collaboration de Stéphane BERNARD • INSERTION PROFESSIONNELLE DES JEUNES ULTRAMARINS : DOM OU MÉTROPOLE ?
Depuis un demi-siècle, les départements d’outre-mer (DOM) sont le théâtre de mouvements migratoires intenses où se croisent départs et retours des natifs des DOM et de populations nées en France métropolitaine ou à l’étranger. L’émigration des natifs des DOM, principalement orientée vers la métropole, a pour caractéristique majeure de concerner quasi exclusivement des individus en âge de travailler motivés par les études et l’emploi. Cette étude mesure l’ampleur et décrit la complexité de ces migrations, en s’attachant aux mécanismes de sélection à l’œuvre au départ comme au retour, notamment selon le niveau de diplôme. Il s’agit aussi d’évaluer les conditions de l’insertion des natifs des DOM pendant leur migration et d’apprécier les bénéfi ces qu’en tirent ceux qui reviennent, en particulier pour les plus jeunes (18 à 34 ans) par comparaison à leurs aînés (35 à 64 ans), afi n d’éclairer les évolutions qui, d’une catégorie d’âge à l’autre, ont marqué cette tradition durable et forte de migration. Les résultats inédits des enquêtes Migrations, famille et vieillissement (MFV) et Trajectoires et origines (TeO), associés aux données des recensements dans les DOM et en métropole, offrent la possibilité d’analyses détaillées de la population des natifs des DOM quel que soit leur lieu de résidence, et ainsi de mieux comprendre les dynamiques en cours.
Franck TEMPORAL, Claude-Valentin MARIE, con la colaboracíon de Stéphane BERNARD • INSERCIÓN PROFESIONAL DE LOS JÓVENES DE ULTRAMAR ¿DOM O FRANCIA METROPOLITANA?
Desde hace medio siglo, los departamentos de ultramar (DOM) son el escenario de intensos movimientos migratorios donde se cruzan salidas y retornos de nativos de los DOM y de poblaciones nacidas en Francia metropolitana o en el extranjero. La emigración de los nativos de los DOM, principalmente dirigida hacia la metrópoli, concierne casi exclusivamente individuos en edad de trabajar, motivados por los estudios y el empleo. Este estudio mide la magnitud de esta emigración y describe su complejidad, centrándose en los mecanismos de selección que actúan tanto en el momento de partir como en el del retorno, en particular según el nivel de educación. Se trata igualmente de evaluar las condiciones de inserción de los nativos de los DOM durante la migración y de apreciar los benefi cios que sacan de ella los que regresan, comparando los individuos mas jóvenes (18-34 anos) con los mayores (35-64 anos); se pretende así esclarecer las evoluciones que, de una categoría de edad a otra, han marcado esta fuerte y duradera tradición de migración. Los resultados inéditos de las encuestas Migrations, famille et vieillissement (MFV) y Trajectoires et origines (TeO), asociados a los datos del censo en los DOM y en Francia metropolitana, permiten analizar de forma detallada la población de los nativos de los DOM cualquiera que sea su lugar de residencia, y así comprender mejor la dinámica actual.
Keywords: DOM native-borns, emigration, return, educational level, labour market integration, job qualifi cation.
Translated by Madeleine Grieve.