Embed Size (px)
Citation preview
B Laboratory Testing, Evaluation, and Analysis of Well Cements
David R. Bell and Erik B. Nelson
Schlumberger Dowel1
B-l INTRODUCTION Laboratory testing of cements and cementing materials is an essential part of the entire cementing process. Testing begins at the manufacturing sites of the cement and addi- tives to monitor product quality, and it continues through the slurry design stages at the pumping service company or operating company laboratories as a specific formula- tion is developed. Evaluation is frequently conducted on samples obtained from the bulk plant as the blend is pre- pared, and on samples taken from storage silos as the ma- terial is placed on location. Field blend samples of both the dry-blended cements and the wet slurry can be ob- tained during mixing for subsequent evaluation, either in the laboratory or on location using portable laboratory equipment. Laboratory examination of samples obtained from the field can sometimes be used as an aid in post treatment investigations.
In general, there are two types of laboratory testing of cements and cementing materials: performance evalu- ation and chemical characterization. The typical oilfield laboratory is engaged primarily in the performance evaluation of cements, through physical measurement of specific slurry properties under simulated downhole con- ditions. This type of evaluation is used mainly in the slurry design stages of a cementing treatment, and in the execution stages to monitor the preparation of the blendedmaterial. Chemical characterization typically in- volves quantitative or qualitative analysis of the slurry components prior to mixing, to ensure their suitability for use. Analytical techniques are used for quality-control purposes at the point of manufacture, to determine that components of a dry-blended cement system are present in the desired quantities, and are blended sufficiently at the bulk plant. Such techniques are also used to monitor the quality of the mix water on location. Correct applica-
tion of a wide variety of laboratory testing methods is necessary to achieve a successful cementing treatment.
This appendix presents a broad overview of laboratory testing procedures and equipment, and is not proposed as a manual for cement laboratory workers. The reader must instead consult the official publications of organizations such as the American Petroleum Institute (API) or the American Society for Testing and Materials (ASTM) be- fore commencing actual work.
B-2 SAMPLE PREPARATION
A meaningful laboratory evaluation of a material is not possible unless the testing is performed using a represen- tative sample of that material. Statistical considerations regarding the choice of sample size may be found in the ASTM Standard C183. Sampling and handling proce- dures for sacked and bulk cement are described in Sec- tion 3 of API Specification 10 (Spec 10). The use of proper storage procedures is particularly important to avoid exposure of the cement to moisture and/or carbon dioxide in the air. Several studies regarding the sampling of blended cements have been reported (Pace et al., 1984; Cobb and Pace, 1985; Gerke et al., 1985; Kunze, 1986; Bell et al., 1988).
The best overall sampling device for blended cements is a diverted flow sampler (Fig. B-l), which permits sampling from a complete cross section of a flowing stream of material. Prior to testing in the laboratory, field blend samples may be split using a mechanical splitter as described in ASTM Specification C 702, because segre- gation of blended components may occur during ship- ping to the laboratory. Similarly, a mechanical splitter may be appropriate for use in obtaining laboratory sam- ples from bulk or sack quantities of multicomponent ad- ditives in the field.
B-l

WELL CEMENTING
I- 5-in. Discharge Pipe
The API Committee on Standardization of Well Cements (Committee 10) acts as a governing body regarding the development of standardized test procedures for the per- formance evaluation of well cement slurries. The proce- dures are published by the American Petroleum Institute as API Spec 10. This publication contains specification tests for neat cement slurries, as well as operational test- ing procedures designed to encompass all conventional slurries. As of this writing, no API testing procedures ex- ist for foamed cements. The procedures are designed to simulate downhole conditions for performance testing in a reasonably equipped field laboratory, and are based on a compromise between realistic wellbore conditions and the practical limitations of the laboratory environment.
B-3.1 Slurry Preparation
The equipment specification and operational procedures for the preparation of oil-well cement slurries in the labo- ratory are contained in Section 5 and Appendix A of API Spec 10. The mixing device is a two-speed, propeller- type mixer, shown in Fig. B-2. Specifications are given for the propeller speeds, mixer blade wear, batch size, and mixing time. Normally, 600 mL of slurry are pre- pared. The mixer is operated at 4,000 RPM for 15 sec- onds (during which all of the cement solids should be added to the mix water), followed by 35 seconds at 12,000 RPM. Cement slurries are very abrasive; as a re- sult, careful monitoring of the mixer blade condition is essential.
Since this method was developed for neat cement slurries, specific procedures for the addition of additives (both liquid and solid) are not provided. Variations in mixing procedures can alter the resultant slurry proper- ties significantly (Roy and Asaga, 1979); therefore, indi- vidual laboratories should establish and adhere to
Figure B-2-Propeller-type mixing device commonly used to prepare well cement slurries (photo courtesy E G & G Chandler Engineering).
supplemental procedures covering items not specifically addressed by Spec 10. Variations in field mixing proce- dures can produce similardifferences in slurry properties at the well site, and attempts have been made to define and improve the correlation between field mixing proce- dures and those used in the laboratory.
The slurry mixing procedure specified by the API is not suitable for the recently developed ultralow-density systems containing microspheres or nitrogen as an ex- tender (Chapter 3). As of this writing, no standardized procedure for preparing such systems in the laboratory has been approved. Hollow microspheres are easily bro- ken under high shear; consequently, the mixer must be operated at a low propeller speed. A kitchen-type mixer, which operates in the fashion of an egg beater, is also ap- propriate.
Foamed cements are routinely prepared in a propeller- type mixer. A base cement slurry containing surfactant is foamed at a high propeller speed until it completely fills
B-2

LABORATORY TESTING. E1’ALUATION. AND ANALYSIS OF WELL CEMENTS
the mixer bowl. The foamed cement density is varied by adjusting the amount of base slurry added to the mixer bowl. The disadvantage of this procedure is that the foam is not prepared under simulated high-pressure field con- ditions. However, some pressurized testing methods were recently described by de Rozikres and Ferrii?re (1990).
B-3.2 Thickening Time
Thickening time tests are designed to determine the length of time which a cement slurry remains in a pump- able fluid state under simulated wellbore conditions of temperature and pressure. The specifications and opera- tional procedures for determining slurry thickening time are contained in Section 8 and Appendix E of Spec 10.
The test slurry is evaluated in a pressurized consis- tometer, shown in Fig. B-3, which measures the consis- tency of the test slurry contained in a rotating cup while under simulated wellbore conditions. Most apparatuses are capable of exposing cement slurries to a maximum temperature and pressure of 400°F and 25,000 psi (204°C and 17.5 MPa); however, special units capable of 600°F and 40,000 psi (3 15°C and 280 MPa) are available for deep-well applications. A smaller portable consis- tometer, using a rotating paddle in a stationary cup, has been introduced recently (Fig. B-4). Thickening time results are reportedly consistent with those obtained with the conventional apparatus, and the API is considering a modification of Spec 10 procedures to include this con- figuration. A nonpressurized, or “atmospheric,” consis- tometer (Fig. B-5) can be used to obtain a thickening time for low-temperature cement systems; however, to- day it is most commonly used for conditioning of slurries (according to various API procedures) before rheology. fluid-loss, or free-water tests.
The pumpability or consistency of the slurry is mea- sured in Bearden units (Bc), a dimensionless quantity with no direct conversion factor to more common units of viscosity such as the poise. The end of a thickening time test is defined when the cement slurry reaches a consis- tency of 100 Bc; however, 70 Bc is generally considered to be the maximum pumpable consistency. l?igure B-6 shows the output from a typical thickening time test. No provision for slurry fluid loss is made in the design of a consistometer slurry cup; therefore, the thickening time for a slurry in the wellbore may be different from that for the same slurry in the laboratory, particularly if the de- sign specifies little or no fluid-loss control.
Appendix E of API Spec 10 contains schedules which specify the rate at which temperature and pressure are increased, as well as the final temperature and pressure,
Figure B-J-Pressurized consistometer.
during the thickening time test. Such schedules have been derived from field data on wells with different depths and temperature gradients, and are designed to more accurately simulate the conditions to which the ce- ment slurry would be exposed in a well. Schedules are given for casing, liner, and squeeze cementing treat- ments. A typical example is shown in Fig. B-7. Appendix K of API Spec 1.0 contains special methods fol testing the thickening time of cement systems to be placed in an Arctic environment.
During the job execution, a flowing cement slurry is exposed to continuously changing pressure and tempera- ture; consequently, measurement of the circulating tem- perature and pressure profile in the wellbore is very
B-3

WELL CEMENTING
Figure B-4-Portable consistometer.
Figure B-S-Atmospheric consistometer (photo cour- tesy E G & G Chandler Engineering).
Temperature (OF)
Figure B-6-Typical thickening time test output.
difficult. The highest temperature and highest pressure to which a slurry is exposed may not occur at the same point in the wellbore; consequently, they may not occur at the same time. Also, a slurry placed near the top of a long cement column almost certainly will be exposed to higher temperatures and pressures during circulation at deeper depths. At present, none of these factors is consid- ered in the official API schedules.
Temperature and pressure can have a pronounced ef- fect on measured thickening time. Although simulating the dynamic wellbore environment in the laboratory is difficult, refinements in procedures and improvements in equipment are helping make possible more realistic labo-
B-4

LABORATORY TESTING. EVALUATION, AND ANALYSIS OF WELL CEMENTS
1 2 3 4 5 6 7 8
Temperature Gradient, “F/100 ft depth (“WOO m depth) Temperature, “F (“C)
Pressure,
Time A
,0.4,‘1.6,’ ;.l,'q i.3i2.4; ,l.!J2.3’ fl.7i3.1; :.“L3.5’\
(min) psi (kpa) “F (“C) “F (“C) OF (“C) “F (“C) OF (“C) “F (“C)
SCHEDULE 5g
Depth: 8000 ft (2440 m) Mud Density: IO lb/gal (1.2 kg/L)
0 1000 ( 6900) 80 (27) 80 (27) 80 (27) 80 (27) 80 (27) 80 (27) 2 1300 ( 9000) 83 (28) 83 (28) 83 (28) 84 (29) 85 (29) 86 (30) 4 1600 (11000) 86 (30) 87 (31) 87 (31) 89 (32) 90 (32) 92 (33) : 2200 1900 (13100)
(15200) 90 93 (32)
(34) 90 94 (32)
(34) 91 95 (33)
(35) 97 93 (34)
(36) 94 99 (34)
(37) 103 97 (36)
(39) IO 2500 (17200) 96 (36) 97 (36) 99 (37) 101 (38) 104 (40) 109 (43) 12 2800 (19300) 100 (38) 101 (38) 103 (39) 106 (41) 108 (42) 115 (46) 14 3100 (21400) 103 (39) 104 (40) 107 (42) 110 (43) 113 (45) 120 (49) 16 3400 (23400) 106 (41) 108 (42) 111 (44) 114 (46) 118 (48) 126 (52) 18 3700 (25500) 110 (43) 111 (44) 115 (46) 119 (48) 122 (50) 132 (56) 20 4000 (27600) 113 (45) 115 (46) 119 (48) 127 (53) 138 (59) 22 4300 (29600) 116 (47) 118 (48) 123 (51)
:z [:A; 132 (56) 143 (62)
24 4600 (31700) 120 (49) 122 (50) 127 (53) 131 (55) 136 (58) 149 (65) 26 4900 (33800) 123 (51) 125 (52) 131 (55) 136 (58) 141 (61) 155 (68) 28 5200 (35900) 126 (52) 129 (54) 135 (57) 140 (60) 146 (63) 160 (71)
Heating Rate,"F/min 1.64 1.75 1.96 2.14 2.36 2.86 (Wmin) (0.91) (0.97) (1.09) (1.19) (1.31) (1.59)
SCHEDULE 6g
Depth: 10,000 ft (3050 m) Mud Density: 12 lb/gal (1.4 kg/L)
0 1250 ( 8600) 80 (27) 80 (27) 80 (27) 80 (27) 80 (27) 80 (27) 2 1600 (11000) 83 (28) 84 (29) 84 (29) 85 (29) 85 (29) 86 (30) 4 1900 (13100) 87 (31) 87 (31) 89 (32) 90 (32) 91 (33) 93 (34) 6 2300 (15900) 90 (32) 91 (33) 93 (34) 95 (35) 96 (36) 100 (38) 8 2600 (17900) 94 (34) 95 (35) 98 (37) 99 (37) 102 (39) 107 (42)
IO 3000 (20700) 97 (36) 98 (37) 102 (39) 104 (40) 107 (42) 113 (45) 12 3300 (22800) 101 (38) 102 (39) 107 (42) 109 (43) 113 (45) 120 (49) 14 3700 (25500) 104 (40) 106 (41) 111 (44) 114 (46) 118 (48) 127 (53) 16 4000 (27600) 108 (42) 109 (43) 116 (47) 119 (48) 124 (51) 134 (57) 18 4400 (30300) 111 (44) 113 (45) 120 (49) 124 (51) 129 (54) 140 (60) 20 4700 (32400) 115 (46) 117 (47) 124 (51) 129 (54) 135 (57) 147 (64) 22 5100 (35200) 118 (48) 120 (49) 129 (54) 133 (56) 140 (60) 154 (68) 24 5400 (37200) 122 (50) 124 (51) 133 (56) 138 (59) 146 (63) 161 (72) 26 5700 (39300) 125 (52) 128 (53) 138 (59) 143 (62) 151 (66) 167 (75) 28 6100 (42100) 129 (54) 131 (55) 142 (61) 148 (64) 157 (69) 174 (79) 30 6400 (44100) 132 (56) 135 (57) 146 (63) 153 (67) 162 (72) 180 (82) 32 6800 (46900) 135 (57) 139 (59) 150 (66) 158 (70) 168 (76) 187 (86) 34 7100 (49000) 138 (59) 142 (61) 154 (68) 163 (73) 174 (79) 193 (89) 36 7500 (51700) 141 (61) 146 (63) 158 (70) 167 (75) 180 (82) 200 (93)
Heating Rate,"F/min 1.69 1.83 2.17 2.42 2.78 3.33 (Wmin) (0.94) (1 .OO) (1.21) (1.34) (1.54) (1.85)
Figure B-7-Example of API thickening time schedule.
B-5

WELL CEMENTING
ratory evaluations of slurry performance. As a result, the API schedules are presently being revised, based on new industry surveys made in 1987-1988. New schedules will be derived from and published with formulas for cal- culation of appropriate test conditions for laboratory evaluation, including provisions for reducing test pres- sure and temperature to simulate slurry placement at the top of a long cement column. Computer simulators for the calculation of test parameters from well data are be- ing developed, and new instrumentation is available which provides precise control of temperature and pres- sure during a thickening time test.
B-3.3 Fluid Loss
Fluid-loss tests are designed to measure the slurry dehy- dration during and immediately following the comple- tion of the placement phase of a cementing treatment. Operational test procedures for the determination of the fluid-loss rate are contained in Appendix F of API Spec 10. After being subjected to simulated wellbore condi- tions in a consistometer, the test slurry is placed in a
heated filter press cell, shown in Fig. B-8, and the filtrate loss at either 100 psi or 1,000 psi differential pressure is measured across a standard filtration medium (325 mesh screen supported on a 60 mesh screen). The duration of the test is 30 minutes, and the filtrate volume (Rcl) is noted. If all of the filtrate passes through the screen in less than 30 minutes, the following equation is used to calculate a hypothetical Ru.
F3(, = F, 5.477 It
F, is equal to the volume of filtrate (mL) collected at time t (min).
The prescribed test evaluates slurry fluid loss under static conditions (immediately following placement). No provision is made in this procedure for the measurement of fluid loss during placement, although results of fl uid- loss determinations under dynamic conditions have been reported (Bannister, 1978).-

LABORATORY TESTING. EVALUATION. AND ANALYSIS OF WELL CEMENTS
Figure B-g-Filter press assembly for high-tempera- ture fluid-loss tests.
The maximum temperature for which there is a speci- fied API test procedure is 250°F (12 I ‘C). Higher circu- lating temperatures are routinely encountered in geo- thermal and deep oil and gas wells, and a special filter press assembly is available for fluid-loss testing at tem- peratures as high as 400°F (204°C) (Fig. B-9); however, for safety reasons, the differential pressure is limited to 500 psi.
A major logistical disadvantage of the present fluid- loss testing procedure is the necessity to transfer a heated slurry from the consistometer to the heated filter press cell. The process is awkward, and presents a safety haz- ard when high circulating temperatures are involved. To ameliorate this situation, several instrument manufac- turers have recently developed stirring fluid-loss test equipment, which provides the capability of determining a slurry’s fluid-loss rate without the necessity of transfer- ring a heated slurry from one vessel to another (Fig. B-10). The API is presently working to revise the ap-
Figure B-lo-Stirring fluid-loss testing apparatus (photo courtesy of E G & G Chandler Engineering).
proved procedures, and to include the new equipment in the specifications.
B-3.4 Compressive Strength
The API specifications and procedures for the determi- nation of compressive strength are described in Section 7 and Appendix D of API Spec 10. Test cement slurries are prepared according to the API mixing procedure, poured into two-inch cube molds, and cured for various time pe- riods at specific temperatures and pressures. The set ce- ment cubes are removed from the molds, and placed in a hydraulic press where increasing uniaxial pressure is ex- erted on each until failure. The compressive strength is then calculated by dividing the pressure at which failure occurred by the cross-sectional area of the specimen.
Figure B-l 1 shows a typical curing mold which makes two test specimens. API procedures are given for curing at pressures from atmospheric to 3,000 psi. Forat- mospheric tests, curing can be performed in a water bath, or a cooling bath to simulate cold weather or permafrost
B-7

WELL CEMENTING
Figure B-II-2-in. curing molds for compressive strength testing.
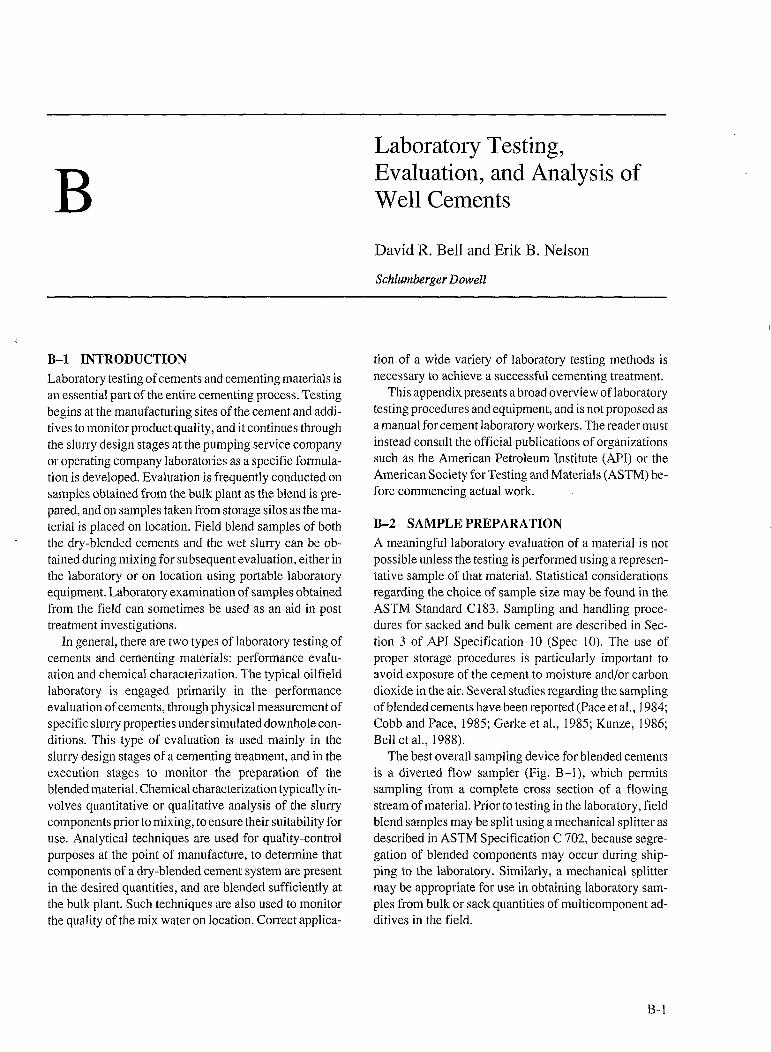
conditions. Pressurized curing chambers, such as the de- vice shown in Fig. B-12, are available in various sizes and with varying performance capabilities. One can pres- ently obtain units which hold up to 32 specimens, and with maximum operating conditions of 600°F (315°C) and 20,000 psi. Appendix D of API Spec 10 contains the prescribed heat-up and pressurization schedules which, like the thickening time schedules, are derived from field data and the anticipated wellbore temperature gradient. For Arctic cement systems, special curing methods are given in Appendix K. In addition, a method for evaluat- ing a cement system’s resistance to freeze/thaw cycling is given. When the specimens are placed in the hydraulic press for strength measurement (Fig. B-13), the rate of loading is regulated depending upon the anticipated strength of the specimen.
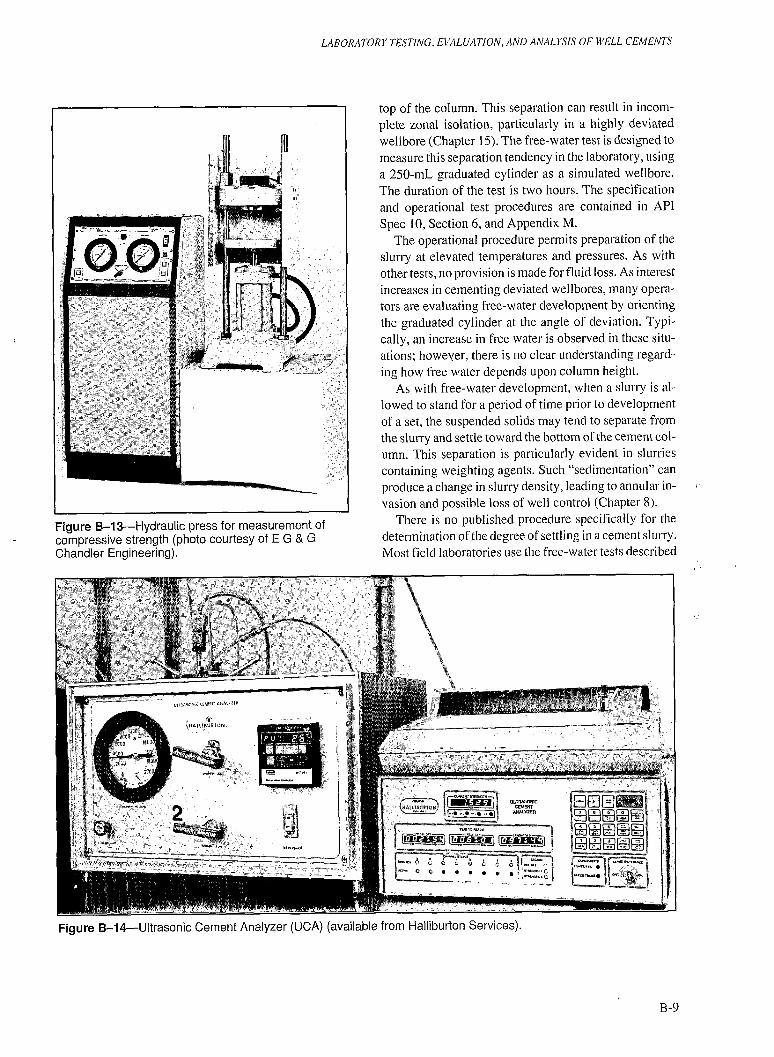
A relatively recent development is the estimation of compressive strength from the ultrasonic velocity (Rao et al., 1982). The Ultrasonic Cement Analyzer (UCA), shown in Fig. B-14, measures the sonic travel time of ul- trasonic energy through a cement sample as it cures un- der simulated wellbore conditions of temperature and pressure. The ultrasonic measurement is nondestructive, and may be made continuously as the cement sample cures at high pressure and elevated temperature. The ul- trasonic velocity directly measures the bulk compressi- bility of the sample, but this is found to be well-corre- lated with compressive strength. The compressive strength estimate can be output directly via a prepro- grammed microprocessor.
Compressive strength measurements are designed to furnish some indication of the ability of a set cement to
B-8
igure B-12-Pressurized curing chamber for com- pressive-strength tests (photo courtesy E G & G Chandler Engineering).
provide zonal isolation, and to protect and support the pipe. However, the compressive strength values obtained using either the API crush test or the UCA are indicative of the integrity of the cement under uniaxial loading (no lateral restraint). In the wellbore, the cement is subject to complex triaxial loading, and the failure stresses may be substantially different from those observed in the stan- dard compressive strength test (Neville, 198 1). Further- more, the compressive strength measurement provides no guide to the shear strength of the casing/cement or the casing/formation bond (Parcevaux and Sault, 1984).
B-3.5 Free Water and Slurry Sedimentation
When a slurry is allowed to stand for a period of time prior to the set, water may separate from the slurry, mi- grate upward, and accumulate either in pockets or at the
LABORAI’ORY TESTING. EVALUATION, AND ANALYSlS OF WELL CEMENTS
Figure B-13-Hydraulic press for measurement of compressive strength (photo courtesy of E G & G Chandler Engineering).
top of the column. This separation can result in incom- plete zonal isolation, particularly in a highly deviated wellbore (Chapter 15). The free-water test is designed to measure this separation tendency in the laboratory, using a 250-mL graduated cylinder as a simulated wellbore. The duration of the test is two hours. The specification and operational test procedures are contained in API Spec 10, Section 6, and Appendix M.
The operational procedure permits preparation of the slurry at elevated temperatures and pressures. As with other tests, no provision is made for fluid loss. As interest increases in cementing deviated wellbores, many opera- tors are evaluating free-water development by orienting the graduated cylinder at the angle of deviation. Typi- cally, an increase in free water is observed in these situ- ations: however, there is no clear understanding regard- ing how free water depends upon column height.
As with free-water development, when a slurry is al- lowed to stand for a period of time prior to development of a set, the suspended solids may tend to separate from the slurry and settle toward the bottom of the cement col- umn. This separation is particularly evident in slurries containing weighting agents. Such “sedimentation” can produce a change in slurry density, leading to annular in- vasion and possible loss of well control (Chapter 8).
There is no published procedure specifically for the determination of the degree of settling in a cement slurry. Most field laboratories use the free-water tests described
Figure B-l4-Ultrasonic Cement Analyzer (UCA) (available from Halliburton Services).
B-9

WELL CEMENTING
in Spec 10, making a visual observation of any distinct settling which may be present. Settling can also be determined by sectioning a column of set cement, and comparing the density of the individual segments.
B-3.6 Permeability The permeability of the cement sheath is a vital parame- ter with regard to zonal isolation. An operational procedure for determining the water permeability of set cement is contained in API Spec 10, Appendix G. The ap- paratus and procedure were developed in the early 1950s (Morgan and Dumbauld, 1952). Water at a differential pressure of 20 to 200 psi ( 100 to 1,400 kPa) is forced through a sample of set cement. Water is flushed through the specimen for a maximum of 15 minutes, or until one milliliter has been accumulated in the measuring tube. Darcy’s law (Eq. B-2) is used to calculate the per- meability.
K= 14,7009 (B-2)
where
K = permeability (md),
Q = flow rate (mL/sec),
P = water viscosity (cp),
L = sample length (cm),
A = sample cross-sectional area (cm?), and
P = differential pressure (psi).
Many laboratories today use a Hassler sleeve-type holder prescribed in an alternative test preparation (Fig. B-151, and measurement of permeability to air, methane, or other gases is fairly routine using the newer instrumenta- tion (API, 1960). This procedure is also presented in Ap- pendix G of API Spec 10.
B-3.7 Rbeological Measurements
A detailed discussion of cement rheological properties and their significance is found in Chapter 4, and a sum- mary of the pertinent relationships is presented in Ap- pendix A. The use of these relationships for accurate pre- diction of friction pressure drops and slurry flow properties depends upon reliable laboratory measure- ments of the rheological parameters.
Two basic types of apparatuses are used today for rheological measurements: capillary pipe rheometers and coaxial cylinder rotational viscometers. As shown in Fig. B-16, rotational viscometers are designed either with a rotating outer cyIinder (Couette type, covered by API Spec. 10, Appendix H) or a rotating inner cylinder (Sear1 type). Although the intrinsic design of the capillary pipe rheometer (Fig. B-17) makes it the pre-
ferred technique for use with non-Newtonian fluids (Bannister, 1980; Bannister and Bdnge, 198 1) (Chapter 4), it is difficult and time consuming to use routinely. Conversely, the coaxial cylinder rotational viscometers are quick and easy to use.
In addition to friction pressure and flow regime calcu- lations, laboratory measurements of rheological parame- ters can provide information about other slurry characteristics. A decrease in values for shear stress when measured in order of decreasing shear rate com- pared to values measured in orderorincreasing shear rate - may indicate that the slurry is thixotropic. A determina- tion of gel strength, using the procedure described in API RP 13B, Section 2, will provide an indication of a slurry gelation tendency. The procedure in API Spec IO pre- scribes a conditioning period of 20 minutes in an atmos- pheric consistometer prior to measurement of the rheological parameters; however. measurements taken immediately after mixing may provide some indication of slurry mixability, particularly in a batch mixer.
B-3.8 Expansion
Set cement expansion can be measured using the proce- dure described in ASTM Specification C 15 I. This pro-
Figure B-15-Apparatus to measure water perme- ability.
B-10

LABORATORY TESTING. EC’ALUATION. AND ANALYSIS OF WELL CEMENTS
Figure B-16-Couette-type and Searl-type rotational viscometers.
cedure, developed for the concrete industry, involves placing the cement slurry into a bar-type mold and curing under water at atmospheric pressure. The cement bar is removed from the mold when it is sufficiently strong. the
Figure B-l-/-Pipe-flow rheometer.
length is carefully measured, and the bar is returned to the water bath for further curing. Periodically, during the curing period, the bar is removed for subsequent length measurements. The ASTM method has two major draw- backs: ( 1) since the cement must develop some strength before a length is measured, it is impossible to obtain a reliable “zero reading,” and (2) there is no provision fol studying the effect of pressure.
In 1983, Spangle invented an apparatus for measuring cement expansion which allows the simulation of the wellbore environment, and does not require the removal of the cement from a mold for an initial measurement. As shown in Fig. B-l 8, the device consists of a cylindrical sleeve which has a vertical slit therein. The sleeve is designed to fit inside a standard two-inch cube mold (Section B-3.4). Mounted on the outside of the sleeve are three sets of two pins, each located on opposite sides of the slit, and secured with a coil spring. The sleeve is in a closed position when the slurry is first introduced, and a zero reading of the distance between the three sets of pins’ is taken with a micrometer. If the cement composition expands during the curing period, the circumference of the sleeve increases and the longitudinal slit opens. After
Figure B-18-Curing sleeves for measurement of cement expansion.
B-l 1

WELL CEMENTING
the mold is removed from the curing chamber, the distances between the pins are remeasured, and the de- gree of expansion is easily calculated according to the following equation.
% expansion = (;(c&- l)), (B-3)
where
C, = distance between the pins when the sleeve is empty,
C, = distance between the pins when the sleeve is ex- panded,
R = inside radius of sleeve, and
I = R plus the length of the pin.
B-3.9 Slurry Density
An operational procedure for determination of slurry density is found in API Spec 10, Appendix C. The proce- dure uses a pressurized mud balance, shown in Fig. B-l 9. In addition to laboratory use, this simple device is frequently used on location to check the accuracy of auto- mated in-line devices. The slurry pressurization in this device compresses entrained air, yielding a more accu- rate determination of slurry density than with a nonpres- surized balance.
B-3.10 Static Gel Strength
The static gel strength of a cement slurry is routinely de- termined by a method developed for drilling fluids (API RP 13B, Section 2). A couette-type rotational viscometer is used.
Procedures specifically developed for the measure- ment of the static gel strength of a cement slurry have been reported (Sabins et al., 1980). These procedures use a consistometer-type apparatus equipped with a low-fric- tion magnetic drive and torque measuring system cou- pled to the paddle. The slow movement of the paddle ap- parently does not inhibit gel-strength development while permitting measurements of torque.
Figure B-l9-Pressurized mud balance (available from Halliburton Services).
B-4 PERFORMANCE EVALUATION OF SPACERS AND CHEMICAL WASHES
As discussed in Chapter 5, spacers and washes perform two important functions in the cementing operation: to clean and remove the drilling fluid from the wellbore, and to minimize cement contamination by the drilling fluid. To accomplish these objectives, the spacer and wash must impart some degree of cleaning effect in the wellbore, and must be compatible with the drilling fluid being displaced from the hole and with the cement slurry being placed in the hole. Laboratory testing of these ma- terials must include procedures to evaluate the cleaning effect and the compatibility.
Operational procedures to evaluate compatibility are contained in API Spec 10, Appendix P. The effects of a spacer or chemical wash upon the thickening time, com- pressive strength, fluid-loss control, and rheological characteristics of the cement system are investigated. The effects of the preflush upon the mud are also tested. Various volumetric ratios of mud, cement, and spacerare specified for the tests.
No specific criteria are provided to aid in the interpre- tation of the test results. No such criteria appear to have been published, and the user must employ sound engi- neering judgment in evaluating and interpreting test re- sults to determine fluid compatibility.
Standard procedures to evaluate the mud removal ca- pability of preflushes have not been published. A qualita- tive observation of the cleaning ability can be obtained by soaking a glazed tile in the drilling fluid, clamping the tile on the end of a rod, attaching the rod to a stirring mo- tor, and rotating the tile in a container of the spacer/wash being evaluated for a period of time equal to the designed contact time of the spacer/wash across a specified section of the wellbore. Results of this observation may indicate a need to modify the spacer/wash formulation and/or the contact time.
B-5 CEMENT CHARACTERIZATION AND ANALYSIS
Characterization of cement and cementing materials in the laboratory involves the application of appropriate analytical techniques to provide achemical and/or physi- cal description of the sample as a whole or of the chemi- cal constituents of the sample. This physico-chemical identification may include a qualitative determination of the chemical species present, a quantitative measurement of the amount of one or more of these species present, and a determination of physical properties of one or more of these species or of the sample as a whole. Four types of samples typically are examined in an oilfield cementing laboratory: neat cement powder, dry-blended cement, set
B-12