Embed Size (px)
Citation preview

WISCONSIN DOTPUTTING RESEARCH TO WORK
Research & Library Unit Wisconsin Highway Research Program
Laboratory Study of Concrete Properties toSupport Implementation of the New AASHTO
Mechanistic-Empirical Pavement Design Guide
Jacob Effinger, Ruipeng Li, Jessica Silva, Steven M. Cramer
University of Wisconsin - MadisonDepartment of Civil and Environmental Engineering
WisDOT ID no. 0092-10-11September 2012

WISCONSIN HIGHWAY RESEARCH PROGRAM #0092-10-11
Laboratory Study of Concrete Properties to Support Implementation of the New AASHTO Mechanistic Empirical
Pavement Design Guide
Final Report
Jacob B. Effinger Ruipeng Li
Jessica Silva Steven M. Cramer
University of Wisconsin – Madison
Department of Civil and Environmental Engineering
Submitted to:
THE WISCONSIN DEPARTMENT OF TRANSPORTATION
September 2012

i
Acknowledgments The authors gratefully acknowledge the support of the Wisconsin Highway Research Program for financial support of this project. Accomplishment of the research was achieved through valuable contributions of a team of experts. The cooperation of member companies of the Wisconsin Concrete Pavement Association is appreciated with acknowledgement for their special assistance in the purchase of the CTE test apparatus. The contributions and cooperation of aggregate, cement, slag cement, and fly ash suppliers who donated materials to enable this research are appreciated. The additional support and recommendations from involved members of the Wisconsin Department of Transportation was also helpful to the completion of this project. The assistance of William Lang and Carole Kraak of the Structures and Materials Testing Laboratory at the University of Wisconsin-Madison is also greatly appreciated. Dr. Jose Munoz conducted the particle size distribution of cementitious and microfine materials at the Turner-Fairbank Highway Research Laboratory and Ryan Shedivy of the Geological Engineering Program at the University of Wisconsin-Madison assisted in the mineralogical identification of coarse aggregates. LaFarge North America provided the chemical analysis of the cementitious materials through the coordination efforts of Andrea Breen. These contributions are appreciated and contributed significantly to successful completion of the research. Disclaimer This research was funded through the Wisconsin Highway Research Program by the Wisconsin Department of Transportation and the Federal Highway Administration under Project # 0092-10-11. The contents of this report reflect the views of the authors who are responsible for the facts and accuracy of the data presented herein. The contents do not necessarily reflect the official views of the Wisconsin Department of Transportation or the Federal Highway Administration at the time of publication. This document is disseminated under the sponsorship of the Department of Transportation in the interest of information exchange. The United States Government assumes no liability for its contents or use thereof. This report does not constitute a standard, specification or regulation. The United States Government does not endorse products or manufacturers. Trade and manufacturers’ names appear in this report only because they are considered essential to the object of the document.

ii
Technical Report Documentation Page 1. Report No. 0092-10-11
2. Government Accession No
3. Recipient’s Catalog No
4. Title and Subtitle Laboratory Study of Concrete Properties to Support Implementation of the New AASHTO Mechanistic-Empirical Pavement Design Guide
5. Report Date September 2012 6. Performing Organization Code
7. Authors Jacob B. Effinger, Ruipeng Li, Jessica Silva, Steven M. Cramer
8. Performing Organization Report No.
9. Performing Organization Name and Address University of Wisconsin – Madison Department of Civil and Environmental Engineering 1415 Engineering Drive, Madison, WI 53706
10. Work Unit No. (TRAIS) 11. Contract or Grant No. WisDOT SPR# 0092-10-11
12. Sponsoring Agency Name and Address Wisconsin Department of Transportation Division of Business Management Research & Library Unit 4802 Sheboygan Ave. Rm 104 Madison, WI 53707
13. Type of Report and Period Covered Final Report, 2009-2012 14. Sponsoring Agency Code
15. Supplementary Notes
16. Abstract Properties of concrete embodying materials typically used in Wisconsin paving projects were evaluated in support of future implementation of the AASHTO Mechanistic-Empirical Pavement Design Guide (MEPDG). The primary concrete properties studied were compressive strength, flexural strength, modulus of elasticity, indirect tensile strength, coefficient of thermal expansion, and Poisson’s ratio. Materials included fifteen sources of coarse aggregate, two sources of fine aggregate, two sources of ordinary Portland cement, two sources of slag cement, and three sources of fly ash. The results showed the type of coarse aggregate had the greatest effect on all concrete properties compared to the rest of the components changed in this study. MEPDG pavement thickness design was found to vary with coarse aggregate source and the use of supplementary materials. The MEPDG default level 2 and 3 empirical relations for material properties proved conservative for typical Wisconsin pavement projects based on predicted critical thicknesses. Two alternative options for empirical equations based on this study’s test results were found to be more accurate to actual test results than default level 2 empirical relations. One option was a least-squares best fit property prediction line based on all the test results. The other option was to split the concrete property predictions into two equations based on coarse aggregate mineralogy. Comparisons with previous relevant WHRP reports are included.
17. Key Words Mechanistic-empirical pavement design guide, concrete,
pavement, coarse aggregate, slag cement, fly ash, compressive strength, flexural strength, modulus of elasticity, tensile strength, coefficient of thermal expansion, Poisson’s ratio
18. Distribution Statement
No restriction. This document is available to the public through the National Technical Information Service 5285 Port Royal Road Springfield VA 22161
18. Security Classif.(of this report) Unclassified
19. Security Classif. (of this page) Unclassified
20. No. of Pages
21. Price
Form DOT F 1700.7 (8-72) Reproduction of completed page authorized

iii
Executive Summary
Project Summary The new AASHTO Mechanistic-Empirical Pavement Design Guide (MEPDG) is a pavement design program based on predicted performances of a pavement using a set of mechanistic and empirical models that take site conditions, environmental effects and material characteristics into consideration. The Wisconsin Department of Transportation (WisDOT) is exploring implementation of the MEPDG for more efficient and cost effective concrete pavement designs. Factors influencing the behavior and durability of a pavement include site conditions, climate, traffic, and material characteristics. These factors are integrated within a set of mechanistic and empirical models to obtain a prediction of the pavement’s performance over the course of its design life. The empirical relations contained within the MEPDG provide alternative approaches to the selection of concrete modulus of rupture and modulus of elasticity for pavement distress and response calculations. The parameters required by the MEPDG for the prediction of new or reconstruction design of Jointed Plain Concrete Pavement (JPCP), Continuously Reinforced Concrete Pavement (CRCP) and Portland Cement Concrete (PCC) overlay include compressive strength, flexural strength, modulus of elasticity, indirect tensile strength, coefficient of thermal expansion, Poisson’s ratio, and unit weight. This research was directed toward assessing the material properties and the sensitivity of MEPDG JPCP designs through the collection of data representative of concretes used in state paving projects. The objective this research was to investigate the effects of different concrete component materials on key concrete mechanical and thermal properties. In addition, the impact of using the current default empirical equations in the MEPDG versus the actual measured concrete properties was evaluated. Background Accurate prediction of key concrete properties is essential to make MEPDG beneficial to pavement designers. Many factors affect concrete properties because of the material’s variable nature. These factors include but are not limited to: the constituents, proportions, air content, mixing procedure, temperature, etc. (Popovics, 1998). A significant variability introduced into the design program is uncertainty on the properties and resulting impact of constituent materials that can vary significantly within the state. Concrete made with limestone coarse aggregate was reported to be 11% to 25% stronger in compressive strength compared to comparable concrete with igneous coarse aggregate (Lebarca et. al., 2007). However, the exact effect of this effect on MEPDG designs remains unclear. It is also known that coarse aggregate and cement are more significant in influencing concrete modulus of elasticity than fly ash (ACI Committee, 2003), though quantitative effects have not been established for Wisconsin materials. Determining whether a component material has a significant impact on predicted JPCP performances by MEPDG helps to establish what level of investigation should be assigned to the component. The MEPDG software represents a major change in the pavement design process. The designer first considers site conditions (traffic, climate, and subgrade for new pavement design, and additionally existing pavement condition for rehabilitation) and construction conditions in proposing a trial design for a new pavement or rehabilitation. The trial design is then evaluated for adequacy through the prediction of key distresses and smoothness. If the design does not meet desired performance criteria, it is revised and the evaluation process repeated as necessary. This approach makes it possible to optimize the design and insure that specific distress types will not develop.

iv
JPCP is widely used throughout Wisconsin. As stated earlier, for the concrete strength inputs for JPCP design using MEPDG, modulus of elasticity and modulus of rupture at 7, 14, 28, and 90 day results are required for pavement response and distress calculations. When the values of these two parameters at the specified dates are provided directly from laboratory tests, the procedure is considered the level 1 option. The default level 2 option utilizes empirical relations to convert the laboratory measured 7-day, 14-day, 28-day, and 90-day compressive strength (f’c) into the required parameters at corresponding dates. The principle of the level 3 option is that the default relations first convert the level 3 input (28-day f’c or 28-day MR) into the corresponding level 2 inputs (7-day, 14-day, 28-day, and 90-day f’c values), then these level 2 results are further converted into the required parameters utilizing the same empirical relations in level 2 option. Research Plan This study was focused on measuring the effects on concrete properties due to different sources of coarse aggregate, fine aggregate, cement, and supplementary cementitious materials from common Wisconsin areas and determining how the effects compare with predictions associated with the MEPDG’s default empirical relations. The research plan involved four main tasks: Task 1: Evaluate prior research and reports regarding the MEPDG design process and the effects of the concrete constituents on design properties and relationships. Task 2: Characterize the concrete component materials used. Task 3: Collect data from each mixing matrix designed to sufficiently reflect the effects of different concrete component materials on concrete mechanical and thermal properties. Task 4: Evaluate the accuracy of the default empirical relationships in MEPDG for concrete mixed with Wisconsin materials. For tasks 3 and 4, a total of 15 sources of coarse aggregates were selected to be mixed with one source of sand using each of the three different mix proportions, Type I ordinary Portland cement (OPC) only, OPC with slag cement1, and OPC with fly ash composing 45 different mix designs. Five selected coarse aggregates were mixed with another source of cement, slag cement, fine aggregate, and two different sources of fly ash composing 65 additional mixes. These materials were selected to represent a range of typical pavement design in the state of the Wisconsin. Research Process The methodologies of tasks 2 and 3 in the research plan were carried out according to accepted test procedures. Task 2 involved the characterization of the coarse aggregates, fine aggregates, Type I Portland cement, slag cement, and fly ash materials. Testing included chemical composition (ASTM C114), scanning electron microscope (SEM) analysis, particle size distribution (PSD), and X-ray diffraction (XRD) of all the cementitious materials, and Blaine fineness (ASTM C204) of the two Type I Portland cements. For the coarse and fine aggregates, testing included gradation (AASHTO T27), absorption (AASHTO T85/84), and materials finer than the No. 200 sieve (AASHTO T11). The microfines of the coarse aggregates were also analyzed with PSD, XRD, reactivity, and leaching tests. Task 3 testing included compressive strength (AASHTO T22), flexural strength (AASHTO T97), modulus of elasticity (ASTM 1 Slag cement is often referred to as “ground granulated blast-furnace slag” (GGBFS). As requested in 2001 by slag cement manufacturers and the Slag Cement Association, the American Concrete Institute officially reviewed and changed the terminology from GGBFS to slag cement (ACI Committee 233, 2003). The term slag cement will be used throughout this paper when referring to finely-ground granulated blast-furnace slag.

v
C496), Poisson’s ratio (ASTM C496), splitting tensile strength (AASHTO T198), dynamic modulus (ASTM C215), and coefficient of thermal expansion (AASHTO T336). A water-to-cementitious material ratio (w/cm) of 0.40 was used for initial mix design, and was modified as necessary to achieve a target slump of 2 in. ± 1 in., and target plastic air content of 6.0% ± 1.0%. The mix proportions for all concrete were based on Wisconsin Department of Transportation Grade A, Grade A-S, and Grade A-F mix designs. Fresh concrete testing included slump (AASHTO T119), unit weight (AASHTO T121), and fresh air content (AASHTO T152). All concrete specimens followed the same curing procedure outlined in AASHTO R39. Primary data for this project was collected in task 3 of the research plan. Compressive strength, flexural strength, modulus of elasticity, Poisson’s ratio, split tensile strength, and dynamic modulus were measured at 7, 14, 28 and 90 day ages. Coefficient of thermal expansion was measured at 28 days. Compressive strength and split-cylinder tensile strength test results for each concrete mix were based on the average of four replicate specimen test results. Flexural strength, modulus of elasticity, Poisson’s ratio, dynamic modulus, and coefficient of thermal expansion test results for each mix were based on the average values of three replicate specimens. The main variables analyzed in mix matrix 1 were fifteen different coarse aggregate sources and three cementitious material compositions. The main variable analyzed in mix matrix 2 with comparisons to matrix 1 was Portland cement source. The main variable analyzed in matrix 3 with comparisons to matrix 1 was supplementary cementitious material source, including two slag cement sources and three fly ash sources. The main variable analyzed in mix matrix 4 was fine aggregate source. Mix matrix 2 and mix matrix 4 were also used to supplement the analysis on the effects of the five supplementary cementitious material sources. Findings and Conclusions The type of coarse aggregate had the greatest effect on all concrete properties. Coarse aggregate type affected concrete modulus of elasticity with much larger magnitude compared to other concrete properties. Modulus of rupture and splitting tensile strength were also affected by changes in concrete components. The effect of cementitious material composition on concrete tensile strength caused observable differences that could impact pavement design. Using the MEPDG program a thickness analysis was conducted to evaluate the effects of changing concrete component materials from test results in task 3. Pavement thickness was found to vary with coarse aggregate source and the use of supplementary materials, especially slag, which improved pavement performance by decreasing the critical thickness required. For most cases, using different sources of Portland cement, slag cement, and fine aggregate did not have a large effect on the pavement thickness. The pavement’s critical thickness varied with the source of fly ash. However, this effect was not as large as that associated with cementitious material type or coarse aggregate type. The effects of modifying default level 2 and level 3 strength input options of the MEPDG were evaluated in the context of critical thickness. The empirical relations within the default level 2 option were shown to be conservative for typical Wisconsin pavement projects by ½ to 1 in. of pavement thickness compared to direct input of the full battery of material properties via input level 1. However, the critical thicknesses obtained from the level 2 strength input option were approximately the same as the ones obtained from level 3 strength input option, meaning the level 3 equation to convert the strength properties to different ages did not introduce new

vi
inaccuracies. Two alternative options were proposed to replace the default level 2 empirical relationships to be more useful for concrete made with Wisconsin materials. One option was the least-squares fit line of all the strength test results from Wisconsin materials. A second option was to split the concrete mixes into two groups, one which covers all granite coarse aggregates and the other one which covers dolomite, basalt, and gabbro aggregates. These attempts to provide simple alternatives to the existing level 2 default equations were only partially successful. The default level 2 equations remained comparable or slightly conservative to the proposed alternatives based on Wisconsin material test results.

vii
Table of Contents Acknowledgments............................................................................................................................ i
Disclaimer ........................................................................................................................................ i
Technical Report Documentation Page .......................................................................................... ii
Executive Summary ....................................................................................................................... iii
1. Problem Statement ................................................................................................................... 1
2. Objectives and Scope of Study ................................................................................................ 1
3. Background and Literature Review ......................................................................................... 2
3.1. Factors Effecting Properties of Concrete ......................................................................... 2
3.2. MEPDG Design Process .................................................................................................. 4
3.2.1. Design Inputs ............................................................................................................ 5
3.2.2. Typical Layered Systems of Jointed Plain Concrete Pavement (JPCP) ................... 7
4. Materials and Methods ............................................................................................................ 8
4.1. General ............................................................................................................................. 8
4.2. Materials ......................................................................................................................... 10
4.2.1. Cementitious Materials ........................................................................................... 10
4.2.2. Coarse and Fine Aggregates ................................................................................... 11
4.2.3. Aggregate Identification and Microfine Analysis ................................................... 12
4.2.3.1. Aggregate Identification .................................................................................. 12
4.2.3.2. Microfine Analysis .......................................................................................... 14
4.3. Mix Design and Specimen Preparation .......................................................................... 15
4.4. Mechanical Testing Methods ......................................................................................... 18
4.4.1. Compression Testing .............................................................................................. 18
4.4.2. Flexural Testing ...................................................................................................... 19
4.4.3. Modulus of Elasticity and Poisson’s Ratio Testing ................................................ 19
4.4.4. Splitting Tension Testing ........................................................................................ 19
4.4.5. Dynamic Modulus Testing ...................................................................................... 19
4.4.6. Coefficient of Thermal Expansion Testing ............................................................. 20
5. Test Results and Comparison to Previous WHRP Reports ................................................... 21
5.1. Material Characteristics.................................................................................................. 21
5.1.1. Cementitious Materials ........................................................................................... 21
5.1.2. Coarse and Fine Aggregate ..................................................................................... 23

viii
5.1.3. Aggregate Identification and Microfine Analysis ................................................... 25
5.1.3.1. Aggregate Identification .................................................................................. 25
5.1.3.2. Microfine Analysis .......................................................................................... 28
5.2. Plastic Concrete Test Results ......................................................................................... 30
5.3. Mechanical Test Results................................................................................................. 31
5.3.1. Compression Tests .................................................................................................. 32
5.3.2. Flexural Tests .......................................................................................................... 33
5.3.3. Modulus of Elasticity and Poisson’s Ratio Tests .................................................... 34
5.3.4. Splitting Tension Tests ........................................................................................... 37
5.3.5. Dynamic Modulus Tests ......................................................................................... 39
5.3.6. Coefficient of Thermal Expansion Tests ................................................................ 40
5.3.7. Effects of Concrete Materials on Pavement Thicknesses ....................................... 41
5.4. Effects of Level 2 Empirical Relationships on Pavement Thickness............................. 44
5.5. Comparison of Results with Previous WHRP Studies ................................................... 51
5.5.1. Effects of Ground Granulated Blast Furnace Slag in PCC – Expanded Study (WHRP 0092-05-01) ............................................................................................................. 51
5.5.2. Investigation of Concrete Properties to Support Implementation of the New AASHTO Pavement Design Guide (WHRP 0092-06-03) .................................................... 56
5.5.3. Reduction of Minimum Required Weight of Cementitious Materials in Concrete Mixes (WHRP 0092-08-08) .................................................................................................. 61
6. Summary of Findings and Recommendations ....................................................................... 65
6.1. Summary of Findings ..................................................................................................... 65
6.1.1. Effects of Changing Concrete Components on Concrete Properties ...................... 65
6.1.2. Effects of Changing Concrete Components on Pavement Design.......................... 66
6.1.3. Effects of Different Empirical Relationships on MEPDG Pavement Design......... 67
6.2. Recommendations .......................................................................................................... 67
Appendix I Bibliography .............................................................................................................. 69
Appendix II Synthesis of Bibliography ........................................................................................ 75
Appendix III Particle Size Distribution for Cementitious Materials and Aggregate Microfines . 79
Appendix IV XRD Scans for Cementitious Materials .................................................................. 81
Appendix V XRD of the Microfines ............................................................................................. 83
Appendix VI XRD Scans for Microfine Reactivity Analysis ....................................................... 89
Appendix VII Concrete Batch Quantities ..................................................................................... 93

ix
Appendix VIII Fresh Concrete Properties .................................................................................... 94
Appendix IX Air Content Analysis............................................................................................. 102
Appendix X Concrete Testing Data ............................................................................................ 115
Appendix XI Statistical Analysis Summary ............................................................................... 118
Appendix XII Data Analysis Example ....................................................................................... 120
Appendix XIII Data Analysis Example Adjusted for Air Content ............................................. 125
Appendix XIV Percent Facture from Splitting Tensile Failure Analysis ................................... 130
Appendix XV Sample Inputs for Thickness Analysis ................................................................ 133

1
1. Problem Statement The achievement of higher quality in the construction of roads and highways has motivated the Wisconsin Department of Transportation (WisDOT) to explore implementation of the new AASHTO Mechanistic-Empirical Pavement Design Guide (MEPDG). This guide is a computer program used for the design of new and rehabilitation of pavement structures that provides engineers with a set of mechanistic and empirical models to predict pavement performance. In particular, major factors that influence the behavior and durability of the pavement including site conditions, climate, traffic, and material characteristics, are integrated within the considerations of a set of mechanistic and empirical models to obtain a prediction of the pavement’s performance and durability. The empirical relations contained within MEPDG provide alternatives to obtain the values of concrete modulus of elasticity and modulus of rupture, required for calculating the pavement’s response and distress. Specifically, the parameters required by the MEPDG for the prediction of new or reconstruction design of Jointed Plain Concrete Pavement (JPCP), Continuously Reinforced Concrete Pavement (CRCP) and Portland Cement Concrete (PCC) overlay include modulus of elasticity, flexural strength, indirect tensile strength, coefficient of thermal expansion, Poisson’s ratio, unit weight, and compressive strength. The accuracy of the predicted pavement performances by MEPDG is believed to be significantly improved when more accurate results of these parameters are obtained and the sources of the variance are understood. With this research, the empirical relations for concrete mechanical characteristics (modulus of rupture and modulus of elasticity) were calibrated specifically for Wisconsin concrete pavement projects. In addition, the effects of changing different concrete component materials on individual concrete mechanical and thermal properties that serve as important inputs for the MEPDG were evaluated. 2. Objectives and Scope of Study It is imperative to collect sufficient data on concrete properties to ensure accurate test results and to understand the sources of variability, facilitating the implementation of MEPDG for higher quality design of Wisconsin pavements. Many factors influence concrete properties, which in turn influence the performances of concrete pavements, including the concrete component materials, mix design, water to cement ratio, air content, workability, and others. This study is limited to the concrete properties critical to pavement design. The effects of different sources of coarse aggregate, fine aggregate, cement, and supplementary cementitious materials on concrete properties were investigated in this research to determine their influences on key concrete mechanical properties. The research plan also involves investigating concrete properties to establish more accurate empirical relations to serve as alternatives for the default ones within the MEPDG software for concrete mixed with Wisconsin materials. The research plan can be summarized by four main tasks: Task 1: Evaluate current literature regarding the MEPDG design process and the effects of the concrete constituents on design properties and relationships. Comparisons of this study’s results will be made to previous WHRP reports similar to this study, as well as current empirical equations used in the MEPDG.

2
Task 2: Characterize the materials used in the study. Aggregate characterization testing
includes gradation, absorption, and microfines2 analysis. Supplementary cementitious material classification testing included chemical composition, Blaine fineness, and SEM and XRD analysis.
Task 3: Collect data from each mixing matrix designed to reflect the effects of different concrete materials on the relationships of different mechanical properties. Testing included compressive strength, modulus of elasticity, Poisson’s ratio, flexural strength, indirect tensile strength, coefficient of thermal expansion, and dynamic modulus. Task 4: Evaluate the accuracy of the default empirical relationships in the MEPDG for Wisconsin materials and assess the applicability of local or project specific empirical relationships for JPCP design in Wisconsin using MEPDG. Factors assessed are coarse aggregate source, fine aggregate source, cement source, and the type and source of supplementary cementitious materials. In order to complete Task 3 and Task 4 at lower costs, variables were further designated as primary and secondary. The primary variable was hypothesized to be the type of coarse aggregate. A total of 15 sources of coarse aggregates were mixed with one source of fine aggregate using each of the three different cement mixes – ordinary Portland cement (OPC) only, OPC with slag cement, and OPC with fly ash, composing of 45 different mixes. Secondary variables were hypothesized to be cement source, slag type, fly ash source, and fine aggregate source. Five of the selected coarse aggregates were mixed with one different source of cement, one different source of slag, two different sources of fly ash, and one different source of sand composing of 65 additional mixes. 3. Background and Literature Review 3.1. Factors Effecting Properties of Concrete Concrete is an inherently variable material and even if most of the variables in the material, such as the constituents, proportions, air content, mixing, temperature, and others, are held constants, there can still be a high variation in strength outcomes depending on the precision of the test procedure, size of the specimens, and curing precautions (Popovics, 1998). The concrete constituents themselves vary significantly throughout the state of Wisconsin. The mineralogy of the aggregate may be vastly different based on the source, or region, from which it was attained. The factor considered to be the most important in controlling concrete strength is the bond of the cement paste to the coarse aggregate. Both aggregate and cement paste can be strong individually, the discontinuous interface between them forms a weakness in the composite nature of the material (Swamy, 1980; Hsu, 1963). Failure occurs when higher stresses at the interface
2 Microfines will be defined as the material finer than 75 µm (passing No. 200 sieve).

3
cause cracks which propagate inside the material (Swamy, 1971). The bond can be affected by microfines adhered to the surfaces and the mineralogy of the aggregate. Mineralogy and microfines differ by aggregate source and will affect the bonding through localized chemical changes or interrupted attachment. Although most microfines are removed through washing procedures, certain microfines like clays are extremely difficult to remove, prohibiting the paste from properly attaching to the aggregate surface. The corresponding weakened area can particularly affect flexural and tensile strengths (Muñoz et al., 2010). In addition, the size, gradation, angularity, and many other characteristics of coarse aggregates could control the strength of such bond, and furthermore the strength of the concrete. Determining empirical relationships for different concrete mechanical properties can be difficult as the relationships tend to vary with the coarse aggregates being used. In a study performed by Ezeldin and Aitcin, the effect of four coarse aggregate sources on the behavior of concrete was found to be inconclusive based on the ratio of flexural to compressive strength. However, it was discovered that in high strength concrete made from limestone aggregate there were higher compressive strengths and different failure planes from the high strength concrete composed of gravel or granite aggregate (Ezeldin and Aitcin, 1991). Another study by Salami, Spring and Zhao testing three aggregate sources showed that aggregate type had a significant influence on the relationships between splitting tensile strength and compressive strength of normal strength concrete. Furthermore, both the moduli of rupture and splitting tensile strength of concrete mixed with all types of aggregate were found not to relate well with compressive strength when taken to the 0.5 power, as suggested by current MEPDG and ACI equations (Oluokun, 1991; Salami et. al., 1993). Most literature supports that the two main classifications of aggregate are natural gravels and crushed stones (Choubane, Wu & Tia, 1996; Ozturan & Cecen, 1997; Popovics, 1998; Hall and James, 2008). Therefore, the mineralogy of the coarse aggregate is often ignored. Although aggregate type may be considered one of the most significant variables of the concrete constituents, other variables need to be addressed. Particularly, the use of supplementary materials can affect the final concrete product. Slag cement affects tensile strength of concrete yielding to a higher concrete modulus of rupture (ACI Committee 233, 2003). However, slag cement concrete was found to have little or no effect on the concrete modulus of elasticity (ACI Committee 233, 2003). Fly ash concrete has been found to increase the later-age strength of concrete as compared to OPC concrete (ACI Committee 232, 2003). However, the difference in modulus of elasticity between fly ash concrete and OPC concrete is not significant, especially when compared to the differences it causes in compressive strength (ACI Committee 232, 2003). The characteristics of the aggregate and cement have a much more significant effect on the modulus of elasticity than fly ash (ACI Committee 232, 2003). Based on a study performed by the University of Wisconsin-Madison it was found that the use of slag cement at a normal replacement level of 30% concrete performed similarly to that using ordinary Portland cement (OPC), differing only slightly in early and late strengths (Labarca et. al., 2007). However, when comparing properties of concrete mixed with grades 100 and 120 slag cement, the grade 120 slag cement concrete performed significantly better (Labarca et. al., 2007). In the same study, noticeable differences in the strengths were found due to slight differences in the chemistry and fineness of Portland cements from different sources (Labarca et.

4
al., 2007). Difference in compressive strength based on cement brand was found to be up to 10% (Labarca et. al., 2007). Comparisons between this study and WHRP 07-01, as well as two other WHRP reports, are shown in section 5.5 of this report. Concrete coefficient of thermal expansion (CTE) is a property related to the dimensional change of concrete subject to heating and cooling cycles. Coarse aggregate mineralogy has been shown to have a significant effect on concrete CTE; specifically, concrete made with natural gravels were reported to have higher concrete CTE values than the concrete made with dolomitic limestone (Buch, 2008; Chung, 2009; Hall and James, 2008; Jahangirnejad, 2009; Mallela, et. al. 2005; Sakyi-Bekoe, 2008; Tran et. al., 2008; Wang et. al., 2008; Won, 2005; Yang, 2003). Concrete CTE was also found to be affected by the cement content, water-to-cement ratio, and relative humidity (Hall and James, 2008; Mallela et. al., 2005). In addition, slag and fly ash were reported to have no significant effect on concrete CTE (Tran et. al., 2008). A comprehensive literature review was conducted on the studies published up to 2011. A bibliography of the information mentioned above as well as other pertinent research can be found in Appendix I. The main concepts of the literature review are mentioned above; however more information is summarized in Appendix II. 3.2. MEPDG Design Process The MEPDG represents a major change in the way a pavement design is performed. The designer first considers site conditions (traffic, climate, and subgrade for new pavement design, and additionally existing pavement condition for rehabilitation) and construction conditions in proposing a trial design for a new pavement or rehabilitation. The trial design is then evaluated for adequacy through the prediction of key distresses and smoothness. If the design does not meet desired performance criteria, it is revised and the evaluation process repeated as necessary (Figure 3.1, MEPDG Analysis Procedure Diagram). This approach makes it possible to optimize the design and to more fully insure that specific distress types will not develop. MEPDG uses a calibrated mechanistic design procedure that allows the integration of material characterization, climate conditions, and traffic loading to be accounted for in the pavement design. For rigid pavements, a two-dimensional finite element program is used to calculate stress distribution inside the pavement for each run of a trial design using MEPDG. The Guide integrates the design methodologies for various types of pavements, providing an equitable basis of computed performance across different pavements. A hierarchical approach for determining the design inputs is utilized in the MEPDG. One of the three distinct levels of input is selected depending on the importance of the project and the availability of data. Level 1 is based on detailed site-specific measurements, level 2 on regional values or regression equations, and level 3 on default values or engineering estimations. The full spectra of axle loads applied to a pavement structure are used in MEPDG to characterize traffic load instead of the equivalent single axle load (ESAL) approach.

5
Figure 3.1: MEPDG analysis procedure diagram (Guide for Mechanistic-Empirical Design of New and Rehabilitated Pavement Structures).
3.2.1. Design Inputs
Four categories of design inputs are discussed in this section, which are general inputs, traffic inputs, climate inputs, and material characterization.
General Inputs
General inputs include site-specific information and analysis reliability. This section provides a general description of the pavement project, including the design life of the pavement project, pavement construction time, traffic opening time, pavement design type, pavement project location, project identification, and traffic direction. Analysis reliability sets up the threshold for the allowable distress and the corresponding confidence level.
Traffic Inputs
Two types of traffic data are usually collected for pavement design: weigh-in-motion (WIM) which provides information about the number and configuration of axles observed within a series of load groups, and automatic vehicle classification (AVC) which counts the number and types

6
of vehicles over a period of time. Traffic data allows three hierarchical levels of inputs. Level 1 requires detailed knowledge of the past and future traffic characteristics based on collection and analysis of historical site-specific traffic volume and load data. Level 2 requires modest knowledge of traffic characteristics dependent on collection of sufficient truck volume information to predict truck volumes accurately. Level 3 allows predictions based on AADT only when traffic characteristics are unknown (Huang, 2004).
Climate Inputs
Climatic information from the selected weather station database and the water table depth at the construction site are the required inputs for the climate section. The climate factors that affect pavement design include temperature and moisture. Temperature gradients cause PCC slabs to curl, and moisture gradients cause PCC slabs to warp. These climate factors affect the contact conditions between the PCC slab and the base layer. Furthermore, the properties of unbound materials are significantly affected by freeze / thaw cycles. The 2002 MEPDG incorporates the Enhanced Integrated Climate Model (EICM), which was improved by the 2002 Guide research team from FHWA’s previous Integrated Climate Model. EICM is a powerful tool to adjust material properties and create temperature profiles based on user provided information, which includes the specific weather station and the water table depth (Huang, 2004).
Material Characterization
Material characterization includes material properties required for computing pavement responses such as elastic modulus and Poisson’s ratio. Additional material inputs substituted into the distress/transfer functions include the modulus of rupture and tensile strength. Additional material inputs are required for the climate model, such as plasticity index, gradation parameters including porosity, effective grain sizes, and thermal properties such as absorptivity, heat capacity, coefficient of thermal expansion. Variables grouped by function categories are shown in Table 3.1. Detailed description of the three input levels and coinciding empirical equations for concrete strength inputs are shown in Table 3.2 Table 3.1: Material inputs considered by function categories. Function category
critical response computations
distress / transfer functions climatic modeling
PCC Materials Modulus of Elasticity (E) Poisson’s Ratio (υ) Unit Weight (ρ) Coefficient of Thermal Expansion (α)
Modulus of Rupture (MR) Compressive Strength (fc’) cement type cement content water to cement (w/c) ratio ultimate shrinkage reversible shrinkage
surface shortwave absorptivity, thermal conductivity, heat capacity

7
Table 3.2: Description of three levels of strength inputs. Input Level Description
1
• Modulus of elasticity (Ec) and modulus of rupture (MR) determined directly by laboratory testing at various ages of 7, 14, 28 and 90 days.
• Estimate the 20-year to 28-day (long term) elastic modulus or modulus of rupture ratio.
• Develop elastic modulus and modulus of rupture gain curve using the test data and long-term modulus ratio to predict E or MR at any time over the design life.
2
• Modulus of elasticity (Ec) and modulus of rupture (MR) determined indirectly from compressive strength (f’c) testing at various ages of 7, 14, 28, 90 days.
• Estimate the 20 year to 28 day compressive strength ratio. • Convert f’c to Ec using the equation,
E = 33 ρ3/2 (f’c)1/2 Equation 3.1
where ρ is the unit weight of the concrete in lb/ft3 and f’c is the compressive strength in psi.
• Convert f’c to Ec using the equation, MR = 9.5 (f’c)1/2 Equation 3.2
where f’c is the compressive strength in psi. • Develop elastic modulus and modulus of rupture gain curve using the test data and
long-term modulus ratio to predict E or MR at any time over the design life.
3
• Modulus of elasticity (Ec) determined indirectly from 28 day estimate of flexural strength (MR) or f’c.
• If 28-day MR is known from testing, then at time t (in years), the MR is determined by the equation,
MR = {1 + log10(t/0.0767) – 0.01566*[log10(t/0.0767)]2}*28-day MR Equation 3.3 • Estimate the Ec (t) by first determining f’c(t) from MR(t) back calculating with
Equation 3.2 and then converting f’c(t) to Ec(t) using Equation 3.1. If 28 day f’c is estimated, first convert it to an MR value using Equation 3.2 and then project MR (t) with Equation 3.3 to get f’c (t) and from that calculate Ec (t) over time using Equation 3.2.
3.2.2. Typical Layered Systems of Jointed Plain Concrete Pavement (JPCP)
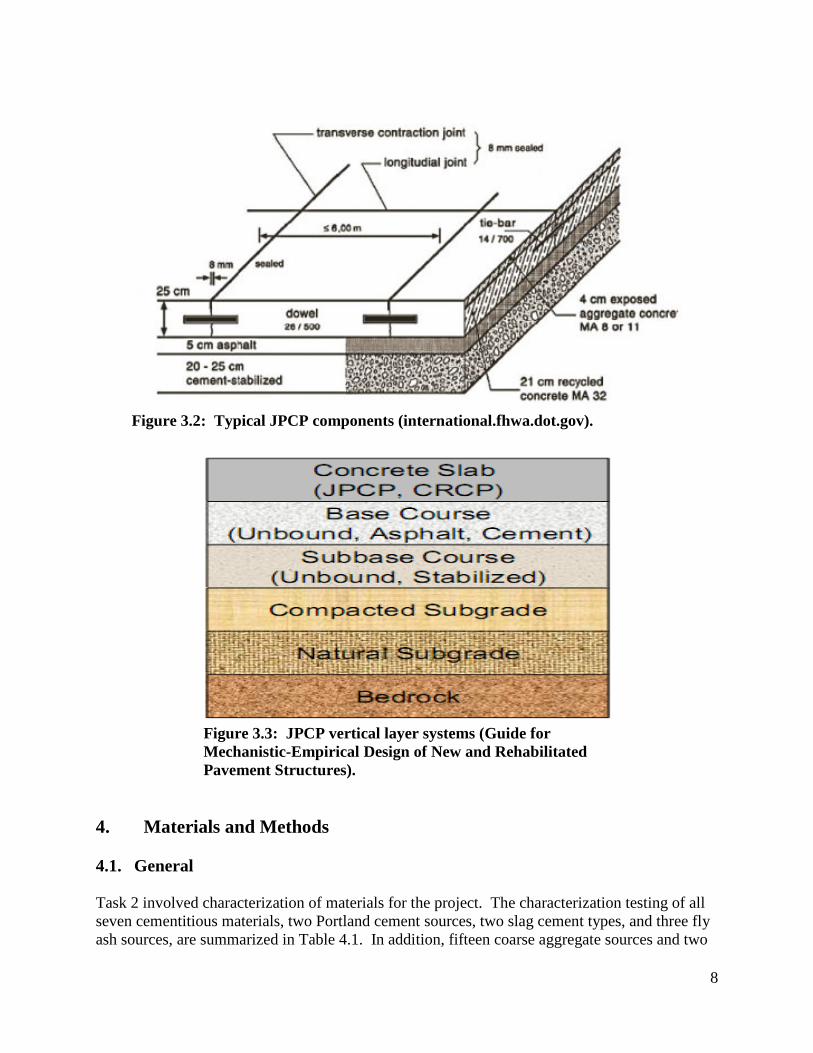
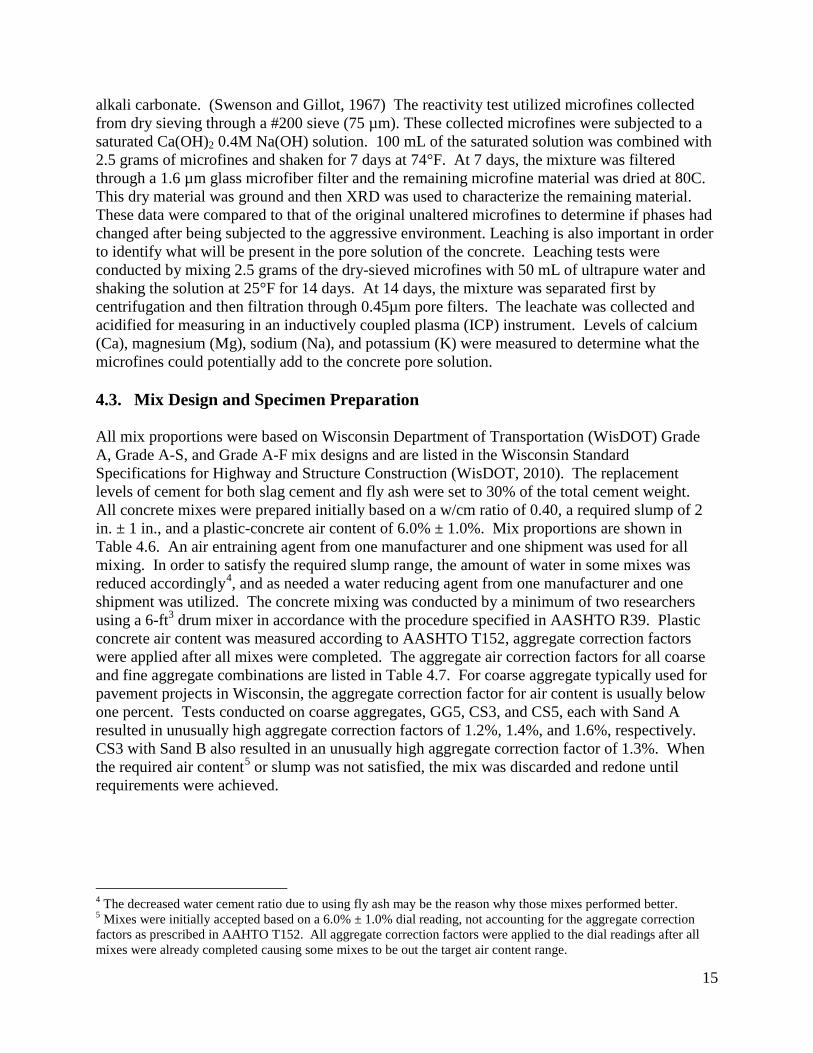
The most commonly used rigid pavement in Wisconsin is the dowelled, jointed plain concrete pavement with a 12-ft lane width. Perpendicular transverse joints are typically spaced at 15-ft. Concrete pavement thicknesses ranges from 6-in to 13-in (Guide for Mechanistic-Empirical Design of New and Rehabilitated Pavement Structures.). Dowell bars range in diameter from 1-in to 1.5-in and are spaced transversely to connect adjacent transverse joints. Tie bars are used to connect the lanes between adjacent longitudinal joints or to connect the lane and the adjacent shoulder when necessary. A typical horizontal view of the JPCP composition is shown in Figure 3.2. Beneath the top layer of the PCC slab, the base layer is either a bound layer, such as a cement stabilized layer, or an unbound layer, such as a coarse aggregate. Under the base layer, there is either a sub-base layer or the sub-grade. If there is no rock under the sub-grade, MEPDG will treat the sub-grade as a semi-infinite layer. A detailed graph showing the vertical layouts of the JPCP system is shown in Figure 3.3.
8
Figure 3.2: Typical JPCP components (international.fhwa.dot.gov).
Figure 3.3: JPCP vertical layer systems (Guide for Mechanistic-Empirical Design of New and Rehabilitated Pavement Structures).
4. Materials and Methods 4.1. General Task 2 involved characterization of materials for the project. The characterization testing of all seven cementitious materials, two Portland cement sources, two slag cement types, and three fly ash sources, are summarized in Table 4.1. In addition, fifteen coarse aggregate sources and two

9
fine aggregate sources were analyzed using testing procedures also summarized in Table 4.1. Task 3 includes mixing, preparing, and testing concrete specimens using the standard testing procedures shown in Table 4.2. All specimens were moist cured until the specified test age, unless specifically noted otherwise. The water to cementitious ratio (w/cm) employed was 0.40, unless modified to achieve the target slump of 2 in. ± 1 in. and fresh air content of 6.0% ± 1.0%3. Table 4.1: Summary of tests conducted in Task 2. Material Test Cements Lafarge-Alpena Chemical Composition ASTM C114, Fineness ASTM C204,
Particle Size Distribution, and SEM/X-ray Imaging St Mary’s-Charlevoix Slag Cement Lafarge-South Chicago Chemical Composition ASTM C114, Particle Size Distribution,
and SEM/X-ray Imaging Holcim-Skyway Fly Ash Columbia-Portage Chemical Composition ASTM C114, Particle Size Distribution,
and SEM/X-ray Imaging Weston-Schofield Edgewater-Sheboygan Coarse Aggregate (# of categories) Glacial Gravels (6) AASHTO T85, AASHTO T27, AASHTO T11, X-ray analysis of
microfines, Particle size distribution of microfines, leaching of ions, and Reactivity test under concrete pore solutions (only for Dolomite aggregates)
Crushed Stones (9)
Fines Aggregates Igneous/metamorphic AASHTO T84, AASHTO T27, AASHTO T11, X-ray analysis of
microfines, Particle size distribution of microfines, leaching of ions, and Reactivity test under concrete pore solutions (only for southern source)
Mostly carbonates
3 Mixes were thrown out based on a 6.0% ± 1.0% dial reading, not accounting for the aggregate correction factors as prescribed in AAHTO T152.

10
Table 4.2: Summary of tests conducted in Task 3.
Test Number of Tests Applicable Standard Concrete Age (days)
Slump One per batch AASHTO T119 0 (fresh) Plastic Air Content One per batch AASHTO T121 0 (fresh)
Unit Weight One per batch AASHTO T152 0 (fresh)
Compressive Strength Four per mix at four ages AASHTO T2311, AASHTO T22 7,14, 28, 90
Modulus of Elasticity and Poisson’s Ratio Three per mix at four ages AASHTO T2311,
ASTM C496 7,14, 28, 90
SplittingTensile Strength Four per mix at four ages AASHTO T198 7,14, 28, 90
Flexural Strength Three per mix at four ages AASHTO T97 7,14, 28, 90 Dynamic Modulus Three per mix at four ages ASTM C215 7,14, 28, 90
Coefficient of Thermal Expansion Three per mix at four ages AASHTO T336 28
4.2. Materials 4.2.1. Cementitious Materials All cementitious materials were used as provided by the manufacturer and are listed in Table 4.3. In order to characterize the cement material, standard chemical composition testing was conducted by LaFarge according to ASTM C114, as well as fineness testing according ASTM C204 for the two Portland cements. The particle size distribution was done at the Turner-Fairbank Highway Research Laboratory. The scanning electron microscope (SEM) analysis was conducted on the cementitious materials to identify general composition and physical features. X-ray diffraction (XRD) patterns of the cementitious materials were utilized to identify the prevalent crystalline structures found in the various sources.
Table 4.3: Sources of cementitious material.
Type Material ID Type I Portland Cement Cement 1 Type I Portland Cement Cement 2 100 Grade Slag Cement Slag 1 120 Grade Slag Cement Slag 2
Class C Fly Ash Fly Ash 1 Class C Fly Ash Fly Ash 2 Class C Fly Ash Fly Ash 3
The following procedure was used to prepare the SEM specimens. A standard aluminum peg was covered with conducting carbon tape. The particles were sprinkled on the tape to allow analysis of individual particles. Each specimen was then coated with a thin layer of gold for 70 seconds at

11
20mV using a Denton Vacuum Desk II sputter coater/etch unit. Each of the samples was examined using a LEO 1530 Scanning Electron Microscope (SEM) in the back scattering electron (BSE) mode using an acceleration voltage of 15 kV. XRD analysis was conducted by the use of powder samples adhered to a glass slide by the use of silicon vacuum grease. The first step in this experiment consisted of obtaining standard powder diffraction files (PDF) of the possible types of minerals that are typically found within the sample. Every mineral will show several characteristic peaks at unique angles representing their individual crystalline structure. Using the PDF data, a comparison can be made between the tested microfines and known peaks. The major peaks observed are used to identify the likely and dominate minerals present in the sample. In this study, if three or more significant peaks are found and correlated to a known mineral, then the target mineral was deemed present within the sample. At least five peaks are identified in each sample to be confident that the major components are detected. To collect the powder diffraction pattern of the microfines in the study, a STOE X-ray Diffractometer was used and data was collected for 2θ values between 5 and 80 degrees at a speed of 0.48 degrees/min. 4.2.2. Coarse and Fine Aggregates Aggregates were selected based on their predominance of use in concrete pavements in the state of the Wisconsin. The fifteen WisDOT No. 1 coarse aggregate sources were divided into two major types, glacial gravels (GG) and crushed stone (CS), and are listed in Table 4.4. Two sources of natural fine aggregate were selected to complement the coarse aggregate types. One source was from Eau Claire, WI, which is primarily igneous/metamorphic material, and one from Janesville, WI, in which the carbonate content is higher. The fine aggregate sources are listed in Table 4.5.
Table 4.4: Sources of WisDOT No.1 coarse aggregate. Aggregate ID Aggregate Type County
GG1 Chippewa River Gravel Eau Claire GG2 South End of Green Bay Lobe Rock GG3 Central Green Bay Lobe Portage GG4 Wisconsin Valley (& Langlade Lobe) Lincoln GG5 Lake Michigan Lobe Racine GG6 Lake Michigan/Green Bay Transition Manitowoc CS1 Niagara Dolomite Milwaukee CS2 Granite Wood CS3 Galena Dolomite Grant CS4 Prairie Du Chien Dolomite Waupaca CS5 Prairie Du Chien Dolomite Crawford CS6 Baraboo Quarzite Columbia CS7 Basalt Polk CS8 Galena/Platteville Outagamie CS9 Diabase Marathon

12
Table 4.5: Natural fine aggregate sources from WI.
Aggregate ID Aggregate Type County Sand A Igneous/metamorphic Eau Claire Sand B Mostly carbonates Rock
Aggregate characteristics were used to facilitate conclusions on why concrete mixes performed differently. For this study, gradation, absorption, and materials finer than the No. 200 sieve tests were performed on each source of coarse and fine aggregate according to AASHTO T27, AASHTO T85/84, and AASHTO T11, respectively. Aggregate absorption values were used to adjust the amount of water needed to achieve a w/cm ratio of 0.40 in the mix design. In order to correctly adjust the amount of water needed, aggregates were oven-dried for a minimum of 12 hours and allowed to cool to the ambient temperature before use. 4.2.3. Aggregate Identification and Microfine Analysis In this study, the location of each source of aggregate was known in advance so the aggregate type could be predicted. Aggregate compositions were verified by conducting a simple visual identification. However, these aggregates also contained microfines, identified as material associated with the aggregates and measuring less than 75µm in size. This material could have a slightly different composition than the aggregate itself. This material is important to monitor as it has a high surface area and therefore higher reactivity in the mix than the aggregate itself. 4.2.3.1. Aggregate Identification Initial identification was reached by comparing a bedrock geological map of Wisconsin seen in Figure 4.1 with the source locations seen in Figure 4.2. The pit and quarry locations were matched with the map and the materials were identified. Several randomly collected samples were taken from each of the coarse aggregate sources to be used for rock identification. After washing, the rock mineral composition was determined by visual inspection with the aid of a geologist. The amount of each rock within the sample was also determined visually using very general terms (all, most, some, or trace). All visual inspections were conducted using standard field geology rock identification methods, including the use of a hand lens. Using Perkins (2001) describing different rock and mineral types, some conclusions were drawn as to the different rock types that appeared in each aggregate source.

13
Figure 4.1: Bedrock geology map of Wisconsin. (http://wisconsingeologicalsurvey.org/gis.htm)

14
Figure 4.2: Quarry and pit locations of aggregates used in this study. (http://www.yellowmaps.com/map/wisconsin-base-map-48.htm)
4.2.3.2. Microfine Analysis The microfines of each aggregate source were tested in four methods, X-ray Diffraction (XRD), particle size distribution (PSD), reactivity, and leaching. XRD was conducted in the same way and for the same reason as the cementitious materials. The analyzed materials were compared with known mineral structures to identify the prevalent materials. Similar to the cementitious material characterization, the PSD analysis was conducted at the Turner-Fairbank Highway Research Laboratory. The reactivity test was conducted on dolomitic sources. These sources were selected because the dolomite contained within them has the potential to react with the basic environment of concrete. The calcium within the dolomite (CaMg(CO3)2) can react with the alkalies found in the concrete pore solution form and release brucite, calcium carbonate, and
15
alkali carbonate. (Swenson and Gillot, 1967) The reactivity test utilized microfines collected from dry sieving through a #200 sieve (75 µm). These collected microfines were subjected to a saturated Ca(OH)2 0.4M Na(OH) solution. 100 mL of the saturated solution was combined with 2.5 grams of microfines and shaken for 7 days at 74°F. At 7 days, the mixture was filtered through a 1.6 µm glass microfiber filter and the remaining microfine material was dried at 80C. This dry material was ground and then XRD was used to characterize the remaining material. These data were compared to that of the original unaltered microfines to determine if phases had changed after being subjected to the aggressive environment. Leaching is also important in order to identify what will be present in the pore solution of the concrete. Leaching tests were conducted by mixing 2.5 grams of the dry-sieved microfines with 50 mL of ultrapure water and shaking the solution at 25°F for 14 days. At 14 days, the mixture was separated first by centrifugation and then filtration through 0.45µm pore filters. The leachate was collected and acidified for measuring in an inductively coupled plasma (ICP) instrument. Levels of calcium (Ca), magnesium (Mg), sodium (Na), and potassium (K) were measured to determine what the microfines could potentially add to the concrete pore solution. 4.3. Mix Design and Specimen Preparation All mix proportions were based on Wisconsin Department of Transportation (WisDOT) Grade A, Grade A-S, and Grade A-F mix designs and are listed in the Wisconsin Standard Specifications for Highway and Structure Construction (WisDOT, 2010). The replacement levels of cement for both slag cement and fly ash were set to 30% of the total cement weight. All concrete mixes were prepared initially based on a w/cm ratio of 0.40, a required slump of 2 in. ± 1 in., and a plastic-concrete air content of 6.0% ± 1.0%. Mix proportions are shown in Table 4.6. An air entraining agent from one manufacturer and one shipment was used for all mixing. In order to satisfy the required slump range, the amount of water in some mixes was reduced accordingly4, and as needed a water reducing agent from one manufacturer and one shipment was utilized. The concrete mixing was conducted by a minimum of two researchers using a 6-ft3 drum mixer in accordance with the procedure specified in AASHTO R39. Plastic concrete air content was measured according to AASHTO T152, aggregate correction factors were applied after all mixes were completed. The aggregate air correction factors for all coarse and fine aggregate combinations are listed in Table 4.7. For coarse aggregate typically used for pavement projects in Wisconsin, the aggregate correction factor for air content is usually below one percent. Tests conducted on coarse aggregates, GG5, CS3, and CS5, each with Sand A resulted in unusually high aggregate correction factors of 1.2%, 1.4%, and 1.6%, respectively. CS3 with Sand B also resulted in an unusually high aggregate correction factor of 1.3%. When the required air content5 or slump was not satisfied, the mix was discarded and redone until requirements were achieved.
4 The decreased water cement ratio due to using fly ash may be the reason why those mixes performed better. 5 Mixes were initially accepted based on a 6.0% ± 1.0% dial reading, not accounting for the aggregate correction factors as prescribed in AAHTO T152. All aggregate correction factors were applied to the dial readings after all mixes were already completed causing some mixes to be out the target air content range.

16
Table 4.6: Mix proportions (lb/yd3).
Material Proportion Grade A Grade A-S Grade A-F
Coarse Aggregate 1872 1860 1848 Fine Aggregate 1248 1240 1232
Portland Cement 565 395 395 Slag Cement 0 170 0
Fly Ash 0 0 170 Net Water
w/cm = 0.40 226 226 226
Table 4.7: Aggregate correction factors (%).
Coarse Aggregate
Fine Aggregate Sand A Sand B
GG1 0.5 0.4 GG2 0.8 0.7 GG3 0.8 N/A GG4 0.5 N/A GG5 1.2 N/A GG6 0.6 N/A CS1 0.6 0.5 CS2 0.4 0.2 CS3 1.4 1.3 CS4 0.7 N/A CS5 1.6 N/A CS6 0.4 N/A CS7 0.5 N/A CS8 0.7 N/A CS9 0.5 N/A
All mixes were performed following the same mixing and curing procedure. Two batches were produced for each mix. The first batch denoted as batch A, yielded specimens for flexure strength and dynamic modulus testing, as well as cylinders for coefficient of thermal expansion testing. The second batch denoted as batch B, yielded specimens for compression strength, modulus of elasticity, Poisson’s ratio, and splitting tensile strength testing. In addition to batches A and B, a third batch, denoted batch C, was made for comparisons and to help ensure test accuracy was satisfactory. The third batch, batch C, was only made when unusually high test variability was observed in certain tests results from some mixes. All specimens were consolidated using the rodding and tapping methods described in AASHTO R39. Immediately after finishing each specimen, cylinder molds were capped and beams were placed under wire mesh and damp burlap covered by plastic for a minimum of 24 hours before demolding. Once demolded, each specimen was stored in a 100% humidity room until prescribed test date.

17
The organization of the mix matrices are shown in Tables 4.8, 4.9, 4.10, and 4.11. The numbers in the table refer to the specific mix number given for each mix to be evaluated. The main variables analyzed using mix matrix 1 were coarse aggregate source and cementitious material composition. The main variable analyzed using mix matrix 2 was Type I Portland cement source. The main variable analyzed using mix matrix 3 was supplementary cementitious material sources. The main variable analyzed using mix matrix 4 was fine aggregate source. Mix matrix 2 and mix matrix 4 were also used to supplement the analysis on supplementary cementitious material sources.
Table 4.8: Mix matrix 1 – comparing coarse aggregate and cementitious material composition.
Mix Proportion A A-S A-F
Cement 1 1 1
SCM N/A Slag 1 Fly Ash 1
Fine Aggregate Sand A Sand A Sand A
Coarse Aggregate
GG1 1 16 31 GG2 2 17 32 GG3 3 18 33 GG4 4 19 34 GG5 5 20 35 GG6 6 21 36 CS1 7 22 37 CS2 8 23 38 CS3 9 24 39 CS4 10 25 40 CS5 11 26 41 CS6 12 27 42 CS7 13 28 43 CS8 14 29 44 CS9 15 30 45
Table 4.9: Mix matrix 2 – comparing Portland cement source and supplementary cementitious material source.
Mix Proportion A-S A-F
Cement 2 2 2 2 2
SCM Slag 1 Slag 2 Fly Ash 1 Fly Ash 2 Fly Ash 3
Fine Aggregate Sand A Sand A Sand A Sand A Sand A
Coarse Aggregate
GG1 46 51 56 61 66 GG2 47 52 57 62 67 CS1 48 53 58 63 68 CS2 49 54 59 64 69 CS3 50 55 60 65 70

18
Table 4.10: Mix Matrix 3 – comparing supplementary cementitious material source.
Mix Proportion A-S A-F
Cement 1 1 1
SCM Slag 2 Fly Ash 2 Fly Ash 3
Fine Aggregate Sand A Sand A Sand A
Coarse Aggregate
GG1 51 61 66 GG2 52 62 67 CS1 53 63 68 CS2 54 64 69 CS3 55 65 70
Table 4.11: Mix matrix 4 – comparing fine aggregate source and supplementary cementitious material source.
Mix Proportion A-S A-F
Cement 1 1 1 1 1
SCM Slag 1 Slag 2 Fly Ash 1 Fly Ash 2 Fly Ash 3
Fine Aggregate Sand B Sand B Sand B Sand B Sand B
Coarse Aggregate
GG1 86 91 96 101 106 GG2 87 92 97 102 107 CS1 88 93 98 103 108 CS2 89 94 99 104 109 CS3 90 95 100 105 110
4.4. Mechanical Testing Methods Hardened concrete tests were conducted according to the corresponding standards listed in Table 4.2, shown in the beginning of section 4. The typical number of test replicates conducted for each test is three, however to ensure accurate test results four test replicates were used for compressive strength and splitting tensile strength testing. In addition, using four test replicates for compressive strength provided a baseline ultimate strength value for each of the Modulus of Elasticity and Poisson’s Ratio test runs, which helped protect instrumentation. 4.4.1. Compression Testing Compression tests were conducted in accordance with AASHTO T22. Wet cured cylinders measured 4-in in diameter and 8-in in height were tested at 7, 14, 28, and 90 days. Prior to testing, each specimen was capped with a sulfur-based compound meeting the requirements of AASHTO T2311. Instead of testing until failure, three of the four specimens were first loaded to approximately 50% of the ultimate strength for two consecutive load cycles to determine Modulus of Elasticity and Poisson’s Ratio. Then these specimens were loaded until failure. More details of this test method are discussed in section 4.3.3. Compression tests were consistent with AASHTO T22 and ASTM E4 at a load rate of 26400 lb/min.

19
4.4.2. Flexural Testing Flexural tests were conducted at the same ages as previous and in accordance with AASHTO T97. A set of three beams measuring 3 in. in width, 4 in. in depth, and 16 in. in length were used for testing. The method of bending chosen for this test was a simple beam with third-point loading creating a uniform bending moment in the middle 1/3 of the span. All beams were wet cured before soaking in a fully saturated lime solution required by the standard. This testing was performed at a load rate of 600 lb/sec as required by AASHTO T97.
4.4.3. Modulus of Elasticity and Poisson’s Ratio Testing Modulus of Elasticity and Poisson’s Ratio tests were conducted at the same ages as the compression tests closely following ASTM C469. A total of three 4-in by 8-in cylinders were tested for each mix. Each cylinder was capped with sulfur compound according to the requirements of AASHTO T2311 prior to testing. For safety and protection of instrumentation, one cylinder representing each mix design and age was first tested in compression following AASHTO T22. This strength provided a baseline to estimate the required ultimate load for each of the Modulus of Elasticity and Poisson’s Ratio test runs. According to ASTM C469 the two points of interest used for calculations are stress and strain corresponding to 40% of the ultimate load and stress and strain corresponding to a longitudinal strain of 50-millionths. Each cylinder was loaded in two cycles reaching the load corresponding to 50% of the ultimate strength. Longitudinal and transverse strains, and the corresponding load values for modulus of elasticity tests, were recorded using digital indicator gages connected to a data acquisition system. After the two loading cycles, each specimen was also tested for compressive strength according to AASHTO T22. The compressive strength of each cylinder was used to calculate the stress and strain at 25% and 40% of the ultimate strength. Interpolation of the recorded values was used to calculate the aforementioned points of interest for Modulus of Elasticity and Poisson’s Ratio. All testing was conducted on the same hydraulic SATEC testing machine at the same load rate as the compression tests. 4.4.4. Splitting Tension Testing Splitting tension tests were conducted at the same ages as the compression tests in accordance with AASHTO T198. A set of four 4 in. by 8 in. cylinders were tested. Specimens were wet cured until testing. Balsa wood cut to the dimensions 8 ½ in. by ¾ in. by ¼ in. were placed on the top and bottom of the specimens acting as bearing surfaces. Tension testing was conducted by applying a load of 7500 lb/min in consistent with the load rate in psi/sec required by AASHTO T198. 4.4.5. Dynamic Modulus Testing Dynamic modulus tests were conducted at the same ages as previous tests in accordance with ASTM C215. The specimens used for the dynamic modulus testing were the beams eventually used for flexural tests. In order to have precise results, each dimension was measured three times and averaged for calculations. In addition each beam was weighed to the nearest tenth of a gram.

20
The transverse frequency was measured using a forced resonance apparatus. The beams were wet cured and soaked overnight in a fully saturated lime solution prior to testing. 4.4.6. Coefficient of Thermal Expansion Testing The coefficients of thermal expansion (CTE) of concrete specimens were determined using the procedure outlined in AASHTO T336. Tests were conducted using AFCT2 Coefficient of Thermal Expansion (CTE) of Hydraulic Cement Concrete Measurement System developed by the Pine Instrument Company. The Pine instrument AFCT2 program was designed in accordance with AASHTO T336 and was installed on the laboratory’s computer to work with the testing machine for all concrete CTE tests.
The general view of the CTE testing system is shown in Figure 4.3. The entire testing machine is controlled by the AFCT2 program. With the AFCT2 program and the associated equipment, the following processes are automated:
• function of the heating / cooling circulator—which provides the temperature
control and fluid circulation required by the system, • generation of output files from LVDT signals, • temperature reading from four temperature probes, and • connection between the computer and the signal transducers (temperature,
displacement, circulator control) via the interface electronics.
The AFCT2 program automatically controls a stable increase and decrease of water temperature between 10°C and 50°C during the test. During the test, the linear variable differential transformer (LVDT) tracks the deformation of the specimen being tested. It is mounted at the top of the fixture. The AFCT2 program contains a built-in calibration between the displacement and the LVDT voltage which changes proportionally with LVDT’s armature’s movement. The program then graphical displays temperature versus length change information while generating text-based files for data analysis. It automatically repeats the test until two consecutive CTE measurements are within 0.3 με/°C as required in AASHTO T336.

21
Figure 4.3: General View of the AFCT2 CTE Testing System
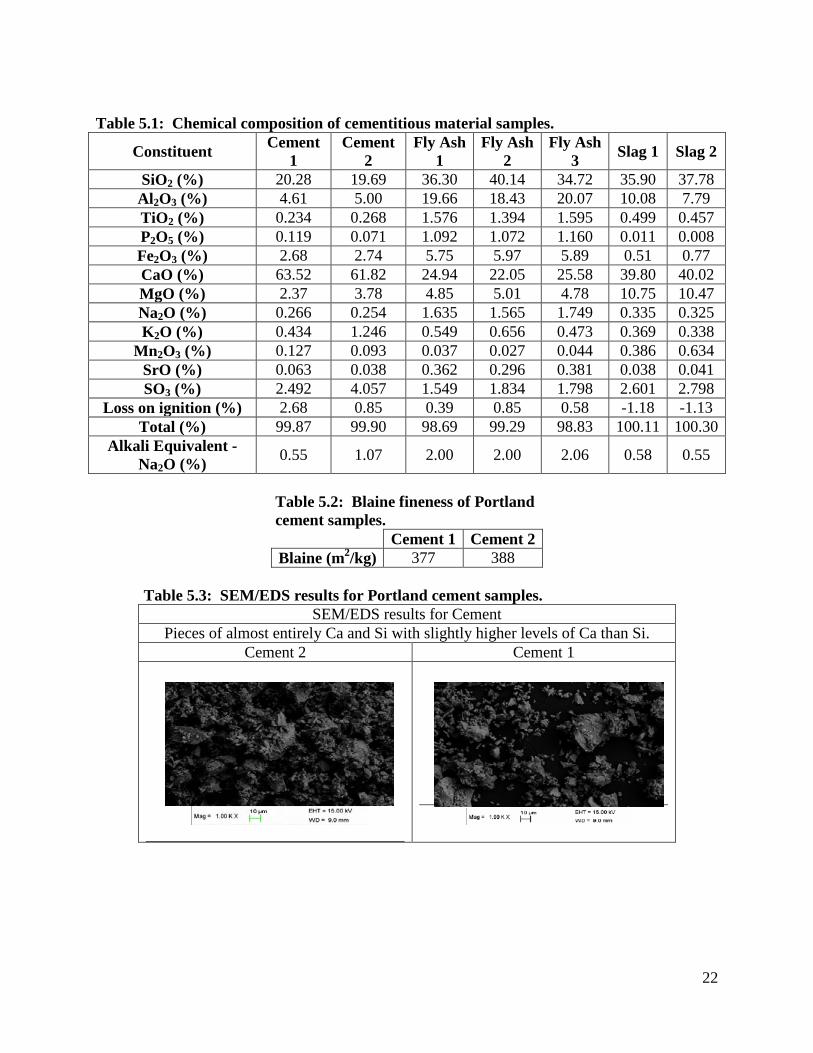
5. Test Results and Comparison to Previous WHRP Reports 5.1. Material Characteristics 5.1.1. Cementitious Materials Chemical analyses were conducted in an industry laboratory with one representative sample of each source of cementitious material used in this study. The chemical constituents are reported as a function of their oxides in Table 5.1. The Blaine fineness results for two Portland cement sources are provided in Table 5.2. Particle size distribution results are presented in Appendix III. The PSD results showed Fly Ash 1 to have the finest particle distribution and Cement 1 to have the least fine distribution. The other materials fell in between those extremes, with Slag 1 and Slag 2 appearing to be slightly finer than Fly Ash 2 and Fly Ash 3. The scanning electron microscope (SEM) imaging analysis showed expected results of particle shape and size and chemical composition. A summary of the imaging and chemical analysis is shown in Tables 5.3, 5.4, and 5.5. X-ray diffraction (XRD) patterns of the cementitious materials are shown in Appendix IV and are similar to expected patterns for respective materials.
Heating / Cooling Circulator
Water Tank
Fixture
LVDT
22
Table 5.1: Chemical composition of cementitious material samples.
Constituent Cement 1
Cement 2
Fly Ash 1
Fly Ash 2
Fly Ash 3 Slag 1 Slag 2
SiO2 (%) 20.28 19.69 36.30 40.14 34.72 35.90 37.78 Al2O3 (%) 4.61 5.00 19.66 18.43 20.07 10.08 7.79 TiO2 (%) 0.234 0.268 1.576 1.394 1.595 0.499 0.457 P2O5 (%) 0.119 0.071 1.092 1.072 1.160 0.011 0.008 Fe2O3 (%) 2.68 2.74 5.75 5.97 5.89 0.51 0.77 CaO (%) 63.52 61.82 24.94 22.05 25.58 39.80 40.02 MgO (%) 2.37 3.78 4.85 5.01 4.78 10.75 10.47 Na2O (%) 0.266 0.254 1.635 1.565 1.749 0.335 0.325 K2O (%) 0.434 1.246 0.549 0.656 0.473 0.369 0.338
Mn2O3 (%) 0.127 0.093 0.037 0.027 0.044 0.386 0.634 SrO (%) 0.063 0.038 0.362 0.296 0.381 0.038 0.041 SO3 (%) 2.492 4.057 1.549 1.834 1.798 2.601 2.798
Loss on ignition (%) 2.68 0.85 0.39 0.85 0.58 -1.18 -1.13 Total (%) 99.87 99.90 98.69 99.29 98.83 100.11 100.30
Alkali Equivalent - Na2O (%) 0.55 1.07 2.00 2.00 2.06 0.58 0.55
Table 5.2: Blaine fineness of Portland cement samples.
Cement 1 Cement 2 Blaine (m2/kg) 377 388
Table 5.3: SEM/EDS results for Portland cement samples.
SEM/EDS results for Cement Pieces of almost entirely Ca and Si with slightly higher levels of Ca than Si.
Cement 2 Cement 1

23
Table 5.4: SEM/EDS results for slag cement samples. SEM/EDS results for Slag
Pieces of mostly Ca, Si, Al, and Mg with equal levels of Ca and Si Slag 2 Slag 1
higher Mg and Al levels than Holcim
Table 5.5: SEM/EDS results for fly ash.
SEM/EDS results for Fly Ash Spheres of mostly Si, Al, and Ca with low levels of Mg, Fe, and Na
Fly Ash 3 Fly Ash 1 Fly Ash 2 higher levels of Al than
others higher levels of Mg than
others
5.1.2. Coarse and Fine Aggregate Coarse aggregate gradations are provided in Table 5.6. The gradation results are the average of a minimum of three tests performed for each source. As shown in the gradation analysis some of the aggregate samples failed specifications set by the Wisconsin Department of Transportation for No. 1 stone (WisDOT 2005). The discrepancies were deemed minor and could have been the result of onsite sampling. The coarse aggregate was not re-ordered from the suppliers. Fine aggregate gradations are provided in Table 5.7. Both fine aggregates passed Wisconsin Department of Transportation specifications (WisDOT 2005). Results from absorption and materials finer than the No. 200 sieve for coarse and fine aggregates are provided in Tables 5.8 and 5.9, respectively. The percent uncompacted voids value is also provided for the fine aggregate in Table 5.9.

24
Table 5.6: Coarse aggregate gradation analysis (% passing) with yellow cells indicating deviation from state standards.
Sieve Size
(in) 1.5 1 3/4 1/2 3/8 3/16 #8
Sieve Size
(mm) 37.5 25.00 19.00 12.50 9.50 4.75 2.36
Aggregate Source
GG1 100 100 98 63 34 4 2 GG2 100 100 99 81 57 2 1 GG3 100 100 98 66 40 1 1 GG4 100 100 92 46 20 1 1 GG5 100 100 90 32 8 2 2 GG6 100 100 79 33 4 0 0 CS1 100 100 96 62 39 6 2 CS2 100 95 79 45 29 6 4 CS3 100 100 97 56 34 7 5 CS4 100 100 99 78 49 2 1 CS5 100 100 99 60 32 1 1 CS6 100 100 96 32 9 0 0 CS7 100 100 94 44 18 1 1 CS8 100 100 89 38 19 1 1 CS9 100 100 100 81 44 2 1
WisDOT Size No. 1
Upper Limit 100 100 100 - 55 10 5 Lower Limit 100 100 90 - 20 0 0
Table 5.7: Fine aggregate gradation analysis (% passing).
Sieve Size (in or #) 3/8" #4 #8 #16 #30 #50 #100 Pan
Sieve Size (mm) 9.5 4.75 2.36 1.18 0.60 0.30 0.15 0
Aggregate Source
Sand A 100 96 81 65 45 12 3 0 Sand B 100 95 86 74 42 12 3 0
WisDOT Fine Agg
Upper Limit 100 100 - 85 - 30 10 0 Lower Limit 100 90 - 45 - 5 0 0

25
Table 5.8: Coarse aggregate absorption and materials finer than #200 sieve.
Aggregate Source
Water Absorbed
(%)
Relative Density (specific gravity)
Apparent Relative Density
Density [kg/m3]
Percent Finer than #200
Sieve GG1 1.7 2.62 2.66 2613 0.84 GG2 2.2 2.60 2.66 2596 0.43 GG3 1.4 2.61 2.64 2599 0.37 GG4 1.0 2.69 2.72 2682 0.38 GG5 2.3 2.61 2.67 2600 1.39 GG6 0.8 2.76 2.78 2749 0.24 CS1 1.8 2.64 2.69 2635 1.26 CS2 0.7 2.53 2.55 2527 0.52 CS3 3.6 2.51 2.60 2501 0.83 CS4 1.9 2.66 2.71 2649 1.69 CS5 2.0 2.61 2.66 2602 1.00 CS6 0.6 2.62 2.64 2616 0.82 CS7 0.9 2.89 2.92 2882 0.33 CS8 1.2 2.74 2.77 2730 0.58 CS9 0.9 2.70 2.72 2694 0.77
Table 5.9: Fine aggregate absorption and materials finer than #200 sieve.
Aggregate Source Water Absorbed (%)
Percent Finer than #200
Sieve
Apparent Specific Density
Percent Uncompacted
Voids Sand A 1.2 2.67 2.7 22.96 Sand B 0.6 0.26 2.46 31.10
5.1.3. Aggregate Identification and Microfine Analysis 5.1.3.1. Aggregate Identification The aggregates were identified using the geological map of Wisconsin and listed in Table 5.10. They were identified further based on visual identification methods, listed in Table 5.11. The sources initially classified as glacial gravels were the most difficult to identify because they are a mix of glacial till, which render some rock types with unknown origins, leading to a higher uncertainty for the visual identification.

26
Table 5.10: Aggregate identified by using the Wisconsin bedrock geology map. Map No.
Aggregate ID General Location Major Geological Data
(geological survey map-University of Wisconsin) Glacial Gravels:
1 GG1 Chippewa River Gravel
Sandstone with some dolomite and shale (sliver of granite, diorite, and gneiss)
2 GG2 South End of Green Bay Lobe
St. Peter Formation—sandstone with some limestone shale and conglomerate. Also could be mixed with sandstone or with Sinnipee Group: dolomite with some limestone and shale.
3 GG3 Central Green Bay Lobe
Basaltic to rhyolitic metavolcanic rock with some metasedimentary rock; or granite, diorite, and gneiss
4 GG4 Wisconsin Valley (& Langlade) Lobe
Basaltic to rhyolitic metavolcanic rock with some metasedimentary rock. Could contain meta-gabbro and hornblende diorite.
5 GG5 Lake Michigan Lobe Dolomite
6 GG6 Lake
Michigan/Green Bay Transition
Dolomite
Crushed Stone: 7 CS1 Milwaukee Dolomite
8 CS2 South of Marshfield Granite, Diorite, and Gneiss
9 CS3 Grant
Sinnipee Group—dolomite with some limestone and shale. (could be mixed with St. Peter Formation—sandstone with some limestone shale and conglomerate)
10 CS4 Waupaca Sandstone with some dolomite and shale(could be mixed with some "Wolf River rock—rapakivi granite, granite, and syenite"
11 CS5 Crawford Prairie du Chien Group—dolomite with some sandstone and shale
12 CS6 Baraboo Quartzite (could be mixed with sandstone) 13 CS7 Polk Basalt
14 CS8 Outagamie dolomite with some limestone and shale
15 CS9 North of Wausau Basaltic to rhyolitic metavolcanic rock with some metasedimentary rock
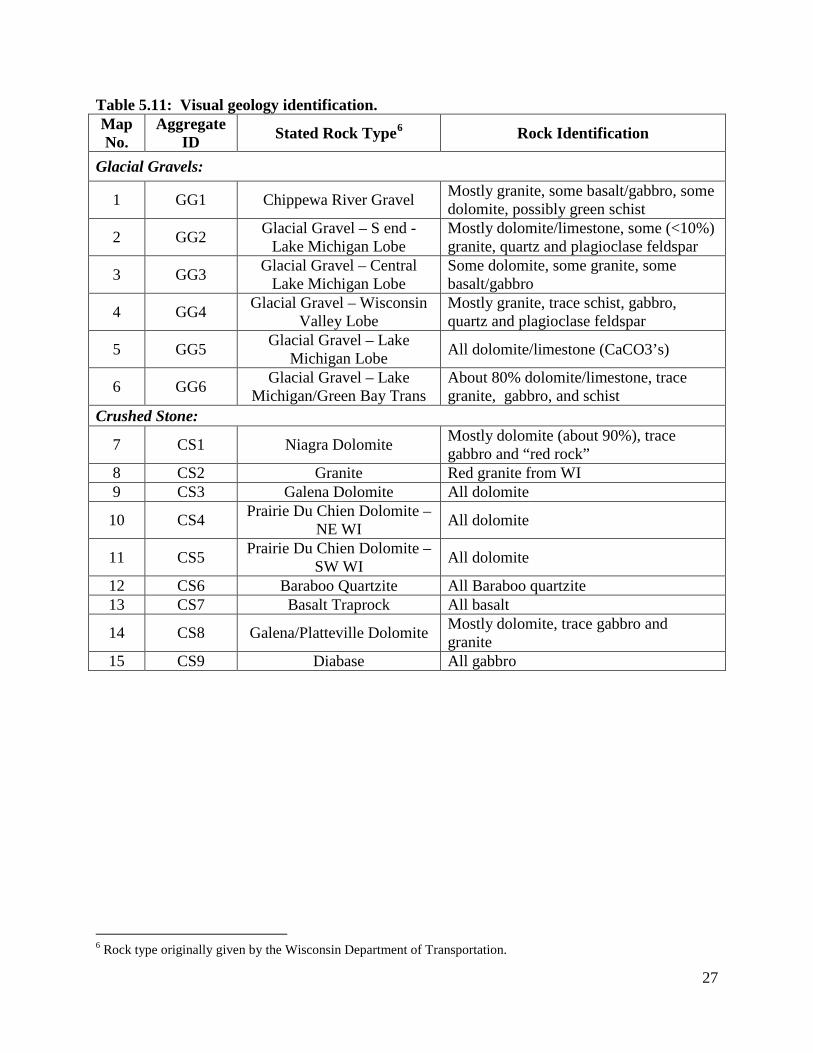
27
Table 5.11: Visual geology identification. Map No.
Aggregate ID Stated Rock Type6 Rock Identification
Glacial Gravels:
1 GG1 Chippewa River Gravel Mostly granite, some basalt/gabbro, some dolomite, possibly green schist
2 GG2 Glacial Gravel – S end - Lake Michigan Lobe
Mostly dolomite/limestone, some (<10%) granite, quartz and plagioclase feldspar
3 GG3 Glacial Gravel – Central Lake Michigan Lobe
Some dolomite, some granite, some basalt/gabbro
4 GG4 Glacial Gravel – Wisconsin Valley Lobe
Mostly granite, trace schist, gabbro, quartz and plagioclase feldspar
5 GG5 Glacial Gravel – Lake Michigan Lobe All dolomite/limestone (CaCO3’s)
6 GG6 Glacial Gravel – Lake Michigan/Green Bay Trans
About 80% dolomite/limestone, trace granite, gabbro, and schist
Crushed Stone:
7 CS1 Niagra Dolomite Mostly dolomite (about 90%), trace gabbro and “red rock”
8 CS2 Granite Red granite from WI 9 CS3 Galena Dolomite All dolomite
10 CS4 Prairie Du Chien Dolomite – NE WI All dolomite
11 CS5 Prairie Du Chien Dolomite – SW WI All dolomite
12 CS6 Baraboo Quartzite All Baraboo quartzite 13 CS7 Basalt Traprock All basalt
14 CS8 Galena/Platteville Dolomite Mostly dolomite, trace gabbro and granite
15 CS9 Diabase All gabbro
6 Rock type originally given by the Wisconsin Department of Transportation.

28
5.1.3.2. Microfine Analysis Microfines were identified through the use of XRD techniques. The analysis results are listed in Table 5.12.
Table 5.12: Identification of major components of microfines by XRD analysis. Map # Rock ID XRD - Major Minerals Found
Glacial Gravels: 1 GG1 Quartz 2 GG2 Dolomite, Quartz 3 GG3 Dolomite, Quartz and Plagioclase 4 GG4 Quartz 5 GG5 Dolomite, Quartz 6 GG6 Dolomite with some Quartz
Crushed Stone: 7 CS1 Dolomite, quartz 8 CS2 Quartz and Orthoclase 9 CS3 Dolomite 10 CS4 Dolomite with some Quartz 11 CS5 Dolomite, Quartz 12 CS6 Quartz, Clintonite, and Tremolite 13 CS7 Anorthite, Plagioclase, Feldspar, and Quartz 14 CS8 Dolomite 15 CS9 Quartz and Feldspar
From the XRD analysis, many of the aggregates possess dolomite and quartz. The microfines could potentially be grouped into dolomite, quartz, a mix of dolomite and quartz, and other which contain additional materials in addition to dolomite and/or silica. All XRD scans of the microfines can be found in Appendix V. Aggregates containing dolomite were tested for reactivity to discern what transformation occurs in an environment mimicking that of concrete. XRD scans were taken of treated microfines and compared to unaltered microfines from the same source. From this comparison it could be determined which minerals were digested in the aqueous media. Scans comparing the original to reacted microfines are presented in Appendix VI. The summary of the decomposed minerals can be seen in Table 5.13. Note that none of the microfines completely deteriorated under the test conditions, but a reduced intensity was seen in the sample at the characteristic 2 theta angle.
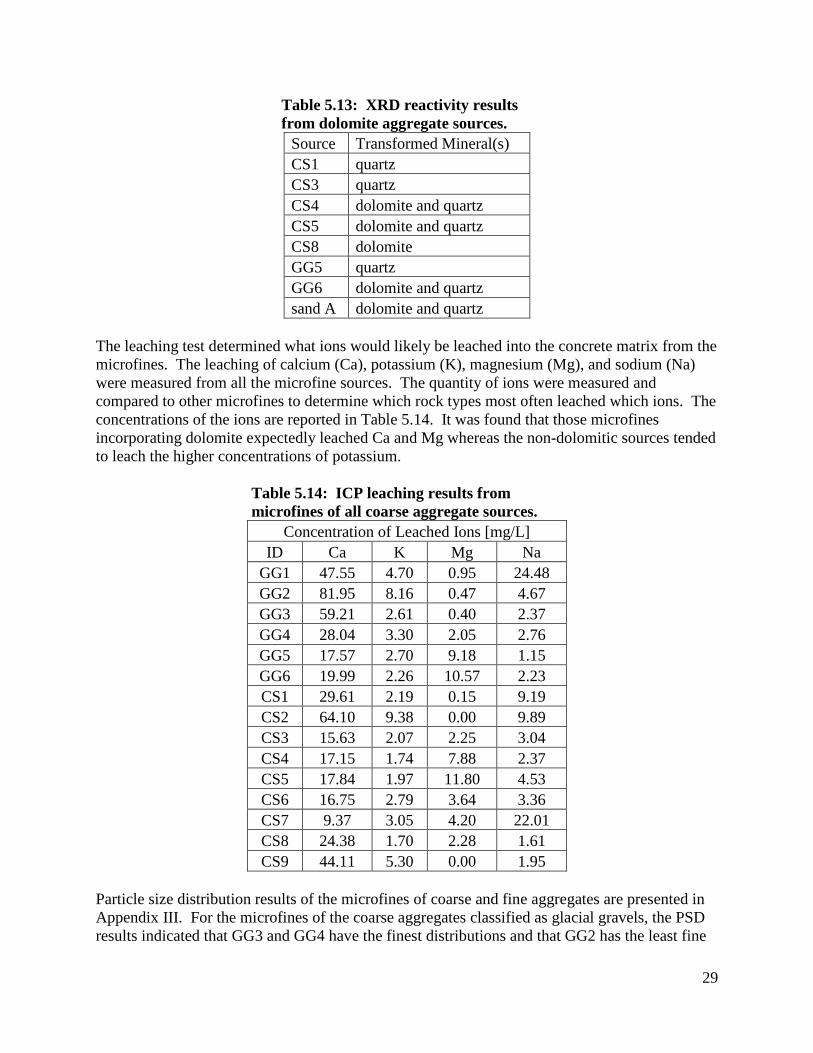
29
Table 5.13: XRD reactivity results from dolomite aggregate sources.
Source Transformed Mineral(s) CS1 quartz CS3 quartz CS4 dolomite and quartz CS5 dolomite and quartz CS8 dolomite GG5 quartz GG6 dolomite and quartz sand A dolomite and quartz
The leaching test determined what ions would likely be leached into the concrete matrix from the microfines. The leaching of calcium (Ca), potassium (K), magnesium (Mg), and sodium (Na) were measured from all the microfine sources. The quantity of ions were measured and compared to other microfines to determine which rock types most often leached which ions. The concentrations of the ions are reported in Table 5.14. It was found that those microfines incorporating dolomite expectedly leached Ca and Mg whereas the non-dolomitic sources tended to leach the higher concentrations of potassium.
Table 5.14: ICP leaching results from microfines of all coarse aggregate sources.
Concentration of Leached Ions [mg/L] ID Ca K Mg Na
GG1 47.55 4.70 0.95 24.48 GG2 81.95 8.16 0.47 4.67 GG3 59.21 2.61 0.40 2.37 GG4 28.04 3.30 2.05 2.76 GG5 17.57 2.70 9.18 1.15 GG6 19.99 2.26 10.57 2.23 CS1 29.61 2.19 0.15 9.19 CS2 64.10 9.38 0.00 9.89 CS3 15.63 2.07 2.25 3.04 CS4 17.15 1.74 7.88 2.37 CS5 17.84 1.97 11.80 4.53 CS6 16.75 2.79 3.64 3.36 CS7 9.37 3.05 4.20 22.01 CS8 24.38 1.70 2.28 1.61 CS9 44.11 5.30 0.00 1.95
Particle size distribution results of the microfines of coarse and fine aggregates are presented in Appendix III. For the microfines of the coarse aggregates classified as glacial gravels, the PSD results indicated that GG3 and GG4 have the finest distributions and that GG2 has the least fine

30
distribution. GG1, GG5, and GG6 were in between those distributions. For the microfines of coarse aggregates classified as crushed stones, the PSD results indicated that CS7 and CS8 have the finest distributions and that CS1, CS2, CS3, and CS9 have the least fine distributions. CS4, CS5, and CS6 were in between those distributions. For the microfines of the fine aggregate sources, the PSD results indicated that Sand A had a finer distribution than Sand B. 5.2. Plastic Concrete Test Results Batches were prepared following the mix design described earlier and actual batch quantities are shown in Appendix VII. Slump, unit weight, and fresh air content were measured and recorded just after the concrete was poured from the mechanical concrete mixer. The results of these tests based on the mix matrices 1 through 4 are provided in Appendix VIII. A summary of the fresh concrete properties for each mix matrix is presented in Table 5.15. All mixes achieved the target slump range of 2 in. ± 1 in. Slump values for concrete mixed for mix matrix 1 ranged from 1 to 3 in. For mix matrix 2 the range of slump was 1 ¼ to 3 in., mix matrix 3 ranged in slump from 1 ½ to 3 in., and for mix matrix 4 ranged in slump from 1 ¼ to 3 in. The w/cm ratio of concrete mixed for matrix 1 ranged from 0.36 to 0.40. For mix matrix 2 and 3 the w/cm ratio ranged from 0.37 to 0.40 and for mix matrix 4 the w/cm ratio ranged from 0.33 to 0.40. Fresh air content for concrete mixed for matrix 1 ranged from 3.4% to 6.5%. For mix matrix 2 the range of fresh air content is 3.7% to 6.4%. For mix matrix 3 the range of fresh air content is 3.6% to 6.6%. For mix matrix 4 the range of fresh air content is 3.7% to 6.8%. Therefore, some of our mixes were lower than the target air content range of 6.0% ± 1.0%. However, as discussed below it was determined the lower air contents and larger range of air content values did not affect the final conclusions. Six additional mixes were evaluated based on mix matrix 1 using coarse aggregate CS3. CS3 was chosen as the coarse aggregate because of its unusually high aggregate air correction factor causing the most cases of unusually low net air content. For each mix proportion in matrix 1, one mix was prepared with a low target air content of 2% and the other was prepared with a high target air content of 7%. A relationship between air content and each mechanical property was found in this project by combining the two extra mixes with the original results from matrix 1. Comparison results from the extra mixes showing the effects of varied air contents are shown in Appendix IX. Results provided in Appendix XIII also reveal that adjusting the test results based on the varied air content does not alter conclusions drawn from the test results based on the unadjusted for air content.

31
Table 5.15: Summary of fresh concrete properties for each mix matrix.
Mix Matrix (number: main variable)
w/cm Ratio Range
Slump Range (in)
Unit Weight Range (lb/ft3)
Fresh Air Content Range
(%) 1: Comparing Coarse
Aggregate and Cementitious Material Composition
(Table 4.8)
0.36 - 0.40 1 - 3 142.1 - 152.2 3.4 - 6.5
2: Comparing Portland Cement Source and
Supplementary Cementitious Material
Source (Table 4.9)
0.37 - 0.40 1 ¼ - 3 141.2 - 149.0 3.7 - 6.4
3: Comparing Supplementary
Cementitious Material Source (Table 4.10)
0.37 - 0.40 1 ½ - 3 141.5 - 148.3 3.6 - 6.6
4: Comparing Fine Aggregate Source and
Supplementary Cementitious Material
Source (Table 4.11)
0.33 - 0.40 1 ¼ - 3 142.4 - 149.8 3.7 - 6.8
5.3. Mechanical Test Results The hardened concrete test results demonstrated that each property may be affected in some way by changing the concrete components. Illustrating the extent of the effect each concrete component has on different concrete strength properties may help categorize their level of importance for design programs, such as the MEPDG. Therefore, comparisons of the percent change in each property due to individually changing specific concrete components were analyzed rather than direct comparisons of their results. All individual hardened concrete test results for compressive strength, modulus of rupture, modulus of elasticity, Poisson’s Ratio, splitting tensile strength, and dynamic modulus are provided in Concrete Testing Data Appendix X. In addition, a statistical analysis based on ANOVA was computed for all results and is provided in Appendix XI. The concrete component materials evaluated are coarse aggregate source, fine aggregate source, ordinary Portland cement (OPC) source, type of supplementary cementitious material, and source of supplementary cementitious material. Note that these component material changes were not the only source of variation potentially driving the average percent differences in each of the hardened concrete properties. Specifically, component variability, proportions, air content, mixing, temperature, precision of the test procedure, and other factors may also result in observed variation in the test results between two test specimens. This variability was controlled as to satisfy precision requirements set by
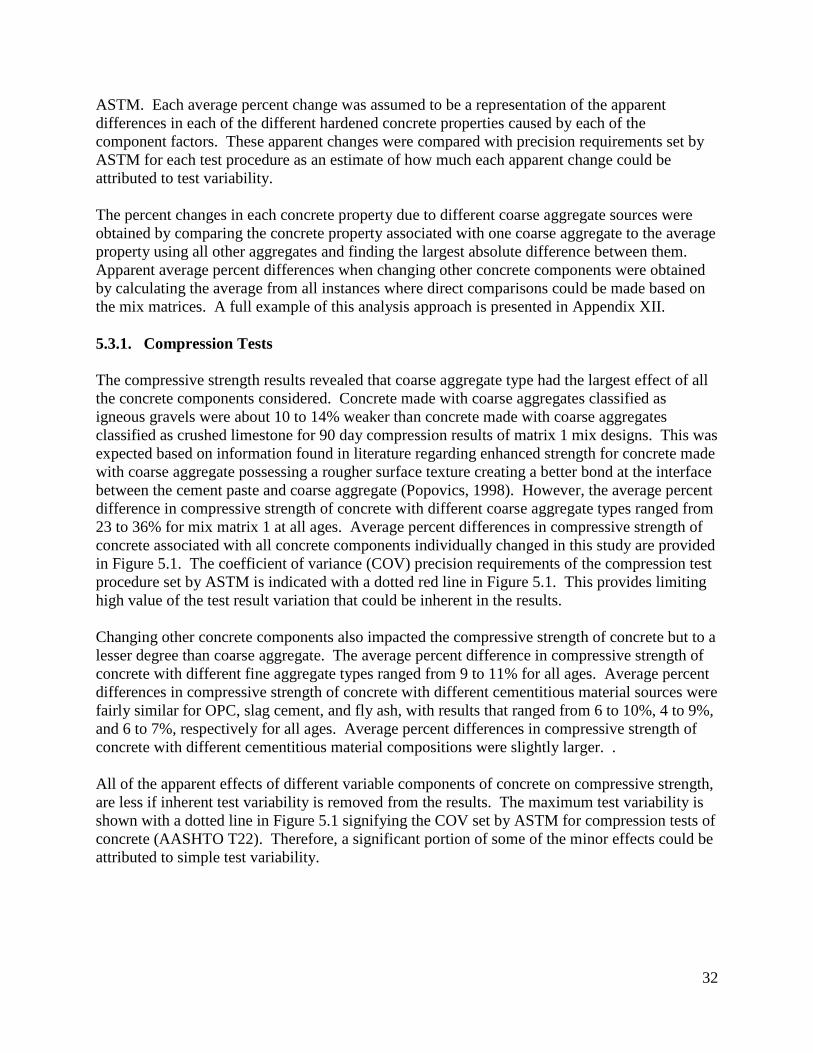
32
ASTM. Each average percent change was assumed to be a representation of the apparent differences in each of the different hardened concrete properties caused by each of the component factors. These apparent changes were compared with precision requirements set by ASTM for each test procedure as an estimate of how much each apparent change could be attributed to test variability. The percent changes in each concrete property due to different coarse aggregate sources were obtained by comparing the concrete property associated with one coarse aggregate to the average property using all other aggregates and finding the largest absolute difference between them. Apparent average percent differences when changing other concrete components were obtained by calculating the average from all instances where direct comparisons could be made based on the mix matrices. A full example of this analysis approach is presented in Appendix XII. 5.3.1. Compression Tests The compressive strength results revealed that coarse aggregate type had the largest effect of all the concrete components considered. Concrete made with coarse aggregates classified as igneous gravels were about 10 to 14% weaker than concrete made with coarse aggregates classified as crushed limestone for 90 day compression results of matrix 1 mix designs. This was expected based on information found in literature regarding enhanced strength for concrete made with coarse aggregate possessing a rougher surface texture creating a better bond at the interface between the cement paste and coarse aggregate (Popovics, 1998). However, the average percent difference in compressive strength of concrete with different coarse aggregate types ranged from 23 to 36% for mix matrix 1 at all ages. Average percent differences in compressive strength of concrete associated with all concrete components individually changed in this study are provided in Figure 5.1. The coefficient of variance (COV) precision requirements of the compression test procedure set by ASTM is indicated with a dotted red line in Figure 5.1. This provides limiting high value of the test result variation that could be inherent in the results. Changing other concrete components also impacted the compressive strength of concrete but to a lesser degree than coarse aggregate. The average percent difference in compressive strength of concrete with different fine aggregate types ranged from 9 to 11% for all ages. Average percent differences in compressive strength of concrete with different cementitious material sources were fairly similar for OPC, slag cement, and fly ash, with results that ranged from 6 to 10%, 4 to 9%, and 6 to 7%, respectively for all ages. Average percent differences in compressive strength of concrete with different cementitious material compositions were slightly larger. . All of the apparent effects of different variable components of concrete on compressive strength, are less if inherent test variability is removed from the results. The maximum test variability is shown with a dotted line in Figure 5.1 signifying the COV set by ASTM for compression tests of concrete (AASHTO T22). Therefore, a significant portion of some of the minor effects could be attributed to simple test variability.
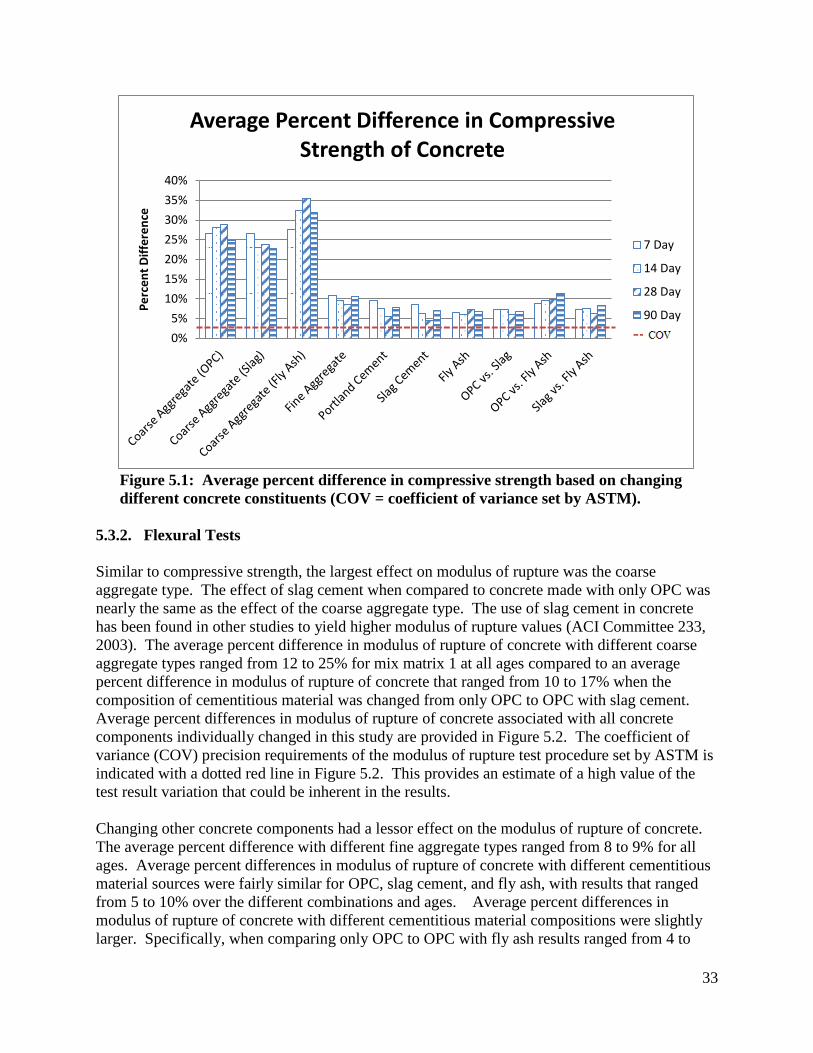
33
Figure 5.1: Average percent difference in compressive strength based on changing different concrete constituents (COV = coefficient of variance set by ASTM).
5.3.2. Flexural Tests Similar to compressive strength, the largest effect on modulus of rupture was the coarse aggregate type. The effect of slag cement when compared to concrete made with only OPC was nearly the same as the effect of the coarse aggregate type. The use of slag cement in concrete has been found in other studies to yield higher modulus of rupture values (ACI Committee 233, 2003). The average percent difference in modulus of rupture of concrete with different coarse aggregate types ranged from 12 to 25% for mix matrix 1 at all ages compared to an average percent difference in modulus of rupture of concrete that ranged from 10 to 17% when the composition of cementitious material was changed from only OPC to OPC with slag cement. Average percent differences in modulus of rupture of concrete associated with all concrete components individually changed in this study are provided in Figure 5.2. The coefficient of variance (COV) precision requirements of the modulus of rupture test procedure set by ASTM is indicated with a dotted red line in Figure 5.2. This provides an estimate of a high value of the test result variation that could be inherent in the results. Changing other concrete components had a lessor effect on the modulus of rupture of concrete. The average percent difference with different fine aggregate types ranged from 8 to 9% for all ages. Average percent differences in modulus of rupture of concrete with different cementitious material sources were fairly similar for OPC, slag cement, and fly ash, with results that ranged from 5 to 10% over the different combinations and ages. Average percent differences in modulus of rupture of concrete with different cementitious material compositions were slightly larger. Specifically, when comparing only OPC to OPC with fly ash results ranged from 4 to
0%5%
10%15%20%25%30%35%40%
Perc
ent D
iffer
ence
Average Percent Difference in Compressive
Strength of Concrete
7 Day
14 Day
28 Day
90 Day

34
13% and when comparing OPC with slag cement to OPC with fly ash results ranged from 9 to 12% for all ages. The net effect of different components of concrete on modulus of rupture should likely be reduced by the amount of the inherent test variability. Specifically, the maximum test variability is shown in Figure 5.2 signifying the COV set by ASTM for modulus of rupture tests of concrete (AASHTO T97). Some of the minor effects could be completely attributed to simple test variability.
Figure 5.2: Average percent difference in modulus of rupture based on changing different concrete constituents (COV = coefficient of variance set by ASTM).
5.3.3. Modulus of Elasticity and Poisson’s Ratio Tests Modulus of Elasticity Similar to compressive strength results, the modulus of elasticity results revealed that coarse aggregate type had the largest effect of all the concrete components changed in this study. The variance in modulus of elasticity of concrete with different coarse aggregate types was found to be related to their general mineralogy, density, and specific gravity in previous studies (Yazdani et. al, 2005; Hall and James, 2008). The average 90 day concrete modulus of elasticity grouped based on the visual geological identification of the coarse aggregates following basalt, quartzite, granite, diabase, and dolomite from high to low. The average percent difference was 18 to 43% for mix matrix 1 at all ages. Average percent differences in modulus of elasticity of concrete are provided in Figure 5.3. The coefficient of variance (COV) precision requirements of the
0%
5%
10%
15%
20%
25%
30%
Perc
ent D
iffer
ence
Average Percent Difference in Modulus of Rupture of Concrete
7 Day
14 Day
28 Day
90 Day

35
modulus of elasticity test procedure set by ASTM is indicated with a dotted red line in Figure 5.3. This provides an estimate of a high value of the test result variation that could be inherent in the results. Modulus of elasticity was influenced by other concrete components to a minor degree. After coarse aggregate, fine aggregate type resulted in an average percent difference that ranged from 8 to 9% for all ages. The magnitude of that effect was about one quarter of the magnitude of the effect of different coarse aggregate types. Average percent differences in modulus of elasticity of concrete with different cementitious material sources were even lower for OPC, slag cement, and fly ash, with results that ranged from 3 to 7%. Average percent differences in modulus of elasticity of concrete with different cementitious material compositions were similar. These results were expected because according to ACI Committee 232 and 233 the influence of slag cement and fly ash on the modulus of elasticity of concrete was found to be small and not as significant as the effect of coarse aggregate types. All of the apparent effects of different variable components of concrete on modulus of elasticity, except coarse aggregate type, are less substantial than shown when considering the amount of the potential effect from test variability. Specifically, the expected test variability was shown with a dotted line at 4.25% in Figure 5.3 signifying the COV set by ASTM for modulus of elasticity tests of concrete (ASTM C469). Therefore, some of the minor effects could be completely attributed to simple test variability.
Figure 5.3: Average percent difference in modulus of elasticity based on different concrete constituents (COV = coefficient of variance set by ASTM).
0%5%
10%15%20%25%30%35%40%45%
Perc
ent D
iffer
ence
Average Percent Difference in Concrete Modulus of Elasticity
7 Day
14 Day
28 Day
90 Day

36
Poisson’s Ratio The observations for the Poisson’s ratio of concrete were similar to those for the modulus of elasticity of concrete and showed that coarse aggregate type had the largest effect of all the concrete components. The variance in Poisson’s ratio of concrete with different coarse aggregate types was found to be related to their general mineralogy (Persson, 1999; Hall and James, 2008). The average 90 day Poisson’s ratio of concrete grouped based on the visual geological identification followed the order from high to low of diabase, dolomite, basalt, quartzite, and granite. The average percent difference in Poisson’s ratio of concrete with different coarse aggregate types ranged from 18 to 36% for mix matrix 1 at all ages. Average percent differences in Poisson’s ratio of concrete are provided in Figure 5.4. The coefficient of variance (COV) precision requirements of the Poisson’s ratio test procedure set by ASTM is indicated with a dotted red line in Figure 5.4. This provides an estimate of a high value of the inherent test result variation. Similar to the modulus of elasticity of concrete, changing other concrete components had a small effect on the Poisson’s ratio of concrete when compared to changing the coarse aggregate type. The average percent difference in Poisson’s ratio of concrete with different fine aggregate types ranged from 5 to 8% for all ages, which was about one quarter to one third the magnitude of the effect from different coarse aggregate types. Average percent differences in Poisson’s ratio of concrete with different cementitious material sources were equally low for OPC, slag cement, and fly ash, with results that ranged from 5 to 10%, 6 to 8%, and 6 to 9%, respectively for all ages. Average percent differences in Poisson’s ratio of concrete with different cementitious material compositions were similar. Specifically, when comparing only OPC to OPC with fly ash results ranged from 6 to 10 percent and when comparing only OPC to using OPC with slag cement results also ranged from 6 to 10% for all ages. In addition, the average percent difference in Poisson’s ratio of concrete with the cementitious material composition changed from OPC with slag cement to OPC with fly ash ranged from 4 to 7% for all ages. The net effect of these influences should be reduced by the inherent test variability. The maximum test variability is shown with a dotted line at 4.25% in Figure 5.4 signifying the COV set by ASTM for Poisson’s ratio tests of concrete (ASTM C469). Therefore, a large portion of the minor effects could be attributed to simple test variability.

37
Figure 5.4: Average percent difference in Poisson’s ratio based on changing different concrete constituents (COV = coefficient of variance set by ASTM).
5.3.4. Splitting Tension Tests The results for splitting tensile strength revealed that coarse aggregate type again had the largest effect of all the concrete components examined in this study. Also similar to the modulus of rupture results, the effect of using slag cement was the next highest component factor for splitting tensile strength. The average percent differences in splitting tensile strength of concrete with different coarse aggregate types ranged from 23 to 34% for mix matrix 1 at all ages compared to an average percent difference in splitting tensile strength that ranged 9 to 13% when changing the cementitious material composition from only OPC to OPC with slag cement. The average percentage differences in splitting tensile strength of concrete associated with all concrete components individually changed in this study are provided in Figure 5.5. The coefficient of variance (COV) precision requirements of the splitting tension test procedure set by ASTM was also indicated with a dotted red line in Figure 5.5. This provides an estimate of a high value of the test result variation that could be inherent in the results. Also similar to the modulus of rupture results, changing other concrete components had an effect on the splitting tensile strength of concrete, but the magnitudes of the effects are not as large as the effects of different coarse aggregate types or using slag cement. The average percent difference in splitting tensile strength of concrete with different fine aggregate types ranged from 5 to 11% for all ages, which is about one quarter to one third of the magnitude of the effect of changing coarse aggregate types. Average percent differences in splitting tensile strength of concrete with different cementitious material sources were equally low for OPC, slag cement,
0%5%
10%15%20%25%30%35%40%
Perc
ent D
iffer
ence
Average Percent Difference in Concrete
Poisson's Ratio
7 Day
14 Day
28 Day
90 Day

38
and fly ash, with results that ranged from 7 to 8%, 3 to 9%, and 6 to 8%, respectively for all ages. Average percent differences in splitting tensile strength of concrete with different cementitious material compositions were similar. Specifically, when comparing only OPC to OPC with fly ash results ranged from 8 to 10% and when comparing OPC with slag cement to OPC with fly ash results ranged 5 to 9% for all ages. All of the apparent effects of different variable components of concrete on splitting tensile strength, except coarse aggregate type and cementitious material composition, are less substantial than shown when considering the amount of the potential effect from test variability. Specifically, the expected test variability was shown with a dotted line at 5% in Figure 5.5 signifying the COV set by ASTM for splitting tension tests of concrete (AASHTO T198). Therefore, some of the minor effects could be completely attributed to test variability. As suggested by AASHTO T198, all percent fracture values were recorded for each of the test specimens after failure. The percent fracture was the estimated proportion of coarse aggregate fractured during the test. Percent fracture values were plotted versus their corresponding splitting tensile strengths for mixes 1 through 15 of mix matrix one described earlier in section 4.3. As expected, the percent fracture increased with concrete age. Also as expected, the coarse aggregates classified as glacial gravels (identified as GG1 through GG6) had lower percent fracture values than those classified as crushed stone (identified as CS7 through CS15). The glacial gravels were more rounded in nature compared the crushed stone which were more angular in nature leading to more surface area. An increased surface area and higher surface roughness helped bonding at the paste-aggregate interface.
Figure 5.5: Average percent difference in splitting tensile strength based on changing different concrete constituents (COV = coefficient of variance set by ASTM).
0%5%
10%15%20%25%30%35%40%
Average Percent Difference in Split Tensile Strength of Concrete
7 Day
14 Day
28 Day
90 Day

39
5.3.5. Dynamic Modulus Tests Dynamic modulus of concrete specimens was measured for a subset of the total specimen set. Five of the fifteen coarse aggregate types were included in the subset that was evaluated. The results for the dynamic modulus of concrete were similar to those for the static modulus of elasticity of concrete and showed that the coarse aggregate type has the largest effect of all the concrete components changed in this study. The variance of the dynamic modulus of concrete associated with changing different concrete components was expected to be similar to the static modulus of elasticity of concrete because static and dynamic moduli were found to be linearly related (Popovics, 1998). The average percent differences in dynamic modulus of concrete with different coarse aggregate types ranged from 11 to 25% for the mixes and ages that were measured. Average percentage differences in dynamic modulus of concrete associated with all concrete components individually changed in this study are provided in Figure 5.6. The coefficient of variance (COV) precision requirements of the dynamic modulus test procedure set by ASTM is indicated with a dotted red line in Figure 5.6. This provides an estimate of a high value of the test result variation that could be inherent in the results. Changing other concrete components also had an effect on the dynamic modulus of concrete similar to their effect on the static modulus of elasticity of concrete. The average percent difference in dynamic modulus of concrete with different fine aggregate types ranged from 4 to 5%, which is about one quarter to one third of the magnitude of the effect of different coarse aggregate types. Average percent differences in dynamic modulus of concrete with different cementitous material sources were equally low for OPC, slag cement, and fly ash, with results that ranged from 3 to 5%. Average percent differences in dynamic modulus of concrete with different cementitious material compositions were also low. The maximum inherent test variability is shown with a dotted line at 1.0% in Figure 5.6 signifying the COV set by ASTM for splitting tension tests of concrete (ASTM C215). The gross COV of dynamic modulus tests is low so when inherent test variability is removed from these values the net effect of the individual parameters is small and likely insignificant for some of the parameters shown in Fig. 5.6.

40
Figure 5.6: Average percent difference in dynamic modulus based on changing different concrete constituents (COV = coefficient of variance set by ASTM).
5.3.6. Coefficient of Thermal Expansion Tests The coefficient of thermal expansion (CTE) results revealed that coarse aggregate type had the most influence on the CTE values. Previous studies found that the variance in CTE between different coarse aggregate was related to their general geology (Sakyi-Bekoe, 2008; Tran et. al., 2008; Wang, 2008; Won, 2005). The sequence of the average concrete CTE based on the visual geological identification from high to low was quartzite, dolomite, diabase, granite, and basalt. The average percent difference in CTE of concrete with different coarse aggregate types ranged from was 15 to 17% for mix matrix 1. Average percentage differences in CTE are provided in Figure 5.7. No precision has been set for the CTE test procedure by ASTM. Of all the results in this study, CTE was the least affected by changes in concrete constituents. Changing cementitious material composition from OPC to slag cement had an average percent difference of 3%. Average percent differences from different cementitious material sources ranged from 1 to 2%. Average percent differences from different cementitious material compositions were similar. These results were in agreement with those of Tran et al. (2008).
0%
5%
10%
15%
20%
25%
30%
Perc
ent D
iffer
ence
Average Percent Difference in Dynamic
Modulus of Concrete
7 Day
14 Day
28 Day
90 Day
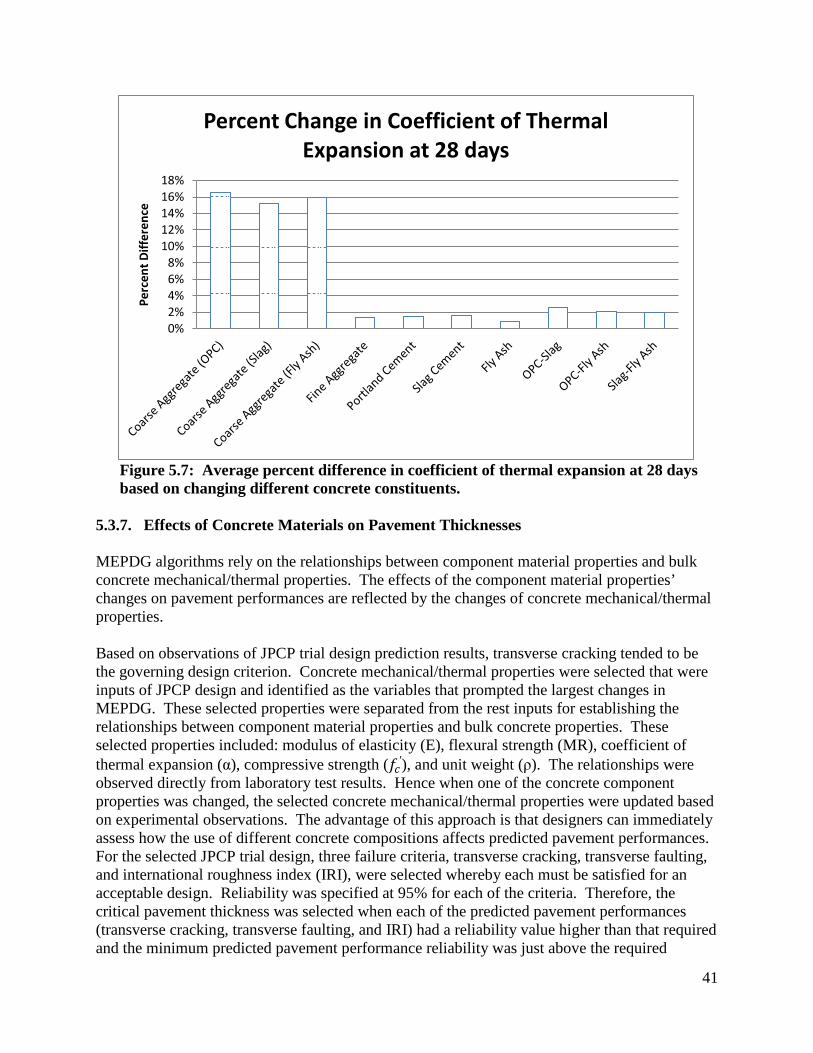
41
Figure 5.7: Average percent difference in coefficient of thermal expansion at 28 days based on changing different concrete constituents.
5.3.7. Effects of Concrete Materials on Pavement Thicknesses MEPDG algorithms rely on the relationships between component material properties and bulk concrete mechanical/thermal properties. The effects of the component material properties’ changes on pavement performances are reflected by the changes of concrete mechanical/thermal properties. Based on observations of JPCP trial design prediction results, transverse cracking tended to be the governing design criterion. Concrete mechanical/thermal properties were selected that were inputs of JPCP design and identified as the variables that prompted the largest changes in MEPDG. These selected properties were separated from the rest inputs for establishing the relationships between component material properties and bulk concrete properties. These selected properties included: modulus of elasticity (E), flexural strength (MR), coefficient of thermal expansion (α), compressive strength (𝑓𝑐′), and unit weight (ρ). The relationships were observed directly from laboratory test results. Hence when one of the concrete component properties was changed, the selected concrete mechanical/thermal properties were updated based on experimental observations. The advantage of this approach is that designers can immediately assess how the use of different concrete compositions affects predicted pavement performances. For the selected JPCP trial design, three failure criteria, transverse cracking, transverse faulting, and international roughness index (IRI), were selected whereby each must be satisfied for an acceptable design. Reliability was specified at 95% for each of the criteria. Therefore, the critical pavement thickness was selected when each of the predicted pavement performances (transverse cracking, transverse faulting, and IRI) had a reliability value higher than that required and the minimum predicted pavement performance reliability was just above the required
0%2%4%6%8%
10%12%14%16%18%
Perc
ent D
iffer
ence
Percent Change in Coefficient of Thermal
Expansion at 28 days

42
reliability value. Due to the unusual properties of certain concrete mixes, the reliability for IRI and faulting could not be satisfied at any pavement thickness. For such cases, the critical thickness was selected when only the cracking reliability was satisfied. Results from Table 5.16 were used to evaluate the effects on predicted pavement performances due to different coarse aggregate sources (reflected by the comparison among rows in the required critical thicknesses) and due to using different supplementary materials (reflected by the comparison among columns). Concrete mixes listed in the same column had fixed cementitious material composition. Concrete mixes listed in the same row had the same mix design except for different cementitious materials. Observed from Table 5.16, pavement thickness varied with coarse aggregate source (especially for the case of CS8—basalt and GG4--granite). As shown in Table 5.16, changes in coarse aggregate can influence the MEPDG prediction of pavement thickness by nearly 1 in. and depending on the aggregate source, changes in cement composition can also influence predicted thickness by 1 in.
Table 5.16: Effect from different coarse aggregate type and use of supplementary cementitious materials.
Cement 1 only Slag 1 Fly Ash 1 Coarse Aggregate Source Mix# Thickness, in Mix# Thickness, in Mix# Thickness, in GG1 (dolomite dominant) 1 9.3 16 8.2 31 8.4 GG3 (granite dominant) 3 8.5 18 8.6 33 8.5
GG6 (dolomite dominant) 6 9.1 21 8.3 36 8.2 CS1 (dolomite dominant) 7 8.9 22 7.8 37 8.6 CS4 (dolomite dominant) 10 8.5 25 7.7 40 8.2 CS6 (quartzite dominant) 12 9.5 27 8.6 42 8.6
CS7 (basalt dominant) 13 8.7 28 8.0 43 8.3 Avg 8.9 Avg 8.2 Avg 8.4
Results from Table 5.17 were used to evaluate the effects on predicted pavement thicknesses due to different cement sources and different coarse aggregate sources. Based on the observations of the critical thickness comparisons within Table 5.17, typical predicted impacts on pavement thickness were ½ in or less, but several aggregate-cement combinations prompted changes in predicted pavement thickness of 1 in. Results from Table 5.18 were used to evaluate the effects of different slag cement sources on the required pavement thicknesses. Based on the results shown in Table 5.18, the differences in required pavement thicknesses prompted by the use of different types of slag cement were insignificant. Results from Table 5.19 were used to evaluate the effect due to the use of different sources of fly ash on critical pavement thicknesses. Concrete mixes listed in each row had the same mix design except for different sources of fly ash. Concrete mixes listed in the same column represented coarse aggregate sources combined with the same fly ash cement combination.

43
Observed from the results in Table 5.19, the pavement’s critical thickness corresponding to each of the source of fly ash showed some variation but again most differences in thickness were less than ½ in.
Table 5.17: Effect due to different sources of Portland cement.
Cement 1 Cement 2 Mix# Thickness, in Mix# Thickness, in
16 8.3 46 7.9 22 7.8 48 8.1 32 9.1 57 8.9 37 8.6 58 7.5 71 8.4 51 8.1 72 8.6 52 7.6 77 8.4 62 8.1 81 9.3 66 8.5 73 7.8 53 7.6 78 8.1 63 8.3 83 8.0 68 8.0
Avg 8.4 Avg 8.1
Table 5.18: Effect due to different sources of slag cement.
Slag 1, Grade 120 Slag 2, Grade 100 Mix# Thickness, in Mix# Thickness, in
16 8.3 71 8.4 22 7.8 73 7.8 24 8.1 75 8.1 46 7.9 51 8.1 47 7.4 52 7.6 48 8.1 53 7.6 50 7.7 55 7.8
Avg 7.9 Avg 7.9
Table 5.19: Effect due to different sources of fly ash.
Fly Ash 1 Fly Ash 2 Fly Ash 3 Mix# Thickness, in Mix# Thickness, in Mix# Thickness, in
31 8.4 76 9.1 81 9.3 32 9.1 77 8.4 82 8.4 37 8.6 78 8.1 83 8.0 56 8.5 61 8.7 66 8.5 58 7.5 63 8.3 68 8.0
Avg 8.4 Avg 8.4 Avg 8.2 Results from Table 5.20 were used to evaluate the effect on required pavement thickness due to using different sources of fine aggregate. Concrete mixes listed in the same row have the same mix design except for the different fine aggregate source. Concrete mixes listed in the same

44
column are different mixes using the same source of fine aggregate. Required pavement thickness varies with different fine aggregate sources for most cases, but a majority of the values differed by less than 1/2 in.
Table 5.20: Effect due to different sources of fine aggregate.
Sand A, Southern WI Sand B, Western WI Mix# Thickness, in Mix# Thickness, in
31 8.4 96 9.4 32 9.1 97 9.9 37 8.6 98 8.6 76 9.1 101 9.1 77 8.4 102 8.6 78 8.1 103 8.5 81 9.3 106 9.2 82 8.4 107 9.6 83 8.0 108 8.4 72 8.6 92 8.4 73 7.8 93 8.8
Avg 8.5 Avg 9.0
5.4. Effects of Level 2 Empirical Relationships on Pavement Thickness The use of different hierarchical levels of input was expected to affect the MEPDG predicted pavement performance as reflected by the critical pavement thickness. The principle of the level 2 input option is to convert the level 2 inputs (7-day, 14-day, 28-day, and 90-day compressive strength inputs) into the corresponding level 1 parameters (7-day, 14-day, 28-day, and 90-day modulus of elasticity (E) and flexural strength (MR)). These values are then used for pavement response analysis, using Equations 3.1 and 3.2 mentioned earlier in section 3 of the report and repeated here:
MR = 9.5 (f’c)1/2
where f’c is the compressive strength in psi Equation 3.1
E = 33 ρ3/2 (f’c)1/2
where ρ = unit weight of the concrete in lb/ft3 and f’c is the compressive strength in psi
Equation 3.2
The principle of the level 3 option is that the default relations are used to convert level 3 input (28-day compressive strength or 28-day flexural strength) into the corresponding level 2 parameters (7-day, 14-day, 28-day, and 90-day compressive strength inputs), using Equation 3.3 mentioned earlier in section 3 of the report, then the predicted level 2 parameters are used to predict the level 1 inputs utilizing the same empirical relations mentioned in the level 2 option. Laboratory modulus of elasticity, flexural strength, and compressive strength test results from the same selected concrete mixes were substituted into the trial pavement design within MEPDG to obtain the critical pavement thicknesses in the same way described in section 5.3.7, each
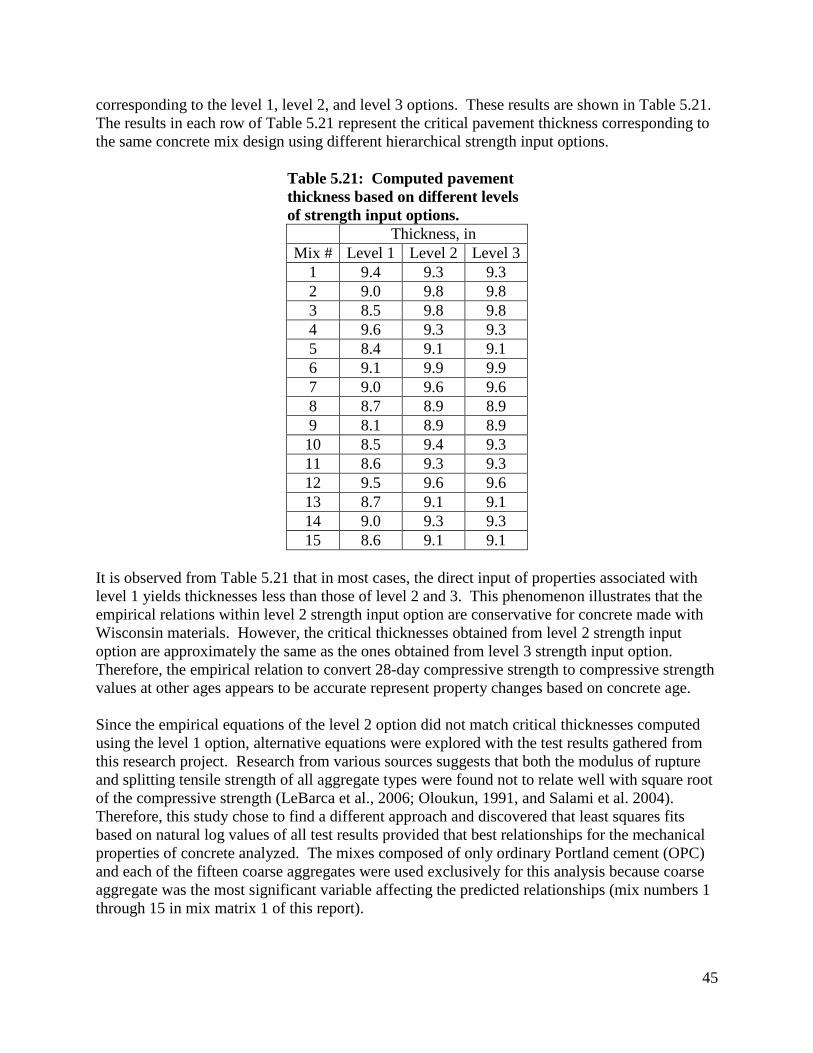
45
corresponding to the level 1, level 2, and level 3 options. These results are shown in Table 5.21. The results in each row of Table 5.21 represent the critical pavement thickness corresponding to the same concrete mix design using different hierarchical strength input options.
Table 5.21: Computed pavement thickness based on different levels of strength input options.
Thickness, in Mix # Level 1 Level 2 Level 3
1 9.4 9.3 9.3 2 9.0 9.8 9.8 3 8.5 9.8 9.8 4 9.6 9.3 9.3 5 8.4 9.1 9.1 6 9.1 9.9 9.9 7 9.0 9.6 9.6 8 8.7 8.9 8.9 9 8.1 8.9 8.9 10 8.5 9.4 9.3 11 8.6 9.3 9.3 12 9.5 9.6 9.6 13 8.7 9.1 9.1 14 9.0 9.3 9.3 15 8.6 9.1 9.1
It is observed from Table 5.21 that in most cases, the direct input of properties associated with level 1 yields thicknesses less than those of level 2 and 3. This phenomenon illustrates that the empirical relations within level 2 strength input option are conservative for concrete made with Wisconsin materials. However, the critical thicknesses obtained from level 2 strength input option are approximately the same as the ones obtained from level 3 strength input option. Therefore, the empirical relation to convert 28-day compressive strength to compressive strength values at other ages appears to be accurate represent property changes based on concrete age. Since the empirical equations of the level 2 option did not match critical thicknesses computed using the level 1 option, alternative equations were explored with the test results gathered from this research project. Research from various sources suggests that both the modulus of rupture and splitting tensile strength of all aggregate types were found not to relate well with square root of the compressive strength (LeBarca et al., 2006; Oloukun, 1991, and Salami et al. 2004). Therefore, this study chose to find a different approach and discovered that least squares fits based on natural log values of all test results provided that best relationships for the mechanical properties of concrete analyzed. The mixes composed of only ordinary Portland cement (OPC) and each of the fifteen coarse aggregates were used exclusively for this analysis because coarse aggregate was the most significant variable affecting the predicted relationships (mix numbers 1 through 15 in mix matrix 1 of this report).
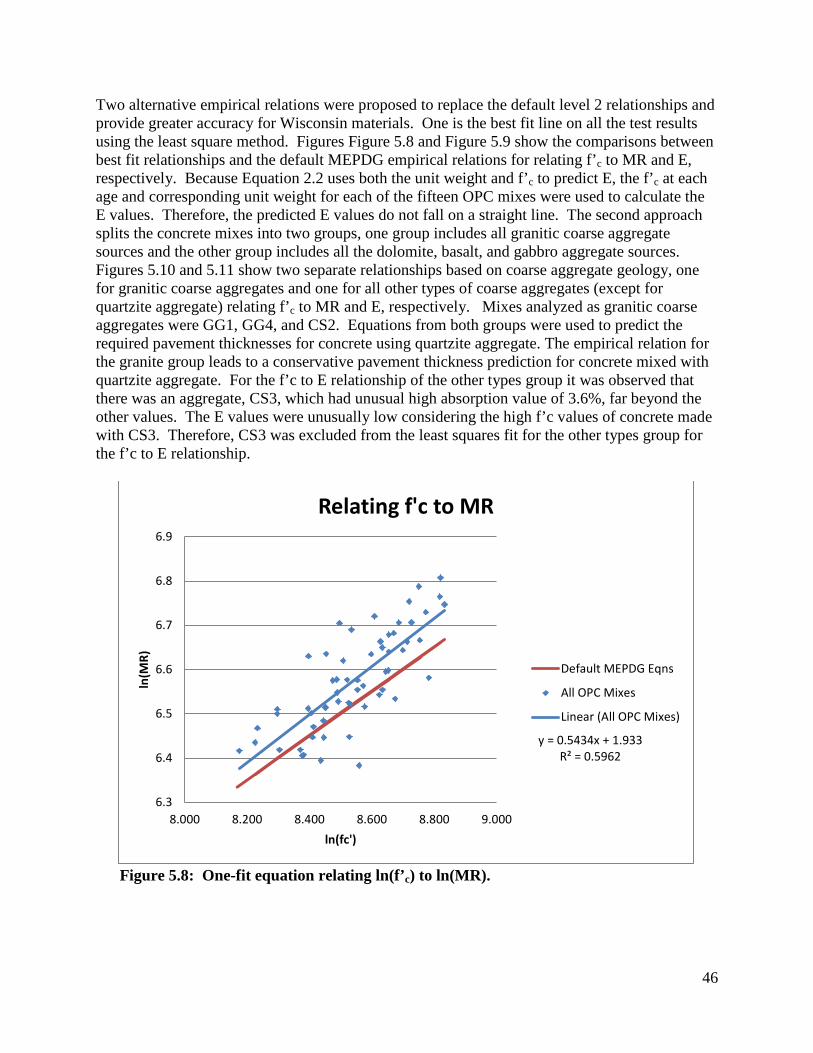
46
Two alternative empirical relations were proposed to replace the default level 2 relationships and provide greater accuracy for Wisconsin materials. One is the best fit line on all the test results using the least square method. Figures Figure 5.8 and Figure 5.9 show the comparisons between best fit relationships and the default MEPDG empirical relations for relating f’c to MR and E, respectively. Because Equation 2.2 uses both the unit weight and f’c to predict E, the f’c at each age and corresponding unit weight for each of the fifteen OPC mixes were used to calculate the E values. Therefore, the predicted E values do not fall on a straight line. The second approach splits the concrete mixes into two groups, one group includes all granitic coarse aggregate sources and the other group includes all the dolomite, basalt, and gabbro aggregate sources. Figures 5.10 and 5.11 show two separate relationships based on coarse aggregate geology, one for granitic coarse aggregates and one for all other types of coarse aggregates (except for quartzite aggregate) relating f’c to MR and E, respectively. Mixes analyzed as granitic coarse aggregates were GG1, GG4, and CS2. Equations from both groups were used to predict the required pavement thicknesses for concrete using quartzite aggregate. The empirical relation for the granite group leads to a conservative pavement thickness prediction for concrete mixed with quartzite aggregate. For the f’c to E relationship of the other types group it was observed that there was an aggregate, CS3, which had unusual high absorption value of 3.6%, far beyond the other values. The E values were unusually low considering the high f’c values of concrete made with CS3. Therefore, CS3 was excluded from the least squares fit for the other types group for the f’c to E relationship.
Figure 5.8: One-fit equation relating ln(f’c) to ln(MR).
y = 0.5434x + 1.933 R² = 0.5962
6.3
6.4
6.5
6.6
6.7
6.8
6.9
8.000 8.200 8.400 8.600 8.800 9.000
ln(M
R)
ln(fc')
Relating f'c to MR
Default MEPDG Eqns
All OPC Mixes
Linear (All OPC Mixes)

47
Figure 5.9: One-fit equation relating ln(f’c) to ln(E).
Figure 5.10: Two equations relating ln(f’c) and ln(MR) based on coarse aggregate geology.
y = 0.5627x + 10.445 R² = 0.3596
14.800
14.900
15.000
15.100
15.200
15.300
15.400
15.500
15.600
8.000 8.200 8.400 8.600 8.800 9.000
ln(E
)
ln(fc')
Default MEPDG Equation for E
All OPC Mixes
Default MEPDG Eqns
Linear (All OPC Mixes)
y = 0.5421x + 1.9546 R² = 0.6045
y = 0.5823x + 1.5565 R² = 0.7668
6.350
6.400
6.450
6.500
6.550
6.600
6.650
6.700
6.750
6.800
6.850
8.000 8.200 8.400 8.600 8.800 9.000
ln(M
R)
ln(fc')
Modulus of Rupture vs. Compressive Strength
Other AggregateTypes
Granite
Linear (OtherAggregate Types)
Linear (Granite)

48
Figure 5.11: Two equations relating ln(f’c) and ln(E) based on coarse aggregate geology.
Pavement critical thicknesses were computed using the previously mentioned alternative equations and the MEPDG. Pavement thicknesses were computed for the level 1, default level 2 and default level 3 options for comparison. As stated before, the default level 2 option and level 3 option provided conservative pavement thicknesses predictions compared to the predictions by the level 1 option. The one fit relationship and relationships based on geology were more accurate than the default level 2 and level 3 options. The relationship based on geology resulted in better critical thickness predictions, and provided mostly conservative results compared to of the results provided by the level 1 option. Comparisons of the required JPCP thicknesses using different concrete strength input options are shown in Table 5.22. By considering the last row in Table 5.22 that shows the averages, direct input of concrete properties results in a predicted pavement thickness approximately ½ in. less than default level 2 and 3 options. Inserting more accurate level 2 equations would decrease predicted pavement thicknesses by approximately ¼ in. less than default level 2 and 3. Graphic comparisons of JPCP design thicknesses for the selected coarse aggregate sources are shown in Figure 5.12.
y = 0.675x + 9.4848 R² = 0.515
y = 0.4575x + 11.429 R² = 0.6909
14.800
14.900
15.000
15.100
15.200
15.300
15.400
15.500
15.600
8.000 8.200 8.400 8.600 8.800 9.000
ln(M
R)
ln(fc')
Modulus of Elasticity vs. Compressive Strength
OtherAggregateTypesGranite
CS3
Linear (OtherAggregateTypes)Linear (Granite)

49
Table 5.22: JPCP design thicknesses comparison for the selected input options.
Critical Thickness, in Mix Mineral Level
1 One
Equation Two
Equation Default Level
2 Default Level
3 GG1 Granite 9.3 9.0 9.4 9.3 9.3 GG2 Dolomite 8.9 9.4 9.3 9.8 9.7 GG3 Dolomite/Granite/Basalt 8.5 9.4 9.3 9.8 9.8 GG4 Granite 9.5 8.9 9.4 9.3 9.3 GG5 Dolomite 8.4 8.8 8.8 9.1 9.1 GG6 Dolomite 9.1 9.4 9.3 9.9 9.8 CS1 Dolomite 8.9 9.2 9.2 9.6 9.6 CS2 Granite 8.7 8.5 9.0 8.9 8.9 CS3 Dolomite 8.1 8.5 8.5 8.9 8.8 CS4 Dolomite 8.5 9.0 8.9 9.3 9.3 CS5 Dolomite 8.6 9.0 8.9 9.3 9.3 CS6 Quartzite 9.5 9.2 9.9 9.6 9.6 CS7 Basalt 8.7 8.6 8.6 9.1 9.1 CS8 Dolomite 9.0 8.9 8.9 9.3 9.2 CS9 Gabbro 8.6 8.6 8.6 9.0 9.0
Averages 8.8 9.0 9.1 9.3 9.3

50
Figure 5.12: Comparisons on JPCP design thicknesses.
7
7.5
8
8.5
9
9.5
10
GG1 GG2 GG3 GG4 GG5 GG6 CS1 CS2 CS3 CS4 CS5 CS6 CS7 CS8 CS9
JPCP
Des
ign
thic
knes
ses
Coarse Aggregate Source
Level 1
One Equation
Two Equation
Default Level 2

51
5.5. Comparison of Results with Previous WHRP Studies 5.5.1. Effects of Ground Granulated Blast Furnace Slag in PCC – Expanded Study
(WHRP 0092-05-01) Background WHRP 0092-05-01, a study previously performed by the University of Wisconsin-Madison, examined the properties of concrete using grade 120 slag cement at different replacement levels. WHRP 0092-05-01 is referred to as Phase II of WHRP 0092-02-14a, another study performed by the University of Wisconsin-Madison. The earlier study was referred to as Phase I and examined the properties of concrete using grade 100 slag cement. Similar materials and test methods were used in both phases; however, materials were acquired at different times and required some assumptions in order to directly compare Phase II with Phase I. WHRP 0092-05-01 and WHRP 0092-02-14a will be referred to as the Phase II slag cement study, and Phase I slag cement study, respectively. The slag cement studies used similar Portland cement and slag cement sources to this study. The Phase II slag cement study utilized a fresh air content ranging from 5.5% to 6.5% and a slump ranging from 1 to 5.25 in. Similarly, this study utilized a target air content of 5.0% to 7.0% and 1 to 3 in. range respectively. Water to cementitious material (w/cm) ratio in the slag cement studies the project was a fixed 0.45 w/cm ratio while this study used a nominal 0.40 w/cm ratio that was allowed to vary based on slump constraints. Also, the sources of the fine and coarse aggregates were different as this study involved the use of fifteen different coarse aggregate sources and two different fine aggregate sources. Comparisons between the two studies were made for concrete tensile and compressive strengths based on different grades of slag cement, different types of coarse aggregates, different sources of cement, and different cementitious material compositions. In addition, the relationship between concrete tensile and compressive strength based on the data from the Phase II slag cement study was compared to the relationship of the corresponding data from this study. Compressive Strength Comparison The Phase II slag cement study was adjusted for small differences in air content using an equation by Popovics (1998) when drawing conclusions based on the concrete compressive strength. In this study, the concrete compressive strength results were not adjusted for air content. Therefore, comparisons were drawn based on the assumption that the minor difference in air content did not affect concrete compressive strength considerably. Table 5.23 provides Phase II slag cement study percent difference results between lowest to highest average compressive strength of concrete (adjusted and unadjusted for air content) with different Portland cement sources with 120 grade slag cement (30% replacement level) for each comparable coarse aggregate source. Table 5.24 provides results from this study utilizing the two sources of Portland cement partially replaced by 120 grade slag cement. There are noticeable differences between the results of this study and those of the Phase II slag cement study. The percent differences in compressive strength of concrete in the Phase II slag cement study are much larger than that of those found in this study. Percent differences in compressive strength of concrete with different cement sources in the Phase II slag cement study ranged from 3 to 38% with an average of 14%. In comparison, percent differences ranged from 0 to 16% with an average of

52
4%, in this study. These differences result from four sources of Portland cement used in the Phase II slag cement study increasing the variability compared to this study in which only used two sources of Portland cement were used.
Table 5.23: Percent difference between lowest to the highest compressive strength based on different Portland cement sources from the Phase II slag cement study.
Air Content Coarse Aggregate
Age (Days) 3 7 14 28 56 365
Unadjusted Limestone 17% 9% 3% 13% 11% 9% Igneous 38% 21% 11% 13% 17% 10%
Adjusted Limestone 21% 11% 9% 9% 13% 15% Igneous 34% 21% 5% 6% 9% 4%
Table 5.24: Percent difference between lowest to the highest compressive strength based on different Portland cement sources from this study.
Coarse Aggregate
General Geology
Age (Days) 7 14 28 90
GG1 Igneous 2% 4% 2% 2% GG2 Dolomite 6% 7% 0% 9% CS1 Dolomite 16% 10% 3% 1% CS2 Igneous 5% 1% 6% 0% CS3 Dolomite 4% 1% 1% 2%
Percent difference between lowest to highest average compressive strength of concrete with different coarse aggregates mixed with cement partly replaced by the 120 grade slag cement (30% replacement level) for each cement source were calculated for data presented in the Phase II slag cement study and is provided in Table 5.25. Analogous methods were utilized for this project based on the five coarse aggregates and the results are provided in Table 5.26. Comparisons were conducted to determine the effect of concrete with different aggregate types on compressive strength. Specifically, the value represents the largest percent difference due to different coarse aggregates. The percent differences in compressive strength of concrete with different coarse aggregate sources found in the Phase II slag cement study are slightly smaller than differences found in this study. Specifically, the Phase II slag cement study had results that ranged from 8 to 26%, with an average of 18%, and this study had results that ranged from 21 to 33%, with an average of 28%. Again this variance can be explained by the use of only two different sources of aggregates for the Phase II slag cement study compared to the five used in this study.

53
Table 5.25: Percent difference between compressive strength based on different coarse aggregate sources (2) from the Phase II slag cement study.
Air Content
Cement Brand
Age (Days) 3 7 14 28 56 365
Unadjusted
Cement 1 23% 22% 23% 20% 20% 21% Cement 2 12% 14% 18% 12% 12% 15% Cement 3 18% 13% 13% 15% 8% 10% Cement 4 27% 22% 24% 28% 25% 22%
Adjusted
Cement 1 24% 23% 24% 21% 22% 22% Cement 2 15% 16% 21% 14% 14% 18% Cement 3 19% 14% 13% 16% 8% 10% Cement 4 25% 20% 21% 26% 23% 20%
Table 5.26: Percent difference between compressive strength based on different coarse aggregate sources (5) from this study.
Cement Brand
Age (Days) 7 14 28 90
Cement 1 29% 29% 28% 21% Cement 2 26% 32% 29% 33%
Tensile Strength Comparison Percent differences between lowest to highest average splitting tensile strength of concrete with different Portland cement sources and 120 grade slag cement (30% replacement level) for each coarse aggregate source is provided in Table 5.27 from the Phase II slag cement study. Comparable values were calculated for this project for the two sources of Portland cement with 120 grade slag cement used in this study and the results are provided in Table 5.28. Similar to compressive strength, the differences in percent differences in tensile strength are noticeable between the results. Results from the Phase II slag cement study ranged from 7 to 31%, with an average of 17%, and results from this study ranged from 1 to 16%, with an average of 7%. Similar to compressive strength, this difference can be attributed to four sources of Portland cement used in Phase II slag cement versus the two sources of Portland cement used in this study.

54
Table 5.27: Percent difference between the lowest to the highest splitting tensile strength based on different Portland cement sources from the Phase II slag cement study.
Coarse Aggregate
Age (Days) 3 7 14 28 56 365
Limestone 31% 19% 21% 22% 11% 7% Igneous 30% 20% 15% 7% 11% 7%
Table 5.28: Percent difference between lowest to the highest splitting tensile strength based on different Portland cement sources from this study.
Coarse Aggregate
General Geology
Age (Days) 7 14 28 90
GG1 Igneous 16% 14% 2% 4% GG2 Dolomite 8% 7% 2% 1% CS1 Dolomite 15% 8% 2% 10% CS2 Igneous 5% 14% 6% 7% CS3 Dolomite 3% 4% 10% 8%
Percent differences between splitting tensile strength of concrete with different coarse aggregate sources with 120 grade slag cement (30% replacement level) for each cement source were calculated for data presented in the Phase II slag cement study and results are provided in Table 5.29. Comparable values were calculated for this project and results are provided in Table 5.30. Comparisons were conducted to determine the effect of different coarse aggregate types on the tensile strength of concrete. The percent differences ranged from 8 to 26%, with an average of 16% in the Phase II slag cement study, and percent differences ranged from 12 to 48%, with an average of 22%, in this study. Similar to compressive strength, this discrepancy is likely related to the difference in sample size between the two studies.
Table 5.29: Percent difference between splitting tensile strength based on different coarse aggregate sources from the Phase II slag cement study.
Cement Brand
Age (Days) 3 7 14 28 56 365
Cement 1 18% 23% 22% 23% 12% 13% Cement 2 17% 12% 23% 11% 14% 19% Cement 3 21% 23% 4% 2% 11% 25% Cement 4 11% 10% 16% 18% 20% 17%

55
Table 5.30: Percent difference between splitting tensile strength based on different coarse aggregate sources from this study.
Cement Brand
Age (Days) 7 14 28 90
Cement 1 26% 48% 23% 14% Cement 2 16% 12% 15% 24%
Comparison of Tensile to Compressive Strength Relationship When comparing the relationship between compressive and tensile strength, the trends are quite similar in both studies. Figure 5.13 provides a power fit for the relationship between concrete compressive strength and tensile strength based on the data provided by the Phase II slag cement study and the corresponding data collected in this study. The data from both studies appear to overlap in a similar region. However, the power fits of each of the sets of data appear to be slightly different, and the power fit of the Phase II slag cement study provides a better overall fit based on least squares. This difference and variance was likely because the Phase II slag cement study tested their concrete specimens at six different ages ranging from 3 to 365 days, where this study only tested at four different ages ranging from 7 to 90 days. Despite the differences, the possibility of one fit of compressive to tensile strength for concrete with different w/cm ratios could be suggested as the following because the trends are similar:
𝑓𝑠𝑡 = 1.2985 ∗ 𝑓𝑐′
0.695 Equation 5.1 This relationship is close to the splitting tensile-compressive strength relationship developed by Oluokun (1991):
𝑓𝑠𝑡 = 1.38 ∗ 𝑓𝑐′0.69 Equation 5.2
For both equations the splitting tensile strength,𝑓𝑠𝑡, and the compressive strength, 𝑓𝑐′, are in psi.

56
Figure 5.13: Relationship of compressive to splitting tensile strength for the Phase II slag cement study and this study.
5.5.2. Investigation of Concrete Properties to Support Implementation of the New
AASHTO Pavement Design Guide (WHRP 0092-06-03) Background Performed by the University of Wisconsin-Milwaukee (UWM), WHRP 0092-06-03 examined a selected group of properties that were used as inputs for the AASHTO MEPDG. For the remainder of this comparison, WHRP 0092-06-03 will be referred to as the UWM MEPDG study. The concrete properties evaluated were the splitting tensile strength and coefficient of thermal expansion. Compressive strength was also measured and served as a baseline parameter for their relationships. The sources of the materials used for the UWM MEPDG study were similar to this project in the use of coarse aggregates, fine aggregates, and cementitious materials. Fifteen of the concrete mixes used UWM MEPDG study utilized one Portland cement supplemented with one fly ash source at the same replacement level as in this study. These fifteen concrete mixes varied with each other in coarse aggregate source. In total, four additional concrete mixes were composed by changing only one of the following parameters each: the ordinary Portland cement (OPC) source, the fly ash source, exchanging supplementary cementitious material of fly ash to slag cement, and using only OPC without a supplementary cementitious material. Similar to this study, the w/cm ratio ranged from 0.38 to 0.41, fresh air content ranged from 4.8% to 7.9%, and slump ranged from 1 to 4 in. However, the differences in the methods of acquiring of all materials and time of acquirement were considered as this could cause variation when comparing the test results. In addition, different coarse aggregate
y = 0.9379x0.7353 R² = 0.92
y = 2.3907x0.6229 R² = 0.68
y = 1.2985x0.6954 R² = 0.88
0
100
200
300
400
500
600
700
800
0 2000 4000 6000 8000
Split
ting
Tens
ile S
tren
gth
(psi
)
Compressive Strength (psi
Phase II Slag Study
This Study
Power (Phase II Slag Study)
Power (This Study)
Power (Both Studies)

57
size and gradation were used for the UWM MEPDG study, and therefore, comparisons were restricted to percentage differences. The primary objective was to compare the percent differences in concrete properties based on the use of different concrete constituents. Percent differences in compressive and tensile strength from the UWM MEPDG study were compared to results found in this study using data from specimens produced with similar concrete constituents. Percent differences in the concrete CTE were qualitatively compared because the test method was changed from AASHTO TP60 to AASHTO T-336 in 2009, significantly changing the test protocol and equipment. The relationship of compressive to tensile strength for the UWM MEPDG study was compared to the relationship from the corresponding data in this study. Compressive Strength Comparison Percent differences in compressive strength were calculated for the data from concrete with different constituents in the UWM MEPDG study and results are provided in Table 5.31. Corresponding values were calculated in this study by matching up similar concrete constituents changed, specifically for different sources of coarse aggregate, OPC, slag cement, and fly ash. These values are provided in Table 5.32. The percent differences in compressive strength of concrete with different coarse aggregate types in the tables represent the average of the largest percent differences in compressive strength of concrete each coarse aggregate had over any other coarse aggregates. Percent differences from the UWM MEPDG study differed in compressive strength of concrete from this study by as much as 28% due to changing OPC source and 18% due to only using OPC instead of OPC with fly ash. The differences in Blaine fineness between this study and the UWM MEPDG study was 13 m2/kg for Cement 1 and 10 m2/kg, which could have added to the disparity in the results. However, the percent differences in compressive strength of concrete with different coarse aggregate types, fly ash sources, and using slag cement instead of fly ash with OPC were similar to the results found in this study.
Table 5.31: Percent difference between compressive strength based on changing concrete constituents from the UWM MEPDG study.
Variable Age (Days) 7 14 28 90
Coarse Aggregate 33% 37% 36% 26% Cement Source 10% 37% 22% 32% Fly Ash Source 12% 12% 5% 0%
Slag Cement vs. Fly Ash 20% 26% 21% 6% Only OPC vs. Fly Ash 26% 32% 32% 23%

58
Table 5.32: Percent difference between compressive strength based on different concrete constituents from this study.
Variable Age (Days) 7 14 28 90
Coarse Aggregate 28% 33% 36% 32% Cement Source 1% 9% 10% 16% Fly Ash Source 8% 4% 2% 9%
Slag Cement vs. Fly Ash 11% 19% 19% 20% Only OPC vs. Fly Ash 8% 17% 15% 18%
Tensile Strength Comparison Percent difference in concrete splitting tensile strength due to changing different concrete constituents’ sources was calculated for data presented in the UWM MEPDG study and is provided in Table 5.33. Similarly, corresponding values for concrete tensile strength were calculated for this study by matching up similar concrete constituents, specifically sources of coarse aggregate, OPC, slag cement, and fly ash. These values are provided in Table 5.34. Again, the percent differences based on in splitting tensile strength of concrete with different coarse aggregate types in the tables represent the average of the largest percent differences each coarse aggregate had over any other coarse aggregates. As in the compressive strength results, the percent differences in splitting tensile strength found in the UWM MEPDG study appear to be larger when changing cementitious material composition from only OPC to OPC with fly ash. However, percent differences in splitting tensile strength of concrete with different OPC sources were similar to results from this study. Percent differences in splitting tensile strength from the UWM MEPDG study differed from this study by as much as 15% when changing cementitious material composition from only OPC to OPC with fly ash. The differences in Blaine fineness between this study and the UWM MEPDG study was 13 m2/kg for Cement 1 and 10 m2/kg, which could have again added to the disparity in the results. Percent differences in splitting tensile strength due to changing coarse aggregate type and using slag cement instead of fly ash with OPC were similar to results found for this study. However, the percent differences due to different fly ash sources for the UWM MEPDG study are larger than results from this study. Similar results are important to observe because it appears that even though the coarse aggregate size and gradations and slag cement sources were exactly the same in each study, their effects on concrete tensile strength were similar.
Table 5.33: Percent difference between splitting tensile strength based on different concrete constituents from the UWM MEPDG study.
Variable Age (Days) 7 14 28 90
Coarse Aggregate 25% 26% 25% 23% Cement Source 3% 32% 12% 2% Fly Ash Source 40% 17% 17% 8%
Slag Cement vs. Fly Ash 6% 8% 9% 3% Only OPC vs. Fly Ash 24% 16% 4% 21%

59
Table 5.34: Percent difference between splitting tensile strength based on different concrete constituents from this study.
Variable Age (Days) 7 14 28 90
Coarse Aggregate 24% 27% 27% 23% Cement Source 6% 5% 13% 8% Fly Ash Source 6% 10% 12% 5%
Slag Cement vs. Fly Ash 0% 12% 3% 6% Only OPC vs. Fly Ash 9% 9% 4% 11%
Coefficient of Thermal Expansion Comparison Percent differences between coefficients of thermal expansion (CTE) due to changing concrete constituents’ sources were calculated for data presented in the UWM MEPDG study and the results are provided in Table 5.35. Corresponding values were calculated for specimens in this study which utilized similar concrete constituents, specifically sources of coarse aggregate, ordinary Portland cement, slag cement, and fly ash. These values are provided in Table 5.36. Again, the percent differences in CTE of concrete with different coarse aggregate types represent the average of the largest differences each coarse aggregate had over any other coarse aggregates. Similar to the compressive and tensile results, the percent differences in CTE found in the UWM MEPDG study appear to be largest when coarse aggregate was the variable. The impact of coarse aggregate source was larger for the UWM MEPDG study, and this could be likely because although the coarse aggregate sources were the same as this study different aggregate sizes and gradations were utilized. All other changes in concrete constituents for the UWM MEPDG study were fairly similar to this study’s results. Data from both reports suggested that changing the cementitious materials of concrete has a minimal effect on CTE.
Table 5.35: Percent difference between coefficients of thermal expansion based on changing concrete constituents from the UWM MEPDG study.
Variable Age
(Days) 28
Coarse Aggregate 21% Cement Source 0% Fly Ash Source 2%
Slag Cement vs. Fly Ash 1% Only OPC vs. Fly Ash 1%

60
Table 5.36: Average percent difference between coefficients of thermal expansion based on changing concrete constituents from this study.
Variable Age
(Days) 28
Coarse Aggregate 16% Cement Source 1% Fly Ash Source 1%
Slag Cement vs. Fly Ash 5% Only OPC vs. Fly Ash 1%
Comparison of Tensile to Compressive Strength Relationship When comparing the relationship between compressive and tensile strength for concrete, the trends were different between data from the UWM MEPDG study and this study. Tensile strength values for the UWM MEPDG study were larger, shifting the trend above that in this study. The differences in values are larger than expected and it is unclear what caused this discrepancy. Figure 5.14 provides a power least squares fit of the relationship of compressive to tensile strength data provided by the UWM MEPDG study and corresponding data of mixes with similar concrete constituents collected in this study.
Figure 5.14: Relationship of compressive to splitting tensile strength for the UWM MEPDG study and this study.
y = 2.41x0.65 R² = 0.72
y = 2.23x0.63 R² = 0.70
0
100
200
300
400
500
600
700
800
900
0 2000 4000 6000 8000 10000
Tens
ile S
tren
gth
(psi
)
Compressive Strength (psi)
WHRP 0092-06-03
WHRP 0092-11-10
Power (WHRP 0092-06-03)
Power (WHRP 0092-11-10)

61
5.5.3. Reduction of Minimum Required Weight of Cementitious Materials in Concrete Mixes (WHRP 0092-08-08)
Background WHRP 0092-08-08, a study performed by the Michigan Tech University, examined the effect of reducing the amount of cementitious materials in concrete mixes using materials from Wisconsin. For the remainder of this comparison, WHRP 0092-08-08 will be referred to as the cement weight study. The concrete properties evaluated similar to this study were the compressive and splitting tensile strength at various ages, as well as the modulus of elasticity and Poisson’s ratio after 28 days. The sources of the materials used for the cement weight study were similar to this project including the use of two coarse aggregate sources, one fine aggregate source, two ordinary Portland cement (OPC) sources, one slag cement source, and two fly ash sources. Cementitious material contents (CMCs) of 564 lbs/yd3, 470 lbs/yd3, and 423 lbs/yd3 were examined, and to achieve the target slump different proportions of the coarse to fine aggregate weight ratio were used. For the CMC of 564 lbs/yd3, which was similar the amount used in this study (564 lbs/yd3), the coarse to fine aggregate weight ratio was 55/45 for mixes without fly ash, and 40/60 for the mixes with fly ash. A coarse to fine aggregate weight ratio of 60/40 was used for all mixes in this study. Similar to this study, the target w/cm ratio was 0.40, target fresh air content was 6.0% ± 1.0%, and target slump was 3 in. ± 1 in. However, the differences in the methods of acquiring of all materials and time of acquirement could cause variation when comparing the test results. In addition, differences are possible because of variations in mix proportions. Therefore, only relative comparisons were made. Similar to the comparisons within the UWM MEPDG study, the primary objective was to compare the percent differences in concrete properties due to the use of different constituents. Differences in compressive and tensile strength from the cement weight study were compared to results found in this study using data from specimens produced with similar concrete constituents. Differences in the concrete modulus of elasticity and Poisson’s ratio after 28 days were also compared using data from specimens produced with similar concrete constituents. The relationship of compressive to tensile strength for the cement weight study was compared to the relationship of corresponding data from this study, similar to the comparison made to the Phase II slag cement and UWM MEPDG studies. Compressive Strength Comparison Average percent differences in compressive strength of concrete were calculated for data encompassing one changed constituent presented in the cement weight study and the results are provided in Table 5.37. Corresponding values were calculated for this study by matching up similar concrete constituents changed, specifically sources of coarse aggregate, OPC, slag cement, and fly ash. These values are provided in Table 5.38. Percent differences in compressive strength from the cement weight study differed from this study by as much as 10% due to changing OPC source. Characteristics of the cementitious materials used in the cement weight study were not presented in the report; therefore, a reason could not be proposed to explain the cause for these differences. However, similar to the comparison to the UWM MEPDG study, percent differences in compressive strength when changing coarse aggregate

62
type, fly ash source, and using slag cement instead of fly ash with OPC were similar to results found in this study.
Table 5.37: Average percent difference between compressive strength based on changing concrete constituents from the cement weight study.
Variable Age (Days) 3 7 28 90
Coarse Aggregate Type 12% 10% 16% 16% Portland Cement Source 10% 19% 12% 11%
Fly Ash Source 9% 7% 10% 7% Slag Vs. Fly Ash 10% 8% 13% 13%
Table 5.38: Average percent difference between compressive strength based on different concrete constituents from this study
Variable Age (Days) 7 14 28 90
Coarse Aggregate Type 14% 13% 12% 12% Portland Cement Source 9% 7% 6% 8%
Fly Ash Source 7% 9% 9% 8% Slag Vs. Fly Ash 13% 9% 8% 10%
Tensile Strength Comparison Average percent differences in splitting tensile strength due to changing different concrete constituents’ sources were calculated for data presented in the cement weight study and the results are provided in Table 5.39. As performed with compressive strength data, corresponding values were calculated for this study by matching up similar concrete constituents, specifically sources of coarse aggregate, OPC, slag cement, and fly ash. These values are provided in Table 5.40. All results from the cement weight study were similar to the results in this study. The average percent differences in splitting tensile strength when changing OPC source were slightly higher for results from the cement weight study compared to this study’s results. However, the results did not differ as much as in the compressive strength results.

63
Table 5.39: Average percent difference between splitting tensile strength based on different concrete constituents from the cement weight study.
Factor Age (Days) 3 7 28 90
Coarse Aggregate Type 6% 6% 9% 8% Portland Cement Source 10% 12% 4% 13%
Fly Ash Source 8% 6% 8% 3% Slag Vs. Fly Ash 4% 8% 9% 10%
Table 5.40: Average percent difference between splitting tensile strength based on different concrete constituents from this study.
Factors Age (Days) 3 7 28 90
Coarse Aggregate Type 9% 6% 6% 5% Portland Cement Source 10% 5% 5% 6%
Fly Ash Source 2% 8% 11% 5% Slag Vs. Fly Ash 5% 7% 6% 5%
Modulus of Elasticity and Poisson’s Ratio Comparison Average percentage difference between modulus of elasticity and Poisson’s ratio of concrete due to changing concrete constituents’ sources were calculated for data presented in the cement weight study and is provided in Table 5.41. Corresponding values were calculated for specimens in this study which utilized similar concrete constituents, specifically sources of coarse aggregate, OPC, slag cement, and fly ash. These values are provided in Table 5.42. The average percent differences in modulus of elasticity and Poisson’s ratio of concrete from the cement weight study were not similar to this study. The impact of the coarse aggregate on modulus of elasticity was not as great as computed for corresponding data in this study. This could be likely because the granite type coarse aggregate was not exactly the same as in this study, but rather a similar granite type source from northern Wisconsin. Also, the results from the cement weight study suggest that OPC, slag cement, and fly ash have a larger impact compared to corresponding results in this study.

64
Table 5.41: Average percent difference between modulus of elasticity (E) and Poisson’s ratio (υ) based on changing concrete constituents from the cement weight study.
Factor 28 Days E υ
Coarse Aggregate Type 10% 12% Portland Cement Source 8% 9%
Fly Ash Source 8% 11% Slag Vs. Fly Ash 11% 12%
Table 5.42: Average percent difference between modulus of elasticity and Poisson’s ratio based on changing concrete constituents from this study.
Factor 28 Days E υ
Coarse Aggregate Type 20% 10% Portland Cement Source 1% 6%
Fly Ash Source 3% 7% Slag Vs. Fly Ash 5% 5%
Comparison of Tensile to Compressive Strength Relationship Similar to the comparison to the UWM MEPDG study, when comparing the relationship between compressive and tensile strength, the trends were different between data from the cement weight study and this study. The compressive and tensile strengths were higher for the cement weight study. Figure 5.15 provides a power fit of the relationship of compressive to tensile strength data provided by the cement weight study and corresponding data collected in this study.

65
Figure 5.15: Relationship of compressive to tensile strength for the cement weight study (0092-08-08) and this study (0092-10-11).
6. Summary of Findings and Recommendations 6.1. Summary of Findings 6.1.1. Effects of Changing Concrete Components on Concrete Properties The effects on predicted performance from changes to individual concrete components vary with concrete property, component changed, and type or source of component changed. Table 6.1 shows the relative magnitude of the effect of changing each concrete component had on each of the concrete properties. This relative magnitude is computed from the average percent difference of all tests and ages evaluating the effect of each particular component analyzed in this study. The effects of the components evaluated in this study were based on coarse aggregate type, cementitious material type, fine aggregate type, cement source, slag cement type, and fly ash source. In addition the effect of supplementing either slag cement or fly ash with Portland cement was evaluated. For all of the concrete properties the type of coarse aggregate had the greatest effect without exception on the properties examined in this study. The magnitude of the effect varied with each property. Other effects were relatively minor but depending on the sensitivity of the MEPDG process to the individual property, even some of the more minor effects could prompt changes to pavement designs.
y = 3.61x0.59 R² = 0.97
y = 3.65x0.57 R² = 0.77
0
100
200
300
400
500
600
700
800
900
0 2000 4000 6000 8000 10000 12000
Split
Ten
sil S
tren
gth
(psi
)
Compressive Strength (psi)
WHRP 0092-08-08
WHRP 0092-10-11
Power (WHRP 0092-08-08)
Power (WHRP 0092-10-11)

66
Table 6.1: Relative apparent magnitudes of the effect of changing concrete constituents on concrete properties (values are a rating calculated from average percent changes, 1.0 being the largest effect).
Factor
Concrete Property
Compressive Strength
Modulus of
Rupture
Modulus of
Elasticity
Poisson's Ratio
Tensile Strength
Dynamic Modulus
Coarse Aggregate 0.9 0.6 1.0 0.8 0.9 0.5
Fine Aggregate 0.3 0.3 0.3 0.2 0.2 0.2
Portland Cement 0.2 0.3 0.2 0.2 0.2 0.1
Slag Cement 0.2 0.2 0.1 0.2 0.2 0.1
Fly Ash 0.2 0.2 0.2 0.2 0.2 0.1
OPC vs. Slag 0.2 0.4 0.2 0.3 0.4 0.1
OPC vs. Fly Ash 0.3 0.2 0.2 0.2 0.3 0.1
Slag vs. Fly Ash 0.2 0.3 0.2 0.2 0.2 0.1
6.1.2. Effects of Changing Concrete Components on Pavement Design The following conclusions were formulated using the critical thickness analysis to evaluate the effects of concrete component materials:
• Pavement design thickness varies with coarse aggregate source, driven by the large percent differences observed in concrete properties.
• The use of supplementary materials, especially slag, improves the rigid pavement’s predicted MEPDG performance by decreasing the required pavement thickness. This is supported by the observation that percent differences in modulus of rupture based on changing supplementary cementitious material type was nearly the same as the effect of changing coarse aggregate source, especially comparing OPC concrete to concrete with OPC and slag cement.
• For most cases, the use of cement from different manufacturers did not affect the pavement thickness. This is consistent with observed small percent differences in concrete properties due to a change in cement source.
• The difference of predicted pavement thicknesses caused by the use of different types of slag cement was small.

67
• The pavement’s predicted thickness corresponding to each source of fly ash was different. However, this effect was not as great as observed from cementitious material type or coarse aggregate type.
• Required pavement thickness varies with different fine aggregate sources for most cases, but a majority of the values differed by less than 1/2 in.
6.1.3. Effects of Different Empirical Relationships on MEPDG Pavement Design Pavement thicknesses computed using empirical relations within the level 2 strength input option did not match pavement thicknesses computed with test results of concrete made with Wisconsin materials used as inputs for the level 1. As stated before, the default level 2 options produce conservative designs compared to the level 1 designs. These differences were in the range of ½ to 1 in. of predicted pavement thickness. The critical thicknesses obtained from the level 2 strength input option are approximately the same as the ones obtained from level 3 strength input option. Therefore, the empirical relation to extrapolate 28-day compressive strength is representative for concrete made with Wisconsin materials. The one-fit relationship and relationships based on geology, as possible replacements to the default level 2 equations, better represent pavement thicknesses computed with test results of concrete made with Wisconsin materials used as inputs for the level 1. The two relationships based on geology as potential replacements of the level 2 default relationships provided the closest pavement thicknesses to those computed directly from test results of concrete made with Wisconsin materials. The observed differences in concrete properties driven by the use of Wisconsin-based materials were generally of the same magnitudes of differences observed in other comparable studies. The observed variation in properties increased with the number of different material sources included in the sample. As such, the results of each study present lower limit variations in properties than will occur when all concrete materials within the state are considered.
There are certain sensitivities in the MEPDG process that were uncovered in this research although incidental to the main objectives. For example, it is suspected that MEPDG over estimates the benefits brought by using the widened slab. When the widened slab option is selected to alleviate the damage from heavy traffic or used as the alternative to tied shoulders, it is recommended that a higher reliability level be specified. Predictions by the current MEPDG v1.1 are not always reasonable in that it appears that it is extremely sensitive to certain concrete properties. Even laboratory test variances used as level 1 input can produce variation in designs that may be unacceptable to established WisDOT practice.
6.2. Recommendations
The direct input of concrete properties via level 1 provided the smallest pavement design thicknesses and the most distinction between the advantages and disadvantages of different

68
material sources. Since it is impractical to conduct the battery of tests for each material source, the empirical equations developed for potential replacement of the default level 2 equations provide a reasonable means to achieve similar distinctions. If the WisDOT goal is more sophisticated and finely tuned tools for pavement design, then it is recommended that the default level 2 equations be replaced with equations similar to the ones proposed herein. We recommend two new sets of empirical relations to correlate concrete compressive strength values to concrete modulus of rupture and modulus of elasticity values. One set of the relations are used for concrete mixed with granite and quartzite coarse aggregates and the other set for concrete mixed with dolomite, basalt, and gabbro coarse aggregates.
The limitations on certain variables’ ranges of the default empirical relations within MEPDG should be modified. The upper limit for the concrete’s flexural strength input is 950 psi and any flexural strength inputs greater than 950 psi result in a system error of exceeding the compressive strength limit, preventing the software from running. However, many concrete mixes have their 90-day flexural strength values greater than 950 psi within the research of this project.
Further investigation of the MEPDG sensitivity to inputs is recommended before full WisDOT implementation of the MEPDG for concrete pavement design is adopted.

69
Appendix I Bibliography American Concrete Institute – Committee 225R-85 (1985), Guide to the Selection and Use of
Hydraulic Cements. ACI Journal, 901-929. American Concrete Institute – Committee 232.2R-03 (2003), Use of Fly Ash in Concrete. ACI
Manual of Concrete Practice: Part 2, 232.2R-1-41. American Concrete Institute – Committee 233R-03 (2003), Slag Cement in Concrete and
Mortar. ACI Manual of Concrete Practice, 233R-1-18. Ahlborn, T. (2008). Ultra-High Performance Concrete for Michigan Bridges. Research Report
RC-1525.Michigan Department of Transportation. Retrieved online from http://mi.gov/documents/mdot/MDOT_Research_Report_RC1525_257995_7.pdf.
Buch, N. & Jahangirnejad (2008). Quantifying Coefficient of Thermal Expansion Values of
Typical Hydraulic Cement Concrete Paving Mixtures. Research Report RC-1525. Michigan Department of Transportation. Retrieved online from http://www.michigan.gov/documents/mdot/MDOT_Research_Report_RC1503_228603_7.pdf.
Chidiac, S., & Panesar, D. (2008). Evolution of Mechanical Properties of Concrete Containing
Ground Granulated Blast Furnace Slag and Effects on the Scaling Resistance Test at 28days. Cement & Concrete Composites, 30(2), 63-71.
Choubane, B., Wu, C., & Tia, M. (1996). Coarse Aggregate Effects on Elastic Moduli of
Concrete. Transportation Research Record, 1547, 29-34. Chung, Yoonseok. (2009). Characteristics of Coefficient of Thermal Expansion of Portland
Cement Concrete Pavements. Transportation Research Record, 2728. Crouch, L. K., Pitt, J., & Hewitt, R. (2007). Aggregate Effects on Pervious Portland Cement
Concrete Static Modulus of Elasticity. Journal of Materials in Civil Engineering, 19(7), 561-568.
Ezeldin, A., & Aitcin, P. (1991). Effect of Coarse Aggregate on the Behavior of Normal and
High-Strength Concretes. Cement, Concrete and Aggregates, 13(2), 121-124. Grieb, W.E. & Werner, G. (1962). Comparison of Split Tensile Strength and Concrete with
Flexural and Compressive Strengths. Public Roads – A Journal of Highway Research, 32(5), 97-107.
Guide for Mechanistic-Empirical Design of New and Rehabilitated Pavement Structures. (2004)
Final Report. National Cooperative Highway Research Program, Transportation Research Board, National Research Council.

70
Hall, K. D., & James, M. (2008). PCC Materials Input Values for Mechanistic-Empirical Pavement Design Duide. Final report, TRC-0708, Arkansas State Highway and Transportation. University of Arkansas.
Hoerner, T. E., Zimmerman, K. A., Smith, K. D., & Cooley Jr., L. A. (2007). Mechanistic-
Empirical Pavement Design Guide Implementation Plan. Study SD2005-01. South Dakota Department of Transportation, Office of Research. Retrieved June 2010, from http://www.state.sd.us/Applications/HR19ResearchProjects/Projects%5Csd2005-01_Final_Report.pdf.
Hossain, A. B., Shrestha, S., & Summers, J. (2009). Properties of Concrete Incorporating
Ultrafine Fly Ash and Silica Fume. Transportation Research Record, 2113, 41-46. Huang, Y. H. (2004) Pavement Analysis and Design, 2nd Ed. New Jersey: Pearson Education,
Inc. Hsu, T. T. C. (1963) Mathematical Analysis of Shrinkage Stresses in a Model of Hardened
Concrete, ACI Journal, 60, 371-390. Jahangirnejad, S. (2009). Evaluation of Coefficient of Thermal Expansion Test Protocol and Its
Impact on Jointed Concrete Pavement Performance. ACI Materials Journal. 106(1), 64-71.
Jiang, Y. J., & Tayabji, S. D. (1998). Mechanistic Evaluation of Test Data from Long-Term
Pavement Performance Jointed Plain Concrete Pavement Test Sections. Transportation Research Record, 1629, 32-40.
Khanum, T. (2005). K-State Research Exchange: Kansas Rigid Pavement Analysis Following
New Mechanistic-Empirical Design Guide. Master’s Thesis, Kansas State University. Retrieved June 2010, from http://krex.k-state.edu/dspace/handle/2097/123.
Khazanovich, L., Yut, I., Husein, S., Turgeon, C., & Burnham, T. (2008). Adaptation of
Mechanistic-Empirical Pavement Design Guide for Design of Minnesota Low-Volume Portland Cement Concrete Pavements. Transportation Research Record, 2087, 12-19.
Kohler, E. & Kannekanti, V. (2008). Influence of the Coefficient of Thermal Expansion on the
Cracking of Jointed Concrete. Pavement Cracking: Mechanisms, Modeling, Detection, Testing and Case Histories, 69-77. Retrieved January 2010, from www.dynatest.cl/papers/kohler-25.pdf.
Ley, T., Kadam, S., Frazier, R., Robertson, B., & Riding, K. (2009). Development and
Implementation of a Mechanistic and Empirical Pavement Design Guide for Rigid Pavements. Planning and Research Division. Oklahoma Department of Transportation. Retrieved June 2010, from http://www.okladot.state.ok.us/hqdiv/p-r-div/spr-rip/library/reports/2208-ffy2009.pdf
71
Li, Q. , Deng, Z. , & Fu, H. (2004). Effect of Aggregate Type on Mechanical Behavior of Dam Concrete. ACI Materials Journal, 101(6).
Li, G., & Zhao, X. (2003). Properties of Concrete Incorporating Fly Ash and Ground Granulated
Blast-Furnace Slag. Cement & Concrete Composites, 25(3), 293-299. Mallela, J., Abbas, A., Harman, T., Rao, C., Liu, R., & Darter, M. I. (2005). Measurement and
Significance of the Coefficient of Thermal Expansion of Concrete in Rigid Pavement Design. Transportation Research Record, 1919, 38-46.
Mielenz, R. C. (1983) Mineral Admixtures – History and Background. Concrete International,
5(8), 34-42. Mills, J. , & Ioannides, A. (2007). Laboratory Study of Larger Sized Aggregate in Portland
Cement Concrete. International Journal of Pavement Engineering, 8(4), 253-263. Mukhopadhyay, A. (2007). Preliminary Characterization of Aggregate Coefficient of Thermal
Expansion and Gradation. FHWA/TX-05/0-1700-5. Texas Transportation Institute. Retrieved January 2010, from http://tti.tamu.edu/documents/0-1700-5.pdf.
Muñoz, J. F., Gullerud, K. J., Cramer, S. M., Tejedor, M. I. and Anderson, M. A.. Effects of
Coarse Aggregate Coatings on Concrete Performance. ASCE Journal of Materials in Civil Engineering, 22(1), 2010, 96-103.
Naik, T. R., Chun, Y., & Kraus, R. N. (2006). Investigation of Concrete Properties to Support
Implementation of the New AASHTO Pavement Design Guide. SPR No. 0092-06-03, Wisconsin Department of Transportation Technical Report. Retrieved April 2010 from http://wisdotresearch.wi.gov/whrp/concrete-rigid-pavements.
Neekhra, S. (2004). A New Mineralogical Approach to Predict the Coefficient of Thermal
Expansion of Aggregate and Concrete. Master's thesis, Texas A&M University. Retrieved June 2010 from http://hdl.handle.net /1969.1/1461.
LeBarca, I., Foley, R., & Cramer, S. (2007) Effects of Ground Granulated Blast Furnace Slag in
PCC – Expanded Study. SPR No. 0092-05-01, Wisconsin Department of Transportation Technical Report. Retrieved April 2011, from http://wisdotresearch.wi.gov/whrp/concrete-rigid-pavements.
Mielenz, R. C. (1983). Mineral Admixtures - History and Background. Concrete International,
5(8), 34-42. Oktar, O. N., Moral, H., & Tasdemir, M. A. (1996). Factors Determining the Correlations
Between Concrete Properties. Cement and Concrete Research, 26(11), 1629-1637.

72
Oluokun, F. A., Burdette, E. G., & Deatherage, J. H. (1991). Elastic Modulus, Poisson's Ratio, and Compressive Strength Relationships at Early Ages. ACI Materials Journal, 88(1), 3-10.
Oluokun, F. A. (1991). Prediction of Concrete Tensile Strength from its Compressive Strength: Evaluation of Existing Relations for Normal Weight Concrete. ACI Materials Journal, 88(3), 302-309.
Ozturan, T. , & Cecen, C. (1997). Effect of Coarse Aggregate Type on Mechanical Properties of Concretes with Different Strengths. Cement and Concrete Research, 27(2), 165-170.
Persson, B. (1999). Poisson's Ratio of High-Performance Concrete. Cement and Concrete
Composites, 29, 1647-1653. Ping, W. V. (2008). Engineering Properties of Florida Concrete Mixes for Implementing the
AASHTO Recommended Mechanistic Empirical Rigid Pavement Design Guide. Master's thesis, Florida State University. Retrieved January 2010, from http://etd.lib.fsu.edu/theses/available/etd-07212008-173629/unrestricted/KampmannRThesis1.pdf .
Perkins, D. (2001). Mineralogy, 2nd Edition. New Jersey: Prentice Hall. Popovics, S. (1998) Strength and Related Properties of Concrete: A Quantitative Approach.
New York City: John Wiley and Sons, Inc. Riding, K. (2009). Effects of Construction Time and Coarse Aggregate on Bridge Deck
Cracking. ACI Materials Journal, 106(5), 448-454. Retrieved January 2010, from http://hdl.handle.net/2097/4755.
Sakyi-Bekoe, K. O. (2008). Assessment of the Coefficient of Thermal Expansion of Alabama
Concrete. Master’s Thesis, Auburn University. Retrieved January 2010, from http://hdl.handle.net/10415/1435.
Salami, M., Spring, G., & Zhao, S. (1993). Coarse-Aggregate Effect on Mechanical Properties of
Plain Concrete. Transportation Research Record, 1382. Selezneva, O., Rao, C., Darter, M. I., Zollinger, D., & Khazanovich, L. (2004). Development of
a Mechanistic-Empirical Structural Design Procedure for Continuously Reinforced Concrete Pavements. Transportation Research Record, 1896, 46-56.
Sideris, K. K., Manita, P., & Sideris, K. (2004). Estimation of Ultimate Modulus of Elasticity
and Poisson's Ratio of Normal Concrete [Abstract]. Cement and Concrete Composites, 26, 631-632.
State of Wisconsin Department of Transportation. (2010) Standard Specifications for Highway
and Structure Construction. Online: http://www.dot.state.wi.us/library.

73
Stires, N. (2009). A Study of the Mechanistic-Empirical Pavement Design Guide for South
Carolina [Program documentation]. Columbia: University of South Carolina College of Enigineering and Computing.
Sutter, L., Peterson, K., & Anzalone, G. (2011) Reduction of Minimum Required Weight of
Cementitious Materials in WisDOT Concrete Mixes. SPR No. 0092-08-08, Wisconsin Department of Transportation Technical Report. Retrieved December 2011, from http://wisdotresearch.wi.gov/whrp/concrete-rigid-pavements.
Swamy, R. N. (1971). Aggregate–Matrix Interaction in Concrete Systems, Structure, Solid
Mechanics and Engineering Design, Proceedings of the Southampton 1969 Civil Engineering Materials Conference, Part 1, London: Wiley-Interscience , 301-316.
Swamy, R. N. (1980), Nature of the Strength of Concrete, Progress in Concrete Technology,
V.M. Malhotra Edition, Department of Energy Mines and Resources, Ottawa, Canada, MRP/MSL 80-89 (TR), 189-222.
Swenson, E. G., & Gillott, J. E. (1967). Alkali Reactivity of Dolomitic Limestone Aggregate.
Magazine of Concrete Research, 19(59), 95-104. Topçu, I. B., Bilir, T., & Boga, A. R. (2010). Estimation of the Modulus of Elasticity of Slag by
Using Composite Material Models. Construction and Building Materials, 24, 741-748. Tran, N. H., Hall, K. D., & James, M. (2008). Coefficient of Thermal Expansion of Concrete
Materials. Transportation Research Record, 2087, 51-56. Wang, H., & Li, Q. (2007). Prediction of Elastic Modulus and Poisson's Ratio for Unsaturated
Concrete. International Journal of Solids and Structures, 44, 1370-1379. Wang, K. C., Li, Q., Hall, K. D., Nguyen, V., Gong, W., & Huo, Z. (2008). Database Support for
the New Mechanistic-Empirical Pavement Design Guide. Transportation Research Record, 2087, 109-119.
Wen, S., & Xi-bing, L. (2000). Experimental Study on Young's Modulus of Concrete. Journal of
Central South University of Technology, 7, 43-45. Won, M. (2005). Improvements of Testing Procedures for Concrete Coefficient of Thermal
Expansion. Transportation Research Record, 1919, 23-28. Retrieved January 2010, from http://trb.metapress.com/content/555143q552872651/.
Yang, S. (2003). Experimental Measurement of Concrete Thermal Expansion. Journal of the
Eastern Asia Society for Transportation Studies, 5, 1035-1048. Retrieved January 2010, from http://www.easts.info/2003journal/papers/1035.pdf.

74
Yasar, E. , Erdogan, Y. , & Kiliç, A. (2004). Effect of Limestone Aggregate Type and Water-Cement Ratio on Concrete Strength. Materials Letters, 58(5), 772-777.
Yazdani, N., McKinnie, B., & Haroon, S. (2005). Aggregate-Based Modulus of Elasticity for
Florida Concrete. Transportation Research Record, 1914, 15-23. Yazdani, N., McKinnie, B., & Haroon, S. (2006). Modeling Compressive Strength Development
in Florida Concrete. Journal of Materials in Civil Engineering, 18(6), 868-870. Yeon, J., Choi, S., & Won, M. (2009). Effect of Relative Humidity and Coefficient of Thermal
Expansion of Hardened Cement Paste and Concrete. Transportation Research Record, 2113, 83-91

75
Appendix II Synthesis of Bibliography Fresh Concrete Properties Concept(s) Reference(s) Using slag cement as supplementary cementitious material results in increased workability.
ACI Committee 233R (2003)
Doses of air entrainment needed may differ from OPC depending on the type of slag cement.
ACI Committee 233R (2003)
Using fly ash as supplementary cementitious material in concrete results in increased slump and paste volume. Less water is needed for mixes with fly ash than mixes with OPC to achieve the same slump measurements.
ACI Committee 232R (2003) Al-Amoudi, et. al. (2010) Hossain, et. al. (2009)
Some Class C fly ashes can reduce the amount of air entraining admixture required
ACI Committee 232R (2003)
Compressive Strength
Concept(s) Reference(s)
Concrete made with crushed coarse aggregates has a higher compressive strength than concrete made with natural gravels. The order of compressive strength from highest to lowest of similar concrete based on coarse aggregate type is dolomite, then quartzite, then limestone, and then gravel.
Choubane et. al. (1996) Ezeldin and Aitcin (1991) Popovics (1998) Hall and James (2008) Mills and Ioannides (2007) Ozturan & Cecen (1997)
Using slag cement and fly ash as supplementary cementitious materials in concrete results in higher long-term compressive strength.
ACI Committee 233R (2003) ACI Committee 232R (2003) Al-Amoudi, et. al. (2010) Hossain, et. al. (2009) Labarca, et. al. (2007) Li and Zhao (2003) Mielenz (1983)
Using slag cement and fly ash as supplementary cementitious materials in concrete results in lower early strength due to a slower rate of hydration.
ACI Committee 233R (2003) Popovics (1998)
The chemical composition and physical characteristics of the cement will affect the strength of the concrete. High fineness cements result in higher strengths than normal fineness for the first 2 to 3 months of curing and then normal fineness cements become higher in strength.
ACI Committee 225 (1985)

76
Modulus of Elasticity and Dynamic Modulus Concept(s) Reference(s) Coarse aggregate type used has a significant effect on the modulus of elasticity of concrete. Concrete made with dense and angular limestone coarse aggregate have higher modulus of elasticity than concrete made with river gravel and porous limestone or sandstone.
Choubane, et. al. (1996) Hall and James (2008) Popovics (1998)
Coarse aggregate type used has no significant effect on concrete modulus of elasticity.
Mills and Ioannides (2007)
Difference in coarse aggregate size used for concrete has no significant effect on the modulus of elasticity of concrete.
Crouch, et. al. (2007)
Density and specific gravity of coarse aggregate significantly affect the modulus of concrete made with those coarse aggregates.
Yazdani, et. al. (2005)
Cement type used does not affect concrete modulus of elasticity. Yazdani, et. al. (2005)
The influence of using slag cement as supplementary cementitious material on concrete modulus of elasticity is small and is not associated with chemical composition.
ACI Committee 233R (2003)
The effect of using fly ash as supplementary cementitious material on modulus of elasticity is small and not as significant as cement and aggregate characteristics
ACI Committee 232R (2003)
Dynamic moduli are higher than static moduli Popovics (1998) Poisson Ratio Concept(s) Reference(s) The coarse aggregate type used has a significant effect on the concrete Poisson’s Ratio. Limestone was found to have the highest value, then gravel, then sandstone.
Hall and James (2008) Persson (1999)
Poisson’s Ratio of high-performance concrete is slightly smaller than Poisson’s Ratio of normal strength concrete. Persson (1999)
Relative humidity has no significant effect on concrete Poisson’s ratio. Persson (1999)
Concrete Poisson’s Ratio increases at an exponentially decaying rate up until the age of about one month, after which it doesn’t significantly change.
Allos and Martin (1981)

77
Tensile and Flexure Strength Concept(s) Reference(s) Modulus of rupture is higher for concrete made with crushed coarse aggregates than for concrete made with natural gravel aggregates. However, due to high modulus of rupture test variability, the significance of the effect of surface texture and angularity can be masked.
Mills and Ioannides (2007) Popovics (1998)
Higher tensile strengths were obtained with concrete made with crushed basalt and limestone coarse aggregates compared to concrete made with gravel aggregate, when using high strength concrete.
Ozturan and Cecen (1997)
Using slag cement as a supplementary cementitious material in concrete yields higher modulus of rupture and splitting tensile stresses.
ACI Committee 233R (2003)
Coefficient of Thermal Expansion (CTE) Concept(s) Reference(s)
Coarse aggregate type has a significant effect on concrete CTE. Highest to lowest concrete CTE based on coarse aggregate used was found to be gravels, then granite, and then dolomitic limestone. The CTE value of concrete made with river gravel is more variable than limestone.
Buch (2008) Chung (2009) Hall and James (2008) Jahangirnejad (2009) Mallela et. al. (2005) Sakyi-Bekoe (2008) Tran, et. al. (2008) Wang et. al. (2008) Won (2005) Yang (2003)
Age has a significant effect on concrete CTE. CTE was found to increase until leveling off after around 28 days of curing.
Buch (2008) Jahangirnejad (2009) Mallela et. al. (2005)
Age has no significant effect on concrete CTE. Chung (2009) The number of heating/cooling cycles has significant effect on concrete CTE.
Buch (2008) Jahangirnejad (2009)
The cement content has a significant effect on concrete CTE.
Hall and James (2008) Mallela et. al. (2005)
The water to cement (w/cm) ratio has a significant effect on concrete CTE.
Hall and James (2008) Mallela et. al. (2005)
Relative humidity has a significant effect on concrete CTE. Chung (2009) Hall and James (2008) Mallela et. al. (2005)
Relative humidity has no significant effect on concrete CTE. Yeon, et. al. (2009)
Higher CTE values result in larger amounts of cracking than pavement with lower CTE.
Kohler and Kannekanti (2008) Riding (2009)
Slag cement and fly ash have no significant affect CTE. Tran, et. al. (2008)
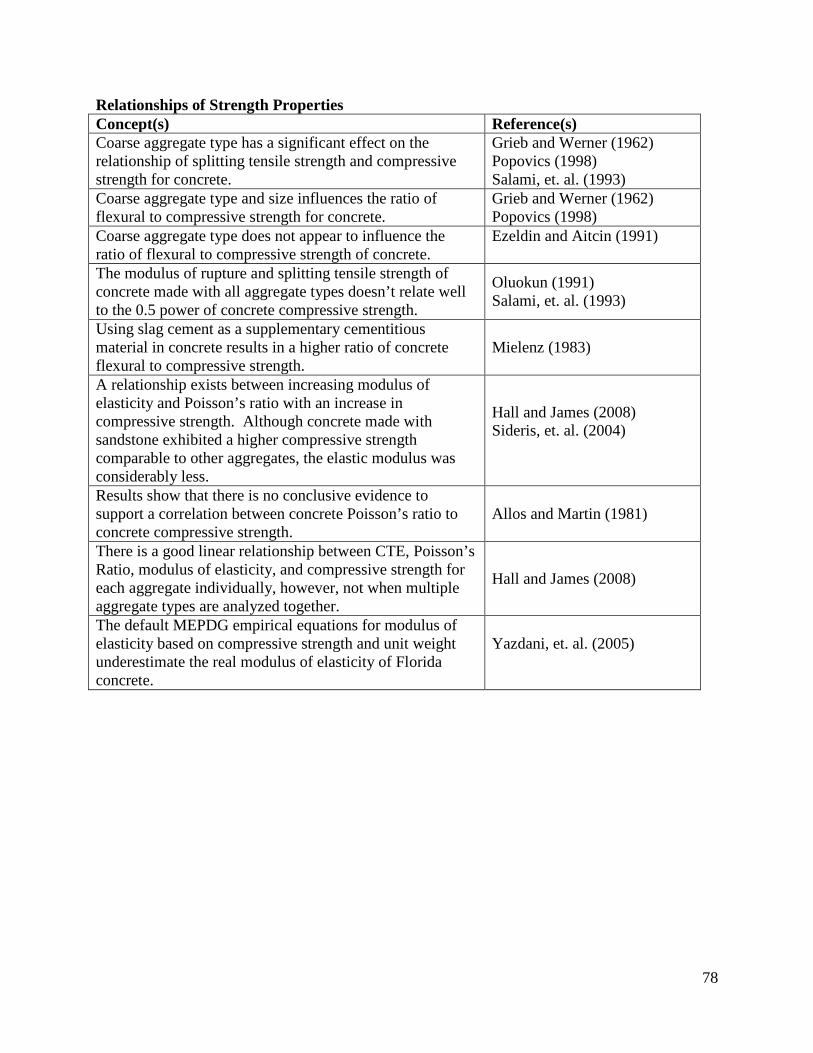
78
Relationships of Strength Properties Concept(s) Reference(s) Coarse aggregate type has a significant effect on the relationship of splitting tensile strength and compressive strength for concrete.
Grieb and Werner (1962) Popovics (1998) Salami, et. al. (1993)
Coarse aggregate type and size influences the ratio of flexural to compressive strength for concrete.
Grieb and Werner (1962) Popovics (1998)
Coarse aggregate type does not appear to influence the ratio of flexural to compressive strength of concrete.
Ezeldin and Aitcin (1991)
The modulus of rupture and splitting tensile strength of concrete made with all aggregate types doesn’t relate well to the 0.5 power of concrete compressive strength.
Oluokun (1991) Salami, et. al. (1993)
Using slag cement as a supplementary cementitious material in concrete results in a higher ratio of concrete flexural to compressive strength.
Mielenz (1983)
A relationship exists between increasing modulus of elasticity and Poisson’s ratio with an increase in compressive strength. Although concrete made with sandstone exhibited a higher compressive strength comparable to other aggregates, the elastic modulus was considerably less.
Hall and James (2008) Sideris, et. al. (2004)
Results show that there is no conclusive evidence to support a correlation between concrete Poisson’s ratio to concrete compressive strength.
Allos and Martin (1981)
There is a good linear relationship between CTE, Poisson’s Ratio, modulus of elasticity, and compressive strength for each aggregate individually, however, not when multiple aggregate types are analyzed together.
Hall and James (2008)
The default MEPDG empirical equations for modulus of elasticity based on compressive strength and unit weight underestimate the real modulus of elasticity of Florida concrete.
Yazdani, et. al. (2005)

79
Appendix III Particle Size Distribution for Cementitious Materials and Aggregate Microfines
0%
10%
20%
30%
40%
50%
60%
70%
80%
90%
100%
0.1 1 10 100 1000
Perc
ent P
assi
ng
Sieve Size (μm)
Cementitious Material
Cement 1
Fly Ash 1
Fly ash 2
Fly ash 3
Slag 1
Slag 2
0%
10%
20%
30%
40%
50%
60%
70%
80%
90%
100%
0.1 1 10 100 1000
Perc
ent P
assi
ng
Sieve Size (μm)
Glacial Gravel Microfines
GG1
GG2
GG3
GG4
GG5
GG6

80
0%
10%
20%
30%
40%
50%
60%
70%
80%
90%
100%
0.1 1 10 100 1000
Perc
ent P
assi
ng
Sieve Size (μm)
Crushed Stone Microfines
CS1
CS2
CS3
CS4
CS5
CS6
CS7
CS8
CS9
0%
10%
20%
30%
40%
50%
60%
70%
80%
90%
100%
0.1 1 10 100 1000
Perc
ent P
assi
ng
Sieve Size (μm)
Fine Aggregate Microfines
Sand A
Sand B

81
Appendix IV XRD Scans for Cementitious Materials
0
100
200
300
400
500
0 20 40 60 80 100
Inte
nsity
Angle 2 Theta
Cement 1
0
50
100
150
200
250
300
0 20 40 60 80 100
Inte
nsity
Angle 2 Theta
Cement 2
0
20
40
60
80
0 20 40 60 80 100
Inte
nsity
Angle 2 Theta
Slag 1
020406080
100120140
0 20 40 60 80 100
Inen
sity
Angle 2 Theta
Slag 2

82
0
100
200
300
400
500
600
0 20 40 60 80 100
Inte
nsity
Angle 2 Theta
Fly Ash 1
0
50
100
150
200
250
0 20 40 60 80 100
Inen
sity
Angle 2 Theta
Fly Ash 2
0
50
100
150
200
250
0 20 40 60 80 100
Inte
nsity
Angle 2 Theta
Fly Ash 3

83
Appendix V XRD of the Microfines The XRD results from the microfines were compared to know mineral XRD patterns as described in section 5.1.3.2. The comparison allowed the identification of the constituent minerals of each microfine source. The table listing each of the minerals which were identified in each source is shown as Table V.1. (This is the same as was reported in the document.)
Table V.1: Major minerals found for each microfine source using XRD. Map # Rock ID XRD - Major Minerals Found
Glacial Gravels: 1 GG1 Quartz 2 GG2 Dolomite, Quartz 3 GG3 Dolomite, Quartz and Plagioclase 4 GG4 Quartz 5 GG5 Dolomite, Quartz 6 GG6 Dolomite with some Quartz
Crushed Stone: 7 CS1 Dolomite, quartz 8 CS2 Quartz and Orthoclase 9 CS3 Dolomite 10 CS4 Dolomite with some Quartz 11 CS5 Dolomite, Quartz 12 CS6 Quartz, Clintonite, and Tremolite 13 CS7 Anorthite, Plagioclase, Feldspar, and Quartz 14 CS8 Dolomite 15 CS9 Quartz and Feldspar
The following tables list the major peaks of each microfine which were used to identify the mineral components. Table V.2 lists the peaks of the glacial gravel sources while Table V.3 lists the peaks of the crushed stone sources.

84
Table V.2: Major peaks for each glacial gravel microfine source for XRD scans. GG1 GG2 GG3 GG4 GG5 GG6 20.8 20.88 23.96 10.52 26.54 26.56 26.6 26.64 26.6 26.48 30.82 30.92 30.44 30.88 30.92 27.8 37.24 41.12 50.08 41.12 41.16 50.04 41.02 44.92 59.88 51 44.92 59.8 44.8 50.52
59.92 50.16
50.94 59.8
59.92
68.16
Table V.3: Major peaks for each crushed stone microfine source for XRD scans.
CS1 CS2 CS3 CS4 CS5 CS6 CS7 CS8 CS9 26.56 20.84 30.88 26.6 26.64 29.4 22.04 30.88 8.8 30.86 26.64 41.12 30.96 30.96 32.16 24.36 41.04 22.88 41.08 27.92 44.88 41.16 41.16 34.36 26.6 44.96 26.64 44.84 50.04 51 44.92 44.96 41.28 27.76 50.48 51.32 50.44 59.92
50.56 50.16 51.64 29.72
59.92
59.96 51.12 62.24 35.4
68.28
59.96
42.2
50.08

85
0100200300400500600700
0 20 40 60 80 100
Inte
nsity
Angle 2 Theta
GG2
0200400600800
100012001400
0 20 40 60 80 100
Inte
nsity
Angle 2 Theta
GG3
0
500
1000
1500
2000
2500
0 20 40 60 80 100
Inte
nsity
Angle 2 Theta
GG4
0100200300400500600700
0 20 40 60 80 100
Inte
nsity
Angle 2 Theta
GG5
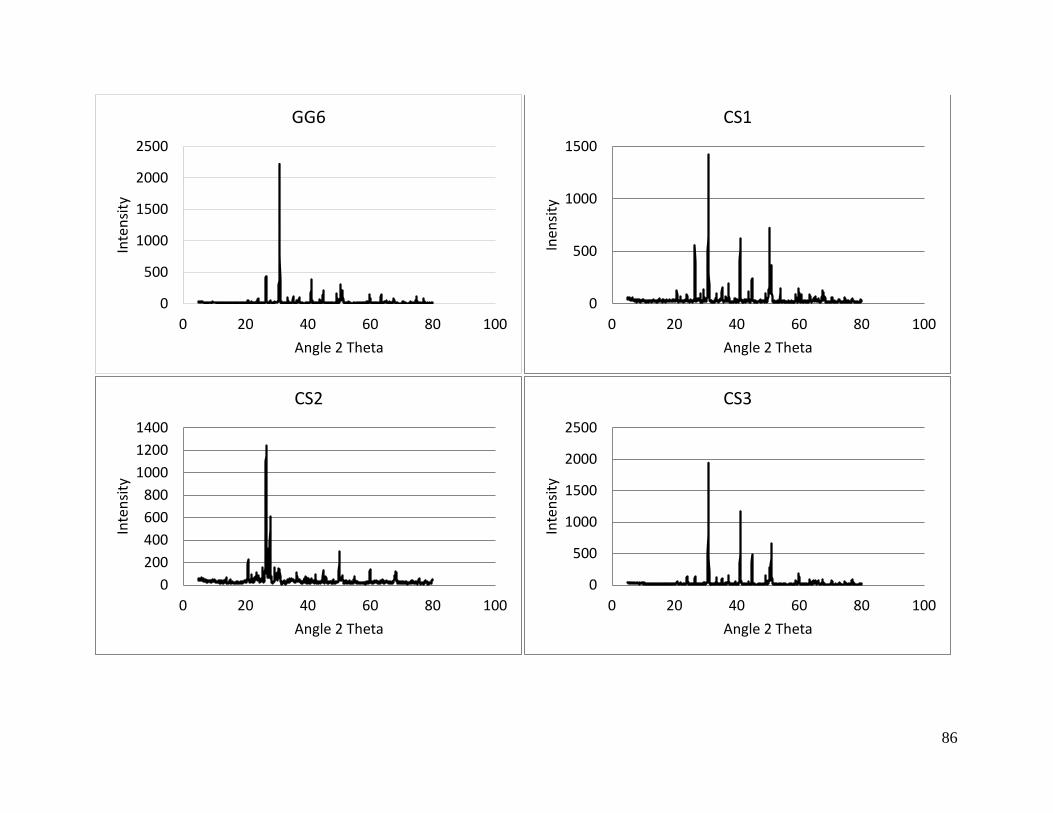
86
0
500
1000
1500
2000
2500
0 20 40 60 80 100
Inte
nsity
Angle 2 Theta
GG6
0
500
1000
1500
0 20 40 60 80 100
Inen
sity
Angle 2 Theta
CS1
0200400600800
100012001400
0 20 40 60 80 100
Inte
nsity
Angle 2 Theta
CS2
0
500
1000
1500
2000
2500
0 20 40 60 80 100
Inte
nsity
Angle 2 Theta
CS3

87
0
500
1000
1500
2000
0 20 40 60 80 100
Inte
nsity
Angle 2 Theta
CS4
0500
100015002000250030003500
0 20 40 60 80 100
Inte
nsity
Angle 2 Theta
CS5
0
100
200
300
400
500
0 20 40 60 80 100
Inte
nsity
Angle 2 Theta
CS6
0
100
200
300
400
500
600
0 20 40 60 80 100
Inte
nsity
Angle 2 Theta
CS7

88
0
500
1000
1500
2000
0 20 40 60 80 100
Inte
nsity
Angle 2 Theta
CS8
0
200
400
600
800
0 20 40 60 80 100
Inte
nsity
Angle 2 Theta
CS9

89
Appendix VI XRD Scans for Microfine Reactivity Analysis Source Transformed Mineral(s) CS1 quartz CS3 quartz CS4 dolomite and quartz CS5 dolomite and quartz CS8 dolomite GG5 quartz GG6 dolomite and quartz sand A dolomite and quartz
0
200
400
600
800
1000
1200
1400
1600
1800
2000
0 10 20 30 40 50 60 70 80 90
Inte
nsity
2Theta
CS1
Original
Reactivity

90
0
500
1000
1500
2000
2500
0 10 20 30 40 50 60 70 80 90
Inte
nsity
2 Theta Angle
CS3
Original
Reactivity
30.96
0
200
400
600
800
1000
1200
1400
1600
1800
0 10 20 30 40 50 60 70 80 90
Inte
nsity
2 Theta Angle
CS4
Original
Reactivity
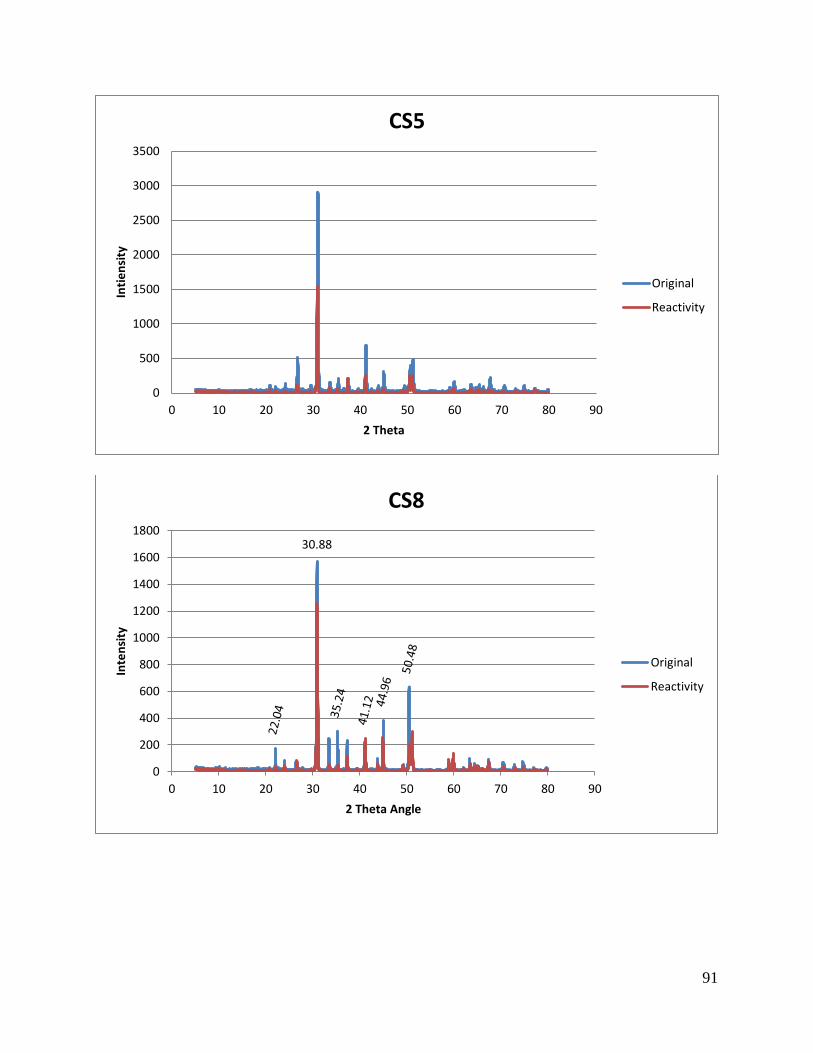
91
0
500
1000
1500
2000
2500
3000
3500
0 10 20 30 40 50 60 70 80 90
Intie
nsity
2 Theta
CS5
Original
Reactivity
30.88
0
200
400
600
800
1000
1200
1400
1600
1800
0 10 20 30 40 50 60 70 80 90
Inte
nsity
2 Theta Angle
CS8
Original
Reactivity

92
0
200
400
600
800
1000
1200
1400
1600
1800
0 10 20 30 40 50 60 70 80 90
Inte
nsity
2 Theta
GG5
Original
Reactivity
0
500
1000
1500
2000
2500
0 10 20 30 40 50 60 70 80 90
Inte
nsity
2 Theta
GG6
Original
Reactivity

93
Appendix VII Concrete Batch Quantities
Table VII.1: Material amounts for OPC mixes.
Mix Volume (ft3) Cement
(lbs) Fine Aggregate
(lbs) Coarse Aggregate
(lbs) Water (lbs)
Butter Mix 1 0.66 13.81 30.51 45.76 5.52 Batch1 2.5 52.31 115.56 173.33 20.93 Batch2 2.5 52.31 115.56 173.33 20.93 Total 5.66 118.44 261.62 392.43 47.38
Table VII.2: Material amounts for slag cement mixes.
Mix Volume
(ft3) Cement
(lbs)
Slag Cement
(lbs)
Fine Aggregate
(lbs)
Coarse Aggregate
(lbs) Water (lbs)
Butter Mix 1 0.66 9.66 4.16 30.31 45.17 5.52 Batch1 2.5 36.57 15.74 114.81 172.22 20.93 Batch2 2.5 36.57 15.74 114.81 172.22 20.93 Total 5.66 82.80 35.64 259.94 389.91 47.38
Table VII.3: Material amounts for fly ash mixes.
Mix Volume
(ft3) Cement
(lbs) Fly Ash
(lbs)
Fine Aggregate
(lbs)
Coarse Aggregate
(lbs) Water (lbs)
Butter Mix 1 0.66 9.66 4.16 30.12 45.17 5.52 Batch1 2.5 36.57 15.74 114.07 171.11 20.93 Batch2 2.5 36.57 15.74 114.07 171.11 20.93 Total 5.66 82.80 35.64 258.26 387.40 47.38

94
Appendix VIII Fresh Concrete Properties
Table VIIII.1: Fresh concrete properties – mix matrix 1.
Mix #
Batch ID
w/cm Ratio
Batch Size (ft3)
AEA (mL)
WRA (mL)
Slump (in)
Unit Weight (lb/ft3)
Fresh Air Content
(%) 1 A 0.4 2.5 12 50 2 1/4 145.8 6.0 1 B 0.4 2.5 12 50 2 1/4 145.7 5.7 1 C 0.4 1.5 8 30 1 3/4 144.6 6.5 2 A 0.4 2.5 11 65 2 3/4 143.9 6.2 2 B 0.4 2.5 10 65 3 145.2 6.0 3 A 0.4 2.5 12 60 1 1/4 148.2 4.3 3 B 0.4 2.5 13 70 2 1/2 144.8 6.2 4 A 0.4 2.5 11 60 2 3/4 146.7 5.7 4 B 0.4 2.5 11 55 2 146.7 4.7 4 C 0.4 2.5 11 55 2 147.0 5.3 5 A 0.4 2.5 9 120 1 1/2 145.1 5.1 5 B 0.4 2.5 7 70 1 1/4 144.7 5.7 6 A 0.4 2.5 12 60 2 1/2 148.2 5.3 6 B 0.4 2.5 12 55 1 3/4 150.7 4.4 6 C 0.4 2.5 11 60 2 1/2 147.0 6.1 7 A 0.4 2.5 10 60 3 146.7 5.6 7 B 0.4 2.5 10 60 3 146.2 5.6 8 A 0.4 2.5 18 85 2 1/4 144.0 5.8 8 B 0.4 2.5 18 85 1 3/4 144.0 6.0 9 A 0.4 2.5 15 85 1 1/4 143.3 5.5 9 B 0.4 2.5 10.5 100 1 3/4 144.1 5.0 9 C 0.4 2.5 10.5 90 1 3/4 142.2 4.9 10 A 0.4 2.5 18 85 1 3/4 147.4 4.3 10 B 0.4 2.5 20 85 2 146.4 5.6 10 C 0.4 2.5 19 90 1 1/4 146.8 5.5 11 A 0.4 2.5 14.5 85 2 1/4 144.7 5.4 11 B 0.4 2.5 14 85 2 1/4 144.7 5.4 12 A 0.4 2.5 29 85 1 145.2 5.7 12 B 0.4 2.5 29 85 1 1/4 144.3 6.5 12 C 0.4 1.5 16 55 1 1/4 144.7 5.6 13 A 0.4 2.5 12 125 2 3/4 152.2 5.2 13 B 0.4 2.5 13 125 2 1/2 151.2 5.5 14 A 0.4 2.5 11.5 85 2 1/2 146.6 6.3 14 B 0.4 2.5 10 85 1 3/4 149.4 4.7

95
Table VIII.1: Fresh concrete properties – mix matrix 1 (continued).
Mix #
Batch ID
w/cm Ratio
Batch Size (ft3)
AEA (mL)
WRA (mL)
Slump (in)
Unit Weight (lb/ft3)
Fresh Air Content
(%) 14 C 0.4 2.5 10 85 2 1/2 147.7 5.8 15 A 0.4 2.5 11 125 2 146.4 6.1 15 B 0.4 2.5 11 125 2 147.5 5.1 16 A 0.4 2.5 16 40 1 1/2 147.3 4.8 16 B 0.4 2.5 16.5 50 2 145.9 5.2 16 C 0.4 1.5 8 32 1 3/4 145.4 5.5 17 A 0.4 2.5 10.5 35 3 146.2 4.8 17 B 0.4 2.5 11 35 3 146.3 4.6 18 A 0.4 2.5 13.5 40 3 143.9 6.1 18 B 0.4 2.5 13 37 3 145.2 5.6 19 A 0.4 2.5 12.5 53 2 3/4 146.9 5.4 19 B 0.4 2.5 12.5 50 2 1/2 147.2 5.3 19 C 0.4 2.5 12 50 2 148.1 4.5 20 A 0.4 2.5 21 85 1 1/4 144.2 5.3 20 B 0.4 2.5 20.5 85 2 143.3 5.6 21 A 0.4 2.5 14 50 3 147.7 5.4 21 B 0.4 2.5 14 45 2 149.5 4.5 21 C 0.4 2.5 14 47 3 147.8 5.4 22 A 0.4 2.5 11.5 30 2 1/2 148.4 4.4 22 B 0.4 2.5 14 30 2 1/2 146.9 5.1 23 A 0.4 2.5 18.5 85 1 1/2 145.8 4.8 23 B 0.4 2.5 21 85 1 1/4 145.2 4.9 24 A 0.4 2.5 12 80 2 1/2 143.8 5.0 24 B 0.4 2.5 11.5 80 2 1/2 143.9 4.6 24 C 0.4 1.5 7 45 2 145.0 4.6 25 A 0.4 2.5 22.5 85 2 145.1 5.8 25 B 0.4 2.5 22.5 85 1 1/2 144.1 5.8 26 A 0.4 2.5 15.5 80 1 3/4 145.8 4.4 26 B 0.4 2.5 15.5 80 1 1/2 146.1 4.1 28 A 0.4 2.5 17 120 2 1/4 149.6 5.7 28 B 0.4 2.5 17 122 2 1/4 150.6 5.5 27 A 0.4 2.5 31 85 1 1/2 145.2 5.6 27 B 0.4 2.5 31 85 1 1/2 145.4 5.2 29 A 0.4 2.5 12 80 2 3/4 148.2 5.0 29 B 0.4 2.5 12.5 75 3 146.2 6.3 30 A 0.4 2.5 17 125 2 1/4 147.0 6.2 30 B 0.4 2.5 17 125 2 148.2 5.0

96
Table VIII.1: Fresh concrete properties – mix matrix 1 (continued).
Mix #
Batch ID
w/cm Ratio
Batch Size (ft3)
AEA (mL)
WRA (mL)
Slump (in)
Unit Weight (lb/ft3)
Fresh Air Content
(%) 31 A 0.38 2.5 16 0 2 3/4 147.8 4.5 31 B 0.38 2.5 18.5 0 3 145.5 5.5 31 C 0.38 1.5 9 0 2 146.6 5.2 32 A 0.37 2.5 16.5 0 2 3/4 148.0 4.2 32 B 0.37 2.5 18.5 0 3 146.1 5.2 32 C 0.37 2.5 14 0 2 1/2 145.2 6.1 33 A 0.37 2.5 15.5 0 3 147.2 4.8 33 B 0.37 2.5 16 0 3 146.7 5.0 34 A 0.38 2.5 16 0 3 146.7 5.3 34 B 0.39 2.5 16.5 0 3 148.4 4.5 35 A 0.4 2.5 16 25 3 143.6 5.6 35 B 0.4 2.5 16 25 2 1/2 145.0 4.8 36 A 0.36 2.5 17.5 0 2 3/4 150.2 4.8 36 B 0.36 2.5 18.5 0 2 3/4 150.2 4.6 36 C 0.36 2.5 16 0 3 147.8 6.4 37 A 0.38 2.5 18 0 3 146.6 5.2 37 B 0.38 2.5 18.5 0 3 147.4 4.6 38 A 0.4 2.5 19 10 3 144.6 5.1 38 B 0.4 2.5 20 10 2 1/2 144.7 5.1 39 A 0.39 2.5 16 0 2 1/4 145.1 4.1 39 B 0.39 2.5 18 0 2 1/4 142.1 5.0 40 A 0.4 2.5 17.5 45 2 146.6 4.9 40 B 0.4 2.5 18 45 2 3/4 147.5 4.3 41 A 0.4 2.5 13.5 50 2 146.9 3.4 41 B 0.4 2.5 14 50 2 3/4 146.2 3.7 42 A 0.4 2.5 16 30 2 145.1 4.7 42 B 0.4 2.5 16.5 35 2 146.7 4.6 43 A 0.4 2.5 12 85 3 149.7 5.3 43 B 0.4 2.5 13.5 65 3 151.2 5.1 43 C 0.4 1.5 9 40 3 148.5 6.5 44 A 0.39 2.5 15 0 3 148.6 4.5 44 B 0.38 2.5 15 0 2 1/4 147.0 5.8 45 A 0.4 2.5 12 85 1 3/4 148.2 5.1 45 B 0.4 2.5 11 80 3 146.6 5.3

97
Table VIII.2: Fresh concrete properties – mix matrix 2.
Mix #
Batch ID
w/cm Ratio
Batch Size (ft3)
AEA (mL)
WRA (mL)
Slump (in)
Unit Weight (lb/ft3)
Fresh Air Content
(%) 46 A 0.4 2.5 10 30 2 3/4 145.0 6.1 46 B 0.4 2.5 12 33 2 146.1 5.5 47 A 0.4 2.5 8 32 2 1/2 147.1 4.7 47 B 0.4 2.5 9 32 3 145.2 5.4 48 A 0.4 2.5 12 22 2 1/4 146.6 5.9 48 B 0.4 2.5 12 22 2 149.0 4.4 49 A 0.4 2.5 16 85 1 1/2 142.8 6.1 49 B 0.4 2.5 16 85 2 143.0 5.8 50 A 0.4 2.5 9.5 65 1 1/4 142.8 4.3 50 B 0.4 2.5 8.5 70 1 3/4 142.3 4.5 51 A 0.4 2.5 12 25 2 1/2 145.6 5.7 51 B 0.4 2.5 12 25 2 146.7 5.0 52 A 0.4 2.5 9 20 2 1/2 146.2 4.5 52 B 0.4 2.5 10 20 3 145.4 5.2 53 A 0.4 2.5 11 25 2 1/2 147.4 4.9 53 B 0.4 2.5 12 25 2 1/4 147.4 5.0 54 A 0.4 2.5 16 80 1 3/4 143.8 6.0 54 B 0.4 2.5 15 83 1 1/2 143.6 5.9 55 A 0.4 2.5 8 70 2 143.0 4.6 55 B 0.4 2.5 8 70 2 142.5 4.8 56 A 0.37 2.5 12 0 3 147.2 5.2 56 B 0.37 2.5 16 0 3 145.0 6.3 57 A 0.37 2.5 12.5 0 3 145.0 5.9 57 B 0.38 2.5 12.5 0 3 147.0 5.0 58 A 0.37 2.5 11.5 0 3 147.9 5.0 58 B 0.37 2.5 12 0 3 148.2 4.7 59 A 0.39 2.5 18 0 2 3/4 143.5 6.0 59 B 0.39 2.5 18 0 2 1/2 143.2 6.0 60 A 0.39 2.5 13 0 3 141.5 5.5 60 B 0.39 2.5 12 0 2 144.7 3.7 61 A 0.38 2.5 19 0 3 145.4 6.1 61 B 0.38 2.5 15 0 3 142.6 6.0 62 A 0.37 2.5 16 0 3 144.5 5.9 62 B 0.38 2.5 16 0 3 146.0 4.7 63 A 0.38 2.5 16 0 2 147.1 5.0 63 B 0.38 2.5 18 0 2 1/4 147.4 4.9

98
Table VIII.2: Fresh concrete properties – mix matrix 2 (continued).
Mix #
Batch ID
w/cm Ratio
Batch Size (ft3)
AEA (mL)
WRA (mL)
Slump (in)
Unit Weight (lb/ft3)
Fresh Air Content
(%) 64 A 0.4 2.5 22 0 1 3/4 143.6 5.4 64 B 0.4 2.5 25 0 2 1/2 142.4 6.4 65 A 0.39 2.5 15 0 2 3/4 141.4 5.2 65 B 0.39 2.5 14 0 2 1/2 141.5 4.6 66 A 0.37 2.5 18 0 3 145.8 5.6 66 B 0.37 2.5 18.5 0 2 3/4 146.6 5.2 67 A 0.37 2.5 15 0 3 148.4 4.2 67 B 0.37 2.5 17.5 0 2 1/2 147.8 4.6 67 C 0.37 1.5 9 0 3 147.7 4.5 68 A 0.37 2.5 20 0 2 1/4 147.4 6.2 68 B 0.37 2.5 19.5 0 2 1/4 148.5 4.8 69 A 0.39 2.5 22 0 2 145.1 4.9 69 B 0.39 2.5 22 0 2 1/2 143.9 5.6 70 A 0.39 2.5 17 0 3 141.2 5.5 70 B 0.39 2.5 14 0 2 1/2 143.9 3.7

99
Table VIII.3: Fresh concrete properties – mix matrix 3.
Mix #
Batch ID
w/cm Ratio
Batch Size (ft3)
AEA (mL)
WRA (mL)
Slump (in)
Unit Weight (lb/ft3)
Fresh Air Content
(%) 71 A 0.4 2.5 16 40 2 1/4 145.7 5.8 71 B 0.4 2.5 16 40 2 1/2 145.6 5.5 72 A 0.4 2.5 16 35 2 3/4 144.7 5.7 72 B 0.4 2.5 16 35 2 1/2 144.5 6.2 73 A 0.4 2.5 16 30 2 1/2 147.6 4.6 73 B 0.4 2.5 16 35 2 1/2 147.3 5.0 73 C 0.4 1.5 12 50 2 1/4 145.8 6.0 74 A 0.4 2.5 22 85 1 1/2 145.8 5.0 74 B 0.4 2.5 24 85 2 148.3 5.2 75 A 0.4 2.5 12 80 2 142.5 4.8 75 B 0.4 2.5 11 80 2 1/2 141.8 4.7 76 A 0.38 2.5 23 0 3 144.7 6.3 76 B 0.38 2.5 22.5 0 3 146.3 5.3 77 A 0.37 2.5 20.5 0 2 3/4 147.4 4.2 77 B 0.38 2.5 23 0 3 145.2 5.6 78 A 0.38 2.5 23 0 3 147.6 4.8 78 B 0.38 2.5 25 0 2 1/2 147.4 4.9 79 A 0.4 2.5 26.5 10 2 1/2 144.6 4.8 79 B 0.4 2.5 30 10 3 143.0 6.0 80 A 0.39 2.5 18 0 2 145.8 3.6 80 B 0.39 2.5 21 0 2 1/2 144.5 4.3 81 A 0.38 2.5 23 0 2 3/4 146.5 5.3 81 B 0.38 2.5 23.5 0 2 1/2 146.9 4.9 82 A 0.38 2.5 21 0 2 3/4 146.6 4.6 82 B 0.38 2.5 22.5 0 3 146.6 4.7 83 A 0.38 2.5 22.5 0 3 147.1 5.2 83 B 0.38 2.5 24 0 2 3/4 147.9 4.7 83 C 0.38 1.5 14 0 3 146.4 5.5 84 A 0.4 2.5 30 10 2 1/2 141.5 6.6 84 B 0.4 2.5 27 10 2 3/4 143.5 5.9 85 A 0.39 2.5 21 0 2 1/4 144.7 4.2 85 B 0.39 2.5 23 0 2 3/4 144.2 4.5
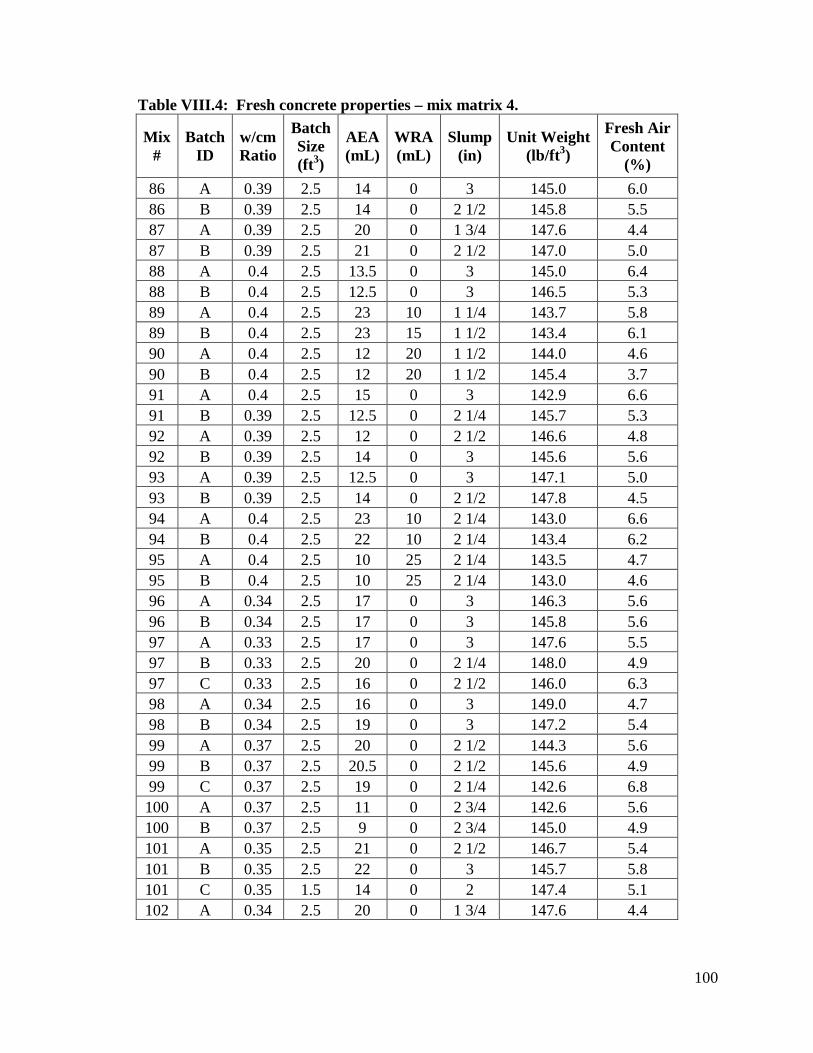
100
Table VIII.4: Fresh concrete properties – mix matrix 4.
Mix #
Batch ID
w/cm Ratio
Batch Size (ft3)
AEA (mL)
WRA (mL)
Slump (in)
Unit Weight (lb/ft3)
Fresh Air Content
(%) 86 A 0.39 2.5 14 0 3 145.0 6.0 86 B 0.39 2.5 14 0 2 1/2 145.8 5.5 87 A 0.39 2.5 20 0 1 3/4 147.6 4.4 87 B 0.39 2.5 21 0 2 1/2 147.0 5.0 88 A 0.4 2.5 13.5 0 3 145.0 6.4 88 B 0.4 2.5 12.5 0 3 146.5 5.3 89 A 0.4 2.5 23 10 1 1/4 143.7 5.8 89 B 0.4 2.5 23 15 1 1/2 143.4 6.1 90 A 0.4 2.5 12 20 1 1/2 144.0 4.6 90 B 0.4 2.5 12 20 1 1/2 145.4 3.7 91 A 0.4 2.5 15 0 3 142.9 6.6 91 B 0.39 2.5 12.5 0 2 1/4 145.7 5.3 92 A 0.39 2.5 12 0 2 1/2 146.6 4.8 92 B 0.39 2.5 14 0 3 145.6 5.6 93 A 0.39 2.5 12.5 0 3 147.1 5.0 93 B 0.39 2.5 14 0 2 1/2 147.8 4.5 94 A 0.4 2.5 23 10 2 1/4 143.0 6.6 94 B 0.4 2.5 22 10 2 1/4 143.4 6.2 95 A 0.4 2.5 10 25 2 1/4 143.5 4.7 95 B 0.4 2.5 10 25 2 1/4 143.0 4.6 96 A 0.34 2.5 17 0 3 146.3 5.6 96 B 0.34 2.5 17 0 3 145.8 5.6 97 A 0.33 2.5 17 0 3 147.6 5.5 97 B 0.33 2.5 20 0 2 1/4 148.0 4.9 97 C 0.33 2.5 16 0 2 1/2 146.0 6.3 98 A 0.34 2.5 16 0 3 149.0 4.7 98 B 0.34 2.5 19 0 3 147.2 5.4 99 A 0.37 2.5 20 0 2 1/2 144.3 5.6 99 B 0.37 2.5 20.5 0 2 1/2 145.6 4.9 99 C 0.37 2.5 19 0 2 1/4 142.6 6.8 100 A 0.37 2.5 11 0 2 3/4 142.6 5.6 100 B 0.37 2.5 9 0 2 3/4 145.0 4.9 101 A 0.35 2.5 21 0 2 1/2 146.7 5.4 101 B 0.35 2.5 22 0 3 145.7 5.8 101 C 0.35 1.5 14 0 2 147.4 5.1 102 A 0.34 2.5 20 0 1 3/4 147.6 4.4

101
Table VIII.4: Fresh concrete properties – mix matrix 4 (continued).
Mix #
Batch ID
w/cm Ratio
Batch Size (ft3)
AEA (mL)
WRA (mL)
Slump (in)
Unit Weight (lb/ft3)
Fresh Air Content
(%) 102 B 0.35 2.5 21 0 2 1/2 147.0 5.0 103 A 0.34 2.5 19.5 0 1 3/4 149.8 4.5 103 B 0.35 2.5 21.5 0 2 149.7 4.5 104 A 0.38 2.5 24 0 2 1/2 144.1 5.8 104 B 0.38 2.5 24 0 2 144.2 5.7 105 A 0.37 2.5 21 0 1 1/2 144.1 4.7 105 B 0.37 2.5 22 0 2 142.4 5.3 106 A 0.34 2.5 23 0 3 145.6 5.6 106 B 0.34 2.5 23 0 3 144.6 6.4 106 C 0.34 2.5 22 0 1 3/4 147.0 5.6 107 A 0.35 2.5 21 0 3 145.4 5.9 107 B 0.35 2.5 21 0 3 145.8 6.0 108 A 0.34 2.5 20 0 2 1/4 149.8 4.5 108 B 0.34 2.5 24 0 2 1/2 148.2 5.2 109 A 0.38 2.5 25 0 3 144.0 5.8 109 B 0.38 2.5 25 0 3 143.4 6.0 110 A 0.37 2.5 21 0 2 1/2 144.6 5.4 110 B 0.37 2.5 21 0 2 1/4 144.6 4.8

102
Appendix IX Air Content Analysis In total, six additional mixes were evaluated based on mix matrix 1 using coarse aggregate CS3, which was chosen because of its unusually high aggregate correction factor causing the most cases of lower than originally thought air content. For each mix proportion in matrix 1, mix numbers 9, 24, and 39, one mix was prepared with a target air content of 2% and the other was prepared with a target air content of 7%. A relationship between air content and each mechanical property found in this project combining the two extra mixes with the original results from matrix 1. Figures IX.1 to IX.3, IX.4 to IX.6, IX.7 to IX.9, and IX.10 to IX.12 provide the air content relationships found for compressive strength, modulus of rupture, modulus of elasticity, and splitting tensile strength, respectively, for mixes 9, 24, and 39. Each data point was the average four individual test results for compressive and splitting tensile strength, and the average of three test results for modulus of rupture, modulus of elasticity, and dynamic modulus. A full example of the data analysis identical to Appendix XII (Data Analysis Example) was conducted adjusting for air content using the estimates of the relationships below and is provided in Appendix XIII. The difference between these figures and the figures presented in the report is negligible, and the conclusions presented in the Section 6 would be unchanged. After applying general forms of the relationships presented below to convert each data point as if the concrete contained 6% air, the average compressive strength of all mixes was reduced by about 380 psi (7.5% if 5000 psi concrete), average modulus of rupture was reduced by about 21 psi (3% if 700 psi concrete), average modulus of elasticity was reduced by about 100 ksi (2.5% if 4000 ksi concrete), and average modulus of elasticity was reduced by about 15 psi (3.5% if 450 psi concrete).
Figure IX.1: Effect of air content on compressive strength of mix 9.
y = -536.11x + 8855.9 R² = 0.7057
0
1000
2000
3000
4000
5000
6000
7000
8000
9000
0.0 2.0 4.0 6.0 8.0
f'c (p
si)
Air Content (%)
Compressive Strength Mix 9
7day
14day
28day
90day
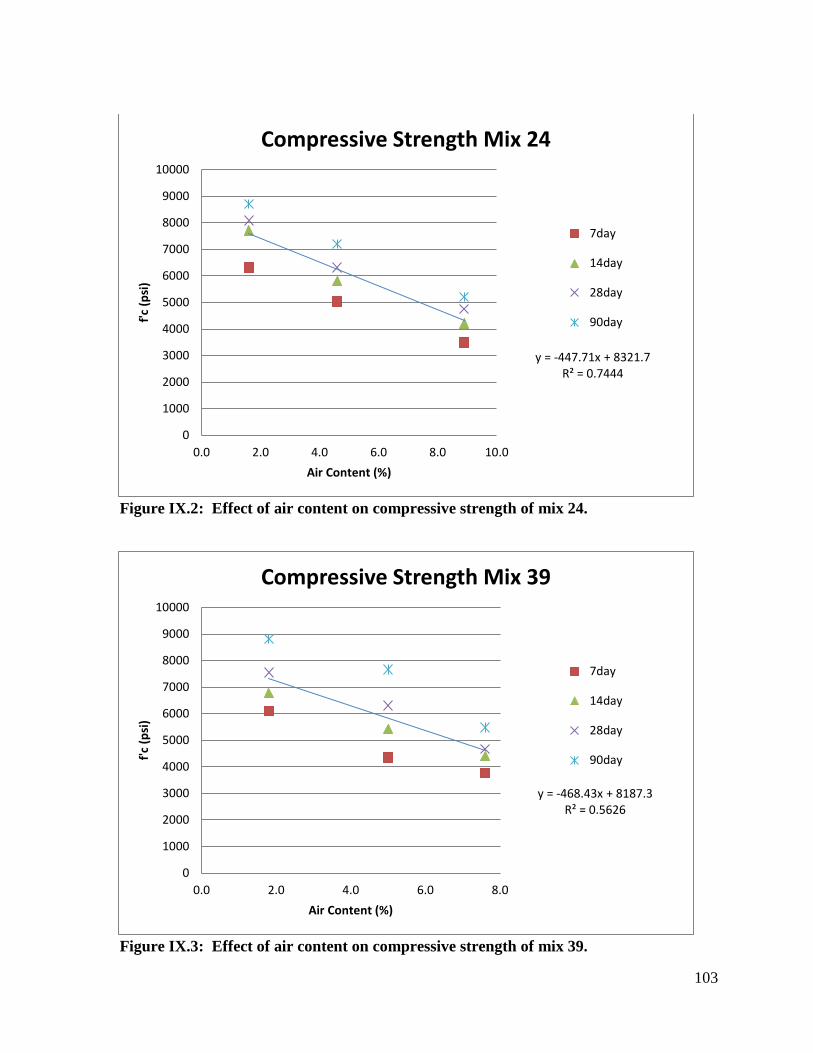
103
Figure IX.2: Effect of air content on compressive strength of mix 24.
Figure IX.3: Effect of air content on compressive strength of mix 39.
y = -447.71x + 8321.7 R² = 0.7444
0
1000
2000
3000
4000
5000
6000
7000
8000
9000
10000
0.0 2.0 4.0 6.0 8.0 10.0
f'c (p
si)
Air Content (%)
Compressive Strength Mix 24
7day
14day
28day
90day
y = -468.43x + 8187.3 R² = 0.5626
0
1000
2000
3000
4000
5000
6000
7000
8000
9000
10000
0.0 2.0 4.0 6.0 8.0
f'c (p
si)
Air Content (%)
Compressive Strength Mix 39
7day
14day
28day
90day
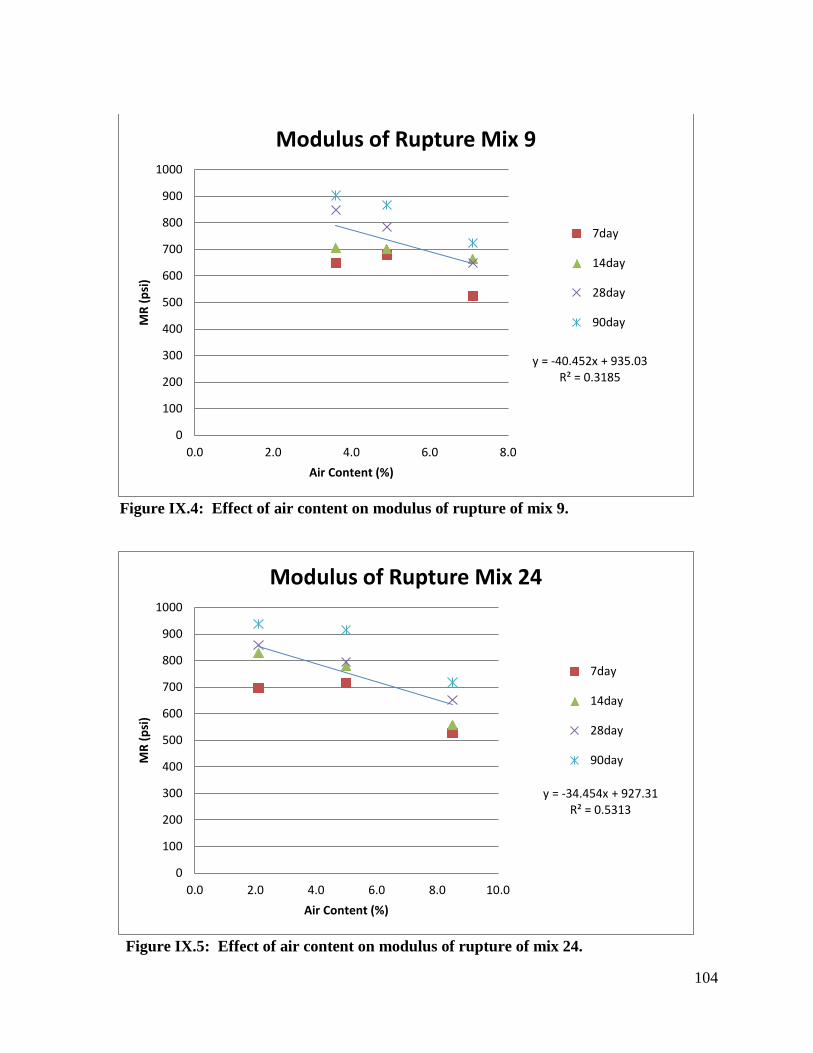
104
Figure IX.4: Effect of air content on modulus of rupture of mix 9.
Figure IX.5: Effect of air content on modulus of rupture of mix 24.
y = -40.452x + 935.03 R² = 0.3185
0
100
200
300
400
500
600
700
800
900
1000
0.0 2.0 4.0 6.0 8.0
MR
(psi
)
Air Content (%)
Modulus of Rupture Mix 9
7day
14day
28day
90day
y = -34.454x + 927.31 R² = 0.5313
0
100
200
300
400
500
600
700
800
900
1000
0.0 2.0 4.0 6.0 8.0 10.0
MR
(psi
)
Air Content (%)
Modulus of Rupture Mix 24
7day
14day
28day
90day

105
Figure IX.6: Effect of air content on modulus of rupture of mix 39.
Figure IX.7: Effect of air content on modulus of elasticity of mix 9.
y = -23.594x + 858.96 R² = 0.2166
0
200
400
600
800
1000
1200
0.0 2.0 4.0 6.0 8.0
MR
(psi
)
Air Content (%)
Modulus of Rupture Mix 39
7day
14day
28day
90day
y = -144132x + 4E+06 R² = 0.319
0
500000
1000000
1500000
2000000
2500000
3000000
3500000
4000000
4500000
5000000
0.0 2.0 4.0 6.0 8.0
E (p
si)
Air Content (%)
Modulus of Elasticity Mix 9
7day
14day
28day
90day

106
Figure IX.8: Effect of air content on modulus of elasticity of mix 24.
Figure IX.9: Effect of air content on modulus of elasticity of mix 39.
y = -122344x + 4E+06 R² = 0.4008
0
500000
1000000
1500000
2000000
2500000
3000000
3500000
4000000
4500000
5000000
0.0 2.0 4.0 6.0 8.0 10.0
E (p
si)
Air Content (%)
Modulus of Elasticity Mix 24
7day
14day
28day
90day
y = -115041x + 4E+06 R² = 0.1972
0
1000000
2000000
3000000
4000000
5000000
6000000
0.0 2.0 4.0 6.0 8.0
E (p
si)
Air Content (%)
Modulus of Elasticity Mix 39
7day
14day
28day
90day
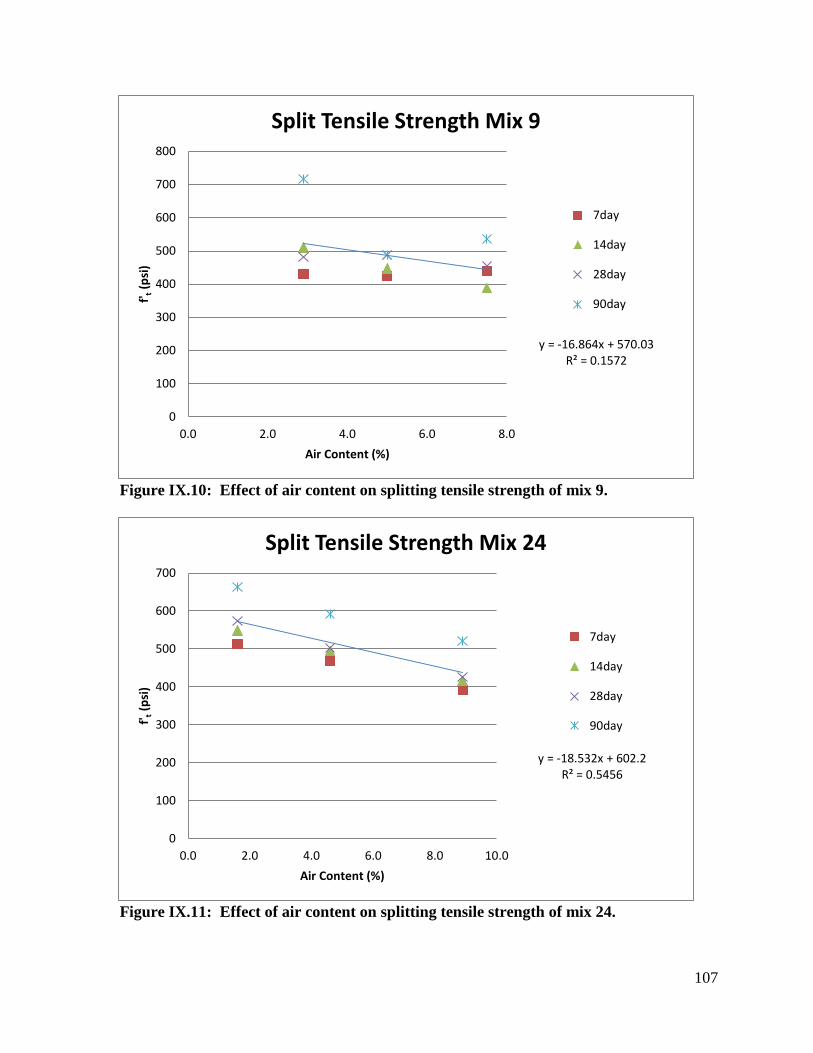
107
Figure IX.10: Effect of air content on splitting tensile strength of mix 9.
Figure IX.11: Effect of air content on splitting tensile strength of mix 24.
y = -16.864x + 570.03 R² = 0.1572
0
100
200
300
400
500
600
700
800
0.0 2.0 4.0 6.0 8.0
f' t (p
si)
Air Content (%)
Split Tensile Strength Mix 9
7day
14day
28day
90day
y = -18.532x + 602.2 R² = 0.5456
0
100
200
300
400
500
600
700
0.0 2.0 4.0 6.0 8.0 10.0
f' t (p
si)
Air Content (%)
Split Tensile Strength Mix 24
7day
14day
28day
90day

108
Figure IX.12: Effect of air content on splitting tensile strength of mix 39.
Figure IX.13: Effect of air content on dynamic modulus of mix 9.
y = -23.053x + 622.19 R² = 0.4111
0
100
200
300
400
500
600
700
800
0.0 2.0 4.0 6.0 8.0
f' t (p
si)
Air Content (%)
Split Tensile Strength Mix 39
7day
14day
28day
90day
y = -165683x + 6E+06 R² = 0.3429
0
1000000
2000000
3000000
4000000
5000000
6000000
7000000
0.0 2.0 4.0 6.0 8.0
E d (p
si)
Air Content (%)
Dynamic Modulus Mix 9
7day
14day
28day
90day

109
Figure IX.14: Effect of air content on dynamic modulus of mix 24.
Figure IX.15: Effect of air content on dynamic modulus of mix 39.
y = -172736x + 6E+06 R² = 0.5494
0
1000000
2000000
3000000
4000000
5000000
6000000
7000000
0.0 2.0 4.0 6.0 8.0 10.0
E d (p
si)
Air Content (%)
Dynamic Modulus Mix 24
7day
14day
28day
90day
y = -162360x + 6E+06 R² = 0.3315
0
1000000
2000000
3000000
4000000
5000000
6000000
7000000
0.0 2.0 4.0 6.0 8.0
E d (p
si)
Air Content (%)
Dynamic Modulus Mix 39
7day
14day
28day
90day

110
The differences in the relationships of compressive strength to modulus of rupture, compressive strength to modulus of elasticity, and compressive strength to splitting tensile strength because of air content were also found to be negligible. Therefore, the air content appears to only affect the individual strengths and not the relationships or strength gain of the particular properties. Figures IX.16 to IX.18, IX.19 to IX.21, and IX.22 to IX.24 present the relationships of compressive strength (f’c) to modulus of rupture (MR), modulus of elasticity (E), and splitting tensile strength (fst), respectively, for mixes 9, 24, and 39. The relationships appear to shift along the same trend as the air content changes, keeping the same general relationship. In each figure, the data points are arranged by mix number. For example, the label “9hi” refers to mix 9 with a high air content, “9” refers to the actual mix 9 used for data analysis, and “9lo” refers to mix 9 with a low air content.
Figure IX.16: Effect of air content on MR versus f’c relationship for mix 9.
y = 0.07x + 297.26 R² = 0.6587
0
100
200
300
400
500
600
700
800
900
1000
0 2000 4000 6000 8000 10000
Mod
ulus
of R
uptu
re (p
si)
Compressive Strength (psi)
MR vs. fc'
9hi
9
9lo
Linear (Mix9 All Data)

111
Figure IX.17: Effect of air content on MR versus f’c relationship for mix 24.
Figure IX.18: Effect of air content on MR versus f’c relationship for mix 39.
y = 0.0739x + 299.64 R² = 0.863 0
100
200
300
400
500
600
700
800
900
1000
0 2000 4000 6000 8000 10000
Mod
ulus
of R
uptu
re (p
si)
Compressive Strength (f'c)
MR vs. fc'
24hi
24
24lo
Linear (Mix24 All Data)
y = 0.0636x + 377.51 R² = 0.7885
0
200
400
600
800
1000
1200
0 2000 4000 6000 8000 10000
Mod
ulus
of R
uptu
re (p
si)
Compressive Strength (psi)
MR vs. fc'
39hi
39
39lo
Linear (Mix 39 All Data)
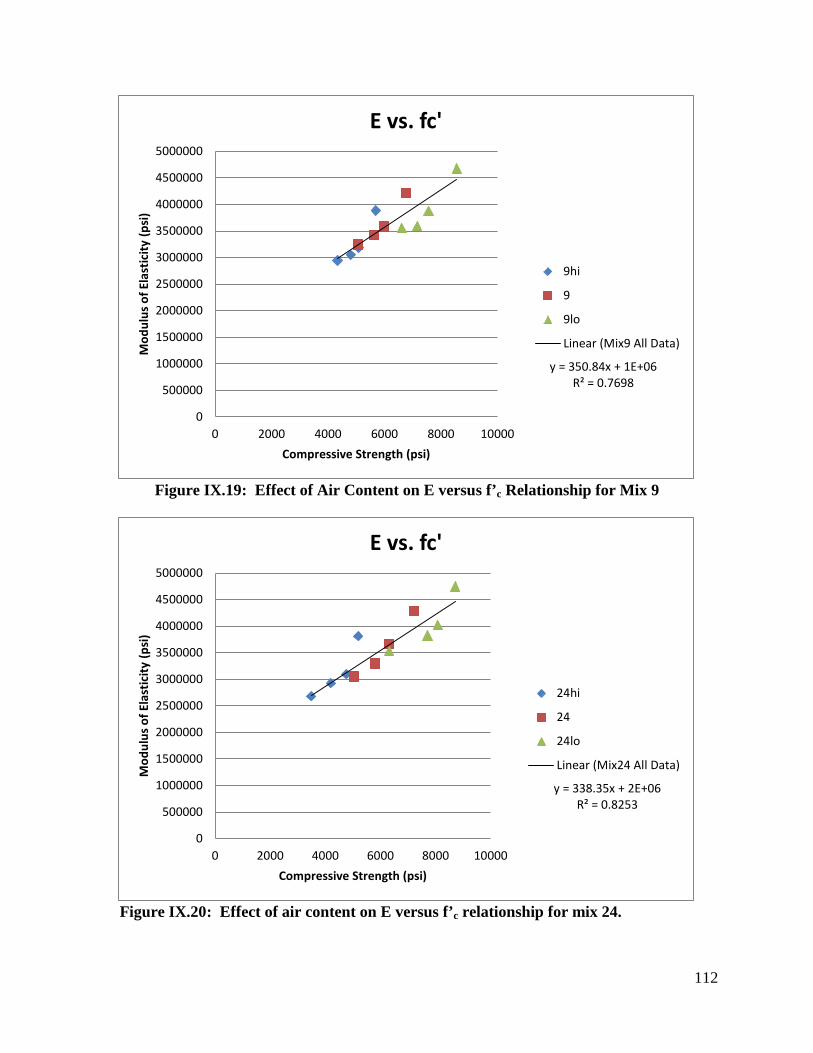
112
Figure IX.19: Effect of Air Content on E versus f’c Relationship for Mix 9
Figure IX.20: Effect of air content on E versus f’c relationship for mix 24.
y = 350.84x + 1E+06 R² = 0.7698
0
500000
1000000
1500000
2000000
2500000
3000000
3500000
4000000
4500000
5000000
0 2000 4000 6000 8000 10000
Mod
ulus
of E
last
icity
(psi
)
Compressive Strength (psi)
E vs. fc'
9hi
9
9lo
Linear (Mix9 All Data)
y = 338.35x + 2E+06 R² = 0.8253
0
500000
1000000
1500000
2000000
2500000
3000000
3500000
4000000
4500000
5000000
0 2000 4000 6000 8000 10000
Mod
ulus
of E
last
icity
(psi
)
Compressive Strength (psi)
E vs. fc'
24hi
24
24lo
Linear (Mix24 All Data)

113
Figure IX.21: Effect of air content on E versus f’c relationship for mix 39.
Figure IX.22: Effect of air content on fst versus f’c relationship for mix 9.
y = 364.53x + 2E+06 R² = 0.7724
0
1000000
2000000
3000000
4000000
5000000
6000000
0 2000 4000 6000 8000 10000
Mod
ulus
of E
last
icity
(psi
)
Compressive Strength (psi)
E vs. fc'
39hi
39
39lo
Linear (Mix39 All Data)
y = 0.0496x + 180.63 R² = 0.5541
0
100
200
300
400
500
600
700
800
0 2000 4000 6000 8000 10000
Split
Ten
sile
Str
engt
h (p
si)
Compressive Strength (psi)
fst vs. fc'
9hi
9
9lo
Linear (Mix9 All Data)

114
Figure IX.23: Effect of air content on fst versus f’c relationship for mix 24.
Figure IX.24: Effect of air content on fst versus f’c relationship for mix 39.
y = 0.0455x + 232.65 R² = 0.8868
0
100
200
300
400
500
600
700
0 2000 4000 6000 8000 10000
Split
Ten
sile
Str
engt
h(ps
i)
Compressive Strength (psi)
fst vs. fc'
24hi
24
24lo
Linear (Mix24 All Data)
y = 0.0545x + 187.62 R² = 0.8974
0
100
200
300
400
500
600
700
800
0 2000 4000 6000 8000 10000
Split
Ten
sile
Str
engt
h(ps
i)
Compressive Strength (psi)
fst vs fc'
39hi
39
39lo
Linear (Mix39 All Data)

115
Appendix X Concrete Testing Data Table X.1: Concrete data for mix matrix 1 – comparison of coarse aggregate and cementitious material composition.
CTE (mm/mm/°C)7 Day 14 Day 28 Day 90 Day 7 Day 14 Day 28 Day 90 Day 7 Day 14 Day 28 Day 90 Day 7 Day 14 Day 28 Day 90 Day 7 Day 14 Day 28 Day 90 Day 7 Day 14 Day 28 Day 90 Day 28 Day
1 4365 4878 5307 6166 606 684 676 817 3914333 4475333 4682333 4865667 0.18 0.19 0.19 0.18 411 438 442 497 4864970 5144992 5426128 5810477 9.341E-62 3734 4350 4686 5475 623 605 675 829 3667000 3657167 3754500 4223333 0.19 0.20 0.19 0.21 426 436 433 457 5415787 9.776E-63 3764 4012 4433 4898 644 665 758 816 3707000 3991000 3945667 4701500 0.19 0.20 0.19 0.19 317 331 384 472 9.183E-64 4319 4657 5042 5727 613 630 682 734 4385667 4419000 4847000 4968000 0.17 0.18 0.18 0.18 420 433 450 502 8.671E-65 5054 5852 6081 6770 631 688 782 904 4077833 4354333 4628000 4953000 0.22 0.23 0.21 0.23 466 500 525 506 5198379 5490312 5580297 6112802 9.577E-66 3553 4041 4472 5088 612 613 666 804 2838333 3051500 3329667 4641833 0.15 0.17 0.18 0.22 325 337 373 427 9.503E-67 4013 4504 4855 5620 672 646 719 772 3416500 3841333 3798667 4360000 0.18 0.20 0.20 0.21 385 416 417 535 6050587 9.527E-68 4676 5189 5738 6524 674 702 765 721 4475667 4573000 4545500 5194667 0.18 0.18 0.18 0.18 436 513 561 573 5498408 5639782 5817518 6139473 8.492E-69 5070 5621 6337 6758 680 702 785 866 3241333 3425333 3677000 4209000 0.19 0.20 0.19 0.19 424 447 483 488 4096154 4398940 5057147 5404921 9.324E-6
10 4652 5018 5420 6118 655 718 761 857 3653667 3422000 4205167 4630000 0.19 0.18 0.20 0.21 415 416 473 491 9.416E-611 4429 4792 5584 6316 673 717 783 887 4295000 4314667 4656167 5035000 0.22 0.22 0.21 0.22 454 440 475 597 9.657E-612 4492 4861 5284 5926 631 698 708 817 4267167 4527500 4573667 5311333 0.15 0.16 0.13 0.19 361 416 438 485 5252232 5766849 5867741 6071343 10.805E-613 4690 5188 5737 6460 761 717 795 837 4678667 5408000 5283167 5402833 0.20 0.23 0.21 0.20 499 530 561 654 8.571E-614 4611 5217 5564 5828 598 592 694 798 3384833 3606667 3885000 4731667 0.18 0.19 0.20 0.22 352 428 428 566 4562934 4532635 5241920 5843738 9.340E-615 4955 5681 5999 6858 750 731 768 851 3749000 3937000 4362667 4622667 0.18 0.21 0.20 0.22 437 489 476 582 9.215E-616 4223 4789 5377 6129 700 744 824 898 3582333 3904833 4708333 4781667 0.16 0.17 0.20 0.18 370 399 488 523 4948176 5166267 5594790 6067138 9.448E-617 4072 4823 4940 6085 720 777 855 993 3300000 3723000 4146000 4517833 0.19 0.19 0.20 0.20 448 431 474 521 5891554 10.089E-618 3579 4426 4686 5369 661 728 759 869 3553667 3779333 4534500 4647000 0.17 0.18 0.22 0.19 443 452 464 473 9.499E-619 3925 4595 5375 6084 734 787 783 962 4326667 4195333 4311333 4906000 0.20 0.20 0.18 0.20 392 443 471 539 9.035E-620 3891 4521 5070 5531 671 794 830 911 3926667 3962000 4435000 4833000 0.22 0.21 0.20 0.20 394 463 487 559 9.428E-621 3944 4474 4825 5590 612 643 753 850 3055000 3168833 3720667 4426167 0.17 0.18 0.16 0.21 354 436 434 463 9.514E-622 3891 4513 5127 5972 705 809 837 916 3363833 3612500 3912333 4460167 0.19 0.19 0.22 0.19 414 448 528 529 6102268 9.740E-623 4767 4985 5815 6171 751 817 954 994 4647500 4996167 4945500 5166500 0.19 0.17 0.18 0.16 466 591 581 588 5568232 5840398 6081436 6443956 8.937E-624 5029 5807 6308 7211 717 780 795 914 3050500 3297833 3662500 4290167 0.19 0.21 0.21 0.21 467 494 503 592 4177637 4374510 4819485 5297050 9.585E-625 4120 4737 5389 6081 692 791 834 922 3381333 3430000 3771000 4724167 0.20 0.19 0.18 0.22 355 410 469 550 9.444E-626 4955 5798 6376 7240 749 860 880 955 4345667 4531000 4930833 5549000 0.19 0.20 0.20 0.23 472 429 628 663 9.293E-627 4532 5046 5606 6289 772 792 870 913 4617000 4891333 5439167 5825167 0.16 0.19 0.18 0.17 454 464 574 635 10.984E-628 4552 5477 5810 6402 829 942 908 988 4962000 5043333 5269167 6044000 0.22 0.21 0.21 0.21 433 425 509 581 6014978 6288909 6464564 6876917 9.043E-629 3915 4858 5181 5659 667 705 785 895 3260667 3300333 3543167 4310333 0.21 0.19 0.19 0.22 382 404 448 469 9.497E-630 4942 5616 6233 6770 815 836 964 973 3719000 4095000 4242667 4700667 0.19 0.20 0.20 0.21 500 499 577 633 9.389E-631 4297 4820 5362 6479 663 671 789 853 4043167 3924467 4218833 5248167 0.18 0.17 0.17 0.19 394 435 472 510 4955934 5242933 5620058 6107435 9.524E-632 3776 4597 5119 5934 597 610 707 789 3447167 3663833 4100333 4616500 0.18 0.19 0.18 0.20 379 432 478 544 4482146 4829414 5178420 5717944 9.850E-633 3842 4278 5001 5910 629 735 731 898 3719167 3932167 4333333 4802000 0.19 0.17 0.19 0.21 397 423 498 513 9.344E-634 4014 4821 5489 6621 625 600 765 888 4138500 4449000 4599667 5330000 0.18 0.18 0.18 0.18 399 438 525 536 9.176E-635 4013 4650 5177 6268 589 633 672 768 3981833 4234000 4610167 5219500 0.20 0.22 0.20 0.21 397 440 509 520 9.649E-636 3383 3690 4226 5139 591 651 788 878 2922833 3073167 4094833 4822667 0.16 0.17 0.19 0.21 328 365 366 463 9.706E-637 3892 4790 5315 6353 663 749 765 871 3667833 3786167 4079833 5321833 0.18 0.19 0.21 0.21 417 458 438 524 6009054 9.611E-638 4404 5203 5959 6746 642 765 718 897 4272667 4776000 5141667 5569000 0.18 0.18 0.19 0.18 438 535 519 561 5304079 5639393 5936016 6591299 8.677E-639 4347 5425 6312 7661 683 685 773 933 3191167 3312333 3510667 4627333 0.20 0.23 0.18 0.22 440 473 476 632 4252484 4889278 4928749 5860802 9.619E-640 4388 4990 5596 6648 712 716 792 907 3455167 3433333 4006000 4529667 0.19 0.19 0.20 0.21 409 424 484 558 4539716 4864247 9.599E-641 4965 5885 6918 7904 688 776 878 1080 4052000 4562333 4921667 5278000 0.22 0.22 0.21 0.20 455 498 491 632 9.659E-642 4592 5275 6182 7313 623 692 783 903 4382000 4529167 4817500 5497667 0.14 0.16 0.16 0.15 462 505 527 625 10.977E-643 3436 3889 4497 5260 694 731 772 959 4495333 4712500 5097333 5527000 0.20 0.19 0.18 0.20 458 480 526 599 8.601E-644 4138 4351 4885 5574 582 638 789 936 3732833 3426167 3983500 4500000 0.19 0.17 0.20 0.23 379 390 425 513 10.020E-645 4197 4952 5597 6799 726 744 808 992 3446667 3963333 4385500 4743833 0.18 0.19 0.20 0.20 420 496 496 585 9.476E-6
Dynamic Modulus (psi)Split Tensile Strength (psi)Compressive Strength (psi)Mix #
Modulus of Rupture (psi) Modulus of Elasticity (psi) Poisson's Ratio

116
Table X.2: Concrete data for mix matrix 2 – comparison of cement source and supplementary cementitious material source.
Table X.3: Concrete test data for mix matrix 3 - comparison of supplementary cementitious material source.
CTE (mm/mm/°C)7 Day 14 Day 28 Day 90 Day 7 Day 14 Day 28 Day 90 Day 7 Day 14 Day 28 Day 90 Day 7 Day 14 Day 28 Day 90 Day 7 Day 14 Day 28 Day 90 Day 7 Day 14 Day 28 Day 90 Day 28 Day
46 4144 4695 5137 5999 731 863 867 845 3912500 4012500 4233667 4767333 0.20 0.20 0.17 0.19 431 456 496 502 4980818 5313019 5469388 5765766 9.759E-647 3839 4503 4921 5520 830 867 933 943 3483667 3748333 3942167 4801000 0.18 0.21 0.18 0.20 411 462 482 526 5901983 10.035E-648 4503 4946 5272 5925 715 855 833 871 3838000 4135500 4012500 4520667 0.22 0.20 0.20 0.20 475 484 537 583 6046132 9.893E-649 4518 5030 5477 6146 805 899 966 776 4764667 4830333 5180667 4694000 0.17 0.19 0.20 0.17 442 509 548 546 5412743 5780690 5874832 6183289 8.966E-650 4853 5729 6349 7361 751 739 845 926 3203833 3612667 3726333 4340500 0.21 0.21 0.21 0.22 455 513 553 622 4409180 4629199 4979284 5493740 9.569E-651 4132 4667 5255 6023 705 831 833 832 3944000 4215000 4189000 4879833 0.18 0.18 0.18 0.18 418 473 492 520 4988016 5194641 5411415 5669140 9.605E-652 3806 4555 4830 5359 706 806 868 922 3591000 3836000 3905500 4335833 0.20 0.21 0.21 0.19 415 441 504 517 6020703 9.793E-653 3887 4558 4949 5587 704 863 875 927 3243333 3800000 3959833 4576833 0.18 0.19 0.20 0.20 428 483 488 515 6000933 9.606E-654 4809 5416 5745 6203 849 902 972 1057 4770750 5012500 5105667 4783000 0.23 0.20 0.19 0.17 437 484 541 510 5732747 5827863 5918877 6027660 8.991E-655 4546 5356 5862 6688 668 750 836 846 3087333 3573500 3531500 4246000 0.19 0.21 0.21 0.21 447 475 494 636 4368879 4531014 4891876 5340390 9.468E-656 3793 4654 5067 5788 763 740 804 839 3793833 4212333 4403000 4841667 0.18 0.18 0.19 0.17 376 396 459 468 4966519 5270466 5590807 5893144 9.556E-657 4234 4945 5385 6763 604 740 746 811 3521833 3937000 4097333 4793833 0.20 0.21 0.21 0.21 337 430 451 479 5847769 9.876E-658 4285 4939 5666 6453 654 771 892 952 3591667 3884167 4079400 5000167 0.19 0.19 0.20 0.22 415 449 538 578 6101876 9.479E-659 3820 4520 5320 6131 727 798 880 968 4437167 4623667 5146833 5134833 0.16 0.17 0.18 0.18 391 471 534 545 5360215 5599207 5711050 6089036 8.808E-660 5497 6390 7293 8798 687 694 781 877 3361333 3819667 4073500 5062000 0.21 0.23 0.22 0.24 454 461 518 735 4169412 4487162 4815447 5440030 9.545E-661 3666 4245 4726 5534 668 661 746 848 3879833 3818167 4377167 4794500 0.17 0.15 0.18 0.18 360 392 428 455 4765120 5135630 5413226 5762075 9.481E-662 4155 4900 5486 6660 627 656 827 838 4080500 3929167 4111333 4603333 0.21 0.20 0.19 0.20 367 436 507 544 6030706 9.706E-663 4312 5116 5557 6786 690 795 810 884 3745000 3834667 4076667 5014833 0.20 0.21 0.20 0.21 420 428 480 548 5495620 5893704 6400541 9.783E-664 3545 4151 4515 5346 666 765 891 897 4261667 4603167 4921000 5289500 0.18 0.19 0.16 0.17 394 453 475 531 5532917 5820099 6053339 6396708 9.125E-665 4664 5319 6325 7763 590 695 784 833 3250167 3679167 3818667 4724833 0.20 0.21 0.22 0.22 415 454 515 667 4198283 4489998 4933890 5518648 9.469E-666 4334 5010 5746 6858 661 707 808 822 4195333 4372500 4704667 5051833 0.18 0.19 0.17 0.19 412 465 466 551 4958278 5288500 5631221 5958212 9.444E-667 4249 5007 5579 6713 742 799 812 1009 3194667 3719500 4430167 4794667 0.15 0.18 0.21 0.21 418 420 481 527 6090028 9.688E-668 4526 5398 6055 6985 674 757 825 948 3817167 4055833 4263167 5022167 0.21 0.20 0.21 0.22 430 457 458 590 5315191 5640890 6052670 9.718E-669 3966 4610 5217 6064 780 822 834 916 4286667 4871000 4970833 4982167 0.19 0.20 0.19 0.18 425 502 499 533 5686167 5828229 5962884 6057604 9.056E-6
Split Tensile Strength (psi) Dynamic Modulus (psi)Mix #
Compressive Strength (psi) Modulus of Rupture (psi) Modulus of Elasticity (psi) Poisson's Ratio
CTE (mm/mm/°C)7 Day 14 Day 28 Day 90 Day 7 Day 14 Day 28 Day 90 Day 7 Day 14 Day 28 Day 90 Day 7 Day 14 Day 28 Day 90 Day 7 Day 14 Day 28 Day 90 Day 7 Day 14 Day 28 Day 90 Day 28 Day
70 5165 6042 6361 7682 666 696 814 969 3292333 3633167 3942833 4882000 0.19 0.21 0.22 0.22 395 526 540 670 4134700 4771680 5045002 5724125 9.484E-671 3655 4321 5040 5821 664 731 789 839 3478000 3891667 4220667 4683167 0.16 0.18 0.18 0.18 414 454 471 522 4675469 5069599 5318186 5832618 9.503E-672 3369 4169 4597 5035 604 700 696 850 3499667 3528833 3641000 3831833 0.21 0.20 0.19 0.18 354 385 452 513 5612979 10.085E-673 3650 4351 5072 5229 687 815 826 957 3268167 3614833 3887000 4789000 0.19 0.19 0.19 0.19 359 446 495 523 6042652 9.573E-674 4189 5239 5651 6656 698 794 805 926 4608667 4817833 4949333 5483500 0.19 0.19 0.19 0.19 497 498 514 584 5341728 5742232 6094109 6180721 8.623E-675 4149 5326 5966 6522 640 692 766 882 3143000 3351167 3680667 4050833 0.19 0.19 0.20 0.21 414 476 484 561 3978787 4136771 4440762 5371157 9.466E-676 3904 4721 5147 6590 584 612 684 826 3674500 4031000 4340500 4957167 0.16 0.18 0.19 0.18 382 460 488 523 4705532 5109601 5279394 5774745 9.484E-677 3778 4294 5126 5851 560 686 721 876 3185000 3545167 3852500 4575333 0.18 0.18 0.20 0.19 347 383 471 530 6209538 9.880E-678 4021 4518 5370 6257 679 682 796 923 3480000 3538000 4042667 4629833 0.20 0.19 0.19 0.19 401 431 495 565 6319136 9.504E-679 3707 4326 4981 5987 611 757 781 939 4100333 4362333 4798167 5255333 0.17 0.16 0.19 0.19 439 441 473 541 5297129 5640059 5802755 6318262 8.602E-680 4954 5363 6459 7707 649 738 756 877 3298500 3802833 4068000 4658333 0.21 0.24 0.21 0.21 396 475 450 579 4741528 4820695 5121875 6163244 9.578E-681 4290 4942 5598 6846 613 659 668 803 3795500 4184667 4166000 5109167 0.17 0.18 0.17 0.19 407 443 467 566 4830416 5279915 5517865 5989062 9.363E-682 3828 4534 5135 5910 614 675 770 880 3358833 3753667 4346500 4380000 0.18 0.19 0.21 0.18 379 411 460 546 6158798 9.777E-683 3798 4339 4995 5401 657 683 805 872 3562833 3603000 3871667 4458667 0.16 0.16 0.18 0.20 362 421 501 556 6104756 9.665E-684 3833 4321 5290 6168 591 655 690 929 4226667 5028000 4842500 5218167 0.17 0.21 0.17 0.19 447 480 478 565 4931902 5375780 5370134 5938766 8.583E-685 4673 5462 6167 7053 630 671 716 847 3112000 3303500 3703667 4523833 0.18 0.21 0.21 0.20 363 427 438 547 4232178 4585588 4764796 5840684 9.495E-6
Mix #Compressive Strength (psi) Modulus of Rupture (psi) Modulus of Elasticity (psi) Poisson's Ratio Split Tensile Strength (psi) Dynamic Modulus (psi)

117
Table X.4: Concrete test data for mix matrix 4 - comparison of fine aggregate source and supplementary cementitious material source.
CTE (mm/mm/°C)7 Day 14 Day 28 Day 90 Day 7 Day 14 Day 28 Day 90 Day 7 Day 14 Day 28 Day 90 Day 7 Day 14 Day 28 Day 90 Day 7 Day 14 Day 28 Day 90 Day 7 Day 14 Day 28 Day 90 Day 28 Day
86 3912 4610 5342 5973 611 730 736 747 3765667 4083333 4369167 4912167 0.17 0.18 0.16 0.18 450 448 474 487 4782053 5202897 5414028 5809154 9.586E-687 3934 4781 5324 6341 544 608 713 785 3593500 4118500 4081667 4869000 0.18 0.20 0.18 0.18 395 434 471 522 4436792 4779163 5119869 5671818 9.599E-688 3820 4591 4995 5893 563 691 666 884 3246500 3672833 3994500 4757500 0.17 0.17 0.17 0.19 406 479 497 469 4594320 5139796 5361613 5870661 9.767E-689 4011 4756 5475 6116 718 797 918 979 4341833 4577167 5026500 5165500 0.17 0.17 0.18 0.17 455 495 510 551 5345679 5742790 5924142 6201295 8.868E-690 5303 6425 7092 8091 587 633 726 857 3337500 3648167 4537167 4522167 0.19 0.20 0.22 0.21 457 458 502 600 4197418 4568393 5114861 5796053 9.752E-691 3728 4318 4970 5643 569 617 713 761 3943667 3972500 4391667 4896000 0.19 0.17 0.16 0.17 365 421 506 478 4635242 5006065 5386634 5578664 9.360E-692 3813 4536 5020 5634 630 662 774 895 3278833 3788167 4017333 4978500 0.18 0.17 0.18 0.19 404 450 492 517 4787530 5207420 5728591 6170737 10.045E-693 4049 4535 4931 6072 638 734 756 814 3487500 3853833 4368333 4956000 0.17 0.17 0.18 0.19 419 429 479 483 4719664 5292812 5593581 6147259 9.468E-694 3783 4513 5378 5535 687 745 782 840 4289500 4657667 5680000 5182000 0.17 0.18 0.22 0.22 390 477 438 558 5003440 5696480 5687847 5940869 8.670E-695 4473 5552 6644 7765 641 663 816 903 3243500 3624333 4037167 4695167 0.20 0.19 0.21 0.22 379 455 489 585 4072439 4548143 4949686 5528433 9.512E-696 4375 5127 5712 6636 594 650 682 823 4243833 4587333 4966833 5382333 0.15 0.17 0.19 0.18 388 439 414 490 5182318 5514036 5727642 6104101 9.492E-697 5154 5855 6183 7610 636 689 689 727 4592333 4278333 4606500 5432833 0.21 0.18 0.18 0.20 421 486 521 558 4897973 5419659 5362837 5941112 9.666E-698 4312 5287 5764 6644 664 691 763 901 3800833 4042333 4295000 5840833 0.17 0.18 0.18 0.22 401 439 468 477 5279127 5636223 5918332 6671825 9.677E-699 4498 5302 5947 6758 543 621 623 732 4528000 4814167 5389333 5504000 0.19 0.16 0.18 0.17 507 516 492 536 5268740 5399983 5560039 5968959 8.632E-6100 4669 5433 5919 7265 585 618 756 775 3494333 3343833 3813833 4784333 0.19 0.19 0.18 0.20 419 391 498 600 4233659 4596260 4949255 5643138 9.631E-6101 4014 4535 5248 5960 508 575 666 795 4312167 4259167 4582333 5152333 0.17 0.15 0.15 0.19 381 412 460 467 5173033 5537552 5838071 6204494 9.332E-6102 4747 5453 6085 7200 715 667 754 967 3866667 4141667 4546833 5261500 0.18 0.18 0.19 0.20 409 476 490 535 5285441 5699427 6140803 6763062 9.877E-6103 4861 5562 6297 7307 651 710 756 911 3797167 4139333 4335500 5244167 0.18 0.18 0.19 0.20 479 478 511 537 5402247 5643061 6081558 6743332 9.879E-6104 4437 5058 5778 6969 636 596 721 814 4572333 4829833 5194167 5138333 0.17 0.18 0.18 0.17 409 473 487 520 5442903 5619178 6093068 6241497 8.531E-6105 4616 5562 6244 7661 618 677 725 849 3222000 3427667 3524833 4924333 0.19 0.19 0.18 0.21 315 374 471 579 4404889 4699335 5269460 5803549 9.605E-6106 3923 4497 4792 5895 582 639 712 731 4204167 4371000 4458500 5138833 0.17 0.18 0.18 0.16 393 476 425 526 5223449 5565567 5673332 6322539 9.282E-6107 4304 5060 5885 6793 595 661 664 788 3640500 3780500 4191500 5040167 0.18 0.17 0.20 0.19 403 416 478 541 4878023 5254406 5590253 6209017 9.862E-6108 4725 5553 5944 7091 698 716 787 897 4059500 4116500 4448500 5130667 0.18 0.18 0.18 0.19 458 472 526 539 5518791 5710255 6098151 6690701 9.579E-6109 4193 4849 5067 6448 602 685 775 782 4462000 4902500 5052500 5122167 0.18 0.20 0.19 0.18 407 489 481 525 5496483 5741720 6008077 6332250 8.736E-6110 4819 5632 6565 7376 625 706 768 860 3099667 3575167 4040500 4887000 0.18 0.20 0.20 0.22 391 423 487 534 3908690 4372198 5196235 5748887 9.654E-6
Split Tensile Strength (psi) Dynamic Modulus (psi)Mix #
Compressive Strength (psi) Modulus of Rupture (psi) Modulus of Elasticity (psi) Poisson's Ratio

118
Appendix XI Statistical Analysis Summary A two-factor ANOVA statistical analysis was used for mix matrix 1 to analyze differences between coarse aggregate type and cementitious material blend. Table XI.1 provides a summary of those results in which YES represents a significant statistical difference based on a 95% confidence level and NO represents no significant statistical difference. A three-factor ANOVA statistical analysis was used for comparisons in mix matrix 2, 3 and 4 to analyze the differences in fine aggregate, ordinary Portland cement brand, slag brand, and fly ash brand. Tables XI.2, XI.3, XI.4, and XI.5 provide a summary of those results based on the same terms described for Table XI.1 with the constituent listed at the top of each table is the source of the difference analyzed.
Table XI.1: Two-factor ANOVA for coarse aggregate and cementitous material composition as sources of difference
Test Coarse Aggregate Type Cementitious Material Comp. 7 Day 14 Day 28 Day 90 Day 7 Day 14 Day 28 Day 90 Day
Compressive Strength YES YES YES YES YES YES YES YES Modulus of Rupture YES YES YES YES YES YES YES YES
Splitting Tensile Strength YES YES YES YES NO NO YES YES Modulus of Elasticity YES YES YES YES NO NO YES YES
Poisson's Ratio YES YES YES YES NO NO NO NO Dynamic Modulus YES YES YES YES NO YES YES YES
CTE - - YES - - - YES -
Table XI.2: Three-factor ANOVA for Portland cement as source of difference.
Test Cement
7 Day 14 Day 28 Day 90 Day Slag Fly Ash Slag Fly Ash Slag Fly Ash Slag Fly Ash
Compressive Strength YES NO YES NO YES YES NO YES Modulus of Rupture YES NO NO NO YES NO NO NO
Splitting Tensile Strength YES NO NO NO YES NO NO NO Modulus of Elasticity NO NO NO NO YES NO NO NO
Poisson's Ratio NO NO NO NO NO YES NO NO Dynamic Modulus YES NO YES NO NO YES NO YES
CTE - - - - YES YES - -

119
Table XI.3: Three-factor ANOVA for fine aggregate as source of difference.
Test Fine Aggregate
7 Day 14 Day 28 Day 90 Day Slag Fly Ash Slag Fly Ash Slag Fly Ash Slag Fly Ash
Compressive Strength YES YES NO NO YES NO YES YES Modulus of Rupture NO NO NO NO NO NO YES YES
Splitting Tensile Strength YES NO YES NO NO YES NO YES Modulus of Elasticity NO NO NO YES NO NO YES YES
Poisson's Ratio NO NO NO NO NO NO NO NO Dynamic Modulus YES YES NO NO NO YES NO YES
CTE - - - - NO NO - -
Table XI.4: Three-factor ANOVA for slag cement as source of difference.
Test Slag Cement
7 Day 14 Day 28 Day 90 Day Cement Sand Cement Sand Cement Sand Cement Sand
Compressive Strength YES NO YES YES NO YES YES YES Modulus of Rupture YES YES YES YES YES YES NO YES
Splitting Tensile Strength NO NO NO NO NO NO NO NO Modulus of Elasticity YES NO YES YES NO YES NO NO
Poisson's Ratio NO YES YES YES NO NO NO NO Dynamic Modulus YES YES NO YES YES YES YES YES
CTE - - - - YES YES - -
Table XI.5: Three-factor ANOVA for fly ash as source of difference.
Test Fly Ash
7 Day 14 Day 28 Day 90 Day Cement Sand Cement Sand Cement Sand Cement Sand
Compressive Strength YES YES NO YES YES YES YES YES Modulus of Rupture NO NO NO NO NO NO NO YES
Splitting Tensile Strength NO NO NO NO NO NO NO NO Modulus of Elasticity NO NO NO NO NO NO YES YES
Poisson's Ratio NO NO NO NO NO NO NO NO Dynamic Modulus NO YES NO NO NO YES YES YES
CTE - - - - NO NO - -

120
Appendix XII Data Analysis Example Compressive Strength For this example 90 Day compressive strength data was used. The individual coarse aggregates were directly compared based on their compressive strengths. Figure XIII.1 below is a matrix of the coarse aggregate comparisons for the ordinary Portland cement (OPC) mixes from mix matrix 1 and their corresponding percent differences calculated with Microsoft Excel. The columns represent the percent difference using the aggregate listed at the top of that column as the base. The maximum and minimum percent differences are for each column are computed at the bottom of the matrix and the largest absolute value of those percent differences is the number used for the averages presented in section 5.3.1 of the report. Figures XII.2 and XII.3 are the corresponding percent differences and average percent differences in compressive strength from the previously mentioned matrix.
Figure XII.1: Excel spreadsheet for calculating percent differences in compressive strength when changing coarse aggregate types.
GG1 GG2 GG3 GG4 GG5 GG6 CS1 CS2 CS3 CS4 CS5 CS6 CS7 CS8 CS9GG1 xxxxxx -691.072 -1268.08 -439.261 603.9293 -1078.5 -546.628 357.5919 591.4908 -48.0203 149.8343 -239.857 293.4103 -338.419 691.8463GG2 691.0721 xxxxxx -577.003 251.8108 1295.001 -387.425 144.4441 1048.664 1282.563 643.0519 840.9064 451.2153 984.4825 352.6529 1382.918GG3 1268.075 577.0034 xxxxxx 828.8142 1872.005 189.5787 721.4475 1625.667 1859.566 1220.055 1417.91 1028.219 1561.486 929.6562 1959.922GG4 439.2613 -251.811 -828.814 xxxxxx 1043.191 -639.235 -107.367 796.8532 1030.752 391.241 589.0956 199.4045 732.6716 100.842 1131.108GG5 -603.929 -1295 -1872 -1043.19 xxxxxx -1682.43 -1150.56 -246.337 -12.4385 -651.95 -454.095 -843.786 -310.519 -942.349 87.91694GG6 1078.497 387.4246 -189.579 639.2355 1682.426 xxxxxx 531.8687 1436.089 1669.988 1030.476 1228.331 838.64 1371.907 740.0775 1770.343CS1 546.628 -144.444 -721.447 107.3667 1150.557 -531.869 xxxxxx 904.22 1138.119 498.6078 696.4623 306.7712 840.0384 208.2088 1238.474CS2 -357.592 -1048.66 -1625.67 -796.853 246.3374 -1436.09 -904.22 xxxxxx 233.8989 -405.612 -207.758 -597.449 -64.1816 -696.011 334.2544CS3 -591.491 -1282.56 -1859.57 -1030.75 12.43851 -1669.99 -1138.12 -233.899 xxxxxx -639.511 -441.657 -831.348 -298.081 -929.91 100.3554CS4 48.02026 -643.052 -1220.06 -391.241 651.9496 -1030.48 -498.608 405.6122 639.5111 xxxxxx 197.8546 -191.837 341.4306 -290.399 739.8665CS5 -149.834 -840.906 -1417.91 -589.096 454.095 -1228.33 -696.462 207.7576 441.6565 -197.855 xxxxxx -389.691 143.576 -488.254 542.012CS6 239.8568 -451.215 -1028.22 -199.404 843.7862 -838.64 -306.771 597.4487 831.3476 191.8365 389.6911 xxxxxx 533.2671 -98.5624 931.7031CS7 -293.41 -984.482 -1561.49 -732.672 310.519 -1371.91 -840.038 64.18159 298.0805 -341.431 -143.576 -533.267 xxxxxx -631.83 398.4359CS8 338.4192 -352.653 -929.656 -100.842 942.3486 -740.078 -208.209 696.0112 929.9101 290.399 488.2535 98.56243 631.8296 xxxxxx 1030.266CS9 -691.846 -1382.92 -1959.92 -1131.11 -87.9169 -1770.34 -1238.47 -334.254 -100.355 -739.867 -542.012 -931.703 -398.436 -1030.27 xxxxxx
GG1 GG2 GG3 GG4 GG5 GG6 CS1 CS2 CS3 CS4 CS5 CS6 CS7 CS8 CS9GG1 -13% -26% -8% 9% -21% -10% 5% 9% -1% 2% -4% 5% -6% 10%GG2 11% -12% 4% 19% -8% 3% 16% 19% 11% 13% 8% 15% 6% 20%GG3 21% 11% 14% 28% 4% 13% 25% 28% 20% 22% 17% 24% 16% 29%GG4 7% -5% -17% 15% -13% -2% 12% 15% 6% 9% 3% 11% 2% 16%GG5 -10% -24% -38% -18% -33% -20% -4% 0% -11% -7% -14% -5% -16% 1%GG6 17% 7% -4% 11% 25% 9% 22% 25% 17% 19% 14% 21% 13% 26%CS1 9% -3% -15% 2% 17% -10% 14% 17% 8% 11% 5% 13% 4% 18%CS2 -6% -19% -33% -14% 4% -28% -16% 3% -7% -3% -10% -1% -12% 5%CS3 -10% -23% -38% -18% 0% -33% -20% -4% -10% -7% -14% -5% -16% 1%CS4 1% -12% -25% -7% 10% -20% -9% 6% 9% 3% -3% 5% -5% 11%CS5 -2% -15% -29% -10% 7% -24% -12% 3% 7% -3% -7% 2% -8% 8%CS6 4% -8% -21% -3% 12% -16% -5% 9% 12% 3% 6% 8% -2% 14%CS7 -5% -18% -32% -13% 5% -27% -15% 1% 4% -6% -2% -9% -11% 6%CS8 5% -6% -19% -2% 14% -15% -4% 11% 14% 5% 8% 2% 10% 15%CS9 -11% -25% -40% -20% -1% -35% -22% -5% -1% -12% -9% -16% -6% -18%
MaxDiff 21% 11% -4% 14% 28% 4% 13% 25% 28% 20% 22% 17% 24% 16% 29%MinDiff -11% -25% -40% -20% -1% -35% -22% -5% -1% -12% -9% -16% -6% -18% 1%HighDiff 21% -25% -40% -20% 28% -35% -22% 25% 28% 20% 22% 17% 24% -18% 29%AbsVal 21% 25% 40% 20% 28% 35% 22% 25% 28% 20% 22% 17% 24% 18% 29%

121
Figure XII.2: Percent differences based on changing coarse aggregate type and cementitious material composition.
Figure XII.3: Average percent differences based on changing coarse aggregate type and cementitious material composition.
0%
10%
20%
30%
40%
50%
60%
OPC-Slag OPC-fly ash slag-fly ash HighAggDiffOPC
HighAggDiffSlag
HighAggDiffFA
Perc
ent D
iffer
ence
Aggregate Effect vs. Cementitious Material
Effect on Compressive Strength GG1
GG2
GG3
GG4
GG5
GG6
CS1
CS2
CS3
CS4
CS5
CS6
CS7
CS8
CS9
0%
10%
20%
30%
40%
50%
60%
OPC-Slag 1 OPC-Fly Ash1
Slag 1-FlyAsh 1
HighAggDiffOPC
HighAggDiffSlag
HighAggDiffFA
Perc
ent D
iffer
ence
Average Percent Differences in Compressive Strength Based on Changing Concrete
Constituents
Average

122
The other concrete constituent factors, such as fine aggregate, slag cement type, fly ash brand, and cementitious material blend were compared directly based on the mix matrices described in section 4.3 of the report. Figures XII.4 and XII.5 show Excel spreadsheet values for percent differences in compressive strength when changing the previously mentioned concrete constituent. Figures XII.6 and XII.8 show individual percent differences based on changing the previously mentioned concrete constituents for 90 day compressive strength. Figures XII.7 and XII.9 show the average percent differences based on changing the previously mentioned concrete constituents. The absolute values of the percent differences were used for the averages presented in section 5.3. The averages appear to be a good representation of the trend and therefore were chosen summarize the data in section 5.3 of the report.
Figure XII.4: Excel spreadsheet for calculating percent differences in compressive strength when changing cementitious material type.
Figure XII.5: Excel spreadsheet for calculating percent differences in compressive strength when changing cementitious material source.
Difference GG1 GG2 GG3 GG4 GG5 GG6 CS1 CS2 CS3 CS4 CS5 CS6 CS7 CS8 CS9OPC-Slag 1 1% -11% -10% -6% 18% -10% -6% 5% -7% 1% -15% -6% 1% 3% 1%
OPC-Fly Ash 1 -5% -8% -21% -16% 7% -1% -13% -3% -13% -9% -25% -23% 19% 4% 1%Slag 1-Fly Ash 1 -6% 2% -10% -9% -13% 8% -6% -9% -6% -9% -9% -16% 18% 2% 0%
GG1 GG2 CS1 CS2 CS3Slag I 2% 9% 1% 0% -2%Slag II -3% -6% -7% 7% -3%FA I 11% -14% -2% 9% -15%FA II 16% -14% -8% 11% -1%FA III 0% -14% -29% 2% -9%Slag I 3% -4% 1% 1% -12%Slag II 3% -12% -16% 17% -19%FA I -2% -28% -5% 0% 5%FA II 10% -23% -17% -16% 1%FA III 14% -15% -31% -5% -5%
GG1 GG2 CS1 CS2 CS3Slag1-2 5% 17% 12% -8% 10%FA1-2 -2% 1% 2% 11% -1%FA1-3 -6% 0% 15% 9% 8%FA2-3 -4% -1% 14% -3% 8%
Slag1-2 0% 3% 6% -1% 9%FA1-2 4% 2% -5% 13% 12%FA1-3 -18% 1% -8% 1% 13%FA2-3 -24% -1% -3% -13% 14%
Slag1-2 6% 11% -3% 9% 4%FA1-2 10% 5% -10% -3% -5%FA1-3 11% 11% -7% 5% -2%FA2-3 1% 6% 3% 7% 4%
Difference Supplementary Material
Coarse Aggregate
Mix Matrix Difference Coarse Aggregate
Cement 1-2
Sand a-b
1 and 3
2
4
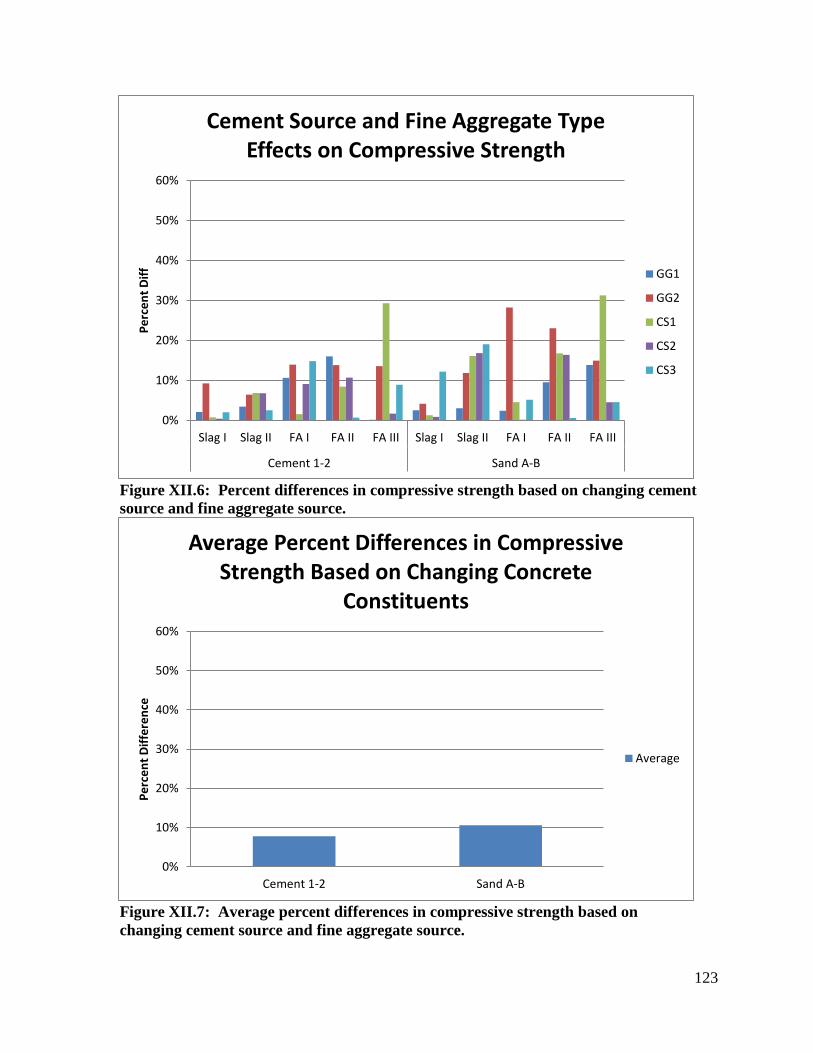
123
Figure XII.6: Percent differences in compressive strength based on changing cement source and fine aggregate source.
Figure XII.7: Average percent differences in compressive strength based on changing cement source and fine aggregate source.
0%
10%
20%
30%
40%
50%
60%
Slag I Slag II FA I FA II FA III Slag I Slag II FA I FA II FA III
Cement 1-2 Sand A-B
Perc
ent D
iff
Cement Source and Fine Aggregate Type Effects on Compressive Strength
GG1
GG2
CS1
CS2
CS3
0%
10%
20%
30%
40%
50%
60%
Cement 1-2 Sand A-B
Perc
ent D
iffer
ence
Average Percent Differences in Compressive Strength Based on Changing Concrete
Constituents
Average
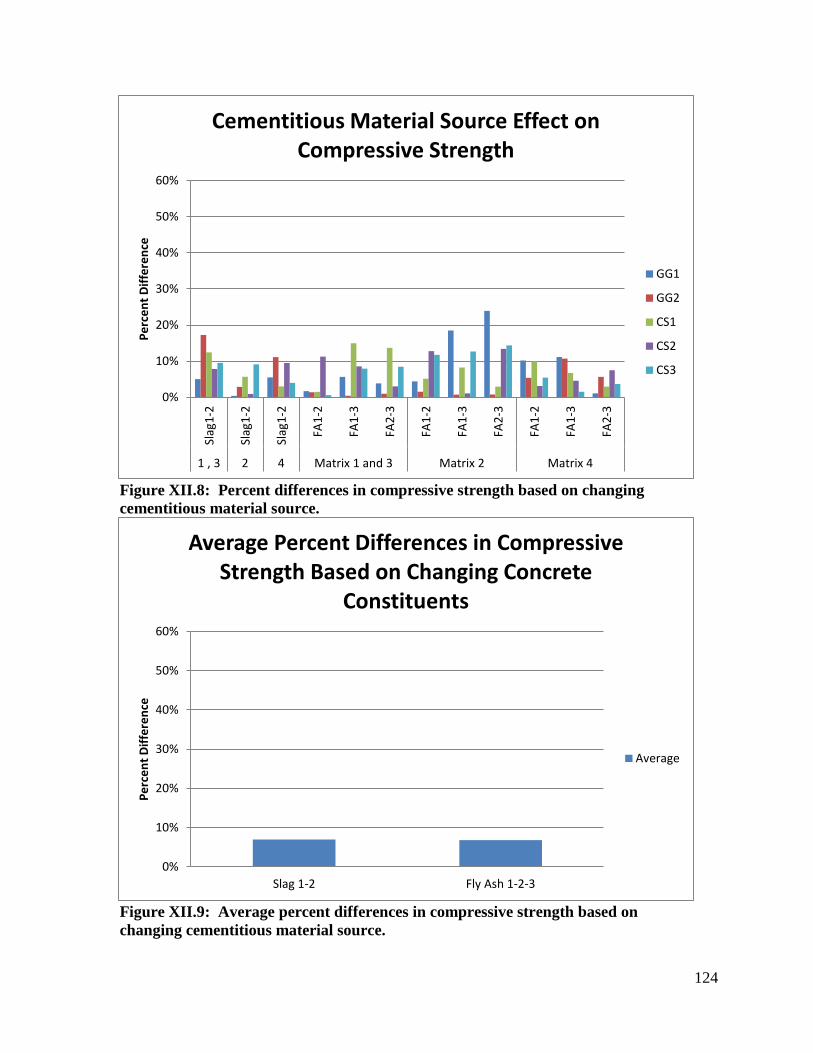
124
Figure XII.8: Percent differences in compressive strength based on changing cementitious material source.
Figure XII.9: Average percent differences in compressive strength based on changing cementitious material source.
0%
10%
20%
30%
40%
50%
60%
Slag
1-2
Slag
1-2
Slag
1-2
FA1-
2
FA1-
3
FA2-
3
FA1-
2
FA1-
3
FA2-
3
FA1-
2
FA1-
3
FA2-
3
1 , 3 2 4 Matrix 1 and 3 Matrix 2 Matrix 4
Perc
ent D
iffer
ence
Cementitious Material Source Effect on
Compressive Strength
GG1
GG2
CS1
CS2
CS3
0%
10%
20%
30%
40%
50%
60%
Slag 1-2 Fly Ash 1-2-3
Perc
ent D
iffer
ence
Average Percent Differences in Compressive Strength Based on Changing Concrete
Constituents
Average

125
Appendix XIII Data Analysis Example Adjusted for Air Content Compressive Strength For this example 90 Day compressive strength data adjusted for air content was used. The individual coarse aggregates were first directly compared based on their concrete compressive strengths adjusted for air content. After applying general forms of the relationships presented below to convert each data point as if the concrete contained 6% air, the average compressive strength of all mixes was reduced by about 380 psi (7.5% if 5000 psi concrete), average modulus of rupture was reduced by about 21 psi (3% if 700 psi concrete), average modulus of elasticity was reduced by about 100 ksi (2.5% if 4000 ksi concrete), and average modulus of elasticity was reduced by about 15 psi (3.5% if 450 psi concrete). Figure XIII.1 below is a matrix of the coarse aggregate comparisons for the ordinary Portland cement (OPC) mixes from mix matrix 1 and their corresponding percent differences calculated with Microsoft Excel. The columns represent the percent difference using the aggregate listed at the top of that column as the base. The maximum and minimum percent differences are for each column are computed at the bottom of the matrix and the largest absolute value of those percent differences is the number used for the averages presented in section 5.3.1 of the report. Figures XIII.2 and XIII.3 are the corresponding percent differences and average percent differences in compressive strength from the previously mentioned matrix.
Figure XIII.1: Excel spreadsheet for calculating percent differences in compressive strength when changing coarse aggregate types (adjusted for air content).
GG1 GG2 GG3 GG4 GG5 GG6 CS1 CS2 CS3 CS4 CS5 CS6 CS7 CS8 CS9GG1 xxxxxx -541.072 -1018.08 -639.261 303.9293 -878.497 -596.628 507.5919 241.4908 -148.02 -0.16569 -289.857 193.4103 -838.419 391.8463GG2 541.0721 xxxxxx -477.003 -98.1892 845.0015 -337.425 -55.5559 1048.664 782.563 393.0519 540.9064 251.2153 734.4825 -297.347 932.9184GG3 1018.075 477.0034 xxxxxx 378.8142 1322.005 139.5787 421.4475 1525.667 1259.566 870.0552 1017.91 728.2187 1211.486 179.6562 1409.922GG4 639.2613 98.18916 -378.814 xxxxxx 943.1906 -239.235 42.63325 1146.853 880.7521 491.241 639.0956 349.4045 832.6716 -199.158 1031.108GG5 -303.929 -845.001 -1322 -943.191 xxxxxx -1182.43 -900.557 203.6626 -62.4385 -451.95 -304.095 -593.786 -110.519 -1142.35 87.91694GG6 878.4968 337.4246 -139.579 239.2355 1182.426 xxxxxx 281.8687 1386.089 1119.988 730.4765 878.3311 588.64 1071.907 40.07752 1270.343CS1 596.628 55.55591 -421.447 -42.6333 900.5574 -281.869 xxxxxx 1104.22 838.1189 448.6078 596.4623 306.7712 790.0384 -241.791 988.4743CS2 -507.592 -1048.66 -1525.67 -1146.85 -203.663 -1386.09 -1104.22 xxxxxx -266.101 -655.612 -507.758 -797.449 -314.182 -1346.01 -115.746CS3 -241.491 -782.563 -1259.57 -880.752 62.43851 -1119.99 -838.119 266.1011 xxxxxx -389.511 -241.657 -531.348 -48.0805 -1079.91 150.3554CS4 148.0203 -393.052 -870.055 -491.241 451.9496 -730.476 -448.608 655.6122 389.5111 xxxxxx 147.8546 -141.837 341.4306 -690.399 539.8665CS5 0.165688 -540.906 -1017.91 -639.096 304.095 -878.331 -596.462 507.7576 241.6565 -147.855 xxxxxx -289.691 193.576 -838.254 392.012CS6 289.8568 -251.215 -728.219 -349.404 593.7862 -588.64 -306.771 797.4487 531.3476 141.8365 289.6911 xxxxxx 483.2671 -548.562 681.7031CS7 -193.41 -734.482 -1211.49 -832.672 110.519 -1071.91 -790.038 314.1816 48.0805 -341.431 -193.576 -483.267 xxxxxx -1031.83 198.4359CS8 838.4192 297.3471 -179.656 199.158 1142.349 -40.0775 241.7912 1346.011 1079.91 690.399 838.2535 548.5624 1031.83 xxxxxx 1230.266CS9 -391.846 -932.918 -1409.92 -1031.11 -87.9169 -1270.34 -988.474 115.7456 -150.355 -539.867 -392.012 -681.703 -198.436 -1230.27 xxxxxx
GG1 GG2 GG3 GG4 GG5 GG6 CS1 CS2 CS3 CS4 CS5 CS6 CS7 CS8 CS9GG1 -10% -20% -12% 5% -17% -11% 8% 4% -3% 0% -5% 3% -16% 6%GG2 9% -10% -2% 13% -7% -1% 16% 13% 7% 9% 4% 12% -6% 15%GG3 17% 9% 7% 21% 3% 8% 23% 20% 15% 17% 13% 20% 3% 22%GG4 11% 2% -8% 15% -5% 1% 18% 14% 8% 11% 6% 13% -4% 16%GG5 -5% -15% -26% -18% -23% -17% 3% -1% -8% -5% -10% -2% -22% 1%GG6 15% 6% -3% 4% 19% 5% 21% 18% 12% 15% 10% 17% 1% 20%CS1 10% 1% -8% -1% 14% -5% 17% 13% 8% 10% 5% 13% -5% 15%CS2 -8% -19% -31% -21% -3% -27% -20% -4% -11% -8% -14% -5% -26% -2%CS3 -4% -14% -25% -16% 1% -22% -15% 4% -7% -4% -9% -1% -21% 2%CS4 2% -7% -17% -9% 7% -14% -8% 10% 6% 2% -2% 5% -13% 8%CS5 0% -10% -20% -12% 5% -17% -11% 8% 4% -3% -5% 3% -16% 6%CS6 5% -5% -15% -6% 9% -11% -6% 12% 8% 2% 5% 8% -11% 11%CS7 -3% -13% -24% -15% 2% -21% -15% 5% 1% -6% -3% -8% -20% 3%CS8 14% 5% -4% 4% 18% -1% 4% 21% 17% 12% 14% 10% 17% 19%CS9 -7% -17% -28% -19% -1% -25% -18% 2% -2% -9% -7% -12% -3% -24%
MaxDiff 17% 9% -3% 7% 21% 3% 8% 23% 20% 15% 17% 13% 20% 3% 22%MinDiff -8% -19% -31% -21% -3% -27% -20% 2% -4% -11% -8% -14% -5% -26% -2%HighDiff 17% -19% -31% -21% 21% -27% -20% 23% 20% 15% 17% -14% 20% -26% 22%
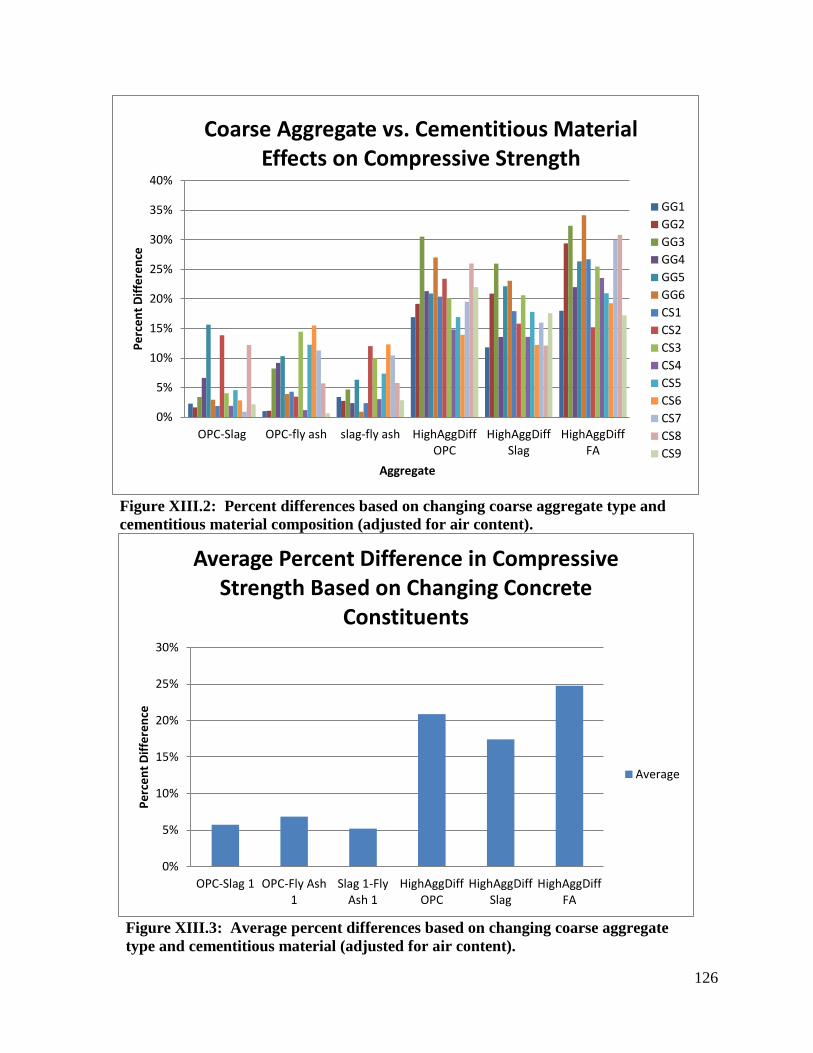
126
Figure XIII.2: Percent differences based on changing coarse aggregate type and cementitious material composition (adjusted for air content).
Figure XIII.3: Average percent differences based on changing coarse aggregate type and cementitious material (adjusted for air content).
0%
5%
10%
15%
20%
25%
30%
35%
40%
OPC-Slag OPC-fly ash slag-fly ash HighAggDiffOPC
HighAggDiffSlag
HighAggDiffFA
Perc
ent D
iffer
ence
Aggregate
Coarse Aggregate vs. Cementitious Material Effects on Compressive Strength
GG1GG2GG3GG4GG5GG6CS1CS2CS3CS4CS5CS6CS7CS8CS9
0%
5%
10%
15%
20%
25%
30%
OPC-Slag 1 OPC-Fly Ash1
Slag 1-FlyAsh 1
HighAggDiffOPC
HighAggDiffSlag
HighAggDiffFA
Perc
ent D
iffer
ence
Average Percent Difference in Compressive Strength Based on Changing Concrete
Constituents
Average

127
The other concrete constituent factors, such as fine aggregate, slag cement type, fly ash brand, and cementitious material blend were compared directly based on the mix matrices described in section 4.3 of the report. Figures XIII.4 and XIII.5 show Excel spreadsheet values for percent differences in compressive strength when changing the previously mentioned concrete constituents adjusted for air content. Figures XIII.6 and XIII.8 show individual percent differences based on changing the previously mentioned concrete constituents for 90 day compressive strength. Figures XIII.7 and XIII.9 show the average percent differences based on changing the previously mentioned concrete constituents. The absolute values of the percent differences were used for the averages presented in section 5.3. The averages appear to be a good representation of the trend and therefore were chosen summarize the data in section 5.3 of the report.
Figure XIII.4: Excel spreadsheet for calculating percent differences in compressive strength when changing cementitious material type (adjusted for air content).
Figure XIII.5: Excel spreadsheet for calculating percent differences in compressive strength when changing cementitious material source (adjusted for air content).
Difference GG1 GG2 GG3 GG4 GG5 GG6 CS1 CS2 CS3 CS4 CS5 CS6 CS7 CS8 CS9OPC-Slag 1 2% 2% -3% -7% 16% -3% -2% 14% -4% -2% -5% -3% 1% -12% 2%
OPC-Fly Ash 1 -1% -1% -8% -9% 10% -4% -4% 3% -14% 1% -12% -15% 11% -6% -1%Slag 1-Fly Ash 1 -3% -3% -5% -2% -6% -1% -2% -12% -10% 3% -7% -12% 10% 6% -3%
GG1 GG2 CS1 CS2 CS3Slag I 2% 3% 7% -8% -2%Slag II 1% 3% 3% 2% -4%FA I 2% -13% -3% 3% -7%FA II 11% -6% -9% 7% -3%FA III -3% -13% -24% 0% -4%Slag I 3% -8% 0% -10% -7%Slag II 5% -6% -2% 10% -20%FA I -6% -28% -12% 1% 6%FA II 12% -19% -15% -14% -7%FA III 3% -29% -30% -5% -8%
GG1 GG2 CS1 CS2 CS3Slag1-2 5% 5% 5% -11% 10%FA1-2 -3% -2% -1% 5% 4%FA1-3 -4% 5% 9% 3% 12%FA2-3 -1% 7% 10% -2% 8%
Slag1-2 4% 5% 1% -2% 8%FA1-2 7% 4% -7% 10% 8%FA1-3 -9% 5% -10% 0% 15%FA2-3 -17% 1% -2% -10% 16%
Slag1-2 8% 7% 4% 9% -2%FA1-2 14% 5% -3% -10% -9%FA1-3 5% 4% -5% -4% -1%FA2-3 -11% -1% -2% 5% 7%
1 and 3
2
4
Cement 1-2
Sand a-b
Mix Matrix Difference Coarse Aggregate
Difference Supplementary
Coarse Aggregate

128
Figure XIII.6: Percent differences in compressive strength based on changing cement source and fine aggregate source (adjusted for air content).
Figure XIII.7: Average percent differences in compressive strength based on changing cement source and fine aggregate source (adjusted for air content).
0%
5%
10%
15%
20%
25%
30%
35%
Slag I Slag II FA I FA II FA III Slag I Slag II FA I FA II FA III
Cement 1-2 Sand A-B
Perc
ent D
iffer
ence
Cement Source and Fine Aggregate Type
Effects on Compressive Strength
GG1
GG2
CS1
CS2
CS3
0%
5%
10%
15%
20%
25%
30%
35%
40%
Cement 1-2 Sand a-b
Perc
ent D
iffer
ence
Average Percent Differences in Compressive Strength Based on Changing Concrete
Constituents
Average
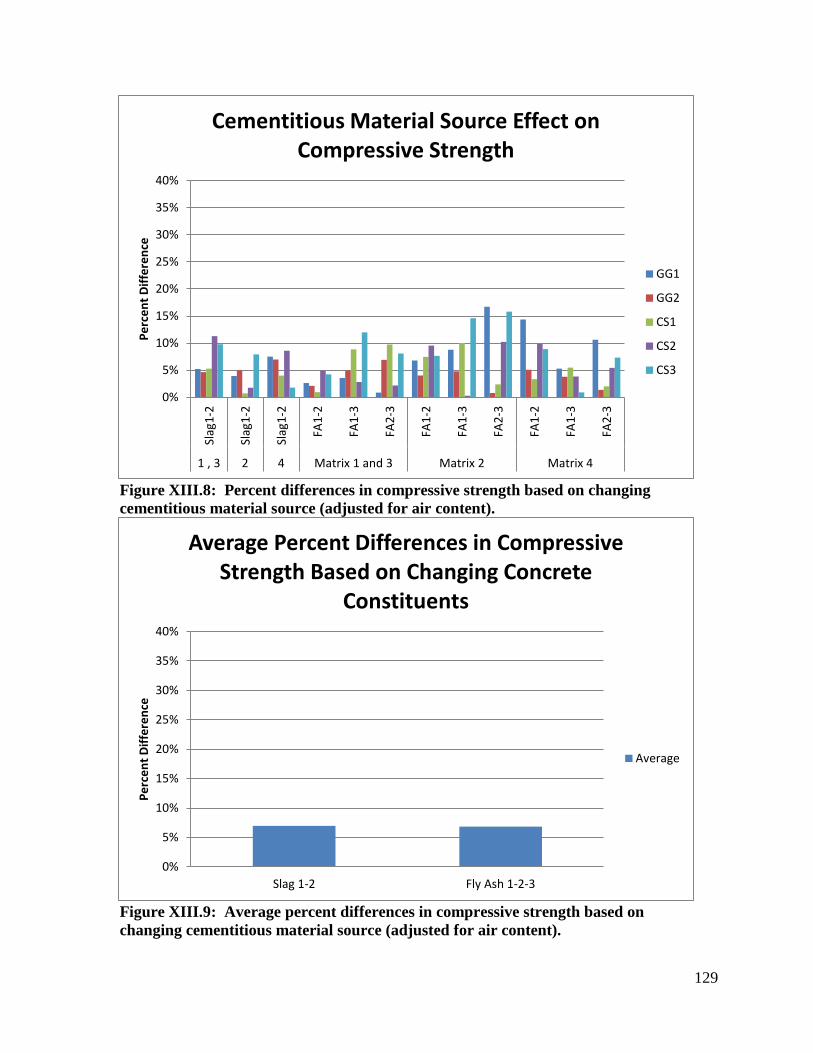
129
Figure XIII.8: Percent differences in compressive strength based on changing cementitious material source (adjusted for air content).
Figure XIII.9: Average percent differences in compressive strength based on changing cementitious material source (adjusted for air content).
0%
5%
10%
15%
20%
25%
30%
35%
40%
Slag
1-2
Slag
1-2
Slag
1-2
FA1-
2
FA1-
3
FA2-
3
FA1-
2
FA1-
3
FA2-
3
FA1-
2
FA1-
3
FA2-
3
1 , 3 2 4 Matrix 1 and 3 Matrix 2 Matrix 4
Perc
ent D
iffer
ence
Cementitious Material Source Effect on
Compressive Strength
GG1
GG2
CS1
CS2
CS3
0%
5%
10%
15%
20%
25%
30%
35%
40%
Slag 1-2 Fly Ash 1-2-3
Perc
ent D
iffer
ence
Average Percent Differences in Compressive Strength Based on Changing Concrete
Constituents
Average

130
Appendix XIV Percent Facture from Splitting Tensile Failure Analysis
Figure XIV.1: Percent fracture values at 7, 14, 28, and 90 days for coarse aggregates classified as glacial gravels (GG1 through GG6) from splitting tensile testing.
Figure XIV.2: Percent fracture values at 7, 14, 28, and 90 days for coarse aggregates classified as crushed stones (CS7 through CS15) from splitting tensile testing.
0%
20%
40%
60%
80%
100%
0 100 200 300 400 500 600 700
Perc
ent F
ract
ure
Split Tesile Strength (psi)
Glacial Gravels Split Tension Test
90 Day
28 Day
14 Day
7 Day
0%
20%
40%
60%
80%
100%
0 100 200 300 400 500 600 700
Perc
ent F
ract
ure
Split Tesile Strength (psi)
Crushed Stone Split Tension Test
90 Day
28 Day
14 Day
7 Day

131
Figure XIV.3: Comparing percent fracture values for coarse aggregates classified as glacial gravels (GG1 through GG6) to coarse aggregates classified as crushed stones (CS7 through CS15) from 7 day splitting tensile testing.
Figure XIV.4: Comparing percent fracture values for coarse aggregates classified as glacial gravels (GG1 through GG6) to coarse aggregates classified as crushed stones (CS7 through CS15) from 14 day splitting tensile testing.
0%
20%
40%
60%
80%
100%
0 100 200 300 400 500 600
Perc
ent F
ract
ure
Split Tesile Strength (psi)
Glacial Gravels vs. Crushed Stone 7 Day Split Tension Test
Glacial Gravel
Crushed Stone
0%
20%
40%
60%
80%
100%
0 100 200 300 400 500 600
Perc
ent F
ract
ure
Split Tesile Strength (psi)
Glacial Gravels vs. Crushed Stone 14 Day Split Tesion Test
Glacial Gravel
Crushed Stone

132
Figure XIV.5: Comparing percent fracture values for coarse aggregates classified as glacial gravels (GG1 through GG6) to coarse aggregates classified as crushed stones (CS7 through CS15) from 28 day splitting tensile testing.
Figure XIV.6: Comparing percent fracture values for coarse aggregates classified as glacial gravels (GG1 through GG6) to coarse aggregates classified as crushed stones (CS7 through CS15) from 90 day splitting tensile testing.
0%
20%
40%
60%
80%
100%
0 100 200 300 400 500 600
Perc
ent F
ract
ure
Split Tesile Strength (psi)
Glacial Gravels vs. Crushed Stone 28 Day Split Tension Test
Glacial Gravel
Crushed Stone
0%
20%
40%
60%
80%
100%
0 100 200 300 400 500 600 700
Perc
ent F
ract
ure
Split Tesile Strength (psi)
Glacial Gravels vs. Crushed Stone 90 Day Split Tensile Strength
Glacial Gravel
Crushed Stone
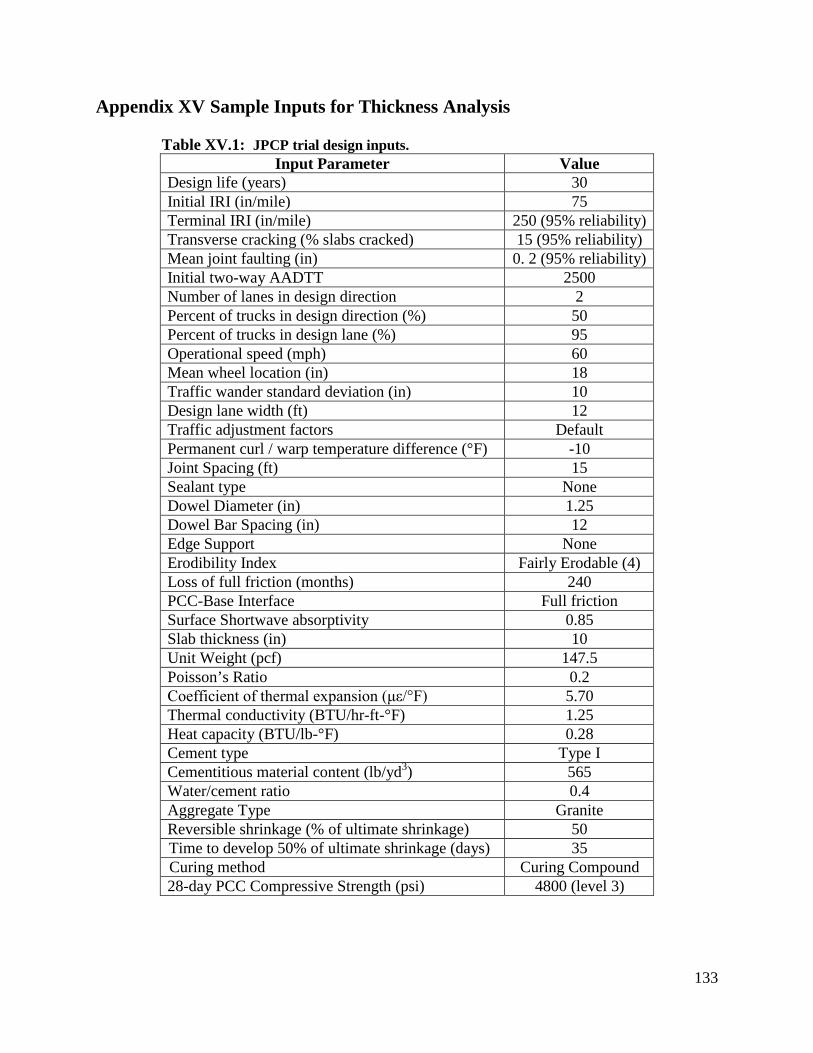
133
Appendix XV Sample Inputs for Thickness Analysis
Table XV.1: JPCP trial design inputs. Input Parameter Value
Design life (years) 30 Initial IRI (in/mile) 75 Terminal IRI (in/mile) 250 (95% reliability) Transverse cracking (% slabs cracked) 15 (95% reliability) Mean joint faulting (in) 0. 2 (95% reliability) Initial two-way AADTT 2500 Number of lanes in design direction 2 Percent of trucks in design direction (%) 50 Percent of trucks in design lane (%) 95 Operational speed (mph) 60 Mean wheel location (in) 18 Traffic wander standard deviation (in) 10 Design lane width (ft) 12 Traffic adjustment factors Default Permanent curl / warp temperature difference (°F) -10 Joint Spacing (ft) 15 Sealant type None Dowel Diameter (in) 1.25 Dowel Bar Spacing (in) 12 Edge Support None Erodibility Index Fairly Erodable (4) Loss of full friction (months) 240 PCC-Base Interface Full friction Surface Shortwave absorptivity 0.85 Slab thickness (in) 10 Unit Weight (pcf) 147.5 Poisson’s Ratio 0.2 Coefficient of thermal expansion (με/°F) 5.70 Thermal conductivity (BTU/hr-ft-°F) 1.25 Heat capacity (BTU/lb-°F) 0.28 Cement type Type I Cementitious material content (lb/yd3) 565 Water/cement ratio 0.4 Aggregate Type Granite Reversible shrinkage (% of ultimate shrinkage) 50 Time to develop 50% of ultimate shrinkage (days) 35 Curing method Curing Compound 28-day PCC Compressive Strength (psi) 4800 (level 3)

134
Figure XV.1: Design layers in MEPDG

Wisconsin Highway Research Program University of Wisconsin-Madison 1415 Engineering Drive 2204 Engineering Hall Madison, WI 53706 608.890.4966 http://wisdotresearch.wi.gov/whrp