Embed Size (px)
Citation preview
Keywords: egg white, molecular weight markers, proteins, SDS-PAGE, wheat
Laboratory-scale Preparation of Potentially Inexpensive Low- and Middle-range Protein Molecular
Weight Markers for SDS-PAGE
Institute of Chemistry, College of Arts and Sciences University of the Philippines Los Baños, College, Laguna 4031 Philippines
Mariam C. Recuenco* and Kennethjer G. Alejo
Protein molecular weight (MW) markers for sodium dodecyl sulfate-polyacrylamide gel electrophoresis (SDS-PAGE) were prepared from proteins extracted and fractionated from egg white, skim milk, porcine serum, and wheat flour. Fractionation methods employed include adsorption on bentonite, isoelectric pH precipitation, ammonium sulfate precipitation, and acetone fractionation. The % recoveries based on reported yields of the egg white proteins – lysozyme, ovotransferrin, and ovalbumin – were 9.70%, 116.51%, and 25.34%, respectively. The % recoveries for caseins from skim milk, porcine albumin, and glutenin fraction from wheat were 93.00%, 0.15%, and 0.54%, respectively. Fractions from egg white, caseins, and porcine albumin (EMPA) were combined to prepare the low-range MW marker – with EMPA consisting of seven proteins and MW range of 11.8–77.1 kDa. The protein fraction from wheat (W) with six components and MW range of 16.2–106.3 kDa was prepared as the middle-range marker (WH). Using a commercial marker as a primary standard, the MWs of the markers’ components were established. The prepared markers were then used as standards to estimate the experimental MWs of some common proteins. The experimental MWs were within 1.2–11.0% difference from the experimental MWs calculated from using the commercial marker as standard. The MWs were also within <13% error from the theoretical MWs, with lower % errors for the proteins with MWs within the markers’ MW range. While some components – specifically the egg white proteins – could be present in their glycosylated forms, both markers showed the ladder profile – consistently suggesting stability of the components under heating, denaturing, and reducing conditions even with some possible effects of glycosylation on some components.
Philippine Journal of Science148 (2): 373-384, June 2019ISSN 0031 - 7683Date Received: 12 Nov 2018
*Corresponding author: [email protected]
INTRODUCTIONLaemmli SDS-PAGE is a widely used technique in separating components of protein mixtures, evaluating sample purity, and estimating MWs (Laemmli 1970). In the Laemmli system, the surfactant (SDS) denatures proteins and coats them with negative charges – resulting in similar charge-to-mass ratios. Thus, the mobility of polypeptide chains in the gel is largely due to their sizes.
The gel matrix for SDS-PAGE is polyacrylamide, which is made up to different concentrations to produce different pore sizes for a variety of separating conditions. The Laemmli system is discontinuous, with buffers in the gels and the tank having different pHs.
MWs of proteins are determined by comparison with proteins of known MWs or protein markers run together in the gel. A plot of log MWs of the protein standards against their migration distances or relative mobility is
373
generated and MWs of samples are extrapolated from the plot (Weber and Osborn 1975). MW markers containing proteins of known sizes appear in a ladder-like array of bands having well-defined intensities. Proteins commonly used as standards include beta-galactosidase (120 kDa), phosphorylase B (94 kD), bovine serum albumin (BSA) (67 kDa), ovalbumin (43 kDa), carbonic anhydrase (30 kDa), soybean trypsin inhibitor (20.1 kDa), alpha-lactalbumin (14.4 kDa), and lysozyme (14 kDa). Protein markers are also available in the pre-stained form, with proteins covalently attached to dyes for easy monitoring of the SDS-PAGE run. Currently, companies that manufacture protein MW markers include Sigma, Promega, Fisher Scientific, R and D Scientific, and Bio-Rad. An unstained marker from Bio-Rad containing 10 proteins of MW range 10–250 kDa costs about USD 96 or approximately Php 5200 (Bio-Rad 2018). In the Philippines, protein markers are usually acquired through importation or purchase through local distributors of the said companies. To our knowledge, there are no manufacturers of protein MW markers in the country.
Some strategies for the preparation of protein markers include the production of recombinant proteins through expression from gene constructs and covalent attachment of various dyes. Some alternative methods were suggested in the studies of Sato et al. (1988) and Doucet and Beauregard (2001). Sato et al. (1988) reported that globin subunits from hemoglobin could be photopolymerized in the presence of protoporphyrin and oxygen to produce a mixture of globin polymers of various MWs. Doucet and Beauregard (2001) prepared a protein ladder using a specifically designed construct to produce a protein with a mass of 11.3 kDa that is capable of intra- and intermolecular disulfide bridges. After oxidation-reduction treatments, oligomerized proteins could be separated and used to prepare a protein ladder.
In this study, we used inexpensive protein sources – egg white, skim milk, porcine blood, and wheat – to prepare protein MW markers for SDS-PAGE. We aimed to obtain some well-studied proteins, which have long been used as components in protein MW markers. Egg white contains the following proteins: ovalbumin, the most abundant; ovotransferrin or conalbumin, a glycoprotein; and lysozyme, an antimicrobial enzyme. Skim milk contains the caseins, a family of phosphoproteins; and lactalbumin, also known as whey protein. Pig’s blood – the source of serum albumin, an abundant protein in the plasma – is widely available in local markets. Using these sources, the marker proteins would have MWs from ~14 kDa to ~70kDa.
Wheat was considered as a source of high MW components for the marker based on an SDS-PAGE image from Melas et al. (1994). Wheat contains glutenins, which are a group of proteins constituting 47% of the total proteins
(Bushuk 1994). The glutenin subunits (GS) interact via disulfide bonds and other forces to account for a variety of molecular masses, giving rise to the high molecular weight (HMW) and low molecular weight (LMW) GS. In the study of Ng and Bushuk (1987), the SDS-PAGE profile of reduced glutenins of the wheat cultivar Marquis was used as a secondary reference standard for the analysis of subunits from other wheat cultivars, after being calibrated against primary protein standards.
In this study, protein fractionation techniques such as adsorption on a clay mineral, isoelectric pH precipitation, ammonium sulfate precipitation, and acetone fractionation were employed to obtain proteins from the selected sources. This laboratory preparation of MW markers may be useful in research or academic institutions in need of more economical research reagents.
MATERIALS AND METHODS
MaterialsPotassium chloride, pyridine, citric acid, ammonium sulfate, sodium hydroxide (NaOH), hydrochloric acid (HCl), propanol, dithiothreitol (DTT), acetone, EDTA, Tris base, glycine, acrylamide, and glacial acetic acid were obtained from Sigma-Aldrich. Eggs were bought from a store near the UP Los Baños gate. Nestlé Non-fat Milk High Calcium (Nestlé Philippines) was used as the source of caseins. Pig’s blood was bought from the Los Baños Public Market. Cream All Purpose Flour (Food Industries, Inc.) was used as the source of wheat glutenins. The commercial protein marker used was the PM2500 ExcelBand™ 3-color Regular Range Protein Marker (SMoBio, Taiwan), a ready-to-use three-color protein standard with 10 pre-stained proteins and MW range 10–180 kDa.
Fractionation of ProteinsEgg white proteins – lysozyme, ovotransferrin, and ovalbumin. The lysozyme fraction of the egg white was obtained using the method described by Alderton et al. (1945). Filtered 100 mL egg white and 15 mL 10% suspension of bentonite in 1% KCl were stirred for 5 min while avoiding foaming. The suspension was centrifuged at 4 °C for 15 min. The bentonite with bound lysozyme was washed with phosphate buffer pH 7.5, and washed three times with 5% aqueous pyridine. Lysozyme was eluted with 5% pyridine pH 5.00. Lysozyme was precipitated by adding ammonium sulfate to a final concentration of 2.6 M. The precipitate was dissolved in water, dialyzed for 24 h, and freeze-dried using FreeZone –105 °C 4.5 L Benchtop Freeze Dry System.
Recuenco and Alejo: SDS-PAGE Protein MarkersPhilippine Journal of ScienceVol. 148 No. 2, June 2019
374
The ovomucin, ovotransferrin, and ovalbumin fractions were obtained following the methods by Abeyrathne et al. (2014). The lysozyme-free fraction obtained after bentonite adsorption was adjusted to pH 4.75 using 3 M HCl to precipitate ovomucin. The ovomucin fraction was collected and washed three times using 10 volumes of distilled water.
Three volumes each of 5% (w/v) ammonium sulfate and 2.5% (w/v) citric acid pH 2.90 were added to the ovomucin-free supernatant. The mixture was kept at 4 °C for 12 h to precipitate ovotransferrin. The precipitate was dissolved in water and reprecipitated with three volumes each of 2% ammonium sulfate and 1.5% citric acid pH 3.35. The final ovotransferrin precipitate was dialyzed against distilled water and then freeze-dried before storage. The supernatants after ovotransferrin precipitation were pooled, dialyzed, concentrated, and then heated for 15 min at 70 °C to precipitate impurities. The final supernatant which contains ovalbumin was freeze-dried before storage.
Milk proteins. Caseins were precipitated from skim milk according to the modified method of Shammet et al. (1992). Nestlé Non-fat skim milk (100 mL) was acidified to pH 4.6 using 1 M HCl. The precipitate was washed with distilled water three times, resuspended in water, and redissolved by adjusting the pH to 7.0 by slow addition of 1 M NaOH. The caseins were reprecipitated by pH adjustment to 4.6 using 1 M HCl. The final precipitates were washed with water, freeze-dried, and then stored.
Porcine serum albumin (PSA). PSA was isolated following the protocol by Odunuga and Shazhko (2013) used for BSA isolation. Whole porcine blood was centrifuged at room temperature to obtain clean serum. The serum was cooled to 4 °C and subjected to ammonium sulfate precipitation by adding solid ammonium sulfate to 40%, 50%, 60%, and 70% saturation values. The precipitated proteins at each saturation step were dialyzed and then freeze-dried before storage.
Wheat proteins. Wheat glutenins were isolated following the procedure by Melas et al. (1994). The flour sample, Cream All Purpose Flour, was defatted using dichloromethane. A six-gram (6 g) sample of defatted flour was washed three times with 150 mL 50% v/v isopropanol for 30 min at 60 °C. The suspension was centrifuged for 15 min at room temperature. The flour residue was suspended in 50% (v/v) isopropanol containing 0.08 M Tris-HCl buffer pH 8.0 containing 1% (w/v) DTT at 60 °C for 30 min. The suspension was centrifuged, and the supernatant was collected. The glutenins were precipitated from the supernatant by adding acetone to concentrations 10%, 20%, 30%, and 40%. The precipitates obtained were stored for further analysis.
Analysis of ProteinsThe protein contents were determined using the Bradford assay using BSA to generate a calibration curve (Bradford 1976). The mixtures of samples and Bradford reagent were read at 595 nm using Fisherbrand™ GO UV/Vis Microplate Spectrophotometer.
SDS-PAGE was performed according to the protocol of Laemmli (1970). Acrylamide concentration was 12.5% for the resolving gel and 4% for the stacking gel. Coomassie Brilliant Blue staining solution was used to visualize the protein bands.
Analysis of SDS-PAGE ProfilesThe MWs of protein components were determined against a calibration curve derived from the commercial protein marker. Image J (Rueden et al. 2017) was used to measure the relative migration of the markers’ components. The MW assigned for each band was the average of at least 24 measurements. Precision among the calculated MWs was assessed by the standard deviation (SD). Using the prepared markers as standards, the average experimental MWs of test proteins, BSA, caseins, and hemoglobin were calculated. For comparisons between the experimental and the literature/theoretical MWs, percent errors were calculated. To compare the experimental MWs from using the prepared and commercial markers as standards, percent differences were calculated.
RESULTS Table 1 shows the yields of proteins obtained after the major fractionation steps and % recoveries based on literature and theoretical yields. From 400 mL egg white, the protein fractions obtained were 0.14 g lysozyme (LY), 5.29 g ovotransferrin (OT) and 6.02 g ovalbumin (OA). The % recoveries of these proteins compared to literature were 9.70%, 116.51%, and 25.34%, respectively. From 100 mL skim milk, 2.74 g of the casein fraction was obtained (93% recovery). From 100 mL porcine serum, the 60–70% ammonium sulfate cut obtained 2.38 mg of the albumin fraction (PSA), which is 0.15% of the literature total albumins. From 6 g of defatted wheat flour, the 40% acetone cut yielded 0.81 mg proteins. This was 0.54% of the estimated and expected amount of LMW-GS in Melas et al. (1994).
Figure 1A–D shows the SDS-PAGE profiles of the different protein fractions from egg white, skim milk, porcine serum, and wheat flour. From egg white (Figure 1A), the LY fraction showed one component with MW of ~11.7 kDa. The OT fraction had three components, with MWs of 71.6 kDa – assigned to ovotransferrin –
Philippine Journal of ScienceVol. 148 No. 2, June 2019
Recuenco and Alejo: SDS-PAGE Protein Markers
375

and the 37.1 kDa and 31.6 kDa components (Figure 1A). The fraction OA had two components – with MWs of 37.1 assigned to ovalbumin and 31.6 kDa to ovomucoid (OM). From skim milk (Figure 1B), the caseins fraction (C) showed three components with MWs of 30.4 kDa, 25.5 kDa ascribed to the caseins (C1 and C2), and 15.2 kDa attributed to lactalbumin (LA). From porcine serum (Figure 1C), the major fraction for the marker preparation was the 70% ammonium sulfate cut with one component of MW 65.8 kDa designated as PSA. From the wheat proteins (Figure 1D), the 40% acetone precipitate showed six components – designated as wheat subunits 1–6 or W1–W6 with the MWs ranging from ~16 – 112 kDa.
The protein fractions from egg white (LY, OT, and OA); milk fraction containing C1, C2, and LA; and the PSA from 70% AS cut were combined in different ratios to prepare the low-range MW marker. In Figure 2A, the low-range marker – named as the EMPA marker – was a mixture containing seven proteins: OT, PSA, OA, C1, C2, LA, and LY (arranged from highest to lowest MWs). Loading 3–4 µL of the EMPA marker was sufficient to show all the bands (Figure 2A). The calibrated MWs of the components were 77.1 kDa, 65.7 kDa, 42.7 kDa, 30.2 kDa, 23.3 kDa, 14.6 kDa and 11.8 kDa against the commercial marker used as primary standard (Table 2, Figures 2A, and Figure 3A). Table 2 shows the comparison between the experimental MWs and theoretical MWs of the EMPA and WH markers’ components. Among the proteins in EMPA were lysozyme and the caseins having experimental MWs that were quite different from their theoretical MWs by ~17–31%. In the wheat fraction, though it was not possible to make certain the identities of
Figure 1. SDS-PAGE analysis of protein fractions from egg white (A), skim milk (B), porcine serum (C), and wheat flour (D). The gels shown are 12.5% gels. Protein fractions, individual components, and their MWs (kDa) are indicated: M – marker; EW – egg white; LY – lysozyme; OT – ovotransferrin; OA – ovalbumin; OM – ovomucoid; C1 – casein 1; C2 – casein 2; LA – lactalbumin; 1:20 – 20x diluted casein isolate; 1:10 – 10x diluted casein isolate; BSA – bovine serum albumin; IpH – IpH precipitate at pH 6.0; 40%, 50%, 60%, 70% – precipitates from ammonium sulfate fractionations; PSA – porcine serum albumin; W – wheat flour protein isolated at 40% acetone concentration; 1:5 – 5x diluted W; 40%, 30%, 20% and 10% – precipitates obtained from various acetone concentrations.
Table 1. Actual yields from fractionation of egg white, skim milk, porcine serum, and wheat proteins – and their comparison with literature and/or theoretical yields.
Starting material and amount
Protein fraction and abbreviation
Amount of protein isolated
Actual% yielda
Literature/ theoretical %
yield Reference(s) % Recoveryb
Egg white 400 mL (~410 g) Lysozyme (LY) 0.14 g 0.033 0.34 Abeyrathne et al. 2014
9.70
Ovotransferrin (OT) 5.29 g 1.27 1.09 Abeyrathne et al. 2014
116.51
Ovalbumin (OA) 6.02 g 1.47 5.8 Abeyrathne et al. 2014
25.34
Skim milk 100 mL (~103 g) Caseins 2.74 g 2.66 2.86 Kailasapathy 2016 93.00
Porcine serum 100 mL 60–70% ammonium sulfate precipitate albumin fraction (PSA)
2.38 mg 0.00238 (% w/v)
2.6 (% w/v total albumins)
Michael 1962 0.15
Wheat flour 6 g 40% acetone precipitate 0.81 mg 0.0135 2.5 Melas et al. 1994 0.54
a% yield by weight, unless specified; (weight protein (g) /weight (g) or volume (mL) starting material) * 100%b(Actual yield/literature or theoretical yield) * 100%
Recuenco and Alejo: SDS-PAGE Protein MarkersPhilippine Journal of ScienceVol. 148 No. 2, June 2019
376
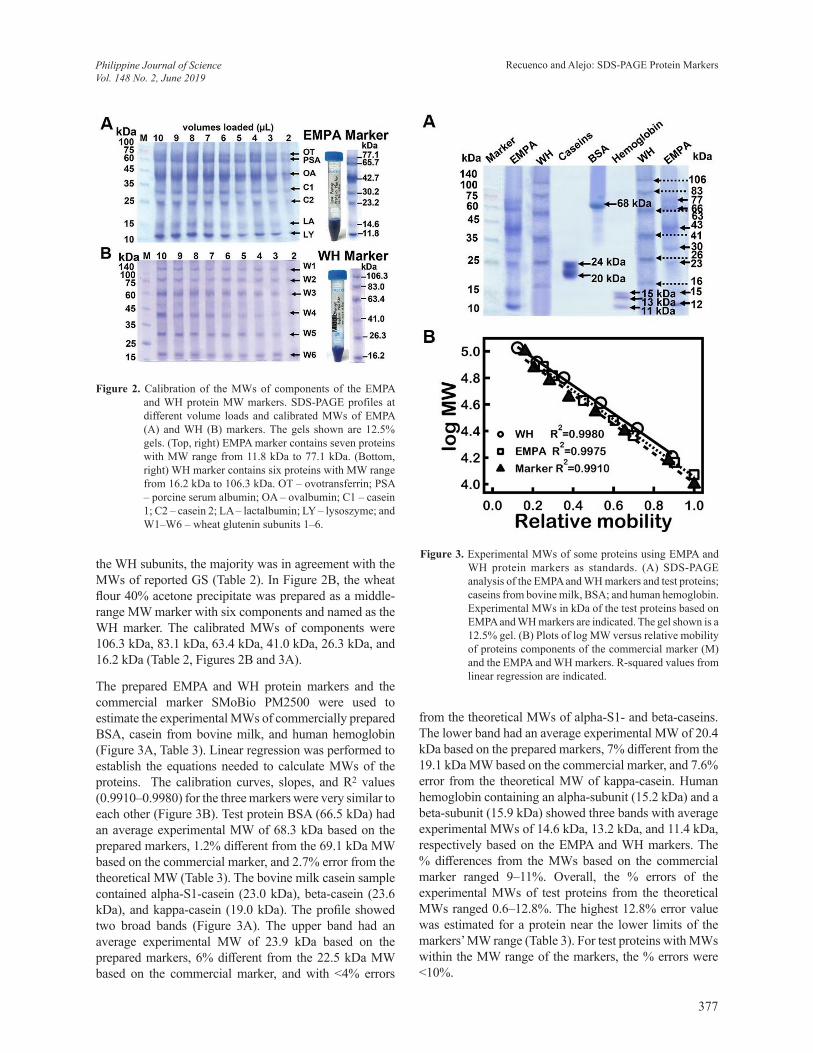
Figure 2. Calibration of the MWs of components of the EMPA and WH protein MW markers. SDS-PAGE profiles at different volume loads and calibrated MWs of EMPA (A) and WH (B) markers. The gels shown are 12.5% gels. (Top, right) EMPA marker contains seven proteins with MW range from 11.8 kDa to 77.1 kDa. (Bottom, right) WH marker contains six proteins with MW range from 16.2 kDa to 106.3 kDa. OT – ovotransferrin; PSA – porcine serum albumin; OA – ovalbumin; C1 – casein 1; C2 – casein 2; LA – lactalbumin; LY – lysoszyme; and W1–W6 – wheat glutenin subunits 1–6.
the WH subunits, the majority was in agreement with the MWs of reported GS (Table 2). In Figure 2B, the wheat flour 40% acetone precipitate was prepared as a middle-range MW marker with six components and named as the WH marker. The calibrated MWs of components were 106.3 kDa, 83.1 kDa, 63.4 kDa, 41.0 kDa, 26.3 kDa, and 16.2 kDa (Table 2, Figures 2B and 3A).
The prepared EMPA and WH protein markers and the commercial marker SMoBio PM2500 were used to estimate the experimental MWs of commercially prepared BSA, casein from bovine milk, and human hemoglobin (Figure 3A, Table 3). Linear regression was performed to establish the equations needed to calculate MWs of the proteins. The calibration curves, slopes, and R2 values (0.9910–0.9980) for the three markers were very similar to each other (Figure 3B). Test protein BSA (66.5 kDa) had an average experimental MW of 68.3 kDa based on the prepared markers, 1.2% different from the 69.1 kDa MW based on the commercial marker, and 2.7% error from the theoretical MW (Table 3). The bovine milk casein sample contained alpha-S1-casein (23.0 kDa), beta-casein (23.6 kDa), and kappa-casein (19.0 kDa). The profile showed two broad bands (Figure 3A). The upper band had an average experimental MW of 23.9 kDa based on the prepared markers, 6% different from the 22.5 kDa MW based on the commercial marker, and with <4% errors
Figure 3. Experimental MWs of some proteins using EMPA and WH protein markers as standards. (A) SDS-PAGE analysis of the EMPA and WH markers and test proteins; caseins from bovine milk, BSA; and human hemoglobin. Experimental MWs in kDa of the test proteins based on EMPA and WH markers are indicated. The gel shown is a 12.5% gel. (B) Plots of log MW versus relative mobility of proteins components of the commercial marker (M) and the EMPA and WH markers. R-squared values from linear regression are indicated.
from the theoretical MWs of alpha-S1- and beta-caseins. The lower band had an average experimental MW of 20.4 kDa based on the prepared markers, 7% different from the 19.1 kDa MW based on the commercial marker, and 7.6% error from the theoretical MW of kappa-casein. Human hemoglobin containing an alpha-subunit (15.2 kDa) and a beta-subunit (15.9 kDa) showed three bands with average experimental MWs of 14.6 kDa, 13.2 kDa, and 11.4 kDa, respectively based on the EMPA and WH markers. The % differences from the MWs based on the commercial marker ranged 9–11%. Overall, the % errors of the experimental MWs of test proteins from the theoretical MWs ranged 0.6–12.8%. The highest 12.8% error value was estimated for a protein near the lower limits of the markers’ MW range (Table 3). For test proteins with MWs within the MW range of the markers, the % errors were <10%.
Philippine Journal of ScienceVol. 148 No. 2, June 2019
Recuenco and Alejo: SDS-PAGE Protein Markers
377
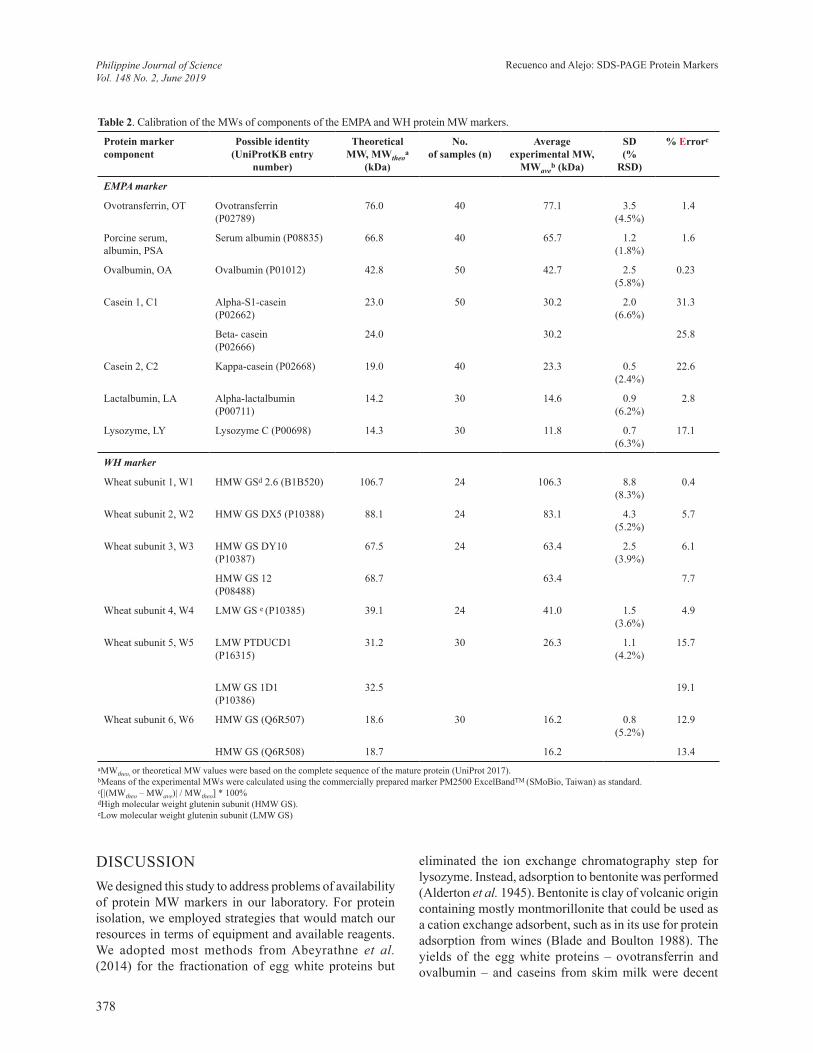
Table 2. Calibration of the MWs of components of the EMPA and WH protein MW markers.
Protein marker component
Possible identity(UniProtKB entry
number)
Theoretical MW, MWtheo
a
(kDa)
No. of samples (n)
Average experimental MW,
MWaveb (kDa)
SD (%
RSD)
% Errorc
EMPA marker
Ovotransferrin, OT Ovotransferrin(P02789)
76.0 40 77.1 3.5 (4.5%)
1.4
Porcine serum, albumin, PSA
Serum albumin (P08835) 66.8 40 65.7 1.2 (1.8%)
1.6
Ovalbumin, OA Ovalbumin (P01012) 42.8 50 42.7 2.5 (5.8%)
0.23
Casein 1, C1 Alpha-S1-casein(P02662)
23.0 50 30.2 2.0 (6.6%)
31.3
Beta- casein(P02666)
24.0 30.2 25.8
Casein 2, C2 Kappa-casein (P02668) 19.0 40 23.3 0.5(2.4%)
22.6
Lactalbumin, LA Alpha-lactalbumin (P00711)
14.2 30 14.6 0.9(6.2%)
2.8
Lysozyme, LY Lysozyme C (P00698) 14.3 30 11.8 0.7(6.3%)
17.1
WH marker
Wheat subunit 1, W1 HMW GSd 2.6 (B1B520) 106.7 24 106.3 8.8(8.3%)
0.4
Wheat subunit 2, W2 HMW GS DX5 (P10388) 88.1 24 83.1 4.3(5.2%)
5.7
Wheat subunit 3, W3 HMW GS DY10(P10387)
67.5 24 63.4 2.5(3.9%)
6.1
HMW GS 12(P08488)
68.7 63.4 7.7
Wheat subunit 4, W4 LMW GS e (P10385) 39.1 24 41.0 1.5(3.6%)
4.9
Wheat subunit 5, W5 LMW PTDUCD1(P16315)
31.2 30 26.3 1.1(4.2%)
15.7
LMW GS 1D1(P10386)
32.5 19.1
Wheat subunit 6, W6 HMW GS (Q6R507) 18.6 30 16.2 0.8(5.2%)
12.9
HMW GS (Q6R508) 18.7 16.2 13.4aMWtheo, or theoretical MW values were based on the complete sequence of the mature protein (UniProt 2017).bMeans of the experimental MWs were calculated using the commercially prepared marker PM2500 ExcelBandTM (SMoBio, Taiwan) as standard.c[|(MWtheo – MWave)| / MWtheo] * 100%dHigh molecular weight glutenin subunit (HMW GS). eLow molecular weight glutenin subunit (LMW GS)
DISCUSSIONWe designed this study to address problems of availability of protein MW markers in our laboratory. For protein isolation, we employed strategies that would match our resources in terms of equipment and available reagents. We adopted most methods from Abeyrathne et al. (2014) for the fractionation of egg white proteins but
eliminated the ion exchange chromatography step for lysozyme. Instead, adsorption to bentonite was performed (Alderton et al. 1945). Bentonite is clay of volcanic origin containing mostly montmorillonite that could be used as a cation exchange adsorbent, such as in its use for protein adsorption from wines (Blade and Boulton 1988). The yields of the egg white proteins – ovotransferrin and ovalbumin – and caseins from skim milk were decent
Recuenco and Alejo: SDS-PAGE Protein MarkersPhilippine Journal of ScienceVol. 148 No. 2, June 2019
378

Table 3. Experimental MWs of some common proteins estimated by using the prepared markers (EMPA and WH) and a commercial protein marker as standards, and comparisons of the proteins’ experimental MWs with their theoretical MWs.
Protein sample and components
Theoretical MW, MWtheo
a (kDa)Experimental MW b (kDa) %
Differencec %Errord
MWPM MWEMPA MWWH MWEMPA-WH
BSA 66.5 69.1 66.3 70.3 68.3 1.2 2.7
Bovine casein
Alpha-S1-casein 23.0 22.5 23.8 23.9 23.9 5.8 3.7
Beta-casein 24.0 22.5 23.8 23.9 23.9 5.8 0.63
Kappa-casein 19.0 19.1 20.7 20.2 20.4 6.8 7.6
Human hemoglobin
Beta subunit 15.9 13.1 14.3 14.8 14.6 10.5 8.5
Alpha subunit 15.2 12.1 13.2 13.3 13.2 9.1 12.8
- 10.3 11.2 11.6 11.4 10.1 -aMWtheo, or theoretical MW values were based on the complete sequence of the mature protein (UniProt 2017).bThe experimental MWs were calculated using three different protein markers as standards. The markers were indicated in the subscripts: MWPM for the commercially prepared marker PM2500 ExcelBandTM (SMoBio, Taiwan); MWEMPA for EMPA marker; MWWH for WH marker; and MWEMPA-WH for the average of MWEMPA and MWWH.c|(MWPM – MWEMPA-WH) / ((MWPM + MWEMPA-WH)/2)| * 100%d|(MWtheo – MWEMPA-WH) / MWtheo| * 100%
but yields obtained for lysozyme, porcine albumin, and wheat glutenins were low. Losses could occur in certain steps such as in dialysis and subsequent concentration by freeze-drying, and during separation of fractions after precipitation and centrifugation steps.
The lysozyme component of EMPA was calibrated to ~11.8 kDa, 17% lower than the theoretical MW of 14.4 kDa. On the other hand, the caseins – alpha-S1-, and beta-caseins – were calibrated to have MWs 20–31% larger than their theoretical MWs. Lysozyme and the caseins were reported to exhibit anomalous behavior in SDS-PAGE (Dunker and Rueckert 1969, Creamer and Richardson 1984). Lysozyme could sometimes be seen around the ~13 kDa region (Dunker and Rueckert 1969). A likely explanation for its increased mobility was partial digestion or degradation, although this could not be confirmed. Factors that could affect mobility and discrepancies between literature and apparent MWs in SDS-PAGE include chain unfolding, intrinsic charges, SDS binding (Dunker and Rueckert 1969), pH, buffer, and salts (Cugia et al. 2013). The lower MW assigned may have also been a consequence of the slight variations in batches of gels, buffers, and running conditions during independent experiments. Both alpha-S1- and beta-caseins were reported to migrate more slowly than expected (Creamer and Richardson 1984). Possible reasons cited were the lower net negatives charge per unit protein and larger than expected hydrodynamic sizes (Creamer and Richardson 1984).
To obtain a high MW component, we tried isolating myosin from chicken muscle. However, the yields were very low. We then considered the high MW glutenin
subunits (HMW-GS) from wheat based on an SDS-PAGE image from Melas et al. (1994). Wheat was shown to have at least three HMW-GS that could be separated from the low MW-GS (Melas et al. 1994). The HMW-GS could be precipitated with acetone until 40% concentration. Beyond 40%, the LMW-GS would increase in the precipitate. To obtain the HMW-GS, we performed addition of acetone in 10% increments until 40%. The 10–30% fractions had components that seem to include the various components with MW starting from ~26 kDa, in addition to the HMW-GS. At the 40% acetone cut, we observed six well-spaced bands with almost similar intensities. The 40% cut as suggested by Melas et al. (1994) seemed to be the boundary for separating the HMW-GS from the LMW-GS. Although we could not separate HMW-GS as neatly as in the Melas et al. (1994) study, the appearance of the six well-spaced bands from wheat resulted in the preparation of a second marker with a range of 16–106 kDa. The process of preparing markers became significantly shortened. The protocol had been performed twice and the results were reproducible. To make the process more economical, for future studies, we would consider other reducing agents that are less expensive than DTT such as mercaptoethanol or glutathione (Bernacka-Mieleszko and Kaczkowski 1975, Li et al. 2004). Eliminating DTT during the isolation may also be explored since the SDS-PAGE sample buffers already contain mercaptoethanol or DTT. Wheat flour – although widely available and used in the Philippines in baked and other products – comes from wheat, which is not produced in the country (Lyddon 2016). A possible local alternative could be jackfruit seed as it was reported to have high glutelin content (Ulloa et al. 2017).
Philippine Journal of ScienceVol. 148 No. 2, June 2019
Recuenco and Alejo: SDS-PAGE Protein Markers
379

The prepared markers were used to estimate the experimental MWs of some common proteins: BSA, caseins, and hemoglobin. It showed that the experimental MWs calculated were comparable to the MWs using the commercial marker as a reference based on the % difference values between 1.2–10.5%, as shown in Table 3. This demonstrated that the prepared markers may be used as a substitute for the commercial marker in preliminary SDS-PAGE experiments. The % errors of <10% from the theoretical MWs were acceptable, particularly for proteins with MWs within the marker range. Larger % errors may be expected for proteins with apparent MWs near the lower and upper MW ranges of the markers. The appearances of bands were reliable in Coomassie Brilliant Blue staining.
The use of single concentration acrylamide gels was mainly due to better consistency of preparations compared to casting gradient gels, in addition to more efficient use of our resources. Using one concentration, we could assess better the electrophoretic mobility by the polypeptide components. In the calibration of the MWs of the markers, electrophoretic mobility variations ranged from 1.8% to 6.8%. Weber et al. (1972) cited that electrophoretic mobility in SDS-PAGE is highly reproducible with possible variations between 5-10% due to small differences when prepared in different batches and current loads. These variations in mobility will not affect MW determination provided that standard proteins are always run at the same time as the unknown (Weber et al. 1972). A 4–20% gradient would have been more appropriate to resolve the protein mixtures for comparison with acceptable commercial standards. Gradient gels allow runs containing both large and small molecules spanning wide MW ranges (Garfin 2003). Gradient gels are good for assessing complex protein mixtures but they cannot match the resolution obtainable with an appropriate single-concentration gel (Garfin 2003). For laboratories with limited resources, disadvantages include the availability of gradient gels and gradient maker apparatus as well as higher costs for pre-cast gels. Aside from these, we found that the single concentration gel of 12.5% acrylamide to be sufficient for the expected MW ranges of the proteins we intended to isolate.
A commercially prepared pre-stained marker had been used to calibrate the prepared markers. Pre-stained markers are generated by attaching dyes to the protein components, while multicolored markers have been developed to solve the problem of identifying the individual components (Compton et al. 2002). The dye labels could cause differences in migrations of the components compared to the unstained ones. Manufacturers highly recommend calibrating the pre-stained marker MWs against unstained protein markers.
Also, adjustments on the MWs of the components in different conditions are specified by manufacturers. In the study of Compton et al. (2002), attachment of Remazol reactive textile dyes to individual proteins had minimal effect on their electrophoretic mobility. The differences in the estimated MWs of labeled and unlabeled were less than 4%. For the pre-stained marker PM2500 ExcelBand from SMoBio in this study, the possible differences in mobility of the bands range 2.5–7.0% under different buffer compositions. We did not perform calibration of the pre-stained marker against an unstained marker and instead used the manufacturer’s MWs for the Tris-glycine system for calibrating our markers. This may add to the variations in MW estimates of proteins being studied. We emphasize that the prepared markers may not be able to provide the very high accuracy given by electrophoretic methods using with professionally made markers or those from chromatography or mass spectrometry. Nevertheless, the majority of MWs assigned to the markers’ components – with the exception of caseins and lysozyme – were close to their theoretical MWs (Table 2, Figure 2), and good estimates of MWs for the test proteins were obtained (Table 3).
The proteins in the EMPA marker, lysozyme, ovotransferrin, and ovalbumin may exist in their glycosylated forms. Egg white lysozyme was reported to have a glycosylated form with 18 kDa MW, 3.6 kDa larger than the mature form (Trudel and Asselin 1995). However, with the size obtained for the lysozyme fraction, it was likely that the nonglycosylated form was obtained. Also, various literature had shown that the MWs of laboratory-prepared lysozyme were close to the theoretical 14.4 kDa MW (Abeyrathne et al. 2014, Shibusawa et al. 2001, Hurst et al. 1992). Non-enzymatic glycation experiments also demonstrated that prolonged treatments with sugars may be necessary to effect oligomerization of lysozyme and to observe significant changes in the MW (Ghosh et al. 2013). Our experimental conditions did not use monosaccharides that could promote non-enzymatic glycation. Ovotransferrin was reported to contain two monosaccharides attached to Asn473 in the C-lobe of the protein (Kurokawa et al. 1999). Enzyme treatment with endoglycosidase (Endo-H) could not cut the carbohydrate chains (Mizutani et al. 2004). The mass spectrometry MWs before (77,326) and after (77,306) Endo-H treatment were almost the same (Mizutani et al. 2004). Harvey et al. (2000) reported that most of the complex glycoproteins in commercial ovalbumin samples appeared to originate from another protein – the chicken riboflavin-binding protein. Ovalbumin may contain different types of glycosylation, with masses between 1.4–2.0 kDa. In recombinant ovalbumin produced in Pichia pastoris, two species with 45 and 47 kDa – thought to be the mono- and di-glycosylated forms, respectively – were
Recuenco and Alejo: SDS-PAGE Protein MarkersPhilippine Journal of ScienceVol. 148 No. 2, June 2019
380
reported (Ito and Matsudomi 2005). Thus, the OA fraction obtained could contain the glycosylated forms and could be related to the slightly broader band appearance on the SDS-PAGE. However, the band appeared consistent and similar to SDS-PAGE profiles from literature and their reported MWs (Abeyrathne et al. 2014). Overall, the proteins that may have glycosylations would vary in sizes by 1–2 kDa. Glycosylations are one of the most common post-translational modifications, and more than half of the proteome of eukaryotes constitute glycoproteins (Jayaprakash and Surolia 2017). While smearing in SDS-PAGE may be observed for glycoproteins, there are also glycoproteins such as ovalbumin, ovotransferrin, and lysozyme that show clear bands in SDS-PAGE – suggesting uniform glycosylations in these proteins. More smearing may be observed for glycoproteins having heterogeneous types of glycosylations. Glycosidic linkages with the proteins and between monosaccharides are known to be stable and could be hydrolyzed in the presence of strong acids or by enzymatic treatment. Glycations had been reported to contribute to the increased stability of protein pharmaceuticals (Sola and Griebenow 2009). Deglycosylation of glycoproteins could be done using chemical agents such as trifluoromethanesulfonic acid (Edge 2003) or enzymes such as peptide-N-glycosidases. The conditions employed in the present study were unlikely to affect deglycosylation reactions. Independent runs on the SDS-PAGE of the protein isolates and even the combined proteins showed consistent patterns of the major bands, including those of the glycosylated components.
In the study of Doucet and Beauregard (2001), their protein ladder – based on the oligomerization of an 11.3 kDa protein – due to intra- and intermolecular disulfide bridges risked elimination of dimers and higher oligomers in DTT-containing buffers. In contrast, the prepared markers had been suspended in the DTT-containing SDS-PAGE loading buffer and were heated in boiling water baths. The rates of migration of the components showed satisfactory reproducibility, based on relative SDs between 1.8–8.3% (Table 2). These were within the generally accepted limit of 10% relative SD or coefficient of variation.
The presence of proteases in the protein sources may affect the protein purification process by reducing the yields of target proteins. Effects of proteases could be reduced by using protease inhibitors. In this study, we did not use protease inhibitors due to availability and cost issues. Since the protein sources used contains abundant amounts, losses due to proteases could be tolerated. Plasmin, a protease present in milk, could be inactivated by heat treatment (Korycha-Dahl et al. 1983). Caseins precipitate at pH 4.6 and could be separated from the residual plasmin. All protein fractions obtained were
eventually denatured by heating and addition of SDS, and reduction with DTT. Thus, issues on stability, proteases, and denaturation did not hinder obtaining enough proteins and reproducible SDS-PAGE patterns from the markers. The markers remained stable for at least four months when stored at sub-zero temperatures within the duration of the study. It is highly recommended to aliquot the prepared markers in smaller quantities, like in the usual practice for commercial markers, to avoid possible degradation due to repeated freeze-thaw cycles.
Mass spectrometry is a powerful tool that could be used to establish MWs and analyze post-translational modifications such as glycosylations. While we recognize this, we were not able to subject our markers due to the costs of analysis. Previous reports on purification of various proteins, including those that we adopted in this study, did not use mass spectrometry to estimate protein sizes. Also, the proteins that we chose to prepare our markers were well-characterized. Nevertheless, mass spectrometry is highly recommended in characterizing proteins for use in various purposes, including those for protein marker preparations.
In designing a marker, downstream applications such as other staining methods or Western blot should also be considered. In this study, we employed the basic Coomassie Brilliant Blue to visualize the proteins. While we did not perform silver staining, we might expect some more bands due to some background stains and also silver staining is more sensitive than Coomassie Brilliant Blue. In Western blots, proteins separated in the SDS-PAGE could be transferred to the blotting membrane. Even though we did not perform Western blotting using the prepared markers, we have good reason to believe that since this method is straightforward, the prepared markers will behave and will be transferred in the same way as other protein markers or samples. It is also a common practice to run duplicate gels prior to a Western blot to aid in marking MWs on the transfer membrane. Possible improvement on the protein markers may include attachment of dyes or epitopes such as in Compton et al. (2002) and Kao et al. (2012).
To estimate the initial costs of the marker preparations, the raw materials, reagents, and amounts used and their current market prices were considered (Table 4). For the 3 mL low MW EMPA marker prepared, the estimated cost of raw materials was Php 1555.63 – with greatest contributions from pyridine and citric acid. For the 2 mL middle range WH marker, the estimated cost of raw materials was Php 2097.90, with DTT contributing the most to the cost. Other factors such as labor, energy, consumables, and equipment use should also be considered in estimating the costs for preparing the protein markers.
Philippine Journal of ScienceVol. 148 No. 2, June 2019
Recuenco and Alejo: SDS-PAGE Protein Markers
381

CONCLUSIONFor the preparation of potentially inexpensive protein MW markers for SDS-PAGE, protein purification studies served as guides in the selection of the protein sources and strategies for fractionation or purification. While fair to good yields of marker components, ovotransferrin, ovalbumin, and caseins were obtained; yields were low for lysozyme, porcine albumin, and wheat glutenins.
Refinement of the techniques should be considered and could include reduction or interchange of steps, use of desalting columns instead of dialysis, and use of ion-exchange or affinity resins. The prepared markers showed consistent profiles after repeated runs while suspended in DTT-containing loading buffer and heated prior to loading. This indicated moderate stability of the components to conditions like reducing agents, heat,
Table 4. Estimated initial costs of raw materials and reagents used for the preparation EMPA and WH markers in comparison with the cost of a commercial unstained protein marker.
Raw materials/ reagents Sourcea
Unit weight or volume
Unit cost (Philippine Peso,
PHP) Amount used in
experiment Cost (PHP)
EMPA marker Description: 7 proteins, 11.8–77.1 kDa, 3 mL, 3–5 µL per load
Fractionation of egg white proteins
Eggs Local store 30 mL 5 400 mL 67
Bentonite Lazada 50 g 161 10 g 32.2
KCl Sigma-Aldrich 500 g 7816.70 2 g 31.27
Pyridine Sigma-Aldrich 100 mL 7899.03 5 mL 394.95
Citric acid Sigma-Aldrich 100 g 3462.24 20 g 692.45
Ammonium sulfate Sigma-Aldrich 500 g 1065.18 15 g 31.96
NaOH Sigma-Aldrich 500 g 4177.61 20 g 167.10
Fractionation of milk proteins
Skim milk Nestlé Non-fat 250 mL 27 100 mL 10.42
HCl Sigma-Aldrich 500 mL 6287.10 5 mL 62.87
Fractionation of porcine serum proteins
Pig’s blood Local market 1000 mL 15 100 mL 1.50
Ammonium sulfate Sigma-Aldrich 500 g 1065.18 30 g 63.91
Total initial cost for EMPA marker 1555.63
WH markerDescription: 6 proteins, 16.2–106.3 kDa, 2 mL, 3–5 µL per load
Fractionation of wheat flour proteins
Wheat Cream All Purpose Flour 500 g 34 12 g 0.82
Propanol Sigma-Aldrich 1000 mL 5253.04 100 mL 525.30
Dithiothreitol Sigma-Aldrich 1 g 4053.53 0.30 g 1216.06
Acetone Sigma-Aldrich 500 mL 3557.18 50 mL 355.72
Total initial cost for WH marker 2097.90
Commercially prepared marker with comparable MW range and number of components
Thermo Scientific™ Unstained Protein Molecular Weight MarkerCatalog Number PI26610Description: 7 proteins at 14.4–116 kDa in reducing sample bufferFor 200–400 mini gel lanes at 5–10 μL per lane2 x 1 mLhttps://www.fishersci.com/shop/products/pierce-unstained-protein-molecular-weight-marker/pi26610#?keyword=unstained+marker Price (Feb 2019) $76.50 or ~PHP 3986
aItems that were from Sigma-Aldrich were quoted in US Dollars and converted to PHP. The quoted prices were obtained from the online catalogue (sigmaaldrich.com) as of May 2018.
Recuenco and Alejo: SDS-PAGE Protein MarkersPhilippine Journal of ScienceVol. 148 No. 2, June 2019
382
and glycosylation. The prepared markers were stable for at least four months based on usage within the study period. In preserving the quality of the markers, practical considerations include storage conditions, number of freeze-thaw cycles, buffers, detergents and reducing agents, heat treatments, and electrophoresis conditions. With multiple measurements done to establish the MWs of the marker components, prepared markers were nearly comparable to the commercial marker in the estimation of experimental MWs of test proteins. Although the MW ranges 12–77 kDa and 16–106 kDa for the two prepared markers may be less wide than the ranges of commercially prepared markers, these ranges could be adequate for estimating the MWs of a good number of proteins. To obtain more accurate MWs of the markers’ components and to improve their performance as standards, calibration against unstained markers and/or mass spectrometry can be performed in future studies.
ACKNOWLEDGMENTSThe authors thank Prof. Kevin C. Salamanez and Dr. Teofila DC Villar for their valuable comments and suggestions.
REFERENCESABEYRATHNE EDNS, LEE HY, AHN DU. 2014.
Sequential separation of lysozyme, ovomucin, ovotransferrin, and ovalbumin from egg white. Poult Sci 93(4): 1001–1009.
ALDERTON G, WARD WH, FEVOLD HL. 1945. Isolation of lysozyme from egg white. J Biol Chem 157: 43–58.
BERNACKA-MIELESZKO T, KACZKOWSKI J. 1975. Reduction dynamics of S-S bonds in wheat gluten. Nahrung 19(9–10): 769–773.
BIO-RAD. 2018. Precision Plus Protein™ Unstained Protein Standards, Strep-tagged recombinant, 1 ml #1610363. Retrieved from http://www.bio-rad.com/en-us/sku/1610363-precision-plus-protein-unstained-protein-standards-strep-tagged-recombinant-1-ml?ID=1610363 on 08 Nov 2018.
BLADE WH, BOULTON R. 1988. Adsorption of protein by bentonite in a model wine solution. Am J Enoc Vitic 39(3): 193–199.
BRADFORD MM. 1976. A rapid and sensitive method for the quantitation of microgram quantities of protein utilizing the principle of protein-dye binding. Anal Biochem 72(1–2): 248–254.
BUSHUK W. 1994. Molecular structure of bread wheat glutenin. In: Gluten Proteins 1993. Detmold, Germany: Association of Cereal Research. p. 5–13.
COMPTON MM, LAPP SA, PEDEMONTE R. 2002. Generation of multicolored, prestained molecular weight markers for gel electrophoresis. Electrophoresis 23(19): 3262–3265.
CREAMER LK, RICHARDSON T. 1984. Anomalous behavior of bovine αS1- and β-caseins on gel electrophoresis in sodium dodecyl sulfate buffers. Arch Biochem Biophys 243(2): 476–486.
CUGIA F, MONDUZZI M, NINHAM BW, SALIS A. 2013. Interplay of ion specificity, pH and buffers: Insights from electrophoretic mobility and pH measurements of lysozyme solutions. RSC Adv 3: 5882–5888.
DOUCET A, BEAUREGARD M. 2001. A sodium dodecyl sulfate-polyacrylamide gel electrophoresis protein ladder made of disulfide-bridged proteins. Anal Biochem 292(2): 296–297.
DUNKER AK, RUECKERT RR. 1969. Observations on molecular weight determinations on polyacrylamide gel. J Biol Chem 244(18): 5074–5080.
EDGE ASB. 2003. Deglycosylation of glycoproteins with trifluoromethanesulphonic acid: Elucidation of molecular structure and function. Biochem J 376(Pt. 2): 339–350.
GHOSH S, PANDEY NK, ROY AS, TRIPATHY DR, DINDA AK, DASGUPTA S. 2013. Prolonged glycation of hen egg white lysozyme generates non amyloidal structures. PLoS ONE 8(9): e74336.
GARFIN DE. 2003. Chapter 7, Gel electrophoresis of proteins. In: Essential Cell Biology, Volume 1: Cell Structure, A Practical Approach. Davey J, Lord M eds. Oxford, UK: Oxford University Press. p. 197–268.
HARVEY DJ, WING DR, KÜSTER B, WILSON IBH. 2000. Composition of N-linked carbohydrates from ovalbumin and co-purified glycoproteins. J Am Soc Mass Spec 11(6): 564–571.
HURST MO, KEENAN MV, SON CC. 1992. Purification of lysozyme by linear salt gradient and SDS gel electrophoresis. J Chem Ed 69(10): 850–851.
ITO K, MATSUDOMI N. 2005. Structural characteristics of hen egg ovalbumin expressed in yeast Pichia pastoris. Biosci Biotechnol Biochem 69(4): 755–761.
JAYAPRAKASH NG, SUROLIA A. 2017. Role of glycosylation in nucleating protein folding and stability. Biochem J 474(14): 2333–2347.
Philippine Journal of ScienceVol. 148 No. 2, June 2019
Recuenco and Alejo: SDS-PAGE Protein Markers
383

KAILASAPATHY K. 2016. Chemical composition, physical and functional properties of milk and milk ingredients. In: Dairy Processing and Quality Assurance, Second Edition. Chandan RC, Kilara A, Shah NP eds. John Wiley and Sons, Ltd. p. 77–105.
KAO CH, CHENG CM, CHUANG KH, CHUANG CH, TZOU SC, CHENG TC, HSIEH YC, LIAO KW, WANG YM, CHANG LS, ROFFLER SR, CHEN FM, CHENG TL. 2012. A regularly spaced and self-revealing protein ladder for anti-Tag Western blot analysis. Anal Biochem 431(1): 1–3.
KORYCHA-DAHL M, DUMAS BR, CHENE N, MARTAL J. 1983. Plasmin activity in milk. J Dairy Sci 66(4): 704–711.
KUROKAWA H, DEWAN JC, MIKAM B, SACCHETTINI JC, HIROSE M. 1999. Crystal structure of hen apo-ovotransferrin: Both lobes adopt an open conformation upon loss of iron. J Biol Chem 274: 28445–28452.
LAEMMLI UK. 1970. Cleavage of structural proteins during the assembly of the head of bacteriophage T4. Nature 227(5259): 680–685.
LI W, TSIAMI AA, BOLLECKER SS, SCHOFIELD JD. 2004. Glutathione and related thiol compounds II: The importance of protein-bound glutathione and related protein-bound compounds in gluten proteins. J Cereal Sci 39(2): 213–224.
LYDDON C. 2016. Focus on the Philippines. Retrieved from https://www.world-grain.com/articles/10218-focus-on-the-philippines. 02.05.2016 on 09 Feb 2018.
MELAS V, MOREL MH, AUTRAN JC, FEILLET P. 1994. Simple and rapid method for purifying low molecular weight subunits of glutenin from wheat. Cereal Chem 71(3): 234–237.
MICHAEL SE. 1962. The isolation of albumin from blood serum or plasma by means of organic solvents. Biochem J 82(1): 212–218.
MIZUTANI K, OKAMOTO I, FUJITA K, YAMAMOTO K, HIROSE M. 2004. Structural and functional characterization of ovotransferrin produced by Pichia pastoris. Biosci Biotechnol Biochem 68(2): 376–383.
NG PKW, BUSHUK W. 1987. Glutenin of Marquis wheat as a reference for estimating molecular weights of glutenin subunits by sodium dodecyl sulfate-polyacrylamide gel electrophoresis. Cereal Chem 64: 324–327.
ODUNUGA OO, SHAZHKO A. 2013. Ammonium sulfate precipitation combined with liquid chromatography is sufficient for purification of bovine serum albumin that
is suitable for most routine laboratory applications. Bio Chem Comp 1: 3 http://dx.doi.org/10.7243/2052-9341-1-3
RUEDEN CT, SCHINDELIN J, HINER MC, DEZONIA BE, WALTER AE, ARENA ET, ELICEIRI KW. 2017. ImageJ2: ImageJ for the next generation of scientific image data. BMC Bioinformatics 18: 529.
SATO H, AONO S, SEMBA R, KASHIWAMATA S. 1988. A simple method for preparation of molecular weight marker proteins for sodium dodecyl sulfate-polyacrylamide gel electrophoresis by photopolymerizations of hemoglobin subunits. Electrophoresis 9(7): 352–353.
SHAMMET KM, BROWN RJ, MCMAHON DJ. 1992. Proteolytic activity of some milk-clotting enzymes on k-casein. J Dairy Sci 75: 1373–1379.
SHIBUSAWA Y, IINO S, SHINDO H, ITO Y. 2001. Separation of chicken egg white proteins by high-speed countercurrent chromatography. J Liq Chrom Relat Tech 24(13): 2007–2016.
SOLA RJ, GRIEBENOW K. 2009. Effects of glycosylation on the stability of protein pharmaceuticals. J Pharm Sci 98(4): 1223–1245.
TRUDEL J, ASSELIN A. 1995. Detection of a glycosylated form of hen egg white lysozyme. Biochem Cell Biol 73(5-6): 307–309.
[UniProt] The UniProt Consortium. 2017. UniProt: The universal protein knowledge base. Nucleic Acids Res 45: D158–D169.
ULLOA JA, BARBOSA MCB, VAZQUEZ JAR, ULLOA PR, RAMÍREZ JCR, CARRILLO JS, TORRES LG. 2017. Production, physico-chemical and functional characterization of a protein isolate from jackfruit (Artocarpus heterophyllus) seeds. CyTA – Journal of Food 15(4): 497–507.
WEBER K, PRINGLE JR, OSBORN M. 1972. Measurement of molecular weights by electrophoresis on SDS-acrylamide gel. Methods Enzymol 26: 3–27.
WEBER K, OSBORN M. 1975. Proteins and sodium dodecyl sulfate: molecular weight determination on polyacrylamide gels and related procedures. In: The Proteins. Neurath H, Hill RL eds. New York: Academic Press. p. 179–223.
Recuenco and Alejo: SDS-PAGE Protein MarkersPhilippine Journal of ScienceVol. 148 No. 2, June 2019
384