Embed Size (px)
Citation preview

Road Materials and Pavement Design, 2015http://dx.doi.org/10.1080/14680629.2015.1028970
Laboratory investigation of the strength, stiffness, and thermalconductivity of fly ash and lime kiln dust stabilised clay subgrade materials
Xin Kanga, Louis Geb∗ , Gi-Chun Kangc and Christopher Mathewsd
aDepartment of Civil, Architectural, and Environmental Engineering, Missouri University of Science andTechnology, Rolla, MO, USA; bDepartment of Civil Engineering, National Taiwan University, Taipei, Tai-wan; cDam & Watershed Maintenance Department, K-water, Daedeok-Gu, Daejeon 306–711, Republic ofKorea; dSCI Engineering, O’Fallon, IL, USA
(Received 8 October 2014; accepted 8 March 2015 )
The effectiveness of Class-C fly ash (FA) (ASTM C-618) and lime kiln dust (LKD) used inclay pavement base materials stabilisation has been investigated in this research. Proctor com-paction test, unconfined compression test, and non-destructive test (Briaud compaction device(BCD) modulus and thermal conductivity) were carried out on the chemically modified soil.Test specimens were reconstituted by static compaction, constructed at optimum water con-tent, and tested at various curing periods. Test results revealed that the addition of Class-C FAup to 20 wt% could effectively increase the dry unit weight from 16.8 to 17.4 kN/m3 (105.0 to108.3 pcf), improve the unconfined compressive strength (UCS, which increased from 181.2to 497.2 kPa at the end of 28 days of curing), and raise the BCD modulus up to 40 MPa. TheLKD was also found to be a good stabiliser for weak soil, which could raise the UCS and stiff-ness under relatively small mixing rations (4 and 8 wt%), but the dry unit weight decreased asthe LKD mixing ratio increased. The thermal conductivity, however, decreased as the curingtime and stabiliser mixing ratio increased. Parallel and series models were employed to under-stand the upper-and-lower bound of the mixtures’ thermal conductivity. A thermal strengthcoupled empirical model which is based on the non-destructive testing results was developedto predict the UCS gain over curing time. The thermal conductivity and BCD modulus werealso incorporated into a novel compaction quality check model. Based on the observed testdata and regression analysis, both models were found to yield good results, indicating that theyare robust tools for predicting the UCS and dry unit weight of chemically treated pavementbase materials.
Keywords: fly ash; lime kiln dust; BCD modulus; proctor compaction; unconfined compres-sive strength; thermal conductivity
IntroductionLow strength and high compressibility clays are commonly encountered in pavement construc-tion in Missouri State, USA. Instead of replacing the in situ soil by other earth materials, chemicalstabilisers, such as Class-C fly ash (FA) and lime kiln dust (LKD), were found to have greatbeneficial potential in soil stabilisation due to their excellent self-cementing characteristics (e.g.Misra, 1998; Tuncer, Hector, & Craig, 2006). The FA-treated soil is typically strong and stiff, andthe plasticity and shrink–swell potential could be reduced as well (e.g. Cokca, 2001; Puppala,Ramakrishna, & Hoyos, 2003; Tuncer et al., 2006). The stabilisation mechanism of Class-C
*Corresponding author. Email: [email protected]
© 2015 Taylor & Francis
Dow
nloa
ded
by [
Mis
sour
i S &
T],
[D
r X
IN K
AN
G]
at 1
3:05
13
Apr
il 20
15

2 X. Kang et al.
FA was studied by several researchers, including Saylak, Mishra, Mejeoumov, and Shon (2008),Lloyd, Provis, and van Deventer (2009), Horpibulsuk, Rachan, and Raksachon (2009), and Shon,Saylak, and Mishra (2010). The hardening process of the mixture was primarily divided into twoparts, the short-term effect and the long-term effect, respectively. The short-term effect takesplace immediately as the FA is blended with soil. The long-term strength gain is attributed tothe hydration of cementation material and the pozzolanic reaction because high quantities oflime (CaO), silica dioxide (SiO2), and alumina trioxide (Al2O3) are contained in the FA. Thestrength and stiffness improvement are largely dependent on the long-term effect (Chitambira,2004; Kamruzzaman, Chew, & Lee, 2009; Tan, Goh, & Yong, 2002). The studies of the strengthgain and small stain stiffness improvement of chemically stabilised soil have been well doc-umented in the literature; however, not many studies were found on investigating the thermalproperties and small-strain modulus of the stabilised soils. The study of soil thermal propertieshas a significant relation to engineering applications (Abuel-Naga, Bergado, & Bouazza, 2008;Abu-Hamdeh & Reeder, 2000; Bachmann, Horton, Ren, & van der Ploeg, 2001; Balland & Arp,2005; Brandon & Mitchell, 1989; Brandon, Mitchell, & Cameron, 1989). A literature reviewrevealed that very limited studies were found to adopt the non-destructive testing method tomonitor and control the filed compaction quality in engineering practice (Weidinger & Ge, 2009).Compared with destructive laboratory testing methods, such as unconfined compression shear,triaxial shear, and resilient modulus test, non-destructive testing (e.g. Briaud compaction device(BCD) modulus and thermal conductivity) showed its great features. The non-destructive testingis low in cost, simple and easy to carry out in the field, and reliable. The non-destructive testingmethod, thus, could be served as a convenient tool for continuously monitoring the strength andsmall-strain stiffness improvement of chemically treated geomaterials.
In summary, the objectives of the research are as follows: (1) Evaluate the effectiveness ofself-cementing Class-C FA and LKD for clay pavement materials stabilisation by carrying outboth destructive testing (unconfined compression strength) and non-destructive testing (whichincluded BCD modulus and thermal conductivity); (2) investigate the physicochemical effectsof FA and LKD on the hardening process of the stabilised soils; (3) correlate and compare thedestructive testing results with non-destructive testing results on FA and LKD stabilised claysubgrade soils; and (4) develop mechanical and thermal coupled models to evaluate the uncon-fined compressive strength (UCS) gain and check the field compaction quality based on thenon-destructive testing methods.
Test materialsTwo different types of chemical stabilisers, the Class-C FA and LKD, were used in this study.Large quantities of FAs were generated by electrical power plants worldwide. Every year, onlyabout 20–30% of generated FA is used as additives in cement and concrete as replacement mate-rials. The rest of them are disposed in landfills and surface impoundments nationwide. Therefore,increasing the recycling percentage of FA is of great significance to the sustainable developmentand global energy market. In this research, different FA samples were first obtained from fivethermo power plants in Missouri State. Set time tests (Kang, Kang, & Ge, 2013) were carried outto determine the proper setting time of the FA and served as a screening criterion for selecting thebest FA stabiliser. The FA selected in this study was from LaBadie Power Plant in Washington,Missouri, USA. The chemical compositions and the engineering properties of the LaBadie FAare listed in Table 1.
LKD is a by-product from the Portland cement manufacturing process. It is estimated thatabout 2.5 million metric tons of high-calcium LKD is produced annually in the USA (Miller
Dow
nloa
ded
by [
Mis
sour
i S &
T],
[D
r X
IN K
AN
G]
at 1
3:05
13
Apr
il 20
15

Road Materials and Pavement Design 3
Table 1. Percentage of chemi-cal compositions in FA.
Chemicals %
SiO2 33.72Al2O3 21.90Fe2O3 7.15CaO 25.31MgO 4.48SO3 2.25K2O 0.41P2O5 1.20TiO2 1.30Na2O 1.40LOI 0.37
& Callaghan, 2004). The LKD is potentially useful in stabilising a variety of soils (i.e. sandyand clayey soils), which in turn is found to be a cost-effective way of recycling the by-productLKD. The addition of LKD in soil was found to increase the California bearing ratio value,improve the summary resilient modulus, and lower plastic strains (Cetin, Aydilek, & Guney,2010). It was reported that LKD could be used together with quicklime for effective municipalsludge pasteurisation and stabilisation (Burnham, Hatfield, Bennett, & Logan, 1992; Heckel &Wahab, 1996). The LKD has also been successfully used in the stabilisation of subgrade soils,improvement of resilient modulus, and enhancement of the UCS (Daita, Drnevich, Kim, & Chen,2006; Kang, Kang, Chang, & Louis, 2014; Solanki, Zaman, & Dean, 2010). The LKD used inthis study was shipped from Mississippi Lime Company at St. Louis, Missouri, USA, whichcontains the key ingredients of lime (20–40% calcium oxide) and FA (8–15%) from the coalused to burn or calcinate the limestone to lime.
The clayey subgrade soil was obtained from a roadbase construction site in Atchison County,Missouri, USA. The plastic and liquid limits are 21 and 38, respectively. According to the unifiedsoil classification system, the Atchison soil was classified as low plasticity clay (CL). The grain-size distribution curves of the soil, FA, and LKD are shown in Figure 1. The FA is gap graded
Figure 1. Grain-size distribution curves of clays and chemical additives.
Dow
nloa
ded
by [
Mis
sour
i S &
T],
[D
r X
IN K
AN
G]
at 1
3:05
13
Apr
il 20
15

4 X. Kang et al.
Table 2. Summary of FA and LKD mixing ratios.
Percentage by weight of soils and additives
Soils Additives
Test case Atchison FA LKD
ACL0 100 – –AC10 90 10 –AC15 85 15 –AC20 80 20 –AL04 96 – 4AL08 92 – 8
and its grain-size distribution curve was located to the right, indicating that the FA was coarser.Table 2 gives the mixing ratios between the soil and the additives (The FA was taken as themajor chemical stabiliser in this research; therefore, three mixing ratios were used. On the con-trary, two mixing ratios of LKD were adopted in this research to identify the effectiveness of theLKD treatment). Typically, the FA mixing ratio was kept lower than 30% and the LKD mixingratio was kept lower than 15% to prevent the development of desiccation cracks during samplecuring.
Specimen preparationThe soil (sampled from Atchison County, Missouri, USA) was first air-dried and mechanicallypulverised before passing through a #40 sieve (425 mm). The processed dry soil was mixed withFA and LKD by targeting mixture ratios and optimum water contents, and then well mixed.The FA/LKD soil mixtures were compacted into a 152.4-mm (6 in.) split proctor mould. Aftercompaction, all specimens were moved a into plastic mould whose inner diameter is exactlysame as the split proctor mould and stored in a 100% humidity moist room for curing. Completedetails of sample construction and quality check are presented in Kang et al. (2014). BCD andthermal conductivity tests were conducted on the samples after 0, 1, 7, 14, and 28 days. Thespecimens for UCS tests were constructed by the static compression method (Kang et al., 2014).Both treated and untreated soil samples were built at optimum moisture content in accordancewith the data from the standard proctor test (ASTM D698) with a specimen size of 71.1 mmdiameter and 142.2 mm height. Each specimen was statically compressed in five equal layers ina cylindrical mould. Afterwards, specimens were carefully extruded for immediate BCD modulustests/thermal conductivity tests or wrapped with a plastic wrap, double sealed in zip-lock plasticbags, and then stored in 100% humidity moist room for curing. For each test, two identicalspecimens were prepared and the test results were compared so as to statistically minimise theexperimental errors and ensure good data quality.
Testing proceduresUCS testingUCS was determined in accordance with ASTM D 2166 for the chemically stabilised soils. Testspecimens were cured at 0, 1, 7, 14, and 28 days, until the treated samples get enough time to setand be strengthened, and to determine the effect of curing length on the UCS. The strain rate waskept at 0.21% per minute until specimen failure.
Dow
nloa
ded
by [
Mis
sour
i S &
T],
[D
r X
IN K
AN
G]
at 1
3:05
13
Apr
il 20
15
Road Materials and Pavement Design 5
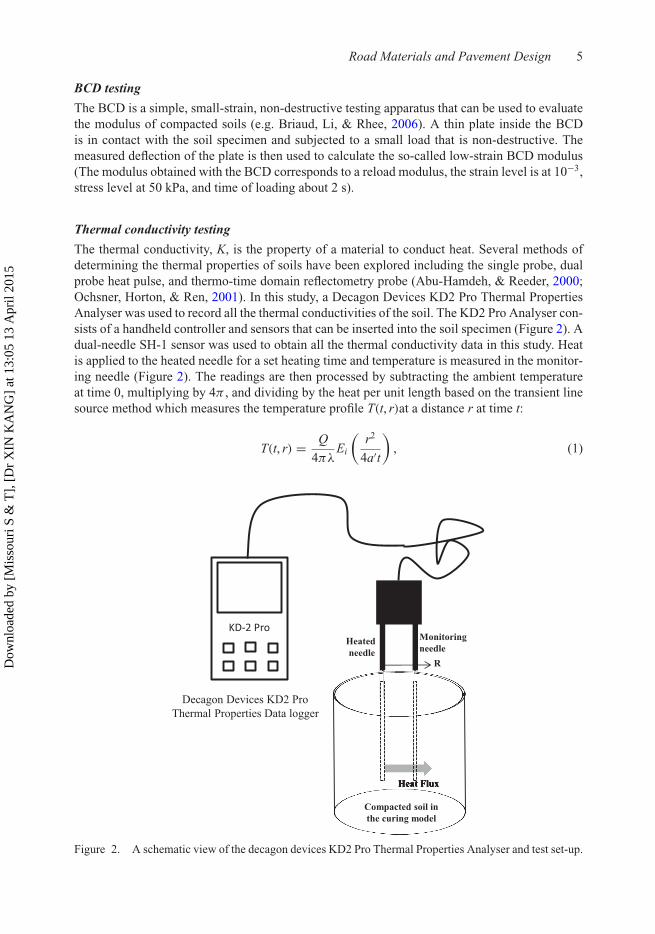
BCD testingThe BCD is a simple, small-strain, non-destructive testing apparatus that can be used to evaluatethe modulus of compacted soils (e.g. Briaud, Li, & Rhee, 2006). A thin plate inside the BCDis in contact with the soil specimen and subjected to a small load that is non-destructive. Themeasured deflection of the plate is then used to calculate the so-called low-strain BCD modulus(The modulus obtained with the BCD corresponds to a reload modulus, the strain level is at 10−3,stress level at 50 kPa, and time of loading about 2 s).
Thermal conductivity testingThe thermal conductivity, K, is the property of a material to conduct heat. Several methods ofdetermining the thermal properties of soils have been explored including the single probe, dualprobe heat pulse, and thermo-time domain reflectometry probe (Abu-Hamdeh, & Reeder, 2000;Ochsner, Horton, & Ren, 2001). In this study, a Decagon Devices KD2 Pro Thermal PropertiesAnalyser was used to record all the thermal conductivities of the soil. The KD2 Pro Analyser con-sists of a handheld controller and sensors that can be inserted into the soil specimen (Figure 2). Adual-needle SH-1 sensor was used to obtain all the thermal conductivity data in this study. Heatis applied to the heated needle for a set heating time and temperature is measured in the monitor-ing needle (Figure 2). The readings are then processed by subtracting the ambient temperatureat time 0, multiplying by 4π , and dividing by the heat per unit length based on the transient linesource method which measures the temperature profile T(t, r)at a distance r at time t:
T(t, r) = Q4πλ
Ei
(r2
4a′t
), (1)
Figure 2. A schematic view of the decagon devices KD2 Pro Thermal Properties Analyser and test set-up.
Dow
nloa
ded
by [
Mis
sour
i S &
T],
[D
r X
IN K
AN
G]
at 1
3:05
13
Apr
il 20
15

6 X. Kang et al.
where Q is the power per unit length (W/m), λis the thermal conductivity of the sample (W/mK),a is the thermal diffusivity (m2/s), and Ei(x)is the exponential integral. When performing anexperiment which measures the temperature at a point at a fixed distance, the exponential inte-gral can be approximated by the relation: Ei(x) = −γ − ln(x) + O(x2), where γ ≈ 0.5777 is theEuler gamma constant; thus,
T(t, r) = Q4πλ
{−γ − ln
(r2
4a
)+ ln(t)
}. (2)
For a given material, the first two terms in the brackets are constant; thus, thermal conductivitycan be determined from the slope of �T − ln(t)curve.
ResultsMoisture density relationshipResults obtained from the proctor compaction tests of both treated and untreated soils are pre-sented in Figure 3. Each test was performed within 30 min after initial mixing. The addition ofFA was found to increase the maximum dry unit weight of the treated soil. The reason for themaximum dry unit weight increase was believed to be due to the squeezing of the finer particlesof FA (normally smaller than #200 sieve) into the voids of soil particles (silts and sand) dur-ing compaction, thus resulting in an increase in the maximum dry density (McMains & Arman,1989). The unit weight of LKD was much lower than the soil; therefore, the high percentageratio of LKD added to soil, the lower the mixture’s dry unit weight.
Unconfined compressive strengthThe UCS test results of chemically treated soils are shown in Figures 4 and 5. The UCS increasedwith the FA content increase. The UCS at initial blending of 10 wt% FA sample was 181.2 kPa,as the curing time increased, the UCS increased gradually. When the 28 days of curing time wasreached, all the UCS has gained the highest strength. The 10% FA sample gained its most of thestrength at about 28 days; however, 15 and 20 wt% FA gained most of the strength at approxi-mately between 14 and 28 days. This indicates that the rate of strength gain is dependent on the
Figure 3. Moisture density relationship of the modified soils.
Dow
nloa
ded
by [
Mis
sour
i S &
T],
[D
r X
IN K
AN
G]
at 1
3:05
13
Apr
il 20
15

Road Materials and Pavement Design 7
Figure 4. The UCS versus curing time of FA stabilized soils.
Figure 5. The UCS versus curing time of LKD stabilised soils.
FA content. In other words, the trend indicated that the speed of the sample stiffening increasedas the FA content increased. The extra “addition of FA”, however, did not influence the finalUCS because all the samples have almost the same UCS at 28 days of curing. If given enoughtime for soils to react with the FA, 10, 15 and 20 wt% FA samples would have approximatelythe same final UCS. Figure 5 shows the efficiency of the LKD in stabilising the clays. Similarlyto the FA-treated soil, as the LKD ratio and curing time increased, the UCS of the LKD treatedsoil also increased. The LKD treated soil gained most of its strength between 7 and 14 days, afterwhich the strength increase was relatively slow. The black lines in the figures were model-fitteddata; the details of the proposed models are shown in the discussion section.
Dow
nloa
ded
by [
Mis
sour
i S &
T],
[D
r X
IN K
AN
G]
at 1
3:05
13
Apr
il 20
15

8 X. Kang et al.
Modulus from the BCDFigure 6 shows the relationship between BCD modulus and water content under standard proc-tor compaction effort. The BCD modulus of pure Atchison soil decreased as the water contentincreased. In general, the BCD modulus of FA–soil mixtures had a “back bone” relationshipwith the water content (see Figure 6). As the water content increased, the compacted soil gradu-ally changed into the “wet-side”, where the inter-particle pores were filled by water and the soil
(a) (b)
Figure 6. BCD modulus of treated and untreated soils at initial mixing.
(a) (b)
(c) (d)
Figure 7. BCD modulus of FA and LKD mixtures at different curing times.
Dow
nloa
ded
by [
Mis
sour
i S &
T],
[D
r X
IN K
AN
G]
at 1
3:05
13
Apr
il 20
15

Road Materials and Pavement Design 9
matrix suction decreased. At a macro scale, the soil became “softer” and as a result, the BCDmodulus decreased.
Figure 7 shows the BCD modulus of FA and LKD treated soil at different curing periods (0,1, 7, 14, and 28 days). For 10% FA–soil mixture, the BCD modulus increased as the curingtime increased. The maximum BCD modulus was observed at 28 days. A similar trend wasfound for the 15 and 20 wt% FA–soil mixtures. The modulus of both (4 and 8 wt%) LKD treated
(a) (b)
Figure 8. Thermal conductivity of both treated and untreated soils.
(a) (b)
(c) (d)
Figure 9. Thermal conductivity of FA and LKD mixtures.
Dow
nloa
ded
by [
Mis
sour
i S &
T],
[D
r X
IN K
AN
G]
at 1
3:05
13
Apr
il 20
15

10 X. Kang et al.
specimens increased with curing time; however, after 14 days of curing, the modulus increasewas not apparent.
Thermal conductivityThe relationship between thermal conductivity and water content of FA and LKD treated soilspecimens at initial mixing are shown in Figures 8 and 9. The maximum value was observed onpure Atchison soil. With the increase in FA and LKD, the thermal conductivity decreased. WhenFA was more than 15 wt%, the maximum value became almost constant. The thermal conduc-tivity was significantly decreased by the addition of 4 wt% LKD, but the value was slightlydecreased for 8 wt% LKD.
The thermal conductivity of 10 wt% FA–soil mixture was large initially (1.68 W/mKFigure 9(a)) and then decreased as the curing time increased. After about 14 days, all the mea-sured thermal conductivity values became constant. Similar findings were obtained for 15 and 20wt% FA–soil mixtures. However, the thermal conductivity for the LKD mixture increased withcuring time for both 4 and 8 wt% LKD.
DiscussionsThe upper-and-lower bound of FA–soil mixtures’ thermal conductivityThe FA stabilised soil could be treated as a composite material that is consisted by two separatematerials, namely the basic soil and the addition FA, of which the physical and mechanical prop-erties are a combination of the two materials’ own properties. Therefore, the rules of mixtureswhich have been used extensively in material science might be employed to understand the com-posite’s upper-and-lower bound thermal conductivities. Both the parallel model and the seriesmodel were employed to predict the upper-and-lower bound of the thermal conductivity of theFA–soil mixtures:
KFA−Soil = KSoilVSoil + KFAVFA, (3)
the parallel model – upper bound of the thermal conductivity**
1KFA−Soil
= VSoil
KSoil+ VFA
KFA. (4)
the series model – lower bound of the thermal conductivity. Here, K denotes the thermal con-ductivity and V is the volume fraction of the FA and soil grains in the composite (specific gravityis needed to calculate the volume fraction of each component in the parallel and series mod-els). The thermal conductivity of pure FA over curing time was measured and is displayedin Figure 10. The thermal conductivity was at its peak after initial mixing. As the FA set, itsthermal conductivity decreased. By using the parallel and series models, the upper-and-lowerbound of the FA stabilised soil mixtures’ thermal conductivity values are calculated and plottedin Figure 11. The measured thermal conductivity of the mixtures at different curing periods isalso plotted in Figure 11 which is located right between the upper-and-lower bound of the pre-dicted range. Therefore, the results indicated that the two models are applicable for estimatingthe upper-and-lower bound of the thermal conductivity of FA stabilised soils.
Proposed models for non-destructive testing evaluationThis section is aimed at establishing non-destructive testing based models to predict the UCSof stabilised soil and check the compaction quality in field. In the literature, the ageing of
Dow
nloa
ded
by [
Mis
sour
i S &
T],
[D
r X
IN K
AN
G]
at 1
3:05
13
Apr
il 20
15

Road Materials and Pavement Design 11
Figure 10. Measured thermal conductivity of pure FA during setting at room temperature.
Figure 11. The upper and lower thermal conductivity boundaries of the FA–soil mixtures.
cement-based/modified clay has been investigated by many practitioners (e.g. Chitambira, 2004;Kamruzzaman et al., 2009). Most of these pioneer works were focused on the ageing effects ofthe strength gain. Curing time was used as an input variable to predict the UCS of stabilisedsoils (Chitambira, 2004). Except time, other factors such as cement percentage, water content,and density were incorporated to improve the prediction of the UCS. However, most of the pub-lished models relied only on the fitting parameters. One disadvantage of these models is thatthe fitting parameters are largely dependent on the type of soil and stabiliser, which in turn sig-nificantly affect the uncertainty of the predicted UCS. Literature review showed that the USChas close relationship with the stiffness and packing state (Chitambira, 2004; Kamruzzamanet al., 2009; Kang et al., 2014; Sunitsakul, Sawatparnich, & Sawangsuriya, 2012). The ther-mal conductivity was found to be influenced by the porosity and density (Hotz & Ge, 2010).Therefore, it is assumed that the UCS increased exponentially with curing time (Chitambira,2004) and was influenced by the BCD modulus and thermal conductivity development. By cor-relating USC with non-destructive testing results, as shown in Equation (5), the prediction ofthe USC would be achieved. Since the BCD small-strain modulus and thermal conductivity aretwo basic properties of the stabilised soil, it is reasonable to select the BCD modulus and ther-mal conductivity to evaluate and predict the UCS gain versus curing time. In this research, athermal–small-strain stiffness coupled model (Equation (5)) was proposed to predict the UCS ofa stabilised soil. The BCD modulus and thermal conductivity were also incorporated in an empir-ical model which served as a non-destructive testing method to check the compaction quality infield (Equation (6)).
Dow
nloa
ded
by [
Mis
sour
i S &
T],
[D
r X
IN K
AN
G]
at 1
3:05
13
Apr
il 20
15

12 X. Kang et al.
qu = BCDMixture
BCDSoil
KSoil
KMixtureexp
{a
[1 − exp
(AshSoil
− b ln t)]}
, (5)
ρd
ρdmax= c
BCDBCDopt
+ dKopt
K, (6)
where BCDmixtureis the BCD modulus of the FA–soil mixture at curing time t. BCDSoil andBCDopt are the BCD modulus of the soil and FA–soil mixture at optimum water content andmaximum dry unit weight conditions. KSoil and Kopt are the thermal conductivity of the soil andFA–soil mixture at the optimum water content and maximum dry unit weight conditions. KMixtureis the thermal conductivity of the FA–soil mixture at curing time t. Ash/Soil is the weight per-centage ratio of FA over soil. ρd is the dry unit weight of a soil or FA–soil mixture. ρd maxis themaximum dry unit weight at optimum water condition.
In Equation (5), a and b are the fitting parameters that are based on the type of stabilisers.The fitting parameter a governs the final USC of a chemically treated soil (when curing timeequals to infinity); fitting parameter b governs how fast the USC grows over curing time. Thenormalised BCD modulus and normalised thermal conductivity were found to have correlationswith the final USC, and the ash to soil ratio was found to influence the USC growing speed.
In Equation (6), c and d are the fitting parameters based on the non-destructive testing data.The physical meanings of c and d represent the degree of correlation of BCD modulus andthermal conductivity improvement with the dry unit weight of a stabilised soil. For example, thehigher the value of c, the closer the relationship between BCD modulus improvement and dryunit weight increase, and vice versa.
The UCS of a chemically treated soil is dependent on the curing time. Other than curing time,the chemical content was found to influence the speed of strength gain. The proposed modelincorporated non-destructive testing results to calibrate the prediction of UCS gain over time.The fitting parameters a and b in Equation (5) could be obtained from a curve-fitting techniqueby using the Solver Add-in in the Microsoft Excel. The combination of a and b that gives the leastsum of square error is chosen for the fitting values. For FA treated soil (as shown in Equation (7)),the values of a and b are 5.36 and 36.59, respectively. For LKD treated soil, the values of a andb were 4.82 and 179.39 (in Equation (8)). For both the FA and LKD treated soil, the a valueswere approximately the same (FA treated sample had a slightly higher value of a, indicating thatthe final UCS of FA treated soil is slightly higher than that of the LKD treated soil); however,the b values of LKD treated soil were much higher. This big difference indicated that the LKDtreated soil had a much faster speed of strength gain compared with the FA treated soil. Modelpredicted data and test data are presented in Figure 12. Black solid circles represented the UCS ofFA treated soil, and hollow circles represented the LKD treated soil. As displayed in the figure,most of the data was located near the diagonal line, indicating that the model predictions werepretty close to the test data (coefficient of determination R2 = 0.8239). Therefore, by carrying outthe BCD and thermal conductivity test measurements, the corresponding UCS of a chemicallytreated soil could be easily predicted.
qu = BCDMixture
BCDSoil
KSoil
KMixtureexp
{5.36
[1 − exp
(AshSoil
− 36.59 ln t)]}
, (7)
qu = BCDMixture
BCDSoil
KSoil
KMixtureexp
{4.82
[1 − exp
(LKDSoil
− 179.39 ln t)]}
. (8)
Dow
nloa
ded
by [
Mis
sour
i S &
T],
[D
r X
IN K
AN
G]
at 1
3:05
13
Apr
il 20
15

Road Materials and Pavement Design 13
Figure 12. The predicted and measured UCS of the FA and LKD stabilised soil.
The values of c and d in Equation (6) were obtained from the same curve-fitting technique byusing the Solver Add-in in the Microsoft Excel. For the FA treated soil (Equation (9)), the valuesof c and d were 0.451 and 0.618, respectively. For the LKD treated soil (Equation (10)), thevalues of c and d were 0.521 and 0.568, respectively. For both the FA and LKD treated soil, thevalues of c and d were approximately between 0.4 and 0.6, which indicated that the correlationdegree of BCD modulus (with the dry density) and thermal conductivity (with the dry density) isalmost the same. The model predicted data and test data are presented in Figure 13. Black solidcircles represented the FA treated soil and hollow circles represented the LKD treated soil. Aspresented in the figure, most of the data points were located near the diagonal line, which indi-cated that the model predictions were pretty close to the test data (coefficient of determination,
Figure 13. The predicted and measured dry unit weight of the FA and LKD stabilised soils.
Dow
nloa
ded
by [
Mis
sour
i S &
T],
[D
r X
IN K
AN
G]
at 1
3:05
13
Apr
il 20
15

14 X. Kang et al.
R2 = 0.7321). Therefore, the compaction quality check results could be obtained by using theaforementioned equation to carry out the BCD and thermal conductivity test measurements:
ρd
ρd max= 0.451
BCDBCDopt
+ 0.618Kopt
K, (9)
ρd
ρd max= 0.521
BCDBCDopt
+ 0.568Kopt
K. (10)
Effects of FA and LKD on the UCS and BCD modulusTest results from mechanical tests, such as moisture density relationship test, unconfined com-pression test, and BCD modulus test all showed that the FA and LKD could effectively stabilisesoft soils, increase the maximum dry unit weight, improve the UCS, and enhance the small-strainmodulus.
The mechanism of how FA and LKD stabilise soil has been studied extensively in theliterature. The major reason was attributed to the pozzolanic reactions that enhanced the physic-ochemical bonding between soils and FA particles (Lloyd et al., 2009; Saylak et al., 2008; Shonet al., 2010). Based on the observed test data, the strength and stiffness enhancement of the FA–soil mixture could be categorised into two groups, the short-term strength gain, and long-termstrength gain, respectively. The short-term strength gain of FA–soil mixture is usually attributedto the cation exchange process. When FA is added to soil, FA particles react with moistureand start hydration. Due to hydration, large amounts minerals, such as lime (CaO), anhydrite(CaSO4), periclase (MgO), quartz, and tricalcium aluminate are dissolved; thus, the conductivityof the solution increases gradually (see Figure 14). The trivalent cation (Al3+) and divalent cation(Ca2+) available from FA are attracted to clay particles by the cation exchange process. Lowervalence cations (H+, Na+, and K+) are replaced by those higher valence cations. The electrolyteconcentration in the soil matrix is thus increased and the electrical diffuse double layer (DDL)at the particle–liquid interface is compressed. The adsorption of cation (Al3+ and Ca2+) andreduction of the thickness of the DDL promote the particulates to flocculate. Flocculation resultsin increased pore solution surface tension, producing an increase in apparent cohesion between
Figure 14. Electrical conductivity change versus FA content.
Dow
nloa
ded
by [
Mis
sour
i S &
T],
[D
r X
IN K
AN
G]
at 1
3:05
13
Apr
il 20
15

Road Materials and Pavement Design 15
soil particles, and thus improves the early strength and compatibility. In addition, the reduction ofthe thickness of the DDL could reduce the repulsion force and increase the van der Waals attrac-tion force among clay particles. The increase in the attractive force is equivalent to an increasein the “effective stress” which will increase the parameters that reflect the resistance of the soilto deformation (Lambe, 1960; Matsui, Ito, Mitchell, & Aben, 1980; Mitchell, 1993; Mitchell &Soga, 2005; Santamarina, Klein, & Fam, 2001; Van Olphen, 1977). This assumption could bedirectly supported by the increase in the pore fluid conductivity measured from the FA watersystem (Figure 14), and indirectly supported by the observations of the change in the moisturedensity relationship and the initial UCS gain. The addition of the FA was found to increase themaximum dry unit weight and the initial UCS.
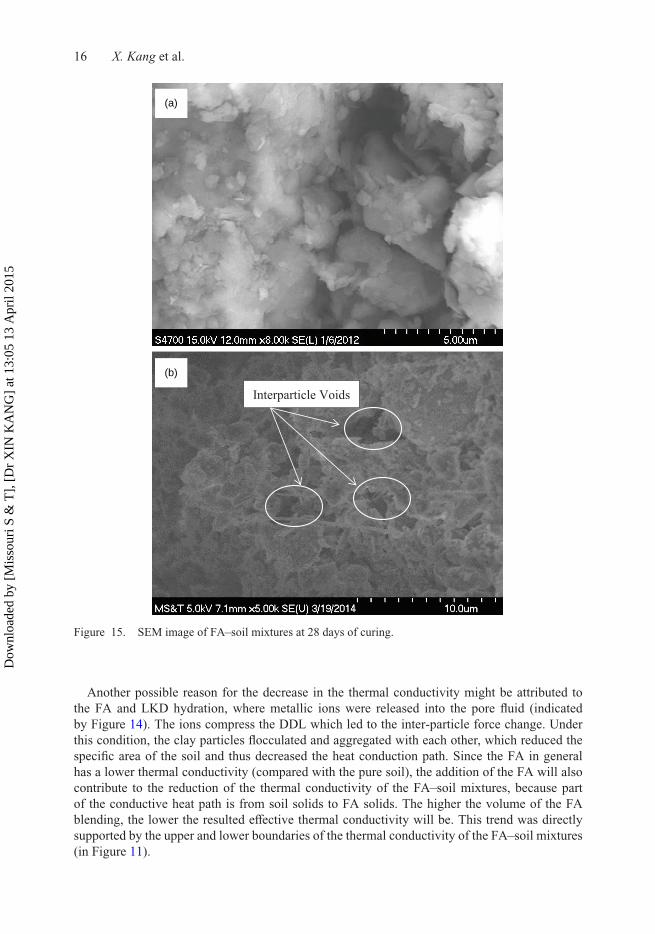
The long-term strength of the stabilised soil is associated with curing time. The strength gainis attributed to the pozzolanic reactions. Generally the pozzolanic reaction is slow and is evenslowed further by the formation of a shell of calcium silicate hydrate (CSH) gel around FAparticles (Figure 15). The reaction rate and strength gain are proportional to the consumption ofCa(OH)2. Janz and Johansson (2002) defined pozzolanic material, and the pozzolanic reaction ofFA can be briefly described as follows:
CaO + H2O → Ca(OH)2, (11)
Ca(OH)2 + Pozzolana + H2O → CSH(CASH), (12)
where CASH is calcium aluminate silicate hydrate.The BCD modulus increased as the curing time increased, which directly supported that the
non-destructive testing method could be used as a fast method to check a compacted soil in thefield. As curing time increased, soil particles were gradually bonded with the adjacent particlesby the pozzolanic products, which resulted in an increase in the packing density and change in thestress–strain response; thus, the compressibility, strength, and small-strain modulus all increasedat the macro scale.
Effects of FA and LKD on the thermal conductivityDifferent from the strength properties, thermal conductivity of the treated soil decreased as thecuring time increased. This is mainly attributed to the fact that the thermal conductivity of FAis normally lower than that of minerals in natural geomaterials (Figure 10). Meanwhile, as thecuring time increases, the thermal conductivity of the FA–soil mixtures decreases gradually. Thedecrease in the thermal conductivity within the curing time at different FA mixing ratios can beexplained by the following mechanisms. Immediately after compaction, the thermal conductiv-ity of the specimens is affected by the addition of FA. As the curing time increases, water isconsumed by evaporation and hydration, and a pozzolanic product produced. It is known thatthe soil thermal properties are strongly influenced by the soil volumetric water content, vol-ume fraction of solids, and volume fraction of air. Air is a poor thermal conductor (K = 0.026W/mK) and reduces the effectiveness of the solid and liquid phases to conduct heat. It is spec-ulated that due to the high degree of pozzolanic reactions, a large portion of the pore water hasbeen consumed, which in turn induces large number of inter-particle pore voids or even someinvisible desiccation cracks. The more inter-particle pore voids and invisible cracks developed(equivalent to more air inside), the less the thermal conductivity would be. Scanning electronmicroscopy (SEM) technique was adopted to verify the microstructure of the FA treated soil.The inter-particle pore voids were clearly seen from the SEM images (see Figure 15), whichindirectly supported the decrease in the effective thermal conductivity over curing. Finally, at theend of the curing period, the thermal conductivities of the specimens are governed primarily bythe newly formed structures.
Dow
nloa
ded
by [
Mis
sour
i S &
T],
[D
r X
IN K
AN
G]
at 1
3:05
13
Apr
il 20
15
16 X. Kang et al.
(a)
(b)
Figure 15. SEM image of FA–soil mixtures at 28 days of curing.
Another possible reason for the decrease in the thermal conductivity might be attributed tothe FA and LKD hydration, where metallic ions were released into the pore fluid (indicatedby Figure 14). The ions compress the DDL which led to the inter-particle force change. Underthis condition, the clay particles flocculated and aggregated with each other, which reduced thespecific area of the soil and thus decreased the heat conduction path. Since the FA in generalhas a lower thermal conductivity (compared with the pure soil), the addition of the FA will alsocontribute to the reduction of the thermal conductivity of the FA–soil mixtures, because partof the conductive heat path is from soil solids to FA solids. The higher the volume of the FAblending, the lower the resulted effective thermal conductivity will be. This trend was directlysupported by the upper and lower boundaries of the thermal conductivity of the FA–soil mixtures(in Figure 11).
Dow
nloa
ded
by [
Mis
sour
i S &
T],
[D
r X
IN K
AN
G]
at 1
3:05
13
Apr
il 20
15

Road Materials and Pavement Design 17
ConclusionsProctor compaction test, unconfined compression test, and non-destructive tests (BCD modulusand thermal conductivity) were carried out on chemically stabilised pavement base soils. Mixingof 20 wt% FA could increase the dry unit weight of the FA–soil mixture from 16.8 to 17.4 kN/m3
(105.0–108.3 pcf), enhance the UCS from 181.2 to 497.2 kPa (at the end of 28 days of curing),and raise the small-strain BCD modulus up to 40 MPa. Similarly, the 8 wt% of LKD could alsoeffectively improve the UCS up to 330.3 kPa and BCD modulus up to 37 MPa; however, thedry unit weight slightly decreased as the LKD mixing ratio increased. The thermal conductivitydecreased as the curing time and stabiliser mixing ratio increased; for instance, the thermal con-ductivity of 10 wt% FA–soil mixture decreased from 1.67 to 1.47 W/mK at the end of 28 daysof curing. Parallel and series models were employed to understand the upper-and-lower boundof the mixtures’ thermal conductivity. A thermal strength coupled empirical model which incor-porated the non-destructive testing results was developed to predict the UCS strength gain overcuring time. In addition, the thermal conductivity and BCD modulus were also incorporated intoa novel compaction quality check model. Based on the observed test results, both the modelswere found to be useful for evaluating the quality of soil stabilisation and offer cost-effectiveways for predicting the small-strain modulus in practice.
Disclosure statementNo potential conflict of interest was reported by the authors.
ORCIDLouis Ge http://orcid.org/0000-0002-1150-3733
ReferencesAbuel-Naga, H. M., Bergado, D. T., & Bouazza, A. (2008). Thermal conductivity evolution of saturated
clay under consolidation process. International Journal of Geomechanics, 8(2), 114–122.Abu-Hamdeh, N. H., & Reeder, R. C. (2000). Soil thermal conductivity: Effects of density, moisture, salt
concentration, & organic matter. Soil Science Society of America Journal, 64, 1285–1290.Bachmann, J., Horton, R., Ren, T., & van der Ploeg, R. R. (2001). Comparison of the thermal prop-
erties of four wettable and four water-repellent soils. Soil Science Society of America Journal, 65,1675–1679.
Balland, V., & Arp, P. A. (2005). Modeling soil thermal conductivities over a wide range of conditions.Journal of Environmental Engineering and Science, 4, 549–558.
Brandon, T. L., & Mitchell, J. K. (1989). Factors influencing thermal resistivity of sands. Journal ofGeotechnical Engineering, 115(12), 1683–1698.
Brandon, T. L., Mitchell, J. K., & Cameron, J. T. (1989). Thermal instability in buried cable backfills.Journal of Geotechnical Engineering, 115(1), 38–55.
Briaud, J., Li, Y., & Rhee, K. (2006). BCD: A soil modulus device for compaction control. Journal ofGeotechnical and Geoenvironmental Engineering, 132(1), 108–115.
Burnham, J. C., Hatfield, N., Bennett, G. F., & Logan, T. J. (1992). Use of kiln dust with quicklime foreffective municipal sludge pasteurization and stabilization with the N-Viro Soil process. ASTM SpecialTechnical Publication, 1135, 128–141.
Cetin, B., Aydilek, A. H., & Guney, Y. (2010). Stabilization of recycled base materials with high carbon flyash Resources. Conservation and Recycling, 54(11), 878–892.
Chitambira, B. (2004). Accelerated ageing of cement stabilized/solidified contaminated soils with elevatedtemperatures (Ph.D. dissertation). University of Cambridge, Cambridge, UK.
Cokca, E. (2001). Use of class C fly ashes for the stabilization of an expansive soil. Journal of Geotechnicaland Geoenvironmental Engineering, 127(7), 568–573.
Dow
nloa
ded
by [
Mis
sour
i S &
T],
[D
r X
IN K
AN
G]
at 1
3:05
13
Apr
il 20
15

18 X. Kang et al.
Daita, R. K., Drnevich, V. P., Kim, D., & Chen, R. (2006). Assessing the quality of soils modified with limekiln dust measuring electrical conductivity with time domain reflectometry. Transportation ResearchRecord. Journal of the Transportation Research Board, 1952, 101–109.
Heckel, G., & Wahab, R. (1996). Soil stabilization utilizing alternative waste materials. Proceedings of theMaterials Engineering Conference, Washington, DC, 318–327.
Horpibulsuk, S., Rachan, R., & Raksachon, Y. (2009). Role of fly ash on strength and microstructuredevelopment in blended cement stabilized silty clay. Soils and Foundations, 49(1), 85–98.
Hotz, R. D., & Ge, L. (2010). Investigation of the thermal conductivity of compacted silts and its correlationto the elastic modulus. Journal of Materials in Civil Engineering, 22(4), 408–412.
Janz, M., & Johansson, S. (2002). The functions of different binding agents in deep stabilization (SwedishDeep Stabilization Research Center Rep. No. 9). Linkoping: Swedish Geotechnical Institute.
Kamruzzaman, A. H., Chew, S. H., & Lee, F. H. (2009). Structuration and destructuration behavior ofcement-treated Singapore marine clay. Journal of Geotechnical and Geoenvironmental Engineering,135(4), 573–589.
Kang, X., Kang, G., & Ge, L. (2013). Modified time of setting test for fly ash paste and fly ash-soil mixtures.Journal of Materials in Civil Engineering, 25(2), 296–301.
Kang, X., Kang, G-C., Chang, T-K., & Louis, G. (2014). Chemically stabilized soft clays for road baseconstruction. Journal of Materials in Civil Engineering. doi:10.1061/(ASCE)MT.1943-5533.0001156
Lambe, T. W. (1960). A mechanistic pic of shear strength of clay. Proc. research conf. on shear strength ofcohesive soils, ASCE, New York, 555–580.
Lloyd, R. R., Provis, J. L., & van Deventer, J. S. J. (2009). Microscopy and microanalysis of inorganicpolymer cements.2: The gel binder. Journal of Materials Science, 44, 620–631.
Matsui, T., Ito, T., Mitchell, J. K., & Aben, N. (1980). Microscopic study of shear mechanisms in soils.Journal of the Geotechnical Engineering Division, ASCE, 106(2), 137–152.
McManis, K. L., & Arman, A. (1989). Class C fly ash as full or partial replacement for Portland cement orlime. Transportation Research Record, 1219, 68–81.
Miller, M. M., & Callaghan, R. M. (2004). Lime kiln dust as a potential raw material in Portland cementmanufacturing (Department of the Interior Geological Survey Open-File Report 2004–1336). Retrievedfrom http://pubs.usgs.gov/of/2004/1336/2004-1336.pdf
Misra, A. (1998). Stabilization characteristics of clays using class C fly ash. Transportation ResearchRecord, 1611, 46–54.
Mitchell, J. K. (1993). Fundamentals of soil behaviors (2nd ed.). New York, NY: John Wiley and Sons.Mitchell, J. K., & Soga, K. (2005). Fundamentals of soil behavior (3rd ed.). New York, NY: John Wiley
and Sons, 577pp.Ochsner, T. E., Horton, R., & Ren, T. (2001). A new perspective on soil thermal properties. Soil Science
Society of America Journal, 65, 1641–1647.Puppala, A. J., Ramakrishna, A. M., & Hoyos, L. R. (2003). Resilient moduli of treated clays from repeated
load triaxial test. Transportation Research Record, 1821, 68–74.Santamarina, J. C., Klein, K. A., & Fam, M. A. (2001). Soils and waves – particulate materials behavior,
characterization and process monitoring. New York, NY: John Wiley and Sons.Saylak, D., Mishra, S. K., Mejeoumov, G. G., & Shon, C-H. (2008). Fly ash-calcium chloride stabilization
in road base construction. Transportation Research Record: Journal of the Transportation ResearchBoard, 2053, 23–29.
Shon, C-H., Saylak, D., & Mishra, S. K. (2010). Combined use of calcium chloride and fly ash in road basestabilization. Transportation Research Record: Journal of the Transportation Research Board, 2186,120–129.
Solanki, P., Zaman, M. M., & Dean, J. (2010). Resilient modulus of clay subgrades stabilized with lime,class C fly ash, & cement kiln dust for pavement design. Transportation Research Record: Journal ofthe Transportation Research Board, 2186, 101–110.
Sunitsakul, J., Sawatparnich, A., & Sawangsuriya, A. (2012). Prediction of unconfined compressivestrength of soil-cement at 7 days. Geotechnical and Geological Engineering, 30(1), 263–268.
Tan, T. S., Goh, T.-L., & Yong, K.-Y. (2002). Properties of Singapore marine clays improved by cementmixing. Geotechnical Testing Journal, 25(4), 422–433.
Tuncer, B. E., Hector, A., & Craig, H. B. (2006). Stabilizing soft fine-grained soils with fly ash. Journal ofMaterials in Civil Engineering, 18, 283–294.
Van Olphen, H. (1977). Clay colloid chemistry (2nd ed.). New York, NY: Wiley.Weidinger, D. M., & Ge, L. (2009). Laboratory evaluation of the Briaud compaction device. Journal of
Geotechnical and Geoenvironmental Engineering, 135(10), 1543–1546.
Dow
nloa
ded
by [
Mis
sour
i S &
T],
[D
r X
IN K
AN
G]
at 1
3:05
13
Apr
il 20
15