Embed Size (px)
Citation preview

DRAFT
LBNL 58742
ERNEST ORLANDO LAWRENCE BERKELEY NATIONAL LABORATORY
Laboratory Evaluation of Residential Furnace Blower Performance I.S. Walker and J.D. Lutz Environmental Energy Technologies Division September 2005
1

DRAFT
This work was supported by the Assistant Secretary for Energy Efficiency and Renewable Energy, Building Technologies Program, of the U.S. Department of Energy under contract No. DE-AC02-05CH11231. The research reported here was also funded by the California Energy Commission, Award Number 500-04-005. Publication of research results does not imply CEC endorsement of or agreement with these findings. This report was also supported in part by work sponsored by the California Energy Commission (Energy Commission). It does not necessarily represent the views of the Energy Commission, its employees, or the State of California. The Energy Commission, the State of California, its employees, contractors, and subcontractors make no warranty, express or implied, and assume no legal liability for the information in this report, nor does any party represent that the use of this information will not infringe upon privately owned rights. This report has not been approved or disapproved by the Energy Commission nor has the Energy Commission passed upon the accuracy or adequacy of the information in this report.
2

DRAFT
Disclaimer This document was prepared as an account of work sponsored by the United States Government. While this document is believed to contain correct information, neither the United States Government nor any agency thereof, nor The Regents of the University of California, nor any of their employees, makes any warranty, express or implied, or assumes any legal responsibility for the accuracy, completeness, or usefulness of any information, apparatus, product, or process disclosed, or represents that its use would not infringe privately owned rights. Reference herein to any specific commercial product, process, or service by its trade name, trademark, manufacturer, or otherwise, does not necessarily constitute or imply its endorsement, recommendation, or favoring by the United States Government or any agency thereof, or The Regents of the University of California. The views and opinions of authors expressed herein do not necessarily state or reflect those of the United States Government or any agency thereof, or The Regents of the University of California.
Ernest Orlando Lawrence Berkeley National Laboratory is an equal opportunity employer.
3

DRAFT
Abstract A testing program was undertaken at Lawrence Berkeley National Laboratory and an electric utility (Pacific Gas and Electric Co.) to compare the performance of furnace blowers. This laboratory testing program was undertaken to support potential changes to California Building Standards regarding in-field furnace blower energy use. This technical support includes identifying suitable performance metrics and target performance levels for use in standards. Five different combinations of blowers and residential furnaces were tested for air moving performance. Three different types of blower and motor combinations were tested in two different furnace cabinets. The blowers were standard forward–curved impellors and a prototype impeller with reverse-inclined blades. The motors were two 6-pole permanent split capacitor (PSC) single-phase induction motors, a brushless permanent magnet (BPM) motor and a prototype BPM designed for use with a prototype reverse-inclined impellor. The laboratory testing operated each blower and furnace combination over a range of air flows and pressure differences to determine air flow performance, power consumption and efficiency. Additional tests varied the clearance between the blower housing and the furnace cabinet, and the routing of air flow into the blower cabinet. Introduction The blowers in residential furnaces typically move the heated air through a duct system that distributes heat and then returns it to the furnace. Usually the blowers are double inlet models with the inlets to the centrifugal blower at both sides. The motor mounts inside the inlet cone on one side. If a house has central air-conditioning, the same blower is usually used to move the cooled air throughout the house. Although furnaces, air conditioners and heat pumps have become significantly more efficient over the last couple of decades, residential forced air system blowers have not experienced similar improvement. The most common blowers have been shown by in-field testing to have efficiencies of only 10% to 15% (Phillips 1998 & 1995 Gusdorf et al. 2002). These low efficiencies indicate that there is significant room for improvement of both electric motor and the aerodynamic performance of furnace blowers. An important consideration in analyzing forced air system blowers is that essentially all of the wasted electricity is manifested as heat. This extra heat reduces air conditioning cooling and dehumidification performance and effectively acts as fuel switching for fossil fuelled furnaces. For electric furnaces, this heat substitutes directly for the electric resistance heating elements. For heat pumps, this heat substitutes for vapor compression-based high COP heating and effectively reduces the COP of the heat pump.
4

DRAFT
Proposed Blower Performance Specifications To put the laboratory test results into some context consider the proposed prescriptive standard for the 2008 California Building Energy Standards is that: “Furnace fans in new homes shall simultaneously demonstrate a watt draw less than 400 W/1000 cfm (2.5 cfm/W) and a cooling flow greater than 350 cfm/ton of nominal cooling capacity with a wet coil.”. These requirements would be evaluated by field testing of installed systems. For testing with a dry coil there will need to be some derating applied to the field test data. It is possible that there will be a similar rating specification for houses with no cooling, but in terms of cfm/kBtuh. The 2.5 cfm/W performance level is critical because (as the test results show) the majority of furnace blowers (which use PSC motors) operate very close to this specification, such that relatively small changes in performance (for example due to duct flow resistance, cabinet restriction, return ducting geometry) can be critical for meeting the specification. Residential Blower Characteristics PSC motors with forward inclined blade blower wheels This is by far (>90% of the residential market) the dominant air handler used today. The single-phase permanent split capacitor (PSC) motor are six-pole induction motors with a synchronous rotation speed of 1200 rpm. Multiple taps are used to operate at several fixed speeds over a range of air flow rates, with highest air flows about 1.5 times the lowest air flows. The speed is set by using different taps that result in different slip, or lag from synchronous speed, of the rotor. Different speeds are necessary to match the different airflow requirements for heating and cooling operation and allow a single blower to have a wider range of applications than if it operated at a single speed. Speed is controlled by changing jumpers on the control board located on the fan housing and/or spade-lug connectors on the motor. The relatively constant rotational speed at each tap means that the air flow is highly variable with static pressure. As shown in Figure 1, the blower wheel has many narrow chord forward curved bent sheet metal blades, with large gaps between the wheel and housing. The housing has one opening on each side with the direct drive motor located in one of these openings (Figure 2), and a rectangular discharge. This side entry means that the air flow pattern inside the air handler cabinet is fairly convoluted as air typically enters the bottom of cabinet, flows around the housing then changes direction 90° to enter the blower wheel. Also, unlike older belt-drive blowers, the mounting of the electric motor in the inlet restricts the flow on that side of the fan.
5

DRAFT
Small forward curved blades
Big Gaps
Figure 1. Blower viewed from the air exit.
Figure 2. Fan housing inlet with direct drive PSC motor BPM motors and forward inclined blade blower wheels The second motor type tested was a brushless permanent magnet (BPM) motor. These motors electronically control the rotating stator field by shifting the field to different coils in the windings. The rotor consists of permanent magnets directly mounted on the shaft of the motor. By varying the voltage and frequency of the electrical current to the stator coils, the
6

DRAFT
motor can be made to rotate over a wide range of speeds and torques. By programming controls based on the performance of the blower, the blower and motor combination can provide a constant air flow across a wide range of static pressures. Because the magnetic field of the rotor is provided by permanent magnets, this type of motor is more efficient than a PSC induction motor, where the field in the rotor is induced by the current caused by the rotating magnetic field of the stator coils. A key characteristic related to their wide speed range is their ability to operate at much lower air flow rates, making them more suitable for continuous fan operation for mixing and/or distribution of ventilation air. The ability to operate at much lower air flows (usually about 2.5 times less than the maximum air flow) results in considerably less power being used at low fan speeds. The blower wheel and housing are the same as those used with PSC motors. Prototype Blower A couple of years ago, the U.S. Department of Energy funded development of a prototype blower with backward inclined impellor blades (shown in Figure 3). To achieve the same airflows the impellor rotates faster than impellors with forward curved blades. Because of the narrower inner diameter and the higher rotational speed of the impellor (up to 2000 rpm compared to a maximum of 1175 rpm for the forward inclined blower, or a little below the 1200 rpm synchronous speed of the PSC motor), a new generation BPM was developed for this blower. Because of the higher rotational speeds to achieve the required air flow, this impellor could not be used with a PSC motor. A report by Weigman et al. (2003) discusses the development of the prototype air handler in detail. This report disaggregated the efficiency increases for different technical aspects of the prototype air handler: the use of rear (or backward) inclined blades (5 to 10% improvement), using inlet cones to condition the flow (2 to 4% improvement), increasing the outlet area (principally height) of the blower housing (5 to 12% improvement), and cabinet effects (inlet cones reduce efficiency losses compared to outside cabinet testing from 6% to 1%).
7

DRAFT
Large aerodynamic backward curved blades
Small Gap
Figure 3. Prototype blower showing different blade design and fan to housing
clearances compared to the standard blower in Figure 1. Comparing blower performance The blowers were compared by examining their air flow and power consumption characteristics over a wide range of operating pressures. Criteria for evaluation included:
• How air flow rates change with system air flow resistance • Performance changes with changes in operating speed • Comparing air flow and power consumption at typical operating conditions • Comparing blower efficiency (output air power divided by electricity input) • Comparing cfm/W ratings (the performance metric most likely to be used by
rating schemes)
8

DRAFT
Efficiency Calculations The efficiency is defined as the air power divided by the electric power consumption of the electric motor and includes both electric and aerodynamic effects. The air power is defined as the volumetric air flow through the blower multiplied by the pressure difference across the blower.
WPQ∆
=η
Where η is the efficiency, Q the air flow (m3/s), ∆P the pressure difference (Pa) and W is the electric power (Watts). The pressure difference is the difference in total pressure (static plus velocity) between the blower inlet and exit. In practice, static pressure is often used because the velocity pressures are low. To determine the efficiency of the blower the pressure difference needs to be measured at the inlet to the blower wheel and at the blower exit. These locations are difficult to access and the complexity of the flow field at these locations adds considerable difficulty and uncertainty to these measurements. In field applications, “external static” pressure is used. That is the pressure difference between the return plenum/blower cabinet and the supply plenum. This pressure difference includes pressure drops in the cabinet itself and across the furnace heat exchanger. For systems including cooling coils, this external static pressure will also include pressure drop across the coil. In this study, the LBNL tests measured static pressures in the blower cabinet and supply plenum as well as total pressure at the fan exit (before the furnace heat exchanger). For the figures and analysis, the external static (plenum-to-plenum) pressure difference was used as this is the pressure difference that will be used in field tests and the applicability of the test results will be discussed in terms of application to possible future field testing requirements in building codes. Interpreting cfm/W ratings When interpreting cfm/W results it is important to realize that there is a limit on cfm/W ratings for 100% efficient operation: 8.5 cfm/W/static pressure (in. water) or 2120 cfm/W/static pressure (Pa). E.g., at 0.5 in. water (125 Pa) the theoretical limit is 17 cfm/W. This is illustrated graphically in Figure 4 that shows the large potential benefits for low static pressure systems.
9

DRAFT
0
10
20
30
40
50
60
70
80
90
100
0 50 100 150 200 250 300
Static Pressure (Pa)
Idea
l cfm
/W0.0 0.2 0.4 0.6 0.8 1.0 1.2
Static Pressure (in. water)
Ideal
Typical ResidentialAir Handler
Figure 4. Maximum theoretical cfm/W for different static pressures compared to a typical residential unit Previous Field and Laboratory Studies Field studies by many researchers (see Bibliography) have shown that existing fans in residential air handlers typically consume about 500W, supply about 2 cfm/W and have efficiencies on the order of 10% to 15%. In particular, California homes showed a higher than average consumption of about 570W (Proctor and Parker 2000 and Wilcox 2004) and use 510W/1000 cfm or about 2 cfm/W. The results of the California Energy Commission field survey currently nearing completion (Chitwood 2005 – personal communication) that focuses on new construction in California show similar results, with an average of about 700W per system and 2 cfm/W. A CMHC (1993) study showed that typical furnace fan efficiencies are on the order of 15%, but poor cabinet and duct design can reduce this to about 7%. The spread from best to worst systems was on the order of ten to one indicating that it is possible to have much better performance using existing technologies. Another Canadian study by Phillips (1998 & 1995) performed field tests on 71 houses and found air handler efficiencies in the range of 10-15%. More recently, the Energy Center of Wisconsin (Pigg (2003) and Pigg and Talerico (2004)) tested 31 houses with new (less than three years old) furnaces during the heating season.
10

DRAFT
Almost all the BPM furnaces used more electricity in these real installations than their DOE test procedure ratings suggest: with a median of 82% above rated values. This was attributed to the static pressures in these field installations being much higher than those used in rating procedures. Test procedure external static pressures are typically 0.20 or 0.23 inches of water (50 or 75 Pa) depending on the capacity (DOE Furnace Test procedure1 and ARI (2003)). The measured field data showed a range of 0.24 to 1.9 inches of water (60 to 249 Pa) with an average of 0.5 inches of water (125 Pa) at the high fire rate.
Natural Resources Canada (Gusdorf et al. (2002 and 2003)) have tested two side-by-side calibrated test houses to evaluate the change in energy for using a BPM rather than a PSC motor for continuous fan operation as required in many Canadian houses. Laboratory tests of the air handlers used in the study showed PSC efficiencies in the range of 10 to 15% with BPM efficiencies of 17 to 18% over the range of flows used for heating and cooling. The biggest differences were for continuous operation where the BPM was six times more efficient than the PSC by being able to operate at about half the flow rate of the PSC during continuous operation. The results of this study showed that for a continuously operating fan in the heating season there was a 74% reduction in electricity use for using a BPM (26% of the whole-house electricity use). There is a corresponding increase in natural gas usage in the heating season of 14% to account for the reduction in waste heat from the electric motor. For cooling the savings were 48% of fan energy and 21% of all air conditioner use. Preliminary laboratory studies have been performed by LBNL (Walker et al. 2004) on furnace #1. In addition, LBNL obtained a second prototype and used an outside contractor to perform standardized testing on Furnace #3 (Biermayer et al. 2003). In the LBNl study the blowers were tested over a range of air flows and static pressures: 500 to 1000 cfm and 0.4 to 1.2 in. water (100 to 300 Pa). The test results showed that the prototype fan was about twice as efficient as a standard fan (23% compared to 12%). Another prototype was tested by Brookhaven National Laboratory (Andrews et al. 2003) and showed similar results. 1 Code of Federal Regulations, Title 10, Part 430, Subpart B, Appendix N, Uniform Test Method for Measuring the Energy Consumption of Furnaces and Boilers.
11

DRAFT
Furnace Blowers Tested Table 1 summarizes key characteristics of the furnaces and blowers tested in this study. A total of five combinations of furnaces and blowers were evaluated. Furnace #2 and #3 are essentially the same furnace, just with different blowers.
Table 1. Blower and Furnace Characteristics Furnace Blower & Blower motor Controls
Forward curved blades (10x7 Blower) with PSC motor (1/3 hp)
Speed taps on motor Furnace # 1 80 kBtu/h 2.5 – 3 Ton AC Prototype backward inclined with
prototype BPM motor Software on laptop
Furnace # 2 88 kBtuh 3.5 ton AC
Forward curved blades (10x8 Blower Size) with PSC motor (1/3 hp)
Speed taps on motor
Forward curved blades (10x8 Blower) with BPM motor (½ hp)
Circuit board in furnace Furnace # 3 2-stage, 88 kBtuh 1.5- 4 Ton AC Prototype backward inclined with
prototype BPM motor Software on laptop
The current study combines measurements made by an electric utility using a standard AMCA 210 (Laboratory Method of Testing Fans for Aerodynamic Rating Performance) type air handler test and LBNL laboratory tests. The furnaces were tested in a horizontal configuration. The burners did not operate during the test and no gas was hooked up. No cooling coils or filters were installed. In real field installations the cooling coils and filters will act as additional flow resistance leading to increased pressures across the blowers. LBNL Laboratory testing All the tests were conducted using the Energy Performance of Buildings Group full-scale duct system and test chamber (Figure 5). The test chamber is a 32’ long, 8’ wide, 8’ tall box (9.2 m x 2.4 m x 2.4 m) over a 4’ (1.2 m) “crawl-space”. The chamber is constructed using standard wood framing materials (two-by-fours and plywood), with all joints taped and sealed to reduce air leakage (chamber background leakage is about 60 cfm25 [100 L/s at 25 Pa]). The furnaces were placed on a stand outside the chamber and connected with insulated flexible ducting to the test chamber, as illustrated in Figure 6.
12

DRAFT
Figure 5. Exterior view of test chamber.
Flow Meter
Return Duct Supply
Plenum Furnace
Return Plenum Controlled
duct leaks
Figure 6. Air Handler Test Apparatus. Controlled duct leaks were used in duct leakage tests and were sealed for the air handler tests. Supply ducts are out of view on
the floor behind the furnace and plenums.
13

DRAFT
The duct system is comprised of the following components (in order of air flow from the chamber): return register, return flexible duct, large flow nozzle, return plenum, fan box, furnace, supply plenum, two main ducts, and ten supply registers. The supply ducts contain dampers that are used to modulate the air flow and pressures in the system. These two main ducts branch into ten individual ducts, each connected to a supply register. The supply ducts are made of flexible insulated duct and are mounted on hangers in the crawlspace. Total system airflow was measured using a high precision flow nozzle (±0.5% of measured flow) located in the return duct upstream of the return plenum (as illustrated in Figure 6). Fan inlet and exit pressures were measured upstream and downstream of the fan using electronic pressure sensors (±1.5% accuracy). The locations for these pressure measurements were carefully chosen after experimenting with several pressure probe placements in order to avoid unstable or extreme results caused by non-uniform flows. Downstream pressure measurements were taken between the fan outlet and the furnace heat exchanger (see Figure 7) and in the supply plenum. The fan outlet pressures were measured using a total pressure probe. The supply plenum pressures were determined by averaging together four static pressure probes in four corners of the plenum. The results given later use the supply plenum pressures. A photo-optical sensor was used to measure fan rotational speed as shown in Figure 8. Fan electrical power use was measured with a true power meter (±1%), which also gives details of power factor and an harmonic analysis. All the data were recorded using five second time averages after waiting for readings to stabilize (about two to three minutes).
Probe tip
Figure 7. Entry to Furnace #1 heat exchanger showing pressure probe location.
14

DRAFT
Optical sensor clamps
Reflective stripe
Figure 8. Rotational Speed Sensor Installation showing reflective stripe to generate pulse and photo sensor mounting
Blower noise levels were measured at the return grille as an indicator of occupant exposure and also outside the blower cabinet. In both cases the sound pressure level meter was pointed directly at the sound source. For the return grille measurements, the meter was placed one meter from the grille face pointed at the center of the grille. For the cabinet measurements the meter was located one meter from the blower cabinet access panel and centered on the access panel. All the results were A-weighted to represent human response. For each blower speed setting, the background noise level was recorded with the blower off. Air inlet size and location The standard or baseline performance was determined with the air entering each furnace through the bottom of the furnace. Return duct design and furnace placement often mean that air enters through the sides of the cabinet or through multiple locations. Air was ducted from the return plenum to the side entry via flexible duct as shown in Figure 9. To investigate the effects of different air entries, the following tests were performed: For Furnace #1, with the both the prototype and PSC motor the air entered through:
• Furnace bottom (Normal operation) • One 14 inch diameter duct on the motor side of the cabinet • One 14 inch diameter duct opposite the motor • Both 14 inch ducts – one on each side • Two 10 inch diameter ducts (one each side) plus the open bottom
15

DRAFT
Air Flow
Return plenum
To furnace
Figure 9. Furnace #3 with two 14 inch diameter side entry ducts. The furnace is mounted horizontally so the side entry is from the top and bottom in this photograph.
Figure 10. Fabricated Motor Side entry for Furnace #1
16

DRAFT
For furnace #3 BPM motor (at both 400 cfm/ton and 350 cfm/ton) air entered through:
• Furnace bottom (Normal operation) • One 14 inch diameter duct on the motor side of the cabinet • One 14 inch diameter duct opposite the motor • Both 14 inch ducts – one on each side
For furnace #3 with prototype motor and blower air entered through:
• Furnace bottom (Normal operation) • One 14 inch diameter duct on the motor side of the cabinet • One 14 inch diameter duct opposite the motor • Both 14 inch ducts – one on each side • Both 14 inch ducts plus the open bottom
For furnace #2 (PSC motor) all the tests were performed in the normal configuration. The side entry openings were fabricated by cutting holes of the appropriate diameter and inserting mounting flanges as illustrated in Figure 10. For the side entry only conditions the normal bottom opening was blocked from the inside. Restrictive Cabinets The effect of cabinet restrictions was evaluated by inserting rigid materials (either wall board or rigid insulation foam) against the walls of the cabinets that face the blower openings. Several thicknesses of materials were used. All the tests had the air entering the bottom of the cabinet (the normal configuration). The three furnace cabinets had the following clearances before any blocking:
• Furnace #1: two inches top and bottom (the furnaces were tested on their sides so the blower entries are at the top and bottom as viewed from the side)
• Furnace #2: three inches top and bottom • Furnace #3: three inches top (motor side) and two inches bottom
The following blocking geometries were evaluated:
• 0.5 inch • 1 inch • 1.5 inch (for Furnace #2 only) • For Furnace #3 the non-blocked clearance was asymmetric, with 3 inches on
one side and 2 inches on the other. For this furnace we examined hhaving different blocking on the two sides, with 1 inch an 1.5 inch blocking. This left gaps of of 2 inches and 0.5 inches respectively.
17

DRAFT
Cabinet
Blocking
2” 1”
Air flow
Figure 11. Illustration of blocking added to restrict fan inlet clearance.
One inch gap
Foam board
Two inch gap
Figure 12. Standard fan in cabinet with no restriction (left) and with added foam board restriction (right).
18

DRAFT
Electric Utility Tests The tests performed at the electric utility used an apparatus similar to those illustrated in AMCA 210 (1999. The furnaces were mounted horizontally, with the bottom of the furnaces open to the room (Figure 13). Air exiting the furnace traveled through a duct system to an array of flow nozzles (Figure 14) that were used to measure the air flow rate. An auxiliary fan at the exit of the apparatus was used to control the air flows and system pressures. The use of this auxiliary fan allowed these tests to achieve lower pressure differences than the LBNL tests whose minimum air flow was set by the resistance of the duct system. Static pressure differences were measured relative to the room from which the furnace drew air. The static pressure was measured downstream of the furnace exit using a tubing ring connecting four duct taps. Thus, the utility test results are comparable to the LBNL test results using the plenum pressures (rather than the pressures measured between the fan outlet before the furnace heat exchanger). Other information, such as air temperatures, barometric pressure, motor power consumption and rotational speed were recorded together with the air flows and pressures. The same five furnace/blower combinations as used in the LBNL study were tested. All the tests were with air entering through the bottom of the furnace with no attached return plenum. There were no tests with additional blocking and no sound measurements were made.
Figure 13. Furnace mounted in electric utility test apparatus
19

DRAFT
Figure 14. Flow nozzles in electric utility test apparatus
20

DRAFT
LBNL Laboratory Results For furnace #1 the test results in Figure 15 show that the prototype with its BPM is better at maintaining air flow as pressure differences increase. The PSC motor data show a distinct pressure performance limit of about 300 Pa (1.2 in. water), whereas that prototype can operate at up to 500 Pa. The prototype shows a gradual decrease in flow with increased pressure difference due to being operated in a constant torque mode. Usually BPM blowers operate to maintain a constant flow (see Figure 16 for furnaces 2 and 3). This maintenance of air flow at higher pressures is reflected in the power consumption data that shows a gradual increase with pressure for the prototype, but a reduction with increasing pressure for the PSC. The power consumption results for the prototype with the BPM shows how low flow operation can be done with very low power consumption (less than 100W) compared to the PSC. Because high cfm/W ratings and low power consumption can be obtained for a BPM motor by operating at low air flows (and correspondingly low system pressures) any performance specification should include am minimum air flow rate. This is because air conditioner (and to a much lesser extent furnace) performance decreases as air flow is lowered. In addition, flow reductions for PSC blowers at high operating pressures could result in lower air conditioner performance that needs to be avoided. The peak efficiency for the PSC occurs at about 250 Pa (1 in. water) for all the speed settings. For the prototype, the pressure corresponding to peak efficiency increases at higher speeds/torque settings, and is generally about double the PSC efficiency. In terms of cfm/W, the PSC shows little pressure related variation and is close to 2 cfm/W for all fan speeds until about 200 Pa (0.8 in. water). Above this pressure the cfm/W declines rapidly. For the prototype, the cfm/W rating is close to 10 at low speeds and pressures, and declines to about 2 cfm/W (same as the low pressure difference PSC values) as the pressure increases to 300 Pa. If we consider a typical duct system operating at 200 Pa (0.8 in. water) static pressure and 365 cfm/ton or 1095 cfm for a three ton system we can estimate the performance of these two air handlers at this operating point. The PSC uses about 610 W at 1.9 cfm/W or 525 W/1000 cfm. This result is close to those found in field surveys for PSC motors. The prototype uses about 370W at 2.8 cfm/W or 357 W/1000cfm. In heating mode we can determine the new operating point by assuming the same duct system, but having the PSC operate at med-high speed. This results in a new air flow rate of about 950 cfm at a static pressure of 170 Pa (0.7 in. water). At this point the PSC uses 450 W at 2.15 cfm/W or 465W/1000cfm and the prototype uses 275 W at 3.4 cfm/W or 290 W/1000cfm. The results for furnace #2 in Figure 17 show that the two cfm/ton settings for the BPM result in very similar results, with the 400 cfm/ton setting providing higher air flow. For furnaces 2 and 3 the PSC results are similar to furnace #1, with cfm/W ratings between 2 and 2.5 up to 200 Pa (0.8 in. water) then declining as pressures increase. There is a large (30%) reduction in air flow at typical operating pressure differences of 200 Pa (0.8 in. water). The BPM results show almost constant flow up to about 300 Pa (1.2 in. water) at higher speeds. At 200 Pa (0.8 in. water) the BPM operates at about 3 cfm/W, increasing at lower pressures to about 7 cfm/W at typical rating conditions (about 50 Pa (0.2 in. water)). At pressures greater than 300 Pa (1.2 in. water) the BPM drops below 2 cfm/W.
21

DRAFT
Furnace #1 PSC
0
200
400
600
800
1000
1200
1400
0 100 200 300 400 500 600
Supply-Return Pressure Difference (Pa)
Air F
low
(cfm
)HighMed-HighMed-LowLow
Furnace #1 Prototype
0
200
400
600
800
1000
1200
1400
0 100 200 300 400 500 600
Supply-Return Pressure Difference (Pa)
Air
Flow
(cfm
)
T19T17T14T11T10T8T8oT5
Furnace#1 PSC
0
100
200
300
400
500
600
700
0 100 200 300 400 500 600
Supply-Return Pressure Difference (Pa)
Pow
er C
onsu
mpt
ion
(W)
HighMed-HighMed-LowLow
Furnace #1 Prototype
0
100
200
300
400
500
600
700
0 100 200 300 400 500 600
Supply-Return Pressure Difference (Pa)
Pow
er C
onsu
mpt
ion
(W)
T19T17T14T11T10T8T8oT5
Furnace #1 PSC
0
5
10
15
20
25
30
35
40
0 100 200 300 400 500 600
Supply-Return Pressure Difference (Pa)
Effic
ienc
y (%
)
HighMed-HighMed-LowLow
Furnace #1 Prototype
0
5
10
15
20
25
30
35
40
0 100 200 300 400 500 600
Supply-Return Pressure Difference (Pa)
Effi
cien
cy (%
)
T19T17T14T11T10T8T8oT5
Furnace #1 PSC
0
1
2
3
4
5
6
7
8
9
0 100 200 300 400 500 600
Supply-Return Pressure Difference (Pa)
cfm
/W
HighMed-HighMed-LowLow
Furnace #1 Prototype
0
1
2
3
4
5
6
7
8
9
0 100 200 300 400 500 600
Supply-Return Pressure Difference (Pa)
cfm
/W
T5T8T8oT10T11T14T17T19
Figure 15. Furnace #1 test results.
22

DRAFT
Furnace #2 PSC
0
200
400
600
800
1000
1200
1400
1600
0 100 200 300 400 500 600
Supply-Return Pressure Difference (Pa)
Air F
low
(cfm
)HighMed-HighMedLow
Furnace #3 Prototype
0
200
400
600
800
1000
1200
1400
1600
0 100 200 300 400 500 600
Supply-Return Pressure Difference (Pa)
Air
Flow
(cfm
)
HighMed HighMedLow
Furnace #2 PSC
0
100
200
300
400
500
600
700
0 100 200 300 400 500 600
Supply-Return Pressure Difference (Pa)
Pow
er C
onsu
mpt
ion
(W)
HighMed-HighMedLow
Furnace #3 Prototype
0
100
200
300
400
500
600
700
0 100 200 300 400 500 600
Supply-Return Pressure Difference (Pa)
Pow
er C
onsu
mpt
ion
(W)
HighMed HighMedLow
Furnace #2 PSC
0
5
10
15
20
25
30
35
40
0 100 200 300 400 500 600
Supply-Return Pressure Difference (Pa)
Effic
ienc
y (%
)
HighMed-HighMedLow
Furnace #3 Prototype
0
5
10
15
20
25
30
35
40
0 100 200 300 400 500 600
Supply-Return Pressure Difference (Pa)
Effic
ienc
y (%
) HighMed HighMedLow
Furnace #2 PSC
0
1
2
3
4
5
6
7
8
9
10
0 100 200 300 400 500 600
Supply-Return Pressure Difference (Pa)
cfm
/W
HighMed-HighMedLow
Furnace #3 Prototype
0
1
2
3
4
5
6
7
8
9
10
0 100 200 300 400 500 600
Supply-Return Pressure Difference (Pa)
cfm
/W
HighMed HighMedLow
Figure 16. Furnace #2 and #3 test results.
23

DRAFT
Furnace #3 350 cfm/ton BPM
0
200
400
600
800
1000
1200
1400
1600
0 100 200 300 400 500 600
Supply-Return Pressure Difference (Pa)
Air F
low
(cfm
)654321
Furnace #3 400 cfm/ton BPM
0
200
400
600
800
1000
1200
1400
1600
0 100 200 300 400 500 600
Supply-Return Pressure Difference (Pa)
Air F
low
(cfm
)
654321
Furnace #3 350 cfm/ton BPM
0
100
200
300
400
500
600
700
0 100 200 300 400 500 600
Supply-Return Pressure Difference (Pa)
Pow
er C
onsu
mpt
ion
(W)
654321
Furnace #3 400 cfm/ton BPM
0
100
200
300
400
500
600
700
0 100 200 300 400 500 600
Supply-Return Pressure Difference (Pa)
Pow
er C
onsu
mpt
ion
(W)
654321
Furnace #3 350 cfm/ton BPM
0
5
10
15
20
25
30
35
40
0 100 200 300 400 500 600
Supply-Return Pressure Difference (Pa)
Effi
cien
cy (%
)
654321
Furnace #3 400 cfm/ton BPM
0
5
10
15
20
25
30
35
40
0 100 200 300 400 500 600
Supply-Return Pressure Difference (Pa)
Effic
ienc
y (%
)
654321
Furnace #3 350 cfm/ton BPM
0
2
4
6
8
10
12
0 100 200 300 400 500 600
Supply-Return Pressure Difference (Pa)
cfm
/W
654321
Furnace #3 400 cfm/ton BPM
0
2
4
6
8
10
12
0 100 200 300 400 500 600
Supply-Return Pressure Difference (Pa)
cfm
/W
654321
Figure 17. Furnace #3 test results at two different cfm/ton ratings.
24

DRAFT
Air Inlet Size and Location Effects Furnace #1 with PSC
0
200
400
600
800
1000
1200
1400
1600
0 50 100 150 200 250 300 350
Supply-Return Pressure Difference (Pa)
Air F
low
(cfm
)High NormalHigh Motor SideHigh OppositeHigh BothHigh 10 inch bothLow NormalLow MotorLow OppositeLow BothLow 10 inch both
Furnace #1 with Protoype
0
200
400
600
800
1000
1200
1400
0 100 200 300 400 500 600
Supply-Return Pressure Difference (Pa)
Air F
low
(cfm
)
High NormalHigh Motor SideHigh OppositeHigh BothHigh 10 inch bothLow NormalLow MotorLow OppositeLow BothLow 10 inch both
Furnace #1 with PSC
0
100
200
300
400
500
600
700
800
0 50 100 150 200 250 300 350
Supply-Return Pressure Difference (Pa)
Pow
er C
onsu
mpt
ion
(W)
High NormalHigh Motor SideHigh OppositeHigh BothHigh 10 inch bothLow NormalLow MotorLow OppositeLow BothLow 10 inch both
Furnace #1 with Prototype
0
100
200
300
400
500
600
700
0 100 200 300 400 500 600
Supply-Return Pressure Difference (Pa)
Pow
er C
onsu
mpt
ion
(W)
High NormalHigh Motor SideHigh OppositeHigh BothHigh 10 inch BothLow NormalLow MotorLow OppositeLow BothLow 10 inch both
Furnace #1 with PSC
0.0
0.5
1.0
1.5
2.0
2.5
0 50 100 150 200 250 300 350
Supply-Return Pressure Difference (Pa)
cfm
/W
High NormalHigh Motor SideHigh OppositeHigh BothHigh 10 inch bothLow NormalLow MotorLow OppositeLow 10 inch both
Furnace #1 with Protoype
0
1
2
3
4
5
6
7
8
9
0 100 200 300 400 500 600
Supply-Return Pressure Difference (Pa)
cfm
/W
High NormalHigh Motor SideHigh OppositeHigh BothHigh 10 inch bothLow NormalLow MotorLow OppositeLow BothLow 10 inch both
Figure 18. Effect of air inlet location for Furnace #1 with both PSC and prototype motors. For Furnace #1, the results illustrated in Figure 18 show that the standard bottom entry gives the best performance, with the exception of the prototype with the open bottom and dual side entries. The air flow and cfm/W changes are on the order of 5 to 10 % for the different openings. The biggest effect on air flows is a reduction of about 10% for an opening on the motor side of the blower only. This is probably because the motor presents a significant blockage to air flow from this side. The results in Figure 18 are for the two extremes of operation – highest and lowest speeds. The results for intermediate speeds fall between these two with no extreme anomalies. The effects are greatest at higher speeds. Figure 19 shows the high speed results only on an expanded scale to better illustrate the differences.
25

DRAFT
Furnace #1 with Prototype
800
900
1000
1100
1200
1300
1400
0 100 200 300 400 500 600
Supply-Return Pressure Difference (Pa)
Air F
low
(cfm
)
High Normal
High Motor Side
High Opposite
High Both
High 10 inch both
Furnace #1 with PSC
0
200
400
600
800
1000
1200
1400
1600
0 50 100 150 200 250 300 350
Supply-Return Pressure Difference (Pa)
Air F
low
(cfm
)
High Normal
High Motor Side
High Opposite
High Both
High 10 inch both
Furnace #1 with Prototype
510
520
530
540
550
560
570
580
0 100 200 300 400 500 600
Supply-Return Pressure Difference (Pa)
Pow
er C
onsu
mpt
ion
(W)
High Normal
High Motor Side
High Opposite
High Both
High 10 inch Both
Furnace #1 with PSC
400
450
500
550
600
650
700
750
0 50 100 150 200 250 300 350
Supply-Return Pressure Difference (Pa)
Pow
er C
onsu
mpt
ion
(W)
High Normal
High Motor Side
High Opposite
High Both
High 10 inch both
Low Both
Furnace #1 with Protoype
0.0
0.5
1.0
1.5
2.0
2.5
3.0
0 100 200 300 400 500 600
Supply-Return Pressure Difference (Pa)
cfm
/W
High Normal
High Motor Side
High Opposite
High Both
High 10 inch both
Furnace #1 with PSC
0.0
0.5
1.0
1.5
2.0
2.5
0 50 100 150 200 250 300 350
Supply-Return Pressure Difference (Pa)
cfm
/W
High Normal
High Motor Side
High Opposite
High Both
High 10 inch both
Figure 19. Effect of air inlet location for Furnace #1 with both PSC and prototype motors on high speed.
26

DRAFT
Furnace #3 400 cfm/ton
0
200
400
600
800
1000
1200
1400
1600
0 100 200 300 400 500 600
Supply-Return Pressure Difference (Pa)
Air
Flo
w (c
fm)
Low NormalLow Motor SideLow Opposite MotorLow Both SidesHigh NormalHigh Motor SideHigh Opposite MotorHigh Both Sides
Furncae #3 Prototype
0
200
400
600
800
1000
1200
1400
1600
0 50 100 150 200 250 300
Supply-Return Pressure Difference (Pa)
Air
Flow
(cfm
)
Low NormalLow Opposite MotorLow Motor SideLow Both SidesLow Both + NormalHigh NormalHigh Both SidesHigh Both + Normal
Furnace #3 400 cfm/ton
0
100
200
300
400
500
600
700
0 100 200 300 400 500 600
Supply-Return Pressure Difference (Pa)
Pow
er C
onsu
mpt
ion
(W)
Low NormalLow Motor SideLow Opposite MotorLow Both SidesHigh NormalHigh Motor SideHigh Opposite MotorHigh Both Sides
Furnace #3 Prototype
0
100
200
300
400
500
600
700
0 50 100 150 200 250 300
Supply-Return Pressure Difference (Pa)
Pow
er C
onsu
mpt
ion
(W)
Low NormalLow Opposite MotorLow Motor SideLow Both SidesLow Both + NormalHigh NormalHigh Both SidesHigh Both + Normal
Furnace #3 400 cfm/ton
0
2
4
6
8
10
12
14
0 100 200 300 400 500 600
Supply-Return Pressure Difference (Pa)
cfm
/W
Low NormalLow Motor SideLow Opposite MotorLow Both SidesHigh NormalHigh Motor SideHigh Opposite MotorHigh Both Sides
Furnace #3 Prototype
0
1
2
3
4
5
6
7
8
9
10
0 50 100 150 200 250 300
Supply-Return Pressure Difference (Pa)
cfm
/W
Low NormalLow Opposite MotorLow Motor SideLow Both SidesLow Both + NormalHigh NormalHigh Both SidesHigh Both + Normal
Figure 20. Effect of air inlet location for Furnace #3 The results in Figures 20-22 are for the two extremes of operation – highest and lowest speeds. The results for intermediate speeds fall between these two with no extreme anomalies. For Furnace #3, the change from bottom entry to other geometries reduced the air flow and cfm/W ratings. The biggest change was for the most restrictive entry: motor side only, where the cfm/W rating dropped by 24% for the 400 cfm/ton BPM motor. The effects were less severe for the prototype motor. Critically, the cfm/W rating for the 400 cfm/ton tests dropped below 2.5 cfm/W for some of the cases implying that an installation that was acceptable using bottom entry may not be if side entry is used. For the PSC results in Figure 21, the fractional changes in air flow are greater than the cfm/W ratings because the PSC uses proportionally less power as air flows decrease. This means that inlet location is more important for making a furnace blower meet air flow requirements rather meeting a cfm/W requirement.
27

DRAFT
Cabinet Restriction For furnace #1, Figure 22 shows how decreasing clearance from 2 in. (50 mm) to 1 in. (25 mm) reduces air flow by about 7% for the prototype and about 15% for the PSC, with the PSC showing greater sensitivity at higher speed settings. The corresponding changes in cfm/W of about 0.25 for both PSC and prototype at typical operating conditions would be critical for a system attempting to meet a performance specification of 2 cfm/W. In Figure 23 the BPM shows less sensitivity to restriction, possibly due its control systems. Table 1 summarizes the results of the cabinet restriction testing.
Furnace #2 PSC
0
200
400
600
800
1000
1200
1400
1600
0 50 100 150 200 250 300 350
Supply-Return Pressure Difference (Pa)
Air F
low
(cfm
)
HighHigh 2.5 inchHigh 2 inchHigh 1.5 inchLowLow 2.5 inchLow 2 inchLow 1.5 inch
Furnace #2 PSC
0
100
200
300
400
500
600
700
0 50 100 150 200 250 300 350
Supply-Return Pressure Difference (Pa)
Pow
er C
onsu
mpt
ion
(W)
HighHigh 2.5 inchHigh 2 inchHigh 1.5 inchLowLow 2.5 inchLow 2 inchLow 1.5 inch
Furnace #2 PSC
0
5
10
15
20
25
30
35
40
0 50 100 150 200 250 300 350
Supply-Return Pressure Difference (Pa)
Effic
ienc
y (%
)
HighHigh 2.5 inchHigh 2 inchHigh 1.5 inchLowLow 2.5 inchLow 2 inchLow 1.5 inch
Furnace #2 PSC
0.0
0.5
1.0
1.5
2.0
2.5
3.0
0 50 100 150 200 250 300 350
Supply-Return Pressure Difference (Pa)
cfm
/W
HighHigh 2.5 inchHigh 2 inchHigh 1.5 inchLowLow 2.5 inchLow 2 inchLow 1.5 inch
Figure 21. Furnace #2 sensitivity to cabinet restriction for high and low speeds with no restriction (about 3 inches clearance), 2.5 inch, 2 inch and 1.5 inch clearance between
cabinet walls and fan housing.
28

DRAFT
Furnace #1 Prototype
0
200
400
600
800
1000
1200
1400
0 100 200 300 400 500 600
Supply-Return Pressure Difference (Pa)
Air F
low
(cfm
)
High
High 1.5 in
High 1 in
Med
Med 1.5 in
Med 1in
Low
Low 1.5 in
Low 1 in
Furnace #1 PSC
0
200
400
600
800
1000
1200
1400
0 50 100 150 200 250 300 350
Supply-Return Pressure Difference (Pa)
Air F
low
(cfm
)
HighHigh 1.5 inHigh 1 inLowLow 1.5 inLow 1in
Furnace #1 Prototype
0
100
200
300
400
500
600
700
0 100 200 300 400 500 600
Supply-Return Pressure Difference (Pa)
Pow
er C
onsu
mpt
ion
(W)
High
High 1.5 in
High 1 in
Med
Med 1.5 in
Med 1in
Low
Low 1.5 in
Low 1 in
Furnace #1 PSC
0
100
200
300
400
500
600
700
0 50 100 150 200 250 300 350
Supply-Return Pressure Difference (Pa)
Pow
er C
onsu
mpt
ion
(W)
HighHigh 1.5 inHigh 1 inLowLow 1.5 inLow 1in
Purnace #1 Prototype
0
5
10
15
20
25
30
35
40
0 100 200 300 400 500 600
Supply-Return Pressure Difference (Pa)
Effi
cien
cy (%
)
High
High 1.5 in
High 1 in
Med
Med 1.5 in
Med 1in
Low
Low 1.5 in
Low 1 in
Furnace #1 PSC
0
5
10
15
20
25
30
0 50 100 150 200 250 300 350
Supply-Return Pressure Difference (Pa)
Effi
cien
cy (%
)
HighHigh 1.5 inHigh 1 inLowLow 1.5 inLow 1in
Furnace #1 Prototype
0
1
2
3
4
5
6
7
8
9
0 100 200 300 400 500 600
Supply-Return Pressure Difference (Pa)
cfm
/W
High
High 1.5 in
High 1 in
Med
Med 1.5 in
Med 1in
Low
Low 1.5 in
Low 1 in
Furnace #1 PSC
0.0
0.5
1.0
1.5
2.0
2.5
3.0
0 50 100 150 200 250 300 350
Supply-Return Pressure Difference (Pa)
cfm
/W
HighHigh 1.5 inHigh 1 inLowLow 1.5 inLow 1in
Figure 22. Furnace #1 sensitivity to cabinet restriction for high and low speeds with no
restriction, 1.5 inch, and 1 inch clearance between cabinet walls and the fan housing.
29

DRAFT
Furnace#3 400 cfm/ton BPM
0
200
400
600
800
1000
1200
1400
1600
0 100 200 300 400 500 600
Supply-Return Pressure Difference (Pa)
Air
Flow
(cfm
)
HighHigh 6 -2.5/1.5 inchHigh - 2/1 inchLow -2/ 1 inchLow -2.5/1.5 inchLow
Furnace #3 400 cfm/ton BPM
0
100
200
300
400
500
600
700
0 100 200 300 400 500 600
Supply-Return Pressure Difference (Pa)
Pow
er C
onsu
mpt
ion
(W)
HighHigh - 2.5/1.5 inchHigh - 2/1 inchLow -2/1 inchLow -2.5/1.5 inchLow
Furnace #3 400 cfm/ton BPM
0
5
10
15
20
25
30
35
0 100 200 300 400 500 600
Supply-Return Pressure Difference (Pa)
Effic
ienc
y (%
)
HighHigh -2.5/1.5 inchHigh - 2/1 inchLow -2/ 1 inchLow -2.5/1.5 inchLow
Furnace #3 400 cfm/ton BPM
0
2
4
6
8
10
12
0 100 200 300 400 500 600
Supply-Return Pressure Difference (Pa)
cfm
/W
HighHigh -2.5/1.5 inchHigh - 2/1 inchLow -2/ 1 inchLow -2.5/1.5 inchLow
Figure 23. Furnace #3 sensitivity to cabinet restriction for high and low speeds with no
restriction, 2.5/1.5 inch, 2/1 inch clearance between upper and lower cabinet walls respectively and the fan housing.
30

DRAFT
Table 1. Effects of cabinet restriction on furnace blower performance Flow
(cfm) Flow (cfm)
Flow Change
Flow Change
cfm/W cfm/W Change cfm/W
Change cfm/W
Furnace Speed No Blockage
Max. Blockage
cfm % No Blockage
Max. Blockage
%
High 1362 1268 -94 -7 2.1 2.1 0 0 #2 PSC
Low 1106 1078 -28 -3 2.3 2.4 0.1 4
High 1246 1075 -171 -14 2.1 2.2 0.1 5 #1 PSC
Low 732 738 6 1 1.9 1.8 -0.1 -5
High 1294 1192 -102 -8 2.5 2.1 -0.4 -16 #1 Prototype Low 626 557 -69 -11 8.2 7.5 -0.7 -9
High 1429 1444 15 1 2.6 2.4 -0.2 -8 #3 BPM
Low 542 548 6 1 11.1 10 -1.1 -10
High 1561 1516 -45 -3 2.4 2.3 -0.1 -4 #3 Prototype Low 805 774 -31 -4 6.4 6.2 -0.2 -3
Average -4.6 -0.3 -4.6
Power factor Table 2 summarizes the results of the power factor measurements. Power factors were recorded for all flow and pressure difference operating points and Table2 gives typical values. In general the Power Factor is greater than 0.85 for the PSC motors and ranges from 05 to 0.6 for the BPMs. For the two prototypes, the power factor did not change more than a few percent over the tested pressure and flow range. This is probably due to operating in a constant torque mode. The BPM results are more complex and showed a gradual increase in power factor to a peak at about 250 to 350 Pa pressure difference then decreasing after this point. The PSC motors had power factors that typically decreased by about 5% to 10% as pressure difference increased. The biggest changes were for Furnace #2 with the PSC motor, where the power factor dropped from 0.94 at high flow and low pressure (1300 cfm and 160 Pa) to 0.78 at 299 cfm and 310 Pa. Figures 24-28 show how the BPMs generate large odd order harmonics due to the current being highly non-sinusoidal. For the PSC motor in Furnace #1, the PF ranged from 0.68 to 0.92 depending on the motor operating point and the pressure across the fan. Two different pressure differences were used to investigate the effect of fan loading on electric motor performance and therefore power factor. Figure 24 shows an example of the power, voltage and current waveforms where the power factor is high (0.92). Figure 25 shows the results of an harmonic analysis that show that for this high power factor almost all the energy is in the first harmonic.
31

DRAFT
Table 2. Results of power factor measurements from LBNL testing
Furnace #1 Prototype BPM Speed Setting2 Power Factor Low 0.53 Medium 0.55 Medium High 0.59 High 0.63
Furnace #1 PSC motor Speed Setting Power Factor Low speed low plenum pressure 0.86 Low speed high plenum pressure 0.92 High speed low plenum pressure 0.83 High speed high plenum pressure 0.68
Furnace #3 Prototype BPM Speed Setting Power Factor Low 0.56 Medium 0.62
Furnace #3 Standard BPM Speed Setting Power Factor Low 0.53 Medium 0.56 High 0.62
Furnace #2 PSC motor Speed setting Power Factor High 0.95 Low 0.92 2 For the prototype the control was more of a torque than speed setting
32

DRAFT
Figure 24. Wave form and Harmonic analysis for Furnace #1 PSC motor, low speed, high plenum pressures.
33

DRAFT
Figure 25. Wave form and harmonic analysis for Furnace #1 PSC Prototype BPM motor, torque setting 2.
34

DRAFT
Figure 26. Wave form and harmonic analysis for Furnace #3 PSC motor, high speed setting.
35

DRAFT
Figure 27. Wave form and harmonic analysis for Furnace #2 BPM motor, lowest speed setting.
36

DRAFT
Figure 28. Wave form and harmonic analysis for Furnace #2 prototype BPM motor, torque setting 11000.
37
DRAFT
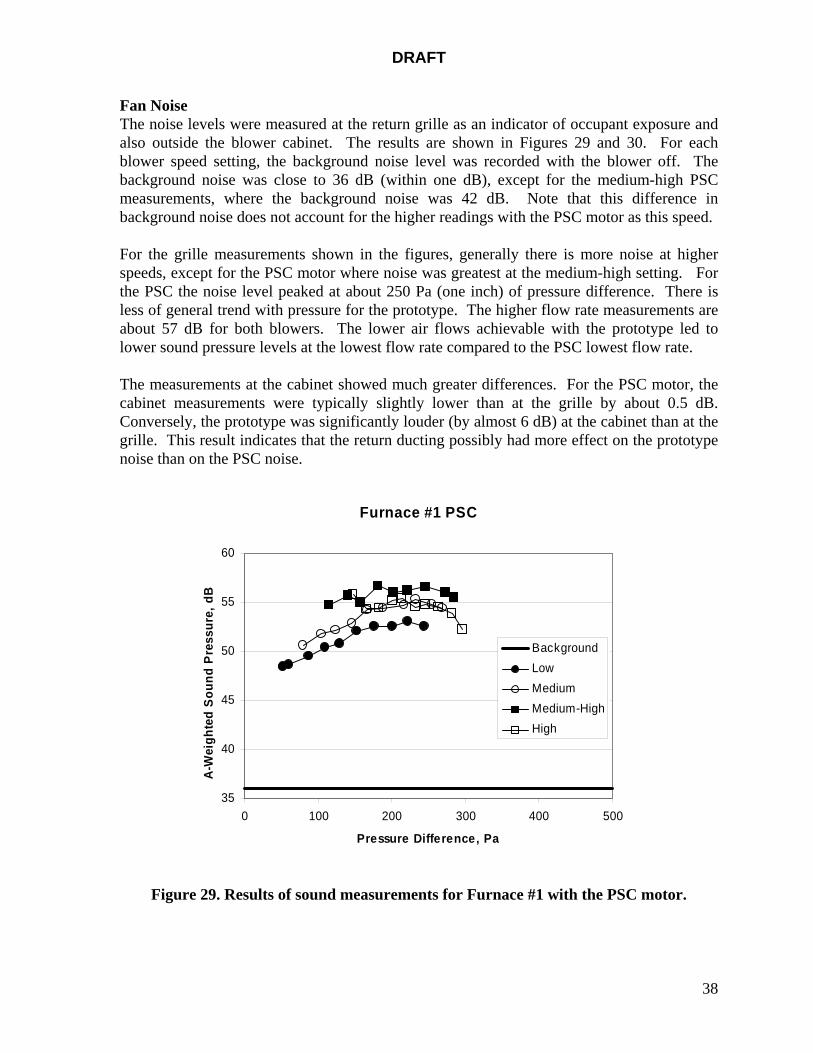
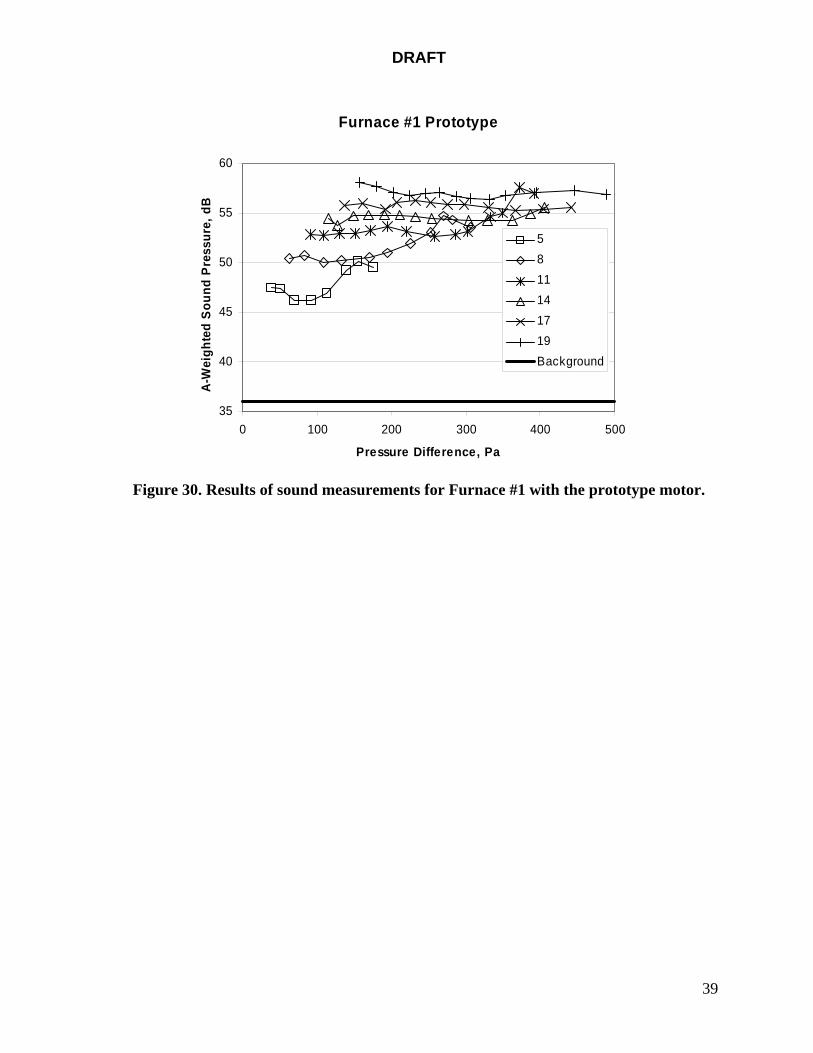
Fan Noise The noise levels were measured at the return grille as an indicator of occupant exposure and also outside the blower cabinet. The results are shown in Figures 29 and 30. For each blower speed setting, the background noise level was recorded with the blower off. The background noise was close to 36 dB (within one dB), except for the medium-high PSC measurements, where the background noise was 42 dB. Note that this difference in background noise does not account for the higher readings with the PSC motor as this speed. For the grille measurements shown in the figures, generally there is more noise at higher speeds, except for the PSC motor where noise was greatest at the medium-high setting. For the PSC the noise level peaked at about 250 Pa (one inch) of pressure difference. There is less of general trend with pressure for the prototype. The higher flow rate measurements are about 57 dB for both blowers. The lower air flows achievable with the prototype led to lower sound pressure levels at the lowest flow rate compared to the PSC lowest flow rate. The measurements at the cabinet showed much greater differences. For the PSC motor, the cabinet measurements were typically slightly lower than at the grille by about 0.5 dB. Conversely, the prototype was significantly louder (by almost 6 dB) at the cabinet than at the grille. This result indicates that the return ducting possibly had more effect on the prototype noise than on the PSC noise.
Furnace #1 PSC
35
40
45
50
55
60
0 100 200 300 400 500
Pressure Difference, Pa
A-W
eigh
ted
Soun
d P
ress
ure,
dB
BackgroundLowMediumMedium-HighHigh
Figure 29. Results of sound measurements for Furnace #1 with the PSC motor.
38
DRAFT
Furnace #1 Prototype
35
40
45
50
55
60
0 100 200 300 400 500
Pressure Difference, Pa
A-W
eigh
ted
Sou
nd P
ress
ure,
dB
5811141719Background
Figure 30. Results of sound measurements for Furnace #1 with the prototype motor.
39

DRAFT
Electric Utility test Results The tests in the electric utility test facility summarized in Figures 31-34 showed the same key characteristics for the different fan/motor combinations as for the LBNL testing:
• BPM motors are better at maintaining airflow as static pressures increase. This means that they are more tolerant to high resistance duct installations in the sense that they are better able to maintain the air flow across heating and cooling heat exchangers so that they operate efficiently. The flip side of maintaining airflow into increasing pressure differences is the corresponding increase in power use. Therefore there is a balance between maintaining heat exchanger effectiveness and the extra fan power requirements. Because high cfm/W ratings can be obtained for a BPM motor by operating at low air flows (and correspondingly low system pressures) any performance specification should include am minimum air flow rate. This is because air conditioner (and to a much lesser extent furnace) performance decreases as air flow is lowered.
• Peak overall (motor and aerodynamic) efficiencies are about 40% for the prototypes, about 30% for current production BPMs and about 25% for PSC motors. For the PSC motors, these peak efficiencies occur at static pressures of about 0.8 in. water (200 Pa). This is a fortunate coincidence as field data show that 0.8 in. water is the typical pressure difference seen by a residential air handler in California duct systems. At lower operating pressures of 0.5 in. water (125 Pa), the efficiencies drop to 12% to 15%. At typical rating points (about 0.2 in. water (100 Pa)) the efficiencies are even lower at 5% or less. For the current equipment BPM, the efficiency peak is spread out from about 0.5 in water (125 Pa) to greater than 1.0 in. water (250 Pa), with higher efficiencies at lower operating settings. At typical operating pressures there is a broad range from 15% to 30% efficiency depending on the operating setting. This shows that it is important for installers to choose the correct operating settings when installing these air handlers and that different settings may be appropriate depending on the specific installation. The prototype showed similar efficiency value as the current equipment BPM at normal operating conditions.
• In terms of cfm/W, the PSC air handlers are fairly constant at about 2 to 2.5 cfm/W for all speeds, with slightly lower cfm/W rating for lower speeds. The performance falls off sharply above about 1.0 inch of water static pressure (250 Pa). The BPM devices have significantly higher cfm/W ratings as pressures are reduced, approaching values greater than 15 cfm/W for low pressures, but at pressures above 0.8 in. water their cfm/W performance is similar to a PSC.
• The Furnace #3 results for 350cfm/ton and 400 cfm/ton tests show essentially the same results, just with lower operating points for the 350 cfm/ton case.
40

DRAFT
Furnace #1 PSC
0
200
400
600
800
1,000
1,200
1,400
1,600
0.0 0.2 0.4 0.6 0.8 1.0 1.2 1.4 1.6 1.8 2.0
Static Pressure (inches H2O)
Air
Flow
(cfm
)
HighMed-HighMediumLow
Furnace #1 Protoype
0
200
400
600
800
1,000
1,200
1,400
1,600
0.0 0.2 0.4 0.6 0.8 1.0 1.2 1.4 1.6 1.8 2.0
Static Pressure (inches H2O)
Air
Flow
(cfm
)
1917141185
Furnace #3 400 cfm/ton BPM
0
200
400
600
800
1,000
1,200
1,400
1,600
1,800
2,000
0.0 0.2 0.4 0.6 0.8 1.0 1.2 1.4 1.6 1.8 2.0
Static Pressure (inches H2O)
Air
Flow
(cfm
)
HighMed-HighMediumLow
Furnace #3 Protoype
0
200
400
600
800
1,000
1,200
1,400
1,600
1,800
2,000
0.0 0.2 0.4 0.6 0.8 1.0 1.2 1.4 1.6 1.8 2.0
Static Pressure (inches H2O)
Air
Flow
(cfm
)
HighMed-HighMediumLow
Furnace #2 PSC
0
200
400
600
800
1,000
1,200
1,400
1,600
1,800
2,000
0.0 0.2 0.4 0.6 0.8 1.0 1.2 1.4 1.6 1.8 2.0
Pressure Difference (inches H2O)
Air
Flow
(cfm
)
HighMed-HighMediumLow
Figure 31. Furnace blower air flow
41

DRAFT
Furnace #1 PSC
0
100
200
300
400
500
600
700
800
0.0 0.2 0.4 0.6 0.8 1.0 1.2 1.4 1.6 1.8 2.0
Static Pressure (inches H2O)
Pow
er C
onsu
mpt
ion
(W)
HighMed-HighMediumLow
Furnace #1 Prototype
0
100
200
300
400
500
600
700
800
0.0 0.2 0.4 0.6 0.8 1.0 1.2 1.4 1.6 1.8 2.0
Static Pressure (inches H2O)
Pow
er C
onsu
mpt
ion
(W)
1917141185
Furnace #3 400 cfm/ton BPM
0
100
200
300
400
500
600
700
800
900
0.0 0.2 0.4 0.6 0.8 1.0 1.2 1.4 1.6 1.8 2.0Static Pressure (inches H2O)
Pow
er C
onsu
mpt
ion
(W)
HighMed-HighMediumLow
Furnace #3 Protoype
0
100
200
300
400
500
600
700
800
900
0.0 0.2 0.4 0.6 0.8 1.0 1.2 1.4 1.6 1.8 2.0
Static Pressure (inches H2O)
Pow
er C
onsu
mpt
ion
(W)
HighMed-HighMediumLow
Furnace #2 PSC
0
100
200
300
400
500
600
700
800
900
0.0 0.2 0.4 0.6 0.8 1.0 1.2 1.4 1.6 1.8 2.0
Pressure Difference (inches H2O)
Pow
er C
onsu
mpt
ion
(W)
HighMed-HighMediumLow
Figure 32. Furnace blower power consumption
42

DRAFT
Furnace #1 PSC
0
5
10
15
20
25
30
35
40
0.0 0.2 0.4 0.6 0.8 1.0 1.2 1.4 1.6 1.8 2.0
Static Pressure (inches H2O)
Effic
ienc
y (%
)HighMed-HighMediumLow
Furnace #1 Prototype
0
5
10
15
20
25
30
35
40
0.0 0.2 0.4 0.6 0.8 1.0 1.2 1.4 1.6 1.8 2.0
Static Pressure (inches H2O)
Effic
ienc
y (%
) 1917141185
Furnace #3 400 cfm/ton BPM
0
5
10
15
20
25
30
35
40
0.0 0.2 0.4 0.6 0.8 1.0 1.2 1.4 1.6 1.8 2.0Static Pressure (inches H2O)
Effic
ienc
y (%
)
HighMed-HighMediumLow
Furnace #3 Protoype
0
5
10
15
20
25
30
35
40
0.0 0.2 0.4 0.6 0.8 1.0 1.2 1.4 1.6 1.8 2.0
Static Pressure (inches H2O)
Effic
ienc
y (%
)
HighMed-HighMediumLow
Furnace #2 PSC
0
5
10
15
20
25
30
35
40
0.0 0.2 0.4 0.6 0.8 1.0 1.2 1.4 1.6 1.8 2.0
Pressure Difference (inches H2O)
Effic
ienc
y (%
)
HighMed-HighMediumLow
Figure 33. Furnace Blower efficiency
43

DRAFT
Furnace #1 PSC
0
2
4
6
8
10
12
0.0 0.2 0.4 0.6 0.8 1.0 1.2 1.4 1.6 1.8 2.0
Static Pressure (inches H2O)
cfm
/W
HighMed-HighMediumLow
Furnace #1 Prototype
0
2
4
6
8
10
12
0.0 0.2 0.4 0.6 0.8 1.0 1.2 1.4 1.6 1.8 2.0
Static Pressure (inches H2O)
cfm
/W
1917141185
Furnace #3 400 cfm/ton BPM
0
2
4
6
8
10
12
14
16
18
20
0.0 0.2 0.4 0.6 0.8 1.0 1.2 1.4 1.6 1.8 2.0Static Pressure (inches H2O)
cfm
/W
HighMed-HighMediumLow
Furnace #3 Protoype
0
2
4
6
8
10
12
14
16
18
20
0.0 0.2 0.4 0.6 0.8 1.0 1.2 1.4 1.6 1.8 2.0
Static Pressure (inches H2O)
cfm
/WHighMed-HighMediumLow
Frunace #2 PSC
0
2
4
6
8
10
12
14
16
18
20
0.0 0.2 0.4 0.6 0.8 1.0 1.2 1.4 1.6 1.8 2.0
Pressure Difference (inches H2O)
cfm
/W
HighMed-HighMediumLow
Figure 34. Furnace blower cfm/W ratings
44

DRAFT
Comparing Laboratory test data to Manufacturer’s Published Data Figure 35 compares the measured test results for Furnace #1 to data taken from the manufacturer’s specifications for this furnace. At high speed the manufacturer’s rating overpredicts the air flow by about 100 cfm. For other speeds it tends to underpredict by about 100 cfm, the exception being at medium-high speed where there is little difference above 0.5 in. water pressure difference.
Furnace #1
0
200
400
600
800
1,000
1,200
1,400
1,600
0.0 0.2 0.4 0.6 0.8 1.0 1.2
Static Pressure (inches H2O)
Air
Flow
(cfm
)
HighMed-HighMediumLowHigh Manufacturer DataMed- High Manufacturer DataMedium Manufacturer DataLow Manufacturer Data
Figure 35. Comparing Laboratory Test Data to Manufacturer’s Published Data Comparing PSC and BPM performance The PSC and BPM performance can be more directly compared by looking at specific operating conditions. Field tests show that high speed operation results in about 365cfm/ton at 0.8 in. water. For furnace #1, at 2.5 tons we will take as the cooling operating point a flow of about 950 cfm at 0.8 in. water (200 Pa). At this operating point the PSC consumes 554 at 1.7 cfm/W. The closest BPM prototype operating point provides 930 cfm at 303 W and 3.1 cfm/W. For heating, we will assume that the medium-high PSC setting is used resulting in about 910 cfm at 0.7 in. water (175 Pa) consuming 415W at about 2.2. cfm/W. The closest prototype speed for heating gives a flow of about 850 cfm at 0.6 in. water (150 Pa) consuming 215W at about 4 cfm/W. These comparisons are illustrated in Figures 36 and 37.
45

DRAFT
Furnace #1
0
100
200
300
400
500
600
700
800
900
0.0 0.2 0.4 0.6 0.8 1.0 1.2 1.4 1.6
Static Pressure (inches H2O)
Pow
er C
onsu
mpt
ion
(W)
Cool PSCHeat PSCCool PrototypeHeat PrototypeCool PSC
Heat PSC
Cool Prototype
Heat Prototype
Figure 36. Furnace #1 comparison of power consumption in typical heating and cooling
modes.
46

DRAFT
Furnace #1
0
1
2
3
4
5
6
7
8
0.0 0.2 0.4 0.6 0.8 1.0 1.2 1.4 1.6
Static Pressure (inches H2O)
cfm
/W
Cool PSCHeat PSCCool PrototypeHeat PrototypeCool Prototype
Heat Prototype
Cool PSC
Heat PSC
Figure 37. Comparison of cfm/W ratings for typical operating settings for Furnace #1.
In repeating this analysis for the other furnaces the PSC and BPM (i.e., combining Furnace #2 and Furnace #3 test results) rather than the prototype were used because these are devices that are currently available unlike the prototype. Figure 38 shows the air flows that at a typical operating point of 0.8 in. water, the PSC cannot provide the required 400 cfm/ton (1600 cfm for this 4 ton unit) and it has an airflow of 1140 cfm. By contrast, the BPM does much better at maintaining the correct flow and provides 1460 cfm. Figure 39 shows that in this pressure difference regime, the BPM increases its power consumption to maintain the flow, but the PSC decreases its power consumption as it is unable to maintain the air flow. At 0.8 in. water pressure difference the BPM consumes 50 more W than the PSC. However, if we use a different BPM speed to match the PSC airflow at this pressure (the “Matched BPM” results) then the BPM uses 180W less than the PSC. The corresponding cfm/W ratings are 2.1 cfm/W for the PSC, 2.4 cfm/W for the BPM and 3.1 cfm/W for the matched BPM. For heating the matched BPM and heat PSC data are compared. At the lower setting, the system pressure drops to 0.7 in. water and the air flow drops to 1117 cfm. At this operating point the BPM uses 340 W compared to 440 W for the PSC. The cfm/W ratings reflect this and are 2.5 cfm/W for the PSC and 3.5 cfm/W for the BPM.
47

DRAFT
0
200
400
600
800
1,000
1,200
1,400
1,600
1,800
2,000
0.0 0.2 0.4 0.6 0.8 1.0 1.2
Pressure Difference (inches H2O)
Air
Flow
(cfm
)Cool PSCCool BPMHeat PSCMatched BPM
Cool PSC
Heat PSC &Matched BPM
Heating
Cool BPM
Matched BPMCooling
Figure 38. Comparing air flows for a PSC and BPM motor.
Furnace #2
0
100
200
300
400
500
600
700
800
900
0.0 0.2 0.4 0.6 0.8 1.0 1.2
Pressure Difference (inches H2O)
Pow
er C
onsu
mpt
ion
(W)
Cool PSCCool BPMHeat PSCMatched BPM
Cool PSC
Heat PSC
Cool BPM
Matched BPMCooling
Figure 39. Comparing power consumption at typical operating points for a PSC and
BPM motor.
48

DRAFT
Summary Analysis of these detailed laboratory investigations has shown that:
• BPM and PSC blowers have distinctly different performance characteristics that must be accounted for when proposing performance specifications. o BPM blowers have better performance in terms of maintaining air flow at
typical system pressures and reduced power consumption compared to PSC blowers. However, the advantage for BPM blowers is marginal at high pressures above about 0.8 in. water (200 Pa).
o As system pressures increase, the PSC blower power consumption decreases as it is unable to maintain air flow.
o PSC blowers have cfm/W ratings that are very close to proposed performance specifications, while the generally higher cfm/W ratings for BPM blowers will make it easier for them to meet these specifications.
• A performance specification should include both an air flow specification and a cfm/W specification.
• Because the performance of blowers at operating conditions is close to probable performance specification limits, although the fractional performance changes are about 15% for PSC blowers, the effects of restrictive cabinets and return air inlet locations could be significant.
• For occupants there are no noise issues related to the use of high speed backward inclined blower wheels.
These laboratory tests have examined only a small sample of furnaces, however, these general conclusions can be broadly applied based on input from furnace manufacturers and the test results from other unpublished studies (e.g., Proctor 2005 – personal communication). Specific furnace/blower combinations will have different air flow characteristics, cfm/W ratings and pressure difference sensitivity, but the general trends and observations will still apply.
49

DRAFT
Acknowledgements The following individuals contributed to this document from unpublished sources: Bruce Wilcox, Rick Chitwood and John Proctor. Darryl Dickerhoff performed the laboratory testing at LBNL and provided review comments together with Peter Biermayer of LBNL. Robert Davis performed the laboratory testing at PG&E. Field Testing Bibliography CEC. 1998. private communication with Bill Pennington– field surveys of large number (>100) homes. CMHC. 1993. Efficient and Effective Residential Air Handling Devices. Research Division, Canada Mortgage and Housing Corporation. Ottawa, Ontario, Canada.
Davis, B., Siegel, J., Francisco, P. and Palmiter, L. 1998. Measured and Modeled Heating Efficiency of Eight Natural Gas-Heated Homes. ECOTOPE, Inc. , Seattle, WA. Olson, J., Palmiter, L., Davis, B., Geffon, M., Bond, T., 1993. Field Measurements of the Heating Efficiency of Electric Forced-Air Systems in 24 Homes. Ecotope, Inc., Seattle, WA. Phillips, B.G. 1998. Impact of Blower Performance on Residential Forced-Air Heating System Performance. ASHRAE Trans. V. 104, Pt.1, American Society of Heating, Refrigeration and Air-conditioning Engineers, Atlanta, GA. Phillips, B.G. 1995. Blower Efficiency in Domestic Heating Systems/ UNIES Ltd., Winnipeg, Manitoba CEA 9202 U 921. Pigg, S. 2003. Electricity Use by New Furnaces: A Wisconsin Field Study, Appendices. Energy Center of Wisconsin, Madison October 2003. http://www.ecw.org/ecw/productdetail.jsp?productId=500&numPerPage=1000&sortAttribute=initiative.title&sortOrder=ASC. Proctor, J. and Parker, D. 2000. Hidden Power Drains: Residential Heating and Cooling Fan Power Demand. Proc. ACEEE Summer Study 2000 pp. 1.225-1.234. American Council for an Energy Efficient Economy, Washington, D.C.
Jump, D.A., Walker, I.S. and Modera, M.P., (1996), “Field Measurements of Efficiency and Duct Retrofit Effectiveness in Residential Forced Air Distribution Systems.”, Proc. 1996 ACEEE Summer Study, pp.1.147-1.156. ACEEE, Washington, D.C., (LBNL 38537).
Walker, I.S., Sherman, M.H., Modera, M.P. and Siegel, J, (1998), “Leakage Diagnostics, Sealant Longevity, Sizing and Technology Transfer in Residential Thermal Distribution Systems”, LBNL 41118.
Walker, I., Sherman, M., Siegel, J., Wang, D., Buchanan, C., and Modera, M., (1999), “Leakage Diagnostics, Sealant Longevity, Sizing and Technology Transfer in Residential Thermal Distribution Systems: Part II”, LBNL 42691.
50

DRAFT
Walker, I.S., Modera, M.P., Tuluca, A. and Graham, I., (1996), “Energy Effectiveness of Duct Sealing and Insulation in Two Multifamily Buildings”, Proc. 1996 ACEEE Summer Study, pp.1.247-1.254. ACEEE, Washington, D.C. (LBNL 38538).
51

DRAFT
References Andrews, J.W., Celebi, Y. and McDonald, R. 2003 Test Results on a high-efficiency air
handling unit for residential applications. Brookhaven National Laboratory. AMCA/ASHRAE. 1999. Laboratory Method of Testing Fans for Aerodynamic Performance
Rating. ANSI/AMCA 210-99, ANSI/ASHRAE 51-1999. ARI. 2003. Standard for Unitary Air Conditioning and Air-source Heat Pump Equipment.
Standard 210/240-2003. Air-conditioning and Refrigeration Institute, Arlington, VA. Biermayer, P.J., Lutz, J.D., and Lekov, A., 2004. Measurement of Airflow in Residential Furnaces., LBNL-53947 CMHC. 1993. Efficient and Effective Residential Air Handling Devices. Research Division,
Canada Mortgage and Housing Corporation. Ottawa, Ontario, Canada. Gusdorf, J., Swinton, M., Entchev, E., Simpson, C., and Castellan, B. 2002. The Impact of
ECM furnace motors on natural gas use and overall energy use during the heating season of the CCHT research facility. National Research Council Canada report No. NRCC-38443.
Gusdorf, J., Swinton, M., Simpson, C., Entchev, E., Hayden, S., and Castellan, B. 2003.
Effects of ECM furnace motors on electricity and gas use: Results from the CCHT research facility and projections. National Research Council Canada report.
Pigg, S. 2003. Electricity use by New Furnaces. Energy Center of Wisconsin, Madison, WI. Pigg, S. and Talerico, T. 2004. Electricity Savings from Variable-Speed Furnaces in Cold
Climates. Proc. ACEEE Summer Study 2004, pp. 1-264 – 1.278. American Council for an Energy Efficieint Economy, Washington, DC.
Phillips, B.G. 1998. Impact of Blower Performance on Residential Forced-Air Heating
System Performance. ASHRAE Trans. V. 104, Pt.1, American Society of Heating, Refrigeration and Air-conditioning Engineers, Atlanta, GA.
Proctor, J. and Parker, D. 2000. Hidden Power Drains: Residential Heating and Cooling Fan
Power Demand. Proc. ACEEE Summer Study 2000 pp. 1.225-1.234. American Council for an Energy Efficient Economy, Washington, D.C.
Walker, I.S., Mingee, D, and Brenner, D. 2004. Improving Air Handler Efficiency in
Residential Applications, Proc. ACEEE summer study 2004, American Council for an Energy Efficient Economy, Washington, DC. LBNL 53606.
Wiegman, H, 2003. ECM 4.0 Operation and Control, GE Research, GE Global Research
Center, February 2003
52

DRAFT
Wiegman, H., Stephens, C., Carl, R., Szczesny, P., Xiaoyue, L., Zhuang, S. and Wright, K.
2003. Final report for the Variable Speed Integrated Intelligent HVAC Blower, GE Global Research, September 2003.
53


![Untitled-1 [ionindia.com] · Flocculants for GCP circuit Water Circuits In Blast Furnace DM BLOWER AVG F ONDENSER TURBO-BLOWER CIRC TURBINE AVCF . v"less Filter WATER H Rscc SOLID](https://img.dokumen.tips/doc/110x75/60766e4394ee33359f5a4b42/untitled-1-flocculants-for-gcp-circuit-water-circuits-in-blast-furnace-dm-blower.jpg)