Embed Size (px)
Citation preview

Laboratory Control Sample (LCS) Study
Overview Fred McLean
EDQW Quality Systems Chair NAVSEA 04XQ(LABS)

Fred McLean (Navy) - Overview of the Laboratory Control
Sample (LCS) Study
Kelly Black (Neptune) – The statistics behind the study
Charles Stoner (Army Public Health) – How laboratories are
integrating the LCS results
Chris Gunning (A2LA) – How an Accrediting Body (AB) will
assess the laboratory for compliance with the QSM Control
Limits Tables
Kari Meir (Army Corps) – How projects can integrate this
study into their QAPPs
Agenda

Old vs. New: The Original Study
1999 LCS Study: Data was collected in 1999; results were published in the 2004 LCS Study report 20 of the “best” DoD approved labs were asked to participate Most methods had a maximum of 17 labs send data, with 5 labs considered a minimum Labs were asked to send their last 20 LCS values for each method/analyte without censoring

The Original Study (2004)
Control Limits were set at 3 standard deviations around the mean for all methods Method 8151 (Herbicides) control limits were considered “too wide” for use; the 5th and 95th percentiles were used instead Control Limits were rounded to the nearest 5 for “ease of use” Lower Control Limits were raised to a minimum of 10

Original Study Goals
Replace AFCEE Control Limits with empirical data collected in cooperation with American council of Independent Laboratories (ACIL) Purpose: To evaluate how well the more commonly used SW-846 methods performed when conducted in routine fashion. 454 analyte-matrix-method combinations over 9 methods were collected and analyzed Use the limits as a set of “benchmarks” that labs were required to achieve, regardless of method parameters. Limits were expected to be used in comparison with new technology All analytes spiked in the LCS shall meet the DoD generated limits (for lab approval)

LCS Study Overview 2004 Study
Methods Evaluated: 6010 – Metals/ICP-AES 7470/7471 – Mercury/CVAA 8081 – Organochlorine Pesticides/GC 8082 – PCB Aroclors/GC 8151 – Chlorinated Herbicides/GC 8260 – Volatile Organics/GC-MS 8270 – Semi-volatile Organics/GC-MS 8310 – PAHs/HPLC 8330/8330A – Explosives/HPLC

LCS Study Overview: 2013 • Purpose: To re-evaluate laboratory performance using a
larger and more recent data set and update limits published in the DoD QSM
• Parameters: 23 methods, 52 laboratories, 1258 analyte-matrix-method combinations
• Participating laboratories were either accredited in accordance with DoD ELAP or assessed in accordance with DOE-CAP
• Approximately 6.5 million records were uploaded, of which 91% were successfully processed and used for setting control limits

2013 LCS Study Parameters • A minimum of one year’s LCS data was collected from
each laboratory, representing at least 30 results per analyte/matrix/method combination
• No data older than 3 years accepted
• Data cleaning steps resulted in exclusion of approximately 9% of submitted data
• A minimum of 100 records representing at least 4 laboratories was required per analyte/matrix/method combination, in order to calculate limits

2013 LCS Study
Additional methods evaluated: SW-846 Methods
6020 – Metals - ICP/MS 6850 – Perchlorate - HPLC/ESI/MS; MS/MS 7196 – Hexavalent Chromium - Colorimetric 8015 – Nonhalogenated Organics - GC 8141 – Organophosphorus Compounds - GC 8270 SIM – Semivolatile Organics - GC/MS 8290 – Dioxins/Furans - HRGC/HRMS

2013 LCS Study
Additional methods evaluated: SW-846 Methods (cont’d.)
8321 – Non-volatile Organics – HPLC/TS/MS 8330B – Explosives – HPLC/UV 9010-9021 – Cyanide - Various 9056 – Inorganic Anions - IC
Non-SW-846 Methods RSK-175 – Dissolved Gases - GC TO-15 – VOCs in Air/Canister - GC/MS 1668 (CWA) – PCB congeners -
HRGC/HRMS

2013 LCS Study Results Based on 1,258 analyte-matrix-method combinations:
Bias (mean LCS recoveries across
laboratories) • 97% of limits centered at ≥ 60% • 67% of limits centered at ≥ 90%
Precision (range of LCS recoveries across
laboratories) • Only 14% of ranges within ± 20% • 97% of ranges within ± 75%

How do the results compare with
the 2004 study?
***The mean LCS percent recovery improved since 2004 for 72% of the limits.***
• OK, enough with the statistics. Have control limits gotten
“better” or “worse” since the last study? Answer: Neither
• Calculated QSM LCS Control Limits represent:
– Multiple laboratories using their in-house procedures – Multiple versions of the methods – Multiple sample preparation/extraction/detection
options

What about “Poor Performers”? Well, what exactly is a “poor performer”? Analytes for which recoveries were ≤ 15% (≥ 100%) or had RSD ≥ 25% were considered poor performers. 64 analytes were identified as poor performers. They were censored and do not appear in the QSM/QSAS Appendix C Tables.
Analyte Method Standard Deviation
Mean Control Limits
Tungsten 6010 (Solid)
43 41 0-170
Zirconium 6010 (solid)
46 70 0-207
Propene RSK-175 (water)
14 142 100-185

Some Additional Poor Performers
Analyte Method Standard Deviation
Mean Control Limits
Merphos 8141 (water) 26 74 0-153
Monocrotophos 8141 (water) 35 55 0-160
Dinoseb 8151 (water) 37 52 0-162
Dalapon 8151 (water) 21 62 0-125
Benzaldehyde 8270 (solid) 30 56 0-146
Benzidine 8270 (solid) 20 38 0-100
Benzoic Acid 8270 (solid) 25 66 0-140
Phenol 8270 (water) 21 46 0-108

A Case for 1,4 Dioxane by Method 8260
Analyte Method Standard Deviation
Mean Control Limits
1,4 Dioxane 8260 (solid) 14 96 55-138
1,4 Dioxane 8260 (water) 13 99 59-139
1,4 Dioxane 8270 (solid) 17 48 0-100
1,4 Dioxane 8270 (water) 14 47 4-90
1,4 Dioxane 8270 SIM (water)
16 57 10-105

Questions??

1 EMDQ • 8 April 2014
2013 Laboratory Control Sample (LCS) Control Limits
Study
www.neptuneinc.org
Kelly Black Matt Pocernich
2 EMDQ • 8 April 2014
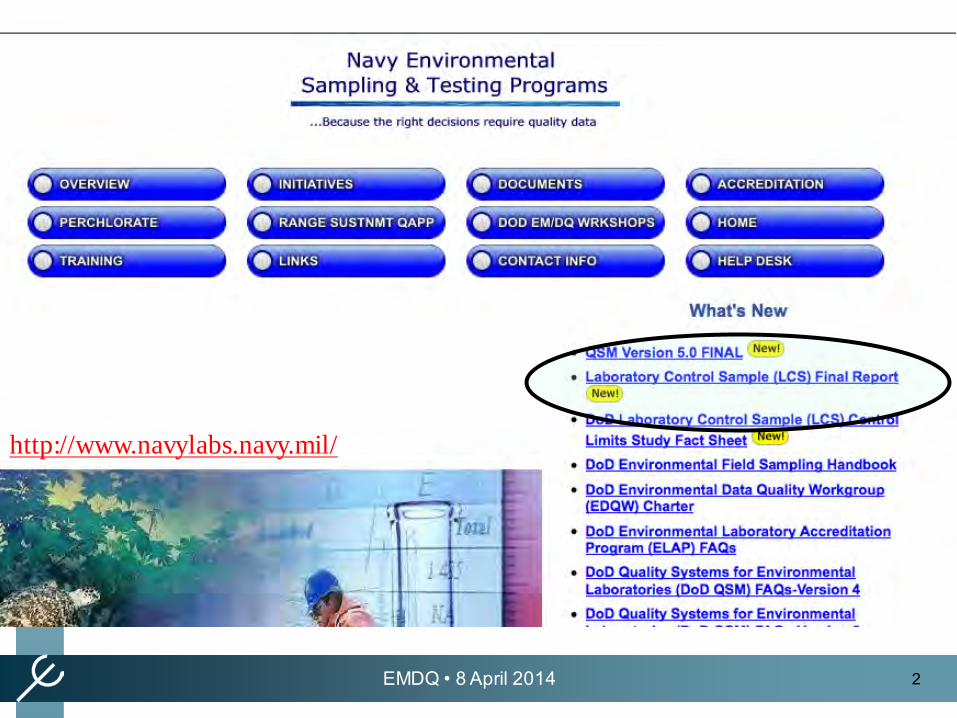
http://www.navylabs.navy.mil/

3 EMDQ • 8 April 2014
• Summary of the update process
• Overview of results
• Comparison to 2004 study
• Potential extension
Presentation Outline
4 EMDQ • 8 April 2014
• Solicit data from potential participants
• Create website to facilitate upload
• Process data to ensure correct identification of methods and analytes
• Calculate new limits
• Review and publish
The Update Process

5 EMDQ • 8 April 2014
• Letter to potential participants – ELAP, DOELAP
• Create website with minimal
requirements on input data
• No fixed lists of methods or analyte names – Less effort by the participants hopefully
resulted in more participants – More effort needed on the back end
Solicit participants

6 EMDQ • 8 April 2014
The review process was iterative
Statistician/ Programmer
Chemist
EDQW

7 EMDQ • 8 April 2014
Data Scrubbing • Create unambiguous and consistent
names – Matrix mapped to water, solid, gas – Method Name / Media – Analyte / CAS ID names – Prep method (frequently omitted, not used
for censoring) 1.9%

8 EMDQ • 8 April 2014
More Data Scrubbing • Mismatches between reported and
calculated percent recovery
• Percent recovery reported beyond believable window (>1000%, <2%)
1.9%
2.2%

9 EMDQ • 8 April 2014
• Records were examined for outliers at the matrix/method/analyte level by creating boxplots
• For a given matrix/method/analyte, if more than 25% of the data from a specific laboratory was identified as outliers, all data from that laboratory was removed – In 2004, outliers were identified using
Youden’s test at the laboratory level. This removed more than half of the available records.
Outlier Removal
2.5%
0.2%

10 EMDQ • 8 April 2014
Datum vs. Lab Weighting • 2013 LCS Study gives equal weight
to each datum. This was also done in 2004.
• Implicitly, this means that laboratories with more data have a greater impact on limits.
• This is supported by the assumption that after the data cleaning and outlier removal, every remaining record represents a representative, independent and exchangeable sample of a recovery.
• In English: each data point represents an LCS result, so all should be given equal consideration.

11 EMDQ • 8 April 2014
Criteria for Calculating Limits
• A minimum of 100 samples were required for each matrix/method/analyte (In 2004, the minimum was 15)
• A minimum of 4 labs must have submitted data
12 EMDQ • 8 April 2014
SIMPLE Control Limit Calculation

13 EMDQ • 8 April 2014
Contol Limit Calculation
• and sd are sample mean and standard deviation
• Intervals are symmetric
• Intervals are not a function of sample size
• Expect about 3 out of 1,000 results to fall outside these intervals
14 EMDQ • 8 April 2014
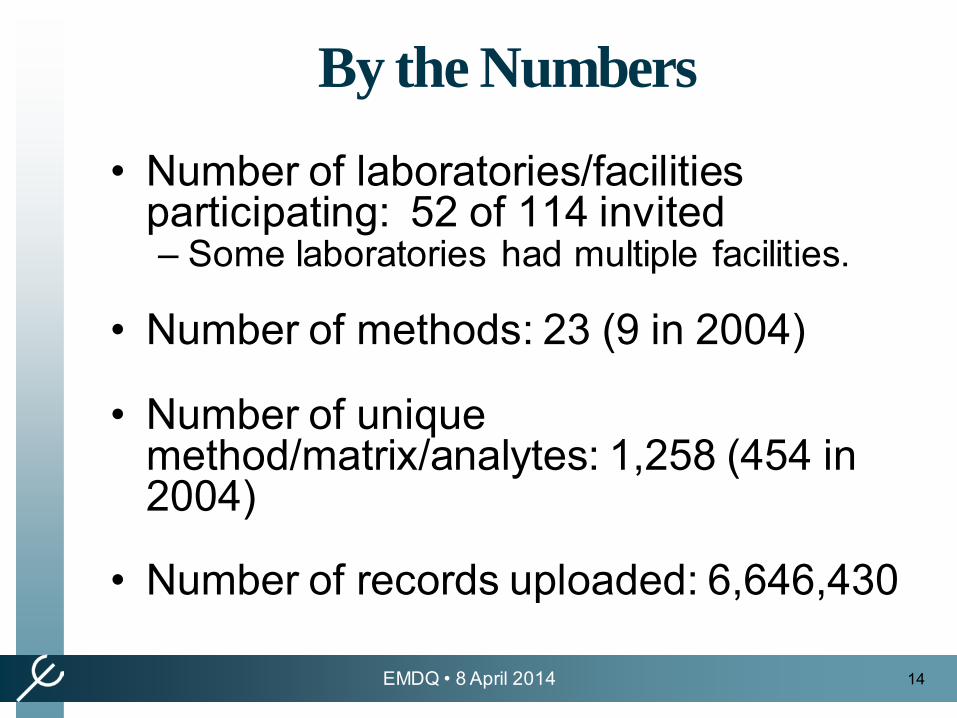
By the Numbers
• Number of laboratories/facilities participating: 52 of 114 invited – Some laboratories had multiple facilities.
• Number of methods: 23 (9 in 2004)
• Number of unique
method/matrix/analytes: 1,258 (454 in 2004)
• Number of records uploaded: 6,646,430

15 EMDQ • 8 April 2014
Water Matrix Methods Limits

16 EMDQ • 8 April 2014
Relative spread (RSD) records
% RDS

17 EMDQ • 8 April 2014
Solid Matrix Limits

18 EMDQ • 8 April 2014
% RSD
Relative Spread (RSD) Solids Records

19 EMDQ • 8 April 2014
Comparison of changes from 2004 Ratio SD 2013 / SD 2004
Narrower Distribution
Wider Distribution

20 EMDQ • 8 April 2014
Change in Distance from 100% (2004 – 2013)
Nearness to 100% Recovery
Closer to 100%
Further From 100%

21 EMDQ • 8 April 2014
• Effects of prep and cleanup methods on recovery rates
• Non-parametric intervals
• Limits as a function of concentration
Items for future discussion or study

22 EMDQ • 8 April 2014
Thanks!
We would like to thank the laboratories and their staff who made this update possible by participating and sharing their data.

Laboratory Control Sample Control Limits Study
Laboratory Perspectives April 2014
Chuck Stoner U.S. Army Public Health Command
DoD Environmental Data Quality Workgroup

Summary Laboratory familiarity with the LCS Study and updated
LCS control limits Perceptions from the lab point of view Poor performers/problem analytes Determination of control limits Laboratory observations and concerns Discussion
Questions to DoD ELAP Labs Did you participate in the DoD LCS Control Limits
Study? If not, are you familiar with the results (DoD LCS
control limits, found in the DoD EDQW LCS report and in DoD QSM 5.0)?
Are you prepared to implement the updated limits for DoD projects?

General Perceptions From the Lab Point of View
DoD ELAP labs are generally aware of the 2012/13 LCS study and resulting LCS limits in QSM V5.0; certainly those that participated in the study.
QSM V5.0 LCS limits are reasonable (possible compound by compound or class by class exceptions for some labs).
Most labs can readily implement different LCS limits project to project (batch control, reporting), but perhaps not all. (Less are able to report DL, LOD, and LOQ on report forms.)

Perceptions From the Lab Point of View
Laboratories generally prefer to use DoD QSM limits because they are constant across all contracts/labs.
Labs understand that project specific limits are encouraged (to say the least) on the project side, and are ready to implement those for batch control.
Labs will monitor trends using in-house limits and will not expect a project to request in-house limits as project limits (unless project and DoD QSM limits are not available).
Labs should not expect a project to request method limits be used as project limits.

Poor Performers/ Problem Analytes
SVOCs: phenols and even more so, amines (e.g., anilines).
VOCs: ketones; some brominated compounds. OC pesticides: BHCs (incl. Lindane),
heptachlor/heptachlor epoxide. Herbicides: chloramben, dalapon. Metals: antimony. Poor Performers (those with lower control limit < 15%
and/or RSD of >25%, based on LCS study).

Poor Performers Method CAS
Number Analyte N
Records
Mean Standard Deviation
LCL UCL
6010 Solid 7440-21-3 Silicon 1214 75.5 39.5 0 194.1 6010 Solid 7440-33-7 Tungsten 273 41.1 43.2 0 170.8 6010 Solid 7440-67-7 Zirconium 239 70.4 45.6 0 207.3 6010 Water 7440-33-7 Tungsten 400 45.1 46.3 0 183.9 6010 Water 7440-67-7 Zirconium 217 60.1 52.9 0 218.7 8082 Water 877-09-8 Tetrachloro-m-xylene 1523 73.2 20 13.1 133.4 8141 Solid 150-50-5 Merphos 310 74.2 26.2 0 152.8 8141 Solid 300-76-5 Naled 308 54.8 39.7 0 174.1 8141 Water 298-03-3 Demeton-O 132 64.2 20.3 3,4 125.1 8141 Water 52-85-7 Fampphur 315 82.8 22.9 14.1 151.5 8141 Water 7786-34-7 Mevinphos 719 91.9 34.8 0 196.2 8141 Water 6923-22-4 Monocrotophos 136 54.7 34.9 0 159.3 8141 Water 300-76-5 Naled 670 69.1 25.7 0 159.3 8141 Water 122-34-9 Simazine 334 89.7 29.3 1.7 177.6 8141 Water 107-49-3 Tetraethyl pyrophosphate
(TEPP) 242 81.2 42.3 0 208
8151 Solid 25057-89-0 Bentazon 117 69.8 19.7 10.6 128.9 8151 Solid 75-99-0 Dalapon 1017 61.9 21 0 125 8151 Solid 88-85-7 Dinoseb 984 52.3 36.5 0 161.8 8151 Solid 87-86-5 Pentachlorophenol 645 78.6 21.5 13.9 143.2 8151 Solid 1918-02-1 Picloram 238 74.6 20 14.6 134.5 8151 Water 88-85-7 Dinoseb 1555 74.4 20 14.4 134.4 8260 Solid 91-57-6 2-Methylnaphthalene 2687 78.5 21.5 14.1 142.9 8260 Water 108-94-1 Cyclohexanone 9007 76.8 31.9 0 172.6 8270 Solid 123-91-1 1,4-Dioxane 745 48.1 17.3 0 99.8 8270 Solid 106-50-3 1,4-Phenylenediamine 188 27.2 10.6 0 59 8270 Solid 134-32-7 1-Naphthylamine 169 54.9 20.1 0 115.1 8270 Solid 51-28-5 2,4-Dinitrophenol 3799 71 22 5 137.1 8270 Solid 91-59-8 2-Naphthylamine 172 39.4 13.1 0 78.9

Poor Performers For poor performers, labs should expect projects to
evaluate in-house limits vs project specific limits (as with all project analytes).
When projects are using DoD QSM V5.0 limits for LCS criteria, labs can expect projects to request in-house limits be used for batch control for poor performers (if the in-house limits are acceptable to the project).
For poor performers/difficult classes of compounds, even if LCS results are acceptable, matrix can easily drop recoveries to near zero.

Lab Methods to Determine Control Limits
Three standard deviations from the mean of the population being studied; presumed to be the most popular approach.
Must meet QSM V5.0, Module 4, 1.7.3.2.3(c) requirements.
Do labs test for normally distributed data? Are other (nonparametric) methods used if the data is not
normally distributed?

Laboratory Observations Projects expect the lab’s in-house LCS limits to be within
the DoD QSM limits. Although an important element in the lab selection
process, LCS limits aren’t the only element a project considers; and having the ‘tightest’ LCS limits of several candidate labs doesn’t appear to be of high importance (as long as the in-house limits are within project or DoD limits).
Labs should expect the project is interested in the lab’s precision and accuracy at concentrations near decision levels, which are possibly lower than the lab’s LCS spike concentration.

Laboratory Concerns Being identified as not qualified based on a project’s comparison
of in-house limits to project specific or QSM limits: Having in-house limits slightly outside the QSM limits on the upper
end (a few percent), while being within the limits on the low end, and having roughly the same standard deviation and mean recovery.
Having in-house limits outside the QSM limits on the high end, but having a lower control limit substantially higher than the LCS lower limit, a smaller standard deviation, and a mean recovery near 100% (so better overall performance).
Labs are hoping for reasonable (and more in-depth when needed) lab evaluations (LCS limits).
DoD LCS control limits being more stringent than calibration (CCV) criteria.

A Related Topic, CCV = LCS Using a CCV as an LCS is permitted. Requirements:
There are no sample preparation steps involving the LCS.
The laboratory must use the method acceptance criteria for the CCV, and the in-house statistically established control limits for LCS evaluations.
The lab must use their CCV for trending purposes.


Implementation and Assessment of LCS Control Limits in the Laboratory
Chris Gunning Environmental Sciences Program Manager
American Association for Laboratory Accreditation (A2LA), Frederick, Maryland

Topics • What does the QSM require?
• How should a laboratory’s in-house LCS control limits be used?
• How should the project-specific LCS control limits be used?
• How should the QSM LCS control limits be used?
• How is the LCS study used in assessments?

What is an LCS? • Laboratory Control Sample.
• Analyte-free matrix spiked with target analytes used
to document laboratory performance.
• Prepared with each batch of 20 or fewer samples.
• Processed through the entire samples preparation
and analysis sequence.

What does the QSM Require? • Laboratories must determine their in-house LCS control
limits.
• Compile LCS recovery data for specific analyte-method-matrix combinations over time (at least 30 samples)
• Must have statistically established LCS control limits for all combinations on scope.
• Must have procedures documented for establishing LCS control limits.

What does the QSM Require? • In-house LCS limits must meet requirements listed in
1.7.3.2.3(c) of V1M4 of the QSM Version 5.0.
• LCS limits must be used to monitor performance and
estimate contribution to analytical uncertainty.
• Must have procedures documented for establishing
LCS control limits.

Batch-Specific LCS Requirement • An LCS or LCS duplicate pair must be processed with
each batch of 20 or fewer field samples (of the same matrix).
• Comparison of LCS results to in-house LCS control limits verifies whether analytical system is in control.
• Comparison of LCS results to MS/MSD results helps identify matrix interferences and other analytical problems.

How to use the Lab’s Limits • Project chemist should compare a lab’s in-house limits
with project specific limits for precision and bias.
• To meet the project’s DQOs, the lab’s in-house limits
must meet the project specific Measurement
Performance Criteria (or QSM limits) for precision and
bias.
• Keep in mind that the LCS is the best case scenario.

How to use the Project Specific LCS Limits. • Project teams shall establish project-specific LCS
limits.
• DoD QSM limits may be adopted if they meet the
projects DQOs.
• Any lab with in-house limits outside the project-
specific limits shall not be used.

Method-Specified LCS Control Data.
• LCS results (% recovery and standard deviation) published in the method.
• Provide method-performance data under controlled conditions (e.g., single-laboratory trials, specified spike concentrations, skilled analysts, method performed as written) defined in the method.
• Data may represent various matrices, preparation methods, and concentration levels.
• Results should NOT be used as absolute QC acceptance criteria for method performance.

How to use the QSM LCS Control Limits • For DoD projects the lab must use the QSM LCS
control limits for batch quality control and data
reporting unless project-specific limits are specified.
• When project-specific analytes are not included in
Appendix C, lab’s must use their in-house limits.

What to Consider When Using the QSM LCS Control Limits • The QSM limits are likely to have a wider range than
individual labs as data was pooled from multiple labs
using their own SOPs.
• In most cases the LCS samples were prepared by
spiking a matrix at the mid-point of the calibration
curve which is likely higher than a project’s decision
level.

What to Consider When Using the QSM LCS Control Limits • Only three classes of analytes (metals, explosives,
and PAHs) were evaluated using more than one
method meaning only these can be used for method
performance comparison.
• Modifications to methods can improve performance
but may require method validation and regulatory
agency approval.

How do ABs use the LCS Study in Assessments? • Ensure that spiking levels are at or below the mid-
level and that all target analytes are tracked.
• Spot check for CCV failures when a target analyte
fails in the LCS/LCSD.
• Examine LCS trending charts to ensure that the labs
in house limits would be able to support the QSM
limits for DoD projects.

How do ABs use the LCS Study is Assessments? • Look for outliers in LCS trending data and examine
corrective actions.
• Ensure that when failures occur, that samples are re-
extracted or re-processed.
• Ensure that surrogates and target analytes are
treated the same for calibration checks.

Accreditation?
• Can a lab be accredited with in-house limits that do
not match the QSM limits?
• Yes—We will evaluate the laboratory in-house limits to
ensure that the data supports migration to the
QSM/project limits if necessary.

Questions / Comments

Contact: Chris Gunning Phone: 240 575 7481
Email: [email protected]
For Further Information
American Association for Laboratory Accreditation 5301 Buckeystown Pike, Suite 350
Frederick, MD 21704 www.A2LA.org

US Army Corps of Engineers BUILDING STRONG®
UFP QAPP: Systematic Project Planning and the LCS
Presenter Kari L. Meier, Ph.D.
Environmental and Munitions Center of Expertise
US Army Engineering and Support Center Huntsville, AL
12 April 2014

BUILDING STRONG®
UFP QAPP: Systematic Project Planning
The QAPP must document: “the environmental decisions that need to
be made… and the level of data quality needed to
ensure that those decisions are based on sound scientific data.”
2

BUILDING STRONG®
Lay the Foundation:
Conceptual Site Model (CSM)
3
UFP QAPP Worksheet #10: (UFP-QAPP Manual Section 2.5.2)
(EPA 2106-G-05 Section 2.2.5)
Text Figures Tables Updated as new data are collected. Multiple sites with unique problems, separate CSM for each site. Data gaps and uncertainties in the CSM clearly identified.
•Background – description and history, including key physical aspects of the site (e.g., site geology, hydrology, topography, climate); •Sources - known or suspected hazardous waste, contaminants or classes of contaminants; •Release Mechanism - including fate and transport considerations; •Receptors and Pathways - potential for exposure; •Model - Current interpretation of nature and extent of contamination •Land use
[1] Guidance on Systematic Planning Using the Data Quality Objectives Process, U.S. EPA, EPA QA/G-4, February 2006. [2] Technical Project Planning Process, U.S. Army Corps of Engineers, EM 200-1-2, August 1998

BUILDING STRONG®
Project Data Quality Objectives
4
UFP QAPP Worksheet #11: (UFP-QAPP Manual Section 2.6.1)
(EPA 2106-G-05 Section 2.2.6)
Document project quality objectives (PQOs) or data quality objectives (DQOs) using a systematic planning process (SPP) EPA’s 7 Step DQOs: 1. State the Problem. - consistent with the CSM (data gaps).
2. Identify the Goals of the Study. specific study questions with alternative outcomes. (Explain goals in terms of how the data will be used to choose among the stated outcomes.)
3. Identify Information Inputs. a. Specify the types of data required to fill data gaps. b. Explain in specific terms how all data will be used.
4. Define the Boundaries of the Study.
a. Specify the target population and characteristics of interest, define spatial /temporal limits and the scale of inference (i.e., which populations will be represented by which data.) b. Develop list of Target Analytes - specific constituents reasonably known or suspected. This provides better opportunities for optimizing method performance for those analytes. Focuses on CSM data gaps.
[1] Guidance on Systematic Planning Using the Data Quality Objectives Process, U.S. EPA, EPA QA/G-4, February 2006. [2] Technical Project Planning Process, U.S. Army Corps of Engineers, EM 200-1-2, August 1998

BUILDING STRONG®
Project Data Quality Objectives
5
UFP QAPP Worksheet #11: (UFP-QAPP Manual Section 2.6.1)
(EPA 2106-G-05 Section 2.2.6)
5 . Develop the Analytic Approach. Define the parameter(s) of interest, and develop the logic or statistics for drawing conclusions from findings. (What kind and how much data?) For decision problems -“if---then” statements, or decision rules, to link potential results with outcomes.
6. Specify Performance or Acceptance Criteria.
a. For hypothesis testing (e.g. presence or absence of contamination exceeding some threshold value), specify probability limits for decision errors.
b. For estimations and other analytic approaches (e.g. estimating the volume of groundwater or soil potentially requiring remediation), develop performance criteria (for new data being collected) or acceptance criteria (for existing data being considered for use).
[1] Guidance on Systematic Planning Using the Data Quality Objectives Process, U.S. EPA, EPA QA/G-4, February 2006. [2] Technical Project Planning Process, U.S. Army Corps of Engineers, EM 200-1-2, August 1998
7. Develop the Detailed Plan for Obtaining
Data. Refer to– WS #11 overview of sampling design WS #17 -design details. WS #19, 20, 24-28, and 30 – analysis design requirements.

BUILDING STRONG®
Project Action Limits and Laboratory-Specific Detection/Quantitation Limits
6
UFP QAPP Worksheet #15: QAPP Worksheet #15: (UFP-QAPP Manual Section 2.6.2.3 and Figure 15)
(EPA 2106-G-05 Section 2.2.6)
Ensure the analytical laboratory and method can provide quantitative results with known precision and bias at the Project Action Limit (PAL).
For each matrix, analyte, analytical method, and concentration level: Target Analytes, Project ALs, and the reference limits on which they are based. Determine the matrix-specific quantitation limit goal -lower than
the Project AL by amount to meet project objectives. [1] Guidance on Systematic Planning Using the Data Quality Objectives Process, U.S. EPA, EPA QA/G-4, February 2006.
[2] Technical Project Planning Process, U.S. Army Corps of Engineers, EM 200-1-2, August 1998

BUILDING STRONG®
Project Action Limits and Laboratory-Specific Detection/Quantitation Limits
7
UFP QAPP Worksheet #15: QAPP Worksheet #15: (UFP-QAPP Manual Section 2.6.2.3 and Figure 15)
(EPA 2106-G-05 Section 2.2.6)
Info Used with information in WS#12 to select analytical methods and labs. Lab must demonstrate precision and bias at the lab-specific quantitation
limit (LOQ) not lower than the lowest calibration standard for any given method and analyte.
Once the methods and labs are selected, complete remaining columns with laboratory-specific information.
Analyte Project
Action Limit (PAL)
PAL Reference
Project Quantitation
Limit Goal
Laboratory-specific
quantitation limit
Laboratory-specific
detection limit
Benzene 5.0 mg/Kg dry weight
2003 Region 3
BTAG
2.0 mg/Kg dry
weight
1.0 mg/Kg 0.1 mg/Kg
BUILDING STRONG® 8
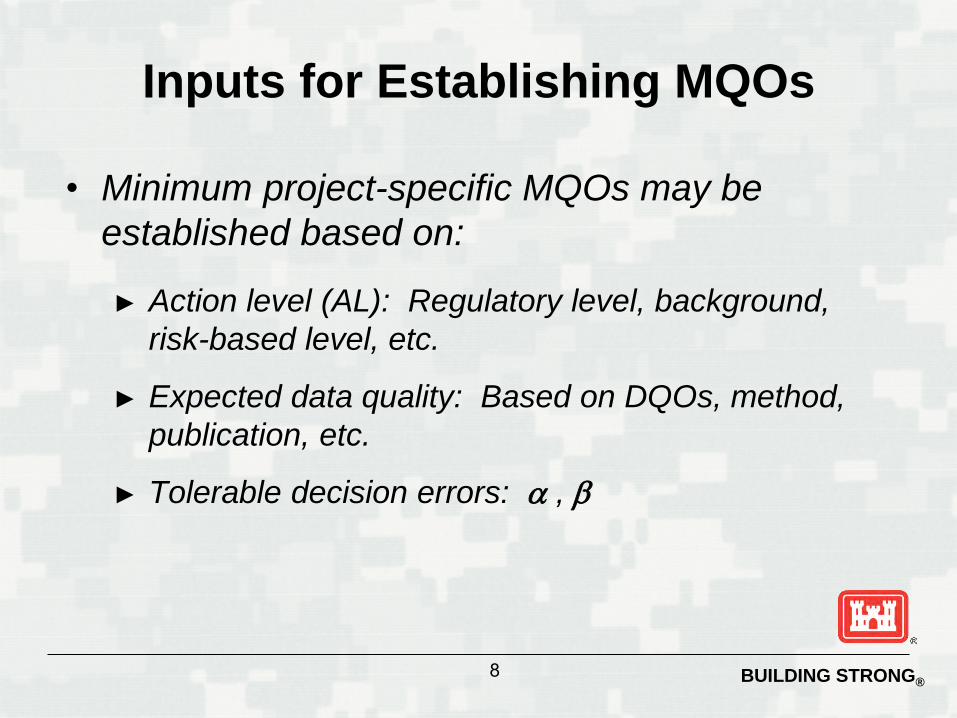
Inputs for Establishing MQOs
• Minimum project-specific MQOs may be established based on:
► Action level (AL): Regulatory level, background, risk-based level, etc.
► Expected data quality: Based on DQOs, method, publication, etc.
► Tolerable decision errors: α , β

BUILDING STRONG®
Project Action Limits (ALs or PALs)
Target analytes that are critical to project-specific decision-making should be highlighted. Include PALs with reference limits (e.g.
regulatory limits or risk-based limits) on which action limits are based. If more than one set of reference limits are
applicable, add columns in WS #15.
9

BUILDING STRONG®
Project Reporting Limit (RL)
Reporting Limit = A client specified lowest concentration value that meets the project requirements for quantitative data with a known precision an bias for a specific analyte in a specific Matrix.
10

BUILDING STRONG® 11
• LOQ ≠ Reporting Limit (RL) • LOQ ≠ Lowest Calibration Standard • LOQ ≠ A Multiple of MDL • LOQ = The lowest concentration that produces
a quantative result within specified limits of precision and bias. For DoD projects, this is at or above the lowest initial calibration standard.
• Remember: Lab-specific LOQ is usually determined in reagent water, so the matrix-specific Project RL will be higher.
Limit of Quantitation (LOQ)

BUILDING STRONG® 12
How Do Projects Define These?
LOD LOQ DL
J
AL RL 0 ~2×DL
LOQ Range
~3 – 10×DL

BUILDING STRONG® 13
Project DQOs: The Bigger Picture Laboratory MDL, LOD, LOQ, and the Project RL and AL
LC LD 0
LOD LOQ DL
J
AL RL 0 ~2×DL
LOQ Range
~3 – 10×DL
1% FN
1% FP 50% FN

BUILDING STRONG® 14
Graphic View of LC and LD
(~DL~MDL)
0 12 10 6 8 4 2
0.5
0.4
0.3
0.2
0.1
0.0
Concentration
Prob
abili
ty D
ensi
ty
(~LOD) Critical Level (LC) Detection Limit (LD)
FN = 1%
FP = 1%
FN = 50%
and , if σ0 ≈ σD and Z1-α = Z1-β CDCDC LzLLzL ×≈+== −− 2101 σσ βα

BUILDING STRONG® 15
Measurement Uncertainty
Concentration
99% UCL
1% FP
DL LOQ
Quantitation Range
99% LCL
••
J E
RL
Approximately constant variance within Quantitation Range

BUILDING STRONG® 16
Measurement Uncertainty
••
Source: John K. Taylor, Quality Assurance of Chemical Measurements (1987)
Std Dev
ACS LOD/LOQ

BUILDING STRONG®
Measurement Performance Criteria
17
UFP QAPP Worksheet #12: QAPP Worksheet #15: (UFP-QAPP Manual Section 2.6.2)
(EPA 2106-G-05 Section 2.2.6)
Documents the quantitative measurement performance criteria (MPC) in terms of precision, bias, and sensitivity.
A separate WS for each type of field/lab measurement. Determined for each matrix, analyte, and concentration
level. Qualitative MPC (representativeness and comparability) WS #17
Analyte-specific detail included as separate tables or modify this worksheet as necessary.

BUILDING STRONG® 18
Data Quality Indicators
• Precision: Variability; measured by relative percent difference (RPD) of duplicates or standard deviation of LCS recoveries.
• Bias: Difference between measured and true values; measured by percent recoveries (%Rs) of spikes or mean percent recovery of LCS.
• Sensitivity: Smallest level for reliably reporting analyte concentrations; measured by the LOD and LOQ.
Low Bias
Some Bias
Precise
Less Precise

BUILDING STRONG®
Data Quality Indicator (DQI)
QC sample or measurement performance activity Measurement Performance Criteria
Overall Precision Field Duplicates RPD ≤ 30% when VOCs are detected in both samples ≥ sample-specific LOQ
Analytical Precision (laboratory)
Laboratory Control Sample Duplicates RPD ≤ 25%
Analytical Accuracy/Bias (laboratory)
Laboratory Control Samples Analyte-specific (Attach list)
Analytical Accuracy/Bias (matrix interference)
Matrix Spike Duplicates Analyte-specific (Attach list)
Overall accuracy/bias (contamination) Equipment Blanks No target analyte concentrations ≥ 1/2 LOQ
Sensitivity LOQ verification sample (spiked at LOQ) Recovery within ±25% of LOQ
Completeness See Worksheet #34 See Worksheet #34 19
UFP QAPP Worksheet #12:
QAPP Worksheet #15: (UFP-QAPP Manual Section 2.6.2) (EPA 2106-G-05 Section 2.2.6)
Matrix: Groundwater Analytical Group or Method: VOA/8260B Concentration Level: Low For example only
Measurement Performance Criteria

BUILDING STRONG®
Analytical Quality Control - Corrective Action
20
QC Sample Number/
Frequency Method/SOP Acceptance
Criteria Corrective Action
Title/position of person responsible
for corrective action
Project-Specific MPC
Method Blank
1 per prep. batch of up to 20 samples.
No analytes detected > ½ reporting limit (RL), 1/10 the amount measured in any sample, or 1/10 the regulatory limit, whichever is greater.
Reprep and reanalyze the method blank and all samples processed with the contaminated blank. If problem persists, call PM.
Analyst / Laboratory Quality Assurance Officer
All analytes in the method blank must be less than ½ the RL or 1/5 of the PAL’s on WS#15, whichever is greater
LCS containing all analytes
One per preparatory batch of up
to 20
samples.
QC acceptance criteria specified in DoD QSM v4.2, if available. Otherwise use in-house limits.
Correct problem, reprep and reanalyze LCS and all samples in associated batch for failed analytes. If problem persists, call PM.
Analyst / Laboratory Quality Assurance Officer
All analytes in samples found to be within +/- 20% of the PAL’s on WS#15 MUST pass method/SOP criteria.
(UFP-QAPP Manual Section 3.4 and Tables 4, 5, and 6) (EPA 2106-G-05 Section 2.3.5)
Matrix: Soil Analytical Group: Metals Analytical Method/SOP: SW-846 6020A/SOP#BR549
Note: example is incomplete. See UFP-QAPP QA/QC Compendium.

BUILDING STRONG® 21
• LCS control limits and control charts demonstrate laboratory’s performance on a clean matrix.
• The inability to achieve acceptable recoveries of LCS indicates problems with the precision and bias of the measurement system.
• Failure to achieve acceptable recoveries in a clean matrix is an indicator of possible problems achieving acceptable recoveries in field samples.
LCS for Project Lab Acquisitions

BUILDING STRONG® 22
A single laboratory’s in-house limits should be tighter than (lie within) the QSM LCS control limits
The QSM LCS Control Limits do not represent best-case analytical capabilities
Methods can be optimized to achieve better performance for specific analytes
The QSM LCS Control limits should NOT be used as “default” project-specific MPCs for precision and bias
DoD/DOE QSM LCS Control Limits

BUILDING STRONG®
Non-Compliant
• A laboratory with in-house LCS control limits outside project-specified LCS acceptance limits are considered not qualified for DoD sample analysis, until it improves its in-house limits. ► The project may select a different laboratory, method,
or relax the data quality requirements.
23

BUILDING STRONG® 24
50% 90% 130% Pooled Labs, DoD QSM −−−−−−−−−−+−−−−−−−−−−−− 85% 105% 125% Lab A: −−−−−+−−−−−− PASS 30% 90% 160% Lab B: −−−−−−−−−−−−−−−−−+−−−−−−−−−−−−−−−−−−−−− FAIL
40% 60% 80% Lab C: −−−−−+−−−−− ???
70% 100% 130% Lab D: −−−−−−−−+−−−−−−−−− PASS
Establishing Project Requirements

BUILDING STRONG® 25
50% 90% 130% Pooled Labs, DoD QSM −−−−−−−−−−+−−−−−−−−−−−− 75% 100% 125% Lab Specific Requirement −−−−−−+−−−−−−− 85% 105% 125% Lab A: −−−−−+−−−−−− PASS 30% 90% 160% Lab B: −−−−−−−−−−−−−−−−−+−−−−−−−−−−−−−−−−−−−−− FAIL
40% 60% 80% Lab C: −−−−−+−−−−− FAIL
70% 100% 130% Lab D: −−−−−−−−+−−−−−−−−− FAIL
Establishing Project Requirements

BUILDING STRONG® 26
Data Quality & Decision Error
Is [X] < AL @ 95% confidence?
X X AL
> 5%
Is [X] < AL?

BUILDING STRONG® 27
Project RL vs Lab LOQ
Xβ AL Xα
2s 2s
β α
Project
Xβ AL Xα
2s 2s
β α
Lab A
LOQ ≤
LOQ ≤
RL ≤
AL Xβ
Lab B
α
2s 2s
Xα β

BUILDING STRONG® 29
Example for Establishing MQOs
• What are the MQOs required for reliable (α = β = 0.05) disposal of IDW to a landfill if AL < 50 ppm?
► Minimum Project MQOs Needed: AL: 50 ppm Tolerable Decision Errors: α =β = 0.05 Precision: LCS CL = ± 30% ⇒ s = 10% = 5 ppm Bias: mean LCS %R = 100% from publications Reporting Limit: RL = (AL – 4s ) × %R = 30 ppm ► Minimum Laboratory MQIs Needed: LOQ ≤ 30 ppm if precision = ± 30% and %R = 100% LOQ ≤ 15 ppm if precision = ± 30% but %R = 50%
BUILDING STRONG® 30
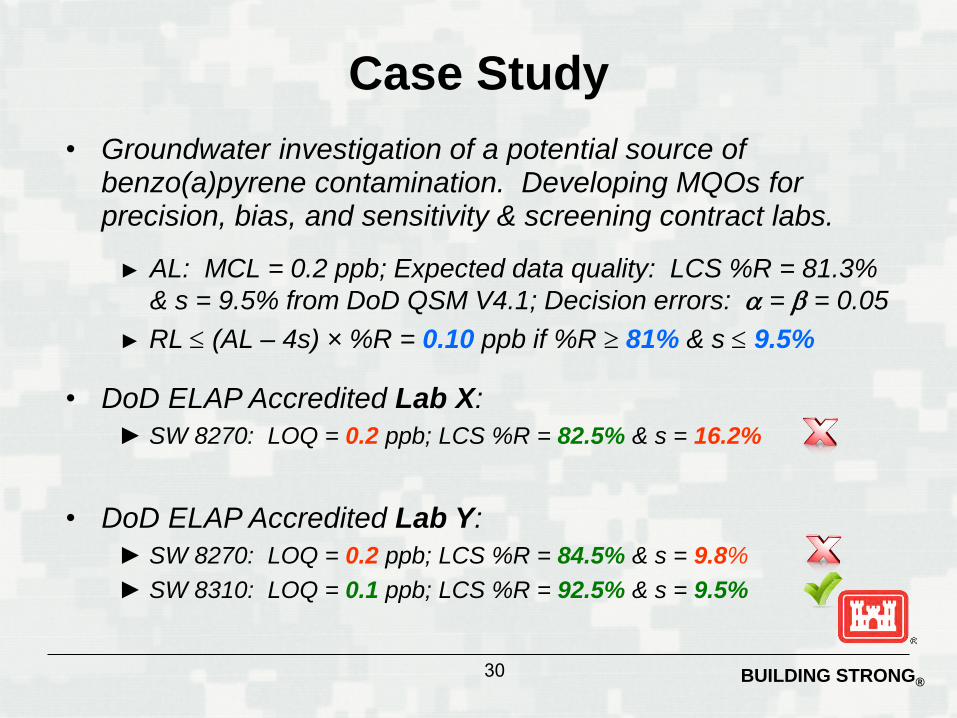
• DoD ELAP Accredited Lab X: ► SW 8270: LOQ = 0.2 ppb; LCS %R = 82.5% & s = 16.2%
Case Study • Groundwater investigation of a potential source of
benzo(a)pyrene contamination. Developing MQOs for precision, bias, and sensitivity & screening contract labs.
► AL: MCL = 0.2 ppb; Expected data quality: LCS %R = 81.3% & s = 9.5% from DoD QSM V4.1; Decision errors: α = β = 0.05
• DoD ELAP Accredited Lab Y: ► SW 8270: LOQ = 0.2 ppb; LCS %R = 84.5% & s = 9.8% ► SW 8310: LOQ = 0.1 ppb; LCS %R = 92.5% & s = 9.5%
► RL ≤ (AL – 4s) × %R = 0.10 ppb if %R ≥ 81% & s ≤ 9.5%

BUILDING STRONG® 33
Summary • Old Rules of Thumb of “LOQ = Lowest Cal. Std. = 3 ×
MDL ≤ RL ≤ 1/5 ~ 1/10 × AL” may not be adequate.
• Laboratory with LOQ ≤ RL does not necessarily meet project MQO for sensitivity. Precision & bias must also be considered.
• Need Scientifically valid and consistent procedures for establishing laboratory performance data precision, bias, and sensitivity.

BUILDING STRONG® 34
Contact Information: Kari L. Meier , Ph.D. Phone: 502-315-6316 e-mail: [email protected]
And Special Thanks to Chug-Rei Mao

BUILDING STRONG® 35
Contact Information: Chung-Rei Mao, Ph.D. Phone: 402-697-2570 e-mail: [email protected]
Special Thanks to Chug-Rei Mao for allowing me to beg, borrow and steal some of his LOD, LOQ, and RL slides!!

BUILDING STRONG® 36
Questions?