Embed Size (px)
Citation preview

Laboratory and Field Evaluation of an Alternative UHPC Mix and Associated UHPC BridgeFinal ReportJuly 2019
Sponsored byIowa Highway Research Board (IHRB Project TR-684)Iowa Department of Transportation(InTrans Project 14-525)

About the Bridge Engineering CenterThe mission of the Bridge Engineering Center (BEC) is to conduct research on bridge technologies to help bridge designers/owners design, build, and maintain long-lasting bridges.
About the Institute for Transportation The mission of the Institute for Transportation (InTrans) at Iowa State University is to develop and implement innovative methods, materials, and technologies for improving transportation efficiency, safety, reliability, and sustainability while improving the learning environment of students, faculty, and staff in transportation-related fields.
Iowa State University Nondiscrimination Statement Iowa State University does not discriminate on the basis of race, color, age, ethnicity, religion, national origin, pregnancy, sexual orientation, gender identity, genetic information, sex, marital status, disability, or status as a U.S. veteran. Inquiries regarding non-discrimination policies may be directed to Office of Equal Opportunity, 3410 Beardshear Hall, 515 Morrill Road, Ames, Iowa 50011, Tel. 515-294-7612, Hotline: 515-294-1222, email [email protected].
Disclaimer NoticeThe contents of this report reflect the views of the authors, who are responsible for the facts and the accuracy of the information presented herein. The opinions, findings and conclusions expressed in this publication are those of the authors and not necessarily those of the sponsors.
The sponsors assume no liability for the contents or use of the information contained in this document. This report does not constitute a standard, specification, or regulation.
The sponsors do not endorse products or manufacturers. Trademarks or manufacturers’ names appear in this report only because they are considered essential to the objective of the document.
Iowa Department of Transportation Statements Federal and state laws prohibit employment and/or public accommodation discrimination on the basis of age, color, creed, disability, gender identity, national origin, pregnancy, race, religion, sex, sexual orientation or veteran’s status. If you believe you have been discriminated against, please contact the Iowa Civil Rights Commission at 800-457-4416 or Iowa Department of Transportation’s affirmative action officer. If you need accommodations because of a disability to access the Iowa Department of Transportation’s services, contact the agency’s affirmative action officer at 800-262-0003.
The preparation of this report was financed in part through funds provided by the Iowa Department of Transportation through its “Second Revised Agreement for the Management of Research Conducted by Iowa State University for the Iowa Department of Transportation” and its amendments.
The opinions, findings, and conclusions expressed in this publication are those of the authors and not necessarily those of the Iowa Department of Transportation.

Technical Report Documentation Page
1. Report No. 2. Government Accession No. 3. Recipient’s Catalog No.
IHRB Project TR-684
4. Title 5. Report Date
Laboratory and Field Evaluation of an Alternative UHPC Mix and Associated
UHPC Bridge July 2019
6. Performing Organization Code
7. Author(s) 8. Performing Organization Report No.
Behrouz Shafei (orcid.org/0000-0001-5677-6324), Brent Phares
(orcid.org/0000-0001-5894-4774), Sri Sritharan (orcid.org/0000-0001-9941-
8156), Meysam Najimi (orcid.org/0000-0003-2421-5172), and Travis Hosteng
(orcid.org/0000-0002-2059-1296)
InTrans Project 14-525
9. Performing Organization Name and Address 10. Work Unit No. (TRAIS)
Bridge Engineering Center
Iowa State University
2711 South Loop Drive, Suite 4700
Ames, IA 50010-8664
11. Contract or Grant No.
12. Sponsoring Organization Name and Address 13. Type of Report and Period Covered
Iowa Highway Research Board
Iowa Department of Transportation
800 Lincoln Way
Ames, Iowa 50010
Draft Final Report
14. Sponsoring Agency Code
IHRB Project TR-684
15. Supplementary Notes
Visit www.intrans.iastate.edu for color pdfs of this and other research reports.
16. Abstract
Ultra-high performance concrete (UHPC) is a relatively new class of concrete that has material and durability properties
superior to normal concrete. These unique properties make it appropriate for use in construction for highway bridges.
Field applications of UHPC for highway bridges in the United States started in 2006. For this project, UHPC called K-UHPC,
which was developed by the Korea Institute of Civil Engineering and Building Technology, was used for construction of the
Hawkeye Bridge in Buchanan County, Iowa. The bridge was built using locally sourced cement, sand, and ready-mix trucks.
For the research presented in this report, selected properties of K-UHPC were studied. The research focus was on the
evaluation of strength behavior (compressive strength), long-term stability properties (creep and shrinkage), bonding with
reinforcement, and durability properties (freeze-thaw resistance and chloride ion penetration). These properties were estimated
using samples prepared in two different environments: first, with samples collected from the field environment where K-UHPC
was mixed in the Buchanan County Secondary Roads Department yard using conventional concrete mixers; then, using
samples prepared in the laboratory.
Properties evaluated from these two different scenarios are presented in this report. These are then compared to the properties
reported by the Federal Highway Administration (FHWA) for other UHPC mixtures. Finally, the outcome of the load tests
performed on the Hawkeye Bridge is presented.
7. Key Words 18. Distribution Statement
accelerated bridge construction (ABC)—Buchanan County bridge—Hawkeye
Bridge—K-UHPC evaluation—ultra-high performance concrete
No restrictions.
19. Security Classification (of this
report)
20. Security Classification (of this
page)
21. No. of Pages 22. Price
Unclassified. Unclassified. 94 NA
Form DOT F 1700.7 (8-72) Reproduction of completed page authorized

LABORATORY AND FIELD EVALUATION OF AN
ALTERNATIVE UHPC MIX AND ASSOCIATED
UHPC BRIDGE
Final Report
July 2019
Principal Investigator
Brent Phares, Research Associate Professor
Bridge Engineering Center, Iowa State University
Co-Principal Investigators
Behrouz Shafei, Assistant Professor
Sri Sritharan, Professor
Civil, Construction, and Environmental Engineering, Iowa State University
Research Assistants
Glenna Lovig and Jyothirmai Nandibhatla
Authors
Behrouz Shafei, Brent Phares, Sri Sritharan, Meysam Najimi, and Travis Hosteng
Sponsored by
Iowa Highway Research Board
and Iowa Department of Transportation
(IHRB Project TR-684)
Preparation of this report was financed in part
through funds provided by the Iowa Department of Transportation
through its Research Management Agreement
with the Institute for Transportation
(InTrans Project 14-525)
A report from
Bridge Engineering Center
Iowa State University
2711 South Loop Drive, Suite 4700
Ames, IA 50010-8664
Phone: 515-294-8103 / Fax: 515-294-0467
www.instrans.iastate.edu


v
TABLE OF CONTENTS
ACKNOWLEDGMENTS ............................................................................................................. xi
EXECUTIVE SUMMARY ......................................................................................................... xiii
CHAPTER 1: INTRODUCTION ...................................................................................................1
1.1 Overview ...........................................................................................................................1 1.2 Ultra-High Performance Concrete (UHPC) ......................................................................2
Composition .......................................................................................................2 Benefits ..............................................................................................................3
Challenges ..........................................................................................................3 Applications .......................................................................................................3
Material Suppliers ..............................................................................................5
1.3 K-UHPC 6 Features ..............................................................................................................6 Properties ...........................................................................................................6
1.4 Research Scope ..................................................................................................................7 1.5 Report Layout ....................................................................................................................7
CHAPTER 2: LITERATURE REVIEW OF K-UHPC ..................................................................8
2.1 Introduction .......................................................................................................................8 2.2 Material Composition and Curing of K-UHPC .................................................................8
2.3 Material Properties of K-UHPC ........................................................................................9 2.4 Properties of UHPC .........................................................................................................10
CHAPTER 3: FIELD APPLICATION OF K-UHPC AND TEST SAMPLES ............................13
3.1 Design and Construction of Hawkeye Bridge .................................................................13
Mix Design.......................................................................................................14 Materials ..........................................................................................................15 Mixing Process.................................................................................................15
Curing ..............................................................................................................16 3.2 Casting and Curing the Girders .......................................................................................17
3.3 Test Samples ....................................................................................................................21 3.4 Laboratory Test Results and Discussion .........................................................................22
Compressive Strength Test ..............................................................................22 Rapid Freeze-Thaw Test ..................................................................................26 Surface Resistivity (SR) Test ...........................................................................29
Summary of Test Results .................................................................................32
CHAPTER 4: K-UHPC LABORATORY TESTING ...................................................................33
4.1 Casting in the Laboratory ................................................................................................33 Trial 1 ...............................................................................................................33 Trial 2 ...............................................................................................................34 Trial 3 ...............................................................................................................36 Summary ..........................................................................................................38

vi
4.2 Test Results and Discussion ............................................................................................40 Compressive Strength Test ..............................................................................40 Shrinkage .........................................................................................................47
Creep ................................................................................................................52 Bonding with Reinforcement ...........................................................................53
CHAPTER 5: HAWKEYE BRIDGE FIELD TESTING .............................................................68
5.1 Bridge Description ...........................................................................................................68 5.2 Field Testing Details ........................................................................................................69
Instrumentation ................................................................................................69 Load Truck and Load Path ...............................................................................70
5.3 Analysis of Field Test Data .............................................................................................72
CHAPTER 6: SUMMARY AND CONCLUSIONS ....................................................................76
6.1 Summary ..........................................................................................................................76 6.2 Conclusions .....................................................................................................................76
REFERENCES ..............................................................................................................................79
vii
LIST OF FIGURES
Figure 1.1 Construction of the Wapello County bridge ...................................................................4 Figure 1.2 Jakway Park Bridge open to traffic (left) and second-generation pi-girder
installation at the site (right) ...........................................................................................5 Figure 3.1 Hawkeye Bridge pi-girder design .................................................................................13 Figure 3.2 Pouring (left) and steam-curing (right) the Hawkeye Bridge beams ...........................14 Figure 3.3 Mix not ready (left) and mix ready for addition of steel fibers (right) .........................16 Figure 3.4 Concrete mixer used to mix K-UHPC ..........................................................................17
Figure 3.5 Workers setting up the formwork for casting (left) and formwork along with the
duct for post tensioning (right) ......................................................................................18 Figure 3.6 Post tensioning ducts in the formwork and the machinery at a corner .........................18 Figure 3.7 Using conveyor for additives (left) and mesh-vibrator for steel fibers (right) .............19
Figure 3.8 Pouring the K-UHPC mix into the formwork ..............................................................19 Figures 3.9 K-UHPC immediately after pouring ...........................................................................19
Figures 3.10 Girders painted with curing paint and partly covered with plastic ...........................20 Figure 3.11 Girder after completion of the post tensioning using strands .....................................20 Figure 3.12 Covered girder for steam curing (left) and steam curing equipment (right) ..............20
Figures 3.13 Formwork prepared for the samples to be collected in the field while casting
the girder .......................................................................................................................21
Figures 3.14 Pouring the concrete into the cylindrical molds .......................................................21 Figures 3.15 Samples after removal from molds and after curing .................................................22 Figure 3.16 Variation of compressive strength of four mixes .......................................................24
Figure 3.17 Average compressive strength over time ...................................................................25 Figure 3.18 Beam samples to test for the effects of freeze thaw ...................................................26
Figure 3.19 Recording the natural frequency of the sample (left) and samples in the freeze-
thaw equipment (right) ..................................................................................................27
Figure 3.20 Variation of the RDM of elasticity by number of cycles ...........................................28 Figure 3.21 Variation of the weight of samples by number of cycles ...........................................28
Figure 3.22 Cylindrical samples used for testing with probe lines marked on them .....................30 Figure 3.23 Wenner four-electrode device and V-shaped stand ....................................................30 Figure 3.24 Variation of the resistivity by the age of concrete ......................................................31
Figure 4.1 Materials ready for mixing (left) and vertical mixer used for mixing K-UHPC
(right).............................................................................................................................36
Figure 4.2 K-UHPC while mixing (left) and cylindrical molds after casting (right) ....................37 Figure 4.3 Samples placed in steam-curing tank ...........................................................................38 Figure 4.4 Samples placed in the moist curing room after 4 days of steam curing .......................38 Figure 4.5 Equipment used for testing compressive strength ........................................................40
Figure 4.6 Front, back, and bottom of Sample 1 (left to right) ......................................................41 Figure 4.7 Front, back, and bottom of Sample 2 (left to right) ......................................................41 Figure 4.8 Front, back, and bottom of Sample 3 (left to right) ......................................................42
Figure 4.9 Front and back of Sample 1 (left and right) .................................................................43 Figure 4.10 Front and back of Sample 2 (left and right) ...............................................................43 Figure 4.11 Front view of Sample 3 ..............................................................................................44 Figure 4.12 Front and top views of samples (left and right) ..........................................................45 Figure 4.13 Test samples at 28 days ..............................................................................................46

viii
Figure 4.14 Variation of compressive strength by age of the concrete .........................................46 Figure 4.15 Beam shrinkage samples ............................................................................................47 Figures 4.16 Length comparator used to measure shrinkage .........................................................48
Figure 4.17 Variation of weight of the samples .............................................................................48 Figure 4.18 Variation of shrinkage by age.....................................................................................49 Figure 4.19 Demec gauge with the reference bar ..........................................................................50 Figure 4.20 Cylindrical samples with Demec discs glued to the surface ......................................50 Figure 4.21 Variation of shrinkage ................................................................................................51
Figure 4.22 Variation of weight .....................................................................................................51 Figures 4.23 Creep frame set up ....................................................................................................52 Figure 4.24 Pullout cube diagram ..................................................................................................53 Figure 4.25 Pullout cube test setup ................................................................................................54 Figure 4.26 UHPC pullout cube slip failure ..................................................................................55
Figure 4.27 K-UHPC pullout 2-inch embedment length ...............................................................56 Figure 4.28 K-UHPC pullout 2db embedment length ....................................................................56
Figure 4.29 Load versus slip data for K-UHPC pullout cubes ......................................................57 Figure 4.30 Bond stress versus slip for K-UHPC samples ............................................................58
Figure 4.31 Beam dimensions........................................................................................................60 Figure 4.32 Four-point beam loading diagram ..............................................................................60
Figure 4.33 Four-point bending setup ............................................................................................61 Figure 4.34 DCDT placement ........................................................................................................61 Figure 4.35 K-UHPC cracks at failure ...........................................................................................62
Figure 4.36 Steel fibers reinforcing concrete crack in K-UHPC ...................................................63 Figure 4.37 Load versus deflection K-UHPC beams.....................................................................63
Figure 4.38 K-UHPC and conventional concrete reinforced with GFRP and steel rebar .............64
Figure 4.39 Sand/glass fiber GFRP coating ...................................................................................65
Figure 4.40 Load versus slip for K-UHPC samples ......................................................................66 Figure 5.1 Plan view of the Hawkeye Bridge ................................................................................68
Figure5.2 Cross-section of the Hawkeye Bridge ...........................................................................69 Figure 5.3 Instrumentation detail for 2015 live load testing ..........................................................69 Figure 5.4 Instrumentation detail for 2017 live load testing ..........................................................69
Figure 5.5 Dump truck axle and weight configurations ................................................................70 Figure 5.6 Load paths on the bridge ..............................................................................................71
Figure 5.7 Load truck on bridge for LP1 .......................................................................................71 Figure 5.8. Transverse distribution, Load Path 1, 2015 and 2017 .................................................72 Figure 5.9 Transverse distribution, Load Path 2, 2015 and 2017 ..................................................73 Figure 5.10 Transverse distribution, Load Path 3, 2015 and 2017 ................................................74 Figure 5.11 Transverse distribution, Load Path 4, 2015 and 2017 ................................................75

ix
LIST OF TABLES
Table 1.1 Typical composition of UHPC ........................................................................................2 Table 1.2 Typical composition of K-UHPC ....................................................................................6
Table 2.1 Mechanical properties of K-UHPC ..................................................................................9 Table 2.2 FHWA-reported properties of UHPC ............................................................................11 Table 3.1 Modified mix design (for 5.5 yd3) of K-UHPC used for construction ..........................15 Table 3.2 Summary of casting and curing details of the field samples in 2015 ............................22 Table 3.3 Compressive strength of samples from four mixes .......................................................23
Table 3.4 Average compressive strength of samples from four mixes ..........................................24 Table 3.5 Summary of the natural frequencies of samples subjected to freezing and
thawing cycles and calculated RDM of elasticity .........................................................27 Table 3.6 Calculation of durability factor (DF) .............................................................................29
Table 3.7 Resistivity of each sample .............................................................................................31 Table 4.1 Material proportions for 3 ft3 batch ...............................................................................33
Table 4.2 Material proportions for 3 ft3 based on modified mix design ........................................35 Table 4.3 Summary of all three trials performed in the laboratory ...............................................39 Table 4.4 Compressive strength at 7 days (11/26/2016)................................................................41
Table 4.5 Compressive strength at 14 days (12/03/2016)..............................................................42 Table 4.6 Compressive strength at 16 days (12/05/2016)..............................................................44
Table 4.7 Compressive strength at 28 days (12/20/2016)..............................................................45


xi
ACKNOWLEDGMENTS
The authors would like to thank the Iowa Department of Transportation (DOT) and Iowa
Highway Research Board (IHRB) for sponsoring this project. The authors would also like to
thank laboratory personnel, Doug Wood, Bob Steffes, and Jeremy McIntyre, for their help.


xiii
EXECUTIVE SUMMARY
Will come from final tech transfer summary.


1
CHAPTER 1: INTRODUCTION
1.1 Overview
Increase in demand for a material that has high compressive strength, superior durability
properties, and good workability has paved the way for development of ultra-high performance
concrete (UHPC). Conventional concrete has cement, coarse aggregates, and fine aggregates as
basic ingredients. The compressive strength of conventional concrete is often in the range 3–5
ksi, and its tensile strength is in the range of 0.3–0.7 ksi (Graybeal 2006).
The strength of concrete depends on the process of hydration of cement, porosity, and density of
the matrix formed. The hydrated cement paste formed is a low-density porous gel. Porosity is
determined by the gel, capillary pores, and voids (formed because of the absence of very fine
particles). Therefore, it has been observed that the low strength of concrete is due to high
porosity and relatively low density of the matrix (Buyukozturk and Lau 2007).
To improve the properties of concrete and increase the strength, porosity should be lowered and
density of the matrix should be increased. In the process to develop higher strength concrete, a
lower water-to-cement ratio in the range of 0.20–0.45 can be used to help with packing of the
particles and to increase the compactness of the matrix formed (Skazlic et al. 2014). Less water
content in the matrix also reduces the capillary pores leading to lower porosity. In addition, the
size of main aggregates used can be reduced to lower the porosity. A fine filler is added to fill up
the voids in the matrix, to strengthen the paste, and to make it fluid and workable.
Typically, chemical and mineral admixtures like superplasticizer, fly ash, and silica fume are
used. Addition of these admixtures improves the workability and durability, besides increasing
the strength of the concrete. These improvements led to the development of high-performance
concrete (HPC) (Buyukozturk and Lau 2007). A minimum compressive strength of 10 ksi (and
higher depending on the mix) and a minimum tensile strength of 0.9 ksi have been achieved for
this class of concrete.
Because of the lower water-to-cement (w/c) ratio and higher compressive strength, HPC is more
brittle than normal concrete. Hence, addition of steel fibers to this complex cement matrix
improves the ductility of the concrete.
Confinement of the concrete mix can also be enhanced with the addition of steel fibers into the
design mix. These improvements to the mix design of HPC led to the development of UHPC. A
minimum compressive strength of 20 ksi is achieved and a higher strength of 30 ksi is reported
for a few proprietary mix designs. In addition to a tensile strength of 1.5 ksi, UHPC displays
superior properties in aspects such as durability, ductility, and ease of constructability.
Several researchers across the globe have proposed different mix designs to achieve the high
compressive strength, enabling the use of this material in construction of different projects.
Recent studies have concluded that construction with UHPC may become economically efficient,

2
especially for large structures, because of optimized design of sections, leading to a decrease in
the dead weight of the structure (Graybeal 2006).
UHPC has also been used as joints between prefabricated members. This approach allows
connecting steel reinforcement to be embedded over shorter lengths, minimizing or eliminating
the complex arrangement of transverse steel.
1.2 Ultra-High Performance Concrete (UHPC)
Composition
A typical UHPC composition includes Portland cement, fine sand, quartz or silica flour, water-
reducing agents (such as superplasticizers), silica fume, fly ash, and steel fibers, as shown in
Table 1.1.
Table 1.1 Typical composition of UHPC
Material Weight (lb/yd3) % by weight
Portland cement 1,200 28.5
Fine sand 1,720 40.8
Silica fume 390 9.3
Ground quartz 355 8.4
HRWR (superplasticizer) 51.8 1.2
Accelerator 50.5 1.2
Steel fibers 263 6.2
Water 184 4.4
HRWR = high-range water reducer
Source: Graybeal (2006)
However, the actual composition of UHPC varies depending on the supplier and its intended use.
Material proportions are established to obtain a highly dense mix with a minimal w/c ratio,
which produces a high compressive strength. The amount of superplasticizer (high-range water
reducer) is derived based on its need to fill the voids of the cement matrix, leading to a lower
water requirement. Apart from mineral admixtures, such as silica fume and fly ash, a variety of
chemical admixtures are also used depending on the use and type of composition needed.
Another critical component of UHPC composition is steel fibers, which are less than 0.787 in.
(20 mm) in length and 0.008 in. (0.2 mm) in diameter. Key material proportions in a typical
UHPC mix can be summarized as follows (Graybeal 2006):
Water-to-cement ratio of 0.22
Steel fibers of 2.5% by volume
Silica fume of 25% by weight of cement
Sand-to-cement ratio of 1.4

3
Because of the compactness of UHPC, it has higher density than HPC. The density of UHPC is
in the range of 144–172 lbs/ft3. To improve the hydration process of cement and further reduce
the porosity of the mix, UHPC is exposed to heat treatment. Temperatures can range from 194°F
to 700°F and exposure duration varies from 48 hours to six days.
An average compressive strength of 28 ksi and tensile strength of 1.3 ksi were reported by Degen
(2006) when six 4 in. by 8 in. cylinders were tested. These cylinders were exposed to steam
curing at 194°F for 48 hours.
Benefits
The unique properties of UHPC offer several advantages, which can be summarized as follows:
Because of the increase in compressive and tensile strengths, smaller sections can be used to
design flexural beams that support large loads. Using smaller sections leads to reduced dead
weight of the structure (Gunes et al. 2012). In addition, the depth of the girders and shear
reinforcement can be reduced.
Due to the compactness of the material, it is impermeable to water and aggressive chemicals,
making it a highly durable material. High durability can lead to longer service life of the
structure and lower maintenance cost over the structure’s lifecycle.
Challenges
Although UHPC displays superior properties and offers several advantages, there are challenges
in using the material for construction purposes, summarized as follows:
Application of UHPC comes with high initial cost due to the use of steel fibers and
admixtures that are relatively expensive.
Steam curing is required to attain design strength. Equipment to maintain the high steam
temperature in the field is expensive and often challenging.
Conventional concrete mixers cannot typically be used, and mixing time is lengthy compared
to that with conventional concrete.
Local availability of materials such as steel fibers, superplasticizer, and other admixtures can
be challenging.
Given that it is a developing material, there are no established testing standards to quantify
the material properties or established design guides to follow for designing structures.
Specialized technical knowledge is required to use this material.
Applications
The high strength and enhanced durability properties exhibited by UHPC opened the door for its
applications in transportation departments as an answer to the challenges faced with the
rehabilitation of existing bridges. More than 20 bridges have been constructed in the US using

4
field-cast UHPC connections. Applications have included field-cast connections for girders,
overlays, and pre-cast elements for bridges. The first UHPC bridge constructed in the US was
constructed in Wapello County, Iowa, during the fall of 2005 (Wipf et al. 2009).
Perry (2015) gave details about some of the bridges constructed using UHPC in the US and their
current conditions. It was indicated that the material properties and proven performance of
UHPC have attracted many contractors and transportation departments throughout the US to use
UHPC for bridge construction.
One such organization is the Iowa Department of Transportation (DOT), which is also in the
process of rehabilitating its old bridges. The Iowa DOT has supported the development of new,
innovative materials for the construction of more durable bridges and collaborated with the
Federal Highway Administration (FHWA) in conducting research on the properties of UHPC
and its applications. After understanding the effective properties of UHPC, the Iowa DOT used it
in the rehabilitation and construction of several bridges in Iowa: the Wapello County UHPC
bridge, the Jakway Park Bridge in Buchanan County, a waffle deck panel system bridge in
Wapello County, and the Mars Hill Bridge south of Ottumwa. Details of two of the bridges
follow.
1.2.4.1 Wapello County UHPC Bridge
This was the first UHPC bridge constructed in the US (Wipf et al. 2009) (see Figure 1.1).
Wipf et al. 2009, BEC
Figure 1.1 Construction of the Wapello County bridge

5
The Iowa DOT and the Bridge Engineering Center (BEC) at Iowa State University worked
together to develop the design of the bridge. Construction was completed in 2005. Lack of
design standards during that time led to the prior laboratory testing of I-shaped UHPC girders,
which helped in the effective design of the bridge.
1.2.4.2 UHPC Pi-Girder Bridge in Buchanan County
The Iowa DOT Office of Bridges and Structures came up with a second-generation pi-shaped
(the Greek symbol for pi, ∏) girder design as an optimized shape to minimize the cost. To
validate the design, laboratory and field testing of a pi-girder was done before the actual bridge
was constructed (Rouse et al. 2011). This bridge, also called the Jakway Park Bridge, is the first
bridge that used precast, prestressed UHPC in the US (see Figure 1.2).
Rouse et al. 2011, BEC
Figure 1.2 Jakway Park Bridge open to traffic (left) and second-generation pi-girder
installation at the site (right)
After construction of the bridge, live load tests were performed immediately and one year after
installation. The live load test results were used to validate the finite element model used for the
design of the bridge (Rouse et al. 2011).
Material Suppliers
For wide application of new and developing materials like UHPC, the materials need to be
available for everyone at a cost that is affordable. Initial development and research of this
product has been done by private organizations, which led to the development of proprietary mix
designs. In recent years, research has been done on material mix proportions by academic
institutions and public organizations. This led to the development of additional proprietary mix
designs and helped to develop competition in the market internationally.
The most common proprietary mix design used in North America is Ductal, developed by
Lafarge. There are multiple material mix proportions of this product available depending on the
6
application. Similarly, research done by the Korea Institute of Civil Engineering and Building
Technology (KICT) led to the development of a proprietary mix design called K-UHPC. This
product has shown high strength with less cost per unit and has found applications
internationally. One of the applications is the Hawkeye Bridge in Buchanan County, Iowa, which
was studied for this project.
1.3 K-UHPC
K-UHPC is a product developed by KICT. As already mentioned in Section 1.2.3, one of the
challenges faced with UHPC is its high initial cost compared to conventional concrete. The main
objective of KICT was to develop a UHPC that is cost effective without any compromise in the
strength.
KICT has been doing investigations since 2007 through many research projects. They developed
K-UHPC, which uses local materials and equipment. The goal of KICT is to use this product to
build highway bridges that have longer life spans with minimal maintenance.
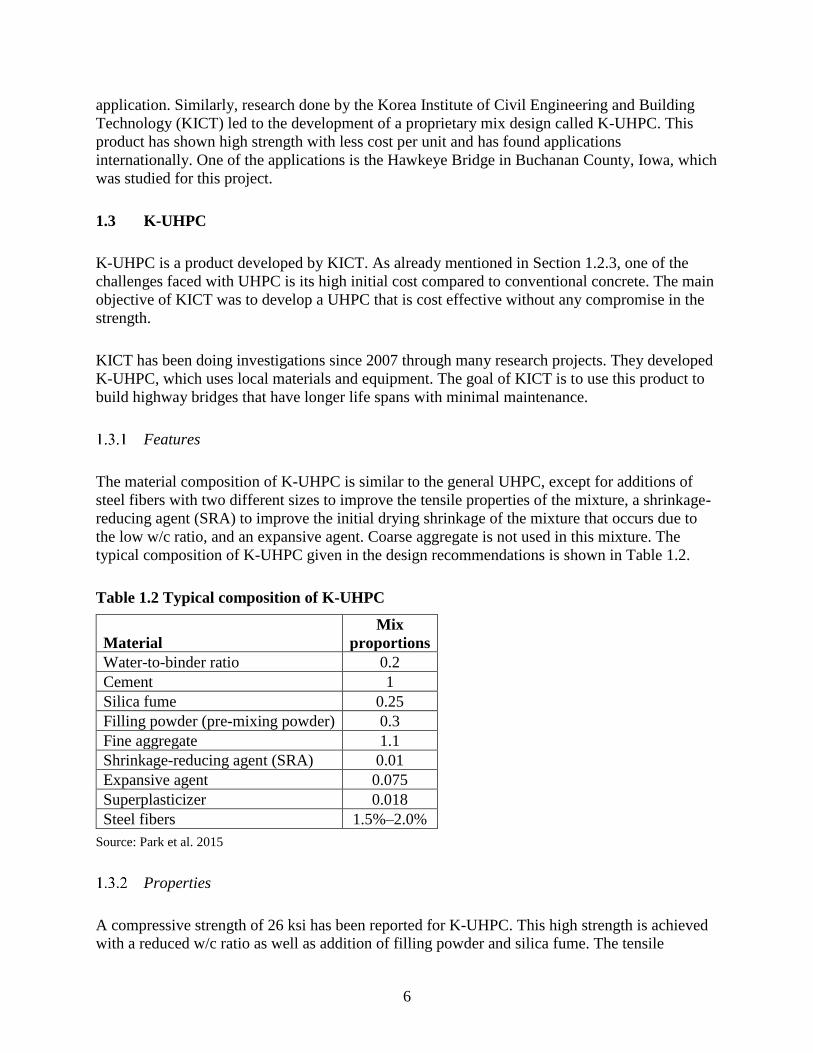
Features
The material composition of K-UHPC is similar to the general UHPC, except for additions of
steel fibers with two different sizes to improve the tensile properties of the mixture, a shrinkage-
reducing agent (SRA) to improve the initial drying shrinkage of the mixture that occurs due to
the low w/c ratio, and an expansive agent. Coarse aggregate is not used in this mixture. The
typical composition of K-UHPC given in the design recommendations is shown in Table 1.2.
Table 1.2 Typical composition of K-UHPC
Material
Mix
proportions
Water-to-binder ratio 0.2
Cement 1
Silica fume 0.25
Filling powder (pre-mixing powder) 0.3
Fine aggregate 1.1
Shrinkage-reducing agent (SRA) 0.01
Expansive agent 0.075
Superplasticizer 0.018
Steel fibers 1.5%–2.0%
Source: Park et al. 2015
Properties
A compressive strength of 26 ksi has been reported for K-UHPC. This high strength is achieved
with a reduced w/c ratio as well as addition of filling powder and silica fume. The tensile

7
strength is 1.8 ksi, which is higher than that of normal concrete (Park et al. 2015). To improve
the tensile and flexural properties, two different sizes of steel fibers are added to the mixture. A
shrinkage reducing agent is also used to control the early-age shrinkage of the mixture. An
adequate flow is achieved by addition of superplasticizer to the mixture.
1.4 Research Scope
The scope of this project was to assess selected properties of K-UHPC independently, under two
different scenarios. The first was based on samples collected in the field (the Hawkeye Bridge
site) where K-UHPC was mixed in regular concrete mixers using locally available materials.
Second, a set of samples was prepared in the laboratory using the same materials. The primary
objective of this research was to evaluate compressive strength, tensile strength, creep and
shrinkage strains, bonding with reinforcement, freeze-thaw durability, and surface resistivity of
these two groups of prepared samples. The evaluated properties are then compared to the
properties reported in the literature for K-UHPC and other UHPCs. A load test was also
performed on the Hawkeye Bridge in Buchanan County to evaluate the in-field performance of
K-UHPC.
1.5 Report Layout
Following the introductory Chapter 1, Chapter 2 presents a summary of literature on the material
properties, field applications of K-UHPC and different standards used to test the properties of K-
UHPC.
Chapter 3 discusses details about the Buchanan County Hawkeye Bridge, construction of the
bridge using K-UHPC, the mix design used, and preparation of field samples.
Chapter 4 reports the results of laboratory testing program, which includes compressive strength,
drying shrinkage, bonding of K-UHPC with reinforcement, and two critical durability property
tests: freeze-thaw and surface resistivity.
Chapter 5 covers the field testing that was conducted on the Hawkeye Bridge in Buchanan
County.
Finally, conclusions drawn from the study and future research are given in Chapter 6.
8
CHAPTER 2: LITERATURE REVIEW OF K-UHPC
2.1 Introduction
Given the purpose of this project was to conduct a laboratory and field evaluation of an
alternative UHPC mix, K-UHPC, and the Hawkeye Bridge that was constructed using K-UHPC
in Buchanan County, this Literature Review chapter focuses on that mix. Consequently, most of
the literature about K-UHPC is from papers presented by the developers of the mix with KICT
and their own materials.
That said, as discussed in Chapter 1, development of a low-cost UHPC, especially for building
large structures like bridges, has been a main goal for KICT. After looking into the shortcomings
of UHPC, such as high initial cost and high shrinkage, KICT has been working to improve the
material properties of K-UHPC, including tensile ductility and shrinkage, and also to reduce the
initial cost. Through various research programs conducted by KICT, they have improved the
mechanical performance of K-UHPC and made it more economically feasible. Their research
programs have also investigated the behavior of the K-UHPC mixture when local materials
(cement, sand, and superplasticizer) are used in the field.
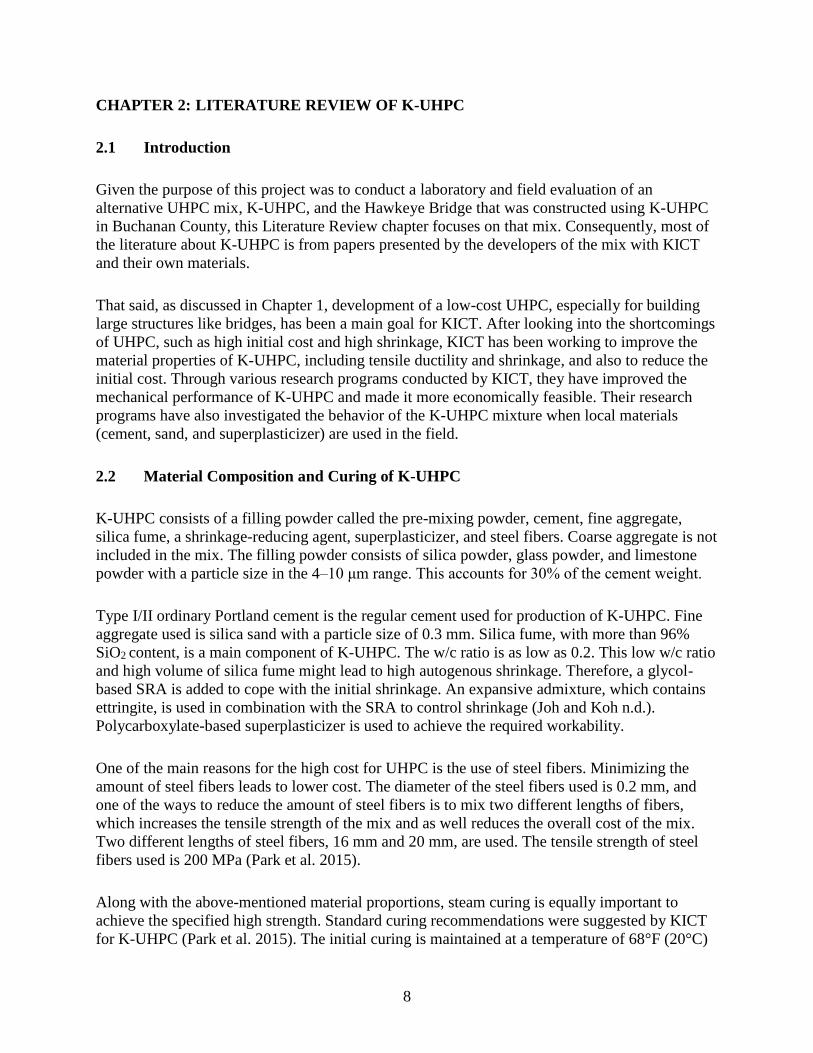
2.2 Material Composition and Curing of K-UHPC
K-UHPC consists of a filling powder called the pre-mixing powder, cement, fine aggregate,
silica fume, a shrinkage-reducing agent, superplasticizer, and steel fibers. Coarse aggregate is not
included in the mix. The filling powder consists of silica powder, glass powder, and limestone
powder with a particle size in the 4–10 μm range. This accounts for 30% of the cement weight.
Type I/II ordinary Portland cement is the regular cement used for production of K-UHPC. Fine
aggregate used is silica sand with a particle size of 0.3 mm. Silica fume, with more than 96%
SiO2 content, is a main component of K-UHPC. The w/c ratio is as low as 0.2. This low w/c ratio
and high volume of silica fume might lead to high autogenous shrinkage. Therefore, a glycol-
based SRA is added to cope with the initial shrinkage. An expansive admixture, which contains
ettringite, is used in combination with the SRA to control shrinkage (Joh and Koh n.d.).
Polycarboxylate-based superplasticizer is used to achieve the required workability.
One of the main reasons for the high cost for UHPC is the use of steel fibers. Minimizing the
amount of steel fibers leads to lower cost. The diameter of the steel fibers used is 0.2 mm, and
one of the ways to reduce the amount of steel fibers is to mix two different lengths of fibers,
which increases the tensile strength of the mix and as well reduces the overall cost of the mix.
Two different lengths of steel fibers, 16 mm and 20 mm, are used. The tensile strength of steel
fibers used is 200 MPa (Park et al. 2015).
Along with the above-mentioned material proportions, steam curing is equally important to
achieve the specified high strength. Standard curing recommendations were suggested by KICT
for K-UHPC (Park et al. 2015). The initial curing is maintained at a temperature of 68°F (20°C)
9
for 24–48 hours after casting (when formwork is still present). After removing formwork,
concrete is exposed to steam curing at a temperature of 194°F (90°C) for 24–72 hours. Testing
proved that these curing temperatures have a significant effect on the strength of K-UHPC.
2.3 Material Properties of K-UHPC
KICT has done extensive research on the material properties of K-UHPC and on how to reduce
the fabrication costs. It started a research program called Super Bridge 200, through which
material and structural element tests were performed. Some of the experiments done by KICT
are listed below (Joh and Koh n.d.).
Testing of compressive, tensile, and flexural strengths
Setting time
Hydration heat
Fracture toughness
Durability properties, such as chloride penetration and carbonation
Punching shear tests
Deck slab mock-up tests
Behavior of in situ joint of K-UHPC deck slab
Model tests of K-UHPC piles
Bond properties with reinforcing steel bars and strands
Shear key tests
Some of the major outcomes of the research performed at KICT are improved compressive
strength, which reached up to 29 ksi, and tensile strength, which reached up to 2.75 ksi. They
were able to limit the total shrinkage to 600 microstrain using an expansive agent and SRA.
Also, they have done research to develop the required mix using locally available materials,
which reduced the overall material costs by 70%. Along with shrinkage, they were able to reduce
creep to a coefficient value of 0.45 (Joh et al. 2015). Some of the mechanical properties of K-
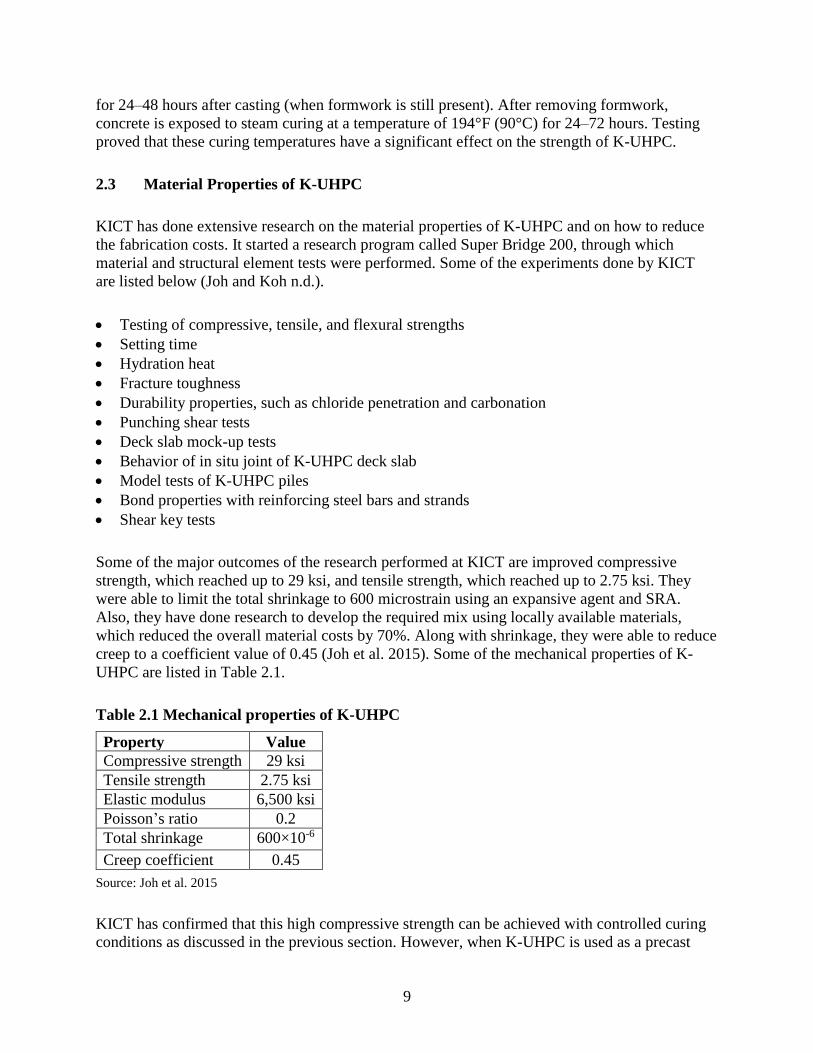
UHPC are listed in Table 2.1.
Table 2.1 Mechanical properties of K-UHPC
Property Value
Compressive strength 29 ksi
Tensile strength 2.75 ksi
Elastic modulus 6,500 ksi
Poisson’s ratio 0.2
Total shrinkage 600×10-6
Creep coefficient 0.45
Source: Joh et al. 2015
KICT has confirmed that this high compressive strength can be achieved with controlled curing
conditions as discussed in the previous section. However, when K-UHPC is used as a precast

10
concrete, it is difficult to maintain the temperature and strictly expose the concrete to steam in
the field. Therefore, research has been done on how to minimize the curing conditions and still
achieve the target strength (Park et al. 2015).
Testing has been done on the effect of delayed curing (time between removing samples from the
molds and keeping them in a curing tank) and the steam curing temperature. After testing, it was
concluded that strength is linearly proportional to the curing temperature and curing period. To
attain the target strength at an early age, the concrete has to be exposed to 90°C for 24 hours
(Park et al. 2015). Also, it was concluded that, with a higher curing temperature, the curing
period can be shortened (Park et al. 2015). Delayed time for curing did not have any considerable
adverse effect on the strength. Therefore, with these new recommendations, it would be easier to
maintain the temperature and curing conditions in the field.
Apart from usage of silica fume as a mineral admixture, another mineral admixture called
Zirconium (Zr silica powder) is used to improve the workability of K-UHPC. Zirconium is used
instead of conventional silica fume powder. Test results show an increase in flowability by 23%
and a decrease of viscosity by 68% without any loss of compressive strength. Addition of this
mineral admixture also affects the amount of superplasticizer. The quantity of superplasticizer
used is reduced by 70% compared to UHPC using silica fume.
Flexural behavior of K-UHPC was tested using a girder reinforced with steel bars and tendons
(Joh et al. 2015). KICT concluded that they could estimate the behavior reasonably well using
the stress-strain relationship. It was also noted that the fiber orientation effect needs to be
considered for the estimation.
Shear behavior was tested using K-UHPC girders without stirrups. The KICT researchers
observed some initial diagonal cracks in the web with an increase in the load, which then
propagated to the top and bottom flanges, along with some loss in the shear strength. However,
KICT did not observe any sudden loss of strength with increase in the load (Joh et al. 2015).
KICT also tested torsional behavior of the girders made with their mix. Their results concluded
there was no loss in strength of girders without any reinforcement (Joh et al. 2015).
KICT also performed tests to check if K-UHPC would need any reinforcement. The researchers
concluded that K-UHPC has enough tensile strength that it would not need any extra
reinforcement (Joh et al. 2015). However, passive reinforcement is required to optimize the
design because of the difference between the compressive strength and tensile strength.
2.4 Properties of UHPC
To evaluate possible use of UHPC for bridge construction, the FHWA has done extensive
research on material properties, long-term stability, and durability of UHPC (Graybeal 2006).
Their work categorized samples into four groups based on curing conditions: steam curing, no

11
steam curing, tempered steam, and delayed steam. Results of compressive strength, shrinkage,
and long-term creep and durability tests for all groups are shown in Table 2.2.
Table 2.2 FHWA-reported properties of UHPC
Curing
conditions
Compressive
strength
Shrinkage
(microstrain)
Creep
(coefficient)
Freeze-thaw
(relative
dynamic
modulus of
elasticity,
%)
Surface resistivity
(indicator of
resistance to
chloride
permeability,
kΩ-cm)
Steam
treated
28 ksi 766 0.29 94 High resistance or
negligible chloride
permeability
Untreated 18.3 ksi 555 0.78 112.5 Very low
permeability
Tempered
steam
24.8 ksi 620 0.66 102 High resistance or
negligible chloride
permeability
Delayed
steam
24.8 ksi 657 0.31 98 High resistance or
negligible chloride
permeability
Source: Graybeal 2006
Strength and durability properties of K-UHPC samples were quantified and compared with other
UHPC mixes as part of this project. These properties were tested according to the standard test
procedures from ASTM. Details of the different standards used for the tests performed are
included here in the literature review given they apply for both Chapter 3 and Chapter 4.
Compressive Strength: The standard testing method for measuring compressive strength of
concrete is given in ASTM C39. 4 in. x 8 in. cylinders are used as test samples. The load is
applied at the rate of 0.25 ± 0.05 MPa/s. It is applied until the indicator shows a steady,
decreasing load. The compressive strength of the sample is calculated by dividing the maximum
load resisted by the sample’s cross-sectional area.
Shrinkage (Beam Shrinkage): The standard testing method to measure the shrinkage of
concrete specimens is given in ASTM C490. Rectangular beams 3 in. x 3 in. x 11.25 in. are used
as test samples. Two gauge studs are installed between the ends of the beam during casting. The
distance between these two studs is 10 in. (which is the gauge length). Shrinkage is quantified by
measuring the change in length between these two gauge studs. A length comparator is used to
measure the change in length. There is a reference bar in the instrument, which accounts for
corrections in the readings, if any. Therefore, while using the length comparator, a reference
reading is taken with the reference bar initially and, then, readings are recorded for the beam
samples. Change in length is estimated based on the formula specified in the standard. Also,
weight of the samples is recorded at regular intervals.
12
Rapid Freeze-Thaw (F-T) Test: The standard testing method to measure resistance of concrete
specimens to rapid freezing and thawing is given in ASTM C666. Rectangular beams 3 in. x 3 in.
x 11.25 in. are used as test samples. The freezing and thawing apparatus consists of a chamber
where samples are subjected to a number of cycles of rapid freezing and thawing. One freezing
and thawing cycle consists of lowering the temperature from 40°F to 0°F (freezing) and then
increasing it from 0°F to 40°F (thawing). The fundamental natural frequency of samples is
measured after every 30 cycles. Damage is quantified by calculating the relative dynamic
modulus (RDM) of elasticity. RDM is defined as the ratio of the square of the natural frequency
of the sample after n number of cycles to the square of the natural frequency of the sample
measured initially. According to the standard, samples are tested for a total of 300 cycles or until
the RDM of elasticity is 60% of its initial value, whichever comes first.
Surface Resistivity (SR) Test: The standard testing method to measure resistance of concrete
samples to electrical conductivity (which is proportional to rapid chloride ion penetration) is
given in ASTM WK37880. Resistivity of the concrete surface is calculated based on the voltage
measured, distance between the probes used to measure the voltage, and a geometry factor that is
based on the shape of the sample. A Wenner four-electrode device is used to measure the voltage
on the concrete surface. 4 in. x 8 in. cylinders are used as test samples. With the electrical
resistivity calculated based on this standard, permeability of chloride into concrete specimens is
quantified based on the range of values given in the standard.
Creep Test: The standard testing method to measure creep strain for concrete is given in ASTM
C512. The concrete samples are stacked one over the other in a creep frame and the frame is
loaded using hydraulic jacks. Springs are used to maintain the load in the frame over a period of
time. The load applied should not be greater than 40% of the compressive strength at the age of
loading. 3 in. x 6 in. cylinders are used as test samples. Demec discs are installed on the surface
of the cylinders before loading the frame. These are used to measure strain using the Demec
gauge.
Bonding of K-UHPC and Reinforcement: For the purpose of assessing the bond of K-UHPC
and reinforcement, two tests were developed including a modified pullout test and a four-point
bending test. Details of these tests with their configurations are provided in Chapter 4.

13
CHAPTER 3: FIELD APPLICATION OF K-UHPC AND TEST SAMPLES
As part of this project and in collaboration with the Iowa DOT and the Buchanan County
Secondary Roads Department, KICT helped construct a bridge in Buchanan County, the
Hawkeye Bridge, as a replacement to an old timber bridge. This was the first application of K-
UHPC in the US. Further details of the design, construction, and key features of the bridge are
discussed in this chapter.
3.1 Design and Construction of Hawkeye Bridge
The Hawkeye Bridge is located on Deacon Avenue just southeast of Fairbank, which is in
Buchanan County. The bridge length is 52 ft and its width is 32.5 ft with a 30 ft roadway. The pi-
girder design for the cross section of the bridge (see Figure 3.1) has proven to be both
economical and efficient.
Keierleber et al. 2015
Figure 3.1 Hawkeye Bridge pi-girder design
To simplify the construction, the length of the bridge was divided into six pi-girders, each 4 ft 4
in. long, 5 ft 3 in. wide, and 2 ft 4 in. deep (see previous Figure 3.1 for additional details). The
six girders were separately cast and assembled in the field later. Transverse beams were

14
constructed for every 12 ft 9 in. across the bridge for effective distribution of the load. Post
tensioning of the girders was done using 14 0.6 in. diameter strands at the bottom of longitudinal
beams and three 0.6 in. diameter strands in each of the five transverse crossbeams (Kim 2016).
All of the girders were cast and cured in the yard of the Buchanan County Secondary Roads
Department (see Figure 3.2) in Independence, which is about 20 miles from the bridge site.
Keierleber et al. 2015
Figure 3.2 Pouring (left) and steam-curing (right) the Hawkeye Bridge beams
Mix Design
The mix design, as suggested by KICT, was modified and then used for construction.
Investigations on the flexibility of the initially proposed mix design and the material proportions
while using the locally available materials led to the laboratory testing of the material properties
(strength and durability) at the University of Iowa. After analyzing the laboratory results, some
changes were proposed including an increase in the amount of superplasticizer, i.e., to use 1.5
times the proposed quantity, use wet sand with 4.5% moisture content to improve the workability
of the mix, and add extra water depending on the mix, if necessary. Again, laboratory testing of
the modified design was done to ensure that efficient and satisfactory results were obtained (Lee
et al. 2014).
The modified mix design was used for the construction of the bridge. As per the calculations for
the batch quantity required for construction of each girder, county engineers came up with a
batch of 11 yd3. To maintain the quality of the mix, it was divided into two batches of 5.5 yd3
and mixed in two different concrete mixers. Mix design for 5.5 yd3 and mixing instructions were
as shown in Table 3.1.

15
Table 3.1 Modified mix design (for 5.5 yd3) of K-UHPC used for construction
Order SC180 KICT MIX
Total
(lb/5.5
yd3)
Location Mixing Instructions
1 Pre-mixing binder 4,386 County
2 Cement 7,310 Ready Mix
Plant Mix for 10 min
3 Dry Sand 8,041 Ready Mix
Plant Mix for 5 min
4 Water 1,710 Ready Mix
Plant
Rotate at 10 rpm and move to
county shop
5 SRA 73 County After adding all liquid additives,
mix for 5 min at 10 rpm; then,
mix for 5 min at maximum speed
6 Defoamer 5 County
7 Superplasticizer 140 County
8 Steel fiber (0.63 in. long) 362 County Add for 7 min at 10 RPM
9 Steel fiber (0.78 in. long) 723 County Add for 13 min at 10 rpm; then,
mix for 2 min at maximum speed
Source: Keierleber et al. 2015
Materials
Table 3.1 provides information on the materials used and their required proportions. Of all the
materials, pre-mixing powder, SRA, defoamer, superplasticizer, and steel fibers were shipped
from Korea; Type 1 Portland cement and wet sand were brought from a local store in Iowa.
Based on the recommendations made from the laboratory test results (as mentioned in Section
3.1.1), wet sand with moisture content of 4.5% was used. Fresh water available at the facility
was used.
Mixing Process
While mixing in the field, maintaining the quality of UHPC is an important job. An advantage of
K-UHPC is that it can be mixed in a conventional concrete mixer. The steps followed for mixing
were similar to those proposed by KICT, which are listed below for laboratory sample
preparation (Lee et al. 2014):
1. Weigh all constituent materials.
2. Place the pre-mixing powder, sand, and cement in the pan-type mixing bowl and mix for 4
minutes at 30 rpm.
3. Add water, superplasticizer, and defoamer to the mixing bowl slowly over the course of 2
minutes at 30 rpm.
16
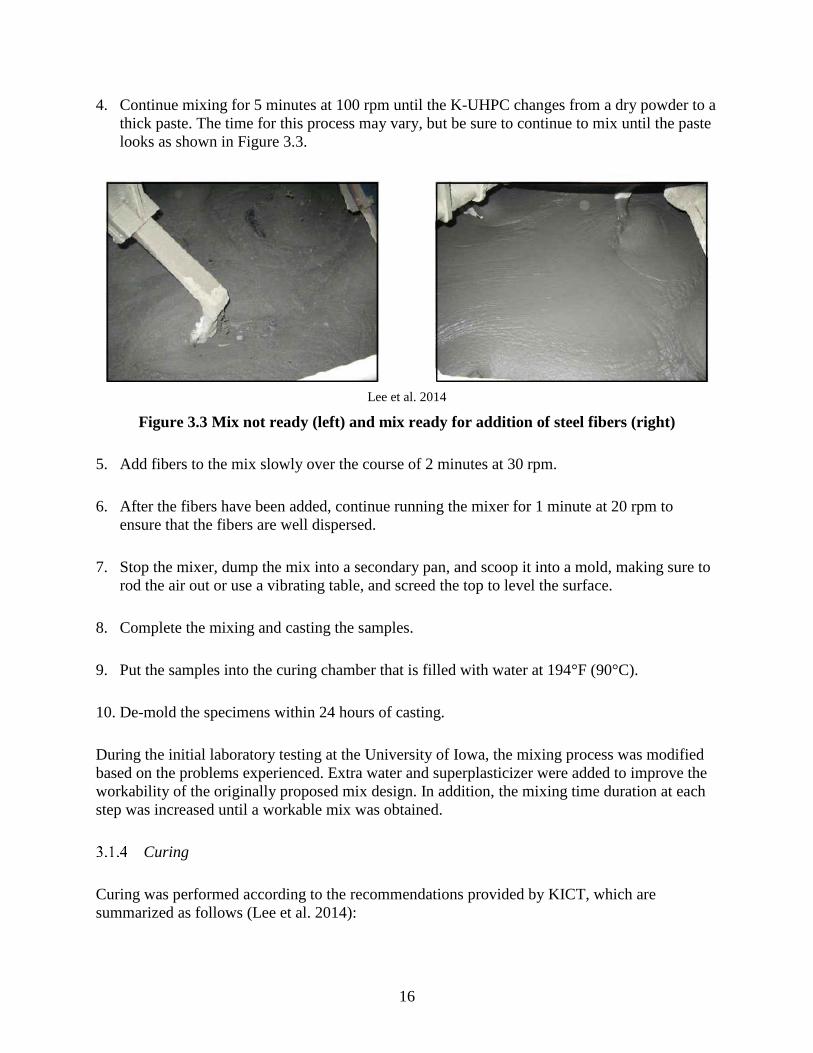
4. Continue mixing for 5 minutes at 100 rpm until the K-UHPC changes from a dry powder to a
thick paste. The time for this process may vary, but be sure to continue to mix until the paste
looks as shown in Figure 3.3.
Lee et al. 2014
Figure 3.3 Mix not ready (left) and mix ready for addition of steel fibers (right)
5. Add fibers to the mix slowly over the course of 2 minutes at 30 rpm.
6. After the fibers have been added, continue running the mixer for 1 minute at 20 rpm to
ensure that the fibers are well dispersed.
7. Stop the mixer, dump the mix into a secondary pan, and scoop it into a mold, making sure to
rod the air out or use a vibrating table, and screed the top to level the surface.
8. Complete the mixing and casting the samples.
9. Put the samples into the curing chamber that is filled with water at 194°F (90°C).
10. De-mold the specimens within 24 hours of casting.
During the initial laboratory testing at the University of Iowa, the mixing process was modified
based on the problems experienced. Extra water and superplasticizer were added to improve the
workability of the originally proposed mix design. In addition, the mixing time duration at each
step was increased until a workable mix was obtained.
Curing
Curing was performed according to the recommendations provided by KICT, which are
summarized as follows (Lee et al. 2014):
17
1. Finish the surface of K-UHPC with curing agents to prevent drying of the surface.
2. The early curing of K-UHPC shall proceed prior to stripping the specimens from the forms
through wet curing during 1 to 2 days after placing the mixtures in the forms. The concrete
surface of the specimen should be covered with an extra cover made of non-woven fabric.
The wet condition should be maintained by spraying water around the specimen.
3. After early curing and specimen removal from the forms, standard high-temperature curing
of K-UHPC shall be done at 180°F (82°C) for 3 to 4 days. The temperature increase rate
should be 27°F/hour (15°C/hour) until it reaches a maximum temperature of 180°F (82°C).
Keep the moisture inside the curing chamber.
4. After high-temperature curing, turn off the device to cool down the concrete.
5. Continue wet curing at ambient temperature for 28 days.
3.2 Casting and Curing the Girders
As discussed in Section 3.1, the total length of the bridge was divided into six girders, which
were cast separately and assembled in the field later. All six girders were constructed one after
the other following the mix design and mixing process discussed in Sections 3.1.1 and 3.1.2.
They were cured following the instructions described in Section 3.1.3 in the yard of Buchanan
County Secondary Roads Department.
As discussed in the Section 3.1.1, two concrete mixers were used to mix a batch of 11 yd3 to
obtain a workable mix and maintain the quality of the mix.
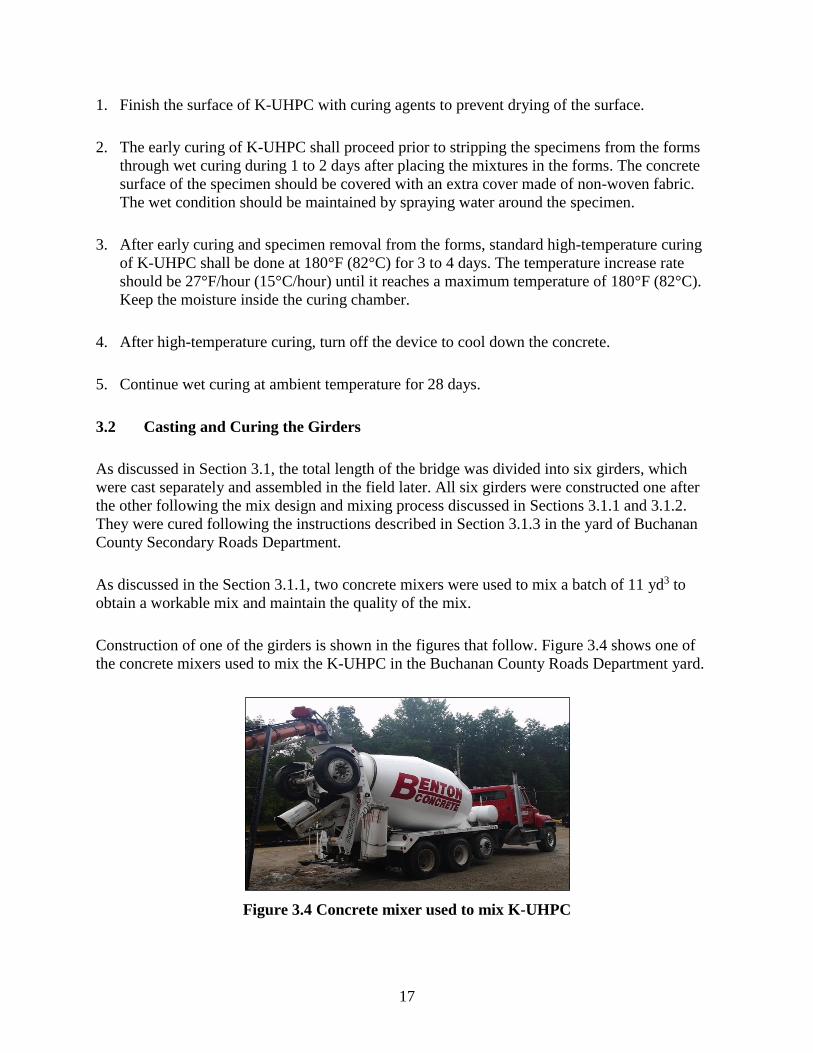
Construction of one of the girders is shown in the figures that follow. Figure 3.4 shows one of
the concrete mixers used to mix the K-UHPC in the Buchanan County Roads Department yard.
Figure 3.4 Concrete mixer used to mix K-UHPC
18
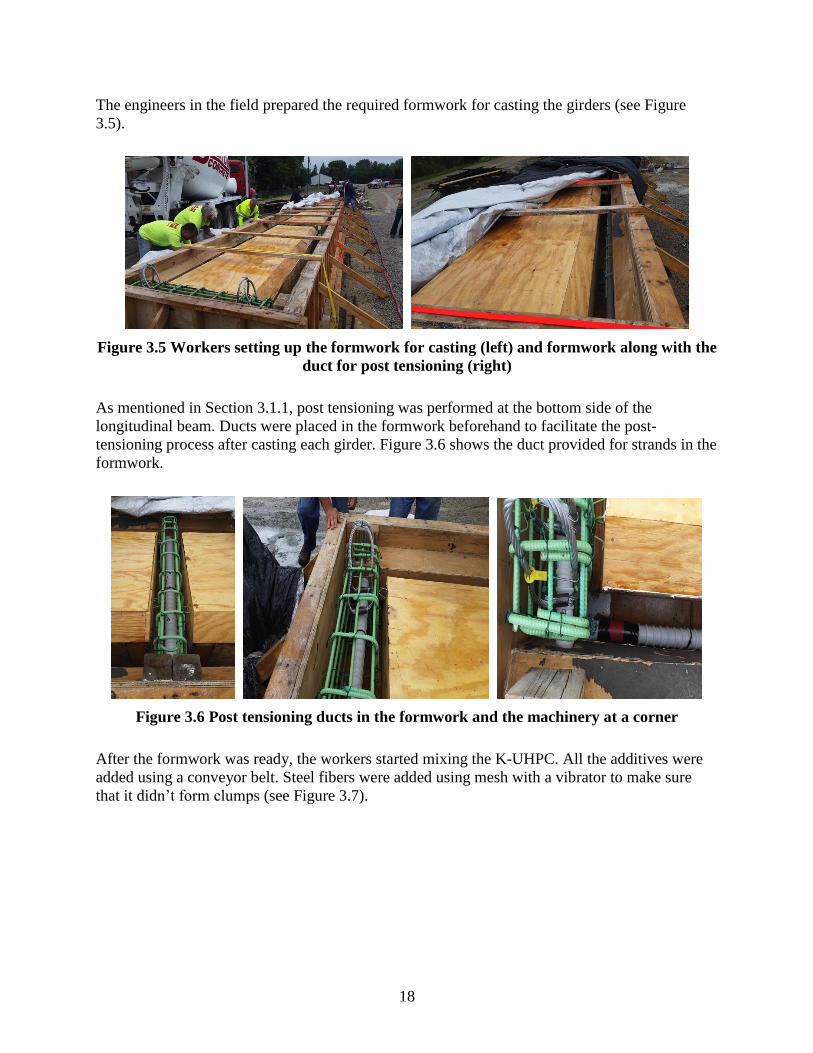
The engineers in the field prepared the required formwork for casting the girders (see Figure
3.5).
Figure 3.5 Workers setting up the formwork for casting (left) and formwork along with the
duct for post tensioning (right)
As mentioned in Section 3.1.1, post tensioning was performed at the bottom side of the
longitudinal beam. Ducts were placed in the formwork beforehand to facilitate the post-
tensioning process after casting each girder. Figure 3.6 shows the duct provided for strands in the
formwork.
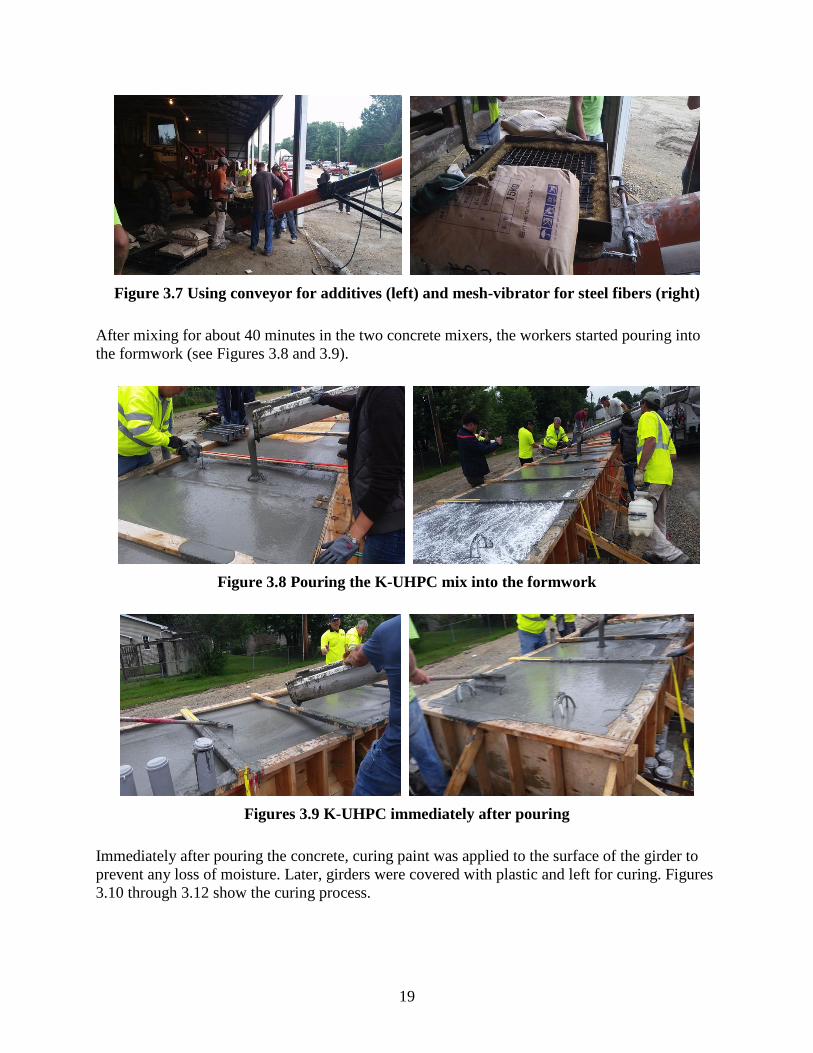
Figure 3.6 Post tensioning ducts in the formwork and the machinery at a corner
After the formwork was ready, the workers started mixing the K-UHPC. All the additives were
added using a conveyor belt. Steel fibers were added using mesh with a vibrator to make sure
that it didn’t form clumps (see Figure 3.7).
19
Figure 3.7 Using conveyor for additives (left) and mesh-vibrator for steel fibers (right)
After mixing for about 40 minutes in the two concrete mixers, the workers started pouring into
the formwork (see Figures 3.8 and 3.9).
Figure 3.8 Pouring the K-UHPC mix into the formwork
Figures 3.9 K-UHPC immediately after pouring
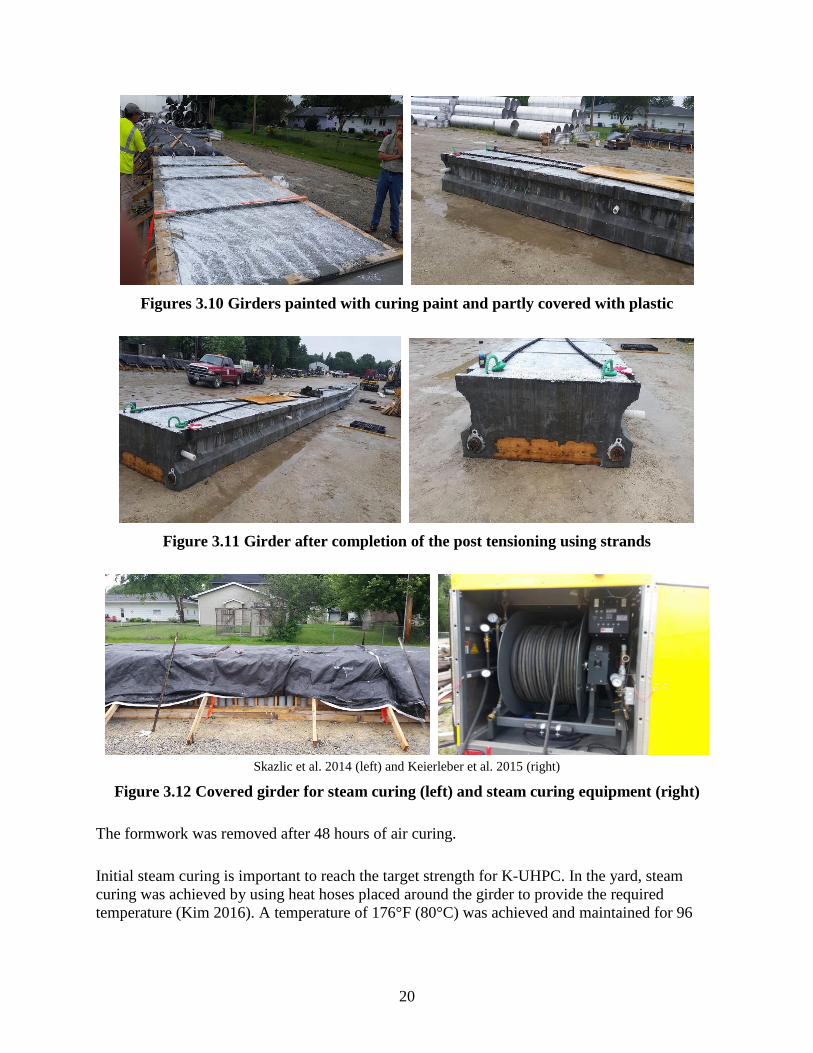
Immediately after pouring the concrete, curing paint was applied to the surface of the girder to
prevent any loss of moisture. Later, girders were covered with plastic and left for curing. Figures
3.10 through 3.12 show the curing process.
20
Figures 3.10 Girders painted with curing paint and partly covered with plastic
Figure 3.11 Girder after completion of the post tensioning using strands
Skazlic et al. 2014 (left) and Keierleber et al. 2015 (right)
Figure 3.12 Covered girder for steam curing (left) and steam curing equipment (right)
The formwork was removed after 48 hours of air curing.
Initial steam curing is important to reach the target strength for K-UHPC. In the yard, steam
curing was achieved by using heat hoses placed around the girder to provide the required
temperature (Kim 2016). A temperature of 176°F (80°C) was achieved and maintained for 96
21
hours. As the target temperature of 194°F (90°C) was not reached, the girders were cured for
longer than KICT’s proposed time.
While the third and sixth girders were cast, some field samples were collected to perform
strength testing in the laboratory to ensure that the desired strength was achieved and to learn
more about the material properties of the samples exposed to field conditions.
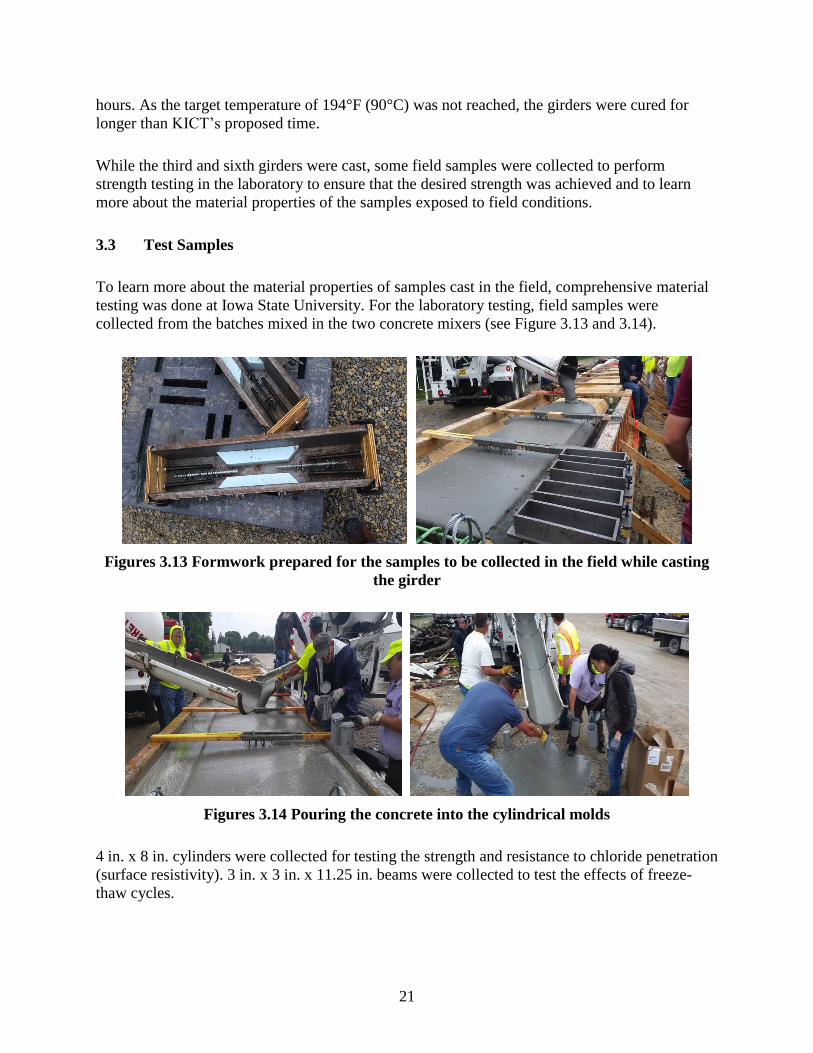
3.3 Test Samples
To learn more about the material properties of samples cast in the field, comprehensive material
testing was done at Iowa State University. For the laboratory testing, field samples were
collected from the batches mixed in the two concrete mixers (see Figure 3.13 and 3.14).
Figures 3.13 Formwork prepared for the samples to be collected in the field while casting
the girder
Figures 3.14 Pouring the concrete into the cylindrical molds
4 in. x 8 in. cylinders were collected for testing the strength and resistance to chloride penetration
(surface resistivity). 3 in. x 3 in. x 11.25 in. beams were collected to test the effects of freeze-
thaw cycles.

22
The samples were cured at the Buchanan County Secondary Roads Department facilities along
with their respective girders. Samples were exposed to the same conditions as the girders to help
in understanding the effects of field conditions on strength and durability. Field sample testing
was also designed to make sure the desired strength was achieved and to help with quality
control. After curing, the samples were taken to the Iowa State University Portland Cement
Concrete (PCC) Pavement and Materials Research Laboratory for testing.
Figures 3.15 Samples after removal from molds and after curing
The list of samples collected from the bridge site and details about curing are shown in Table
3.2.
Table 3.2 Summary of casting and curing details of the field samples in 2015
Mix
Date cast
(2015)
Curing start
(2015)
Curing completed
(2015)
Method and
location
1 July 16 July 20 July 21 Steam
County facilities
2 July 16 July 20 July 21 Steam
County facilities
3 August 4 August 6 August 7 Steam
County facilities
4 September 2 September 8 September 10 Water
Iowa State PCC Lab
3.4 Laboratory Test Results and Discussion
Strength and durability tests were performed on the field samples. The test procedure and results
for each test are discussed in the following sections.
Compressive Strength Test
TEST SAMPLES: According to ASTM C39, the standard size of testing samples for
compressive strength is 4 in. x 8 in. cylinders. Therefore, 4 in. x 8 in. cylinders were cast in the

23
field. Field samples were collected from four different mixes (from three different dates) in the
yard (as shown listed in Table 3.2). These samples were cured with their respective beams at the
facility in Buchanan County.
TEST PROCEDURE: Compressive strength testing was done according to ASTM C39 with the
loading rate as described in Section 2.6.
RESULTS: Compressive strength results for samples from all mixes are listed in Table 3.3.
Table 3.3 Compressive strength of samples from four mixes
Mix
No. of
days
Compressive
strength, psi
1
15 15,402
36 17,664
50 18,687
66 18,914
2 15 18,283
3
14 17,918
28 18,914
62 23,658
4 9 19,717
24 16,699
Wood was used to cap all of the cylinders. The strength test was performed using a plywood
sheet on top and bottom of the cylindrical specimens. Strength was recorded after 14, 28, 50, and
62 days of casting. Because of the unavailability of many samples from Mix 2 and Mix 4, only
one or two ages were considered for testing.
Figure 3.16 shows the compressive strength of these four mixes over their curing periods.
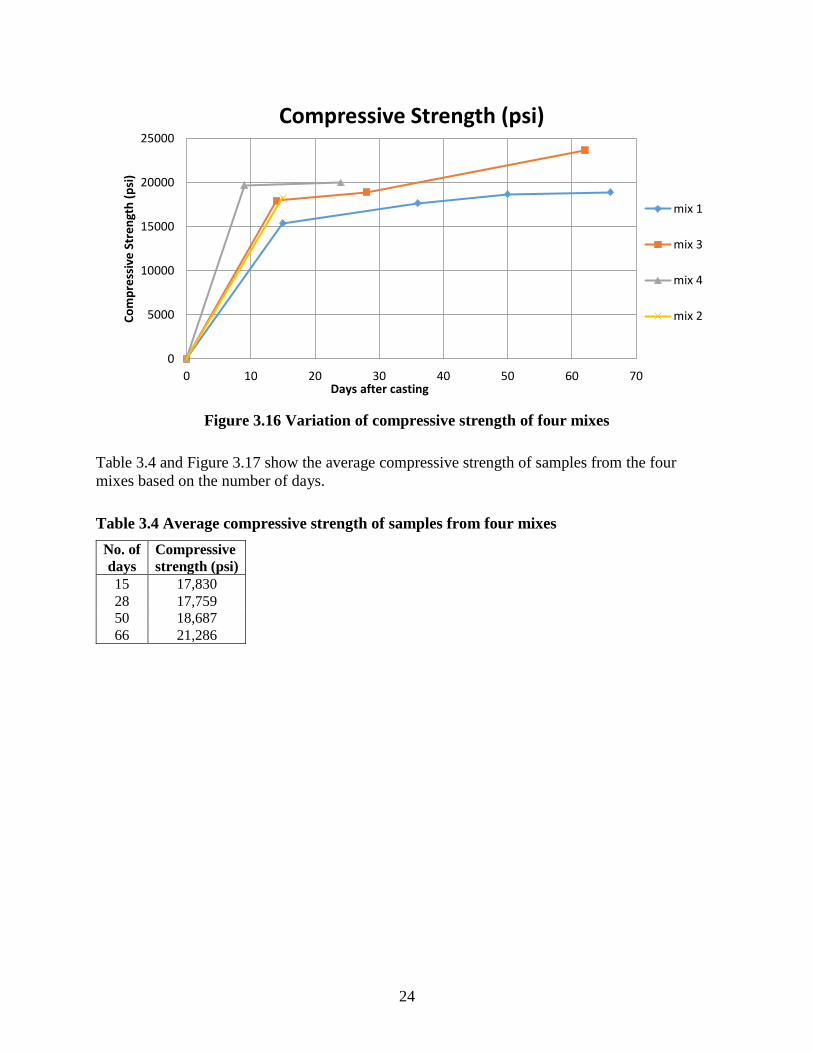
24
Figure 3.16 Variation of compressive strength of four mixes
Table 3.4 and Figure 3.17 show the average compressive strength of samples from the four
mixes based on the number of days.
Table 3.4 Average compressive strength of samples from four mixes
No. of
days
Compressive
strength (psi)
15 17,830
28 17,759
50 18,687
66 21,286
0
5000
10000
15000
20000
25000
0 10 20 30 40 50 60 70
Co
mp
ress
ive
Str
en
gth
(p
si)
Days after casting
Compressive Strength (psi)
mix 1
mix 3
mix 4
mix 2

25
Figure 3.17 Average compressive strength over time
An average compressive strength of 17.83 ksi was achieved at 14 days. The graph shows a
gradual increase in strength after 14 days and up to 66 days. The average strength value from the
initial tests done at the University of Iowa was reported as 17.82 ksi at 14 days when sulphur
capping was used (Lee et al. 2014), which was a different type of capping than that used for
strength testing specimens (which used wood). A higher value was recorded in the testing at the
University of Iowa when neoprene capping was used, and a lower value was recorded when
sulphur capping was used. Therefore, the strength recorded using sulphur capping was taken as a
reasonable value for reference. The reported average strength of 17.83 ksi is less than the value
reported by KICT (26 ksi) (Park et al. 2015).
The reason for a lower value may be due to different conditions used for field curing. The target
steam-curing temperature of 194°F (90°C) was not achieved in the yard at the Buchanan County
facilities. Even though the girder and samples were exposed to steam curing of 176°F (80°C) for
four days (Section 3.1.4), which is more than recommended, it might have affected the early-age
strength of the concrete (14 days).
CONCLUSIONS:
Average strength of 17.8 ksi was achieved after 28 days and there was a consistent increase
in the compressive strength value when tested after 28 days; i.e., at 50 days and 66 days.
Curing conditions can be further explored to make sure that the desired strength can be
achieved.
0
5000
10000
15000
20000
25000
0 10 20 30 40 50 60 70
Co
mp
ress
ive
str
en
gth
(p
si)
Days after casting
Average Compressive Strength (psi)
26
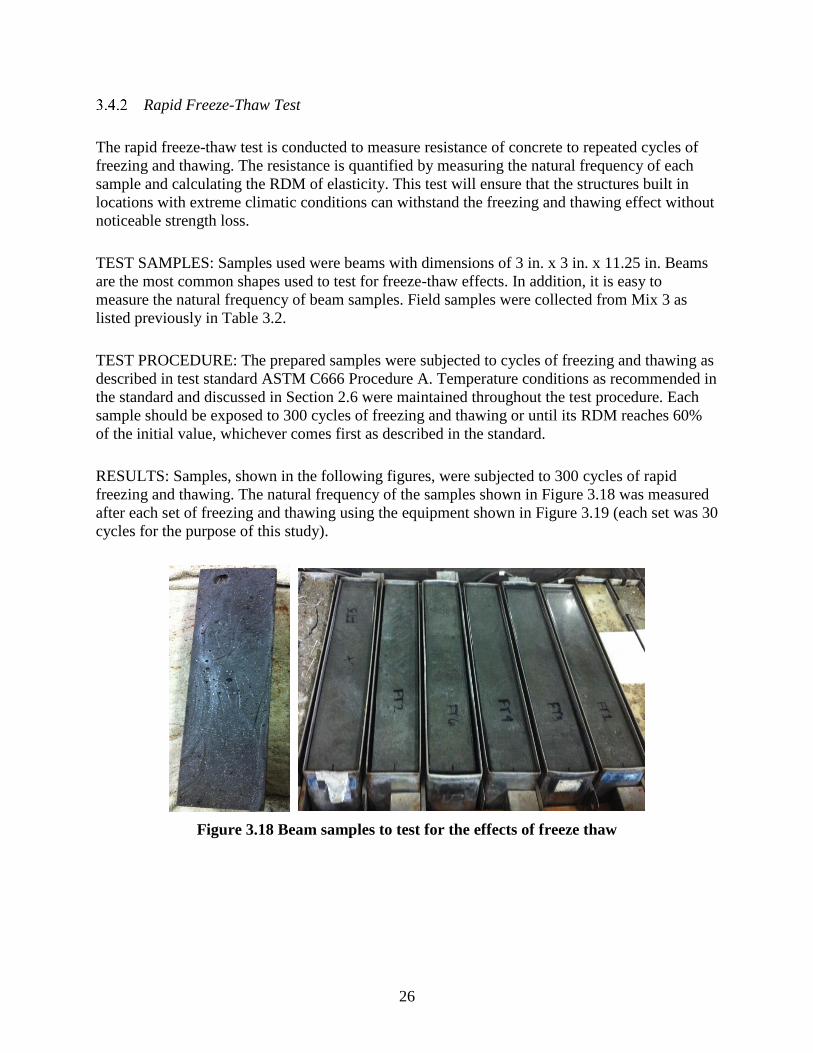
Rapid Freeze-Thaw Test
The rapid freeze-thaw test is conducted to measure resistance of concrete to repeated cycles of
freezing and thawing. The resistance is quantified by measuring the natural frequency of each
sample and calculating the RDM of elasticity. This test will ensure that the structures built in
locations with extreme climatic conditions can withstand the freezing and thawing effect without
noticeable strength loss.
TEST SAMPLES: Samples used were beams with dimensions of 3 in. x 3 in. x 11.25 in. Beams
are the most common shapes used to test for freeze-thaw effects. In addition, it is easy to
measure the natural frequency of beam samples. Field samples were collected from Mix 3 as
listed previously in Table 3.2.
TEST PROCEDURE: The prepared samples were subjected to cycles of freezing and thawing as
described in test standard ASTM C666 Procedure A. Temperature conditions as recommended in
the standard and discussed in Section 2.6 were maintained throughout the test procedure. Each
sample should be exposed to 300 cycles of freezing and thawing or until its RDM reaches 60%
of the initial value, whichever comes first as described in the standard.
RESULTS: Samples, shown in the following figures, were subjected to 300 cycles of rapid
freezing and thawing. The natural frequency of the samples shown in Figure 3.18 was measured
after each set of freezing and thawing using the equipment shown in Figure 3.19 (each set was 30
cycles for the purpose of this study).
Figure 3.18 Beam samples to test for the effects of freeze thaw

27
Figure 3.19 Recording the natural frequency of the sample (left) and samples in the freeze-
thaw equipment (right)
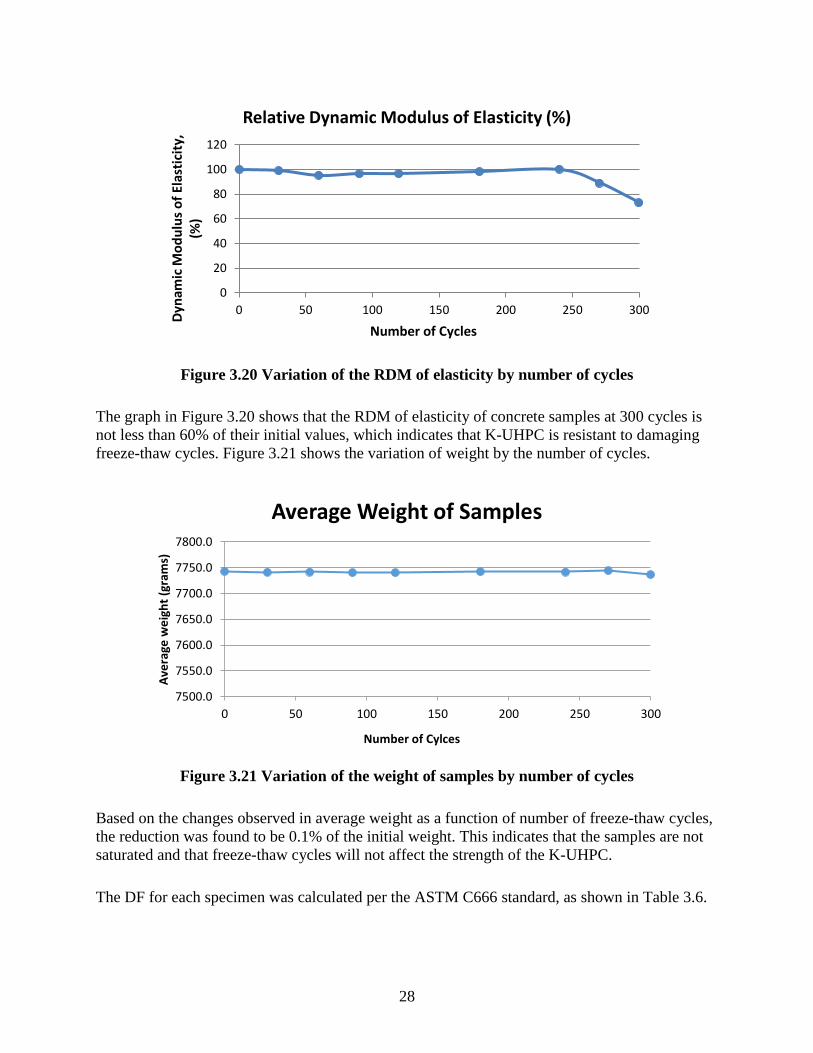
RDM of elasticity (Pc) was calculated based on the standard. Weight of each sample was also
measured to check for the amount of saturation. The durability factor (DF) was calculated for
each sample after 300 cycles.
Table 3.5 and Figure 3.20 provide information on the measured natural frequencies of all
samples and calculated RDM of elasticity. Recorded weight of all the samples is also listed in the
table.
Table 3.5 Summary of the natural frequencies of samples subjected to freezing and thawing
cycles and calculated RDM of elasticity
Date
(2015) Days Cycles
Initial
Frequency
(n)
Measured
Frequency
(n1)
Pc
(%)
Weight
(grams)
Sept. 3 0 0 51.57 51.57 100 7743.1
Sept. 8 5 30 51.57 51.33 99 7741.7
Sept. 15 12 60 51.57 50.36 95 7741.9
Sept. 21 18 90 51.57 50.65 96 7740.8
Sept. 24 21 120 51.57 50.67 97 7740.8
Oct. 6 33 180 51.57 51.12 98 7742.6
Oct. 21 48 240 51.57 51.64 100 7742.0
Dec. 22 110 270 51.57 48.68 89 7744.5
Jan. 21 140 300 51.57 44.19 73 7737.0
n = fundamental frequency at 0 cycles
n1 = fundamental frequency at N cycles
Pc (%) = relative dynamic modulus of elasticity at N cycles, %
28
Figure 3.20 Variation of the RDM of elasticity by number of cycles
The graph in Figure 3.20 shows that the RDM of elasticity of concrete samples at 300 cycles is
not less than 60% of their initial values, which indicates that K-UHPC is resistant to damaging
freeze-thaw cycles. Figure 3.21 shows the variation of weight by the number of cycles.
Figure 3.21 Variation of the weight of samples by number of cycles
Based on the changes observed in average weight as a function of number of freeze-thaw cycles,
the reduction was found to be 0.1% of the initial weight. This indicates that the samples are not
saturated and that freeze-thaw cycles will not affect the strength of the K-UHPC.
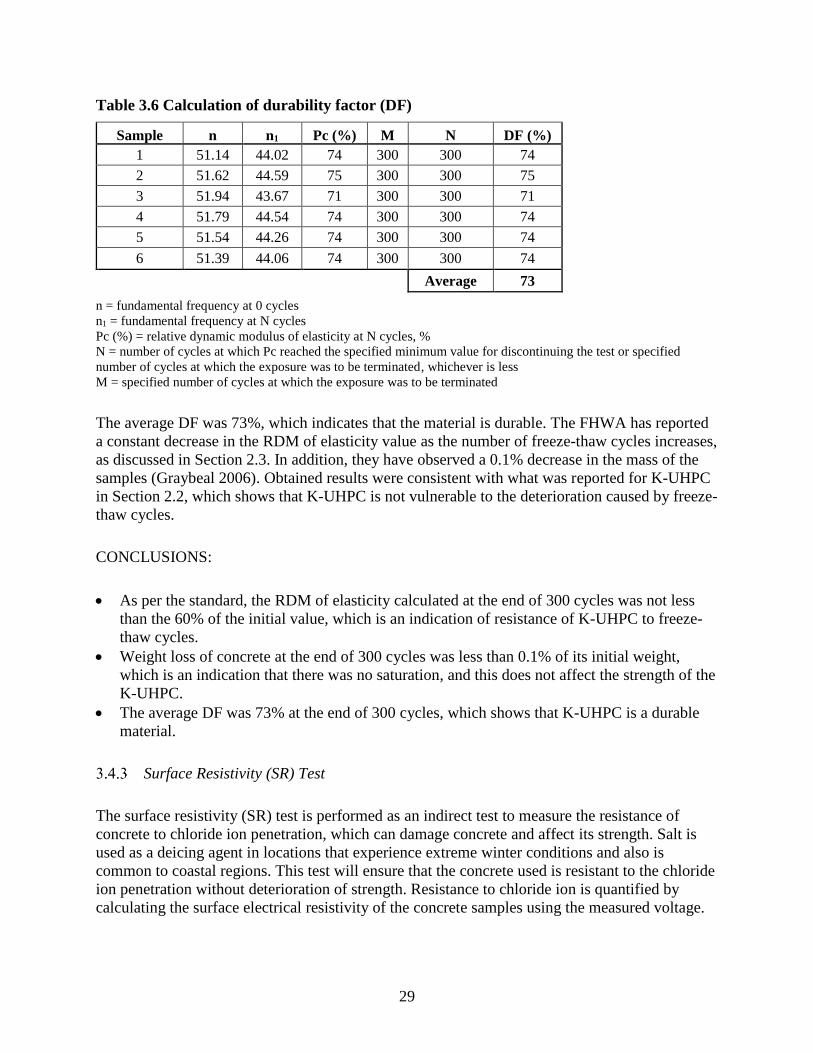
The DF for each specimen was calculated per the ASTM C666 standard, as shown in Table 3.6.
0
20
40
60
80
100
120
0 50 100 150 200 250 300
Dyn
amic
Mo
du
lus
of
Elas
tici
ty,
(%)
Number of Cycles
Relative Dynamic Modulus of Elasticity (%)
7500.0
7550.0
7600.0
7650.0
7700.0
7750.0
7800.0
0 50 100 150 200 250 300
Ave
rage
we
igh
t (g
ram
s)
Number of Cylces
Average Weight of Samples
29
Table 3.6 Calculation of durability factor (DF)
Sample n n1 Pc (%) M N DF (%)
1 51.14 44.02 74 300 300 74
2 51.62 44.59 75 300 300 75
3 51.94 43.67 71 300 300 71
4 51.79 44.54 74 300 300 74
5 51.54 44.26 74 300 300 74
6 51.39 44.06 74 300 300 74
Average 73
n = fundamental frequency at 0 cycles
n1 = fundamental frequency at N cycles
Pc (%) = relative dynamic modulus of elasticity at N cycles, %
N = number of cycles at which Pc reached the specified minimum value for discontinuing the test or specified
number of cycles at which the exposure was to be terminated, whichever is less
M = specified number of cycles at which the exposure was to be terminated
The average DF was 73%, which indicates that the material is durable. The FHWA has reported
a constant decrease in the RDM of elasticity value as the number of freeze-thaw cycles increases,
as discussed in Section 2.3. In addition, they have observed a 0.1% decrease in the mass of the
samples (Graybeal 2006). Obtained results were consistent with what was reported for K-UHPC
in Section 2.2, which shows that K-UHPC is not vulnerable to the deterioration caused by freeze-
thaw cycles.
CONCLUSIONS:
As per the standard, the RDM of elasticity calculated at the end of 300 cycles was not less
than the 60% of the initial value, which is an indication of resistance of K-UHPC to freeze-
thaw cycles.
Weight loss of concrete at the end of 300 cycles was less than 0.1% of its initial weight,
which is an indication that there was no saturation, and this does not affect the strength of the
K-UHPC.
The average DF was 73% at the end of 300 cycles, which shows that K-UHPC is a durable
material.
Surface Resistivity (SR) Test
The surface resistivity (SR) test is performed as an indirect test to measure the resistance of
concrete to chloride ion penetration, which can damage concrete and affect its strength. Salt is
used as a deicing agent in locations that experience extreme winter conditions and also is
common to coastal regions. This test will ensure that the concrete used is resistant to the chloride
ion penetration without deterioration of strength. Resistance to chloride ion is quantified by
calculating the surface electrical resistivity of the concrete samples using the measured voltage.
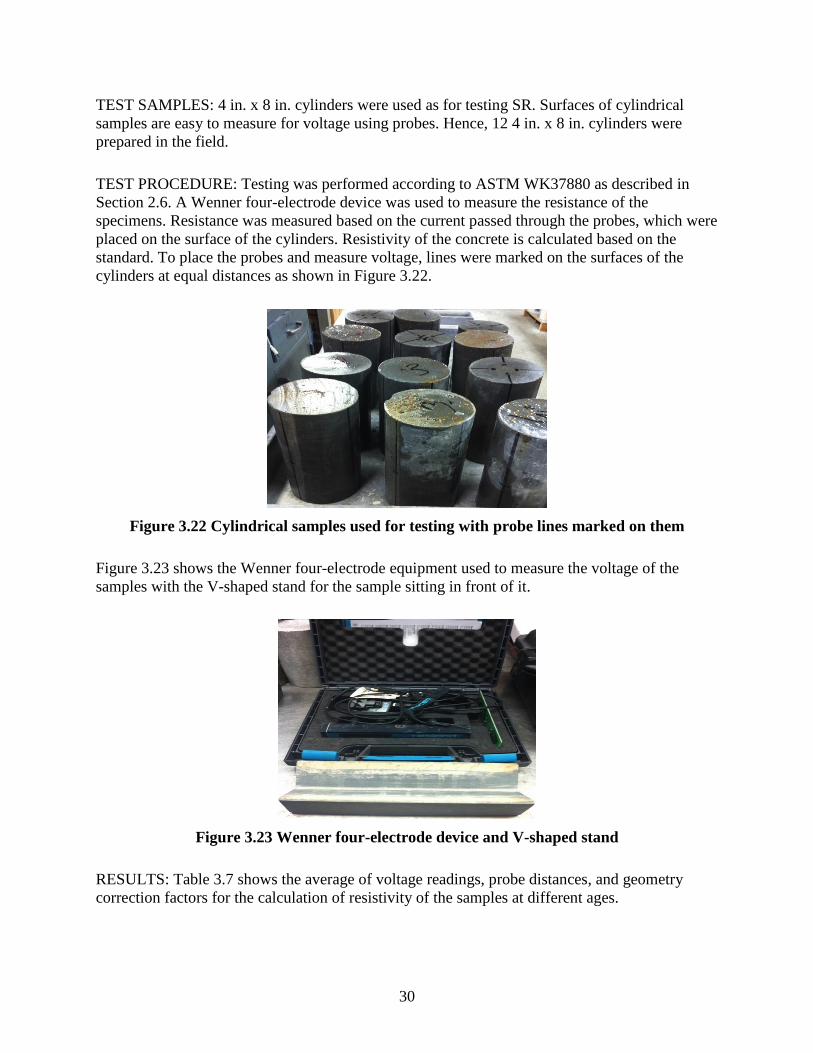
30
TEST SAMPLES: 4 in. x 8 in. cylinders were used as for testing SR. Surfaces of cylindrical
samples are easy to measure for voltage using probes. Hence, 12 4 in. x 8 in. cylinders were
prepared in the field.
TEST PROCEDURE: Testing was performed according to ASTM WK37880 as described in
Section 2.6. A Wenner four-electrode device was used to measure the resistance of the
specimens. Resistance was measured based on the current passed through the probes, which were
placed on the surface of the cylinders. Resistivity of the concrete is calculated based on the
standard. To place the probes and measure voltage, lines were marked on the surfaces of the
cylinders at equal distances as shown in Figure 3.22.
Figure 3.22 Cylindrical samples used for testing with probe lines marked on them
Figure 3.23 shows the Wenner four-electrode equipment used to measure the voltage of the
samples with the V-shaped stand for the sample sitting in front of it.
Figure 3.23 Wenner four-electrode device and V-shaped stand
RESULTS: Table 3.7 shows the average of voltage readings, probe distances, and geometry
correction factors for the calculation of resistivity of the samples at different ages.
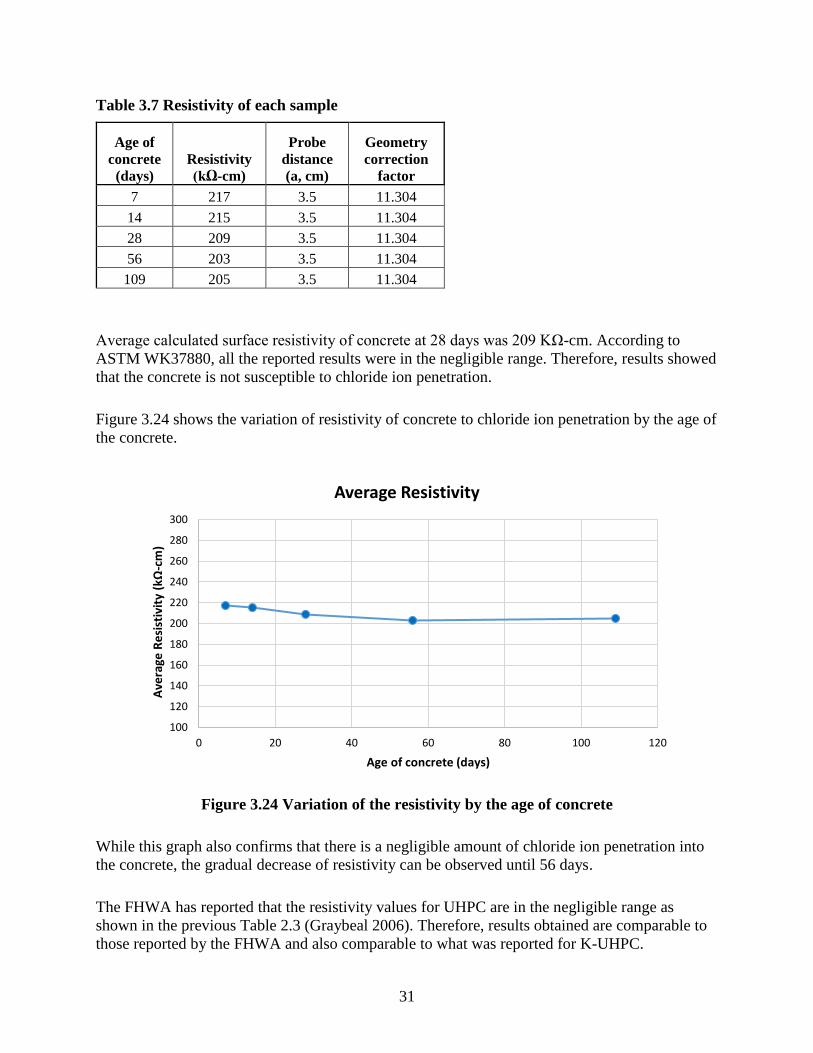
31
Table 3.7 Resistivity of each sample
Age of
concrete
(days)
Resistivity
(kΩ-cm)
Probe
distance
(a, cm)
Geometry
correction
factor
7 217 3.5 11.304
14 215 3.5 11.304
28 209 3.5 11.304
56 203 3.5 11.304
109 205 3.5 11.304
Average calculated surface resistivity of concrete at 28 days was 209 KΩ-cm. According to
ASTM WK37880, all the reported results were in the negligible range. Therefore, results showed
that the concrete is not susceptible to chloride ion penetration.
Figure 3.24 shows the variation of resistivity of concrete to chloride ion penetration by the age of
the concrete.
Figure 3.24 Variation of the resistivity by the age of concrete
While this graph also confirms that there is a negligible amount of chloride ion penetration into
the concrete, the gradual decrease of resistivity can be observed until 56 days.
The FHWA has reported that the resistivity values for UHPC are in the negligible range as
shown in the previous Table 2.3 (Graybeal 2006). Therefore, results obtained are comparable to
those reported by the FHWA and also comparable to what was reported for K-UHPC.
100
120
140
160
180
200
220
240
260
280
300
0 20 40 60 80 100 120
Ave
rage
Re
sist
ivit
y (kΩ
-cm
)
Age of concrete (days)
Average Resistivity
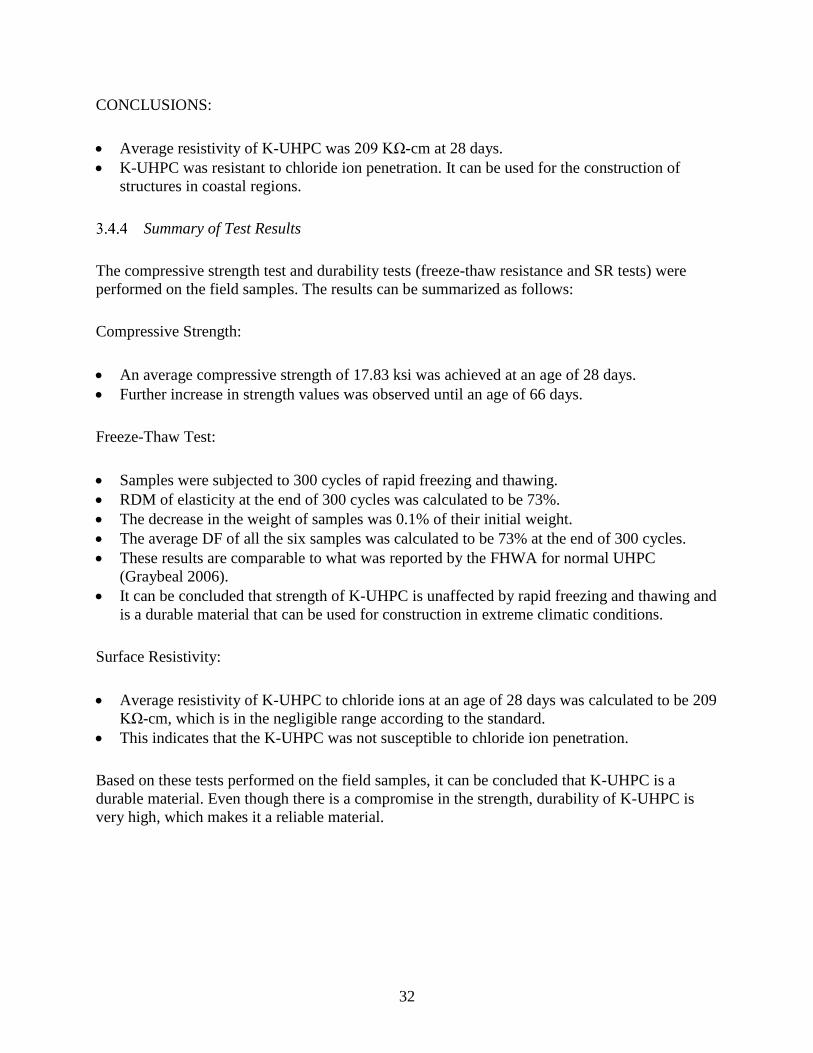
32
CONCLUSIONS:
Average resistivity of K-UHPC was 209 KΩ-cm at 28 days.
K-UHPC was resistant to chloride ion penetration. It can be used for the construction of
structures in coastal regions.
Summary of Test Results
The compressive strength test and durability tests (freeze-thaw resistance and SR tests) were
performed on the field samples. The results can be summarized as follows:
Compressive Strength:
An average compressive strength of 17.83 ksi was achieved at an age of 28 days.
Further increase in strength values was observed until an age of 66 days.
Freeze-Thaw Test:
Samples were subjected to 300 cycles of rapid freezing and thawing.
RDM of elasticity at the end of 300 cycles was calculated to be 73%.
The decrease in the weight of samples was 0.1% of their initial weight.
The average DF of all the six samples was calculated to be 73% at the end of 300 cycles.
These results are comparable to what was reported by the FHWA for normal UHPC
(Graybeal 2006).
It can be concluded that strength of K-UHPC is unaffected by rapid freezing and thawing and
is a durable material that can be used for construction in extreme climatic conditions.
Surface Resistivity:
Average resistivity of K-UHPC to chloride ions at an age of 28 days was calculated to be 209
KΩ-cm, which is in the negligible range according to the standard.
This indicates that the K-UHPC was not susceptible to chloride ion penetration.
Based on these tests performed on the field samples, it can be concluded that K-UHPC is a
durable material. Even though there is a compromise in the strength, durability of K-UHPC is
very high, which makes it a reliable material.
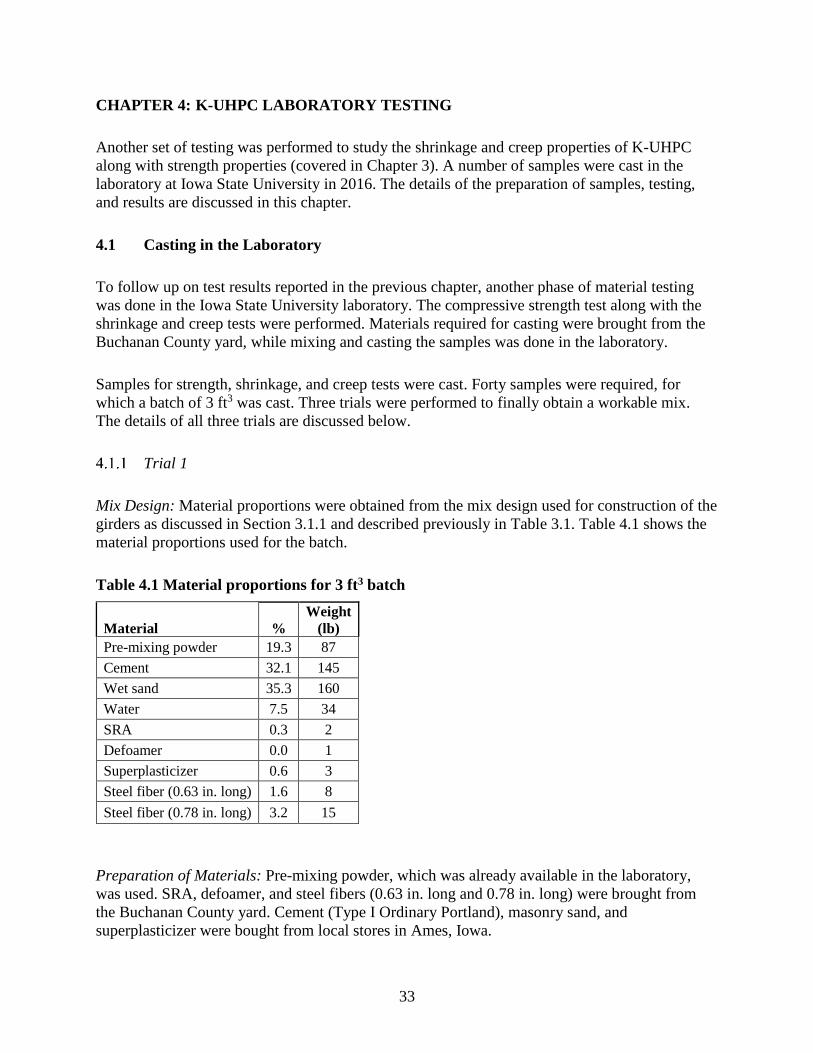
33
CHAPTER 4: K-UHPC LABORATORY TESTING
Another set of testing was performed to study the shrinkage and creep properties of K-UHPC
along with strength properties (covered in Chapter 3). A number of samples were cast in the
laboratory at Iowa State University in 2016. The details of the preparation of samples, testing,
and results are discussed in this chapter.
4.1 Casting in the Laboratory
To follow up on test results reported in the previous chapter, another phase of material testing
was done in the Iowa State University laboratory. The compressive strength test along with the
shrinkage and creep tests were performed. Materials required for casting were brought from the
Buchanan County yard, while mixing and casting the samples was done in the laboratory.
Samples for strength, shrinkage, and creep tests were cast. Forty samples were required, for
which a batch of 3 ft3 was cast. Three trials were performed to finally obtain a workable mix.
The details of all three trials are discussed below.
Trial 1
Mix Design: Material proportions were obtained from the mix design used for construction of the
girders as discussed in Section 3.1.1 and described previously in Table 3.1. Table 4.1 shows the
material proportions used for the batch.
Table 4.1 Material proportions for 3 ft3 batch
Material %
Weight
(lb)
Pre-mixing powder 19.3 87
Cement 32.1 145
Wet sand 35.3 160
Water 7.5 34
SRA 0.3 2
Defoamer 0.0 1
Superplasticizer 0.6 3
Steel fiber (0.63 in. long) 1.6 8
Steel fiber (0.78 in. long) 3.2 15
Preparation of Materials: Pre-mixing powder, which was already available in the laboratory,
was used. SRA, defoamer, and steel fibers (0.63 in. long and 0.78 in. long) were brought from
the Buchanan County yard. Cement (Type I Ordinary Portland), masonry sand, and
superplasticizer were bought from local stores in Ames, Iowa.

34
Mixing Process: A batch of 3 ft3 was mixed in the vertical UHPC mixer available in the
laboratory. In this trial, the mixing procedure provided by KICT, as discussed previously in
Section 3.1.3, was followed.
Mixing: All the materials were weighed accordingly and kept aside. At first, pre-mixing powder,
sand, and cement were mixed for 5 minutes. Then water, superplasticizer, defoamer, and SRA
were added one after the other as required and mixed for 5 minutes. When the mix was
examined, it was still dry, so an additional 5 lb of water and 2 lb of superplasticizer were added
and mixed for another 10 minutes. The mixture was full of small lumps and did not turn into a
fluid. Therefore, an additional 3 lb of water was added and mixed for an extra 15 minutes. It was
still lumpy and did not turn into a workable fluid. An additional 2 lb of superplasticizer was
added and mixed for 10 minutes. Slowly, it started to turn into fluid but was not as workable as
expected. It was not in a state to use or to cast samples. Therefore, the mixing process was
stopped.
Possible Reasons for Failure: After inspecting the mix, the main possible reason for failure was
identified as the usage of one-year-old pre-mixing powder. In addition, the other possible reasons
for failure were analyzed as follows:
County engineers suggested using wet sand with about 4.5% moisture content at the time of
mixing. However, due to lack of availability of wet sand in the local stores, dry masonry sand
was used. Probably, the addition of extra water at the end (which was to account for the
moisture content missing from the sand) affected the w/c ratio of mix.
Locally available superplasticizer was used, which had a different concentration than the one
used for the bridge girders.
Trial 2
After looking into the possible failure reasons of the first attempt, the following corrections were
made to the mix design and materials used for another batch, which was mixed in late July 2016:
New pre-mixing powder materials were brought from the Buchanan County facilities.
A modified mix design and mixing procedure, shared by KICT, were followed for this trial.
Material proportions for 3 ft3 based on the modified mix design are shown in Table 4.2.
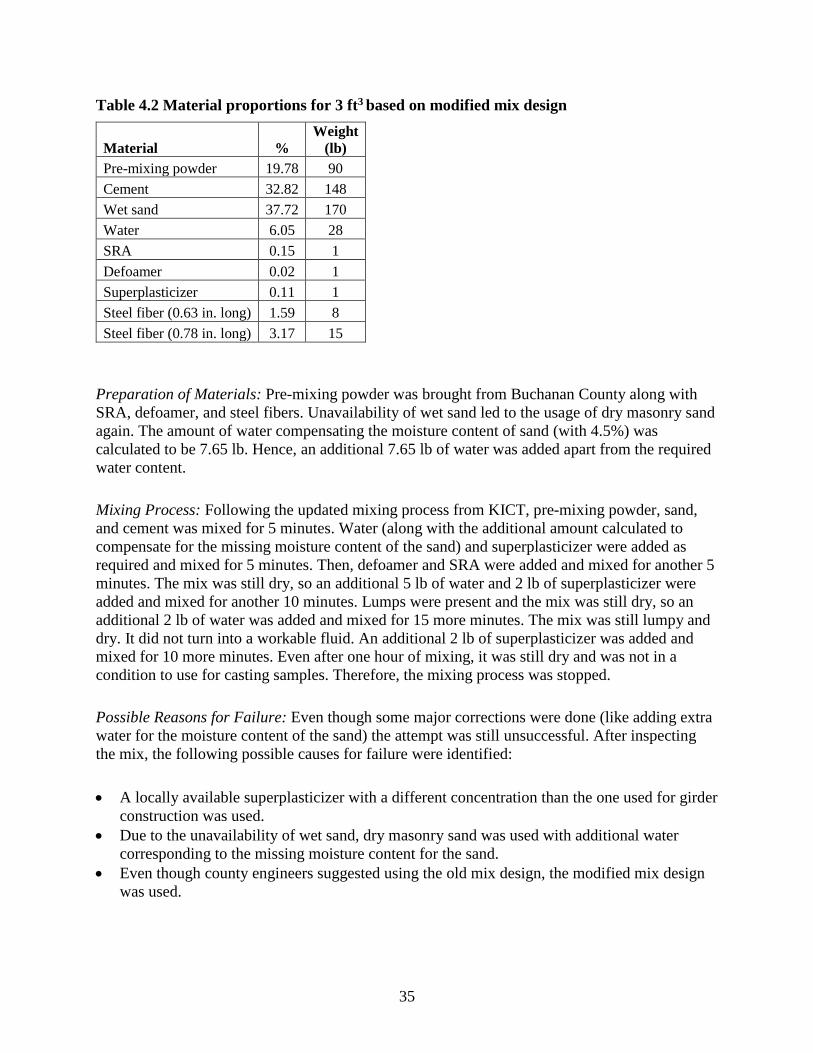
35
Table 4.2 Material proportions for 3 ft3 based on modified mix design
Material %
Weight
(lb)
Pre-mixing powder 19.78 90
Cement 32.82 148
Wet sand 37.72 170
Water 6.05 28
SRA 0.15 1
Defoamer 0.02 1
Superplasticizer 0.11 1
Steel fiber (0.63 in. long) 1.59 8
Steel fiber (0.78 in. long) 3.17 15
Preparation of Materials: Pre-mixing powder was brought from Buchanan County along with
SRA, defoamer, and steel fibers. Unavailability of wet sand led to the usage of dry masonry sand
again. The amount of water compensating the moisture content of sand (with 4.5%) was
calculated to be 7.65 lb. Hence, an additional 7.65 lb of water was added apart from the required
water content.
Mixing Process: Following the updated mixing process from KICT, pre-mixing powder, sand,
and cement was mixed for 5 minutes. Water (along with the additional amount calculated to
compensate for the missing moisture content of the sand) and superplasticizer were added as
required and mixed for 5 minutes. Then, defoamer and SRA were added and mixed for another 5
minutes. The mix was still dry, so an additional 5 lb of water and 2 lb of superplasticizer were
added and mixed for another 10 minutes. Lumps were present and the mix was still dry, so an
additional 2 lb of water was added and mixed for 15 more minutes. The mix was still lumpy and
dry. It did not turn into a workable fluid. An additional 2 lb of superplasticizer was added and
mixed for 10 more minutes. Even after one hour of mixing, it was still dry and was not in a
condition to use for casting samples. Therefore, the mixing process was stopped.
Possible Reasons for Failure: Even though some major corrections were done (like adding extra
water for the moisture content of the sand) the attempt was still unsuccessful. After inspecting
the mix, the following possible causes for failure were identified:
A locally available superplasticizer with a different concentration than the one used for girder
construction was used.
Due to the unavailability of wet sand, dry masonry sand was used with additional water
corresponding to the missing moisture content for the sand.
Even though county engineers suggested using the old mix design, the modified mix design
was used.

36
Trial 3
Due to the poor experience with the superplasticizer, a quantity required was requested from the
Buchanan County facility. Moreover, with the suggestion of the engineers at the bridge site, the
old mix design (as used in Trial 1) was used. Wet sand with 4.5% moisture content was bought
from a local store in Ames, Iowa. Also, Buchanan County Engineer Alex Davis was requested to
come to Ames to supervise the mixing process. In his presence, another batch of 3 ft3 was mixed
on November 19, 2016.
Mix Design: Material proportions from the old mix design shown previously in Table 4.1 were
used.
Preparation of Materials: Wet sand with about 4.5% moisture content was bought from local
stores in Iowa. Along with other materials, superplasticizer with the required concentration was
brought from the Buchanan County facilities. Cement was also brought from a local store in
Ames (see Figure 4.1).
Figure 4.1 Materials ready for mixing (left) and vertical mixer used for mixing K-UHPC
(right)
Mixing Process: The same procedure stated in Trial 1 was followed with some modifications.
Premixing powder, cement, and sand were added first and mixed for 10 minutes. Water was
added as required at the rate of 6.6 lb/minute and was mixed for 5 minutes. When the mix was
examined, it had become very wet. Superplasticizer was then added as required and was mixed
for 10 minutes. Next, the SRA and defoamer were added and mixed for 5 minutes. The mix was
very liquid. To make it workable, about 2 lb of sand was added and mixed for 10 minutes. At this
stage, the mix was workable. Finally, steel fibers were added and mixed for 10 minutes. When
examined later, the mix was in a state to cast into molds.
Thirty-five 4 in. x 8 in. cylinders and three 3 in. x 3 in. x 11.25 in. beams and three dog bone
shaped samples (for testing tension) were cast. All the molds were filled with the mix and kept in
the laboratory for 48 hours. Figure 4.2 shows the mixing process and molds produced.

37
Figure 4.2 K-UHPC while mixing (left) and cylindrical molds after casting (right)
Later, a number of samples were cast for the bonding tests (pullout cubes of 6 in. x 6 in. x 4 in.
and four-point bending beams of 6 in. x 8 in. x 24 in.) using the same mixture proportions.
Demolding and Curing: Demolding of the samples was done 48 hours after casting (November
21, 2016). All samples were marked accordingly and all except seven cylinders and three beams
were arranged in the curing tank.
To measure the initial drying shrinkage, a set of readings was taken before leaving the samples
for curing. The seven cylinders and three beams were left out of the curing tank to take readings
(for shrinkage measurement). Lines and small points were marked on the cylinders for placement
of Demec discs. Using epoxy, the Demec discs were stuck onto the cylinders and left out for few
minutes for the epoxy to dry. Later, a set of initial readings was taken for the three beams using
the length comparator and shrinkage readings were taken for the cylinders using the Demec
gauge. Also, the weight of all the samples was recorded. Finally, all the samples were placed into
the curing tank shown in Figure 4.3 and the temperature was set to 122°F (50°C).

38
Figure 4.3 Samples placed in steam-curing tank
There was a time gap of 2 hours before curing started. During this gap, samples were exposed to
air at the normal laboratory room temperature. The samples were in the curing tank for four days
at 122°F (50°C). They were removed from the curing tank on November 26, 2016 and placed in
a moist curing room thereafter (see Figure 4.4).
Figure 4.4 Samples placed in the moist curing room after 4 days of steam curing
Summary
Table 4.3 summarizes the three trials, challenges faced, and corrections made.
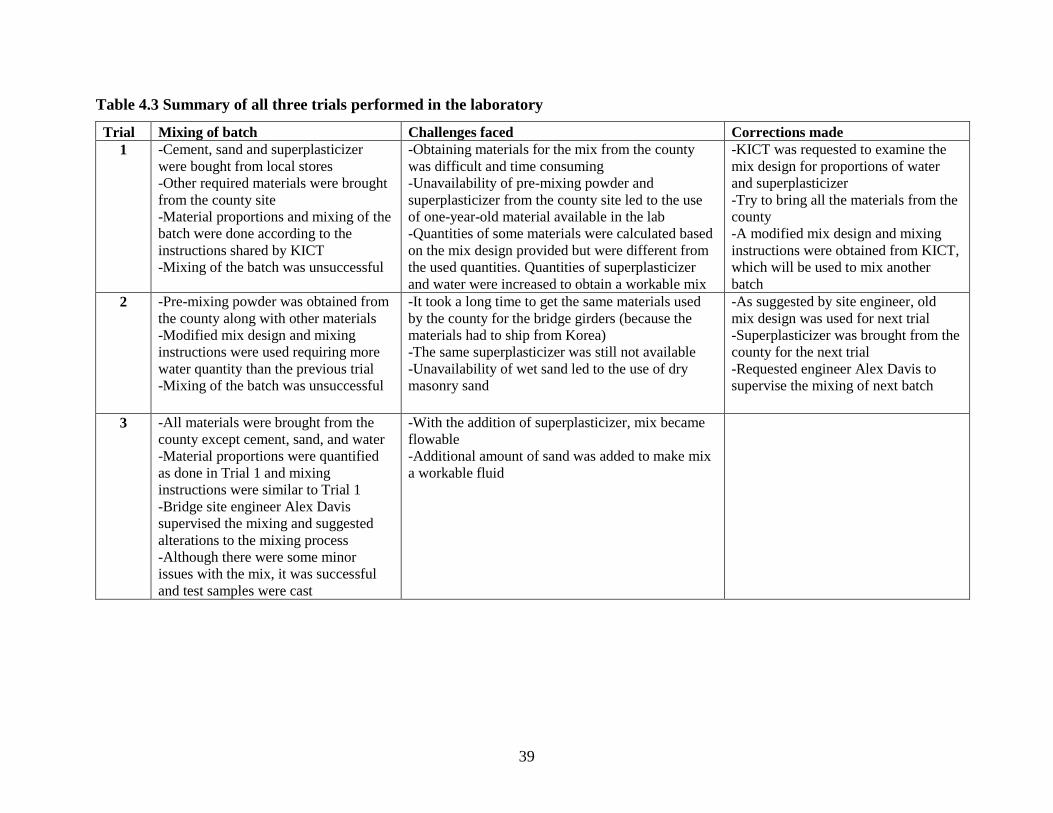
39
Table 4.3 Summary of all three trials performed in the laboratory
Trial Mixing of batch Challenges faced Corrections made
1 -Cement, sand and superplasticizer
were bought from local stores
-Other required materials were brought
from the county site
-Material proportions and mixing of the
batch were done according to the
instructions shared by KICT
-Mixing of the batch was unsuccessful
-Obtaining materials for the mix from the county
was difficult and time consuming
-Unavailability of pre-mixing powder and
superplasticizer from the county site led to the use
of one-year-old material available in the lab
-Quantities of some materials were calculated based
on the mix design provided but were different from
the used quantities. Quantities of superplasticizer
and water were increased to obtain a workable mix
-KICT was requested to examine the
mix design for proportions of water
and superplasticizer
-Try to bring all the materials from the
county
-A modified mix design and mixing
instructions were obtained from KICT,
which will be used to mix another
batch
2 -Pre-mixing powder was obtained from
the county along with other materials
-Modified mix design and mixing
instructions were used requiring more
water quantity than the previous trial
-Mixing of the batch was unsuccessful
-It took a long time to get the same materials used
by the county for the bridge girders (because the
materials had to ship from Korea)
-The same superplasticizer was still not available
-Unavailability of wet sand led to the use of dry
masonry sand
-As suggested by site engineer, old
mix design was used for next trial
-Superplasticizer was brought from the
county for the next trial
-Requested engineer Alex Davis to
supervise the mixing of next batch
3 -All materials were brought from the
county except cement, sand, and water
-Material proportions were quantified
as done in Trial 1 and mixing
instructions were similar to Trial 1
-Bridge site engineer Alex Davis
supervised the mixing and suggested
alterations to the mixing process
-Although there were some minor
issues with the mix, it was successful
and test samples were cast
-With the addition of superplasticizer, mix became
flowable
-Additional amount of sand was added to make mix
a workable fluid

40
4.2 Test Results and Discussion
Compressive strength, cylinder shrinkage, and beam shrinkage tests were performed. The test
procedure and results are discussed in the following sections:
Compressive Strength Test
TEST SAMPLES: According to ASTM C39, the standard test samples for compressive strength
are 4 in. x 8 in. cylinders. Therefore, 21 4 in. x 8 in. cylinders were cast to test the compressive
strength of the concrete at different ages of curing.
TEST PROCEDURE: Compressive strength testing was done according to ASTM C39, with the
loading rate as discussed in Section 2.6. The tests were performed on two different machines
available at the Iowa State University laboratory. Figure 4.5 shows the two machines used:
Figure 4.5 Equipment used for testing compressive strength
RESULTS AND DISCUSSION:
Compressive strength tests were conducted immediately after removing the samples from the
steam curing tank. Three samples were tested on November 26, 2016 to determine the 7-day
compressive strength. A thin layer on the rough side of each cylindrical sample was cut to
maintain smoothness on both sides of the cylinder. Thin sheets of wood were used on the top and
bottom of the samples while testing. Table 4.4 shows the values of strength for the three samples.
An average compressive strength value of 16.6 ksi was achieved.

41
Table 4.4 Compressive strength at 7 days (11/26/2016)
Sample
Compressive
strength (ksi) Note
1 15.251
Wood at bottom and top 2 17.152
3 17.391
Average 16.6
Figures 4.6 through 4.8 show the details of the failure patterns of the three samples tested for
compressive strength.
Figure 4.6 Front, back, and bottom of Sample 1 (left to right)
Figure 4.7 Front, back, and bottom of Sample 2 (left to right)

42
Figure 4.8 Front, back, and bottom of Sample 3 (left to right)
From these images, it can be observed that the whole load was bearing on the bottom surface of
each sample. The loads formed vertical cracks and caused the most failure at the bottom
surfaces.
Again, strength was tested when the concrete was 14 days old. As stated previously, the rough
surfaces of the samples were cut. Wood pieces were used on the top and bottom of the samples.
Three samples were tested and the average compressive strength value was 16.7 ksi. There was
no increase in strength from 7 days to 14 days. Table 4.5 shows the values of strength for the
three samples.
Table 4.5 Compressive strength at 14 days (12/03/2016)
Sample
Compressive
strength (ksi) Note
1 18.117
Wood at bottom and top 2 16.67
3 15.241
Average 16.68
Figures 4.9 through 4.11 show the deformation and failure pattern of the three samples tested for
the 14-day compressive strength.
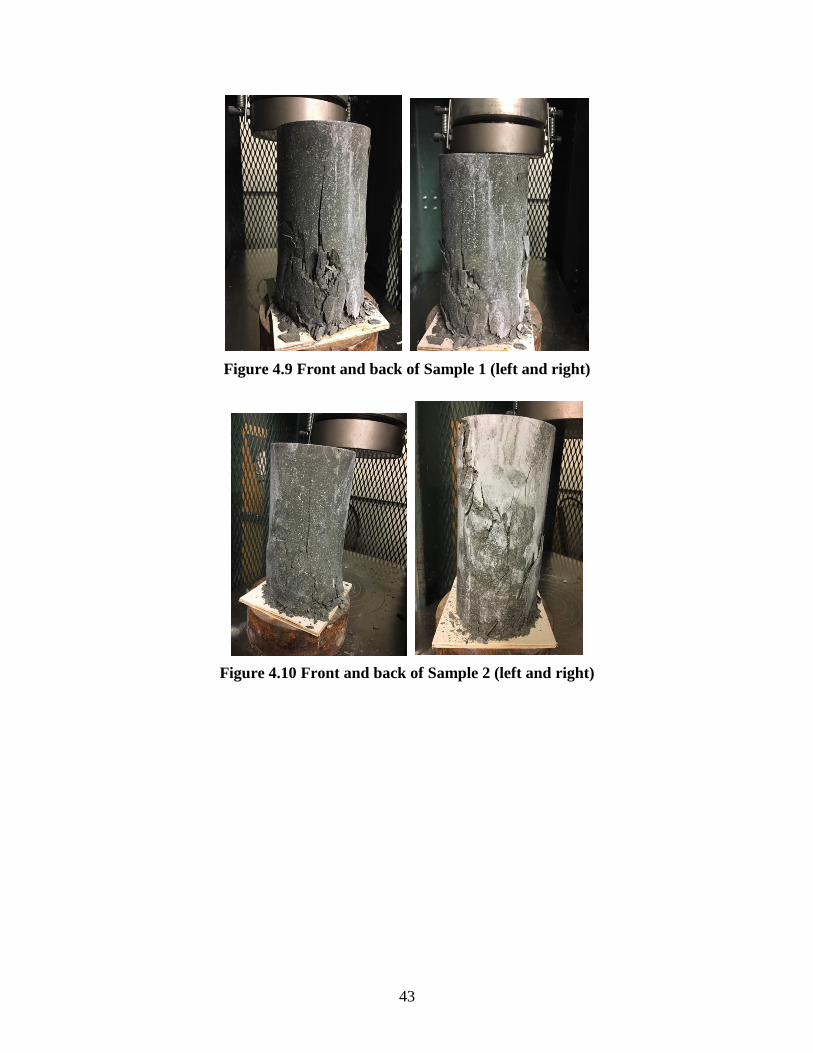
43
Figure 4.9 Front and back of Sample 1 (left and right)
Figure 4.10 Front and back of Sample 2 (left and right)
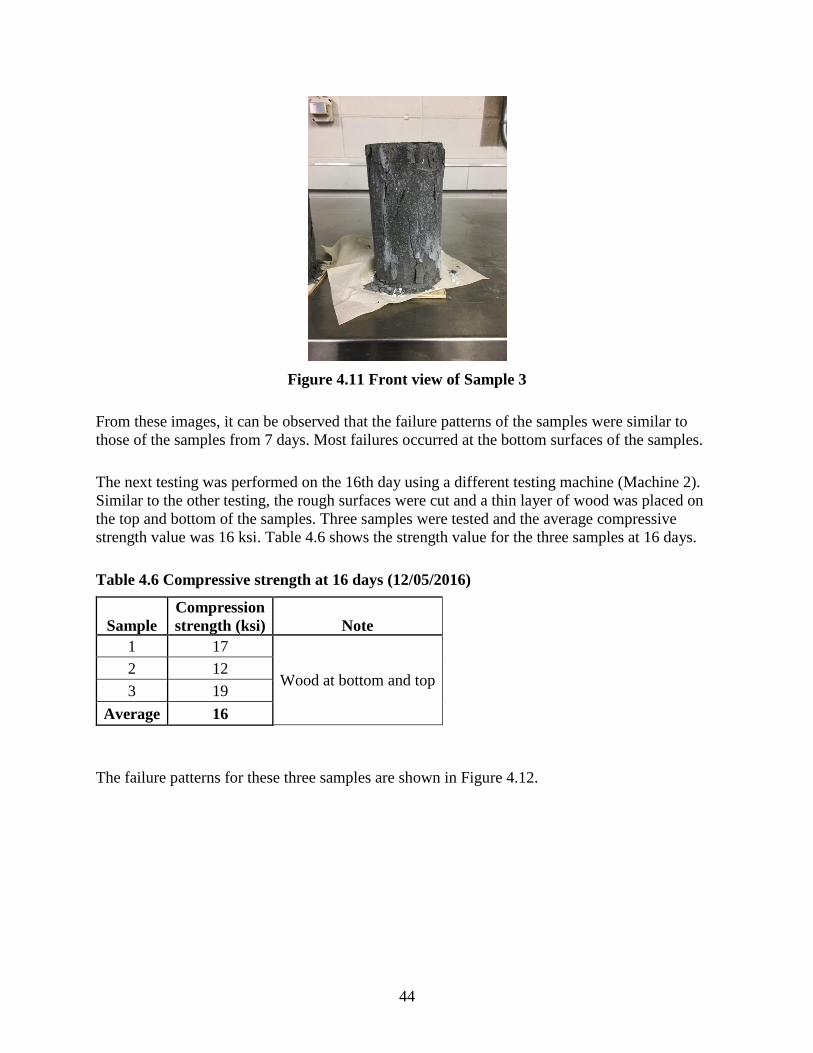
44
Figure 4.11 Front view of Sample 3
From these images, it can be observed that the failure patterns of the samples were similar to
those of the samples from 7 days. Most failures occurred at the bottom surfaces of the samples.
The next testing was performed on the 16th day using a different testing machine (Machine 2).
Similar to the other testing, the rough surfaces were cut and a thin layer of wood was placed on
the top and bottom of the samples. Three samples were tested and the average compressive
strength value was 16 ksi. Table 4.6 shows the strength value for the three samples at 16 days.
Table 4.6 Compressive strength at 16 days (12/05/2016)
Sample
Compression
strength (ksi) Note
1 17
Wood at bottom and top 2 12
3 19
Average 16
The failure patterns for these three samples are shown in Figure 4.12.

45
Figure 4.12 Front and top views of samples (left and right)
Compressive strength results obtained at 7 and 14 days performed on Machine 1 were consistent
with the results obtained from the 16th day test performed on Machine 2.
Failure of the samples also looks similar to the other samples. As seen in Figure 4.12, one of the
samples had white chunks and almost no steel fiber distribution. When tested, this sample had
compressive strength of 12 ksi, which was much lower than the other two samples.
The compressive strength test at 28 days was conducted on December 20, 2016 following a
similar procedure. An average compressive strength value of 19.09 ksi was achieved. The
strength values of the samples are shown in Table 4.7.
Table 4.7 Compressive strength at 28 days (12/20/2016)
Sample
Compressive
strength (ksi) Note
1 18.32
Wood at bottom and top 2 20.6
3 18.34
Average 19.09
Figure 4.13 shows the tested samples.
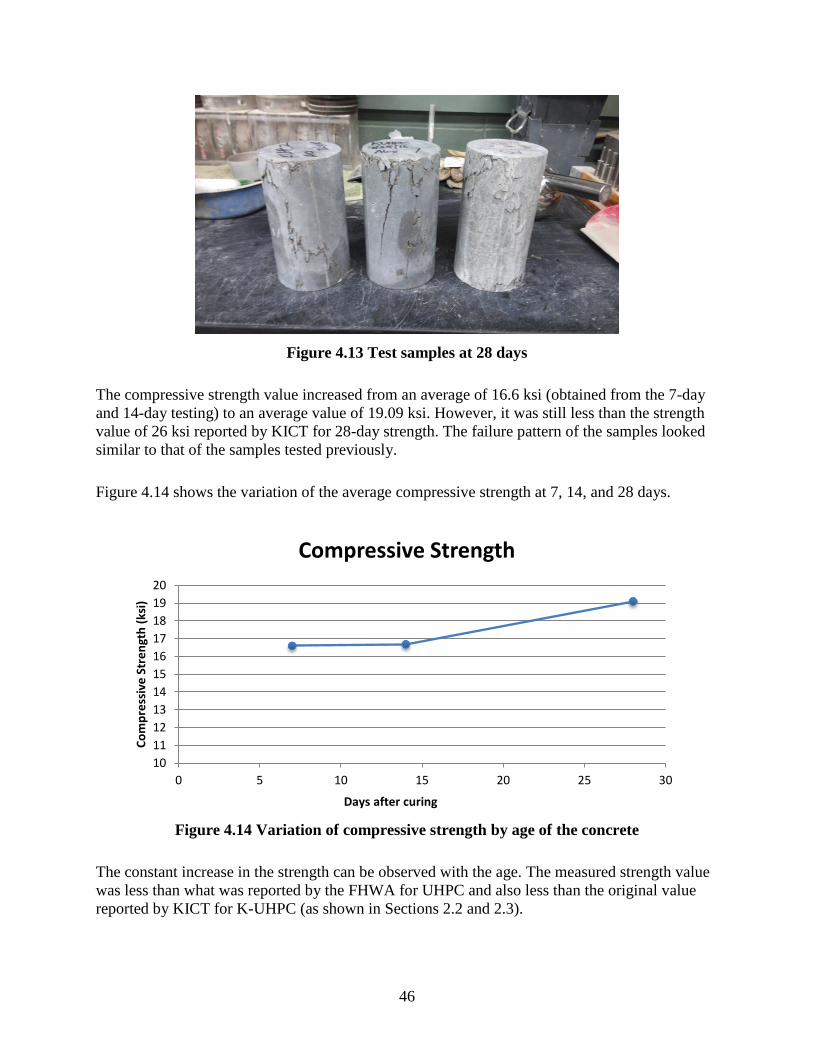
46
Figure 4.13 Test samples at 28 days
The compressive strength value increased from an average of 16.6 ksi (obtained from the 7-day
and 14-day testing) to an average value of 19.09 ksi. However, it was still less than the strength
value of 26 ksi reported by KICT for 28-day strength. The failure pattern of the samples looked
similar to that of the samples tested previously.
Figure 4.14 shows the variation of the average compressive strength at 7, 14, and 28 days.
Figure 4.14 Variation of compressive strength by age of the concrete
The constant increase in the strength can be observed with the age. The measured strength value
was less than what was reported by the FHWA for UHPC and also less than the original value
reported by KICT for K-UHPC (as shown in Sections 2.2 and 2.3).
10
11
12
13
14
15
16
17
18
19
20
0 5 10 15 20 25 30
Co
mp
ress
ive
Str
en
gth
(ks
i)
Days after curing
Compressive Strength
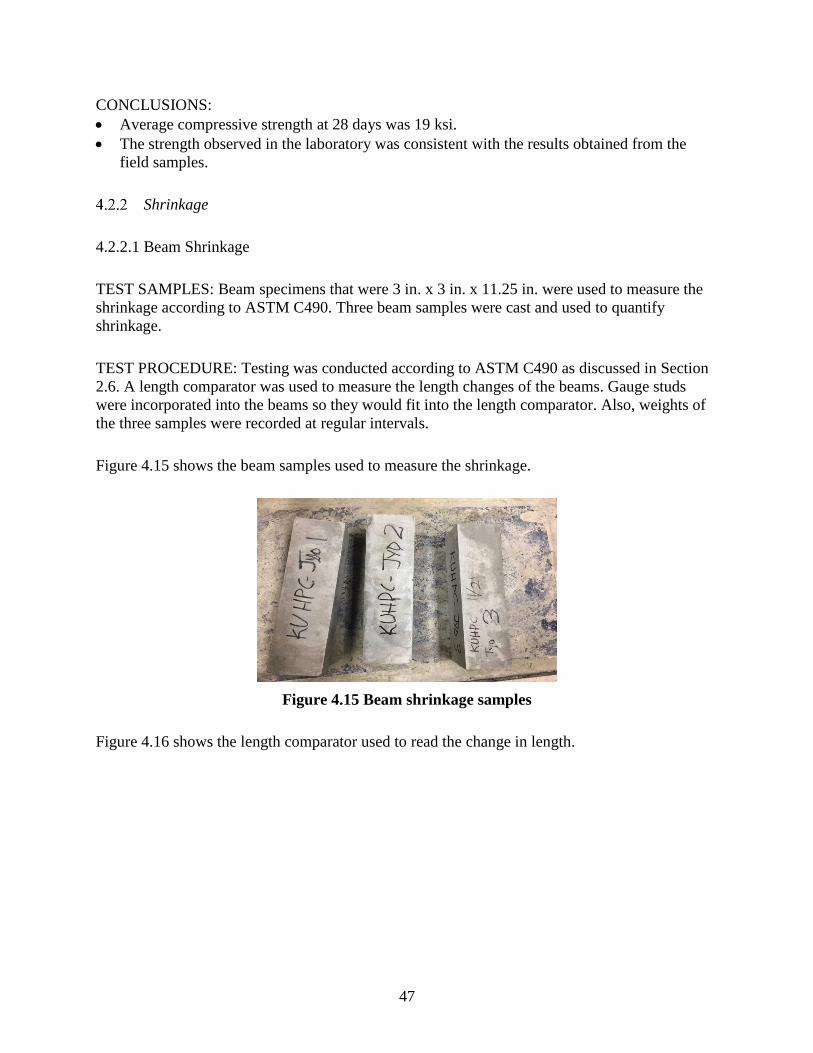
47
CONCLUSIONS:
Average compressive strength at 28 days was 19 ksi.
The strength observed in the laboratory was consistent with the results obtained from the
field samples.
Shrinkage
4.2.2.1 Beam Shrinkage
TEST SAMPLES: Beam specimens that were 3 in. x 3 in. x 11.25 in. were used to measure the
shrinkage according to ASTM C490. Three beam samples were cast and used to quantify
shrinkage.
TEST PROCEDURE: Testing was conducted according to ASTM C490 as discussed in Section
2.6. A length comparator was used to measure the length changes of the beams. Gauge studs
were incorporated into the beams so they would fit into the length comparator. Also, weights of
the three samples were recorded at regular intervals.
Figure 4.15 shows the beam samples used to measure the shrinkage.
Figure 4.15 Beam shrinkage samples
Figure 4.16 shows the length comparator used to read the change in length.
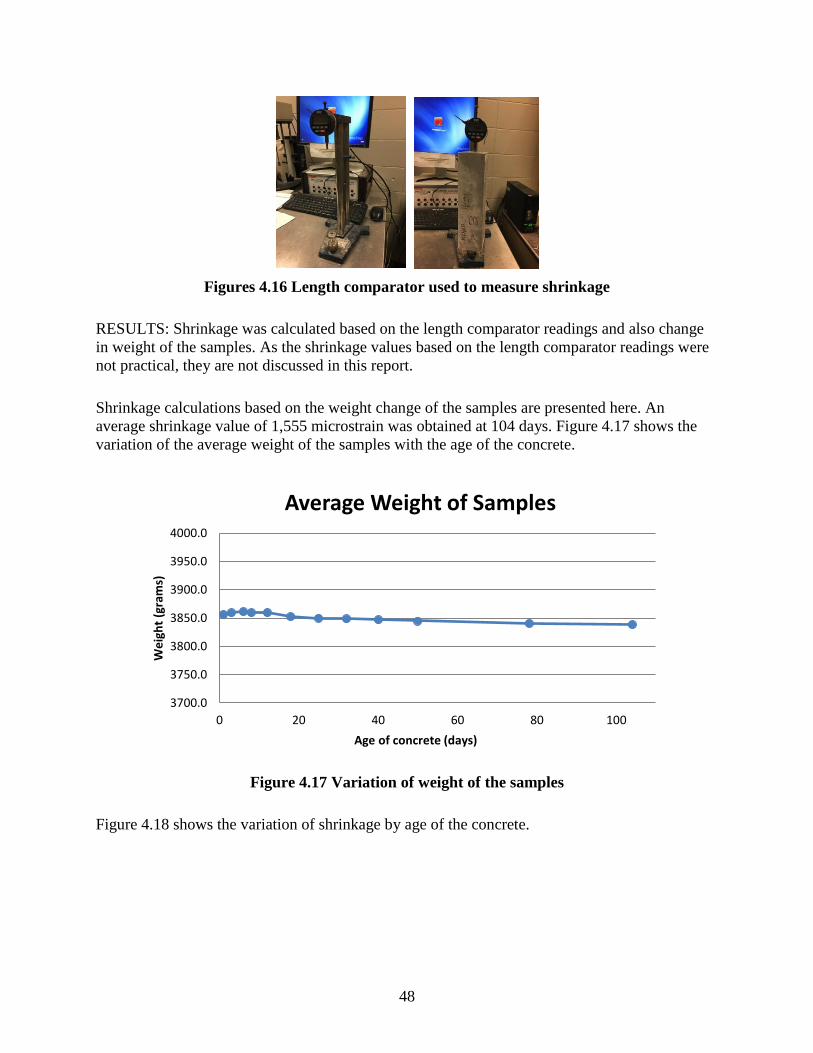
48
Figures 4.16 Length comparator used to measure shrinkage
RESULTS: Shrinkage was calculated based on the length comparator readings and also change
in weight of the samples. As the shrinkage values based on the length comparator readings were
not practical, they are not discussed in this report.
Shrinkage calculations based on the weight change of the samples are presented here. An
average shrinkage value of 1,555 microstrain was obtained at 104 days. Figure 4.17 shows the
variation of the average weight of the samples with the age of the concrete.
Figure 4.17 Variation of weight of the samples
Figure 4.18 shows the variation of shrinkage by age of the concrete.
3700.0
3750.0
3800.0
3850.0
3900.0
3950.0
4000.0
0 20 40 60 80 100
We
igh
t (g
ram
s)
Age of concrete (days)
Average Weight of Samples

49
Figure 4.18 Variation of shrinkage by age
Results showed that the K-UHPC experienced a few negative strains initially, which was due to
the gain in the weight of the samples during the initial days. This weight gain can be seen in the
previous Figure 4.17. The reason for the weight gain may be because the samples were left for
curing later after recording the initial readings, and samples might have absorbed water when
they were left in the moisture room for curing.
The total average shrinkage value was 1,555 microstrain, which is more than what was reported
for UHPC by the FHWA (as previously discussed in Section 2.3) and also higher than what was
reported by KICT (as previously discussed in Section 2.2).
CONCLUSIONS:
Initially, negative strains were observed because of the gain in weight.
Total average shrinkage at an age of 104 days was 1,555 microstrain.
4.2.2.2 Shrinkage Using Demec Gauge
TEST SAMPLES: 4 in. x 8 in. cylinders were used for measuring the shrinkage using the Demec
gauge. Seven cylinders were cast.
TEST PROCEDURE: The Demec gauge is the instrument used to measure the change in length.
Small Demec discs were attached to the surface of the cylinders at equal lengths in the transverse
direction. The spacing between the discs in the longitudinal direction should be equal to the
gauge length of the instrument. The gauge length of the instrument used in the laboratory was 4
in.
-1000.0
-500.0
0.0
500.0
1000.0
1500.0
2000.0
0 20 40 60 80 100 120
Shri
nka
ge, x
10
-6
Age of concrete (days)
Average Shrinkage

50
The discs were glued to the surface using epoxy immediately after removing the samples from
their molds. The Demec gauge has one fixed location point and a movable point. These points
were placed on the discs on the cylindrical surface to read any change in the gauge length and
displayed on the dial of the gauge. There is a reference invar bar along with the gauge. It was
used as a reference bar to check the shrinkage readings for errors.
Demec readings for all seven samples were taken at regular intervals. Also, weights of all the
samples were recorded. Figures 4.19 and 4.20 show the Demec gauge used and Demec discs
attached to the cylindrical surface of each cylinder, respectively.
Figure 4.19 Demec gauge with the reference bar
Figure 4.20 Cylindrical samples with Demec discs glued to the surface
RESULTS: Shrinkage readings calculated using the Demec strain readings were not practical.
Hence, they are not presented in this report. Shrinkage was estimated based on the weight of the
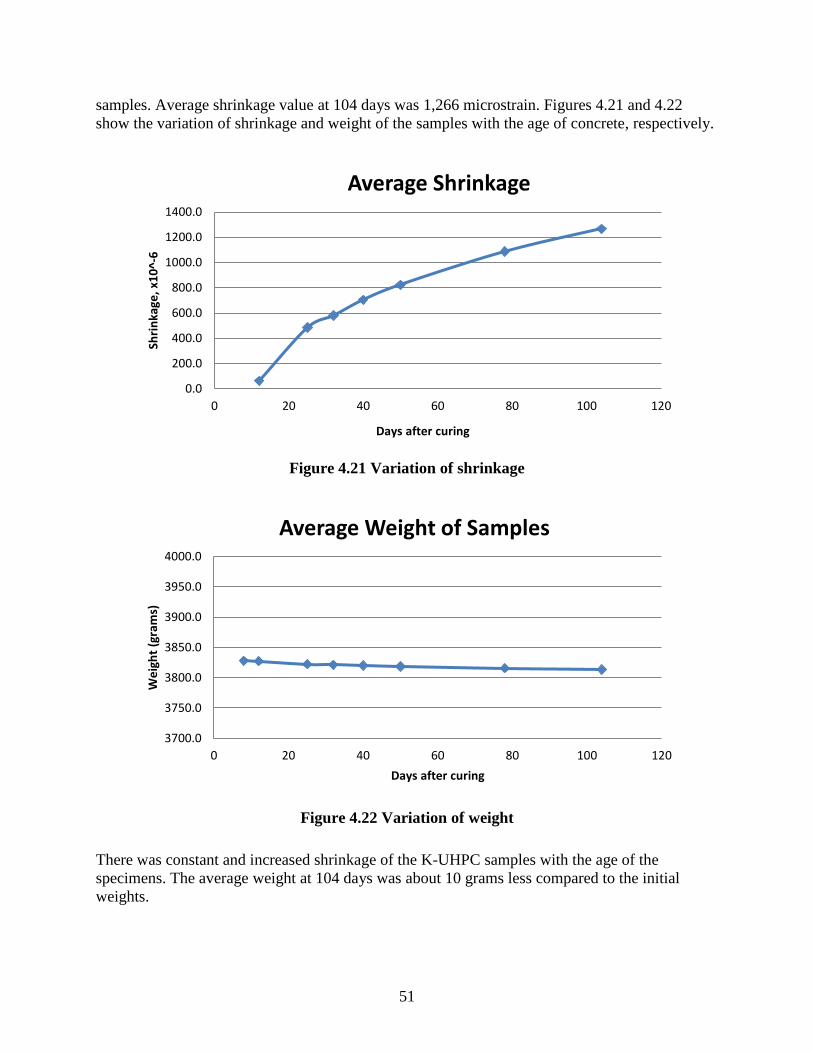
51
samples. Average shrinkage value at 104 days was 1,266 microstrain. Figures 4.21 and 4.22
show the variation of shrinkage and weight of the samples with the age of concrete, respectively.
Figure 4.21 Variation of shrinkage
Figure 4.22 Variation of weight
There was constant and increased shrinkage of the K-UHPC samples with the age of the
specimens. The average weight at 104 days was about 10 grams less compared to the initial
weights.
0.0
200.0
400.0
600.0
800.0
1000.0
1200.0
1400.0
0 20 40 60 80 100 120
Shri
nka
ge, x
10
^-6
Days after curing
Average Shrinkage
3700.0
3750.0
3800.0
3850.0
3900.0
3950.0
4000.0
0 20 40 60 80 100 120
We
igh
t (g
ram
s)
Days after curing
Average Weight of Samples
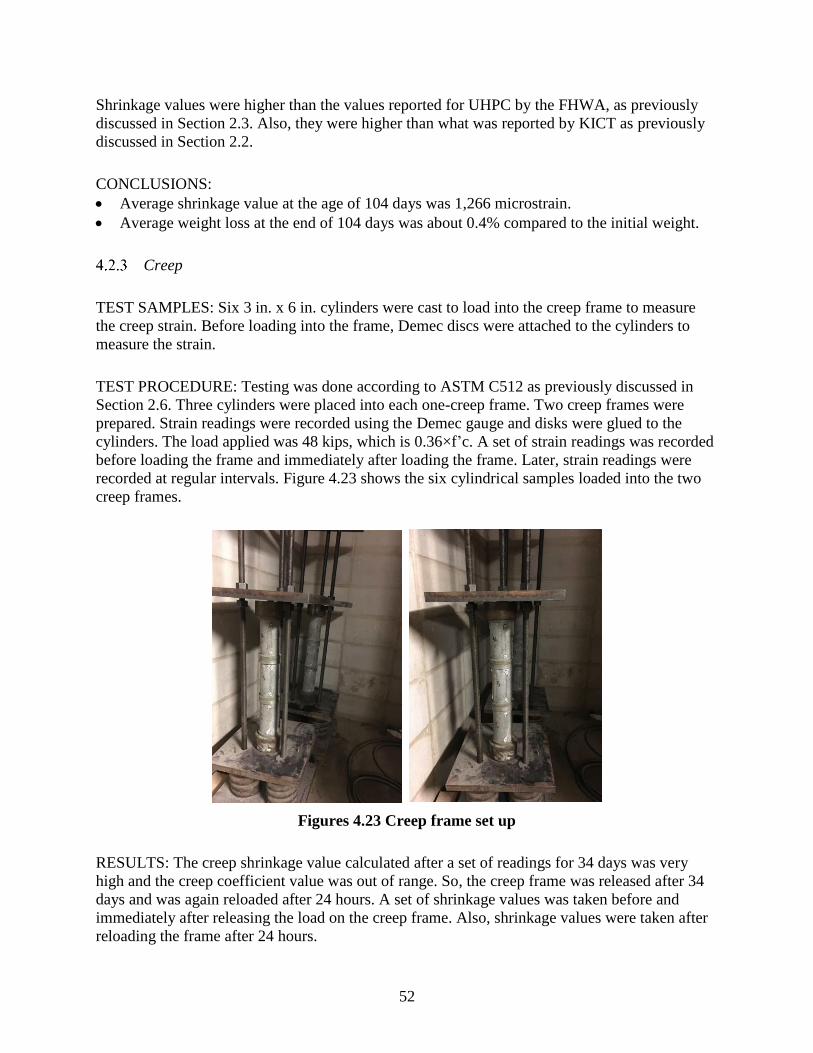
52
Shrinkage values were higher than the values reported for UHPC by the FHWA, as previously
discussed in Section 2.3. Also, they were higher than what was reported by KICT as previously
discussed in Section 2.2.
CONCLUSIONS:
Average shrinkage value at the age of 104 days was 1,266 microstrain.
Average weight loss at the end of 104 days was about 0.4% compared to the initial weight.
Creep
TEST SAMPLES: Six 3 in. x 6 in. cylinders were cast to load into the creep frame to measure
the creep strain. Before loading into the frame, Demec discs were attached to the cylinders to
measure the strain.
TEST PROCEDURE: Testing was done according to ASTM C512 as previously discussed in
Section 2.6. Three cylinders were placed into each one-creep frame. Two creep frames were
prepared. Strain readings were recorded using the Demec gauge and disks were glued to the
cylinders. The load applied was 48 kips, which is 0.36×f’c. A set of strain readings was recorded
before loading the frame and immediately after loading the frame. Later, strain readings were
recorded at regular intervals. Figure 4.23 shows the six cylindrical samples loaded into the two
creep frames.
Figures 4.23 Creep frame set up
RESULTS: The creep shrinkage value calculated after a set of readings for 34 days was very
high and the creep coefficient value was out of range. So, the creep frame was released after 34
days and was again reloaded after 24 hours. A set of shrinkage values was taken before and
immediately after releasing the load on the creep frame. Also, shrinkage values were taken after
reloading the frame after 24 hours.
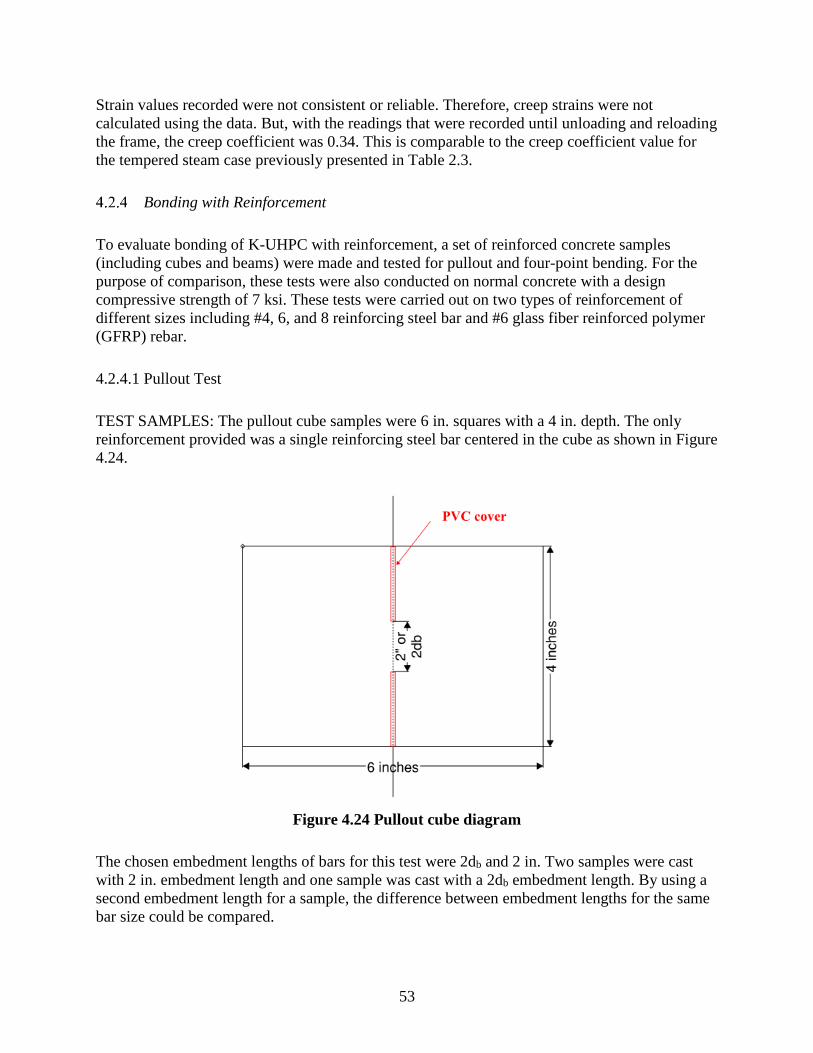
53
Strain values recorded were not consistent or reliable. Therefore, creep strains were not
calculated using the data. But, with the readings that were recorded until unloading and reloading
the frame, the creep coefficient was 0.34. This is comparable to the creep coefficient value for
the tempered steam case previously presented in Table 2.3.
Bonding with Reinforcement
To evaluate bonding of K-UHPC with reinforcement, a set of reinforced concrete samples
(including cubes and beams) were made and tested for pullout and four-point bending. For the
purpose of comparison, these tests were also conducted on normal concrete with a design
compressive strength of 7 ksi. These tests were carried out on two types of reinforcement of
different sizes including #4, 6, and 8 reinforcing steel bar and #6 glass fiber reinforced polymer
(GFRP) rebar.
4.2.4.1 Pullout Test
TEST SAMPLES: The pullout cube samples were 6 in. squares with a 4 in. depth. The only
reinforcement provided was a single reinforcing steel bar centered in the cube as shown in Figure
4.24.
Figure 4.24 Pullout cube diagram
The chosen embedment lengths of bars for this test were 2db and 2 in. Two samples were cast
with 2 in. embedment length and one sample was cast with a 2db embedment length. By using a
second embedment length for a sample, the difference between embedment lengths for the same
bar size could be compared.

54
TEST PROCEDURE: The cubes were tested using an MTS 810 material testing system with a
FlexTest controller. When looking into previous literature, one issue that arose with the use of
pullout samples was that the concrete would often be entirely in compression. To avoid this
unrealistic situation, the cubes were held for the test with a metal plate that contained a 5 in.-
square hole in the center of it. By only supporting 1/2 in. of the cube on all sides, most of the
pullout cube would remain in tension. The plate was then bolted to the bottom jaw of the MTS
equipment while the top reinforcing bar was clamped into the top jaw of the equipment. Figure
4.25 shows the test setup.
Figure 4.25 Pullout cube test setup
Direct current differential transformers (DCDTs) were placed on both the top and bottom
reinforcing bars of the sample to measure the slip of the bar during the testing. The bottom jaw
of the MTS equipment was pulled down to apply the load to the cube.
The load and slip values were measured during the testing of each of the pullout cubes. After
collecting these values, the bond stress for the connection was calculated using the following
equation:
𝜏 = 𝐹
𝜋𝑙𝑑𝑑𝑏
Where τ is the bond stress of the bars, F is the tensile force applied to the sample, ld is the
embedment length, and db is the bar diameter.
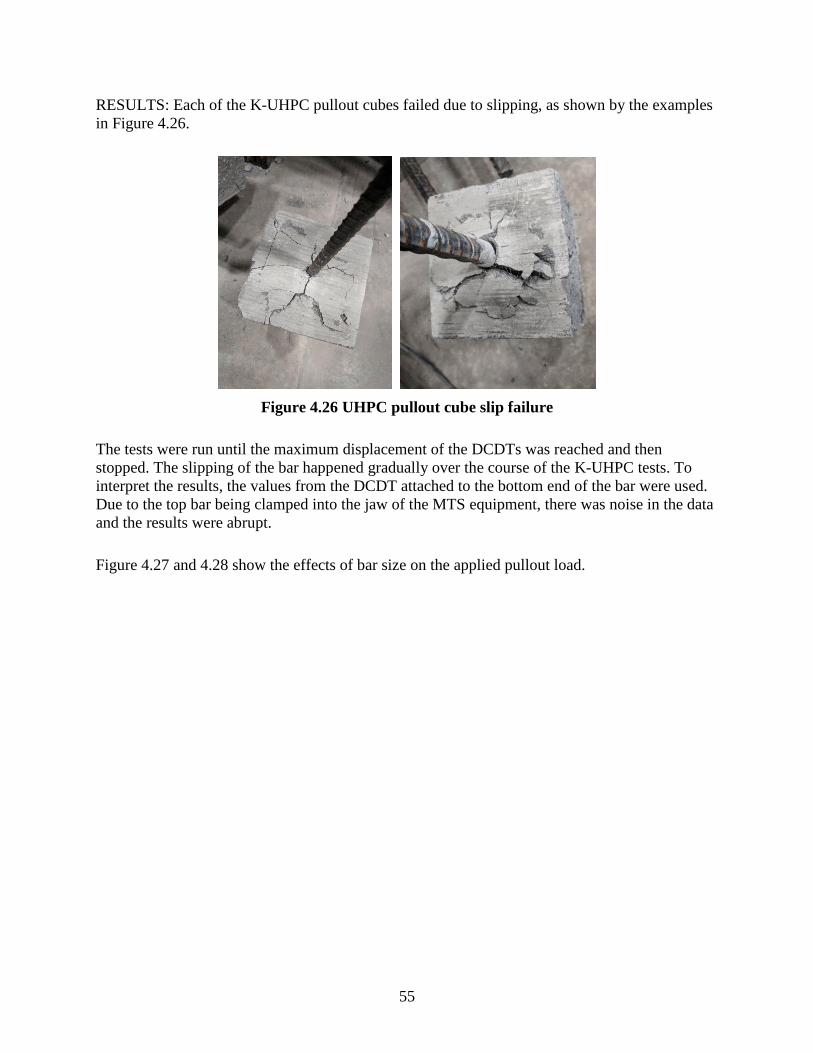
55
RESULTS: Each of the K-UHPC pullout cubes failed due to slipping, as shown by the examples
in Figure 4.26.
Figure 4.26 UHPC pullout cube slip failure
The tests were run until the maximum displacement of the DCDTs was reached and then
stopped. The slipping of the bar happened gradually over the course of the K-UHPC tests. To
interpret the results, the values from the DCDT attached to the bottom end of the bar were used.
Due to the top bar being clamped into the jaw of the MTS equipment, there was noise in the data
and the results were abrupt.
Figure 4.27 and 4.28 show the effects of bar size on the applied pullout load.

56
Figure 4.27 K-UHPC pullout 2-inch embedment length
Figure 4.28 K-UHPC pullout 2db embedment length
0
5000
10000
15000
20000
25000
30000
0 0.05 0.1 0.15 0.2 0.25
Load
(lb
s)
Free End Slip (in)
#8 Black Bar
#6 Black Bar
#4 Black Bar
#6 GFRP
NC Black Bar
NC GFRP
0
5000
10000
15000
20000
25000
30000
0 0.02 0.04 0.06 0.08 0.1 0.12 0.14 0.16 0.18 0.2
Load
(lb
s)
Free End Slip (in)
#8 Black Bar
#6 Black Bar
#4 Black Bar
#6 GFRP
NC #6 Black Bar
NC #6 GFRP

57
Comparing the load versus bar slip for the K-UHPC cubes, the larger bars saw a higher load for
the same value of slip. For example, the maximum load for #6 black reinforcing bar was
approximately 10,000 lb more than the maximum load for #4 black reinforcing bar. Figure 4.29
shows that the samples with a 2db embedment length had lower performance than that of the
samples with a 2 in. embedment length.
Figure 4.29 Load versus slip data for K-UHPC pullout cubes
For the #8 bars, the 2 in. and 2db development lengths were the same. Looking at the #6 black
bars shown in Figure 4.29, the bars with a 2 in. embedment length had a maximum load of 26
kips, where the 2db embedment length loading was only 16 kips. This was also shown in the #4
black bars and the #6 GFRP bars, where the 2 in. embedment length had a higher max loading
than the 2db embedment lengths. Overall, larger bars were shown to have higher loading
capacity, and, for a given bar size, the longer embedment lengths had higher capacities.
Comparing this trend to that shown by Saleem et al. (2013), the results are similar and have the
same general trend: the longer the embedment length the higher the loading.
Additionally, as shown from the steel reinforcing bar and the GFRP reinforcing bar in the K-
UHPC concrete, the GFRP bars had weaker performance than the steel bars. The maximum
loading value for the 2 in. embedment length bars was 16 kips for the GFRP bar; whereas, the
maximum value reached 26 kips for the steel reinforcing bar. One issue that causes this is the
lack of ribbing in the GFRP bars. The steel reinforcing bars have the typical ribs that allow them
to create a strong bond with the concrete; the GFRP bars are sand coated and lack that ribbing;
therefore, they are not able to create as strong of a bond.
0
5000
10000
15000
20000
25000
30000
0 0.05 0.1 0.15 0.2 0.25
Load
(lb
s)
Free End Slip (in)
#6 Black Bar - 2"#6B Black Bar- 2db#4 Black Bar - 2"#4 Black Bar - 2db#6 GFRP - 2"#6 GFRP - 2db#8 Black Bar - 2"
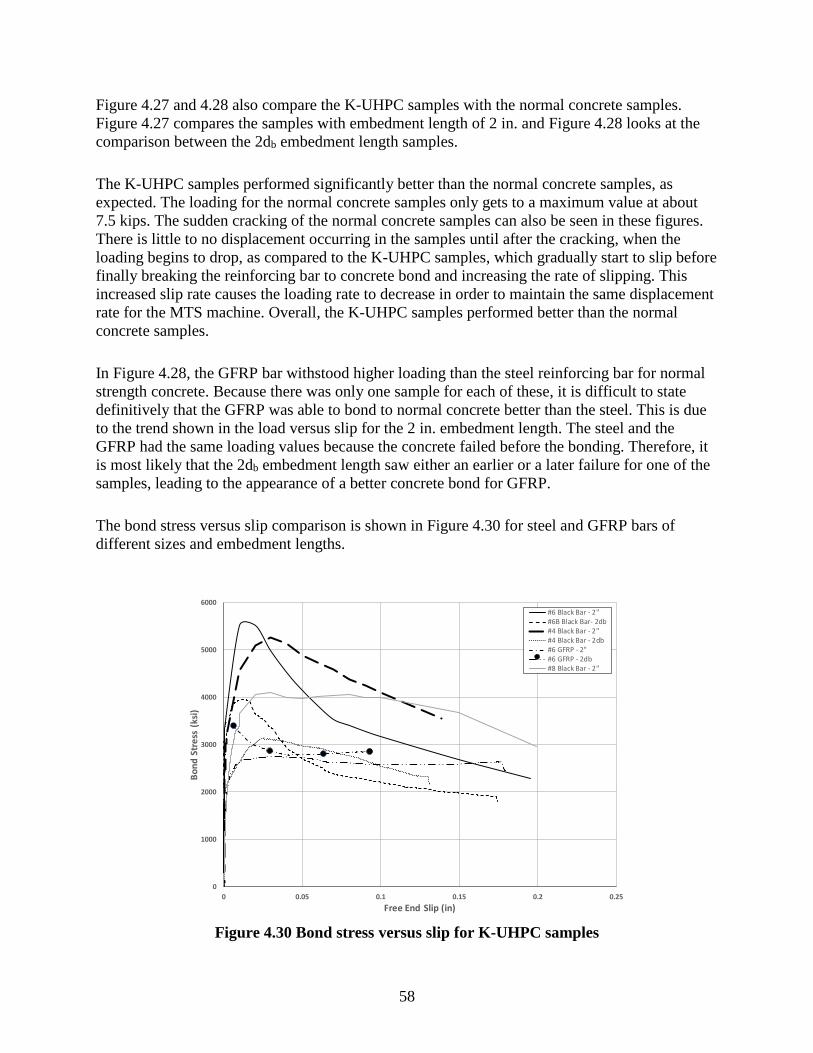
58
Figure 4.27 and 4.28 also compare the K-UHPC samples with the normal concrete samples.
Figure 4.27 compares the samples with embedment length of 2 in. and Figure 4.28 looks at the
comparison between the 2db embedment length samples.
The K-UHPC samples performed significantly better than the normal concrete samples, as
expected. The loading for the normal concrete samples only gets to a maximum value at about
7.5 kips. The sudden cracking of the normal concrete samples can also be seen in these figures.
There is little to no displacement occurring in the samples until after the cracking, when the
loading begins to drop, as compared to the K-UHPC samples, which gradually start to slip before
finally breaking the reinforcing bar to concrete bond and increasing the rate of slipping. This
increased slip rate causes the loading rate to decrease in order to maintain the same displacement
rate for the MTS machine. Overall, the K-UHPC samples performed better than the normal
concrete samples.
In Figure 4.28, the GFRP bar withstood higher loading than the steel reinforcing bar for normal
strength concrete. Because there was only one sample for each of these, it is difficult to state
definitively that the GFRP was able to bond to normal concrete better than the steel. This is due
to the trend shown in the load versus slip for the 2 in. embedment length. The steel and the
GFRP had the same loading values because the concrete failed before the bonding. Therefore, it
is most likely that the 2db embedment length saw either an earlier or a later failure for one of the
samples, leading to the appearance of a better concrete bond for GFRP.
The bond stress versus slip comparison is shown in Figure 4.30 for steel and GFRP bars of
different sizes and embedment lengths.
Figure 4.30 Bond stress versus slip for K-UHPC samples
0
1000
2000
3000
4000
5000
6000
0 0.05 0.1 0.15 0.2 0.25
Bo
nd
Str
ess
(ks
i)
Free End Slip (in)
#6 Black Bar - 2"#6B Black Bar- 2db#4 Black Bar - 2"#4 Black Bar - 2db#6 GFRP - 2"#6 GFRP - 2db#8 Black Bar - 2"

59
The trend for bond stress is the same as the load versus slip trend for the samples, because bond
stress is a function of the tensile load applied to the sample. Similar to the loading results, the
samples with a 2 in. embedment length had a higher bond stress than the 2db embedment length
samples.
Unlike the loading results, steel bars of different sizes experienced close stresses. This can be
seen by looking at the #4 bar average values. In the load versus slip graph in Figure 4.27, the #4
bar takes a significantly smaller load than the #6 steel bar. However, due to the small bar
diameter and, consequently, the small embedment length of the bar, the bond stress for the
sample is nearly the same as it was for the #6 steel bar. (Note that diameter and embedment
length are in the denominator of the bond stress equation.) The #8 bar is an outlier from the trend
that a bigger bar sees a smaller bond stress, although it’s still in the same range of the 2 in. and
2db samples of the other bar sizes. It should be noted that 2db was 2 in. for #8 bar.
In each of the comparisons made for the pullout cubes, load versus slip and bond stress versus
slip, there was a general trend presented for the amount of slip experienced by the bars before,
during, and after failure of the bonding. The larger #8 bar showed the most slip before failure.
The slip of the bar would steadily increase in a nearly linear fashion with the loading of the
sample. Figure 4.29 shows this clearly. The bar slips until it reaches 0.02 in. at a failure loading
of 25 kips. Then, the larger the bar, the more it slips during the moment of failure before the load
decreases. Again, in Figure 4.28 and Figure 4.29, the #8 bar sees roughly 0.02 in. displacement
before an initial decrease in loading; however, there is enough residual stress in the bond and the
concrete that it takes 0.08 in. of slip before the load on the sample really starts seeing a decrease.
The #6 black bar gets to a displacement around 0.005 in. before it fails from a load of 16 kips.
The sample then experiences 0.015 in. of displacement before loading decreases.
The same is true for most of the K-UHPC samples tested. The larger bars see larger deflections
at the time of failure and during failure before the load decreases. The smaller bars still see some
deflection during failure in the K-UHPC samples, though. In addition, the steel bars experienced
higher slip than the GFRP bars, regardless of the size of the bar. The #6 GFRP bar shows less
slip at failure than each of the steel bars. Figure 4.29 shows this trend well. The GFRP samples
have almost no slip at the time of failure. This is most likely due to the coating on the GFPR
bars.
4.2.4.2 Four-Point Bending Beams
TEST SAMPLES: The dimensions for the four-point flexure samples are shown in Figure 4.31.

60
Figure 4.31 Beam dimensions
The samples were 6 in. wide, 8 in. deep, and 24 in. long. Shear stirrups were provided at 4 in. on
center with a clear cover of 1.5 in. The flexural reinforcement for the beam was placed on the
tension side, centered 2 in. from the bottom of the beam. The embedment length for the beams
was chosen to be eight times the bar diameter (8db). This was taken from the FHWA study (Yuan
2014) as the recommended minimum embedment length for UHPC materials. To achieve the
required length, polyvinyl chloride (PVC) pipe was placed around the flexural reinforcement
such that the desired length was centered within the beam as shown in Figure 4.32.
Figure 4.32 Four-point beam loading diagram
TEST PROCEDURE: Testing for the four-point bending beams was done in a SATEC 400 HVL
high-capacity universal hydraulic testing machine running INSTRON PARTNER software. The

61
support span of the beams was 18 in. centered on the bottom of the beam, and the nose span was
6 in. centered on the top of the beam, as shown in Figure 4.33 and Figure 4.34.
Figure 4.33 Four-point bending setup
Figure 4.34 DCDT placement
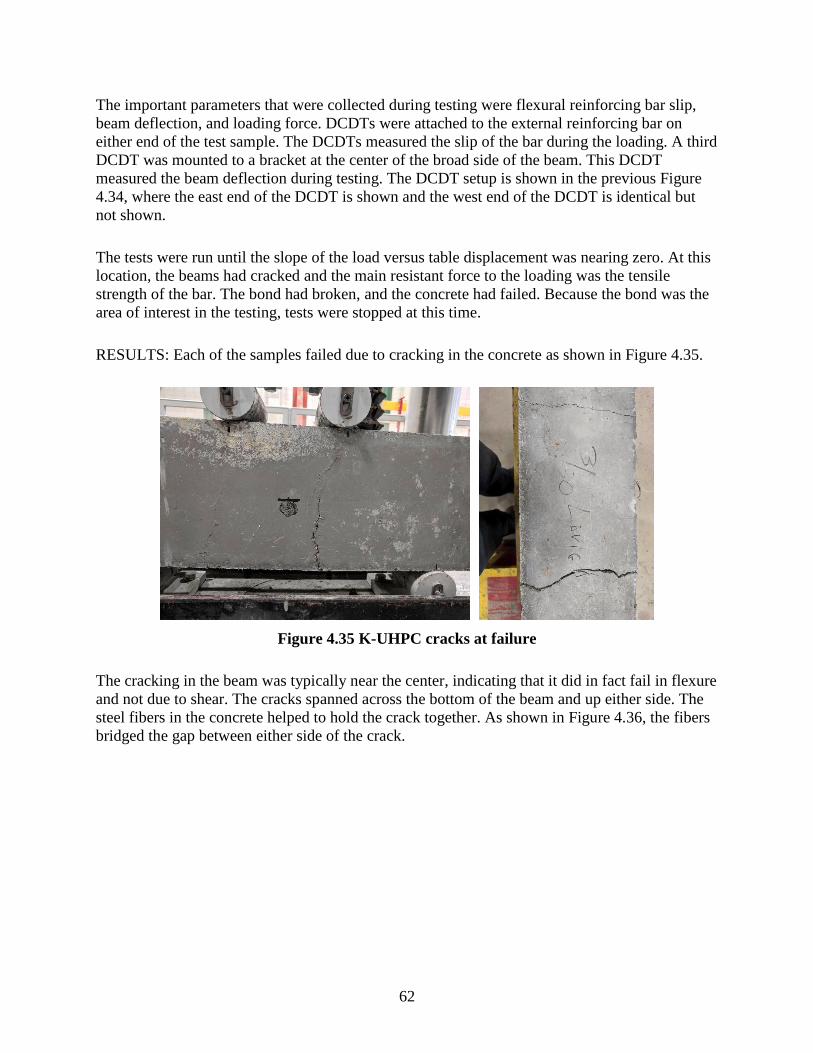
62
The important parameters that were collected during testing were flexural reinforcing bar slip,
beam deflection, and loading force. DCDTs were attached to the external reinforcing bar on
either end of the test sample. The DCDTs measured the slip of the bar during the loading. A third
DCDT was mounted to a bracket at the center of the broad side of the beam. This DCDT
measured the beam deflection during testing. The DCDT setup is shown in the previous Figure
4.34, where the east end of the DCDT is shown and the west end of the DCDT is identical but
not shown.
The tests were run until the slope of the load versus table displacement was nearing zero. At this
location, the beams had cracked and the main resistant force to the loading was the tensile
strength of the bar. The bond had broken, and the concrete had failed. Because the bond was the
area of interest in the testing, tests were stopped at this time.
RESULTS: Each of the samples failed due to cracking in the concrete as shown in Figure 4.35.
Figure 4.35 K-UHPC cracks at failure
The cracking in the beam was typically near the center, indicating that it did in fact fail in flexure
and not due to shear. The cracks spanned across the bottom of the beam and up either side. The
steel fibers in the concrete helped to hold the crack together. As shown in Figure 4.36, the fibers
bridged the gap between either side of the crack.

63
Figure 4.36 Steel fibers reinforcing concrete crack in K-UHPC
The cracks in the beams never got very large as the tests were stopped before that point. When
the slope of the load versus displacement line began reaching zero, the concrete had failed, and
the tensile strength of the bar was the only thing contributing to resisting the load being applied.
It was at this point that the tests were stopped to avoid yielding the tension reinforcement.
Load, deflection, and slip were the main parameters that were collected during the beam flexure
tests. Load versus center deflection for the K-UHPC samples is shown in Figure 4.37.
Figure 4.37 Load versus deflection K-UHPC beams
0
5000
10000
15000
20000
25000
30000
35000
40000
45000
0 0.01 0.02 0.03 0.04 0.05 0.06 0.07 0.08 0.09 0.1
Load
(lb
s)
Center Deflection (in)
#8 Black Bar
#6 Black Bar
#4 Black Bar
#6 GFRP

64
Ultimately, there wasn’t a large difference between any of the beams. All of the results were
within 20% of each other on average. It is noticeable that the failure mode of the beams was slow
cracking. The load rate for the samples was a decreasing positive slope, which showed that the
K-UHPC did not fail suddenly like normal concrete. The GFRP sample of normal strength
concrete showed that the beam deflected slowly until it cracked, at which point the loading rate
became zero; however, the beam was still deflecting (see Figure 4.38).
Figure 4.38 K-UHPC and conventional concrete reinforced with GFRP and steel rebar
This is the point at which the tests were stopped, to avoid yielding of the reinforcing steel bar.
The #6 black bar and GFRP bar performed about the same, each taking a maximum load of
roughly 32 kips. Unlike the pullout testing, the flexural testing had shear and compression
reinforcement within the samples. The intention of the testing was to see the flexural behavior of
the bonding between the tensile reinforcement and the concrete. To avoid any shear or
compressive cracking that may occur, additional steel reinforcement was provided. This may be
the cause of the increased performance of the smaller bars. Due to all the beams being reinforced
with the same shear and compressive reinforcement, the only change in the samples was the size
of the bar.
The previous Figure 4.38 shows the comparison between the K-UHPC and normal concrete for
beams reinforced with #6 black bar and GFRP bar. In the flexural samples, the steel and GFRP
bars performed similarly; however, for both the K-UHPC and normal strength concrete, the
GFRP bar performed slightly better on average. The difference was not as large within the K-
UHPC beams as it was in the normal concrete, but it is there. This marginal difference could be
the cause of errors in placing the PVC pipe within the beam or it could be due to the actual
0
5000
10000
15000
20000
25000
30000
35000
40000
0 0.01 0.02 0.03 0.04 0.05 0.06
Load
(lb
s)
Center Deflection (in)
#6 Black Bar
#6 GFRP
NC #6 Black Bar
NC #6 GFRP
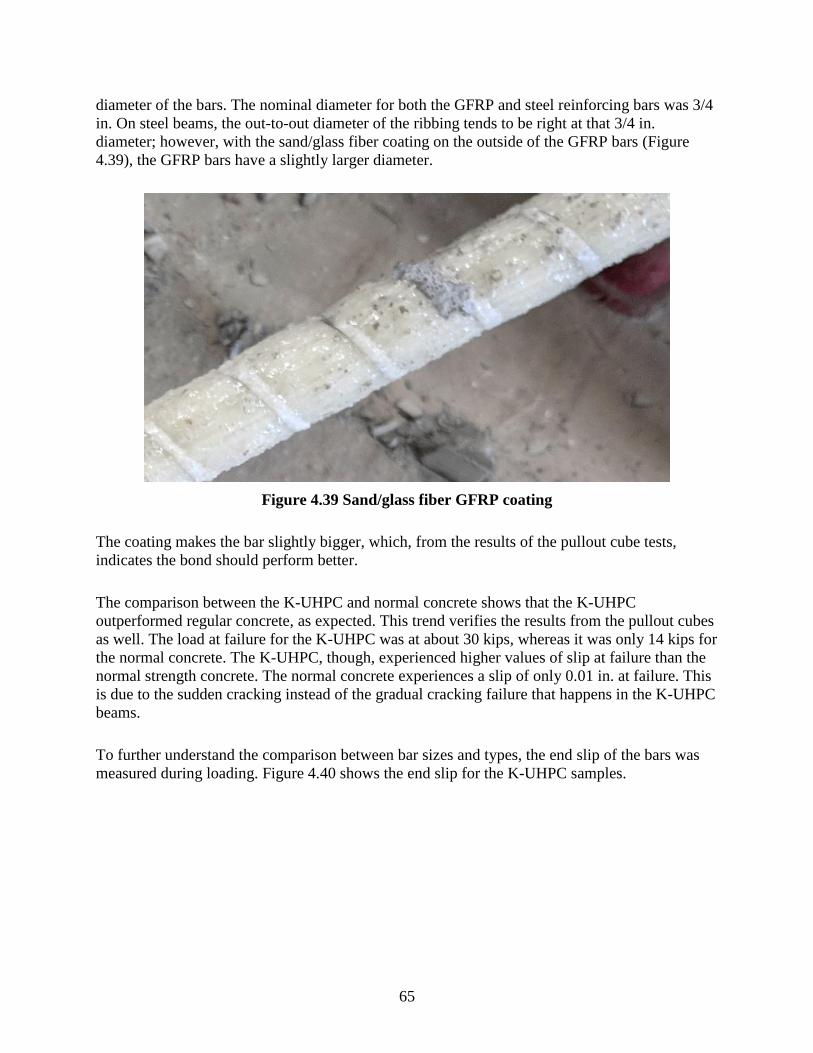
65
diameter of the bars. The nominal diameter for both the GFRP and steel reinforcing bars was 3/4
in. On steel beams, the out-to-out diameter of the ribbing tends to be right at that 3/4 in.
diameter; however, with the sand/glass fiber coating on the outside of the GFRP bars (Figure
4.39), the GFRP bars have a slightly larger diameter.
Figure 4.39 Sand/glass fiber GFRP coating
The coating makes the bar slightly bigger, which, from the results of the pullout cube tests,
indicates the bond should perform better.
The comparison between the K-UHPC and normal concrete shows that the K-UHPC
outperformed regular concrete, as expected. This trend verifies the results from the pullout cubes
as well. The load at failure for the K-UHPC was at about 30 kips, whereas it was only 14 kips for
the normal concrete. The K-UHPC, though, experienced higher values of slip at failure than the
normal strength concrete. The normal concrete experiences a slip of only 0.01 in. at failure. This
is due to the sudden cracking instead of the gradual cracking failure that happens in the K-UHPC
beams.
To further understand the comparison between bar sizes and types, the end slip of the bars was
measured during loading. Figure 4.40 shows the end slip for the K-UHPC samples.
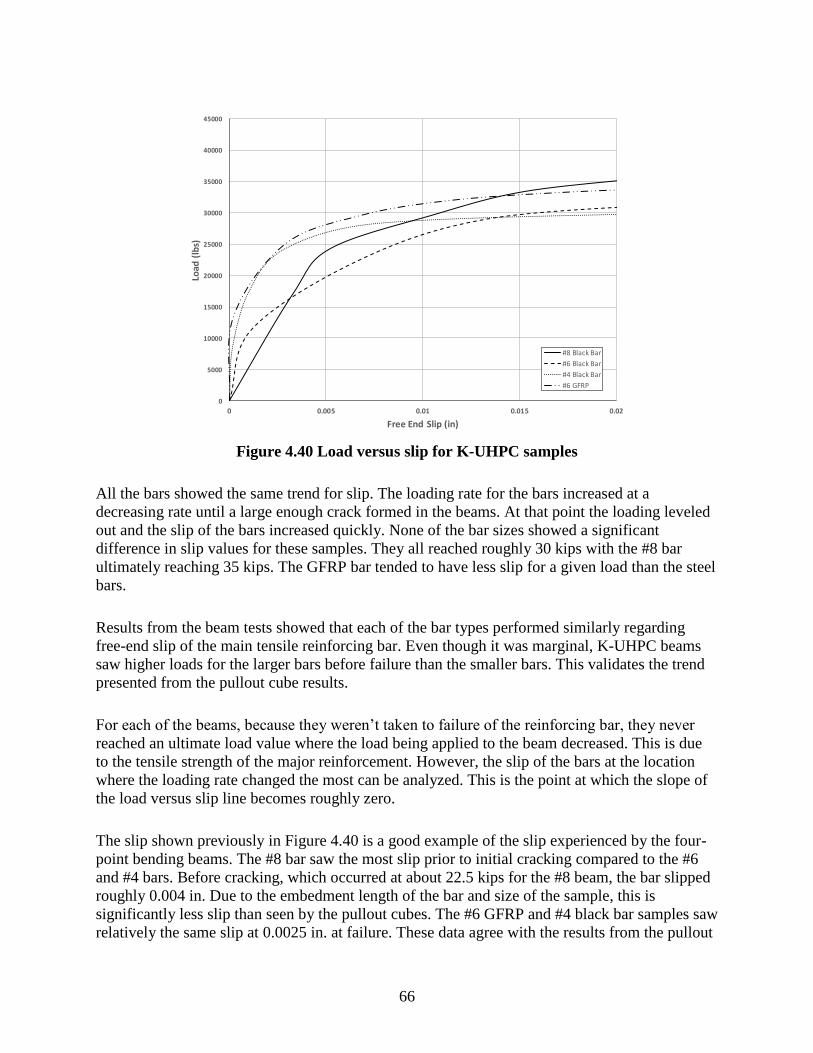
66
Figure 4.40 Load versus slip for K-UHPC samples
All the bars showed the same trend for slip. The loading rate for the bars increased at a
decreasing rate until a large enough crack formed in the beams. At that point the loading leveled
out and the slip of the bars increased quickly. None of the bar sizes showed a significant
difference in slip values for these samples. They all reached roughly 30 kips with the #8 bar
ultimately reaching 35 kips. The GFRP bar tended to have less slip for a given load than the steel
bars.
Results from the beam tests showed that each of the bar types performed similarly regarding
free-end slip of the main tensile reinforcing bar. Even though it was marginal, K-UHPC beams
saw higher loads for the larger bars before failure than the smaller bars. This validates the trend
presented from the pullout cube results.
For each of the beams, because they weren’t taken to failure of the reinforcing bar, they never
reached an ultimate load value where the load being applied to the beam decreased. This is due
to the tensile strength of the major reinforcement. However, the slip of the bars at the location
where the loading rate changed the most can be analyzed. This is the point at which the slope of
the load versus slip line becomes roughly zero.
The slip shown previously in Figure 4.40 is a good example of the slip experienced by the four-
point bending beams. The #8 bar saw the most slip prior to initial cracking compared to the #6
and #4 bars. Before cracking, which occurred at about 22.5 kips for the #8 beam, the bar slipped
roughly 0.004 in. Due to the embedment length of the bar and size of the sample, this is
significantly less slip than seen by the pullout cubes. The #6 GFRP and #4 black bar samples saw
relatively the same slip at 0.0025 in. at failure. These data agree with the results from the pullout
0
5000
10000
15000
20000
25000
30000
35000
40000
45000
0 0.005 0.01 0.015 0.02
Load
(lb
s)
Free End Slip (in)
#8 Black Bar
#6 Black Bar
#4 Black Bar
#6 GFRP

67
cubes and verify that the larger bars ultimately see more slip because they experience higher
loads. The bars are larger, and, therefore, it takes longer for the beam to see the same amount of
deflection as the smaller bars. During that longer test duration, the bars see larger slip. The bond
between the bar and the concrete fails, but the beam and the bar still have residual strength that
withstands the force being applied. Because the bond has already failed, the bar is free to slip
during this extended loading, and, therefore, the larger bars see larger slips given they are tested
for longer periods of time.
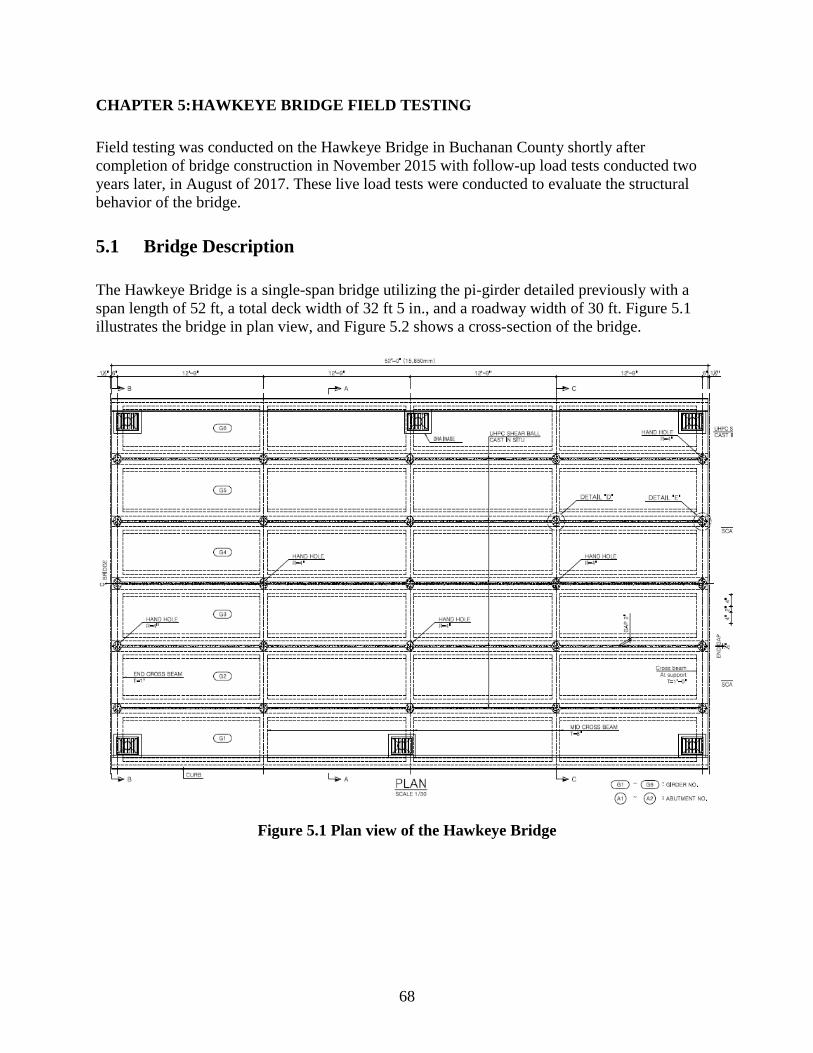
68
CHAPTER 5: HAWKEYE BRIDGE FIELD TESTING
Field testing was conducted on the Hawkeye Bridge in Buchanan County shortly after
completion of bridge construction in November 2015 with follow-up load tests conducted two
years later, in August of 2017. These live load tests were conducted to evaluate the structural
behavior of the bridge.
5.1 Bridge Description
The Hawkeye Bridge is a single-span bridge utilizing the pi-girder detailed previously with a
span length of 52 ft, a total deck width of 32 ft 5 in., and a roadway width of 30 ft. Figure 5.1
illustrates the bridge in plan view, and Figure 5.2 shows a cross-section of the bridge.
Figure 5.1 Plan view of the Hawkeye Bridge

69
Figure5.2 Cross-section of the Hawkeye Bridge
5.2 Field Testing Details
Instrumentation
Two field live load tests were conducted to measure the bridge behavior. The initial load test was
conducted in 2015 after construction was completed and involved installation of 12 strain gauges
and five displacement transducers on the underside of the pi-girders as shown in Figure 5.3.
Figure 5.3 Instrumentation detail for 2015 live load testing
Instrumentation for the load test conducted in 2017 replicated the initial testing and is illustrated
in Figure 5.4.
Figure 5.4 Instrumentation detail for 2017 live load testing
As shown, a strain transducer was placed on the bottom flange of each leg of each girder at
midspan. In addition, displacement transducers were installed at each girder-to-girder interface at
midpsan to measure differential displacement of the adjacent girders.
2969 2934 2962
d011
4820 4328
d364
4780 4814
d361
6079 2970
d360
2947 2964
d362
4815
Looking South9999 - strain transducer designation
d999 - displacement transducer designation
4820 4721 4829
d387
2947 4821
d360
4815 4803
d361
6084 4825
d362
4692 4785
d364
4819
Looking South9999 - strain transducer designation
d999 - displacement transducer designation
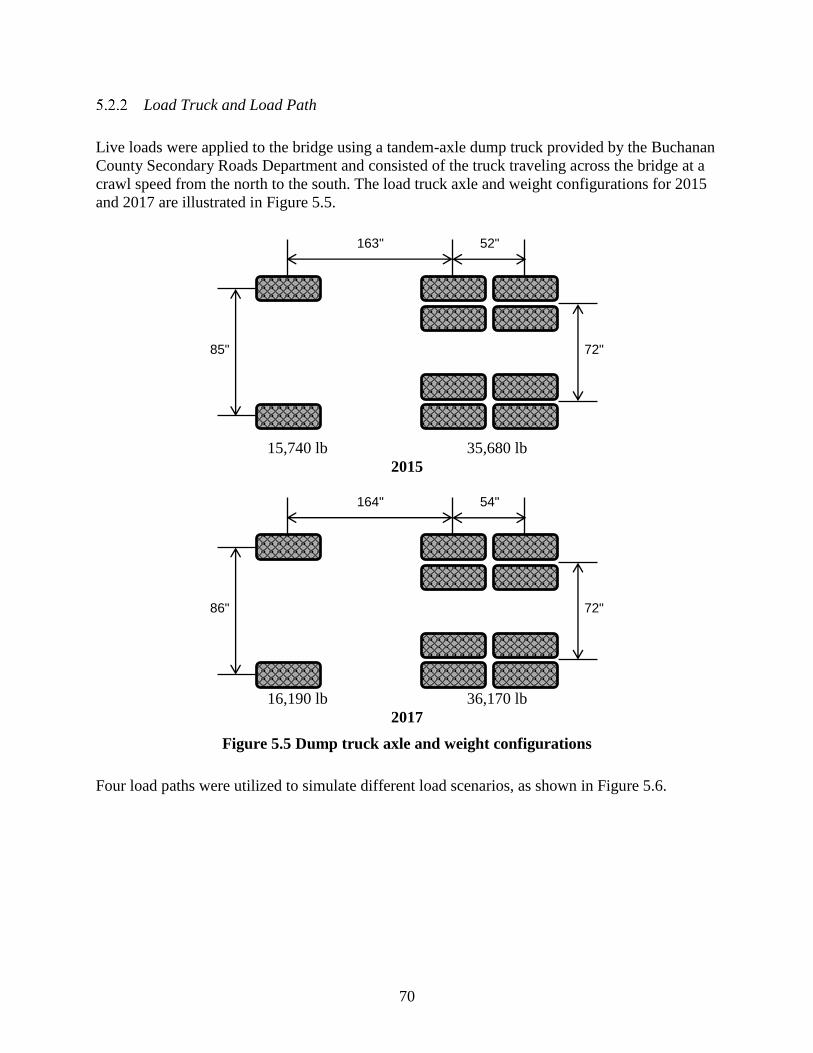
70
Load Truck and Load Path
Live loads were applied to the bridge using a tandem-axle dump truck provided by the Buchanan
County Secondary Roads Department and consisted of the truck traveling across the bridge at a
crawl speed from the north to the south. The load truck axle and weight configurations for 2015
and 2017 are illustrated in Figure 5.5.
15,740 lb 35,680 lb
2015
16,190 lb 36,170 lb
2017
Figure 5.5 Dump truck axle and weight configurations
Four load paths were utilized to simulate different load scenarios, as shown in Figure 5.6.
163" 52"
72" 85"
164" 54"
72" 86"
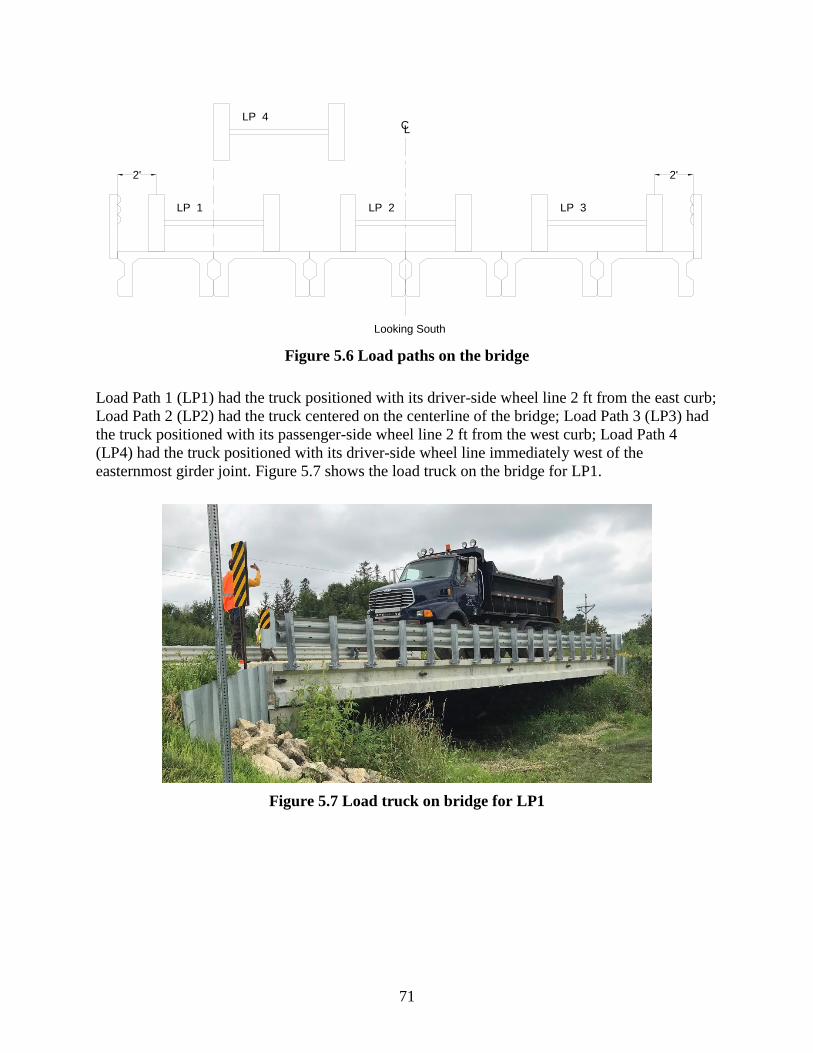
71
Figure 5.6 Load paths on the bridge
Load Path 1 (LP1) had the truck positioned with its driver-side wheel line 2 ft from the east curb;
Load Path 2 (LP2) had the truck centered on the centerline of the bridge; Load Path 3 (LP3) had
the truck positioned with its passenger-side wheel line 2 ft from the west curb; Load Path 4
(LP4) had the truck positioned with its driver-side wheel line immediately west of the
easternmost girder joint. Figure 5.7 shows the load truck on the bridge for LP1.
Figure 5.7 Load truck on bridge for LP1
Looking South
LP 3LP 2
LP 4
LP 1
2'2'
LC

72
5.3 Analysis of Field Test Data
The focus of the load testing for the Hawkeye Bridge was to evaluate two key structural
responses of the bridge:
Transverse load distribution
Localized slip, or differential displacement, between adjacent girders
To evaluate the transverse load distribution of the bridge, distribution factors were calculated
from the measured strains at midspan from the live load test. Figures 5.8 through 5.11 illustrate
the superimposed live load transverse distribution from 2015 and 2017 for all four load paths.
Figure 5.8. Transverse distribution, Load Path 1, 2015 and 2017
-0.02
0.00
0.02
0.04
0.06
0.08
0.10
0.12
0.14
0.16
0.18
0.20
0.22
0.24
1e 1w 2e 2w 3e 4w 4e 4w 5e 5w 6e 6w
Dis
trib
utio
n Fa
ctor
, %
Gage Location - Looking South
2015 2017
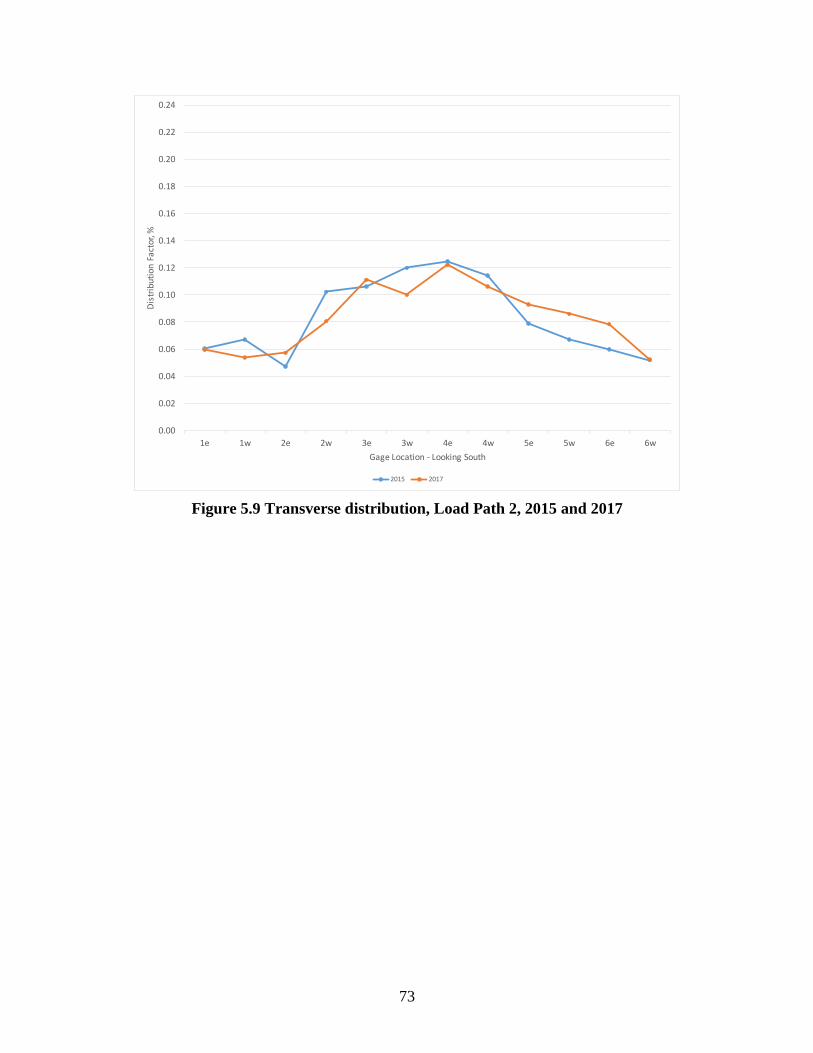
73
Figure 5.9 Transverse distribution, Load Path 2, 2015 and 2017
0.00
0.02
0.04
0.06
0.08
0.10
0.12
0.14
0.16
0.18
0.20
0.22
0.24
1e 1w 2e 2w 3e 3w 4e 4w 5e 5w 6e 6w
Dis
trib
utio
n Fa
ctor
, %
Gage Location - Looking South
2015 2017
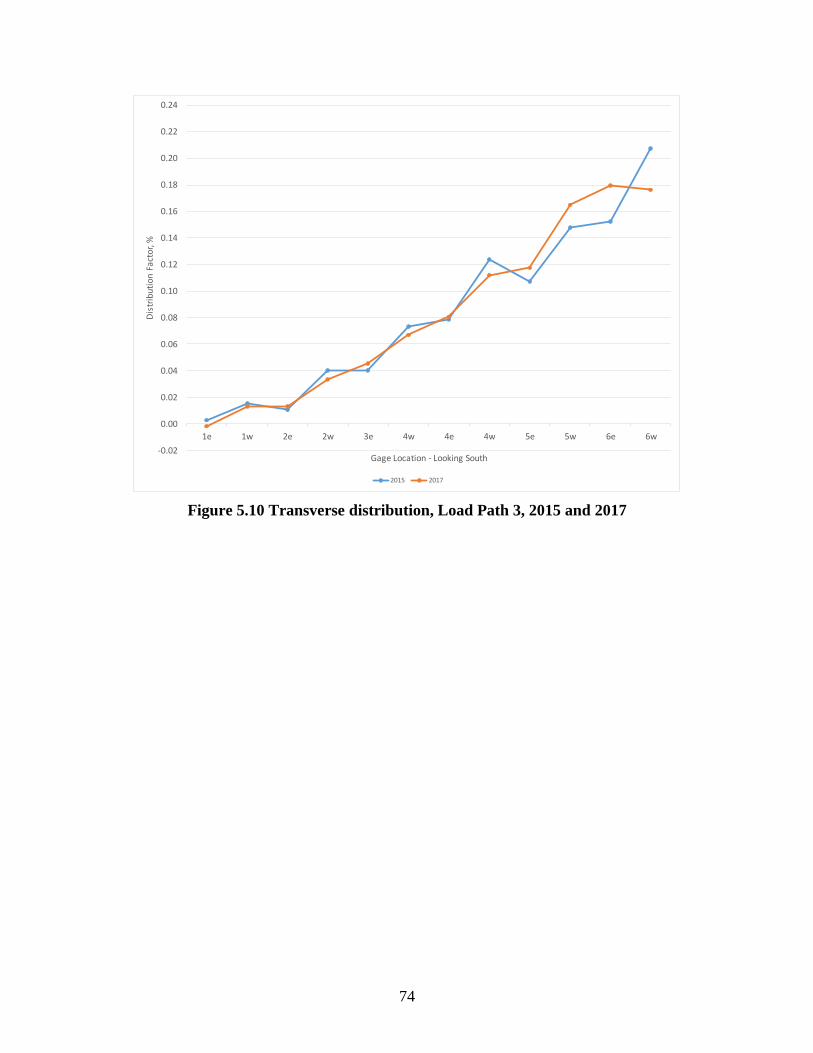
74
Figure 5.10 Transverse distribution, Load Path 3, 2015 and 2017
-0.02
0.00
0.02
0.04
0.06
0.08
0.10
0.12
0.14
0.16
0.18
0.20
0.22
0.24
1e 1w 2e 2w 3e 4w 4e 4w 5e 5w 6e 6w
Dis
trib
uti
on
Fac
tor,
%
Gage Location - Looking South
2015 2017
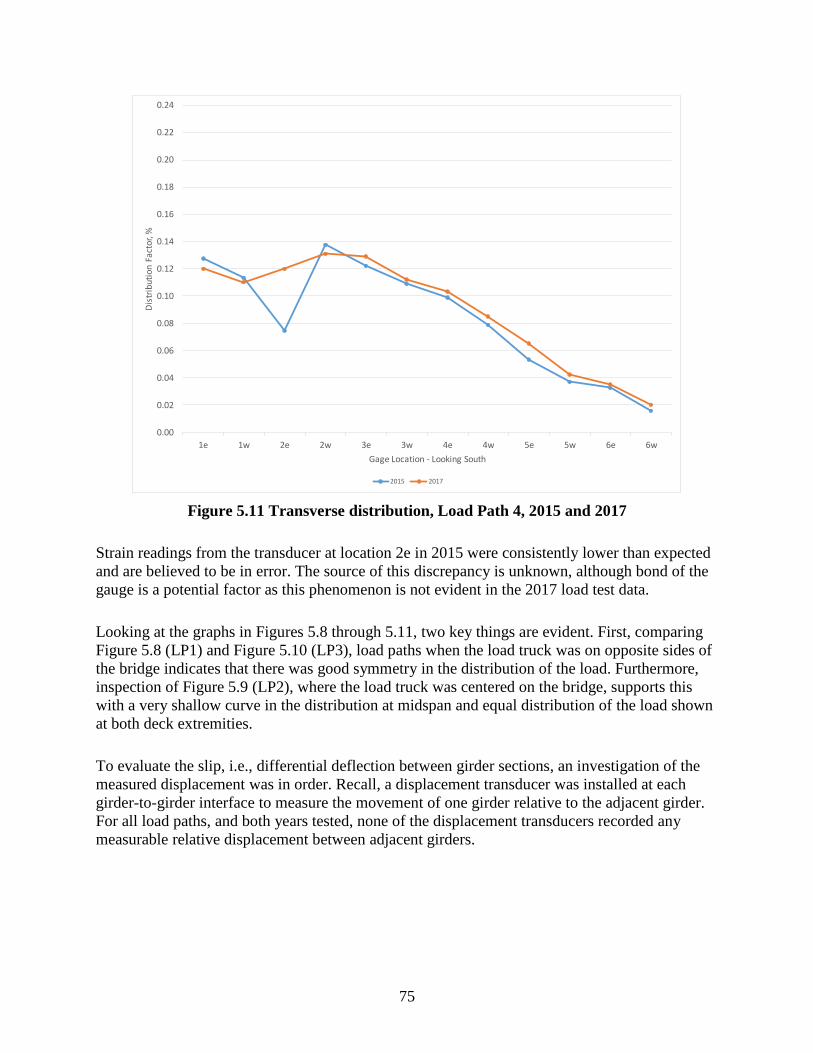
75
Figure 5.11 Transverse distribution, Load Path 4, 2015 and 2017
Strain readings from the transducer at location 2e in 2015 were consistently lower than expected
and are believed to be in error. The source of this discrepancy is unknown, although bond of the
gauge is a potential factor as this phenomenon is not evident in the 2017 load test data.
Looking at the graphs in Figures 5.8 through 5.11, two key things are evident. First, comparing
Figure 5.8 (LP1) and Figure 5.10 (LP3), load paths when the load truck was on opposite sides of
the bridge indicates that there was good symmetry in the distribution of the load. Furthermore,
inspection of Figure 5.9 (LP2), where the load truck was centered on the bridge, supports this
with a very shallow curve in the distribution at midspan and equal distribution of the load shown
at both deck extremities.
To evaluate the slip, i.e., differential deflection between girder sections, an investigation of the
measured displacement was in order. Recall, a displacement transducer was installed at each
girder-to-girder interface to measure the movement of one girder relative to the adjacent girder.
For all load paths, and both years tested, none of the displacement transducers recorded any
measurable relative displacement between adjacent girders.
0.00
0.02
0.04
0.06
0.08
0.10
0.12
0.14
0.16
0.18
0.20
0.22
0.24
1e 1w 2e 2w 3e 3w 4e 4w 5e 5w 6e 6w
Dis
trib
utio
n Fa
ctor
, %
Gage Location - Looking South
2015 2017

76
CHAPTER 6: SUMMARY AND CONCLUSIONS
6.1 Summary
UHPC is a relatively new development that displays material properties superior to normal
concrete. The applications of UHPC for construction of bridges and a brief introduction on the
development of UHPC were discussed in Chapter 1. Different types of UHPC, especially
focusing on K-UHPC, their main properties, and applications to bridge construction (in the US)
were discussed in Chapter 1 as well.
A brief review of literature in Chapter 2 provided information about the enhanced material and
durability properties displayed by K-UHPC.
Details on the construction of the Hawkeye Bridge and casting of field samples were discussed
in Chapter 3. This included the results of testing the field samples performed in the Iowa State
University laboratory.
Chapter 4 summarized the mixing and casting of K-UHPC samples at the laboratory. Details of
the different tests conducted and the results obtained were also presented in Chapter 4. The tests
performed determined the compressive strength, shrinkage, bonding, and durability properties of
samples and provided a comparison between properties of field-cast and laboratory-cast samples.
Chapter 5 covered the live load field tests that were conducted on the Hawkeye Bridge in
Buchanan County shortly after completion of bridge construction in November 2015 with a
follow-up load test two years later, in August 2017, to evaluate the structural behavior of the
bridge.
6.2 Conclusions
The following conclusions were made through this research project, which can be further applied
to the use of UHPC for bridge construction in US:
Overall, the test results from the samples collected from the field proved development of
adequate compressive strength in K-UHPC. The compressive strength of samples collected at
different stages reached average values of 18 and 20 ksi after 28 and 60 days, respectively,
which can be considered adequate, particularly by considering the use of local materials
(cement and fine aggregate) in the mixes.
The samples collected from the field showed promising durability performance in terms of
resistance against chloride penetration and freezing and thawing cycles. The penetration of
chloride ions measured by the surface resistivity test and durability loss in the frost resistance
test were negligible.

77
The compressive strength results of the samples cast in the laboratory were almost similar to
those obtained from the field samples. The results indicated that K-UHPC can develop
adequate strength with the use of local cement and fine aggregates. The consistent data points
proved the replicability of the reported results (in both laboratory and field conditions).
The shrinkage of K-UHPC cast in the laboratory was in the range of 1,200 to 1,500
microstrain, which was slightly higher than the total shrinkage reported in the literature. The
creep coefficient was 0.35, which was in the typical range reported in the literature.
The K-UHPC showed proper bonding to both steel and GFRP reinforcement. The bonding of
K-UHPC with these two types of reinforcement was considerably superior to the bonding
reported for normal strength concrete.
From the load tests, for all the load paths and both years tested, none of the displacement
transducers recorded any measurable relative displacement between adjacent girders.
Reviewing the load test results indicated satisfactory structural performance of the Hawkeye
Bridge at the time of construction and after two years.


79
REFERENCES
Buyukozturk, O. and D. Lau. 2007. High Performance Concrete: Fundamentals and
Applications. Massachusetts Institute of Technology, Cambridge, MA.
Degen, B. E. 2006.Shear Design and Behavior of Ultra High Performance Concrete. MS thesis.
Iowa State University, Ames, IA.
Graybeal, B. A. 2006. Material Property Characterization of Ultra-High Performance Concrete,
FHWA-HRT-06-103. Federal Highway Administration, Office of Infrastructure Research
and Development, McLean, VA.
Gunes, O., S. Yesilmen, B. Gunes, and F.-J. Ulm. 2012. Use of UHPC in Bridge Structures:
Material Modeling and Design, Advances in Materials Science and Engineering, Vol.
2012, pp. 1–12.
Joh, C. and G. Koh. n.d. Super Bridge 200-Construction of UHPC Highway Bridges. Korea
Institute of Civil Engineering and Building Technology, Goyang, Gyeonggi-do, South
Korea.
Joh, C., I. Kwahk, J. W. Lee, and B.-S. Kim. 2015. Structural Behavior and Design Guidelines of
K-UHPC. First International Symposium of Asian Concrete Federation on UHPC,
October 7, Klokata, India.
Keierleber, B., A. Davis, and H. D. Lee. 2015. Iowa County Bridge Constructed of K-UHPC.
Accelerated Bridge Construction University Transportation Center, Florida International
University, Miami, FL. Pdf of webinar presentation at https://abc-utc.fiu.edu/wp-
content/uploads/sites/52/2016/04/20151130_K-UHPC_2.pdf.
Kim, H. 2016. Design and Field Construction of Hawkeye Bridge Using Ultra High Performance
Concrete for Accelerated Bridge Construction. MS thesis. University of Iowa, Iowa City,
IA.
Lee, H. D., H. Kim, and M. Gazdziak. 2014. Evaluation of KICT’s UHPC Technology in SUPER
Bridge at Laboratory for Advanced Construction Technology (LACT). University of
Iowa, Iowa City, IA.
Park, J. S., Y. J. Kim, J.-R. Cho, and S.-J. Jeon. 2015. Early-Age Strength of Ultra-High
Performance Concrete in Various Curing Conditions, Materials, Vol. 8, No. 8, pp. 5537–
5553.
Perry, V. H. 2015. Case Studies on Innovative Applications and Challenges of Introducing
Breakthrough Technologies (UHPC) in the Construction Industry. First International
Symposium of Asian Concrete Federation on UHPC, October 7, Klokata, India.
Rouse, J. M., T. J. Wipf, B. Phares, F. Fanous, and O. Berg. 2011. Design, Construction, and
Field Testing of an Ultra High Performance Concrete Pi-Girder Bridge. Bridge
Engineering Center, Iowa State University, Ames, IA.
Saleem, M. A., A. Mirmiran, J. Xia, and K. Mackie. 2013. Embedment Length of High-Strength
Steel Rebar in Ultrahigh Performance Concrete, Journal of Materials in Civil
Engineering, Vol. 25, No. 8, pp. 991–998.
Skazlic, M., D. Bjegovic, and M. Jambresic. 2014. Development in High Performance Concrete
Technology. University of Zagreb, Croatia.
Wipf, T. J., B. M. Phares, S. Sritharan, B. E. Degen, and M. T. Giesmann. 2009. Design and
Evaluation of a Single-span Bridge Using Ultra-High Performance Concrete. Bridge
Engineering Center, Iowa State University, Ames, IA.

80
Yuan, J. 2014. Bond Behavior of Reinforcing Steel in Ultra-High Performance Concrete.
FHWA-HRT-14-089. Federal Highway Administration, McLean, VA.


THE INSTITUTE FOR TRANSPORTATION IS THE FOCAL POINT FOR TRANSPORTATION AT IOWA STATE UNIVERSITY.
InTrans centers and programs perform transportation research and provide technology transfer services for government agencies and private companies;
InTrans contributes to ISU’s educational programs for transportation students and provides K–12 outreach; and
InTrans conducts local, regional, and national transportation services and continuing education programs.
Visit InTrans.iastate.edu for color pdfs of this and other research reports.


![Rolling Fatigue Test of Large-Sized UHPC Member for Cable ... · tion of UHPC to cable stayed bridge [1-4]. As part of this project, SuperBridge800, a UHPC cable stayed bridge with](https://img.dokumen.tips/doc/110x75/5ebf1c7878e2f9654370ef61/rolling-fatigue-test-of-large-sized-uhpc-member-for-cable-tion-of-uhpc-to-cable.jpg)