Embed Size (px)
Citation preview
U.S. Department of Energy Energy Efficiency and Renewable Energy Federal Energy Management Program
United States Environmental Protection Agency
L a b o r a t o r i e s f o r t h e 2 1 s t C e n t u r y :C a s e S t u d i e s
Patri
ck C
orke
ry/P
IX14
916
Case Study IndexLaboratory Type❑ Wet lab❑ Dry lab❑ Clean roomConstruction Type❑ New❑ RetrofitType of Operation❑ Research/development❑ Manufacturing❑ Teaching❑ Chemistry❑ Biology❑ ElectronicsService Option❑ Suspended ceiling❑ Utility service corridor❑ Interstitial spaceFeatured Technologies❑ Fume hoods❑ Controls❑ Mechanical systems❑ Electrical loads❑ Water conservation❑ Renewables❑ Sustainable design/
planning❑ On-site generation❑ Daylighting❑ Building commissioningOther Topics❑ Diversity factor❑ Carbon trading❑ Selling concepts to
stakeholders❑ Design processLEED Rating❑ Platinum❑ Gold❑ Silver❑ Certified
✔
✔
✔
✔
✔
✔
✔
✔
✔
✔
✔
✔
✔
✔
✔
✔
✔Introduct ion
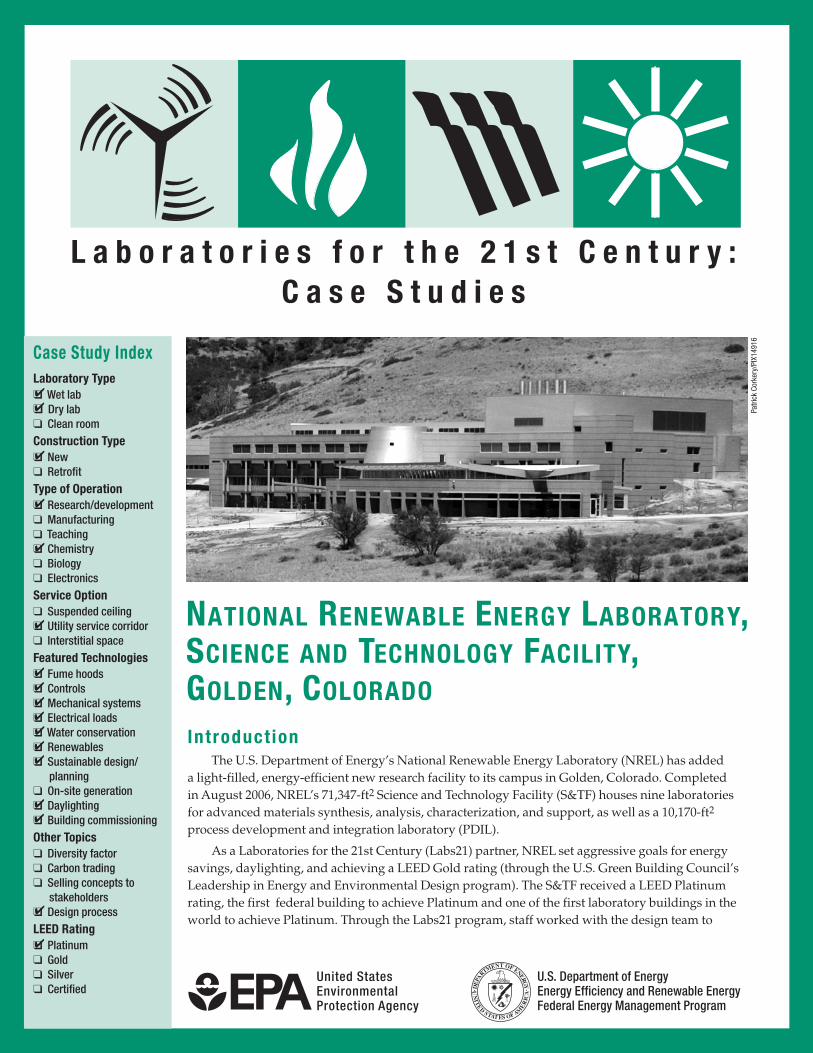
The U.S. Department of Energy’s National Renewable Energy Laboratory (NREL) has added a light-filled, energy-efficient new research facility to its campus in Golden, Colorado. Completed in August 2006, NREL’s 71,347-ft2 Science and Technology Facility (S&TF) houses nine laboratories for advanced materials synthesis, analysis, characterization, and support, as well as a 10,170-ft2 process development and integration laboratory (PDIL).
As a Laboratories for the 21st Century (Labs21) partner, NREL set aggressive goals for energy savings, daylighting, and achieving a LEED Gold rating (through the U.S. Green Building Council’s Leadership in Energy and Environmental Design program). The S&TF received a LEED Platinum rating, the first federal building to achieve Platinum and one of the first laboratory buildings in the world to achieve Platinum. Through the Labs21 program, staff worked with the design team to
NatioNal ReNewable eNeRgy laboRatoRy, ScieNce aNd techNology Facility, goldeN, coloRado
L A B S F O R T H E 2 1 S T C E N T U R Y2
analyze, design, review, and implement the energy-saving features highlighted in this case study. Staff also coordi-nated documentation for the LEED submittal, oversaw an analysis to validate the project’s energy simulation, and prepared documentation to showcase the project through design awards and other venues.
The S&TF laboratories are designed to accelerate renewable energy process and manufacturing research for both near-term technologies, such as thin-film solar cells, and next-generation technologies, such as organic and nanostructured solar cells. Energy costs for this building are estimated through computer simulation to be 41% lower than those of a comparable facility designed to American Society of Heating, Refrigerating, and Air-Conditioning Engineers (ASHRAE) standard 90.1 (1999), for an estimated savings of $96,000 per year. The estimated annual energy savings is 10,648 million Btu. The cost of the Labs21 contribution to the project was $67,000 over 3 years. Given that the Labs21 pro-gram had a significant influence on the outcome of this project, we estimate that at least 30% of the expected annual savings can be attributed to Labs21 support. This represents a 2.3-year simple payback. Energy- saving features include these:
• Variable-air-volumesupplyandexhaustsystemsfor all laboratory and office areas
• Fan-coilunitsinlaboratoryspaces
• Low-flowchemicalhoodsandlaminar-flowfumehoods
• Stagedexhaustfansbroughtonaccordingtobuildingexhaust needs
• Exhaustairenergyrecoveryandprocesscoolingwaterenergy recovery
• Indirect/directevaporativecooling
• Expansionofthecentralplantintheadjacentbuildingwith a high-efficiency chiller and boiler to serve the S&TF load
• Underfloorair-distributionsystemintheofficeareawith demand-based ventilation controls using carbon dioxide detection and monitoring
• 100%daylightinginofficeareas,gooddaylightinginlaboratories, and lighting control throughout.
This case study is one in a series produced by Labs21, a joint program of the U.S. Environmental Protection Agency (EPA) and the U.S. Department of Energy (DOE) geared toward architects and engineers who are familiar with laboratory buildings. This program encourages the design, construction, and operation of safe, sustainable, high-performance laboratories.
Project Descr ipt ion The S&TF is a two-story, 71,347-gross ft2 (44,800 net
ft2) laboratory building completed in 2006 at a total constructioncostof$22.7million($318/grossft2) and a total project cost of $29.8 million. The architect and the mechanical, electrical, plumbing and fire protection engi-neers were the SmithGroup of Phoenix, Arizona. Civil Engineering was provided by Martin-Martin; landscape design was by Wenk Landscape Architects. The structural engineer was Paul Koehler Leffler, and the general con-tractor was M.A. Mortenson.
The ground floor includes laboratories, office space, and a lobby. The second floor houses laboratories and includes the PDIL. An elevated bridge connects the second floor service corridor to the adjacent 117,000-gross ft2 Solar Energy Research Facility (SERF). The third level houses the bulk of the S&TF’s mechanical support functions, including laboratory exhaust fans. The exterior consists primarily of precast concrete panels and metal panels at the entry that complement the exterior of the adjacent building.
Seven “interaction spaces” encourage informal dis-cussions among researchers. Each space features seating, a white board, access to a local area computer network, and views to open space outside.
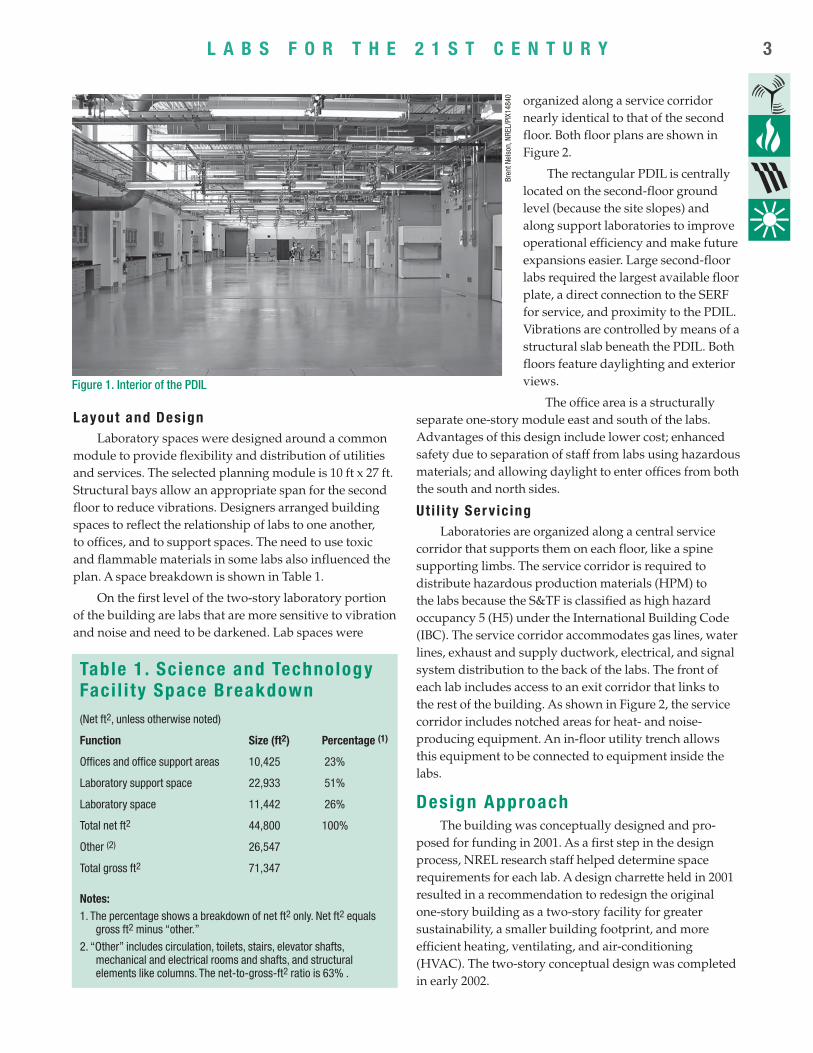
The building’s centerpiece is the 10,170-ft2 PDIL. It was designed to accommodate a new class of deposi-tion, processing, analysis, and characterization tools (see Figure 1). These flexible tools can be integrated into proto-type processes for developing thin-film and nanoscale devices and low-cost, high-throughput manufacturing processes that are not yet available in the United States. The processes can be applied to thin-film photovoltaics (PV),hydrogennanostructuresforproductionandstor-age, thin-film window coatings, and solid-state lighting. The intent is to reduce the risk and cost to industry associated with these processes.
The PDIL allows researchers to move samples between large tools under vacuum, which prevents the samples from coming in contact with airborne contami-nants. Researchers can bring samples under vacuum to the lab in mobile transport pods.
. . . . . . . . .“I applaud the thinking that went into it and the flexibility and adaptability of the design that emerged.” Energy Secretary Samuel W. Bodman
. . . . . . . . .
L A B S F O R T H E 2 1 S T C E N T U R Y 3
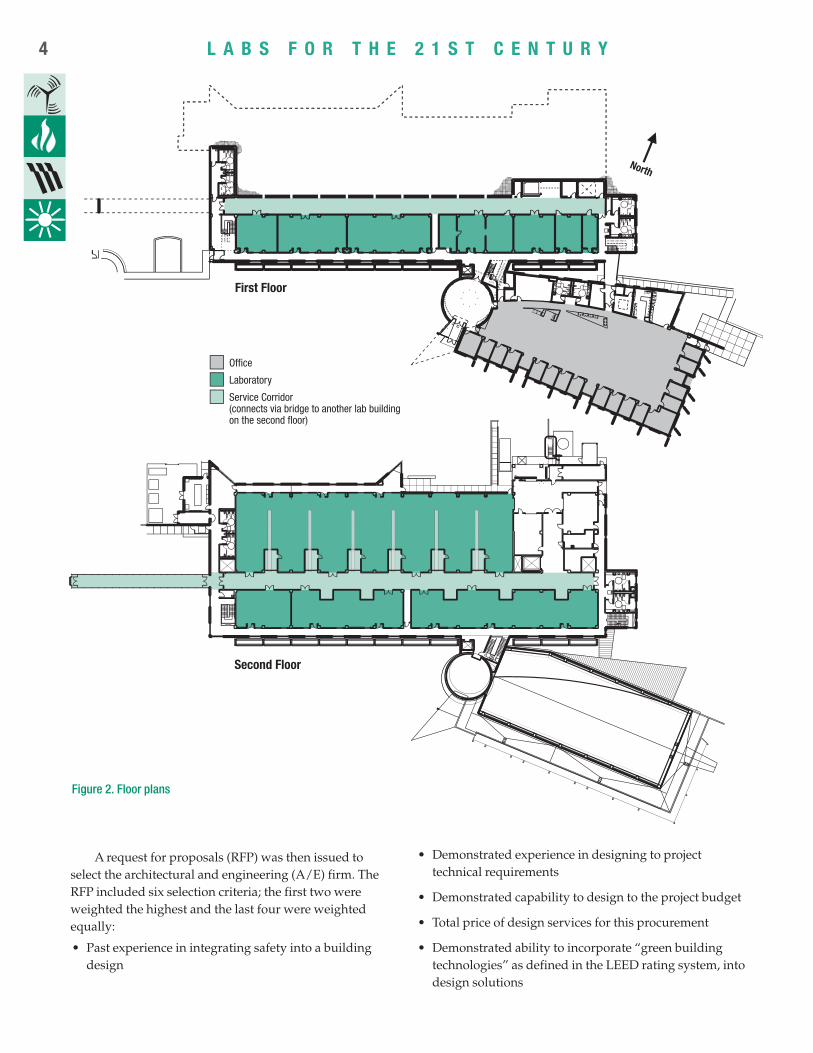
organized along a service corridor nearly identical to that of the second floor. Both floor plans are shown in Figure 2.
The rectangular PDIL is centrally located on the second-floor ground level (because the site slopes) and along support laboratories to improve operational efficiency and make future expansions easier. Large second-floor labs required the largest available floor plate, a direct connection to the SERF for service, and proximity to the PDIL. Vibrationsarecontrolledbymeansofastructural slab beneath the PDIL. Both floors feature daylighting and exterior views.
The office area is a structurally separate one-story module east and south of the labs. Advantages of this design include lower cost; enhanced safety due to separation of staff from labs using hazardous materials; and allowing daylight to enter offices from both the south and north sides.
Ut i l i ty Serv ic ing Laboratories are organized along a central service
corridor that supports them on each floor, like a spine supporting limbs. The service corridor is required to distribute hazardous production materials (HPM) to the labs because the S&TF is classified as high hazard occupancy 5 (H5) under the International Building Code (IBC). The service corridor accommodates gas lines, water lines, exhaust and supply ductwork, electrical, and signal system distribution to the back of the labs. The front of each lab includes access to an exit corridor that links to the rest of the building. As shown in Figure 2, the service corridor includes notched areas for heat- and noise- producing equipment. An in-floor utility trench allows this equipment to be connected to equipment inside the labs.
Design ApproachThe building was conceptually designed and pro-
posed for funding in 2001. As a first step in the design process, NREL research staff helped determine space requirements for each lab. A design charrette held in 2001 resulted in a recommendation to redesign the original one-story building as a two-story facility for greater sustainability, a smaller building footprint, and more efficient heating, ventilating, and air-conditioning (HVAC).Thetwo-storyconceptualdesignwascompletedin early 2002.
Figure 1. Interior of the PDIL
Table 1 . Science and Technology Faci l i ty Space Breakdown(Net ft2, unless otherwise noted)
Function Size (ft2) Percentage (1)
Offices and office support areas 10,425 23%
Laboratory support space 22,933 51%
Laboratory space 11,442 26%
Total net ft2 44,800 100%
Other (2) 26,547
Total gross ft2 71,347
Notes:1. The percentage shows a breakdown of net ft2 only. Net ft2 equals
gross ft2 minus “other.”
2. “Other” includes circulation, toilets, stairs, elevator shafts, mechanical and electrical rooms and shafts, and structural elements like columns. The net-to-gross-ft2 ratio is 63% .
Layout and DesignLaboratory spaces were designed around a common
module to provide flexibility and distribution of utilities and services. The selected planning module is 10 ft x 27 ft. Structural bays allow an appropriate span for the second floor to reduce vibrations. Designers arranged building spaces to reflect the relationship of labs to one another, to offices, and to support spaces. The need to use toxic and flammable materials in some labs also influenced the plan. A space breakdown is shown in Table 1.
On the first level of the two-story laboratory portion of the building are labs that are more sensitive to vibration and noise and need to be darkened. Lab spaces were
Bren
t Nel
son,
NRE
L/PI
X148
40
L A B S F O R T H E 2 1 S T C E N T U R Y4
A request for proposals (RFP) was then issued to selectthearchitecturalandengineering(A/E)firm.TheRFP included six selection criteria; the first two were weighted the highest and the last four were weighted equally:
• Pastexperienceinintegratingsafetyintoabuildingdesign
• Demonstratedexperienceindesigningtoproject technical requirements
• Demonstratedcapabilitytodesigntotheprojectbudget
• Totalpriceofdesignservicesforthisprocurement
• Demonstratedabilitytoincorporate“greenbuildingtechnologies” as defined in the LEED rating system, into design solutions
Figure 2. Floor plans
Office
Laboratory
Service Corridor(connects via bridge to another lab buildingon the second floor)
Second Floor
First Floor
North
L A B S F O R T H E 2 1 S T C E N T U R Y 5
• Demonstratedabilitytodevelopanarchitecturalimageconsistent with the project site and the owner’s identity.
After a nationwide search, the selection team chose the SmithGroup team. The final design was completed in 2003, and construction began in early 2005.
Technologies Used Si te
The S&TF is oriented along an east-west axis so that windows on the north and south facades can provide natural lighting. A butterfly roof over the office module collects stormwater and directs it to detention ponds with xeriscape land scaping. The construction contractor recycled more than 80% of the construction waste by weight. In addition, a portion of the excavation soils were retained and used to restore a previously disturbed por-tion of the site.
Per the Labs21 Environmental Performance Criteria (the basis for the LEED Application Guide for Laboratories), NREL contracted for an exhaust effluent study using wind tunnel modeling to define the impact of emissions from exhaust sources at the building intake and other sensitive locations. The study suggested minimum acceptable design parameters in terms of exhaust stack height, exit velocity, volume flow and exhaust, and loca-tion of intake air. The recommendations were used in designing the air intake location and exhaust system.
Energy Ef f ic iency The energy efficiency features of the S&TF were
designed to provide a 41% percent reduction in energy cost in comparison to a standard laboratory building. Thesefeaturesincludeavariable-air-volume(VAV)supplyand exhaust system, variable-frequency motor drives, efficient fume hoods and fans, energy recovery, efficient heating and cooling equipment, and underfloor air distribution.
VAV Supply and exhaust system requirements. The minimum occupied air flow is 1 cubic foot per minute (1cfm)/ft2 asrequiredbyIBCH5occupancy.TheVAVsystem allows more supply air as needed for fume hoods and other exhaust devices.
The facility’s chemical fume hoods feature an auto-matic sash closer to ensure that the sash is open no more than 18 in. when operating. An ASHRAE 110 test verified that the hood is performing to the recommended level by ANSI Z9.5-2003.
In laminar-flow hoods, HEPA-filtered air is intro-duced to protect the product and air is drawn in through the sash to protect the user. Laminar-flow hoods are a big energy user at NREL, so the S&TF hoods were designed
to have two-speed blower motor control. When the sash is closed and no product is being tested, this signals the blowermotortooperateatlowspeedandtheVAVsystemto operate at a low set point volume, reducing airflow by 40%. The ASHRAE 110 test verified the hoods’ contain-ment performance.
Exhaust fans. The building’s six exhaust stacks are on the southeast side. Each is connected to a dedicated direct-drive 20,000-cfm exhaust fan. Fans are staged on and off to maintain an exhaust plenum negative static pressure set point of approximately 1.5 in. water column. The fans are started in sequence until they exceed the set point; then, the bypass damper in the exhaust plenum modulates open to maintain the set point pressure as the system reacts to varying lab conditions. When the bypass damper modu-lates to 80% fully open, an exhaust fan shuts down and the bypass damper modulates toward closed to maintain the negative set point pressure. This saves considerable energy in comparison to running a full-capacity fan and large bypass damper in part-load conditions.
Fan coils. Fan coil units provide heating and cooling directly to laboratory spaces, nearly eliminating the need for inefficient reheating systems. Fan coils allow the venti-lation system to supply only the tempered air required forminimumventilation(1cfm/ft2) and makeup air for exhaust devices. Fan coils provide cooling for areas with high internal heat gain.
Energy recovery. A runaround-coil system with an estimated 63% sensible effectiveness reduces the heating and cooling requirements associated with conditioning ventilation air in labs. The system recovers energy from exhaust air to precondition supply air and uses waste heat from the process water loop to preheat ventilation air. This also provides “free” cooling for process cooling water when the outside temperature is below 60°F, for savings in both chiller energy and cooling tower water.
Efficient heating and cooling. The S&TF uses a high-efficiency condensing boiler and variable-speed chiller, indirect evaporative cooling, and a heat exchanger that allows cooling water to bypass chillers and be cooled directly by the cooling tower. Direct evaporative cooling cools offices and provides cooling and humidity control in labs. A modulating indirect gas-fired heating section in makeup air units heats makeup air for labs and reduces hot water piping needs. The condensing boiler provides heat for offices and fan coil units in labs.
Underfloor air distribution. The offices are condi-tionedbyaVAVunderfloorairdistributionsystem.It provides fan energy savings and increases the number of hours when the economizer and evaporative cooling
L A B S F O R T H E 2 1 S T C E N T U R Y6
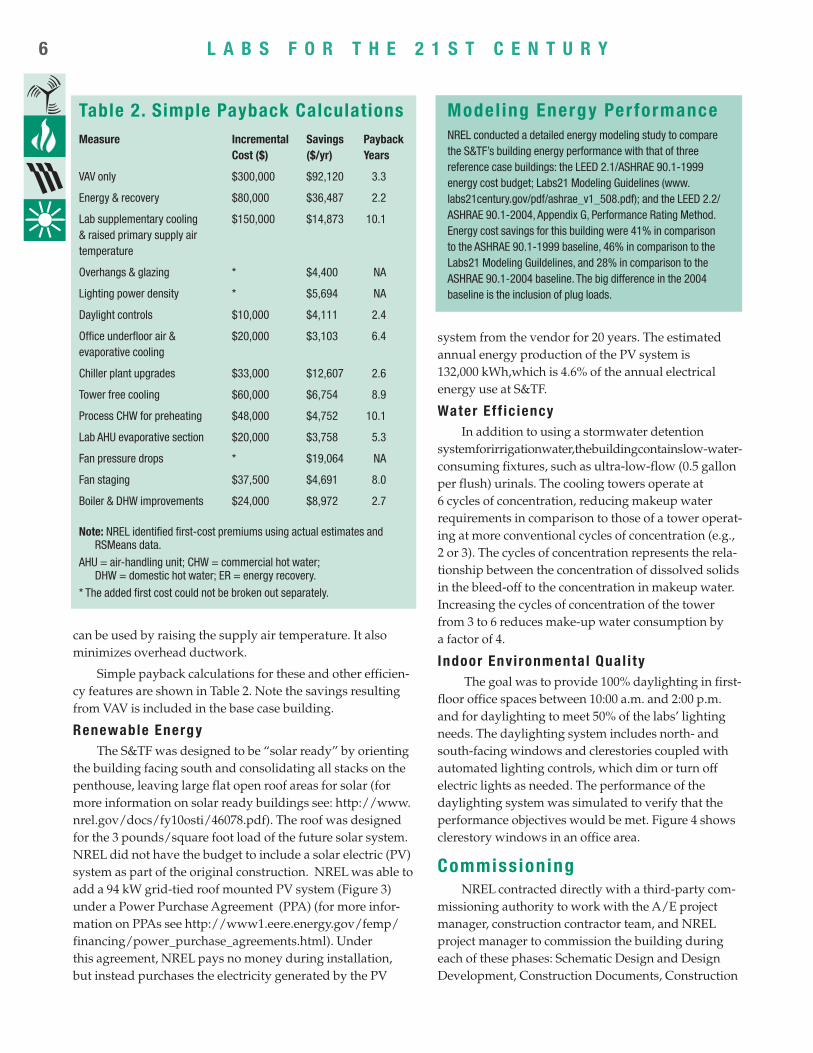
Table 2. Simple Payback CalculationsMeasure Incremental Savings Payback Cost ($) ($/yr) Years
VAV only $300,000 $92,120 3.3
Energy & recovery $80,000 $36,487 2.2
Lab supplementary cooling $150,000 $14,873 10.1 & raised primary supply air temperature
Overhangs & glazing * $4,400 NA
Lighting power density * $5,694 NA
Daylight controls $10,000 $4,111 2.4
Office underfloor air & $20,000 $3,103 6.4 evaporative cooling
Chiller plant upgrades $33,000 $12,607 2.6
Tower free cooling $60,000 $6,754 8.9
Process CHW for preheating $48,000 $4,752 10.1
Lab AHU evaporative section $20,000 $3,758 5.3
Fan pressure drops * $19,064 NA
Fan staging $37,500 $4,691 8.0
Boiler & DHW improvements $24,000 $8,972 2.7
Note: NREL identified first-cost premiums using actual estimates and RSMeans data.
AHU = air-handling unit; CHW = commercial hot water; DHW = domestic hot water; ER = energy recovery.
* The added first cost could not be broken out separately.
Model ing Energy PerformanceNREL conducted a detailed energy modeling study to compare the S&TF’s building energy performance with that of three reference case buildings: the LEED 2.1/ASHRAE 90.1-1999 energy cost budget; Labs21 Modeling Guidelines (www.labs21century.gov/pdf/ashrae_v1_508.pdf); and the LEED 2.2/ASHRAE 90.1-2004, Appendix G, Performance Rating Method. Energy cost savings for this building were 41% in comparison to the ASHRAE 90.1-1999 baseline, 46% in comparison to the Labs21 Modeling Guildelines, and 28% in comparison to the ASHRAE 90.1-2004 baseline. The big difference in the 2004 baseline is the inclusion of plug loads.
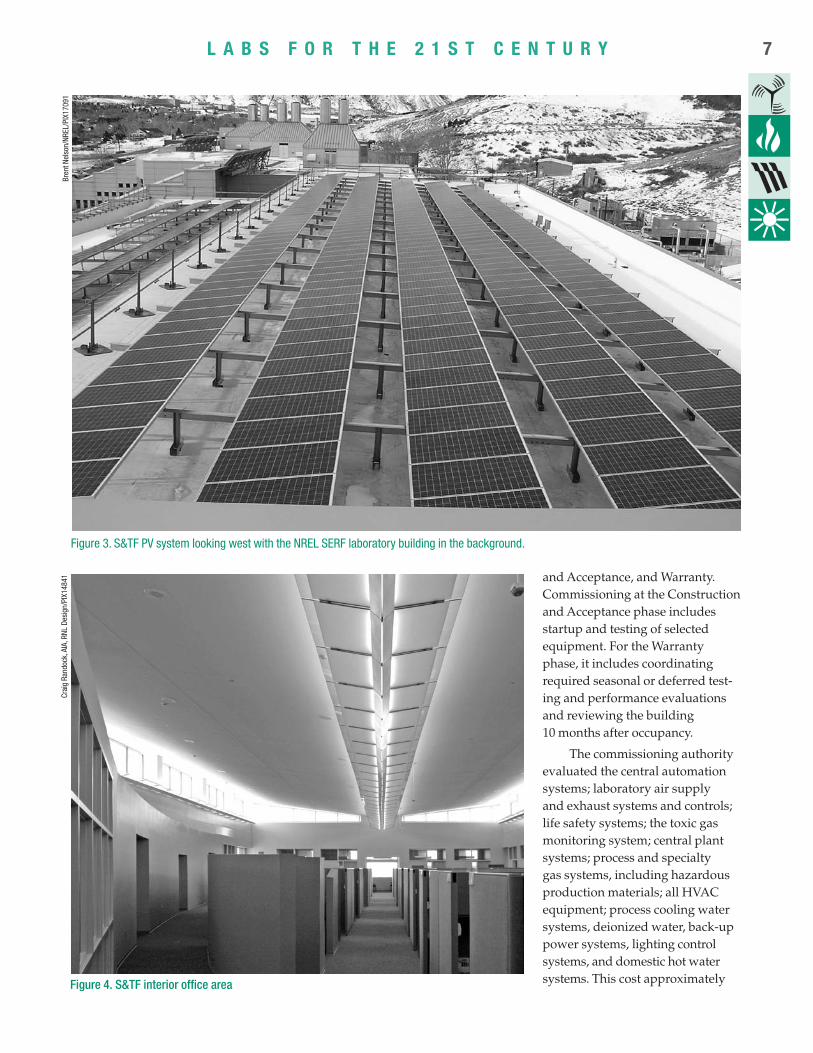
system from the vendor for 20 years. The estimated annualenergyproductionofthePVsystemis132,000 kWh,which is 4.6% of the annual electrical energy use at S&TF.
Water Ef f ic iencyIn addition to using a stormwater detention
system for irrigation water, the building contains low-water- consuming fixtures, such as ultra-low-flow (0.5 gallon per flush) urinals. The cooling towers operate at 6 cycles of concentration, reducing makeup water requirements in comparison to those of a tower operat-ing at more conventional cycles of concentration (e.g., 2 or 3). The cycles of concentration represents the rela-tionship between the concentration of dissolved solids in the bleed-off to the concentration in makeup water. Increasing the cycles of concentration of the tower from 3 to 6 reduces make-up water consumption by a factor of 4.
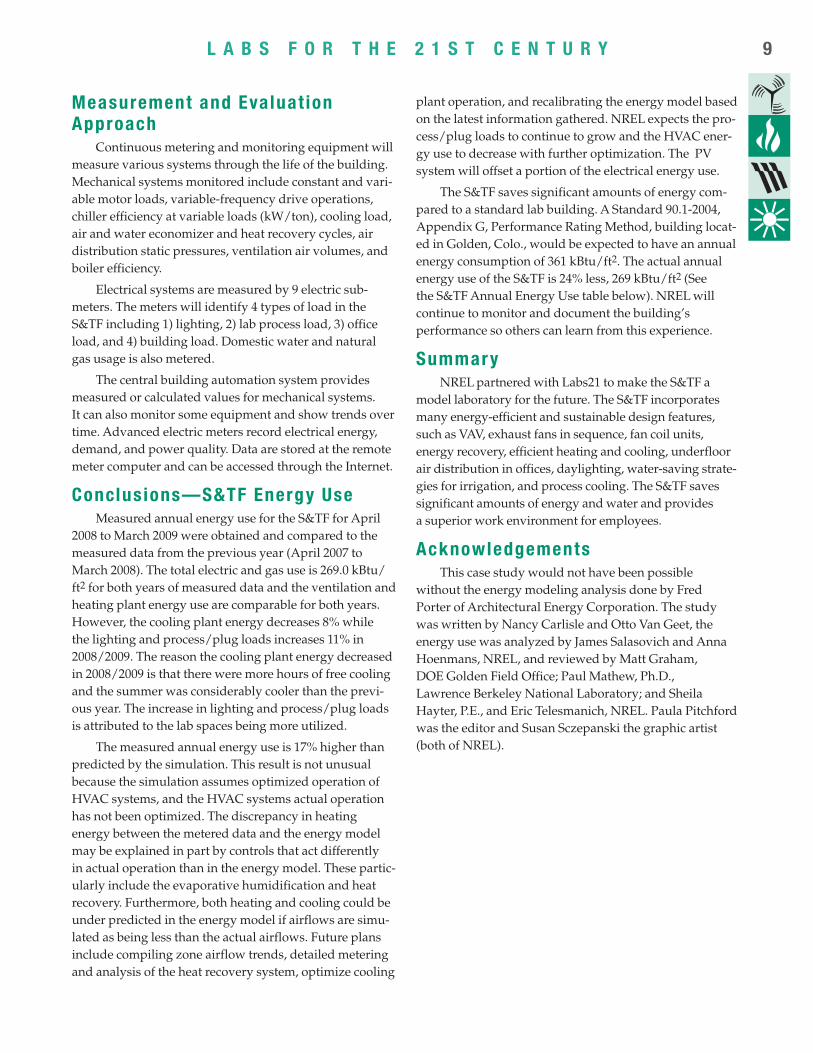
Indoor Environmental Qual i ty The goal was to provide 100% daylighting in first-
floor office spaces between 10:00 a.m. and 2:00 p.m. and for daylighting to meet 50% of the labs’ lighting needs. The daylighting system includes north- and south-facing windows and clerestories coupled with automated lighting controls, which dim or turn off electric lights as needed. The performance of the daylighting system was simulated to verify that the performance objectives would be met. Figure 4 shows clerestory windows in an office area.
Commissioning NREL contracted directly with a third-party com-
missioningauthoritytoworkwiththeA/Eprojectmanager, construction contractor team, and NREL project manager to commission the building during each of these phases: Schematic Design and Design Development, Construction Documents, Construction
can be used by raising the supply air temperature. It also minimizes overhead ductwork.
Simple payback calculations for these and other efficien-cy features are shown in Table 2. Note the savings resulting fromVAVisincludedinthebasecasebuilding.
Renewable EnergyThe S&TF was designed to be “solar ready” by orienting
the building facing south and consolidating all stacks on the penthouse, leaving large flat open roof areas for solar (for moreinformationonsolarreadybuildingssee:http://www.nrel.gov/docs/fy10osti/46078.pdf).Theroofwasdesignedforthe3pounds/squarefootloadofthefuturesolarsystem.NRELdidnothavethebudgettoincludeasolarelectric(PV)system as part of the original construction. NREL was able to adda94kWgrid-tiedroofmountedPVsystem(Figure3)under a Power Purchase Agreement (PPA) (for more infor-mationonPPAsseehttp://www1.eere.energy.gov/femp/financing/power_purchase_agreements.html).Under this agreement, NREL pays no money during installation, butinsteadpurchasestheelectricitygeneratedbythePV
L A B S F O R T H E 2 1 S T C E N T U R Y 7
Figure 4. S&TF interior office area
Crai
g Ra
ndoc
k, A
IA, R
NL D
esig
n/PI
X148
41Br
ent N
elso
n/NR
EL/P
IX17
091
Figure 3. S&TF PV system looking west with the NREL SERF laboratory building in the background.
and Acceptance, and Warranty. Commission ing at the Construction and Acceptance phase includes startup and testing of selected equipment. For the Warranty phase, it includes coordinating required seasonal or deferred test-ing and performance evaluations and reviewing the building 10 months after occupancy.
The commissioning authority evaluated the central automation systems; laboratory air supply and exhaust systems and controls; life safety systems; the toxic gas monitoring system; central plant systems; process and specialty gas systems, including hazardous productionmaterials;allHVACequipment; process cooling water systems, deionized water, back-up power systems, lighting control systems, and domestic hot water systems. This cost approximately

L A B S F O R T H E 2 1 S T C E N T U R Y8
0.5%ofthetotalconstructionbudget,orabout$1.60/grossft2 of building area.
Bui ld ing Metr icsA comparison between S&TF’s energy use based on
design calculations and an hourly computer simulation model is shown in Table 3. The biggest difference between the two methods for calculating energy use is the value for
ventilation air. Calculations are based on nameplate values and assumed full loads. They follow Labs21 benchmark procedures and are included for comparison to other Labs21 data sets. The simulation model predicts loads basedonascheduleandthetypical1cfm/ft2 of lab venti-lation rather than design capacities and is assumed to be more accurate.
Table 3 . Bui ld ing Metr ics for the S&TF
System Key Design Parameters Annual Energy Usage (based on design data calculations)
Annual Energy (based on simulation) (1) Measured (Apr 07 to Mar 08)
Measured (Apr 08 to Mar 09)
Ventilation (sum of wattage of all the supply and the exhaust fans)
Supply= 1.44 W/cfm Exhaust = 0.75 W/cfm Total =1.09 W/cfm(2)
1.4 cfm/gross ft2; 2.2 cfm/net ft2, and 3.15 cfm/gross ft2 of labs (3)
25.6 kWh/gross ft2 (4) 9.6 kWh/gross ft2 10.1 kWh/ft2 10.5 kWh/ft2
Cooling plant 400 tons 0.449 kW/ton
7.3 kWh/gross ft2 (5) 4.8 kWh/gross ft2 13.0 kWh/ft2 11.9 kWh/ft2
Lighting Varies from 1.45 W/gross ft2 in labs to 0.86 W/ft2 in open offices
2.3 kWh/gross ft2 (6) 2.3 kWh/gross ft2 15.7 kWh/ft2 (10)
17.6 kWh/ft2 (10)
Process/Plug 4.70 average W/gross ft2; range varies from 0-10 W/gross ft2
19.8 kWh/gross ft2 (7) 21.3 kWh/gross ft2
Heating plant temperature
95% efficient at 140°F supply 91.9 kBtu/gross ft2 (as per simulation)
91.9 kBtu/gross ft2 (as per simulation) 136.7 kBtu/ft2 132.7 kBtu/ft2
Total electricity only (8)
electricity only (8)
55.0 kWh/gross ft2/yr
187.6 kBtu/gross ft2
279.5 kBtu/gross ft2/yr for electricity and gas
38.1 kWh/gross ft2/yr
131.5 kBtu/gross ft2
223.4 kBtu/gross ft2 for electricity and gas
$3.33/gross ft2 estimated cost for electricity and gas (9)
38.3 kWh/ft2
132.4 kBtu/ft2
269.0 kBtu/ft2
40 kWh/ft2
136.4 kBtu/ft2
269.0 kBtu/ft2
Notes:
1. Simulation study done by Architectural Energy Corporation, Energy Modeling Analysis and Baseline Performance Comparison for NREL Science and Technology Facility, June 10, 2006.
2. 180 hp (supply) plus 100 hp (exhaust) x 746 W/hp/93,000 cfm (supply) + 100,000 cfm (exhaust) = 1.09 W/cfm.
3. 100,000 cfm (total cfm based on exhaust)/44,800 net ft2 = 2.2 cfm/net ft2; 100,000 cfm/71,347 gross ft2 = 1.4 cfm/gross ft2; 100,000 cfm/31,700 net ft2 of labs = 3.15 cfm/net ft2 of labs.
4. 0.75 W/cfm x 100,000 cfm/gross ft2 (exhaust) + 93,000 cfm/gross ft2 x 1.44 W/cfm (supply)/71,347 ft2 x 8760 hours/1000 = 25.6 kWh/gross ft2 (40.6 kWh/net ft2.)
5. 0.449 kW/ton x 400 tons x 2890 hours/71,347 gross ft2 = 7.27 kWh/gross ft2 (assumes cooling runs 33% of the hours in a year).
6. 1.11 W/gross ft2 (weighted average) x 2080 hours/1000 = 2.3 kWh/gross ft2. (In other case studies, it was assumed that lights are on 87.2 hours/week. In this case, because of the aggressive daylighting strategy, the assumption is that lights are on 40 hours per week.)
7. 4.70 W/gross ft2 (weighted average) x 0.80 x 5256 hours/1000 = 19.78 kWh/gross ft2. (The lab power density ranges from 0-10 W/ft2 and the average office power density is 1.0 W/ft2. (Assumes that 80% of all equipment is operating 60% of the hours in a year.)
8. Estimated data are presented in site Btu (1 kWh = 3412 Btu). To convert to source Btu, multiply site Btu for electricity by 3. Note: Golden, CO, has approx. 6020 Base 65°F heating degree-days and 679 Base 65°F cooling degree-days (based on Boulder, CO, weather data).
9. 2005 utility rate information: natural gas at $0.75/therm plus a $75.00 monthly charge; electricity at 0.029 per kWh plus $13.76/kW (summer) and $12.52/kW (winter) plus $130.00/month service charge. Cost estimate based on simulation.
10. Lighting and Process/Plug energy are measured together.
L A B S F O R T H E 2 1 S T C E N T U R Y 9
Measurement and Evaluat ion Approach
Continuous metering and monitoring equipment will measure various systems through the life of the building. Mechanical systems monitored include constant and vari-able motor loads, variable-frequency drive operations, chillerefficiencyatvariableloads(kW/ton),coolingload,air and water economizer and heat recovery cycles, air distribution static pressures, ventilation air volumes, and boiler efficiency.
Electrical systems are measured by 9 electric sub-meters. The meters will identify 4 types of load in the S&TF including 1) lighting, 2) lab process load, 3) office load, and 4) building load. Domestic water and natural gas usage is also metered.
The central building automation system provides measured or calculated values for mechanical systems. It can also monitor some equipment and show trends over time. Advanced electric meters record electrical energy, demand, and power quality. Data are stored at the remote meter computer and can be accessed through the Internet.
Conclusions—S&TF Energy UseMeasured annual energy use for the S&TF for April
2008 to March 2009 were obtained and compared to the measured data from the previous year (April 2007 to March2008).Thetotalelectricandgasuseis269.0kBtu/ft2 for both years of measured data and the ventilation and heating plant energy use are comparable for both years. However, the cooling plant energy decreases 8% while thelightingandprocess/plugloadsincreases11%in2008/2009.Thereasonthecoolingplantenergydecreasedin2008/2009isthatthereweremorehoursoffreecoolingand the summer was considerably cooler than the previ-ousyear.Theincreaseinlightingandprocess/plugloadsis attributed to the lab spaces being more utilized.
The measured annual energy use is 17% higher than predicted by the simulation. This result is not unusual because the simulation assumes optimized operation of HVACsystems,andtheHVACsystemsactualoperationhas not been optimized. The discrepancy in heating energy between the metered data and the energy model may be explained in part by controls that act differently in actual operation than in the energy model. These partic-ularly include the evaporative humidification and heat recovery. Furthermore, both heating and cooling could be under predicted in the energy model if airflows are simu-lated as being less than the actual airflows. Future plans include compiling zone airflow trends, detailed metering and analysis of the heat recovery system, optimize cooling
plant operation, and recalibrating the energy model based on the latest information gathered. NREL expects the pro-cess/plugloadstocontinuetogrowandtheHVACener-gyusetodecreasewithfurtheroptimization.ThePVsystem will offset a portion of the electrical energy use.
The S&TF saves significant amounts of energy com-pared to a standard lab building. A Standard 90.1-2004, Appendix G, Performance Rating Method, building locat-ed in Golden, Colo., would be expected to have an annual energyconsumptionof361kBtu/ft2. The actual annual energyuseoftheS&TFis24%less,269kBtu/ft2 (See the S&TF Annual Energy Use table below). NREL will continue to monitor and document the building’s performance so others can learn from this experience.
SummaryNREL partnered with Labs21 to make the S&TF a
model laboratory for the future. The S&TF incorporates many energy-efficient and sustainable design features, suchasVAV,exhaustfansinsequence,fancoilunits, energy recovery, efficient heating and cooling, underfloor air distribution in offices, day lighting, water-saving strate-gies for irrigation, and process cooling. The S&TF saves significant amounts of energy and water and provides a superior work environment for employees.
AcknowledgementsThis case study would not have been possible
without the energy modeling analysis done by Fred Porter of Architectural Energy Corporation. The study waswrittenbyNancyCarlisleandOttoVanGeet,theenergy use was analyzed by James Salasovich and Anna Hoenmans, NREL, and reviewed by Matt Graham, DOE Golden Field Office; Paul Mathew, Ph.D., Lawrence Berkeley National Laboratory; and Sheila Hayter, P.E., and Eric Telesmanich, NREL. Paula Pitchford was the editor and Susan Sczepanski the graphic artist (both of NREL).

L A B S F O R T H E 2 1 S T C E N T U R Y10
Laboratories for the 21st CenturyU.S. Environmental Protection Agency Office of Administration and Resources Management www.labs21century.gov
In partnership with the U.S. Department of EnergyEnergy Efficiency and Renewable EnergyBringing you a prosperous future where energy is clean, abundant, reliable, and affordable.http://www.eere.energy.gov/
Federal Energy Management Program www.eere.energy.gov/femp
Prepared by the National Renewable Energy Laboratory (NREL), a national laboratory of the U.S. Department of Energy, Office of Energy Efficiency and Renewable Energy; NREL is operated by the Alliance for Sustainable Energy, LLC.
This publication is subject to Government rights.
DOE/GO-102010-3015 Revised June 2010
Printed with a renewable-source ink on paper containing at least 50% wastepaper, including 10% postconsumer waste.
For More Informat ionOn the NREL Science and Technology Facility:OttoVanGeet,P.E. National Renewable Energy Laboratory 1617 Cole Boulevard Golden, CO 80401 303-384-7369 [email protected]
On Laboratories for the 21st Century:Will Lintner, P.E. U.S. Department of Energy Federal Energy Management Program 1000 Independence Ave., S.W. Washington, DC 20585 202-586-3120 [email protected]
Daniel Amon, P.E. U.S. Environmental Protection Agency 1200 Pennsylvania Ave., N.W. Washington, DC 20460 202-564-7509 [email protected]
Nancy Carlisle, A.I.A. National Renewable Energy Laboratory 1617 Cole Blvd. Golden, CO 80401 303-384-7509 [email protected]
Seealsowww.labs21century.gov/toolkit/bp_guide.htmfor these best practice guides:
Daylighting in Laboratories
Minimizing Reheat Energy Use in Laboratories
Modeling Exhaust Dispersion for Specifying Exhaust/Intake Designs
Water Efficiency for Laboratories


