Embed Size (px)
Citation preview

Labor Unions, Operating Leverage,
and Expected Stock Returns*
Huafeng (Jason) Chen
Marcin Kacperczyk
Hernan Ortiz-Molina
Abstract
We examine the effect of an important friction in the labor market, that generated by labor unions, on the cross-section of expected stock returns. We hypothesize that labor unions increase expected stock returns by increasing firms’ share of fixed labor costs in total labor costs and thus their operating leverage. Consistent with our hypothesis, we find that expected returns are higher for firms in more unionized industries and that the effect is stronger when unions face a more favorable bargaining environment. Furthermore, using instrumental-variables techniques we establish a causal link from unionization to expected returns. Finally, we provide evidence that unions increase expected returns through the operating leverage channel. Overall, our findings underline the importance of labor markets’ imperfections in understanding the cross-sectional variation in expected returns.
This Draft: October 2006
*All authors are from the Sauder School of Business at the University of British Columbia, 2053 Main Mall, Vancouver BC, V6T 1Z2, Canada. Please address inquiries to [email protected], [email protected], or [email protected]. We thank Malcolm Baker, Maria Boutchkova, Murray Carlson, Joseph Chen, Lauren Cohen, Adlai Fisher, Lorenzo Garlappi, Ron Giammarino, Radha Gopalan, Thomas Hellmann, Barry Hirsch, Harrison Hong, Alan Kraus, Jeffrey Kubik, Marc Law, Michael Lemmon, Maurice Levi, Mindy Marks, Luboš Pástor, Gordon Phillips, Monika Piazzesi, Amit Seru, Tyler Shumway, Clemens Sialm, Laura Starks, Sheridan Titman, Pietro Veronesi, Luis Viceira, James Weston, Lu Zhang, as well as seminar participants at the University of British Columbia, the UBC Summer Conference, and the Northern Finance Association 2006 Meetings for comments and helpful suggestions. Kyung Shin provided invaluable research assistance. Chen acknowledges financial support from UBC/HSS Grant. Kacperczyk and Ortiz-Molina acknowledge financial support from the Social Sciences and Humanities Research Council of Canada.

Recent theoretical and empirical research in financial economics has devoted keen
attention to explaining the cross-section of expected stock returns in the context of a
production economy.1 While in a neoclassical framework production inputs are fully
flexible and have no effect on firm risk, in reality, imperfections in input markets may
add to systematic risk and thus increase expected returns. Although the effect of frictions
in markets for physical capital has been well explored, relatively little is known about
how frictions in the labor market may affect equilibrium risk and expected returns. In this
paper, we fill this void by empirically studying the effect of a particular friction, that
generated by labor unions, on the cross-section of expected stock returns.
Labor unions introduce an important friction in the market for labor inputs that
may have real effects on firms’ operations. In particular, powerful unions make wages
sticky and layoffs costly, leading to a higher share of fixed labor costs in a firm’s total
labor costs. This mechanism introduces a hitherto unexplored source of operating risk –
operating leverage due to labor. The presence of this operating leverage may magnify a
firm’s intrinsic business risk and thus may increase systematic risk, following the general
intuition presented in Rubinstein (1973). As a result, investors would require higher
returns on the capital they provide. Hence, we hypothesize that, by increasing operating
leverage, labor unions may increase nondiversifiable firm risk and the equilibrium
expected return.
Using both the portfolio and regression frameworks, we show that firms in more
unionized industries are associated with higher expected stock returns. Our analysis uses
two ex-ante measures of expected returns: the cost of equity arising from the Fama-
French (1993) three-factor model and the implied cost of equity of Gebhardt, Lee, and 1 Examples include Cochrane (1991, 1996), Jermann (1998), Berk, Green, and Naik (1999), Gomes, Kogan, and Zhang (2003), Titman, Wei, and Xie (2004), Zhang (2005), and Xing (2006).
1

Swaminathan (2001). The results are statistically and economically significant: A one-
standard-deviation increase in the unionization rate increases the Fama-French cost of
equity by about 0.5 percentage points per year and the implied cost of equity by 1.5
percentage points per year.
To ensure that our tests do not identify a spurious relation between unionization
rates and expected returns, we study the cross-sectional variation in the unionization
premium arising from differences in the bargaining environment that could affect the
strength of unions. We find that the effect of unionization on expected returns is stronger
when unions face a more favorable bargaining environment. Specifically, this effect is
more pronounced in industries with low unemployment rates, with a strong influence of
the Democratic party, and also in firms with more concentrated business operations.
Since the effect of unions on expected returns is significantly related to our proxies for
union bargaining power, our results are unlikely to be driven by the potential omission of
unobservable industry or firm characteristics correlated with unionization. Moreover,
differences in risk rather than in relative mispricing are more likely to explain the
unionization premium in expected returns.
Next, we establish a causal link from unionization to expected returns using
instrumental-variables techniques. In particular, one could argue that higher unionization
is more likely to arise in firms operating in more risky industries, which in turn have
higher expected returns. As a result, labor unions themselves may not cause an increase
in the firm’s risk, but rather firm risk may cause higher unionization. We address this
endogeneity concern using two instruments that are strongly correlated with unionization
rates, but do not directly affect expected returns: the percentage of female workers and
the average age of workers in the industry. We confirm the econometric validity of our
2

instruments, we show that our OLS estimates are not biased due to endogeneity, and
provide strong evidence that unions cause an increase in expected returns.
Our subsequent analysis indicates that labor unions increase expected returns by
increasing firms’ share of fixed labor costs in total labor costs and thus their operating
leverage. To this end, first, we establish a positive relation between labor unionization
and firms’ operating leverage, which we estimate as the sensitivity of a firm’s earnings to
its sales. Second, we decompose the Fama-French cost of equity into its three
components – market beta, SMB beta, and HML beta – and show that the effect of unions
on expected returns works primarily through the book-to-market channel. Since previous
studies (e.g., Carlson, Fisher, and Giammarino, 2004) argue that book-to-market ratios
capture firms’ operating leverage, our results are consistent with the premise that labor
unions increase expected returns because they increase operating leverage.
We also document that unionization rates are not significantly related to realized
returns, a common proxy for expected returns. We argue that the ex-ante estimates of
expected returns, such as the Fama-French cost of equity and the implied cost of equity,
are more suitable to capture the economic relation between labor unions and expected
returns.2 In particular, we show that high-unionization firms have suffered from
unexpectedly low profitability and unexpected increases in discount rates. Thus, realized
returns are a poor proxy for expected returns because the unexpected component of
returns is systematically related to unionization.
Our main results are robust to different specifications. First, we find that labor
unions tend to depress firms’ market equity values, even after controlling for return on
2 Other studies that argue for ex-ante measures of expected returns include Friend, Westerfield, and Granito (1978), Kaplan and Ruback (1995), Elton (1999), Claus and Thomas (2001), Fama and French (2002), Brav, Lehavy, and Michaely (2005), and Pástor, Sinha, and Swaminathan (2006).
3

equity and other firm characteristics. Our estimates indicate that a one-standard-deviation
increase in the unionization rate reduces market-to-book equity by about 9% per year, a
magnitude that is consistent with what one would obtain in the expected return analysis
under the assumption of a perpetual fixed-rate growth. Second, we establish the effect of
unions on expected returns over and above their effect through financial leverage. Given
that other studies (e.g., Bronars and Deere (1991) and Matsa (2005)) have shown that
higher unionization is associated with higher financial leverage, it is possible that
financial leverage may explain some of the effect of unionization on expected returns. To
this end, we explicitly control for financial leverage in all our regressions. In addition, we
repeat our tests using the unlevered cost of equity as the dependent variable and find that
firms in more unionized industries face higher unlevered costs of equity. Thus, the
association between unionization and financial leverage does not explain our findings.
Our results are also robust to a number of additional tests. We find that the
positive relation between unionization rates and expected returns holds and is both
statistically and economically significant for most of the individual years in our sample.
The main findings also remain significant when we run regressions at the industry level.
In addition, our results cannot be attributed to the fact that unions are more likely to be
found in the “old-economy” industries. While our regression analysis uses standard errors
clustered by industry, the statistical significance improves if we cluster standard errors by
firm or by year. Finally, the results hold with improved statistical significance if we run
the Fama-MacBeth cross-sectional regressions with Newey-West standard errors.
Our paper contributes to several literatures. First, we advance the literature
relating operating leverage to expected stock returns. Closely related to ours is the
theoretical work by Danthine and Donaldson (2002) who introduce fixed labor costs to
4

generate operating leverage and match the observed aggregate equity premium. We differ
from the above study in that we empirically examine how the cross-sectional variation in
fixed labor costs associated with labor unions affects expected stock returns. Also related
is earlier work by Rubinstein (1973), Lev (1974), and Booth (1991) who demonstrate that
operating risk affects expected returns in the capital asset pricing model. Mandelker and
Rhee (1984) find that both operating and financial leverage can explain a significant
proportion of the variation in market beta. More recently, Carlson, Fisher, and
Giammarino (2004), Cooper (2006), and Gourio (2005) argue theoretically that operating
leverage helps explain the observed book-to-market effect in the cross-section of stock
returns. Our paper focuses on operating leverage due to labor and provides new evidence
consistent with the idea that operating leverage helps explain the book-to-market effect.3
Second, we contribute to the literature that relates labor unions to financial
markets. In particular, we reconcile seemingly conflicting evidence regarding the impact
of unions on firms’ market valuations. Early studies (e.g., Ruback and Zimmerman
(1984), Abowd (1989), and Bronars and Deere (1990)) find that labor unions reduce
firms’ equity values and interpret this result as evidence that labor unions reduce firms’
profitability. On the other hand, DiNardo and Lee (2004) demonstrate that unions have a
negligible effect on the levels of wages and employment, which suggests that unions have
no impact on profitability. Our results reconcile these findings by showing that unions
reduce market equity values through an increase in discount rates.
Finally, related to ours are studies that directly associate higher unionization with
higher financial leverage and thus indirectly with higher expected returns. For example, 3 Our evidence is also consistent with the view that labor unions increase expected returns by making a firm’s investment in human capital more irreversible. Current finance literature that explores irreversibility or costly reversibility focuses on investments in physical capital. Recent examples include Cochrane (1996), Jermann (1998), Kogan (2001), and Zhang (2005). A notable exception is Merz and Yashiv (2006), who consider both capital and labor adjustment costs in the aggregate stock market.
5

Bronars and Deere (1991) and Matsa (2005) argue that firm’s management may increase
financial leverage as a result of the bargaining game between management and labor
unions.4 In contrast to these studies, we identify operating leverage as another
economically important channel through which unions directly affect expected returns,
independently of any effect they may exert through financial leverage.
The roadmap of the paper is as follows. Section I describes the data sources,
defines the main variables, and examines the source of variation in the unionization data.
Section II relates unionization to the cross-section of expected stock returns. Section III
takes a closer look at the identification of the model. Section IV establishes causality
from unions to expected returns. Section V presents evidence on the relation between
unions and operating leverage. Section VI reports various additional tests. Section VII
concludes.
I. Data Sources and Variable Definitions
In this section, we describe our data sources and sample selection. We also define the
main variables and report their summary statistics.
A. Data Sources and Sample Selection
We obtain industry unionization data for the period 1983-2004 from the Union
Membership and Coverage Database maintained by Barry Hirsch and David Macpherson
and available at www.unionstats.com. The data are compiled from the Current Population
Survey (CPS) using the methodology of the Bureau of Labor Statistics (BLS). Hirsch and
Macpherson (2003) provide details on the construction of this unique and comprehensive
4 Also related is the recent study by Berk, Stanton, and Zechner (2006) who relate labor relations to financial leverage.
6

data set. Most of our additional data come from the Center for Research in Security
Prices (CRSP), Compustat, and the Institutional Broker Estimates System (I/B/E/S).
Industry unemployment and work force demographics are computed using data from the
Current Population Survey Labor Extracts, also known as the Merged Outgoing Rotation
Group Files. The presidential election data come from Dave Leip’s Atlas of U.S.
Presidential Elections, available at www.uselectionatlas.org.
To construct our sample, we start with the set of firms in the CRSP-Compustat
Merged Database. We only include companies with ordinary shares (CRSP share codes
10 or 11) and exclude companies in the financials (SIC codes 6000 to 7000) and utilities
(SIC codes 4900 to 5000) industries. Our final sample contains information about all non-
financial, non-utility firms in the CRSP-Compustat Merged Database for which we can
compute expected returns and we have no missing data on unionization or on our control
variables. Since our analysis uses lagged explanatory variables, unionization rates and
our control variables span the period 1983-2004 while our dependent variables span the
period 1984-2005. The exception is the implied cost of equity that we can only compute
for the period 1984-2004 due to limited availability of analyst forecast data.
B. Labor Unions: Role, Measures, and Source of Variation in the Data
Labor unions legally represent union members in the collective bargaining over
wages, benefits, and working conditions, and also if management attempts to violate
contract provisions. Although union membership as a percentage of the total workforce
has declined slowly but steadily from the peak membership in the mid-1950s, unions still
exert an important impact on firms’ decisions.5
5 For example, unions opposed General Motors’ labor restructuring plans, a merger between U.S. Airways Group and America West, and resisted Sprint Nextel Corp.’s plan to spin off its local phone business into
7

We measure labor force unionization (UNION) as the percentage of employed
workers in the Census Industry Classification (CIC) industry covered by unions in the
collective bargaining with the firm.6 Our data set contains 199 CIC industries, which
roughly correspond to 3-digit SIC industries. While we measure expected returns at the
firm level, a typical problem in studies on labor unions is the lack of the firm-level
unionization data. As a result, many studies, including this one, rely on labor unionization
rates measured at the industry level. We believe that this limitation does not pose a
serious problem for our study. While there is substantial variation in the unionization
rates across industries, firms within narrowly defined industries are likely to exhibit
similar unionization rates. In addition, to the extent that the industry-level unionization is
a noisy proxy for firm-level unionization this limitation should bias our tests against
finding any relation between unionization and expected returns.
Our study relates the variation in industry unionization to the variation in
expected returns. Thus, it is important to document the source and amount of the
variation in UNION. Table I reports summary statistics on unionization rates for the ten
most and least unionized industries.
Insert Table I about here
We observe a significant variation in unionization rates across different industries.
Railroads, pulp and paper, steelworks, and motor vehicles are among the most unionized
industries with the average rates above 47% during the period 1983-2004. In contrast,
small retail industries are generally not unionized, with an average unionization rate of
about 1%. The table illustrates both the cross-sectional and time-series variation in the an independent company. In addition, the AFL-CIO recently announced it would push a bill requiring large employers to spend the equivalent of 8% of their payroll on health-care benefits for employees. 6 While we follow the existing literature in labor economics and use union coverage in our analysis, the data also contain union membership, defined as the fraction of the industry’s workers that are union members. Our results are similar if we use union membership instead.
8

unionization rates. In general, we observe a decreasing trend in the unionization rates
over time, with aggregate union coverage decreasing from 20.43% in 1983 to 11.20% in
2004. We inspect this variation in more detail by running two separate regressions of
unionization rates on CIC industry and year dummies. We find that the industry variation
can explain about 88% of the total variation in the unionization rates, while the time
variation accounts for only 4%. Hence, we conclude that the primary source of variation
in our data originates in the cross-sectional differences in the industry unionization rates.
We use this variation to identify our results in the subsequent sections.
C. Variables for Expected Return Regressions
Our empirical model uses expected returns as the dependent variable, which we
measure using either the Fama-French (1993, 1997) cost of equity (FFCOE) or the
implied cost of equity (ICOE) of Gebhardt, Lee, and Swaminathan (2001).7 The
Appendix provides further details on the estimation of these variables.
In addition to our test variable (UNION) we include several control variables.
Sales beta (SALESBETA) is the cyclicality of revenues in a firm’s CIC industry,
computed using quarterly data as the slope from a full-sample time-series regression of
changes in industry log sales over the one-year period on log GDP growth over the same
period. Financial leverage (FINLEV) is the ratio of total liabilities (Item 181) and assets
(Item 6). The ratio of fixed assets to total assets (FA/TA) measures capital operating
7 The choice of these variables is primarily based on their popularity in the literature. However, each of the measures alone may be subject to different kinds of criticisms. For example, the Fama-French cost of equity strictly depends on the specification of the asset pricing model. Moreover, Daniel and Titman (1997) argue that stock characteristics rather than the Fama-French factors are more likely to explain the cross-section of asset returns. At the same time, the implied cost of equity relies on some assumptions regarding the stochastic process governing returns and cash-flows, which are not required for estimating the Fama-French cost of equity. Thus, using both measures gives us more confidence that our results are not spurious.
9

leverage and is defined as net property, plant & equipment (Item 8) over total assets (Item
6). The industry’s capital to labor ratio (INDKL) is the sum of net fixed assets (Item 8)
across all firms in the same CIC industry divided by the sum of the number of employees
(Item 29) across all firms in the industry. We divide the ratio by 1,000 to express it in
millions of dollars of physical capital per employee. FIRMAGE is the natural logarithm
of the number of years since a firm first appears in CRSP. LOGSALGR is the change in
the natural logarithm of the firm’s net sales (Item 12). LOGASSETS is the natural
logarithm of the firm’s book assets (Item 6). VOLAT is the standard deviation of daily
stock returns during the year. INDCONC is a Herfindahl Index of sales concentration in
the firm’s CIC industry, which we average over the past three years to minimize the
influence of potential data errors on our concentration index. We winsorize SALESBETA
at the 5% level and both FINLEV and VOLAT at the 1% level.
In Section III we employ interaction terms between unionization (UNION) and
three proxies for the bargaining environment. UNEMPL is the unemployment rate within
the firm’s CIC industry. DEMOCRAT is the fraction of workers within a Census Industry
Classification (CIC) industry that is located in a democratic state. We define a democratic
state as one in which the Democratic party won the majority of electoral votes in the most
recent presidential election. BUSCONC is the Herfindahl index measuring the
concentration of a firm’s sales across its business segments. In Section IV we use as
instruments two demographic characteristics of the labor force in the firm’s CIC industry.
These include the percentage of female workers, FEMALE, and the average age of
workers, WORKERAGE.
10

Panel A of Table II reports summary statistics for the sample used in the Fama-
French cost of equity regressions, while Panel B reports statistics for the sample used in
the implied cost of equity regressions.
Insert Table II about here
The mean and median FFCOE in our sample equal 14.3% and 14.0%,
respectively, with a standard deviation of 8.3%. Likewise, the mean and median ICOE
amount to 10.4% and 11.4%, respectively, with a standard deviation of 5.6%. The
magnitudes of other variables are similar to those reported in previous studies. The
sample for the Fama-French cost of equity analysis consists of 8,682 firms, while the
analysis of the implied cost of equity uses 4,835 firms.
D. Variables for Operating Leverage Regressions
The dependent variable is operating leverage (OPLEV). Following Mandelker and
Rhee (1984) and Xing and Zhang (2004) we calculate operating leverage as the elasticity
of a firm’s operating income after depreciation with respect to its sales. For firms with
positive EBIT we calculate this elasticity by running the time-series quarterly regression
of log EBIT on log SALES using the 15 most recent quarterly observations. The
coefficient on log SALES measures the elasticity, and is termed OPLEV. For firms with at
least one negative value of EBIT, we approximate the elasticity by running a similar
regression of EBIT on SALES and then multiplying the coefficient on SALES by the ratio
of average sales over the period and the average operating income. We winsorize OPLEV
at the 5% level. Our controls include LOGASSETS, TOBQ, FA/TA, INDKL, and FINLEV.
Tobin’s Q, TOBQ, is defined as the market value of assets (market capitalization plus
book debt) over book assets. Panel C presents summary statistics for the sample of 7,248
firms for which we can compute OPLEV.
11

II. Unionization and Expected Returns
We argue that labor unions increase firms’ shares of fixed labor costs in total
labor costs. The resulting increase in a firm’s operating leverage increases systematic
risk. This occurs because operating leverage magnifies a firm’s intrinsic business risk
(e.g., Rubinstein (1973)). As a result, investors require higher expected returns. Hence,
we hypothesize a positive relation between labor unions and the expected stock returns.
In this section, we examine whether expected returns are systematically related to
the degree of unionization in the firm’s CIC industry. Using a portfolio approach we first
examine a univariate association between unionization and expected returns measured as
the Fama-French cost of equity (FFCOE) or the implied cost of equity (ICOE). To this
end, in each year we sort companies into quintile portfolios based on their last year’s
industry unionization rates. Quintile 1 includes firms with the lowest, while Quintile 5
includes firms with the highest unionization rates. Next, we calculate the equal- and
value-weighted expected returns for each of the five portfolios. Panel A of Table III
presents the results.
Insert Table III about here
The table shows a strictly increasing pattern in expected returns as we move from
the lowest to the highest unionization portfolio for both the equal- and value-weighted
portfolios. For both the FFCOE and ICOE samples, the average unionization rate ranges
from about 2.5% in Quintile 1 to about 33% in Quintile 5. The difference in the Fama-
French cost of equity between Quintile 5 and Quintile 1 equals 0.94 percentage points per
year for the equal-weighted portfolio and 2.31 percentage points per year for the value-
weighted portfolio. Both numbers are highly statistically significant. Likewise, for the
12

implied cost of equity the respective differences between Quintile 5 and Quintile 1 are
2.73 and 2.10 percentage points.
While our objective is to test whether unionization is related to expected returns,
our task is complicated by the fact that unionized firms differ from other firms in several
dimensions. We thus turn to a multivariate analysis, in which we estimate the following
cross-sectional regression:
ERijt+1 = a0 + a1 UNIONjt + a2 Controlsijt + εijt+1, (1)
where i indexes firms, j indexes the firm’s CIC industry, and t indexes year. Our
dependent variable ER, the expected return, is proxied by either FFCOE or ICOE, while
our test variable is the percentage of workers in the industry covered by unions (UNION).
Existing theories predict that expected returns should be affected by firms’ revenue
cyclicality (SALESBETA), financial leverage (FINLEV), and operating leverage. Since
operating leverage can be induced by capital or labor, and the unionization rate proxies
for labor operating leverage, we control for operating leverage due to capital (FA/TA) and
also include the relative importance of labor in affecting total operating leverage, INDKL.
In addition, we add in other firm characteristics that earlier research has found to be
correlated with expected returns, including FIRMAGE, LOGSALGR, LOGASSETS,
VOLAT, and INDCONC.8 To control for time and industry variation in the expected
return, each regression includes year dummies and one-digit SIC industry dummies. The
coefficient of interest is a1, which measures whether companies in more unionized
industries have different expected returns than do other companies. The null-hypothesis is
that it is zero, whereas our prediction is that it will be significantly greater than zero.
8 Our results hold, with a slightly lower economic and statistical magnitude, if we include the book-to-market ratio as an additional control. However, given that our expected return measures by construction are related to the book-to-market ratio we do not include it in our main tests.
13

To assess the statistical significance of our estimates, throughout the analysis we
use a conservative method of running a pooled OLS regression and clustering standard
errors at the CIC industry level. The worry is that the errors, conditional on the
independent variables, are correlated within industry groupings (e.g., Moulton (1986)).
Clustered errors assume that observations are independent across industries, but not
necessarily independent within industries. They also respond to the concern that UNION
is an industry-level variable.9 Panel B of Table III reports the results of estimating
equation (1).
We continue finding a positive and statistically significant relation between
unionization rates and expected returns. In column (1), we regress FFCOE on UNION
and industry and year dummies. The coefficient on UNION is 0.046 and is statistically
and economically significant. In column (2), we add SALESBETA, FINLEV, FA/TA, and
INDKL, while column (3) additionally includes FIRMAGE, LOGSALGR, LOGASSETS,
VOLAT, and INDCONC. We find that including these standard controls reduces the
magnitude of the coefficient on UNION to 0.037, while the coefficient remains
statistically significant at the 5% level of significance. In terms of the economic
significance, a one-standard-deviation increase in the unionization rate increases the
expected return by approximately 0.51 percentage points per year. The coefficients on
SALESBETA, FINLEV, LOGASSETS, and VOLAT are positive, the coefficient on
FIRMAGE is negative; they are all statistically significant. In contrast, FA/TA, INDKL,
LOGSALGR, and INDCONC have little impact on the Fama-French cost of equity.
In columns (4)-(6), we examine the effect of unions on the implied cost of equity
(ICOE). In column (4), we regress ICOE on UNION and industry and year dummies. The 9 Petersen (2005) discusses various reasons for clustering that allow assessing statistical significance of estimated coefficients.
14

coefficient on UNION is 0.116 and is statistically and economically significant. Once we
add in all the other controls, the magnitude of the coefficient drops to 0.112, but the
coefficient remains significant at the 1% level of significance. A one-standard-deviation
increase in the unionization rate is associated with an economically significant increase in
the implied cost of equity of 1.46 percentage points per year. Taken together, our results
indicate a strong positive association between unionization rates and expected returns.
It is noteworthy that the effect of unionization on expected returns is larger in
magnitude if we measure expected returns with ICOE rather than with FFCOE. One
reason for this difference may be that the Fama-French cost of equity is estimated
imprecisely (e.g., Fama and French (1997) and Pástor and Stambaugh (1999)). Another
reason may be the differences in the samples we use for ICOE and FFCOE. In particular,
the sample we use for ICOE contains only the largest firms, for which earnings forecasts
are available, while the sample used for FFCOE includes all firms in the CRSP-
Compustat universe, thus containing a significant fraction of smaller firms that are not
covered by analysts. To check how much any discrepancies in the sample composition
can explain the observed differences in magnitudes, we repeat the FFCOE regression on
the subset of firms for which we can compute ICOE. In the specification including all
control variables we find that the coefficient on UNION increases to 0.077 and is
statistically significant. A one-standard-deviation increase in the unionization rate
increases the Fama-French cost of equity by 1 percentage point per year, which is closer
to, but still less than, the magnitude of the effect that we observe for ICOE.
III. Identification
Our results in the previous section show that firms in more unionized industries
exhibit higher expected returns. This finding is consistent with the notion that unions
15

reduce the variation in employment and wages and increase firms’ operational risk.
However, one could argue that our empirical model may be misspecified due to omitted
or unobservable firm or industry characteristics that are correlated with unionization.
To provide additional evidence that our tests do not identify a spurious relation
between unionization rates and expected returns, we study the cross-sectional variation in
the unionization premium arising from differences in the bargaining environment that
could affect the strength of unions. We posit that in more favorable bargaining situations
labor unions should be more able to affect firms’ operating risk and therefore expected
stock returns. Thus, evidence that the unionization premium is higher when unions face a
more favorable bargaining environment would support our hypothesized relation between
labor unions and expected returns.
To test this prediction, we estimate the following general regression:
ERijt+1 = a0 + a1 UNION jt + a2 POWijt+a3 UNION jt*POWijt+b Controlsijt + εijt+1, (2)
where UNION and Controls mirror specification (1). In addition, we alternately include
three variables (POW), which serve as proxies for the union’s bargaining environment,
and their interactions with UNION. Our proxies include CIC industry-level
unemployment rate (UNEMPL) and political environment (DEMOCRAT), as well as the
concentration of a firm’s sales across its business segments (BUSCONC). The coefficient
of interest is a3, which represents the effect of UNION on ER, conditional on unions’
bargaining power.
Our intuition for using these variables is as follows. First, higher unemployment
undermines unions’ ability to affect a firm’s decision making, as companies are able to
16

more easily substitute its unsubordinated workers with those who are unemployed.10 We
predict that higher industry unemployment should weaken union’s bargaining power,
which then implies a negative coefficient on UNION*UNEMPL. Second, in the U.S. the
Democratic party tends to favor unions and thus to enhance the effectiveness of unions’
actions. We predict that unions operating in industries that are more likely to enjoy the
support from the Democratic party should have stronger bargaining power, which then
implies a positive coefficient on UNION*DEMOCRAT. Finally, firms with more
diversified business operations possess a bargaining advantage over unions because they
can use their “deep pockets” to cross-subsidize strikes or other costs related to unions’
activity (Rose (1991)). Thus, we predict a positive coefficient on UNION*BUSCONC.
Table IV reports the results for both FFCOE and ICOE. To facilitate the
interpretation of our results, we demean UNION and POW before forming interaction
terms in equation (2). The coefficients on the control variables are omitted for brevity.
Insert Table IV about here
We find results consistent with our prediction. The coefficient on
UNION*UNEMPL is negative, while the coefficients on UNION*DEMOCRAT and
UNION*BUSCONC are both positive. All three interaction terms are statistically
significant for both FFCOE and ICOE. Thus, the effect of labor unions on expected
returns is weaker when the unemployment rate in the firm’s industry is higher.
Conversely, the effect is stronger when a larger fraction of the industry’s workers is
located in the democratic states or the firm’s operations are more concentrated across
business segments.
10 For example, this process has been recently observed in the airline industry, in which the strike of the mechanic workers in Northwest Airlines led the management to substitute the workforce with the available free outside workers. In this case, the boycott orchestrated by unionized workers was not successful.
17

Overall, the results in this section indicate that the positive effect of labor unions
on expected returns is stronger when unions operate in a more favorable bargaining
environment and thus have more power to affect firms’ operations. This evidence implies
that our results are unlikely to be driven by the omission of unobservable firm or industry
characteristics correlated with unionization.
These results also serve two other purposes. First, the systematic patterns in the
unionization premium suggest that differences in risk rather than in relative mispricing
are more likely to explain the unionization premium in expected returns. Second, the
results suggest that the causality is likely to run from unionization to expected return.
IV. Endogeneity
Our analysis suggests that the presence of unions increases firms’ operation risk
and thus the expected stock returns. One concern with this argument is that of reverse
causality. In particular, higher unionization may be more likely to arise in firms operating
in more risky industries, with higher expected returns. Thus, labor unions themselves
may not cause an increase in the firm’s risk, but rather firm risk may cause higher
unionization. In this section, we show that our results are robust to the endogeneity
concern using a two-stage least squares (2SLS) regression. This method relies on
instrumental variables to guarantee the consistency of our estimates under the null that
unionization and expected returns are simultaneously determined (at the cost of losing
efficiency and thus reducing statistical significance).
Since unionization is measured at the CIC industry level, we construct our
instruments at the industry level. Motivated by the labor economics literature on the
determinants of unionization (e.g., Hirsch (1980, 1982)), we instrument UNION using
two demographic characteristics of the industry’s labor force that we construct from the
18
Census Population Survey: the fraction of female workers (FEMALE) and the average
age of workers (WORKERAGE). We argue that both FEMALE and WORKERAGE are
economically related to UNION, but uncorrelated with the error term of the second-stage
regression relating expected returns to unionization.
Specifically, female workers are less likely to unionize because women, on
average, have less permanent attachment to the labor market and to specific internal job
ladders than do men. In addition, the expected benefits (particularly non-wage benefits)
from being a union member may be smaller for female workers and their costs of
organizing may be greater. For example, the choice of union membership for women is
informed by their responsibilities at home (Kessler-Harris (1975)). Thus, we expect a
negative relation between FEMALE and UNION. Similarly, the industry workforce age
structure may be related to the unionization level. Since senior workers have relatively
strong job attachment and low mobility, their expected benefits from unionization are
high (in the form of institutionalized work rules, strict seniority systems, grievance
procedures, and health and pension benefits), while organizing costs may be relatively
low. Thus, we expect a positive relation between WORKERAGE and UNION. At the
same time, we do not have reasons to believe that our instruments would have a direct
economic impact on expected returns, and thus they are unlikely to be correlated with the
error term in the second-stage regression.
Table V reports the two-stage least squares (2SLS) estimates of equation (1), in
which we treat UNION as an endogenous variable that we instrument with FEMALE and
WORKERAGE. Panel A reports the first-stage results relating UNION to FEMALE,
WORKERAGE, and to the exogenous variables of the model. Panel B reports the second-
19

stage regressions of expected returns on the value of UNION predicted in the first-stage
regression and the corresponding exogenous control variables.
Insert Table V about here
Consistent with the hypothesized economic relation between our instruments and
unionization, the first-stage results show that UNION is negatively affected by FEMALE
and positively affected by WORKERAGE. Both coefficients are statistically significant at
the 1% level of significance. Our instruments have strong predictive power. The partial
R-squared of the first-stage regression indicates that they explain around 14% of the
variation in unionization, net of any effect they may have through other explanatory
variables. In addition, the F-test rejects the null that the coefficients on both instruments
are jointly zero. Finally, the test of overidentifying restrictions fails to reject the joint null
hypothesis that our instruments are uncorrelated with the error term and are correctly
excluded from the second-stage regression.
The second-stage results continue providing strong evidence of a statistically
significant and positive relation between UNION and both the Fama-French cost of
equity (FFCOE) and the implied cost of equity (ICOE). The magnitude of the estimated
2SLS coefficients is very similar to that in the OLS regressions, reported in Table III. In
addition, the Hausman test cannot reject the null hypothesis that the 2SLS and OLS
coefficients on UNION are the same. Hence, we conclude that our OLS results are robust
to endogeneity concerns, that is, our OLS estimates are not biased due to endogeneity and
higher unionization causes higher expected returns.
V. Unionization and Operating Leverage
To the extent that labor unions reduce the variability of wages and employment,
unionization may serve as a proxy for operating leverage due to fixed labor costs. Hence,
20

we argue that unionization should be related to expected stock returns because labor
unions increase firms’ operating leverage. To provide evidence for this conjecture, in this
section, we investigate the link between unionization and total operating leverage, which
captures all of a firm’s fixed costs. Our task is complicated by the fact that it is difficult
to precisely measure a firm’s true operating leverage. Nevertheless, if our conjecture is
valid then unionization should be associated with variables that previous research has
related to total operating leverage. To this end, in our subsequent analysis we rely on two
different approaches.
In our first approach we examine the empirical relation between unionization and
the estimate of operating leverage, OPLEV. If higher expected returns in more unionized
firms are indeed due to higher operating leverage, we should expect a positive association
between UNION and OPLEV. In Panel A of Table VI we study the univariate relation
between these variables using a portfolio approach. For that reason, in each year we sort
companies into quintile portfolios based on their last year’s industry unionization rates.
Quintile 1 includes firms with the lowest, while Quintile 5 firms with the highest
unionization rates. Next, for each of the five portfolios we calculate the equal- and value-
weighted operating leverage.
Insert Table VI about here
The results indicate a strongly increasing trend in operating leverage as we move
from the lowest to the highest unionization portfolio. The differences in operating
leverage between Quintile 5 and Quintile 1 equal 0.62 for the equal-weighted and 0.32
for the value-weighted portfolio, and are both statistically significant.
21
To further explore the relation between unionization and operating leverage, we
extend our analysis to a multivariate regression setting, in which we control for other
variables that may possibly drive out the effect of labor unions. Our set of controls
includes LOGASSETS, TOBQ, FA/TA, INDKL, and FINLEV. In all specifications we
additionally include one-digit SIC industry and year fixed effects. As before, we cluster
standard errors at the CIC industry groupings. Panel B of Table VI presents the
estimation results.
In column (1) we consider UNION as the only explanatory variable. Consistent
with our hypothesis, we find that unionization is positively related to operating leverage.
In column (2) we include all other controls. The results remain qualitatively similar in
terms of their statistical significance, but the economic significance drops: A one-
standard-deviation increase in UNION increases OPLEV by 0.13, which is equivalent to
an 8% increase. Overall, we conclude that unionization is highly related to firms’
operating leverage, which is consistent with our prediction that labor unions increase
expected returns because they increase firms’ share of fixed costs.
To further examine the link between unionization and operating leverage, in our
second approach we look at the individual components of the Fama-French cost of
equity. Recent research suggests that book-to-market equity explains the cross-section of
stock returns because it is correlated with firms’ operating leverage. For example,
Carlson, Fisher, and Giammarino (2004) argue that when demand for a firm’s product
decreases, variable costs decrease while fixed costs do not, which leads to higher
operating leverage. The associated increase in systematic risk and expected returns causes
a decrease in equity values, which translates into a higher book-to-market ratio (see also,
Cooper, 2006; Gourio, 2005 for related arguments). Thus, if unionization indeed
22

increases expected returns through higher operating leverage we should observe a
positive relation between unionization and HML beta.
We investigate the relation between unionization and each of the loadings on the
Fama-French factors: market beta, SMB beta, and HML beta. This decomposition allows
us to identify the specific channels through which unions affect the Fama-French cost of
equity. To this end, in each year we sort firms into quintile portfolios based on their
unionization rates and compute equal-weighted averages of each loading. Panel A of
Table VII shows that the market beta in Quintile 5 is lower than that in Quintile 1, but we
find no statistically significant difference in market betas across Quintiles 2-4.11 In
contrast, we observe a large negative effect of unionization on SMB beta, which we
attribute to the fact that more unionized firms generally tend to be larger. Finally, the last
column of the table shows that higher unionization rates are associated with substantially
higher HML betas: The difference in betas between Quintile 5 and Quintile 1 equals 0.42,
an economically and statistically significant number.
Insert Table VII about here
Panel B examines the effect of UNION on each loading separately using a
multivariate regression framework. We find no relation between market beta and
unionization. In addition, the negative effect of UNION on SMBBETA vanishes once we
include the control variables. The only statistically significant result is the strong positive
effect of UNION on HMLBETA.
In sum, we show that unionization is positively related to a direct measure of
operating leverage and that unionization increases the Fama-French cost of equity
primarily through its effect on HML beta, which previous research has related to 11 This result is consistent with Hirsch and Morgan (1994) who find no systematic difference in the CAPM beta between unionized and non-unionized workers for the 1970s and 1980s.
23
operating leverage. Thus, our findings support the intuition that labor unions increase
firms’ operating leverage and thus investors’ required returns on equity.
VI. Additional Tests
This section describes a number of additional tests and robustness checks. For
brevity we omit some of the tables which are available upon request.
A. Unionization and Market Valuation
As an alternative approach to study the economic impact of unions on expected
returns, we investigate the direct effect they have on a firm’s market value of equity. The
main advantage of this approach is that it does not rely on any specific model to estimate
required returns on equity. At the same time, equity values are affected by both cash
flows and discount rates, which makes it more difficult to identify the pure discount rate
effect.
Since equity values may be influenced by both the expected returns and the cash-
flow growth rate, we try to separate the pure discount-rate effect of unions on equity
values by utilizing an empirical model similar to that in Pástor and Veronesi (2003).
Using annual frequency data, we run the regression of a firm’s log book-to-market ratio
(LOGBM) on UNION, controlling for the level and volatility of return on equity as well
as for other firm characteristics related to equity values:
LOGBMijt = a0 + a1 UNIONjt + a2 Controlsijt + εijt, (3)
The control variables include previously defined LOGASSETS, FINLEV, and
FIRMAGE, as well as return on equity (ROE) and volatility of ROE (VOLROE). ROE is
the ratio of earnings (income before extraordinary items available to common
shareholders (Item 237), plus deferred taxes from the income statement (Item 50), plus
24

investment tax credit (Item 51)) to book value of equity. To measure the volatility of
ROE, we follow Pástor and Veronesi (2003) and estimate an AR(1) model for each
stock’s ROE using a 10-year series of the company’s valid annual ROEs. Next, we
calculate VOLROE as the variance of the residuals from this regression. We winsorize
both ROE and VOLROE at the 1% level.
The null hypothesis is that a1 is equal to zero. According to our hypothesis a1
should be positive, that is, higher discount rates should reduce market values and thus
increase book-to-market ratios. In our regressions, we cluster standard errors at the CIC
industry level. Table VIII presents the results of this estimation.
Insert Table VIII about here
We find that unionization is inversely related to market equity values.
Specifically, in column (1), we regress LOGBM on UNION and the one-digit SIC
industry and year dummies. The coefficient on UNION equals 1.112 and is statistically
and economically significant. In columns (2)-(3), we add in all other controls. For the
most comprehensive specification in column (3), the coefficient on UNION drops to
0.735, but remains significant at the 1% level of significance. This coefficient implies
that a one-standard-deviation increase in unionization increases LOGBM by 0.735*0.123
= 0.09 per year, or decreases the market-to-book equity by 9%. The effect of other
variables on LOGBM is consistent with the results presented in previous work (e.g.,
Pástor and Veronesi (2003)), that is, the coefficients on LOGASSETS and VOLROE are
negative, while the coefficients on FINLEV, FIRMAGE, and ROE are positive and
statistically significant.
To further assess the correspondence between our valuation results and the
expected return results, we consider an average firm that grows as perpetuity at a constant
25

rate. Using the Gordon growth model with constant growth rate and assuming that
dividends are proportional to book value, one can show that the sensitivity of the
valuation ratio to changes in the discount rate equals:12
grr
MB−
=∂
∂ 1)/ln( , (4)
where r is the expected return and g is the dividend growth rate, both evaluated at their
sample means. Following other studies (e.g., Lettau and Ludvigson (2005)), we assume
the average dividend growth rate to be equal to 5%. The average discount rate is fixed at
the sample mean of our expected return measures. As an example, we consider the Fama-
French cost of equity, whose sample average equals 14.3%. We then obtain that the 9%
increase in the log book-to-market ratio corresponds to an implied 0.84 percentage points
increase in the discount rate, which is only slightly higher in magnitude than the direct
effect of about 0.5 percentage points, reported in Table III. The results for the implied
cost of equity are qualitatively similar.
In sum, we find evidence that unionized firms tend to exhibit significantly lower
equity values, even after controlling for the level of their expected growth rates. These
results provide further support for the effect of unions on expected returns.13
These findings also shed light on the issue of whether unions are beneficial to the
firm. While we argue that stronger unions use their power to obtain concessions from
employers, which then leads to higher operating leverage, a benevolent view holds that
labor unions may also allow workers to communicate more efficiently with management.
Given that the main concern of workers is stability of their jobs and compensation during
12 From the Gordon valuation model, P=D/(r-g). Assuming D=c*B and taking log of both sides, we obtain ln(B/M)=ln(r-g)-ln(c). Differentiating with respect to r and given that c is constant delivers the result. 13 These results are consistent with prior studies by Salinger (1984) and Hirsch (1990, 1991) that document, for a smaller sample of firms and different period, a negative effect of unionization on Tobin’s Q.
26
uncertain industry conditions, unions may improve labor contracts by facilitating optimal
risk-sharing arrangements between well-diversified shareholders and risk-averse workers,
whose salaries and human capital are tied to the firm. If unions improve the efficiency of
bargaining outcomes by reducing the variability of employment and wages, one should
still expect firms to have higher operating leverage. Thus, this alternative view of unions
generates a similar prediction on expected returns. The main difference, however, is that
such arrangement should be beneficial for both workers and shareholders. Since we find a
negative effect of unionization on equity values we feel that the benevolent view is
unlikely to be the primary channel relating labor unions to expected returns. Casual
observations also suggest that employers typically resist workforce unionization.
B. Realized Returns
Our hypothesis relates unionization rates to expected returns. We rely on two ex-
ante measures: the Fama-French cost of equity and the implied cost of equity.
Alternatively, one could gauge expected returns using realized returns, under the
assumption that average realized returns converge to expected returns in the long run. We
explore the relation between monthly realized returns and unionization rates using a
portfolio approach. Specifically, in each month we assign all firms into quintile portfolios
according to their unionization rates and calculate the equal- and value-weighted
annualized return of each portfolio.
Insert Table IX about here
Table IX shows a weakly decreasing (increasing) relation between unionization
rates and returns for the equal-weighted (value-weighted) returns. However, the
difference between returns of the most and the least unionized portfolios is never
27

statistically significant. Thus, we observe no particular economic relation between
unionization and realized returns.
Further analysis suggests that the main reason for the lack of significant
association between unionization and realized returns is that, in this context, realized
returns are a noisy measure of expected returns.14 Specifically, realized returns would be
a good proxy for expected returns only if the unexpected component were orthogonal to
unionization. However, we show that in our sample the unexpected component of returns
is systematically and negatively related to the unionization rates. This occurs for two
reasons: 1) Unionized firms have had unexpectedly poor earnings; 2) Expected returns of
unionized firms have increased over our sample period, thus driving down prices and
realized returns.
To demonstrate this point formally, we consider the extended version of the
Campbell and Shiller’s (1988) decomposition, as in Vuolteenaho (2002) and Cohen,
Polk, and Vuolteenaho (2003). In particular, the difference between realized and expected
returns can be decomposed as follows:
(5) ,10
1 tj
jtj
tj
jtj
tttt rEeErEr κρρ +∆−∆=− ∑∑∞
=+
∞
=+−
where rt is the log return, et is the log return on equity (ROE), ρ is a constant that is
related to the dividend yield, and κt is an approximation error. ∆Et denotes the change in
expectation from t – 1 to t (i.e., Et (.) – Et-1 (.)). The parameter ρ is slightly less than 1.
The decomposition in (5) says that the unexpected stock returns can be low if either
expected future ROEs decrease and/or expected future returns increase. Our subsequent
analysis attempts to assess the importance of each of the two components. 14 The argument related to potential pitfalls of using realized returns has been forcefully presented by Elton (1999) in his Presidential address. Footnote 2 lists other studies that advocate ex-ante measures of expected returns in the finance literature.
28

Assuming that , where ER∑∑∞
=
∞
=+ =
11 jt
j
jjt
jt ERrE ρρ t is either FFCOEt or ICOEt,
we can write the formula in (5) as:
,)(
1
)()()(
13
2122
11111
tttj
jtj
t
tttttttttttttt
EREReE
eEeEeEeEeEerEr
κρ
ρρ
ρρ
+−−
−∆+
−+−+−=−
−
∞
=+
+−++−+−−
∑ (6)
Equation (6) shows how unexpected returns can be decomposed into unexpected
profitability (the first four terms) and the unexpected change in the discount rate, ERt –
ERt-1.
First, we focus on the cash-flow part and consider the first three terms in the
unexpected profitability. Building on Fama and French (2000) and Vuolteenaho (2002),
we estimate the expected profitability, E(e), year by year using cross-sectional
regressions of ROE on a set of predictors that previous studies have used in this context.
ROEit = a0 + a1 ROEit-s+ a2 Predictorsit-s + εit s =1, 2, 3 (7)
We include an autoregressive term for ROE and a set of previously defined
predictors: LOGBM, LOGAGE, INVEST, VOLAT, LOGSIZE, FA/TA, as well as NODIV
and DIVB. NODIV is a dummy equal to one if the firm does not pay dividends in a given
year and zero, otherwise. DIVBV is dividend payments divided by book equity. For each
company i we calculate the first three terms of equation (6) using different lag
specifications of the model in (7). Next, each year we group firms into quintile portfolios
according to their unionization rates and calculate average unexpected profitability for 1,
2, and 3 periods ahead. We report the results in Panel A of Table X.
Insert Table X about here
The results indicate a negative relation between unionization rates and each of the
three terms of unexpected profitability. This relation is statistically significant for the first
29

term, while it is insignificant for the remaining two elements. Therefore, unionized firms
experienced unexpectedly low profits moving forward.
Second, we examine whether, relative to those of low-unionization firms,
expected returns of high-unionization firms have changed over our sample period. To this
end, we divide our sample into five periods. For each sub-period we group firms into
quintile portfolios according to their unionization rates and calculate the average value of
FFCOE and ICOE of each quintile portfolio. We also calculate the average return of a
zero-investment portfolio that takes a long position in Quintile 5 and a short position in
Quintile 1. Panel B of Table X reports the results.
The return on the hedge portfolio is positive in all periods and generally increases
over time. The trend is more pronounced for ICOE and is weakly positive for FFCOE. In
both cases, the unionization premium in the last period is higher than that in the first
period, though the difference is statistically significant only for ICOE. Thus, we conclude
that more unionized firms have recorded unexpectedly high discount-rates over time.
In sum, we show that unionization rates are not significantly related to realized
returns, mostly because those companies suffered from disadvantageous unexpected
events, both in terms of their profitability and discount rates. Thus, direct estimates of
expected returns, such as FFCOE and ICOE, are more suitable to capture the economic
relation between unionization rate and expected returns than are realized returns.
C. Financial Leverage
Our results suggest that labor unions increase expected returns by increasing
operating leverage. A possible concern with this interpretation is that this effect may be
due to financial leverage rather than due to operating leverage. For example, Bronars and
Deere (1991) and Matsa (2005) find that higher unionization is associated with higher
30

financial leverage, as firms rely more on debt financing to shelter their cash-flows from
union demands (this relation also holds in our data). Since financial leverage is related to
expected returns the effect could naturally follow.
To address this possibility, throughout our analysis we include financial leverage
as a control and find that it does not significantly weaken the coefficient on UNION. This
suggests that our results identify the effect of unions on expected returns, net of any
effect they may have through higher financial leverage. In addition, we consider the
unlevered cost of equity calculated from the Modigliani-Miller formula with taxes.
Working with unlevered cost of equity eliminates any concern that financial leverage
may alter our results. The formula we use to unlever cost of equity is given by:
)1)(/(1)1)(/(
tSDrtSDER
UNLCOE D
−+−+
= (8)
where UNLCOE denotes unlevered cost of equity, ER is the levered cost of equity,
defined as either FFCOE or ICOE, rD denotes cost of debt, D and S are respectively the
levels of debt and market equity, and t is the maximum corporate tax rate in a given year.
The data on cost of debt are generally fairly sparse, which would significantly
reduce our sample size and thus make any comparisons difficult. To alleviate this
problem, we estimate cost of debt for each firm-year in our sample by mapping a firm’s
S&P debt rating to the average bond yield corresponding to its debt rating category. Only
a reduced number of firms in our sample have credit ratings. We estimate missing credit
ratings for other firms according to the following procedure. For the subset of companies
with credit ratings, we estimate an ordered logit model with the S&P debt rating as the
dependent variable and a set of explanatory variables. Our predictors include the
31
logarithm of the firm’s assets, financial leverage, revenue cyclicality, profitability,
interest coverage, the natural logarithm of the firm’s age, excess returns, and the volatility
of excess returns. We then use the estimated coefficients of this model to predict the debt
rating for all the other companies with missing ratings that have non-missing data for the
complete set of predictors. For every year, we then match a firm’s debt rating to the
average bond yield in its rating category. We calculate average bond yields using
individual yields from SDC Platinum and averaging them out across a rating category.
The estimated bond yields are then entered into equation (8) and deliver the unlevered
Fama-French cost of equity (UFFCOE) and the unlevered implied cost of equity
(UICOE).
Next, we run regressions similar to those in Table III using the unlevered cost of
equity, UNLCOE, as the dependent variable and excluding financial leverage from our set
of controls. Table XI reports the results.
Insert Table XI about here
We find a positive relation between unionization rates and the unlevered cost of
equity. The coefficients on UNION are statistically significant for both UFFCOE and
UICOE. In terms of their economic significance, a one-standard-deviation increase in the
unionization rate increases the unlevered Fama-French cost of equity by 0.34 percentage
points and the unlevered implied cost of equity by 1.15 percentage points. In comparison
to the results in Table III the magnitude of the results drops by about 25%. Hence, we
conclude that financial leverage cannot fully explain the impact of unions on expected
returns.
32

D. Year-by-Year Analysis and Economic Significance
While the primary source of variation in the unionization rates is cross sectional,
we also observe a downward trend in the unionization rates over time. It is thus possible
that the interpretation of our results may not precisely reflect the true cross-sectional
impact of unions or our results may be driven by a few particular periods in the data. To
address this concern, we redo our analysis for expected returns considering cross-
sectional regressions for each individual year. The estimated coefficients on UNION,
along with their respective t-statistics, are presented in Table XII. Columns (1) and (2)
report the results for FFCOE and columns (4) and (5) for ICOE.
Insert Table XII about here
Our findings indicate that the relation documented for the entire sample holds true
for most of the individual years. The coefficient on UNION is positive and statistically
significant in 14 out of the 22 years for FFCOE, and in 20 out of 21 years for ICOE.
Among those coefficients that are insignificant, the effect is positive in all but one case
for FFCOE and in all cases for ICOE.
To provide further evidence on the time-series impact of unions we evaluate the
degree to which they contribute to total expected returns. We estimate this impact by
taking the product of the coefficients and the average unionization rate in the period.
Columns (3) and (6) of Table XII deliver the results. We observe that, if anything, the
economic significance of unions has increased over time, especially when measured with
ICOE. The pattern observed for FFCOE is less pronounced, but we still observe that the
importance of unions in the recent periods has been very similar to that in the 1980s.
These results suggest that, despite the reduced influence of unions on firms’ cash-flows,
their effect on discount rates has become stronger in time, maybe because investors attach
33

more importance to unions’ actions. As a net effect, unions still exert a significant impact
on expected stock returns.
Overall, our analysis strengthens the cross-sectional interpretation of our results
and alleviates a potential concern that the unions’ impact on expected returns may be
only significant in the 1980s when unionization was a more wide-spread phenomenon.
E. Alternative Econometric Methods
Throughout our analysis we run pooled OLS regressions and asses the statistical
significance of our estimates using the conservative method of clustering standard errors
at the CIC industry groupings. Given the lack of agreement in the literature regarding the
type of specification one should use, in Table XIII we report the coefficients on UNION
along with their statistical significance for our main specification in (1) using various
alternative methodologies. For ease of comparison, the first row repeats the coefficient
estimates in the base-case specification. In rows two and three we cluster standard errors
at the firm- and time levels, respectively. The last row reports the results of the Fama-
MacBeth cross-sectional regressions with the Newey-West standard errors. To alleviate
any concern regarding the possible autocorrelation in errors we set the lag length to be 6,
which is higher than the length of the estimation window we use for estimating the factor
loadings in the Fama-French regression.
Insert Table XIII about here
Compared to the base-case regression, the t-statistics associated with the
coefficients on UNION more than double when we cluster standard errors by firm or by
year in both the FFCOE and ICOE regressions. The estimated effect of unions arising
from the Fama-MacBeth estimation is higher in magnitude than that arising from the
pooled OLS regressions, especially when we measure expected returns by FFCOE. For
34
both FFCOE and ICOE the t-statistics based on the Newey-West standard errors are
considerably larger.
In sum, we conclude that our method of running pooled OLS and clustering
standard errors at the CIC industry level provides the most conservative estimates both in
terms of their magnitude and statistical significance.
F. Miscellanea
The positive association between unionization and expected returns that we
document may be spuriously driven by the fact that unions are stronger in the “old-
economy” industries, which generally have higher operating leverage. To address this
concern, we additionally include in our regressions the book-to-market ratio as a proxy
for the firms’ maturity, with the caveat outlined in footnote 8. The results remain similar.
In addition, we construct an “old-economy” dummy equal to one if the firm belongs to an
“old-economy” industry, and zero otherwise. Following Ittner, Lambert, and Larcker
(2003), we identify the “old-economy” industries with SIC codes less than 4000 that are
not in the computer, software, internet, telecommunications, or networking industries.
Controlling for “old-economy” status does not affect our results.
Our analysis controls for industry differences using one-digit SIC dummies,
which ensures that it is not the variation in unionization across one-digit SIC industries
that identifies our results. To validate our results we estimate our main regressions after
transforming our variables into industry means. Our results remain qualitatively
unchanged. We also replace one-digit industry dummies by two-digit SIC industry
dummies. This finer industry partition better controls for unobserved time-invariant
industry characteristics that could be correlated with unionization rates (an even finer
35

industry partition is not feasible because our unionization variable is measured at the CIC
industry level). The results remain qualitatively similar.
We have also estimated expected returns using the four-factor model that
additionally includes the momentum factor. The momentum beta is unrelated to
unionization rates and the results for expected returns remain qualitatively similar.
Finally, we also include NASDAQ and S&P 500 dummies to control for any systematic
differences across firms that could be correlated with their trading exchange or index
membership. Our results remain unaffected.
VII. Conclusion
What determines expected returns is a fundamental question in finance. We revisit
this question from a new perspective, namely, that imperfections in the labor market may
affect expected returns in an important way. We focus on one important friction – that
generated by labor unions – and hypothesize that by increasing firms’ share of fixed labor
costs in their total labor costs, and thus firms’ operating leverage, labor unions may
increase firms’ systematic risk and hence their equilibrium expected returns.
Consistent with our hypothesis, we find that firms in more unionized industries
exhibit statistically and economically higher expected returns. Moreover, unions increase
firms’ operating leverage. In particular, unionization rates are positively related to our
estimate of operating leverage, and unions increase expected returns primarily through
the book-to-market channel, which previous research has related to operating leverage.
Furthermore, the effect of unions on expected returns is stronger when unions face more
favorable bargaining environments and thus are more able to affect firms’ operating
strategies. Taken together, our results support the hypothesis that labor unions increase
expected returns by increasing operating leverage. More generally, they point to the
36

importance of frictions in the labor market to explain the cross-sectional variation in
expected returns and motivate new ideas for future research.
References
Abowd, John M., 1989, The effect of wage bargaining on the stock market value of the firm, American Economic Review 79, 774-800.
Berk, Jonathan, Richard C. Green, and Vasant Naik, 1999, Optimal investment, growth options, and security returns, Journal of Finance 54, 1553-1607.
Berk, Jonathan, Richard Stanton, and Josef Zechner, 2006, Managerial ability and capital structure, Working Paper, University of California, Berkeley.
Booth, Laurence, 1991, The influence of production technology on risk and the cost of capital, Journal of Financial and Quantitative Analysis 26, 109-127.
Brav, Alon, Reuven Lehavy, and Roni Michaely, 2005, Using expectations to test asset pricing models, Financial Management.
Bronars, Stephen G., and Donald R. Deere, 1990, Union representation elections and firm profitability, Industrial Relations 29, 15-37.
Bronars, Stephen G., and Donald R. Deere, 1991, The threat of unionization, the use of debt, and the preservation of shareholder wealth, Quarterly Journal of Economics 106, 231-254.
Campbell, John Y., and Robert J. Shiller, 1988, The Dividend-Price Ratio and expectations of future dividends and discount factors, Review of Financial Studies 1, 195-228.
Carlson, Murray, Adlai Fisher, and Ron Giammarino, 2004, Corporate investment and asset price dynamics: Implications for the cross-section of returns, Journal of Finance 59, 2577-2603.
Claus, James, and Jacob Thomas, 2001, Equity premia as low as three percent? Evidence from analysts’ earnings forecasts for domestic and international stock markets, Journal of Finance 56, 1629–1666.
Cochrane, John H., 1991, Production-based asset pricing and the link between stock returns and economic fluctuations, Journal of Finance 46, 207-234.
Cochrane, John H., 1996, A cross-sectional test of an investment-based asset pricing model, Journal of Political Economy 104, 572–621.
Cohen, Randolph B., Christopher Polk, and Tuomo Vuolteenaho, 2003, The value spread, Journal of Finance 58, 609-641.
Cooper, Ilan, 2006, Asset pricing implications of nonconvex adjustment costs and irreversibility of investment, Journal of Finance 61, 139-170.
Daniel, Kent, and Sheridan Titman, 1997, Evidence on the characteristics of cross sectional variation in stock returns, Journal of Finance 52, 1-33.
37

Danthine, Jean-Pierre, and John B. Donaldson, 2002, Labour relations and asset returns, Review of Economic Studies 69, 41-64.
DiNardo, John, and David S. Lee, 2004, Economic impacts of new unionization on private sector employers: 1984-2001, Quarterly Journal of Economics, 1383-1441
Fama, Eugene F., and James D. MacBeth, 1973, Risk, return, and equilibrium: empirical test, Journal of Political Economy 81, 607-636.
Fama, Eugene F., and Kenneth R. French, 1993, Common risk factors in the returns on stocks and bonds, Journal of Financial Economics 33, 3-56.
Fama, Eugene F., and Kenneth R. French, 1997, Industry costs of equity, Journal of Financial Economics 43, 153-193.
Fama, Eugene F., and Kenneth R. French, 2000, Forecasting profitability and earnings, Journal of Business 73, 161-175.
Fama, Eugene F., and Kenneth R. French, 2002, The equity premium, Journal of Finance 57, 637–659.
Friend, Irwin, Randolph Westerfield, and Michael Granito, 1978, New evidence on the capital asset pricing model, Journal of Finance 33, 903–917.
Gebhardt, William R., Charles M. C. Lee, and Bhaskaran Swaminathan, 2001, Toward an implied cost of capital, Journal of Accounting Research 39, 135-176.
Gomes, Joao, Leonid Kogan, and Lu Zhang, 2003, Equilibrium cross-section of returns, Journal of Political Economy 111, 693-732.
Gourio, Francois, 2005, Operating leverage, stock market cyclicality, and the cross-section of returns, Working Paper, Boston University.
Guay, Wayne R., S.P. Kothari, and Susan Shu, 2005, Properties of implied cost of capital using analysts’ forecasts, MIT Sloan Working Paper No 4422-03.
Hirsch, Barry T., 1980, The determinants of unionization: An analysis of interarea differences, Industrial and Labor Relations Review 33, 147-161.
Hirsch, Barry T., 1982, The interindustry structure of unionism, earnings, and earnings dispersion, Industrial and Labor Relations Review 36, 22-39.
Hirsch, Barry T., 1990, Market structure, union rent seeking, and firm profitability, Economics Letters 32, 75-79.
Hirsch, Barry T., 1991, Union coverage and profitability among U.S. firms, Review of Economics and Statistics 73, 69-77.
Hirsch, Barry T., and David A. Macpherson, 2003, Union membership and coverage database from the Current Population Survey: Note, Industrial and Labor Relations Review 56, 349-54.
Hirsch, Barry T., and Barbara A. Morgan, 1994, Shareholder risk and returns in union and nonunion firms, Industrial and Labor Relations Review 47, 302-318.
38
Hou, Kewei, and David T. Robinson, 2006, Industry concentration and average stock returns, Journal of Finance 61, 1927-1956.
Ittner, Christopher D., Richard A. Lambert, and David F. Larcker, 2003, The structure and performance consequences of equity grants to employees of new economy firms, Journal of Accounting and Economics 33, 3-42.
Jermann, Urban J., 1998, Asset pricing in production economies, Journal of Monetary Economics, 257-275.
Kaplan, Steven N., and Richard S. Ruback, 1995, The valuation of cash flow forecasts: An empirical analysis, Journal of Finance 50, 1059–1093.
Kessler-Harris, Alice, 1975, Where are the organized women workers? Feminist Studies 3, 92-110.
Kogan, Leonid, 2001, An equilibrium model of irreversible investment, Journal of Financial Economics 62, 201-245.
Lee, Charles, David Ng, and Bhaskaran Swaminathan, 2003, The cross-section of international cost of capital, Working Paper, Cornell University.
Lettau, Martin, and Sydney C. Ludvigson, 2005, Expected returns and expected dividend growth, Journal of Financial Economics 76, 583-626.
Lev, Baruch, 1974, On the association between operating leverage and risk, Journal of Financial and Quantitative Analysis 9, 627-641.
Mandelker, Gershon N., and S. Ghon Rhee, 1984, The impact of the degrees of operating and financial leverage on systematic risk of common stock, Journal of Financial and Quantitative Analysis 19, 45-57.
Matsa, David A., 2005, Capital structure as a strategic variable: Evidence from collective bargaining, Working Paper, MIT.
Merz, Monika, and Eran Yashiv, 2006, Labor and the market value of the firm, American Economic Review, forthcoming.
Moulton, Brent, 1986, Random group effects and the precision of regression estimates, Journal of Econometrics 32, 385-397.
Newey, Whitney K., and Kenneth D. West, 1987, A simple positive-definite heteroskedasticity and autocorrelation consistent covariance matrix, Econometrica 55, 703-708.
Pástor, Luboš, and Robert F. Stambaugh, 1999, Costs of equity capital and model mispricing, Journal of Finance 54, 67-121.
Pástor, Luboš, and Pietro Veronesi, 2003, Stock valuation and learning about profitability, Journal of Finance 58, 1749-1790.
Pástor, Luboš, Meenakshi Sinha, and Bhaskaran Swaminathan, 2006, Estimating the intertemporal risk-return tradeoff using the implied cost of capital, Working Paper, University of Chicago.
39

Petersen, Mitchell A., 2005, Estimating standard errors in finance panel data sets: Comparing approaches, Working Paper, Northwestern University.
Rose, David C., 1991, Are strikes less effective in conglomerate firms?, Industrial and Labor Relations Review 45, 131-144.
Ruback, Richard S., and M.B. Zimmerman, 1984, Unionization and profitability: Evidence from the capital market, Journal of Political Economy 92, 1134-1157.
Rubinstein, Mark E., 1973, A mean-variance synthesis of corporate financial theory, Journal of Finance 28, 167-181.
Salinger, Michael A., 1984, Tobin's q, unionization, and the concentration-profits relationship, Rand Journal of Economics 15, 159-170.
Titman, Sheridan, K.C. Wei, and Feixue Xie, 2004, Capital investments and stock returns, Journal of Financial and Quantitative Analysis 39, 677-700.
Vuolteenaho, Tuomo, 2002, What drives firm-level stock returns?, Journal of Finance 57, 233-264.
Xing, Yuhang, 2006, Interpreting the value effect through the Q-theory: An empirical investigation, Working Paper, Rice University.
Xing, Yuhang, and Lu Zhang, 2005, Value vs. growth: Movements in economic fundamentals, Working Paper, University of Rochester.
Zhang, Lu, 2005, The value premium, Journal of Finance 60, 67-103.
Appendix. Expected Return Estimation
FFCOE derives from the Fama and French (1993) three-factor model. Specifically, for
each stock j in year t (between 1984 and 2005), we run the following regression using monthly
data from year t-4 to year t: j
ttj
stj
hf
tM
tj
mjf
tj
t SMBHMLrrrr εβββα +++−+=− )( , (A.1)
where the dependent variable is the monthly return on stock j in month t minus the risk-free rate,
and the independent variables are given by the returns of the following three zero-investment
factor portfolios. The term rM – rf denotes the excess return of the market portfolio over the risk-
free rate, HML is the return difference between high and low book-to-market stocks, and SMB is
the return difference between small and large capitalization stocks.15 We then construct Fama-
French cost of equity capital (FFCOE) as follows:
SMBHMLrrrFFCOE js
jh
fMjm
f βββ ˆˆ)(ˆ ++−+= , (A.2)
15 The factor returns are taken from Kenneth French’s Web site: http://mba.tuck.dartmouth.edu/pages/faculty/ken.french/Data_Library.
40
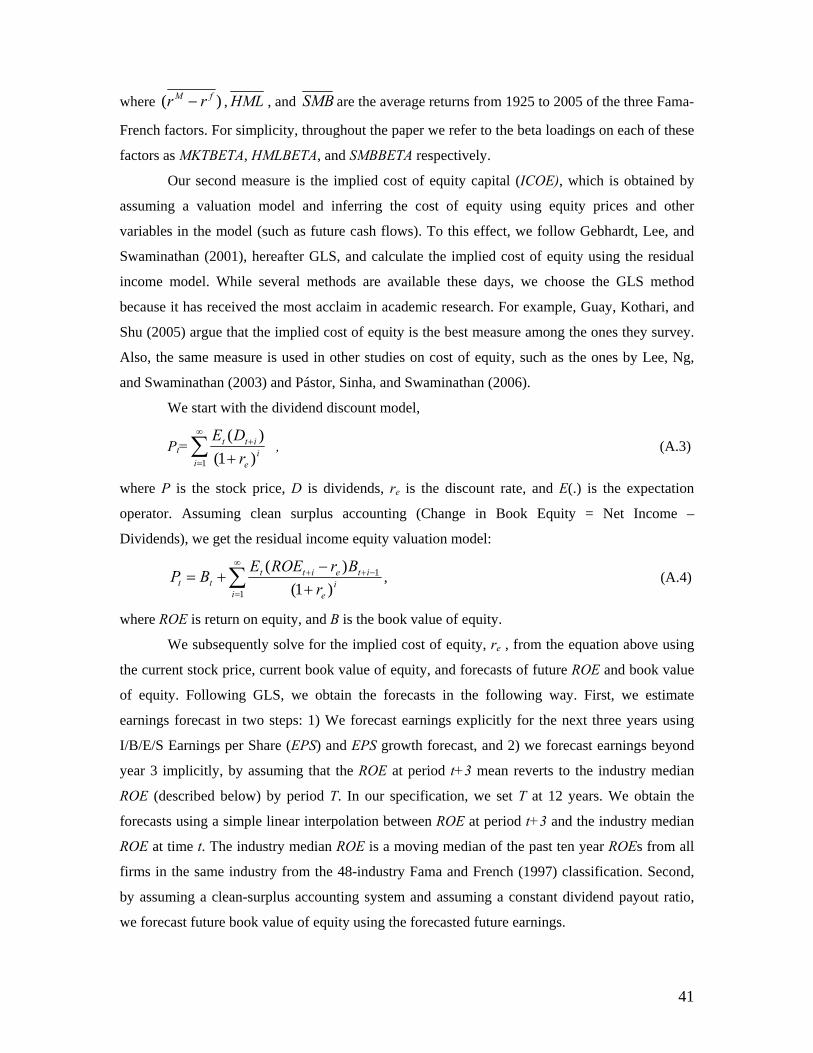
where )( fM rr − , HML , and SMB are the average returns from 1925 to 2005 of the three Fama-
French factors. For simplicity, throughout the paper we refer to the beta loadings on each of these
factors as MKTBETA, HMLBETA, and SMBBETA respectively.
Our second measure is the implied cost of equity capital (ICOE), which is obtained by
assuming a valuation model and inferring the cost of equity using equity prices and other
variables in the model (such as future cash flows). To this effect, we follow Gebhardt, Lee, and
Swaminathan (2001), hereafter GLS, and calculate the implied cost of equity using the residual
income model. While several methods are available these days, we choose the GLS method
because it has received the most acclaim in academic research. For example, Guay, Kothari, and
Shu (2005) argue that the implied cost of equity is the best measure among the ones they survey.
Also, the same measure is used in other studies on cost of equity, such as the ones by Lee, Ng,
and Swaminathan (2003) and Pástor, Sinha, and Swaminathan (2006).
We start with the dividend discount model,
Pt=∑∞
=
+
+1 )1()(
ii
e
itt
rDE
, (A.3)
where P is the stock price, D is dividends, re is the discount rate, and E(.) is the expectation
operator. Assuming clean surplus accounting (Change in Book Equity = Net Income –
Dividends), we get the residual income equity valuation model:
∑∞
=
−++
+−
+=1
1
)1()(
ii
e
iteitttt r
BrROEEBP , (A.4)
where ROE is return on equity, and B is the book value of equity.
We subsequently solve for the implied cost of equity, re , from the equation above using
the current stock price, current book value of equity, and forecasts of future ROE and book value
of equity. Following GLS, we obtain the forecasts in the following way. First, we estimate
earnings forecast in two steps: 1) We forecast earnings explicitly for the next three years using
I/B/E/S Earnings per Share (EPS) and EPS growth forecast, and 2) we forecast earnings beyond
year 3 implicitly, by assuming that the ROE at period t+3 mean reverts to the industry median
ROE (described below) by period T. In our specification, we set T at 12 years. We obtain the
forecasts using a simple linear interpolation between ROE at period t+3 and the industry median
ROE at time t. The industry median ROE is a moving median of the past ten year ROEs from all
firms in the same industry from the 48-industry Fama and French (1997) classification. Second,
by assuming a clean-surplus accounting system and assuming a constant dividend payout ratio,
we forecast future book value of equity using the forecasted future earnings.
41

With future earnings and book value of equity, we can calculate future ROE (FROE) and
so the stock price at year t will be:
111
1
312
21
1221
)1()1()1(1
)1(1
−+−+
−+
−
=
++
++
+++
+−
++
−+
+−
++
−+=
++
−+
+−
+=
∑ TtTee
eTtit
T
ii
e
eitt
e
ett
e
ett
te
ett
e
ettt
Brr
rFROEBr
rFROEBr
rFROEBr
rFROEB
TVBr
rFROEBr
rFROEBPA.5
where FROEt+1 and FROEt+2 are earnings forecasts for the next two years, and TV is the terminal
value estimate. Thus, the implied cost of equity (ICOE) is a numerical solution, re, of the above
equation. Limited data availability in I/B/E/S constrains our ICOE sample to 1984-2004. In spite
of its intuitive appeal, one limitation of this measure is its reliance on the availability of analyst
forecast data. This problem results in a considerably shorter time-series of data, as well as biases
our sample towards the larger firms, for which I/B/E/S reports analyst data.
42

Table I Unionization Rates for Selected Industries: 1983-2004
The table reports the fraction of the industry’s workers covered by unions in their collective bargaining with the firm. Based on the average industry unionization during 1983-2004, we identify the ten most and least unionized among the 199 industries corresponding to different Census Industry Classifications (CICs) contained in our data.
Panel A: High-Unionization Industries Industry 1983-2004 1983 1993 2004 Railroads 76.2% 85.4% 78.0% 68.0% Pulp, paper, and paperboard mills 50.3% 62.7% 59.4% 38.7% Blast furnaces, steelworks, rolling and finishing mills 50.2% 67.3% 56.9% 31.0% Motor vehicles and motor vehicle equipment 46.6% 61.7% 47.9% 29.9% Bus service and urban transit 42.1% 52.3% 41.5% 37.1% Air transportation 41.6% 45.7% 42.1% 44.9% Railroad locomotives and equipment 41.5% 62.7% 29.4% 15.9% Primary aluminum industries 40.8% 52.6% 42.6% 38.7% Telephone communications 40.5% 63.1% 44.65 24.0% Leather tanning and finishing 40.5% 48.3% 58.5% 12.5%
Panel B: Low-Unionization Industries Industry 1983-2004 1983 1993 2004 Radio, TV, and computer stores 1.8% 1.4% 1.4% 1.5% Restaurants and other food services 1.7% 2.5% 4.0% - Lodging places, except hotels and motels 1.7% 0.5% 1.1% 2.7% Accounting, auditing, and bookkeeping services 1.6% 1.4% 1.1% 1.2% Gasoline service stations 1.6% 2.0% 1.8% 0.8% Agricultural production, livestock 1.5% 1.2% 1.8% 2.4% Beauty shops 1.4% 2.4% 1.8% 0.8% Sewing, needlework, and piece goods stores 1.3% 0.0% 7.1% 0.0% Retail nurseries and garden stores 0.9% 0.0% 0.0% 1.0% Mobile home dealers 0.1% 0.0% 0.0% -
43
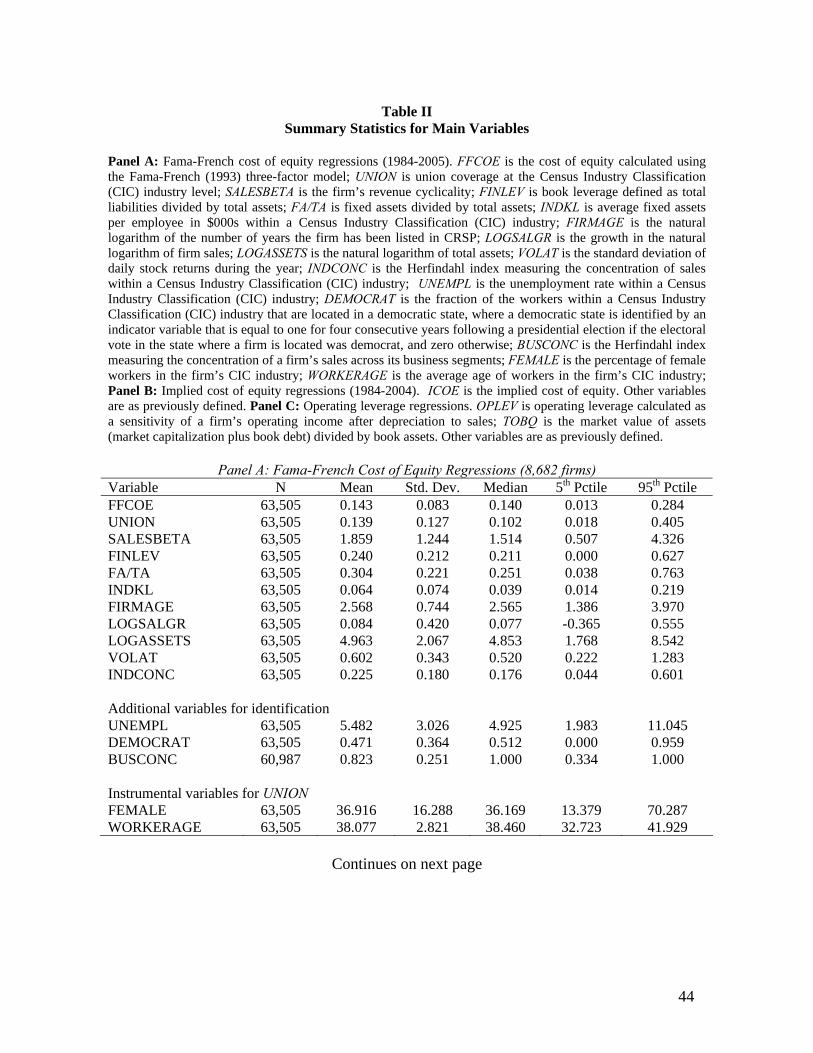
Table II
Summary Statistics for Main Variables Panel A: Fama-French cost of equity regressions (1984-2005). FFCOE is the cost of equity calculated using the Fama-French (1993) three-factor model; UNION is union coverage at the Census Industry Classification (CIC) industry level; SALESBETA is the firm’s revenue cyclicality; FINLEV is book leverage defined as total liabilities divided by total assets; FA/TA is fixed assets divided by total assets; INDKL is average fixed assets per employee in $000s within a Census Industry Classification (CIC) industry; FIRMAGE is the natural logarithm of the number of years the firm has been listed in CRSP; LOGSALGR is the growth in the natural logarithm of firm sales; LOGASSETS is the natural logarithm of total assets; VOLAT is the standard deviation of daily stock returns during the year; INDCONC is the Herfindahl index measuring the concentration of sales within a Census Industry Classification (CIC) industry; UNEMPL is the unemployment rate within a Census Industry Classification (CIC) industry; DEMOCRAT is the fraction of the workers within a Census Industry Classification (CIC) industry that are located in a democratic state, where a democratic state is identified by an indicator variable that is equal to one for four consecutive years following a presidential election if the electoral vote in the state where a firm is located was democrat, and zero otherwise; BUSCONC is the Herfindahl index measuring the concentration of a firm’s sales across its business segments; FEMALE is the percentage of female workers in the firm’s CIC industry; WORKERAGE is the average age of workers in the firm’s CIC industry; Panel B: Implied cost of equity regressions (1984-2004). ICOE is the implied cost of equity. Other variables are as previously defined. Panel C: Operating leverage regressions. OPLEV is operating leverage calculated as a sensitivity of a firm’s operating income after depreciation to sales; TOBQ is the market value of assets (market capitalization plus book debt) divided by book assets. Other variables are as previously defined.
Panel A: Fama-French Cost of Equity Regressions (8,682 firms)
Variable N Mean Std. Dev. Median 5th Pctile 95th Pctile FFCOE 63,505 0.143 0.083 0.140 0.013 0.284 UNION 63,505 0.139 0.127 0.102 0.018 0.405 SALESBETA 63,505 1.859 1.244 1.514 0.507 4.326 FINLEV 63,505 0.240 0.212 0.211 0.000 0.627 FA/TA 63,505 0.304 0.221 0.251 0.038 0.763 INDKL 63,505 0.064 0.074 0.039 0.014 0.219 FIRMAGE 63,505 2.568 0.744 2.565 1.386 3.970 LOGSALGR 63,505 0.084 0.420 0.077 -0.365 0.555 LOGASSETS 63,505 4.963 2.067 4.853 1.768 8.542 VOLAT 63,505 0.602 0.343 0.520 0.222 1.283 INDCONC 63,505 0.225 0.180 0.176 0.044 0.601 Additional variables for identification UNEMPL 63,505 5.482 3.026 4.925 1.983 11.045 DEMOCRAT 63,505 0.471 0.364 0.512 0.000 0.959 BUSCONC 60,987 0.823 0.251 1.000 0.334 1.000 Instrumental variables for UNION FEMALE 63,505 36.916 16.288 36.169 13.379 70.287 WORKERAGE 63,505 38.077 2.821 38.460 32.723 41.929
Continues on next page
44

Panel B: Implied Cost of Equity Regressions (4,835 firms) Variable N Mean Std. Dev. Median 5th Pctile 95th Pctile ICOE 25,835 0.104 0.056 0.114 0.001 0.180 UNION 25,835 0.137 0.130 0.099 0.017 0.413 SALESBETA 25,835 1.867 1.289 1.514 0.507 4.430 FINLEV 25,835 0.214 0.187 0.192 0.000 0.551 FA/TA 25,835 0.308 0.219 0.257 0.043 0.763 INDKL 25,835 0.066 0.074 0.041 0.014 0.237 FIRMAGE 25,835 2.401 0.986 2.398 0.693 4.094 LOGSALGR 25,835 0.158 0.311 0.114 -0.181 0.633 LOGASSETS 25,835 6.129 1.721 5.999 3.520 9.201 VOLAT 25,835 0.503 0.242 0.449 0.218 0.987 INDCONC 25,835 0.211 0.172 0.161 0.039 0.567 Additional variables for identification UNEMPL 25,835 5.176 2.782 4.609 1.976 10.206 DEMOCRAT 25,835 0.535 0.347 0.626 0.000 0.963 BUSCONC 25,249 0.813 0.262 1.000 0.301 1.000 Instrumental variables for UNION FEMALE 25,835 37.198 16.346 36.015 13.977 72.731 WORKERAGE 25,835 38.177 2.846 38.610 32.641 41.941
Panel C: Operating Leverage Regressions (7,248 firms) Variable N Mean Std. Dev. Median 5th Pctile 95th PctileOPLEV 47,371 1.653 4.422 1.365 -8.478 12.408 UNION 47,371 0.132 0.125 0.093 0.017 0.403 LOGASSETS 47,371 4.778 2.027 4.660 1.653 8.254 TOBQ 47,371 1.825 1.681 1.304 0.734 4.633 FA/TA 47,371 0.309 0.230 0.251 0.036 0.779 INDKL 47,371 0.067 0.077 0.039 0.014 0.241 FINLEV 47,371 0.223 0.191 0.198 0.000 0.584
45

Table III Unionization and Expected Returns: Portfolio Sorts and Regression Analysis
Panel A reports portfolio sorts. For every year we sort firms into quintile portfolios based on their unionization rate. We then compute the Fama-French cost of equity (FFCOE) and the implied cost of equity (ICOE) for each quintile portfolio, and subsequently take the average for each quintile across years. The last row reports p-values corresponding to a t-test of the differences in means of Quintile 5 and Quintile 1. Panel B reports OLS regressions of expected returns (both FFCOE and ICOE) on lagged unionization (UNION) and control variables. SALESBETA is the firm’s revenue cyclicality; FINLEV is book leverage defined as total liabilities divided by total assets; FA/TA is fixed assets divided by total assets; INDKL is average fixed assets per employee in $000s within a Census Industry Classification (CIC) industry; FIRMAGE is the natural logarithm of the number of years the firm has been listed in CRSP; LOGSALGR is the growth in the natural logarithm of firm sales; LOGASSETS is the natural logarithm of total assets; VOLAT is the standard deviation of daily stock returns during the year; INDCONC is the Herfindahl index measuring the concentration of sales within a Census Industry Classification (CIC) industry. All regressions include year and one-digit SIC dummies (not reported). The absolute values of the t-statistics in parentheses are based on standard errors robust to heteroskedasticity and clustered at the CIC industry level. In both panels *, **, and *** means significant at 10%, 5%, and 1%, respectively.
Panel A: Portfolio Sorts FFCOE ICOE Unionization Quintile
Unionization (%)
Equal-weighted (%)
Value-weighted (%)
Unionization (%)
Equal-weighted (%)
Value-weighted (%)
Q1 (Low) 2.548 13.841 9.571 2.21 9.811 8.277 Q2 5.877 14.002 10.228 5.32 9.895 8.392 Q3 11.269 14.017 10.451 10.53 11.040 8.532 Q4 16.494 14.469 11.515 15.77 11.792 10.574 Q5 (High) 33.261 14.777 11.878 33.23 12.545 10.374 Q5 – Q1 0.936*** 2.307*** 2.734*** 2.098** p-value 0.002 0.000 0.001 0.036
Continues on next page
46

Panel B: Regression Analysis
FFCOE ICOE (1) (2) (3) (4) (5) (6)
UNION 0.046*** 0.042*** 0.037** 0.116*** 0.122*** 0.112*** (3.38) (3.30) (2.56) (3.91) (4.14) (4.10) SALESBETA 0.002** 0.002* 0.004** 0.004** (2.17) (1.78) (2.45) (2.53) FINLEV 0.039*** 0.034*** 0.034*** 0.036*** (11.43) (11.10) (4.08) (4.68) FA/TA -0.002 -0.003 0.017* 0.011 (0.43) (0.65) (1.74) (1.43) INDKL 0.017 0.010 -0.119** -0.111** (0.84) (0.50) (2.45) (2.43) FIRMAGE -0.004*** -0.001 (3.69) (1.25) LOGSALGR -0.001 -0.006** (1.48) (2.42) LOGASSETS 0.004*** -0.003*** (3.59) (3.81) VOLAT 0.012*** -0.036*** (5.12) (5.31) INDCONC 0.004 0.042*** (0.90) (3.53) Intercept 0.129*** 0.110*** 0.097*** 0.089*** 0.064*** 0.068*** (22.67) (12.79) (9.72) (5.76) (3.65) (2.86) Observations 63,505 63,505 63,505 25,835 25,835 25,835 R-squared 0.02 0.03 0.03 0.26 0.30 0.33
47

Table IV Identification
The table reports OLS regressions of expected returns (both Fama-French cost of equity (FFCOE) and implied cost of equity (ICOE)) on lagged unionization (UNION), interaction terms, and control variables. UNEMPL is the unemployment rate within a Census Industry Classification (CIC) industry; DEMOCRAT is the fraction of the workers within a Census Industry Classification (CIC) industry that are located in a democratic state, where a democratic state is identified by an indicator variable that is equal to one for four consecutive years following a presidential election if the electoral vote in the state where a firm is located was democrat, and zero otherwise; BUSCONC is the Herfindahl index measuring the concentration of a firm’s sales across its business segments. All variables that are interacted are first demeaned (UNION, UNEMPL, DEMOCRAT, and BUSCONC). Control variables are identical to those in Table III. SALESBETA is the firm’s revenue cyclicality; FINLEV is book leverage defined as total liabilities divided by total assets; FA/TA is fixed assets divided by total assets; INDKL is average fixed assets per employee in $000s within a Census Industry Classification (CIC) industry; FIRMAGE is the natural logarithm of the number of years the firm has been listed in CRSP; LOGSALGR is the growth in the natural logarithm of firm sales; LOGASSETS is the natural logarithm of total assets; VOLAT is the standard deviation of daily stock returns during the year; INDCONC is the Herfindahl index measuring the concentration of sales within a Census Industry Classification (CIC) industry. All regressions include a constant term as well as year and one-digit SIC dummies (not reported). The coefficients of the standard control variables are also omitted for brevity. The absolute values of the t-statistics in parentheses are based on standard errors robust to heteroskedasticity and clustered at CIC industry level. In both panels *, **, and *** means significant at 10%, 5%, and 1%, respectively. FFCOE ICOE (1) (2) (3) (4) (5) (6) UNION 0.031** 0.037** 0.038** 0.103*** 0.129*** 0.114*** (2.15) (2.59) (2.58) (3.96) (4.72) (4.06) UNEMPL 0.001*** 0.001** (3.42) (2.00) UNION*UNEMPL -0.005*** -0.009*** (2.75) (2.93) DEMOCRAT -0.015*** -0.024*** (3.19) (2.70) UNION*DEMOCRAT 0.043** 0.163*** (2.31) (5.67) BUSCONC -0.009*** -0.004 (2.95) (0.78) UNION*BUSCONC 0.053** 0.057** (2.50) (2.02) Intercept 0.102*** 0.105*** 0.104*** 0.081*** 0.086*** 0.084*** (8.25) (10.38) (9.47) (3.31) (4.28) (3.88) Observations 63,505 63,505 60,987 25,835 25,835 25,249 R-squared 0.03 0.03 0.03 0.34 0.35 0.33
48

Table V
Unionization and Expected Returns: Instrumental Variables Estimation
Panel A reports first-stage regressions of unionization (UNION) on the instrumental variables (FEMALE and WORKERAGE) and the exogenous control variables included in the second-stage regression. FEMALE is the percentage of female workers in the firm’s CIC industry; WORKERAGE is the average age of workers in the firm’s CIC industry. Other variables are defined in Table III. The partial R2 is the fraction of the variation in UNION explained by the instruments, net of their effect through the exogenous variables. The cluster-robust F-statistic of excluded instruments tests the joint statistical significance of the instruments. The test of overidentifying restrictions tests the joint null hypothesis that the excluded instruments are uncorrelated with the error term and correctly excluded from the second-stage equation. Panel B reports the second-stage results of regressions of expected returns (both FFCOE and ICOE) on lagged unionization (UNION) and control variables, where unionization is treated as the endogenous variable. The Hausman test examines whether the OLS and 2SLS coefficients on UNION are systematically different. In panels A and B, all regressions include a constant term as well as year and one-digit SIC dummies (not reported). The absolute values of the t-statistics in parentheses are based on standard errors robust to heteroskedasticity and clustered at CIC industry level. *, **, and *** means significant at 10%, 5%, and 1%, respectively.
Panel A: First-Stage Regressions and Validity of Instruments FFCOE ICOE (1) (2) (3) (4) (5) (6)
Instruments FEMALE -0.002*** -0.002*** -0.002*** -0.002*** -0.002*** -0.002*** (3.74) (3.25) (3.25) (3.70) (3.32) (3.31) WORKERAGE 0.013*** 0.014*** 0.012*** 0.013*** 0.014*** 0.013*** (2.64) (3.17) (2.89) (2.94) (3.58) (3.26) Predetermined Variables SALESBETA -0.002 -0.004 -0.000 -0.001 (0.25) (0.56) (0.00) (0.22) FINLEV 0.018 0.011 0.042** 0.023 (1.57) (0.99) (2.39) (1.47) FA/TA 0.100*** 0.083*** 0.120*** 0.103*** (3.16) (2.78) (3.50) (3.02) INDKL 0.043 0.029 0.057 0.047 (0.31) (0.22) (0.42) (0.37) FIRMAGE 0.010*** 0.004* (3.85) (1.90) LOGSALGR -0.003* -0.004* (1.82) (1.66) LOGASSETS 0.006*** 0.007*** (3.38) (2.69) VOLAT -0.005 -0.021 (0.86) (1.59) INDCONC 0.045 0.038 (1.55) (1.22) Observations 63,505 63,505 63,505 25,835 25,835 25,835 R-squared 0.44 0.47 0.50 0.46 0.51 0.52
Predictive Power of Excluded Instruments Partial R-squared 0.178 0.162 0.142 0.192 0.171 0.154 Cluster-Robust F-Statistic
10.00 10.45 9.42 10.04 11.63 10.33
p-value 0.000 0.000 0.000 0.000 0.000 0.000 Test of Overidentifying Restrictions
Hansen’s J-Statistic 1.073 1.284 1.233 0.457 0.337 0.657 p-value 0.300 0.257 0.267 0.499 0.561 0.418
49

Panel B: Second-Stage Regressions of Expected Returns on Unionization FFCOE ICOE (1) (2) (3) (4) (5) (6)
UNION 0.053* 0.059** 0.058* 0.079 0.143** 0.124* (1.82) (2.11) (1.78) (1.24) (2.04) (1.85) SALESBETA 0.002** 0.002* 0.005** 0.004** (2.30) (1.92) (2.20) (2.13) FINLEV 0.039*** 0.033*** 0.033*** 0.036*** (11.36) (11.11) (3.61) (4.44) FA/TA -0.003 -0.004 0.015 0.010 (0.67) (0.89) (1.60) (1.43) INDKL 0.013 0.006 -0.124** -0.114** (0.61) (0.28) (2.43) (2.37) FIRMAGE -0.004*** -0.001 (3.85) (1.32) LOGSALGR -0.001 -0.006*** (1.37) (2.64) LOGASSETS 0.004*** -0.003*** (3.32) (4.16) VOLAT 0.012*** -0.035*** (5.18) (4.76) INDCONC 0.003 0.042*** (0.63) (3.75) Observations 63,505 63,505 63,505 25,835 25,835 25,835 Hausman Test for the Effect of Unionization Cluster-Robust T-Statistic 0.28 0.66 0.69 0.84 0.41 0.24 p-value 0.779 0.508 0.489 0.404 0.681 0.808
50

Table VI
Unionization and Operating Leverage We estimate operating leverage as the sensitivity of a firm’s operating cash flows to its sales. In Panel A, for every year we sort firms into quintile portfolios based on their unionization rate. We then compute average operating leverage (OPLEV) for each quintile portfolio, and subsequently take the average for each quintile across years. The last row reports p-values corresponding to a t-test of the differences in means of Quintile 5 and Quintile 1. Panel B reports OLS regressions of the firm-level operating leverage on unionization (UNION) and control variables. Our set of controls includes the natural logarithm of total assets (LOGASSETS), Tobin’s Q (TOBQ), the ratio of fixed assets to total assets (FA/TA), average fixed assets per employee in $000s within a Census Industry Classification (CIC) industry (INDKL), and book leverage (FINLEV). All regressions include year and one-digit SIC dummies (not reported). The absolute values of the t-statistics in parentheses are based on standard errors robust to heteroskedasticity and clustered at CIC industry level. In both panels *, **, and *** means significant at 10%, 5%, and 1%, respectively.
Panel A: Operating Leverage: Portfolio Sorts Unionization Quintile
Unionization (%)
Equal-weighted Value-weighted
Q1 (Low) 2.374 1.341 1.474 Q2 5.255 1.424 1.637 Q3 10.397 1.462 1.684 Q4 15.331 1.766 1.846 Q5 (High) 32.220 1.959 1.791 Q5 – Q1 0.618*** 0.317*** p-value 0.000 0.004
Panel B: Operating Leverage: Regression Analysis Dep. Var. Operating Leverage (1) (2) UNION 2.359*** 1.008** (4.04) (2.19) LOGASSETS 0.190*** (6.44) TOBQ -0.202*** (9.60) FA/TA 0.657*** (3.35) INDKL -1.420* (1.87) FINLEV -0.454** (2.32) Intercept 1.053*** 0.597* (4.20) (1.88) Observations 47,371 47,371 R-squared 0.01 0.02
51

Table VII Unionization and Loadings of the Fama-French Three-Factor Model
Panel A reports portfolio sorts. For every year we sort firms into quintile portfolios based on their unionization rate. We then compute the equal-weighted averages for each of the loadings in the Fama-French three-factor model: Market beta (MKTBETA), SMB beta (SMBBETA), and HML beta (HMLBETA). The last row reports p-values corresponding to a t-test of the differences in means of Quintile 5 and Quintile 1. Panel B reports OLS regressions of the loadings of MKTBETA, SMBBETA, and HMLBETA on lagged unionization (UNION) and control variables. Control variables are identical to those in Table III. SALESBETA is the firm’s revenue cyclicality; FINLEV is book leverage defined as total liabilities divided by total assets; FA/TA is fixed assets divided by total assets; INDKL is average fixed assets per employee in $000s within a Census Industry Classification (CIC) industry; FIRMAGE is the natural logarithm of the number of years the firm has been listed in CRSP; LOGSALGR is the growth in the natural logarithm of firm sales; LOGASSETS is the natural logarithm of total assets; VOLAT is the standard deviation of daily stock returns during the year; INDCONC is the Herfindahl index measuring the concentration of sales within a Census Industry Classification (CIC) industry. All regressions include year and one-digit SIC dummies (not reported). The absolute values of the t-statistics in parentheses are based on standard errors robust to heteroskedasticity and clustered at CIC industry level. *, **, and *** means significant at 10%, 5%, and 1%, respectively.
Panel A: Loadings on Fama-French Factors Unionization Quintile UNION
(%) MKTBETA SMBBETA HMLBETA
Q1 (Low) 2.548 1.020 0.894 -0.062 Q2 5.877 0.967 0.842 0.081 Q3 11.269 0.970 0.915 0.040 Q4 16.494 1.009 0.843 0.115 Q5 (High) 33.261 0.960 0.667 0.358 Q5 – Q1 -0.060** -0.227*** 0.420*** p-value 0.039 0.000 0.000
Continues on next page
52

Panel B: Regressions of MKTBETA, SMBBETA, and HMLBETA on UNION
MKTBETA SMBBETA HMLBETA (1) (2) (3) (4) (5) (6)
UNION -0.018 -0.135 -0.607*** -0.047 1.321*** 0.916*** (0.16) (1.40) (3.17) (0.31) (5.60) (4.86) SALESBETA 0.007 0.003 0.017 (0.88) (0.34) (1.26) FINLEV -0.028 0.129*** 0.601*** (0.91) (3.40) (8.96) FA/TA -0.181*** -0.303*** 0.388*** (5.09) (5.28) (6.02) INDKL 0.251* -0.184 -0.170 (1.72) (0.85) (0.49) FIRMAGE -0.100*** -0.169*** 0.143*** (11.53) (10.06) (7.81) LOGSALGR 0.009 -0.002 -0.050*** (1.20) (0.16) (3.61) LOGASSETS 0.107*** -0.050*** (16.72) (3.67) VOLAT 0.292*** 0.386*** -0.323*** (12.07) (9.52) (5.42) INDCONC -0.128*** -0.079 0.366*** (2.84) (1.64) (4.21) Intercept 0.699*** 0.436*** 0.875*** 1.226*** 0.274*** -0.337*** (28.22) (5.45) (10.44) (11.12) (3.67) (2.79) Observations 63,505 63,505 63,505 63,505 63,505 63,505 R-squared 0.02 0.09 0.04 0.10 0.06 0.11
53

Table VIII Unionization and Market Valuation
The table reports the results from OLS regressions of the natural logarithm of a firm-level book-to-market (LOGBM) on unionization (UNION) and a set of control variables. Various permutations of controls include the natural logarithm of assets (LOGASSETS), book leverage (FINLEV), the natural logarithm of firm age (FIRMAGE), return on equity (ROE), and volatility of firm ROE (VOLROE). All regressions include year and one-digit SIC fixed effects (not reported). The absolute values of the t-statistics in parentheses are based on standard errors robust to heteroskedasticity and clustered at CIC industry level. *, **, and *** means significant at 10%, 5%, and 1%, respectively.
(1) (2) (3) UNION 1.113*** 0.890*** 0.735*** (3.58) (3.37) (2.91) ROE 0.258*** 0.280*** (10.74) (12.20) VOLROE -0.043*** -0.042*** (13.13) (13.56) LOGASSETS -0.042*** (6.00) FINLEV 0.408*** (6.24) FIRMAGE 0.140*** (14.15) Intercept -0.684*** -0.609*** -0.825*** (7.62) (5.96) (7.56) Observations 85,973 85,973 85,973 R-squared 0.07 0.16 0.18
54

Table IX
Unionization and Realized Returns: Portfolio Sorts
For every month we sort all firms with no missing FFCOE into quintile portfolios based on their unionization rate. We then take the average for each quintile portfolio across months and calculate annualized returns. The last row reports p-values corresponding to a t-test of the differences in means of Quintile 5 and Quintile 1.
Unionization Quintile
UNION (%)
Equal-weighted (%)
Value-weighted (%)
Q1 (Low) 2.678 16.386 11.446 Q2 6.395 18.993 16.378 Q3 11.999 17.854 14.276 Q4 17.368 17.874 14.666 Q5 (High) 34.439 15.694 13.632 Q5 – Q1 -0.692 2.187 p-value 0.905 0.699
55

Table X
Profitability and Discount-Rate Surprises Panel A examines the relation between profitability surprises and unionization rates. ROE is the ratio of earnings to book value of equity. LOGBM is the natural logarithm of the book equity to market equity ratio. NODIV is a dummy equal to one if the firm does not pay dividends in a given year, and zero otherwise. DIVBV is dividend payments divided by book equity. FIRMAGE is the natural logarithm of firm age. INVEST is capital expenditures divided by assets. VOLAT is the standard deviation of daily returns during the year. LOGSIZE is the natural logarithm of market capitalization. FA/TA is fixed assets divided by total assets. Expected profitability, E(e), is obtained from the Fama-MacBeth regressions of ROE on lagged ROE and all other variables defined above. We group firms into quintiles in an increasing order according to their unionization rates and report average unexpected profitability for 1, 2, and 3 periods ahead, as defined in the first column. The last two columns report the differences between Quintile 5 and Quintile 1 and the non-parametric Spearman rank correlations for each unexpected profitability measure, along with their respective p-values. Panel B relates discount-rate surprises to unionization rates. For every sub-period, we group firms into quintiles according to their unionization rates and report the average expected return of each quintile (both FFCOE and ICOE). We report the respective differences in returns between Quintile 5 and Quintile 1. We also report the change in differences between Quintiles 1 and 5 for the first and the last period, as well as the nonparametric Spearman rank correlation across sub-periods, along with their respective p-values.
Panel A: Unionization and Profitability Surprises Quintiles 1 2 3 4 5 5 – 1 Spearman
correlation et – Et-1(et) 0.0087 -0.0052 -0.0083 0.0079 -0.0054 -0.0140 -0.872* p-value 0.227 0.054
Et(et+1) – Et-1(et+1) 0.0038 -0.0012 0.0018 -0.0008 -0.0043 -0.0082 -0.700 p-value 0.125 0.188
Et(et+2) – Et-1(et+2) 0.0000 0.0008 -0.0001 -0.0001 -0.0005 -0.0005 -0.500 p-value 0.901 0.391
Panel B: Unionization and Discount-Rate Surprises
Quintiles FFCOE 1 2 3 4 5 5 – 1 p-value
1984-1987 12.983 13.654 13.074 13.602 13.879 0.896*** 0.000 1988-1991 13.921 13.917 14.263 14.382 14.711 0.790*** 0.001 1992-1995 14.116 12.317 14.725 14.669 14.118 0.001 0.996 1996-1999 12.993 13.925 14.124 13.902 14.826 1.833*** 0.000 2000-2005 14.730 15.402 13.889 15.462 15.849 1.118*** 0.000
Difference between 2000-2005 and 1984-1987 0.222 0.463 Spearman rank correlation across all periods 0.500 0.391
ICOE 1 2 3 4 5 5 – 1 p-value
1984-1987 14.235 13.769 14.762 14.718 14.553 0.319 0.146 1988-1991 11.731 10.401 13.063 13.378 12.572 0.841*** 0.001 1992-1995 10.235 8.293 11.068 11.313 11.677 1.442*** 0.000 1996-1999 8.421 9.163 9.578 10.947 12.297 3.876*** 0.000 2000-2004 5.350 8.054 7.381 9.067 11.750 6.400*** 0.000
Difference between 2000-2004 and 1984-1987 6.081*** 0.000 Spearman rank correlation across all periods 1.000*** 0.000
56
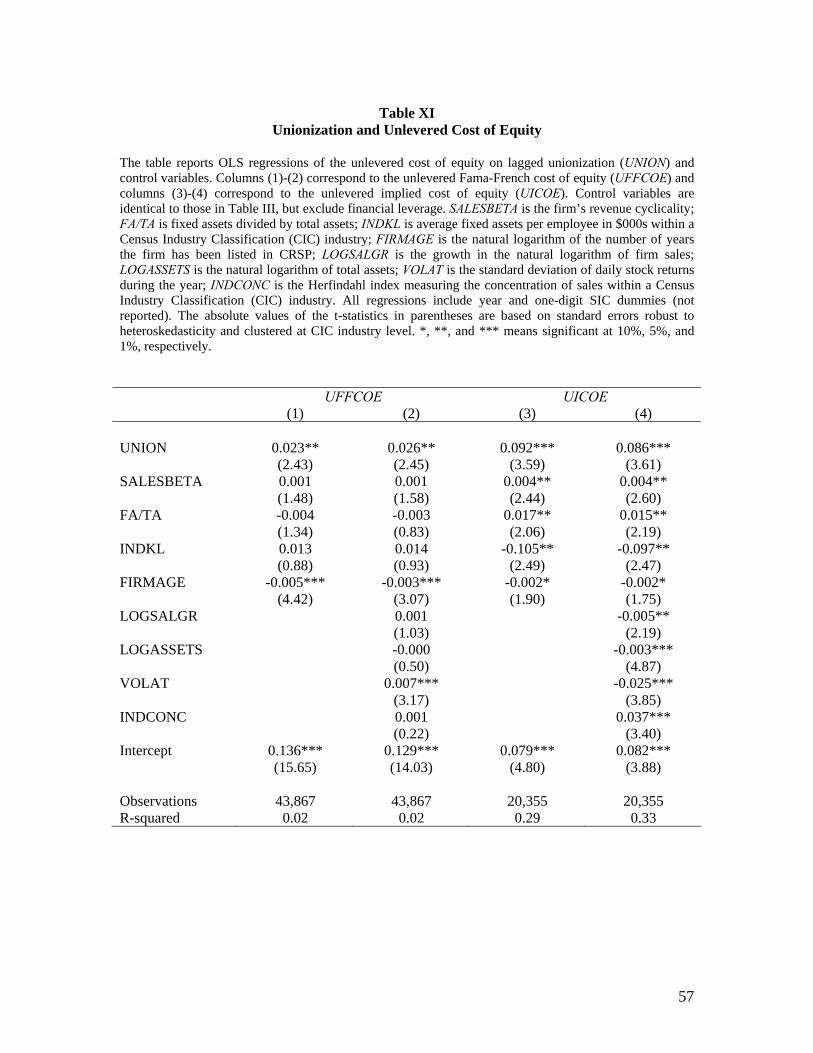
Table XI
Unionization and Unlevered Cost of Equity The table reports OLS regressions of the unlevered cost of equity on lagged unionization (UNION) and control variables. Columns (1)-(2) correspond to the unlevered Fama-French cost of equity (UFFCOE) and columns (3)-(4) correspond to the unlevered implied cost of equity (UICOE). Control variables are identical to those in Table III, but exclude financial leverage. SALESBETA is the firm’s revenue cyclicality; FA/TA is fixed assets divided by total assets; INDKL is average fixed assets per employee in $000s within a Census Industry Classification (CIC) industry; FIRMAGE is the natural logarithm of the number of years the firm has been listed in CRSP; LOGSALGR is the growth in the natural logarithm of firm sales; LOGASSETS is the natural logarithm of total assets; VOLAT is the standard deviation of daily stock returns during the year; INDCONC is the Herfindahl index measuring the concentration of sales within a Census Industry Classification (CIC) industry. All regressions include year and one-digit SIC dummies (not reported). The absolute values of the t-statistics in parentheses are based on standard errors robust to heteroskedasticity and clustered at CIC industry level. *, **, and *** means significant at 10%, 5%, and 1%, respectively. UFFCOE UICOE
(1) (2) (3) (4) UNION 0.023** 0.026** 0.092*** 0.086*** (2.43) (2.45) (3.59) (3.61) SALESBETA 0.001 0.001 0.004** 0.004** (1.48) (1.58) (2.44) (2.60) FA/TA -0.004 -0.003 0.017** 0.015** (1.34) (0.83) (2.06) (2.19) INDKL 0.013 0.014 -0.105** -0.097** (0.88) (0.93) (2.49) (2.47) FIRMAGE -0.005*** -0.003*** -0.002* -0.002* (4.42) (3.07) (1.90) (1.75) LOGSALGR 0.001 -0.005** (1.03) (2.19) LOGASSETS -0.000 -0.003*** (0.50) (4.87) VOLAT 0.007*** -0.025*** (3.17) (3.85) INDCONC 0.001 0.037*** (0.22) (3.40) Intercept 0.136*** 0.129*** 0.079*** 0.082*** (15.65) (14.03) (4.80) (3.88) Observations 43,867 43,867 20,355 20,355 R-squared 0.02 0.02 0.29 0.33
57

Table XII
Year-by-Year Regressions and Economic Significance
Columns (1) and (4) of the table report the coefficient on UNION arising from year-by-year estimation of equation (1) for both the Fama-French cost of equity (FFCOE) and the implied cost of equity (ICOE). UNION and all controls variables are lagged one period. Control variables are identical to those in Table III. SALESBETA is the firm’s revenue cyclicality; FINLEV is book leverage defined as total liabilities divided by total assets; FA/TA is fixed assets divided by total assets; INDKL is average fixed assets per employee in $000s within a Census Industry Classification (CIC) industry; FIRMAGE is the natural logarithm of the number of years the firm has been listed in CRSP; LOGSALGR is the growth in the natural logarithm of firm sales; LOGASSETS is the natural logarithm of total assets; VOLAT is the standard deviation of daily stock returns during the year; INDCONC is the Herfindahl index measuring the concentration of sales within a Census Industry Classification (CIC) industry. All regressions include one-digit SIC dummies (not reported). The absolute values of the t-statistics in parentheses are based on standard errors robust to heteroskedasticity and clustered at CIC industry level. *, **, and *** means significant at 10%, 5%, and 1%, respectively. Columns (3) and (6) provide the economic contribution of unions to expected returns by taking the product of the estimated coefficient and the average unionization in the corresponding year.
FFCOE ICOE Coef. t-stat Coef x Avg.
UnionizationCoef. t-stat Coef x Avg.
Unionization (1) (2) (3) (4) (5) (6)
1984 0.035*** (3.39) 0.811 0.007 (0.41) 0.162 1985 0.034** (1.98) 0.696 0.023* (1.72) 0.497 1986 0.026 (1.16) 0.500 0.059*** (3.41) 1.161 1987 0.034** (2.56) 0.611 0.063*** (2.87) 1.171 1988 0.034* (1.85) 0.589 0.066** (2.60) 1.216 1989 0.048*** (3.40) 0.782 0.074** (2.47) 1.338 1990 0.073*** (4.44) 1.158 0.102*** (2.79) 1.774 1991 0.059*** (3.21) 0.891 0.121*** (3.91) 1.998 1992 0.045* (1.76) 0.675 0.103*** (3.43) 1.654 1993 0.040 (1.45) 0.580 0.119*** (4.06) 1.745 1994 0.058** (2.25) 0.816 0.141*** (4.61) 2.029 1995 0.027 (1.14) 0.364 0.125*** (3.81) 1.756 1996 0.027 (0.88) 0.329 0.134*** (4.49) 1.704 1997 0.045* (1.71) 0.539 0.123*** (4.55) 1.512 1998 0.023 (0.85) 0.269 0.158*** (4.29) 1.847 1999 0.012 (0.48) 0.134 0.211*** (5.60) 2.352 2000 -0.011 (0.42) -0.119 0.176*** (4.15) 1.899 2001 0.02 (0.88) 0.194 0.167*** (4.98) 1.602 2002 0.046* (1.82) 0.449 0.190*** (5.55) 1.844 2003 0.078*** (2.79) 0.706 0.202*** (5.12) 1.893 2004 0.097*** (3.61) 0.857 0.227*** (4.84) 2.081 2005 0.104*** (3.50) 0.892 - -
58
Table XIII Alternative Econometric Methods
This table summarizes the coefficient on UNION that arises from estimating equation (1) using different methodologies. Column (1) reports coefficients for the Fama-French cost of equity (FFCOE) regressions. Column (2) reports coefficients for the implied cost of equity (ICOE) regressions. UNION and all controls variables are lagged one period. Control variables are identical to those in Table III. SALESBETA is the firm’s revenue cyclicality; FINLEV is book leverage defined as total liabilities divided by total assets; FA/TA is fixed assets divided by total assets; INDKL is average fixed assets per employee in $000s within a Census Industry Classification (CIC) industry; FIRMAGE is the natural logarithm of the number of years the firm has been listed in CRSP; LOGSALGR is the growth in the natural logarithm of firm sales; LOGASSETS is the natural logarithm of total assets; VOLAT is the standard deviation of daily stock returns during the year; INDCONC is the Herfindahl index measuring the concentration of sales within a Census Industry Classification (CIC) industry. All regressions include year and one-digit SIC dummies (not reported). The coefficients of the controls variables are omitted for brevity. The absolute values of t-statistics in parentheses are based on standard errors robust to heteroskedasticity and clustered at CIC industry level. *, **, and *** means significant at 10%, 5%, and 1%, respectively. As a benchmark, the first row repeats the results of OLS estimation with standard errors clustered by CIC industry reported in columns (3) and (6) of Panel B in Table III. In the second and third rows we cluster by firm and by year, respectively. The last row reports the coefficients from the Fama-MacBeth regressions with Newey-West errors based on six lags. The absolute values of the t-statistics are reported in parentheses. *, **, and *** means significant at 10%, 5%, and 1%, respectively. FFCOE ICOE (1) (2) OLS clustering by CIC 0.037** 0.112*** (2.56) (4.10) OLS clustering by firm 0.037*** 0.112*** (5.91) (13.63) OLS clustering by year 0.037*** 0.112*** (7.42) (9.65) Fama-MacBeth with Newey-West standard errors 0.043*** 0.123*** (5.83) (4.55)
59