Embed Size (px)
Citation preview

Labor Situation in Japan and Analysis: General Overview 2006/2007
Having at last got out of unstable condition caused by depressed economy which continued for morethan 10 years from the beginning of 1990s, Japan now switches to favorable economic situation withsteady growth. During the period, structural changes has come out with in several fields of labor andemployment. These changes include first the transformation of labor market structure based on corpo-rate employment stabilization, secondly changes in the field of human resource management and skilldevelopment associated with changes in corporate business structure and performance, thirdly changesin workers’ awareness and needs, especially those related to young people’s employment and growingneeds of work life balance, and others.
The Japan Institute for Labour Policy and Training was established in October 2003 with the objec-tive of contributing to the planning of labor policies and working toward their effective and efficientimplementation. It serves to promote the livelihood of workers and the development of the nationaleconomy by conducting comprehensive research projects regarding labor issues and policies, bothdomestically and internationally, and to capitalize the findings of such research by sponsoring trainingprograms for administrative officials. In order to achieve this objective, the Institute works towardsbuilding a network with overseas research institutions and individual researchers, and is also engaged inthe definitive promotion of international collaboration in research, together with the advancement oflabor policy studies from an international perspective.
This publication, which has been compiled as part of the Institute’s effort to establish a foundationfor international activities, describes and analyzes individual themes related to the current status of laborissues in Japan. The authors are primarily JILPT researchers; assistance has been provided by officials atthe relevant departments of the Ministry of Health, Labour and Welfare regarding comments on specificlabor policies; and the International Affairs Department is responsible for compilation and editing.
In principle, this publication is issued every year alternately as “General Overview” and “DetailedExposition” editions. The 2005/2006 edition issued in July 2005 belonged to the detailed exposition,and provides recent write-ups by researchers of the Institute dealing mainly with important labor issues.It does not provide an exhaustive account of the labor situation. The publication takes up specific topicsand introduced recent trends concerning these as well as the relevant analyses, but does not present anyone uniform theme as a whole. As opposed to the 2005/2006 edition, this 2006/2007 issue provides gen-eral overview, and offers an exhaustive range of write-ups that covered basic points on issues related tolabor problems and labor policies in Japan. Consequently, it has been compiled with the intention thatthe reader will use it together with the 2005/2006 edition.
We hope that this publication will help its readers gain an understanding of the current labor situationin Japan.
November 2006The Japan Institute for Labour Policy and Training
Labor Situation in Japan and Analysis: General Overview 2006/2007
Foreword

ii Labor Situation in Japan and Analysis: General Overview 2006/2007
Chapter I The Japanese Economy and Labor Situation1 The Japanese Economy: Current Situation and Outlook for the Future ………………………………22 Characteristics of the Recent Labor Situation……………………………………………………………8
Chapter II The Labor Market1 Population and Labor Force ……………………………………………………………………………142 Employment and Unemployment Trends ………………………………………………………………193 Changes in the Employment Structure …………………………………………………………………244 Diversification in Forms of Employment ………………………………………………………………27
Chapter III Human Resource Management1 The Long-Term Employment System ……………………………………………………………………322 Recruiting and Hiring ……………………………………………………………………………………353 Assignments and Transfers………………………………………………………………………………404 Wages ……………………………………………………………………………………………………445 Working Hours …………………………………………………………………………………………466 Company Benefits ………………………………………………………………………………………507 Career Development through In-house Training and Education ……………………………………548 Resignation, Mandatory Retirement and Dismissals …………………………………………………58
Chapter IV Labor-Management Relations1 Labor-Management Relations in Japan…………………………………………………………………642 Situation for Union Organizations and Structure of Labor Unions……………………………………673 Shunto: Spring Wage Offensive…………………………………………………………………………724 Individual Labor-Management Dispute Settlement ……………………………………………………74
Chapter V Labor Administration and Legislation1 Employment Measures and Relief for the Unemployed ………………………………………………802 Policies Designed to Secure Employment for Older and Disabled Workers …………………………823 Employment Measures for the Youth …………………………………………………………………894 Issues of Foreign Workers ………………………………………………………………………………925 Public Job Introduction System …………………………………………………………………………966 Measures to Shorten Working Hours …………………………………………………………………987 The Minimum Wage System …………………………………………………………………………1018 Industrial Safety and Health……………………………………………………………………………1039 Gender Equal Employment Policies……………………………………………………………………10710 Assistance Measures to Balance Work and Family……………………………………………………10811 Part-time Work Policies…………………………………………………………………………………11012 Public Vocational Training Policies ……………………………………………………………………112
Chapter VI Social Security System1 The Subject of Japan’s Social Security System ………………………………………………………1162 Pension System …………………………………………………………………………………………1223 Medical Insurance and Long-Term Care Insurance …………………………………………………124
Appendix (International Comparisons) …………………………………………………………………127
Index …………………………………………………………………………………………………………132
Contributing Authors ………………………………………………………………………………………135
Contents

iiiLabor Situation in Japan and Analysis: General Overview 2006/2007
Chapter I
I-1 Real Economic Growth Rate, and Unemployment Rate ……………………………………………4
I-2 Employment, Capital Stock, and Debt Situation
1. Employment conditions diffusion index (“excessive”-“insufficient”)…………………………5
2. Production capacity diffusion index (“excessive”-“insufficient”) ………………………………5
3. Interest-bearing debt/cash flow ratio ……………………………………………………………6
I-3 The Non-performing Loans Situation ………………………………………………………………6
I-4 Trends in Prices ………………………………………………………………………………………7
I-5 Trends in the Unemployment Rate, and Ratio of Active Job Openings to Active Job Applicants …10
I-6 Trends in the Numbers of Freeters and Young not in Labor Force (NEET)
1. Trends in the numbers of freeters ………………………………………………………………11
2. Trends in the numbers of young not in labor force in “others” (NEET) ………………………11
I-7 Unemployment Rate and Ratio of Active Job Openings to
Active Job Applicants by Region (2004) ……………………………………………………………12
I-8 Contributory Factors in Fluctuations of Total Cash Earnings
(for establishments with five employees or more)…………………………………………………12
I-9 Trends in the Proportion of Workers with Short/Long Working Hours to Employees
(employed person at work) in Non-agricultural and Forestry Industries …………………………13
Chapter II
II-1 Japan’s Population in 50 years………………………………………………………………………15
II-2 Changes in Registered Alien Population by Nationality …………………………………………16
II-3 Composition of Labor Force ………………………………………………………………………16
II-4 Changes in the Labor Force Participation Ratio by Gender and Age: 1970–2004………………17
II-5 Breakdown of Employed Persons (2005 Average)…………………………………………………21
II-6 Breakdown of Employees by Status at Work ………………………………………………………21
II-7 Breakdown of Non-Agricultural/Forestry Industry Employees by Working Hours ………………22
II-8 Shifts in the Total Unemployment Rate, and Long-term Unemployment Rate …………………22
II-9 Shifts in the Structural/Frictional Unemployment Rate,
and the Demand Shortage Unemployment Rate …………………………………………………23
II-10 Year-on-Year Difference in the Number of Employees by Principal Industries …………………25
II-11 Trends of Employments by Three Industry Divisions ………………………………………………25
II-12 Year-on-Year Difference in the Number of Employed Workers by Occupation …………………26
II-13 Number of Employed Workers by Major Occupation ……………………………………………26
Contents forTables and Figures

iv Labor Situation in Japan and Analysis: General Overview 2006/2007
II-14 Proportion of Workers by Form of Employment …………………………………………………28
II-15 Changes in the Ratio of Non-regular Staff by Age and Gender …………………………………29
II-16 Changes in the Number of Part-time Workers ……………………………………………………29
II-17 Reasons for Hiring Non-regular Staff ………………………………………………………………30
II-18 Reasons for Working as a Non-regular Staff ………………………………………………………30
Chapter III
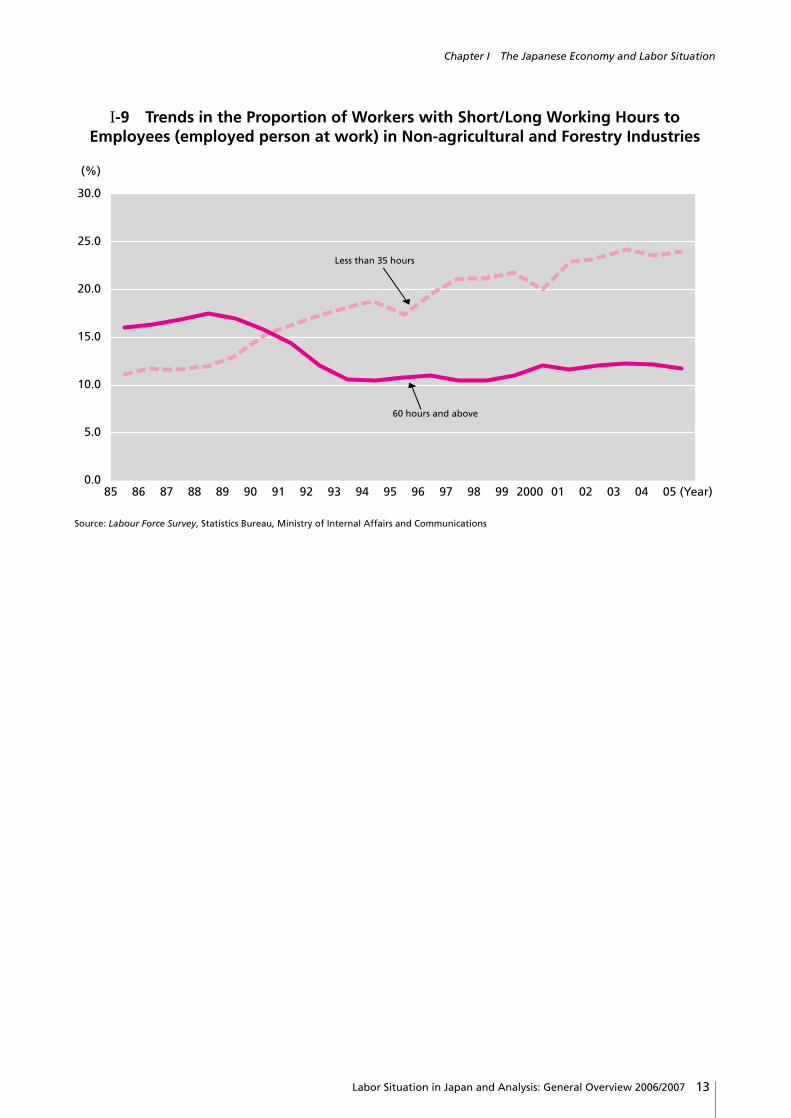
III-1 Attitudes of Companies Towards Lifetime Employment …………………………………………32
III-2 Attitudes of Workers Towards Lifetime Employment ……………………………………………33
III-3 Current Ratio of Hiring for New Graduates (multiple answers) …………………………………35
III-4 Current Ratio of Hiring for Mid-career Workers (multiple answers) ……………………………36
III-5 Methods of Recruiting New College Graduates and Mid-career Hires-2004, 2001
(multiple answers)……………………………………………………………………………………36
III-6 Methods of Screening New College Graduates (multiple answers)………………………………37
III-7 Points Considered Important when Hiring Recent College Graduates
(up to 3 multiple answers) …………………………………………………………………………38
III-8 Points Considered Important when Hiring Mid-career Workers (up to 3 multiple answers)……39
III-9 Method to Secure Desired Human Resources/Capacities …………………………………………40
III-10 Ratio of Companies That Did/Did Not Reassign Employees ………………………………………41
III-11 Reasons for Transferring Employees ………………………………………………………………41
III-12 Ratio of Companies by Implementation Status of Various Personnel Management Systems
and by Future Plans …………………………………………………………………………………42
III-13 Wage Profile by Age and Gender …………………………………………………………………44
III-14 International Comparison of Working Hours
(production workers in manufacturing industries: 2002) …………………………………………46
III-15 Percentage of Annual Paid Leave Consumed ……………………………………………………46
III-16 Long-Term Movements in the Average Annual ……………………………………………………47
III-17 Year-on-Year Difference in the Non-Scheduled Working Hours …………………………………48
III-18 Comparison of Labor Cost Structures by Cost Item (manufacturing) ……………………………50
III-19 Social Insurance Premium Rates (workers) …………………………………………………………51
III-20 Breakdown of Average Compulsory Benefit Costs per Regular Worker Each Month …………52
III-21 Existence of Employee Retirement Benefit Systems in Companies
and Percentage of Companies by the Employee Retirement Benefit System ……………………52
III-22 Current Situation of Off-JT Implementation ………………………………………………………55
III-23 Current Situation of Formal OJT Implementation …………………………………………………56
III-24 The Current and Future Conditions of the Responsible Actor for HRD …………………………56
III-25 Support for Self-development by Employees (multiple answers)…………………………………57
III-26 Special Measures Currently Taken for the Employment of Workers of 60 Years and Over ……60
III-27 Public Support for Expanding Employment of Workers over 60 Years and Over ………………61

vLabor Situation in Japan and Analysis: General Overview 2006/2007
Chapter IV
IV-1 Changes in the Number of Union Members and the Estimated Unionization
Rate for Part-time Workers (Unit labor union) ……………………………………………………65
IV-2 Changes in the Number of Employees and Union Members,
and the Estimated Unionization Rate ………………………………………………………………67
IV-3 Unionization Rate by Size of Enterprise ……………………………………………………………68
IV-4 Unionization by Industry ……………………………………………………………………………68
IV-5 Ratio of Labor Unions by Items Regarding Subject between Labor and Management,
whether or not Negotiation was Held and Session through which Negotiation was Held
(in the past 3 years) Total Labor Unions=100, M. A.………………………………………………70
IV-6 Ratio of Labor Unions by Existence of Labor Disputes (in the past 3 years) ……………………71
IV-7 Fluctuations in Revisions to Average Per Capita Wage and Rate of Revision (weighted average)………………………………………………………………………………………………………73
IV-8 Flowchart for Dispute Settlement According to the Act on Promoting the Resolution
of Individual Labor Disputes…………………………………………………………………………75
IV-9 Number of Consultations (FY2005) ………………………………………………………………76
IV-10 Breakdown of Civil Consultation Cases (FY2005) …………………………………………………76
IV-11 Overview of the Labor Tribunal System ……………………………………………………………78
Chapter V
V-1 Overview of the Act to Partially Amend the Act Concerning Stabilization of
Employment of Older Persons (promulgated June 11, 2004) ……………………………………83
V-2 System of Employment and Labor Measures for the Elderly ……………………………………84
V-3 System of Employment Measures for Persons with Disabilities …………………………………86
V-4 Employment Situation for Disabled Persons at Private Enterprise
Fluctuations in the employment rate and the disabled workers …………………………………87
V-5 Situation of Employment Placement of Persons with Disabilities at Public Employment Security Offices …88
V-6 Changes in the Number of Employment Cases and of New Applications for Employment ……88
V-7 Overview of Statuses of Residence for Foreigners…………………………………………………93
V-8 Measures for Foreign Workers………………………………………………………………………94
V-9 Number of New Entrant Workers to Japan According to Status of Residence (2005) …………95
V-10 Number of Registered Foreigners According to Status of Residence (2005 year-end) …………95
V-11 The Organization and Functions of the Public Employment Service Institutions
(as of March 31, 2005)………………………………………………………………………………97
V-12 Shifts in Average Total Annual Working Hours per Worker (FY, finalized) ………………………99
V-13 International Comparison of Annual Working Hours (workers in the manufacturing industry: 2003)………………………………………………………………………………………………………100
V-14 International Comparison of Annual Holidays……………………………………………………100
V-15 Methods Used to Set Minimum Wages
(minimum wages set through minimum wage council investigation and deliberation) ………102

vi Labor Situation in Japan and Analysis: General Overview 2006/2007
Copyright© The Japan Institute for Labour Policy and Training, 2006First published 2006
For rights of reproduction or translation, application should be made to the International Affairs Department JILPT(Rights and Permissions), The Japan Institute for Labour Policy and Training, 8-23, Kamishakujii 4-chome,Nerima-ku, Tokyo 177-8502, JAPAN (Telephone +81-3-5903-6316 Facsimili +81-3-3594-1113). JILPT welcomessuch applications.
V-16 Minimum Wages (weighted national average) …………………………………………………102
V-17 Outline of Workers’ Compensation Insurance System …………………………………………104
V-18 Changes in Reported Cases of Occupational Accidents…………………………………………106
V-19 Aspects of the Society We Should Aim for in the Child and Child Rearing Support Plan (excerpt)………………………………………………………………………………………………………109
V-20 Annual Trend of Number of Births and Total Fertility Rate ………………………………………109
V-21 Changes in the Number and Percentage of Part-time Workers (people who work less than
35 hours per week) in Industries besides Agriculture and Forestry ……………………………111
V-22 Outline of Self-education and Training in the Private Sector ……………………………………113
V-23 Status on Implementation of Public Vocational Training ………………………………………114
Chapter VI
VI-1 The Social Security System by Life Stage …………………………………………………………117
VI-2 Ratios of Social Expenditures Accounting for National Income and GDP ………………………118
VI-3 International Comparison of the Breakdown of the National Burden Ratio……………………119
VI-4 Changes in Social Security Benefits by Category…………………………………………………120
VI-5 Outlook on Social Security Benefits and Cost Burden …………………………………………121
VI-6 Current Condition of Income Disparity and Redistribution Effects by Social Security (Gini Index)………………………………………………………………………………………………………121
VI-7 The Pension System ………………………………………………………………………………123
VI-8 Annual Trends of the Number of Public Pension Subscribers and the Number of
Public Pension Beneficiaries ………………………………………………………………………123
VI-9 The Medical Insurance System ……………………………………………………………………125
VI-10 Long-term Care Insurance: Approval of the Necessity for Long-term Care
and Method of Using Services ……………………………………………………………………126
Appendix (International Comparisons)
Appendix 1 Population, Labor Force and Labor Force Participation Rate by Gender and Age ………127
Appendix 2 Ratio of Part-time Workers to Number of Employed ………………………………………128
Appendix 3 Unemployment Rate (official release) ………………………………………………………129
Appendix 4 Wages (manufacturing industries) …………………………………………………………130
Appendix 5 Working Hours per Year (estimated value, manufacturing, production employee in principle)………………………………………………………………………………………………131
Appendix 6 Unionization Rate ……………………………………………………………………………131

From Post-war High Economic Growth toStable Growth
In the wake of the confusion and inflation thatcame immediately after the end of the World War II,once the Korean War (1950-51) was over, theJapanese economy, rebuilt from the devastation thatfollowed Japan’s defeat, entered a period of highEconomic growth (1955 to the first half of the 1970s).With an annual average real growth rate of over 10%during this period, Japan has become the world’s sec-ond largest economic superpower after the US.
In addition to the collapse of the fixed exchangerate system and the transition to a flexible exchangerate system, in the 1970s it experienced two separateoil crises. The first oil crisis saw Japan experiencingthe trilemma (triple hardship) of inflation, currentaccount deficit, and economic downturn, in 1974 itrecorded negative growth for the first time since theend of the war, and the process of adjustment provedto be a very difficult one. By drawing on its experi-ence from the first oil crisis, along with an appropri-ate response from the government, calm behavior onthe part of companies and consumers, moderation inwage determination and a structural shift in industrydue to technological innovation, Japan was able torespond to the second oil crisis without any relativelymajor confusion. Looking at its stable growth periodoverall, amongst developed countries the Japaneseeconomy has performed well, with stable growth inthe region of 3-5%, stable commodity prices, and alow unemployment rate.
However, in the 1970s Japan became an “export-ing superpower,” and from the 1980s onwards, amid asubstantial underlying current account surplus, tradefriction has intensified. Furthermore, since the transi-
tion to the flexible exchange rate system, there hasbeen a shift towards a long-term strong yen tendency,and in the latter halves of the 70s and 80s and themid-90s in particular, the strong yen made substantialstrides forward. Companies which faced tough inter-national competition due to the strong yen pushedforward with international specialization. In particu-lar, given the rapid rise of the yen following the PlazaAgreement of 1985, progress towards internationalspecialization moved up another gear, and companieshave responded with measures such as boosting over-seas production, increasing imports of labor-inten-sive, low-cost goods, and a move towards high-value-added exports.
Emergence and Collapse of the BubbleEconomy, and Low Growth in the 90s
With a dramatic rise in the latter half of the 1980sin asset prices such as shares and land prices, fol-lowed by a sudden fall in the first half of the 1990s,Japan experienced the emergence and collapse of abubble economy.
The currency realignment that resulted from thePlaza Agreement among the G5 countries inSeptember 1985 caused a substantial and rapid rise inthe yen, and hastened the downturn in the economy(the “strong yen recession”). In addition to develop-ing economic policies aimed at boosting the econo-my, centered around international policy coordinationand expansion of domestic demand, the governmentimplemented positive easy monetary policy. Withsome advantages to the strong yen emerging, in theeconomic recovery that began in November, 1986(the Heisei Boom), economic growth, centered onprivate sector demand, was high, and with a growth
2 Labor Situation in Japan and Analysis: General Overview 2006/2007
Chapter I The Japanese Economyand Labor Situation
1 The Japanese Economy: Current Situation and Outlook for the Future

rate of around 5%, Japan became one of the leadinglarge economies of the post-war period, with labordemand becoming tighter. However, asset prices suchas shares and land prices rose sharply, and the bubblewas born. Triggered by a substantial rise in interestrates from the 90s onwards, and the implementationof measures to curb land prices, the bubble economysubsequently collapsed, and asset prices declined sig-nificantly.
Following the collapse of the bubble economy(90s), the Japanese economy for a long period contin-ued to remain in the doldrums, referred to as “the 10lost years.” With this as a factor, the following pointscan be made.
(1) This is the effect of stock adjustment. Due tothe large accumulation of capital stock, housing, con-sumer durables and so forth in the bubble period in thelatter half of the 80s, rapid and substantial stockadjustment was carried out during the economicdownturn phase at the beginning of the 90s. (2) This isthe effect of excessive corporate and household debt.Although companies and households in the bubbleperiod acquired stock and land with loans, increasingboth assets and liabilities, with the collapse of thebubble economy asset prices fell, debts remaineduncleared, and as a result, Japan’s balance sheet dete-riorated. Companies saddled with excessive debtsreduced costs such as labor costs, prioritized therepayment of loans, and curbed investment (onecould say that (1) and (2) are companies’ “3 problemsof excess (employment, capital stock, debt)”).Households, too, curbed their consumption. (3) Thisis the problem of non-performing loans. With banks’profits under pressure from the burden caused by theamortization cost of non-performing loans, theirfinancial intermediary functions weakened, leading toa credit crunch. As a result, corporate facilities invest-ment was curbed. Furthermore, with the instability offinancial systems due to bank insolvencies makingcompanies and households more cautious in theirbehavior, business investment and consumption werecurbed. (4) This is the effect of deflation. Amid thedeflationary situation which prevailed from the latterhalf of the 90s onwards, corporate revenues and prof-its slumped, facilities investment was curbed, employ-ment and wages were adjusted, and consumption
failed to grow. Moreover, deflation not only increasesthe debt burden of companies saddled with excessivedebt, but the drop in asset prices, and stagnation incorporate profit that accompanies deflation turns bor-rowers’ loans into non-performing ones, thereby exac-erbating the non-performing loan problem. There isalso the aspect of economic stagnation causing a dropin commodity prices.
It is thought that deflation, together with the prob-lems of excessive debt and non-performing loans,form a vicious circle, and have dragged down theJapanese economy.
This Gradual but Long-term, SustainedEconomic Recovery
Despite temporarily passing through adjustmentphases, at the time of the Iraq War in the first half of2003, and due to adjustments in global IT-related sec-tors from the second half of 2004 to the first half of2005, this economic recovery, which began at thestart of 2002, continues to be a gradual and long-termone. Although at the outset it was a corporate sector-centered recovery, involving exports and businessinvestment, through improvements in the employ-ment and income environment in 2005, movementstowards improvements in the household sector arealso spreading. In terms of the long-term backgroundto this economic recovery, one can cite the sustainedexpansion of overseas economies, and with progressmade on the handling of the negative legacy left bythe bubble economy, the almost complete resolutionof the “3 excesses,” namely employment, capitalstock, and debt (companies rectified excessiveemployment through restructuring; excessive capitalstock through the rolling back of new investment, anddisposal of facilities that were decrepit or lying idle;and excessive debt through repayment of liabilities,as well as debt repayment by asset disposal). In addi-tion, among other factors, with the increased robust-ness of the corporate sector, one could also cite thecontinued improvements in corporate profits, as wellas the favorable turnaround in the financial environ-ment due to the progress made in the handling ofnon-performing loans. Set against this background,although there is a need to keep a close watch on theeffects exerted on the oil price economy with global
3Labor Situation in Japan and Analysis: General Overview 2006/2007
Chapter I The Japanese Economy and Labor Situation

oil prices skyrocketing, for the moment it would befair to say that the effect on the Japanese economy islimited. Regarding prices, however, taking an overallview, although there is a situation of moderate defla-tion, oil prices are skyrocketing, corporate goodsprices are on the increase, the extent of the fall inconsumer prices is contracting, base costs have lev-
eled out, and one has now begun to see a movementtowards a breakaway from deflation.
However, in terms of issues facing the Japaneseeconomy, one could say that the question of howJapan can build a sustainable and dynamic economicsociety, given the decline in the population, is a majorissue.
4 Labor Situation in Japan and Analysis: General Overview 2006/2007
I-1 Real Economic Growth Rate, and Unemployment Rate
Sources: National Accounts, Economic and Social Research Institute, Cabinet Office; Labour Force Survey, Statistics Bureau, Ministry of InternalAffairs and Communications
Notes: Regarding the real economic growth rate, up to and including 1980, 1990 Basis Revised National Accounts (68SNA), from 1981 to 1994 , 1995Basis Revised National Accounts (93SNA) and from 1995 onwards, 2000 Basis Revised National Accounts (93SNA, chain-linked method)"
-4
-2
0
2
4
6
8
10
12
14(%)
5657
5859
6061
6263
6465
6667
6869
7071
7273
7475
7677
7879
8081 83 85 87 89 91 93 95 97 99 01 03 05
82 84 86 88 90 92 94 96 98 2000 02 04 (Year)
Real economicgrowth rate
Unemployment rate
5Labor Situation in Japan and Analysis: General Overview 2006/2007
Chapter I The Japanese Economy and Labor Situation
I-2 Employment, Capital Stock, and Debt Situation1. Employment conditions diffusion index (“excessive”-“insufficient”)
(Year)
-50
-40
-30
-20
-10
0
10
20
30
(% points)
1974 75 76 77 78 79 80 81 82 83 84 85 86 87 88 89 90 91 92 93 94 95 96 97 98 99 2000 01 02 03 04 05 06
Source: Tankan (Short-term Economic Survey of Enterprises in Japan), Bank of JapanNote: 1) All sizes of all industries.
2) From the March 2004 Survey onwards, the survey method changed. For this reason, there is a break in the graph.
2. Production capacity diffusion index (“excessive”-“insufficient”)
(% points)
(Year)1974 75 76 77 78 79 80 81 82 83 84 85 86 87 88 89 90 91 92 93 94 95 96 97 98 99 2000 01 02 03 04 05 06
-20
-10
0
10
20
30
40
Source: Tankan (Short-term Economic Survey of Enterprises in Japan), Bank of JapanNote: 1) All sizes of manufacturing industries
2) From the March 2004 Survey onwards, the survey method changed. For this reason, there is a break in the graph.

6 Labor Situation in Japan and Analysis: General Overview 2006/2007
3. Interest-bearing debt/cash flow ratio
(Year)01980 81 82 83 84 85 86 87 88 89 90 91 92 93 94 95 96 97 98 99 2000 01 02 03 04 05
2
4
6
8
10
12
14
16
18
(%)
Non-manufacturingindustries
All industries
Manufacturing industries
Source: Financial Statements Statistics of Corporations by Industry, Quarterly, Ministry of FinanceNote: Interest-bearing debt/cash flow ratio = interest-bearing debt (long-term loans + short-term loans + bonds)/cash flow (=ordinary profits×
0.5+depreciation expenses)
I-3 The Non-performing Loans Situation
Source: Status of Non-Performing Loans, Financial Services AgencyNote: Total amount of non-performing loans =Non-performing loans based on the Financial Reconstruction Act
0.0
1.0
2.0
3.0
4.0
5.0
6.0
7.0
8.0
9.0
Half-year to
endMarch1999
Half-year to
endSept.1999
Half-year to
endMarch2000
Half-year to
endSept.2000
Half-year to
endMarch2001
Half-year to
endSept.2001
Half-year to
endMarch2002
Half-year to
endSept.2002
Half-year to
endMarch2003
Half-year to
endSept.2003
Half-year to
endMarch2004
Half-year to
endSept.2004
Half-year to
endMarch2005
Half-year to
endSept.2005
(Year/period)
(%)
0
10
20
30
40
50
60
(Trillion yen)
Non-performing loan ratio: all banks (left axis)
Non-performing loan ratio:major banks(left axis)
Total amount of non-performing loans: all banks(right axis)

7Labor Situation in Japan and Analysis: General Overview 2006/2007
Chapter I The Japanese Economy and Labor Situation
I-4 Trends in Prices
Sources: National Accounts, Economic and Social Research Institute, Cabinet Office; Consumer Price Index, Statistics Bureau, Ministry of InternalAffairs and Communications; Corporate goods Price Index, Bank of Japan
80 81 82 83 84 85 86 87 88 89 90 91 92 93 94 95 96 97 98 99 2000 01 02 03 04 05 (Year)-6
-4
-2
0
2
4
6
8
10
12
14
16
(%)
GDP deflator
Consumer price index
Domestic corporate goods price index

8 Labor Situation in Japan and Analysis: General Overview 2006/2007
The Recent Labor SituationFrom the 1990s and the period of the Heisei
Recession onwards, with the Japanese economy feel-ing the effects of the collapse of the bubble economy,and due to the fact that long-term stagnation has per-sisted, the employment and unemployment situationcontinues to be a very difficult one. In particular, in theeconomic downturn phase from 1997 onwards, theemployment and unemployment situation rapidly dete-riorated due to factors such as the slump in rapid pro-duction activity. The sense of employment excess grewstronger up until the first oil crisis hit its peak, corpo-rate restructuring moved forward, and harsh adjust-ments were made in the areas of employment volumeand wages. In 1999, the ratio of active job openings toactive job applicants stood at just 0.48, the lowest everrecorded, and in 2001, for the first time the unemploy-ment rate entered the 5.0 to 5.9% range, reaching5.0%. Since 1998, not only has the number of peoplein work continued to decline, but the downward ten-dency in nominal wages has also continued.
In this economic recovery, which began at thestart of 2002, despite the fact that at the outset, theemployment situation continued to be very difficult,with the total unemployment rate reaching its highestlevel of 5.4% in 2002, due to companies’ round ofrestructuring, and a reduction in the sense of employ-ment excess amid a sustained economic recovery, thejob openings to applicants ratio is on an upwardtrend, the total unemployment rate is now showing adownward tendency, and the number of employees isalso increasing. The ratio of active job openings toactive job applicants in 2005, at 0.95, was secondonly to the 2002 figure of 1.08 (however, inDecember 2005, it reached 1.03 (seasonally adjustedvalue), the first time since 1992 that it has entered the1.0 to 1.9% range). In 2005, the corporate sense ofemployment excess, too, has almost disappeared(“Short-term Economic Survey of Enterprises inJapan”). In 2005, there was an increase in the numberof employees for the third year running, and there
was also a rise in the number of employed person, forthe second year running. For the first time in sevenyears, the labor force population, which had contin-ued to decline due to factors such as the aging of thedemographic structure, and the increased tendency toremain not in labor force, is on the increase.Although the unemployment rate remains as high asever, it has nevertheless come down to 4.4%. Againstthis background, although difficult conditions in thelabor market for new graduates still remain, compa-nies are showing a stronger interest in recruiting newemployees.
As we have seen, although the employment andunemployment situation remains a very difficult one,improvements can be observed. However, if onelooks at these improvements in more detail, variationbetween them can be observed.
The improvements in employment are principallyin non-regular employment. The ratio of active jobopenings to active job applicants for regular staffemployees in 2005, at 0.58 (estimate), is at a lowerlevel than that of the overall ratio of active job open-ings to active job applicants (0.95). The rise in thenumber of employees is due to the increase in non-regular workers (in 2004 and 2005, there has been aprominent increase in dispatched workers, contractemployee or entrusted employee). Even during thiseconomic recovery phase, the number of regular staffand employees, which hit its peak in 1994, continuesits downward trend (“The Special Survey of theLabour Force Survey,” “Labour Force Survey(Detailed Tabulation”).
If one looks at the results by industry and corpo-rate size, set against steady increases in the medical,health care and welfare, and service industries, therecontinues to be a decline in the construction industry.Moreover, delays in employment improvements arebeing observed in small businesses with between 1and 29 people.
In terms of differences between the sexes, the sit-uation for males continues to be relatively difficult,
2 Characteristics of the Recent Labor Situation

9Labor Situation in Japan and Analysis: General Overview 2006/2007
Chapter I The Japanese Economy and Labor Situation
and in terms of the total employment rate in 2005, theaverage for males stands at 4.6%, while the figure forfemales is 4.2%.
In terms of age group differences, the employ-ment and unemployment situation faced by the youngis a particularly difficult one. In 2005, the total unem-ployment rate of those aged 15 to 24 still remainshigh, at 8.7%. Moreover, amid a difficult employmentenvironment for the young, there is a high level of“freeters” and those not in employment, education ortraining (NEET). Following the substantial increasein the number of freeters from the 1982 figure of500,000 to 2.17 million in 2003, although a decreasehas been observed amid improvements in the employ-ment situation, the figure of 2.01 million in 2005 stillremains high. Moreover, the transition from non-reg-ular employment to regular employment is proving tobe a difficult one (the proportion of those movingfrom non-regular employment to non-regular employ-ment is rising, whereas the proportion of those mov-ing to regular employment is falling). Following therise in the number of NEET to 640,000 in 2002, thefigure has remained unchanged up to 2005. However,the job openings-to-applicants ratio is low among theelderly too, and the unemployment rate, particularlyamong men in the 60 to 64 age bracket, is high.
Furthermore, with this economic recovery phase,there are striking regional disparities in the pace ofemployment improvements. In Hokkaido, Tohoku,Kinki, and Kyushu, the total unemployment rateremains between 5.0 and 5.9%, as before. The ratioof active job openings to active job applicants ratio islow in Hokkaido, Tohoku, Shikoku, Kyushu and else-where, with the range of increase in the ratio of activejob openings to active job applicants getting smaller.It is thought that discrepancies in the concentration ofindustries (such as IT-related industries, and manu-facture of transportation equipment), which are pro-viding the momentum for this economic recovery, aswell as differences in the degree of dependence onthe ever-dwindling number of public works projects,are behind these regional disparities in the employ-ment situation.
Furthermore, with this economic recovery,improvements in wages are lagging behind comparedto improvements in corporate profit. In terms of the
background to this, amid deflation and intensificationof competition, it is thought that companies areattempting to improve their financial standing, andtaking a firm stance on curbing labor costs. Althoughthe total cash earnings (establishments with fiveemployees or more) decreased for four years in a row,from 2001 to 2004, the rise in the composition ratioof part-time employees on low wage levels is alsocontributing to the decrease in the total cash earnings.In 2005, high wage increases for ordinary workersmeant that the lowering effect caused by the increasein the composition ratio of part-time employees wasreduced, and as a result, for the first time in fiveyears, there was an increase in the total cash earnings,up by 0.6% year-on-year. If one looks at the break-down of the total cash earnings, there have beenincreases in scheduled earnings, non-scheduled cashearnings, and special cash earnings. Wages in realterms have increased for the first time in five years,up by 1.0% year-on-year. One could say thatimprovements in corporate profits have finally had animpact on wages.
Having said that, in terms of the recent wage situ-ation, one could cite the fact that achievements incompany performance are now reflected in bonusesrather than wage increases, and that companies areincreasingly introducing performance-based wagesystems, in addition to attaching less importance toseniority factors. Moreover, given the rising propor-tion of non-regular employees, a widening in thewage disparities between regular employees and non-regular employees can be observed.
Since the enactment of the Revised LaborStandards Act in 1988, working hours are tending todecrease. In 2005, the number of actual workinghours (establishments with five employees or more)fell by 0.6%. Down by 0.7%, scheduled workinghours have decreased for five years running. With a1.1% increase, non-scheduled working hours haveincreased for four years running, reflecting the econ-omy’s recovery. However, compared to the recoveryperiod of the 90s, in this economic recovery phase animprovement in the employment situation can beobserved, even to the extent that the increase in non-scheduled working hours is reflecting an increase inregular employment.

10 Labor Situation in Japan and Analysis: General Overview 2006/2007
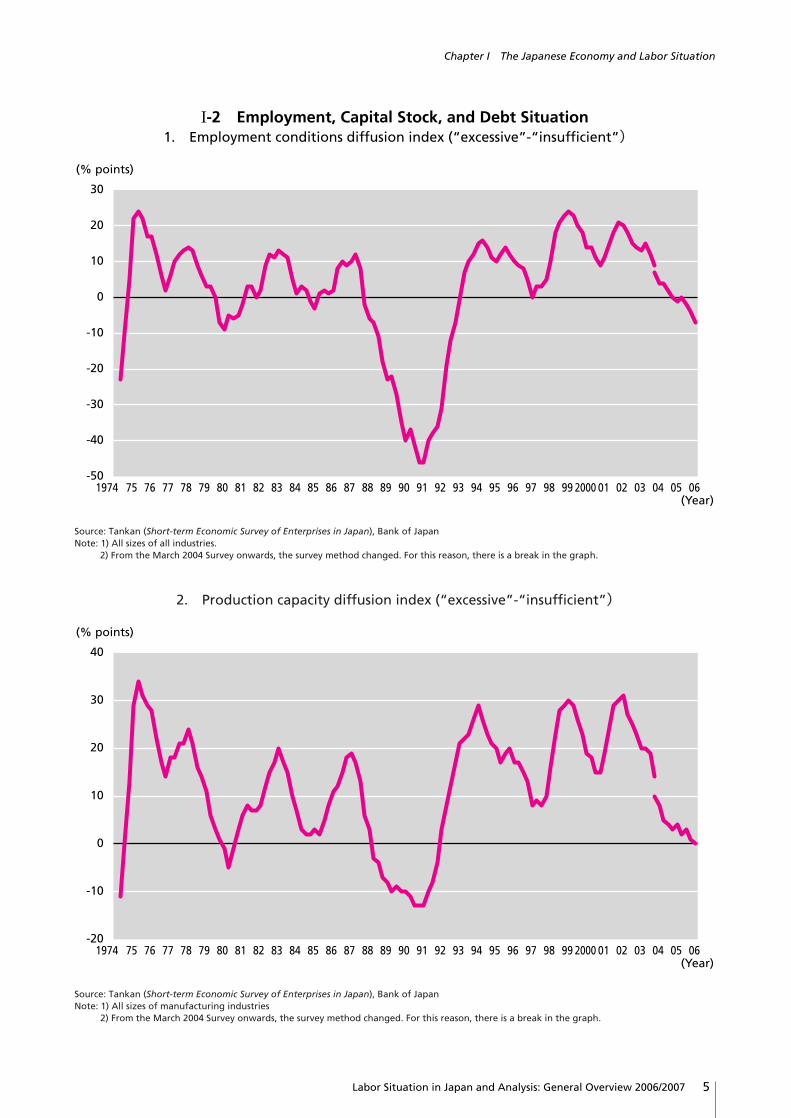
Furthermore, while the proportion of those work-ing less than 35 hours a week to employees(employed person at work) in non-agricultural andforestry industries is on a long-term upward trend, theproportion of those working 60 or more hours a weekleveled out after falling significantly from 1989 to1993. Following that shift, since 1999 it has been ris-ing, albeit gradually (“Labour Force Survey”). Withrising percentages of both those with shorter workinghours, and long working hours, one can observe apolarization of working hours. However, there is atendency among middle-aged men and regular work-
ers to put in long hours.In view of this, one could say that the increasing
variation in wages and employment, as well as theincrease in working long hours, are points to whichattention must be paid.
Hereafter, amidst a decreasing population therewill be calls for the creation of an economy and soci-ety which would enable sustainable developmentthrough the enthusiastic work of a diverse range ofpeople and by making full use of their abilities, allwhile raising the quality of employment.
I-5 Trends in the Unemployment Rate, and Ratio of Active Job Openings to Active Job Applicants
Sources: Labour Force Survey, Statistics Bureau, Ministry of Internal Affairs and Communications; Report on Employment Service, Ministry of Health,Labour and Welfare
(Year)63
6465
6667
6869
7071
7273
7475
7677
7879
8081
8283
8485
8687
8889
9091
9293
9495
9697
9899
200001
0203
0405
0.0
1.0
2.0
3.0
4.0
5.0
6.0
(%, ratio)
Unemployment rate
Ratio of active Job openings toactive Job applicants

11Labor Situation in Japan and Analysis: General Overview 2006/2007
Chapter I The Japanese Economy and Labor Situation
I-6 Trends in the Numbers of Freeters and Young not in Labor Force (NEET)1. Trends in the numbers of freeters
01982 87 92 97 2002 03 04 05
50
100
150
200
250(10,000 people)
(Year)
50
79
101
151
208217 214
201
Sources: For the years 1982, 1987, 1992 and 1997, taken from the White Paper on the Labour Economy 2004 For 2002 and subsequent years, LabourForce Survey (Detailed Tabulation), Statistics Bureau, Ministry of Internal Affairs and Communications
Notes: 1) For the years 1982, ’87, ’92 and ’97, the age of freeters has been limited to those between 15 and 34.① Defining those who are usually engaged in work and called arbeit (temporary workers) or “part-time workers” at the workplaces with
males being those who have continuously been in work for 1 to less than 5 years, and females being those who are unmarried andmainly engaged in work figures have been calculated.
② Defining people usually not in engaged as those who neither keep house nor attend school, and who wish do “arbeit (temporarywork), part-time work”, figures have been calculated.
2) For the years 2002 to 2005, the definition of freeters is restricted to those who have graduated and are aged between 15 and 34, withwomen defined as those who are unmarried, ① those currently in work defined as employed people whose job is referred to as “arbeit(temporary workers)” or “part-time work” and ② people currently not engaged in work as those who neither do housework, nor attendschool, and who wish to do “arbeit (temporary work), part-time work”. Using these definitions, figures have been calculated.
3) Regarding the values for the years 1982 to 1997, and 2002 to 2005, it should be heeded that values do not link up, due to the differingdefinitions and so on of freeters.
2. Trends in the numbers of young not in labor force in “others” (NEET)
0
10
20
30
40
50
60
70
85 86 87 88 89 90 91 92 93 94 95 96 97 98 99 2000 01 02 03 04 05 (Year)
(10,000 people)
40 38 40 38 3639 41
38 40 42 4440 42
46 4844
49
64 64 64 64
Source: Labour Force Survey, Statistics Bureau, Ministry of Internal Affairs and CommunicationsNotes: Within the non-labor force population aged between 15 and 34, and in the "others"(those who neither do housework, nor attend school)

12 Labor Situation in Japan and Analysis: General Overview 2006/2007
I-7 Unemployment Rate and Ratio of Active Job Openings to Active Job Applicantsby Region (2004)
Sources: Labour Force Survey, Statistics Bureau, Ministry of Internal Affairs and Communications; Report on Employment Servce, Ministry of Health,Labour and Welfare
0.0
1.0
2.0
3.0
4.0
5.0
6.0
7.0
Nationwide Hokkaido Tohoku SouthernKanto
NorthernKanto/Koshin
Hokuriku Tokai Kinki Chugoku Shikoku Kyushu
(%)
0.00
0.20
0.40
0.60
0.80
1.00
1.20
1.40
1.60
(ratio)
0.95
0.57
0.68
1.11 1.09
1.06
1.41
0.92
1.10
0.84
0.67
Unemployment rate(left axis) Ratio of active job openings
to active job applicants(right axis)
4.4
5.35.0
4.3
3.73.3 3.2
5.2
3.8
4.3
5.3
I-8 Contributory Factors in Fluctuations of Total Cash Earnings (for establishments with five employees or more)
Source: Monthly Labour Survey, Ministry of Health, Labour and Welfare
3
2
1
0
-1
-2
-3
-494 95 96 97 98 99 20 01 02 03 04 05 (Year)
(%)
Total cash earningsfluctuation rate
Contribution made by part-timeemployees' earnings
Contribution made by full-timeemployees' earnings
Contribution made by compositionratio of part-time employees
13Labor Situation in Japan and Analysis: General Overview 2006/2007
Chapter I The Japanese Economy and Labor Situation
I-9 Trends in the Proportion of Workers with Short/Long Working Hours toEmployees (employed person at work) in Non-agricultural and Forestry Industries
Source: Labour Force Survey, Statistics Bureau, Ministry of Internal Affairs and Communications
85 86 87 88 89 90 91 92 93 94 95 96 97 98 99 2000 01 02 03 04 05 (Year)0.0
5.0
10.0
15.0
20.0
25.0
30.0
(%)
60 hours and above
Less than 35 hours

Population Growth Rate and Decline fromthe Late 1970s
Between November 1945 (immediately after theend of World War II) and October 2005 (national cen-sus), Japan’s population increased by a factor ofabout 1.77, from a reported 72.15 million to 127.76million. Naturally, this continued increase has notbeen at a uniform pace over the entire half century.There has been a switchover in population changefrom the pre-war days of high birth rates and highdeath rates to the post-war situation of fewer birthsand fewer deaths.
During this transition period, we experienced acondition of high birth rates and low death rates.During the first baby boom (1947-49), the populationgrew at an average annual rate of over 5%, butgrowth rapidly slowed down to about 1% per year inthe subsequent 10 years. The second baby boomoccurred in the early 1970s, stimulating another risein the rate of population growth until it once againreverted to 1% growth per year, and then began asteady decline. It recorded a post-war low decreasingto 0.7% in this 5 years.
Nuclear Families as the Main Reason forDecline in the Population Growth Rate
There are a variety of factors behind the decline inpopulation growth. However, one of the biggest rea-sons is the population shift from farming villages tourban centers causing an increase in families ofemployed laborers forming nuclear families, and as aresult the birth rate have declined. This transition wasalso marked by the tendency to postpone marriageand child-bearing until a higher age. Along withreceiving a higher level of education, women are con-
tinuing to find an expansion of employment opportu-nities; the resulting rise in the female employmentrate is closely related to this trend.
Total Population Peaked in 2004, andthereafter Decline
It is believed that Japan has entered a period ofpopulation decline. According to the latest statisticsfrom the Ministry of Internal Affairs andCommunication, the population peaked in 2004reaching 127.78 million. It has decreased for the firsttime in history. Although population change is due tonatural and societal increase and decrease, the naturalincrease and decrease that is considered to be thebasis for population change has been graduallydecreasing. Population distributions by age, too, willfurther increase with the tendency toward lower birthrates and a larger elderly population (see II-1). Theworking population is already diminishing in bothreal and proportional terms. As a result, there is con-cern over problems such as a slow-down in economicgrowth, and an increasing burden of support for theyounger and older segments of society. As the laborforce ages, a decrease in the number of young work-ers and overall manpower is observable.
Post-war Period Characterized byRegional Migrations in Search ofEmployment Opportunities
Looking at the population shifts between threemajor urban areas and other areas of Japan over thepostwar years shows one striking pattern-the shiftfrom non-urban areas (farming villages) to majorcities during the period of high economic growth inthe 1950s and 1960s. With the exception of the eldest
14 Labor Situation in Japan and Analysis: General Overview 2006/2007
Chapter II The Labor Market
1 Population and Labor Force

15Labor Situation in Japan and Analysis: General Overview 2006/2007
Chapter II The Labor Market
II-1 Japan’s Population in 50 years
Source: Japan’s Population in 50 Years, National Institute of Population and Social Security ResearchNote: “Hinoeuma” is one of the sign in the Oriental Zodiac. It is superstitiously believed that females born to this sign will create evil and many
people avoided to give birth on this year.
Year 2000: 126.93 million persons Year 2050: 100.59 million persons
00 0 200 400 600 800 1000200
(Age)
(10,000 persons)
65 years old-17.4%
15-64 years old68.1%
-14 years old14.6%
65 years old-35.7%
15-64 years old53.6%
-14 years old10.8%
40060080010001200
5101520253035404550556065707580859095
100Effects of WW@
54, 55 years old: Decrease in birth rate around the War time
84 years old: The year of the
“Hinoeuma” of 1966
76-79 years old: The second baby
boom of 1971-1974
50 years old: Born in 2000
34 years old: The year of the
“Hinoeuma“of 1966
26-29 years old: The second baby
boom of 1971-1974
51-53 years old: The first baby boom
between 1947 and 1949
sons of families engaged in agriculture, people movedfrom farming areas (where employment opportunitieswere limited) to cities, where they could easily findwork in the rapidly developing secondary and tertiaryindustries. This shift brought about the serious prob-lems of depopulation in the countryside and over-crowding in urban centers. A subsequent shift saw amigration within urban boundaries from congestedcity centers to the suburbs. Geographic shifts in popu-lation finally began to subside with the 1973 oil crisisand the subsequent tapering off of economic growth.
Concentration of Population in theGreater Tokyo Area
The heavy concentration of population in theGreater Tokyo area, as opposed to other urban centers,poses many difficulties. Also noteworthy (though notso much in terms of absolute population) are the so-called “U-turn” and “J-turn”-the tendency for peopleto move from their birthplaces in the countryside to alarge urban center, and later back to their home-towns
or a major regional city near their hometowns.The concentration has been increasing yearly, and
as of 2005 (national census), approximately 27% ofJapan’s population centers in the four prefectures ofSaitama, Chiba, and Kanagawa, and Tokyo.
Globalization Brings Increase in theForeign Population
With the advancement of globalization, the for-eign population in Japan is increasing gradually.
In the past, North and South Koreans accountedfor the vast majority of Japan’s resident aliens. Theirratio has been decreasing, however, and as of the endof 2004, they accounted for 30.8% of the foreignpopulation, a record low (see II-2). On the otherhand, there has been an influx of people from otherAsian countries such as China and the Philippines,and the number of Central and South Americans ofJapanese descent who have immigrated to Japan withthere families to work is also on the rise afterapproval of their permanent-resident visas. This trend

16 Labor Situation in Japan and Analysis: General Overview 2006/2007
Source: Labour Force Survey, Population Census, Ministry of Internal Affairs and CommunicationsNote: The figures above are average values for 2004
II-3 Composition of Labor Force
Total population 127,619
65 years oldand over24,311
Population of working age 85,404
Labor force 66,420
Workers 63,290
Employees 53,550
Unemployed persons 3,130
Not in labor force 42,850
Persons agedunder 1517,905
Family workers 2,900
Self-employed workers 6,560
Closure 1,060
0 20,000 40,000 60,000 80,000 100,000 120,000 140,000
(1,000 persons)
II-2 Changes in Registered Alien Population by Nationality
Source: Statistics on Aliens in Japan, 2005, Immigration Association
2004200019951990
Total 1,075,317 1,362,371 1,686,444 1,973,747
North/South Korea 687,940 666,376 635,269 607,419
Distribution (%) 64.0 48.9 37.7 30.8
China 150,339 222,991 335,575 487,570
Distribution (%) 14.0 16.4 19.9 24.7
Brazil 56,429 176,440 254,394 286,557
Distribution (%) 5.2 13.0 15.1 14.5
Philippines 49,092 74,297 144,871 199,394
Distribution (%) 4.6 5.5 8.6 10.1
Peru 10,279 36,269 46,171 55,750
Distribution (%) 0.9 2.7 2.7 2.8
U.S. 38,364 43,198 44,856 48,844
Distribution (%) 3.6 3.2 2.6 2.5
Others 82,874 142,800 225,308 288,213
Distribution (%) 7.7 10.5 13.4 14.6
(Year end figures)

began to gather speed during the bubble economy ofthe late 1980s. The Chinese population in Japan, inparticular, has been increasing greatly since 2000 andhas made up more than 25% of the foreign populationby the end of 2004. The number of registered alienshas increased steadily as well, reaching an all-timehigh of 1.974 million persons in the end of 2004. Thepercentage of foreigners in the total population isabout 1.55%.
Labor Force Declines, Labor Force RatioRemains Stable
In 1960, the number of Japanese people capableof working (which includes all persons aged 15 andolder) was 65.20 million. In 2004, this number hadjumped to 109.90 million.
The labor force includes those people aged 15 andolder who actually hold jobs and therefore qualify as“workers,” as well as “completely unemployed per-sons” who want and seek jobs, but are not currentlyengaged in any work.
Although the labor force population reached
66.42 million (male: 39.05 million, female: 27.37million) in 2004, having been 45.11 million in 1960,it had decreased by 240,000 compared to 2003.
The ratio of the labor force to the general popula-tion aged 15 and older is called the “labor force ratio”(or the “labor force population ratio”). In 1960,Japan’s labor force ratio was 69.2%, but it declined to62.9% in 1976 after the first oil crisis, and hasremained quite stable at this level until today. In2004, Japan’s labor force ratio was 60.4% (male:73.4%, female: 48.3%).
Features of Japan Visible in the LaborForce Ratio
Figure II-4 shows the labor force ratio classifiedby gender and age from 1970 to 2004, and points outthe following characteristics as long-term trends ofJapan’s labor force ratio.(1) The ratio of males aged 24 and under in the
younger bracket tends to decline, but the ratio ofthe elderly (age 55 and older bracket) tends toincrease. The other age groups demonstrate no
17Labor Situation in Japan and Analysis: General Overview 2006/2007
Chapter II The Labor Market
II-4 Changes in the Labor Force Participation Ratio by Gender and Age: 1970–2004
1970
1980
1990
2000
2004
0
10
20
30
40
50
60
70
80
90
100
0
10
20
30
40
50
60
70
80
90
100
15|
19
20|
24
25|
29
30|
34
35|
39
40|
44
45|
49
50|
54
55|
59
60|
64
65|
Age
15|
19
20|
24
25|
29
30|
34
35|
39
40|
44
45|
49
50|
54
55|
59
60|
64
65|
Age
(%) (%)Male Female
Source: Labour Force Survey, Ministry of Internal Affairs Communications

18 Labor Situation in Japan and Analysis: General Overview 2006/2007
large change.(2) The female labor force ratio develops in the “M”
curve: the labor force ratio of female workersdeclines for workers in their late 20s through their30s, and increases again after that. During thisperiod, the valley section of this “M” curve hasshifted northeastward. In addition, both peaks ofthis “M” curve have become higher, revealing anincrease in the labor force ratio. Above all, theincreases of female workers in the 25-34 and 55-64 age groups are prominent.
Factors Behind the Labor Force RatioThe following factors are thought to have caused
these changes in the labor force ratios.(1) Both male and female have become better educat-
ed. In 1960, the ratio of those who advanced tohigh school was 57.7% of junior high schoolgraduates (male and female combined, excludingthose who proceeded via correspondence cours-es). This figure jumped to 96.5% in 2005. In addi-tion, the ratio of those who moved on to universi-ties (undergraduate), junior colleges (liberal arts),and so on was 10.3% in 1960 (male and female
combined, including “ronin”-those who graduatedfrom high school, but failed to enter a college andare waiting for another chance). This figureincreased to 51.5% in 2005. As a result of thesedevelopments, the labor force ratio for teenagershas declined.
(2) Since women often quit their jobs during the peri-ods of marriage, childbirth, and child rearing, thelabor force ratio of those women in their late 20sdeclined. Recently, however, many wives andmothers have continued to hold jobs through thesepersonal changes. Further influencing the laborforce ratio, women have begun to delay marriageand childbirth, and the ratio of unmarried womenhas increased. Above all, women with higher lev-els of education have a stronger tendency to con-tinue their jobs during marriage, childbirth, andchild rearing than women with less education.
(3) In addition, women who have devoted themselvesto matters at home such as childbirth and childrearing, primarily women in their 40s, are increas-ingly returning to the full-time and part-time jobmarkets.

19Labor Situation in Japan and Analysis: General Overview 2006/2007
Chapter II The Labor Market
Diversification in Forms of EmploymentAlong with changes in the structure of industry,
the structure of employment is also undergoing somemajor changes. If one looks at changes in the numberof people in work by industry, we can see that theproportion of tertiary industries, centered around theservice industry, is rising, taking the place of sec-ondary industries centered around manufacturingindustries. Out of the 63.56 million people in work in2005, tertiary industries account for 67.4%, and look-ing at the figures by industry, 18.31 million (28.8%)are in the service industry (the total of the medicaland welfare, education and learning support indus-tries, and the compound service industry, based onJapan’s industry classification, as well as other ser-vice industries that cannot be categorized), 11.42 mil-lion (18.0%) are in manufacturing industries, 11.22million (17.7%) are in the wholesale and retail indus-try, 5.68 million (8.9%) are in the construction indus-try, 3.43 million (5.4%) are in the food and beverageand hotels industry, 2.53 million (4.0%) are in theagricultural industry, 3.17 million (5%) are in thetransport industry, and 1.76 million (2.8%) are in theinformation and telecommunications industry. In con-trast to service industries, which continue to increaseacross-the-board, manufacturing industries, sincereaching a peak of 15.69 million in 1992, have subse-quently continued their downward trend.
Accompanying the change in the structure ofemployment by industry, in the form of an increase inthe ratio of tertiary industries, diversification in theforms of employment is also advancing, with anincrease in those working as part-time workers anddispatched workers not within the bounds of regularemployment. If one looks at the proportions, byforms of employment, of the total number of peoplein work, including people working in a self-employedcapacity etc., in the averages for 2005, out of the63.43 million people in work, 54.07 million (85.2%)are employees, while 9.04 million (14.3%) are non-employed, such as the self-employed and so on. If
one looks at the content of employees, 37.74 million(59.5%) are regular staff, including executives, whilethe number of non-regular staff comes to 16.33 mil-lion (25.7%), meaning that the number of non-regularstaff has increased to the point where it surpasses thenumber of non-employed, such as the self-employedetc., by around 5 million.
If one looks just at the figures for employees, incontrast to regular staff, who account for 69.8% ofthe total, non-regular staff, at 30.2%, account forapproximately three-tenths. Furthermore, if one looksat the content of non-regular staff, part-time workers,the largest group at 7.8 million, account for 14.4% ofthe total of employees. The next largest group afterpart-time workers is made up of those with temporaryworkers, numbering 3.4 million (6.2% of the total),while 2.78 million (5.1% of the total) are contractemployees and entrusted employees, and 1.06 million(2.0% of the total) are dispatched workers.
If one looks at the shifts in the proportion of non-regular staff from a chronological perspective, in con-trast to the 1986 figure of 16.6% and the upward ten-dency it has shown since then, in 2005 it has risen ashigh as 32.6%. The rise in those intervening years hasbeen brought about mainly by the rise in the propor-tion of part-time and temporary workers. Althoughdispatched workers only account for a small propor-tion of the total of non-regular staff, if one looks atthe last three years, we can see that it has more thandoubled its growth (0.9% in 2002, 2.1% in 2005).
Furthermore, if one looks at the proportion ofnon-regular staff by sex, females accounted for52.5% (38.4% in 1995), whereas males made up17.7% (8.5% in 1995). Looking at the figures byindustry, in 2005, the highest proportion, at 44.3%,were employed in the wholesale and retail industry,with manufacturing industry accounting for 20.8%.
As we have seen, the number of non-regular staffhas increased to the point where it accounts forapproximately 30% of employees, and that increasehas been brought about mainly by the increase in the
2 Employment and Unemployment Trends

20 Labor Situation in Japan and Analysis: General Overview 2006/2007
proportion of those engaged in female-dominated part-time and temporary work. Recently, there has been amale-dominated expansion in the employment ofthose in the fields of contract employee and entrustedemployees other than part-time and temporary work.Having said that, the increase in the number of non-regular staff is exposing the problem of wideningwage disparities with regular staff, and it also raisesthe issue of just how to establish the basic principleof equal wages for equal labor.
The Rise in the Unemployment RateThrough the establishment of the long-term, sta-
ble employment practice referred to as lifetimeemployment, and the repositioning of flexible humanresources within companies and corporate groups,Japanese society boasted a low unemployment rate ofbetween 1.0 and 2.9%. Once it entered the 1990showever, the employment situation rapidly deteriorat-ed, due to such factors as the increase in bankruptciesand closure of companies caused by the deflationaryeconomy, as well as the increase in shifting produc-tion overseas in manufacturing industries. In 1998,the year which saw the financial crisis, the totalunemployment rate rose suddenly to the rangebetween 4.0 and 4.9%, reaching 5.4% in 2003. Withthe effect of the economic recovery, although still at ahigh level, the total unemployment rate has subse-quently shifted to a downward trend, and in 2005stands at 4.4%.
Set against this background, in recent years theproblems of youth unemployment and long-termunemployment have become apparent, and the struc-ture of unemployment is clearly deteriorating. If onelooks at the unemployment rate by age group, thehighest figure is among young people, and out of thetotal of the 2005 unemployment rate of 4.4%, 10.2%were aged 15 to 19, 8.4% were aged 20 to 24, and6.2% were aged 25 to 29. Factors affecting this situa-tion include the fact that there are many who left theirjobs voluntarily for their own reasons, as well asthere being a large number who alternate betweenperiods of short-term employment, such as temporarywork, and being unemployed.
Meanwhile, there has been a rapid increase inrecent years in the numbers of the long-term unem-
ployed whose period of unemployment is one year ormore. In the average figures for 2005, out of 2.94million completely unemployed persons, with960,000 being long-term unemployed, or 32.7%, theproportion has now exceeded 30%. Moreover, out ofthe long-term unemployed, middle-aged and elderlypeople aged between 45 and 64 account for approxi-mately 38.0%, with a figure of 350,000 people. Inaddition, the proportion of the long-term unemployedset against the labor force population (the long-termunemployment rate) has risen substantially since1999, and in the October to December quarter of2005, stood at 1.4%.
Mismatches between Employers and Job-seekers
In the background to the unemployment rate is theproblem of mismatches, in which the requirements ofemployers, and the desired requirements of the job-seekers do not quite match up. Since the latter half ofthe 1990s, the structural and frictional unemploymentrate arising from mismatches between employers andjob-seekers has been on an upward trend, more sothan the demand shortage unemployment rate, whichbecame apparent in the recession period. Out of thetotal unemployment rate of 4.6% in the January toMarch quarter of 2005, it is estimated that 4.0% wasthe structural and frictional unemployment rate, and0.6% the demand shortage unemployment rate, withfour-fifths of unemployment being that due to mis-matches between employers and job-seekers.
With respect to demand shortage unemployment,economic policies take precedence if one considersthat employment is demand derived from production.On the other hand, regarding the problem of mis-matches, measures to deal with employment andunemployment play an important role. Although thecausal factors behind the problem of mismatches, inwhich large numbers of vacancies are unfilled, arecomplex, in terms of the main ones, the reality is thatthere are substantial discrepancies in the desiredworking conditions, centering around wages, betweenemployers and job-seekers; job-seekers are unable toprovide the vocational skills required by the employ-ers; and with employers imposing strict age restric-tions, middle-aged and elderly job-seekers are being

21Labor Situation in Japan and Analysis: General Overview 2006/2007
Chapter II The Labor Market
robbed of the opportunity to apply for work.
II-5 Breakdown of Employed Persons (2005 Average)Employed Persons (2005 average) 6,343
Type of Employment
Employed 5,407(85.2)
Not employed 904 (14.3)
Status at work
Regular staff 3,774 (59.5) Non-regular staff 1,633 (25.7)
Part-time workers 780 (12.3)Temporary workers 340 (5.4)(Arbeit)Dispatched workers 106 (1.7)Fixed-term contract workers/ 278 (4.4)Entrusted employees (shokutaku)Others 129 (2.0)
Executive officers 400 (6.3)Permanent employees 3,374 (53.2)(excluding executive officers)
Self-employed 626 (9.9)Workers in family businesses 278 (4.4)
Source: Labour Force Survey (Detailed Tabulation), Statistics Bureau, Ministry of Internal Affairs and CommunicationsNote: Figures not in parenthesis indicate the number of people in the ten thousands; those in parenthesis indicate the percentage in overall population.
II-6 Breakdown of Employees by Status at Work
0
5
10
15
20
25
30
35(%)
Rate of non-regular staff
Rate of non-regular staff of part-time/temporary workers
Rate of non-regular staff other than part-time/temporary workers
1986 87 88 89 90 91 92 93 94 95 96 97 98 99 2000 01 (year)05040302
Sources: Special Survey of Labour Force Survey (February survey) (1986-2001) and Labour Force Survey (Detailed Tabulation) (2002-2005), StatisticsBureau, Ministry of Internal Affairs and Communications
Notes: 1) Rate includes employees other than directors.2) A reason for the drop in the rate of part-time workers in 2002 is that the survey questionnaire for the "Labour Force Survey (Detailed
Tabulation)" was different from that of the prior "Special Survey of Labour Force Survey," and therefore, that some people who respond-ed until 2001 that they were part-time workers may have answered in 2002 that they were, contract employees or entrusted employees.

22 Labor Situation in Japan and Analysis: General Overview 2006/2007
II-7 Breakdown of Non-Agricultural/Forestry Industry Employees by Working Hours
5
7
9
11
13
15
17
19
21
23
25
1980 868584838281 87 88 89 90 91 92 93 94 95 96 97 98 99 2000 01 05040302 (year)
1-34 hour(s)
1-29 hour(s)
(%)
Sources: Labour Force Survey, Statistics Bureau, Ministry of Internal Affairs and Communications
II-8 Shifts in the Total Unemployment Rate, and Long-term Unemployment Rate
Sources: Labour Force Survey, Special Survey of Labour Force Survey (1977 - 2001), Labour Force Survey (Detailed Tabulation) (2002-2005) StatisticsBureau, Ministry of Internal Affairs and Communications
Notes: 1) Long-term unemployment rate=completely unemployed persons with an unemployment period of 1 year or more/labor force popula-tion
2) The values (raw values) for 1982 and before are those for March each year; from 1983 to 2001 they are for February each year; from 2002to 2004, they are yearly averages; for 2005 they are for Jan.-Mar., Apr.-Jun., Jul.-Sept., and Oct.-Dec.
1977 7978 80 81 82 83 84 85 86 87 88 89 90 91 92 93 94 95 96 97 98 99 2000 01 02 05Ⅰ Ⅱ Ⅲ Ⅳ
03 04
0.0
1.0
2.0
3.0
4.0
5.0
6.0
(Quarter)
(year)
unemployment rate
Long-term unemployment rate
(%)

23Labor Situation in Japan and Analysis: General Overview 2006/2007
Chapter II The Labor Market
II-9 Shifts in the Structural/Frictional Unemployment Rate, and the Demand Shortage Unemployment Rate
Sources: Estimates made by the Labour Policy Director’s Office of the Ministry of Health, Labour and Welfare, from the Employment SecurityOperations Statistics, Ministry of Health, Labour and Welfare, and Labour Force Survey, Statistics Bureau, Ministry of Internal Affairs andCommunications
Note: Regarding the structural/frictional unemployment rate, the limitations inherent in estimates should be borne in mind given the effect ofchanges in economic conditions and so forth.
-1.0
0.0
1.0
2.0
3.0
4.0
5.0
6.0
76 77 78 79 80 81 82 83 84 85 86 87 88 89 90 91 92 93 94 95 96 97 98 99 2000 01 02 0503 04(year)
unemployment rate
Structural/ frictional unemployment rate
Demand shortage unemployment rate
(%)

24 Labor Situation in Japan and Analysis: General Overview 2006/2007
Decreasing Numbers Employed in theAgricultural and Forestry Industries
When taking an overall look at the recent fluctua-tions in the employment structure by main industries(see II-10, 11), the number of those employed in theagricultural and forestry industries continues todecline consistently, with a total of 2.59 million per-sons employed in 2005, representing a 4.1% share ofall workers. The number of persons employed in theconstruction industry showed a tendency to increasefrom 1990 to 1995 due to the building rush in thewake of the bubble economy years; but this sector toois recently in a downward shift, having decreased foreight consecutive years to employ 5.68 million per-sons in 2005 (representing a total of 8.9% of allworkers).
Manufacturing and the Hollowing Out ofIndustry
The manufacturing industry has been greatlyaffected by the globalization of production activitiesin particular. In 1995, with the temporary dollar-yenexchange rate of US$1=¥80, not only large corpora-tions but also small and medium manufacturers beganto move operations overseas, leading to a suddenrealization of the “hollowed-out industry problem”.In 1993, with the yen continuing to appreciate rapid-ly, the number of workers in the manufacturing indus-try began a downward trend. From 1993, the numberof workers in the manufacturing industry have fallen ,to a level of 11.50 million in 2004. Japan’s overseasmanufacturing production rate began to increase afterthe conclusion of the G5 Plaza Accord in 1985, andby FY2003 this rate had reached a level of 15.5%(“Basic Survey on Overseas Business Activities,”Ministry of Economy, Trade, and Industry, 2003).Within this figure, the share of overseas productionfor transport machinery manufacturers stands at32.6% and for electric machinery manufacturers at23.4%, reaching levels greatly above the average andcausing anxieties about the falling levels of workers
in the skilled divisions of these two industries.As these types of industries are increasingly
showing an international division of labor, a marketshift is being contemplated in which domestic focuswould be placed on strengthening research and devel-opment and high value-added divisions.
Increasing Numbers Working in tertiaryIndustries
On the other hand, the number of tertiary indus-tries has been steadily rising during the past 10 years,and the number of employees in 2005 was 42.87 mil-lion persons, reaching 67.4 % of the total number ofemployees. However, a downward shift is being wit-nessed in number of workers in the wholesale, retailindustries. After rising steadily until 1998, workernumbers peaked in 1999, to drop off in 2005, withworker numbers totaling 11.22 million, or a 17.7%share of all workers.
Responding to IT and Maintaining andTraining Human Resources
Concerning employment structure by type ofwork (see II-12, 13) reflecting the changes in theindustrial structure, the number of workers in theagricultural, forestry and fishery industries has fallenby half-from 10% of all workers in 1980, to 4.4% in2004. Moreover, the number of workers in produc-tion, manufacturing, machine operation and construc-tion is declining due to effects of the globalization ofthe manufacturing business and construction slumps,and accounts for 22.2% of the total number ofemployees in 2004.
On the other hand, the number of those workersengaged in specialized or technical work has risenconsistently over the last fourteen years, to reach14.7% of the total number of workers in 2005 (11% in1990). In the future, with international competitionbecoming all the more severe, the necessity is increas-ing to cultivate and maintain human resources capableof responding to the IT and technology revolutions.
3 Changes in the Employment Structure

25Labor Situation in Japan and Analysis: General Overview 2006/2007
Chapter II The Labor Market
Another important issue will be to improve treat-ment of workers by basing evaluations on merit andby offering a wider variety of career opportunities, as
well as to provide professional ability developmentopportunities at all levels.
II-10 Year-on-Year Difference in the Number of Employees by Principal Industries
-40
40
20
30
10
-10
0
-20
-30
Ave. in 2003
Ave. in 2004
Ave. in 2005
ServicesMedical health careand welfare
Eating and drinking place, accomodations
wholesale and retail tradeManufacturingConstruction
(10,000 persons)
II-11 Trends of Employments by Three Industry Divisions
Source: Labour Force Survey, Statistics Bureau, Ministry of Internal Affairs and CommunicationsNotes: 1) Primary industry means Agroforestry and Fishery.
2) Secondary industry means Mining, Construction, and Manufacturing.3) Tertiary industry means industries other than above, excluding those non-categorizable.
1994 6,453 373 2,157 3,894 3 -10 -19 31 0.0 -2.6 -0.9 0.8 100.0 5.8 33.4 60.3
1995 6,457 367 2,125 3,940 4 -6 -32 46 0.1 -1.6 -1.5 1.2 100.0 5.7 32.9 61.0
1996 6,486 356 2,121 3,979 29 -11 -4 39 0.4 -3.0 -0.2 1.0 100.0 5.5 32.7 61.3
1997 6,557 350 2,134 4,039 71 -6 13 60 1.1 -1.7 0.6 1.5 100.0 5.3 32.5 61.6
1998 6,514 343 2,050 4,085 -43 -7 -84 46 -0.7 -2.0 -3.9 1.1 100.0 5.3 31.5 62.7
1999 6,462 335 2,008 4,078 -52 -8 -42 -7 -0.8 -2.3 -2.0 -0.2 100.0 5.2 31.1 63.1
2000 6,446 326 1,979 4,103 -16 -9 -29 25 -0.2 -2.7 -1.4 0.6 100.0 5.1 30.7 63.7
2001 6,412 313 1,921 4,133 -34 -13 -58 30 -0.5 -4.0 -2.9 0.7 100.0 4.9 30.0 64.5
2002 6,330 296 1,845 4,134 -82 -17 -76 1 -1.3 -5.4 -4.0 0.0 100.0 4.7 29.1 65.3
2003 6,316 293 1,787 4,175 -14 -3 -58 41 -0.2 -1.0 -3.1 1.0 100.0 4.6 28.3 66.1
2004 6,329 286 1,738 4,236 13 -7 -49 61 0.2 -2.4 -2.7 1.5 100.0 4.5 27.5 66.9
2005 6,356 282 1,713 4,287 27 -4 -25 51 0.4 -1.4 -1.4 1.2 100.0 4.4 27.0 67.4
Total PrimaryIndustry
SecondaryIndustry
TertiaryIndustry Total Primary
IndustrySecondaryIndustry
TertiaryIndustry Total Primary
IndustrySecondaryIndustry
TertiaryIndustry Total Primary
IndustrySecondaryIndustry
TertiaryIndustry
Real Count (10,000 persons) Year-on-Year Difference (10,000 persons) Year-on-Year Difference (%) Proportion (%)
Source: Labour Force Survey, Statistics Bureau, Ministry of Internal Affairs and Communications

26 Labor Situation in Japan and Analysis: General Overview 2006/2007
II-12 Year-on-Year Difference in the Number of Employed Workers by Occupation
20
30
10
-10
0
-20
-30
Ave. in 2003
Ave. in 2004
Ave. in 2005
Production Process Labor
Protective Service and
Service Business
Sales
ClericalManegerialSpecialized and Technical
(10,000 persons)
II-13 Number of Employed Workers by Major Occupation
Total
Employed Workers
Specializedand
TechnicalManegerial Clerical Sales
ProtectiveService and
ServiceBusiness
Agriculture,Forestry,
and Fishery
Transportationand
Communication
ProductionProcessLaborA+B
Manufacturing,Production,
Operation, andConstruction (A)
Labor (B)
RealCount
Year-on-
YearDiffere-
nce(10,000
per-sons)
Male and
FemaleTotal
Male and
FemaleTotal
1995 6,457 790 236 1,252 945 610 363 237 1,997 1,687 310
1996 6,486 804 240 1,263 933 618 352 240 2,004 1,686 318
1997 6,557 824 226 1,273 940 637 346 241 2,034 1,706 328
1998 6,514 844 222 1,290 928 654 340 232 1,967 1,634 333
1999 6,462 846 215 1,273 921 668 332 228 1,938 1,604 334
2000 6,446 856 206 1,285 911 677 321 221 1,927 1,580 347
2001 6,412 873 202 1,249 968 693 309 214 1,859 1,506 353
2002 6,330 890 187 1,228 934 717 291 211 1,817 1,468 349
2003 6,316 906 185 1,230 917 729 289 210 1,790 1,437 353
2004 6,329 920 189 1,244 901 748 284 201 1,775 1,415 360
2005 6,356 937 189 1,247 892 757 279 204 1,779 1,416 363
1995 4 12 1 14 2 7 -6 3 -26 -28 2
1996 29 14 4 11 -12 8 -11 3 7 -1 8
1997 71 20 -14 10 7 19 -6 1 30 20 10
1998 -43 20 -4 17 -12 17 -6 -9 -67 -72 5
1999 -52 2 -7 -17 -7 14 -8 -4 -29 -30 1
2000 -16 10 -9 12 -10 9 -11 -7 -11 -24 13
2001 -34 17 -4 -36 57 16 -12 -7 -68 -74 6
2002 -82 17 -15 -21 -34 24 -18 -3 -42 -38 -4
2003 -14 16 -2 2 -17 12 -2 -1 -27 -31 4
2004 13 14 4 14 -16 19 -5 -9 -15 -22 7
2005 27 17 0 3 -9 9 -5 3 4 1 3
Source: Labour Force Survey, Statistics Bureau, Ministry of Internal Affairs and Communications
Source: Labour Force Survey, Statistics Bureau, Ministry of Internal Affairs and Communications

27Labor Situation in Japan and Analysis: General Overview 2006/2007
Chapter II The Labor Market
Non-regular staff Comprise 34.6% ofEmployees
During the long-term economic stagnation thatbegan in the 1990s, Japan’s economic environmentchanged enormously, including the development ofeconomic services, the intensification of internationalcompetition and advances in IT. Worker values havealso evolved and diversified over this period. Withthis fundamental shift in the socioeconomic environ-ment as a backdrop, there has been a concomitantstartling rise in the number of workers who are notclassifiable as regular workers; i.e. part-time workersor dispatched workers. According to the “Survey ofthe Diversification of Employment Status” issued bythe Ministry of Health, Labour and Welfare in 2003,non-regular staff comprise 34.6% of all workers, witha large number of women in this category (see II-14).In addition, the largest group among these non-regu-lar staff were part-time workers (23.0%), followed bytemporary workers (0.8%), and dispatched workers(2.0%).
Taking a look at the increases in the proportion ofnon-regular staff by age and gender, and looking attrends over a 20-year period to 2004, we see that theproportion of non-regular staff is increasing in everyage bracket. The increase is particularly noticeable infigures for women overall, as well as the young andthe elderly (see II-15).
11.06 Million Part-time WorkersHere we take a look at the fluctuations in part-
time workers, who comprise the vast majority of non-regular staff. Part-time workers here are defined inaccordance with the Ministry of Internal Affairs andCommunications “Labour Force Survey-SpecialSurvey” and “Labour Force Survey (DetailedTabulation).” Part-time workers numbered 5.61 mil-lion in 1987, increasing thereafter to stand at 11.06million in 2004 (see II-16). In addition, the percent-age of part-time workers among employees, exclud-ing executives, continues to expand with figures
standing at 22.4% in 2004.
Characteristics of Part-time Workers inJapan
Most part-time workers are housewives, but theyare not evenly distributed among all occupationalfields. Looking at the usage of part-time workers byindustry, we see that eating and drinking place, acco-modations account for the great majority, followed byother service-related industries including wholesaleand retail trade, medical health care and welfare, edu-cation and learning support (see II-14). In addition,small to medium size work places are the most preva-lent.
The most often stated reasons for employersemploying part-time workers are “to control wagecosts,” and that they “require additional personnel ona daily or weekly basis” (see II-17). The reasons part-time workers give for choosing part-time employmentare that they “can choose own hours,” and “want todefray educational or household expenses” (see II-18).
2.13 Million Dispatched WorkersDispatched workers are defined by the Manpower
Dispatching Business Act, enacted in 1986, as “work-ers under contract to a dispatching agency, who areentrusted with specific duties by the companies towhich they are assigned.” At first, dispatched workerscould only be used to perform 26 duties that requireda high degree of specialization. However, a revisionmade to the law in 1999 allows dispatched workers toperform any type of work except longshoring, con-struction work, security services, medical care-relatedwork and manufacturing. A revision was also made in2003 which lifted the ban on dispatched workersfrom performing work related to manufacturing andthe limit on the period of dispatch (from one year tothree years).
According to the “Report on Temporary EmploymentAgencies” issued by the Ministry of Health, Labour andWelfare, there were 144,000 dispatched workers in
4 Diversification in Forms of Employment

28 Labor Situation in Japan and Analysis: General Overview 2006/2007
II-14 Proportion of Workers by Form of Employment
Source: Survey of the Diversification of Employment Status, 2003, Ministry of Health, Labour and WelfareNotes: 1) Figures in [ ] are the ratio assuming "non-regular staff" in the industries covered as 100.
2) Figures in ( ) are the ratio in each industry, size of enterprize, and gender (totaling 100).
Total
Industry
Mining
Construction
Manufacturing
Electricity, gas, heat supplyand water
Information and telecom-munications
Transportation
Wholesale and retail trade
Finance, insurance
Real estate
Eating and drinking place,accomodations
Medical health care andwelfare
Education, learning support
Compound services
Services(not elsewhere classified)
Size of Enterprise
1,000 persons and over
500-999
300-499
100-299
50-99
30-49
5 to 29
Gender
Male
Female
(100.0) 100.0 65.4 34.6 2.3 1.4 1.5 2.0 0.8 23.0 3.4
[100.0] [6.8] [4.1] [4.4] [5.6] [2.4] [66.7] [10.0]
( 0.1) 100.0 89.3 10.7 0.4 1.8 1.9 0.4 0.2 3.4 2.5
( 8.0) 100.0 85.6 14.4 1.9 1.6 1.8 1.0 0.8 2.5 4.8
( 22.2) 100.0 76.7 23.3 1.4 1.5 1.7 2.0 0.3 12.7 3.8
( 0.5) 100.0 91.2 8.8 2.2 2.0 1.1 0.8 0.0 1.6 1.1
( 3.1) 100.0 78.3 21.7 3.3 0.8 3.9 5.9 1.1 4.5 2.4
( 6.3) 100.0 77.3 22.7 3.2 2.2 1.5 1.6 0.7 10.8 2.7
( 22.9) 100.0 54.7 45.3 1.4 0.8 0.8 1.4 0.7 37.3 3.0
( 4.0) 100.0 78.3 21.7 2.2 1.6 1.4 8.7 0.0 6.2 1.6
( 0.9) 100.0 64.1 35.9 4.8 5.2 5.0 2.0 0.5 15.5 3.0
( 7.9) 100.0 29.1 70.9 2.0 0.6 0.4 0.5 0.5 62.8 4.1
( 7.3) 100.0 70.2 29.8 2.8 1.3 1.5 0.8 0.2 20.7 2.4
( 2.6) 100.0 60.8 39.2 10.3 1.7 0.4 2.0 0.3 21.7 2.8
( 0.7) 100.0 79.8 20.2 1.9 1.0 0.6 0.7 1.1 7.9 7.0
( 13.4) 100.0 58.7 41.3 3.5 2.3 2.6 2.2 2.8 23.6 4.4
( 5.5) 100.0 81.0 19.0 2.4 0.8 1.8 3.7 0.2 7.4 2.6
( 4.0) 100.0 73.8 26.2 3.4 1.4 2.9 3.9 0.4 11.1 3.1
( 7.5) 100.0 69.1 30.9 2.8 1.6 1.9 2.6 0.2 18.1 3.8
( 13.7) 100.0 68.6 31.4 3.1 1.9 1.5 2.3 0.3 18.5 3.7
( 16.8) 100.0 63.9 36.1 2.5 1.6 2.0 2.6 0.6 23.6 3.1
( 9.0) 100.0 63.4 36.6 2.2 1.5 1.4 1.5 0.7 26.1 3.3
( 43.5) 100.0 62.1 37.9 1.9 1.2 1.2 1.2 1.3 27.5 3.6
( 59.1) 100.0 80.0 20.0 1.9 1.8 2.2 1.0 0.9 9.6 2.6
( 40.9) 100.0 44.4 55.6 2.9 0.9 0.6 8.4 0.8 42.5 4.6
Total Regularstaff
Non-regular
staffContract
employees
Form of Employment
Entrustedemployees
TransferredWorkers
DispatchedWorkers
TemporaryWorkers
Part-timeWorkers Others
(%)
1986, increasing to 2.13 million in FY2002. Manyworkplaces report that their main reason for usingdispatched workers is they “require persons withexperience and expertise,” and “require persons capa-ble of doing specialized work,” although there arealso many who respond that they “need to control
labor costs other than wages,” and “need to adjust hir-ing practices due to changes in business conditions”(see II-17). While it seems that there are workplaceskeen to utilize dispatched workers for their experi-ence and expertise, it is also the case that need dis-patched workers as a form of marginal labor.

29Labor Situation in Japan and Analysis: General Overview 2006/2007
Chapter II The Labor Market
II-15 Changes in the Ratio of Non-regular Staff by Age and Gender
Sources: Labour Force Survey-Special Survey and Labour Force Survey, Ministry of Internal Affairs and Communication. Excerpts from Introductionto the Japanese Economy, edited by K. Asako. and S. Shinohara, Yuhikaku Publishing, 2006. Kurosawa, M., "Labour Economics."
Note: The ratio of non-regular workers is the ratio of part-time, affiliated, dispatched and other workers, excluding executives, engaged in non-agricultural work. Those engaged in educational study are excluded for ages 15-24.
1985 1995 2004
Male
15-24 4.7 9.2 27.1
25-34 3.2 2.9 11.4
35-44 3.1 2.3 6.7
45-54 5.0 2.9 7.5
55-64 19.2 17.4 25.3
65 and older 34.7 48.3 65.2
Female
15-24 8.3 16.3 39.1
25-34 24.3 26.6 40.3
35-44 44.4 48.9 54.9
45-54 37.4 46.8 55.9
55-64 38.1 43.6 60.6
65 and older 45.8 48.6 67.9
(%)
II-16 Changes in the Number of Part-time Workers
Source: Labour Force Survey-Special Survey and Labour Force Survey (Detailed Tabulation), Ministry of Internal Affairs and CommunicationNotes: 1) The figures up to 2001 are based on the Labour Force Survey-Special Survey that was taken every year in February, and from 2002 based
on the Labour Force Survey (Detailed Tabulation) which figures are the average taken between January and March each year.2) Part-time workers refer to all persons who are referred to as "part-timers" or similar phraseology at the workplace, regardless of working
hours or working days.
1987 561 13.9
1988 599 14.5
1989 656 15.4
1990 710 16.3
1991 734 16.2
1992 782 16.8
1993 801 16.9
1994 800 16.8
1995 825 17.3
1996 870 18.0
1997 945 19.0
1998 986 19.9
1999 1,024 20.8
2000 1,078 22.0
2001 1,152 23.0
2002 1,023 20.9
2003 1,092 22.1
2004 1,106 22.4
Part-time Workers
Number (10,000 persons) Proportion to Employees (Excluding executives) (%)

30 Labor Situation in Japan and Analysis: General Overview 2006/2007
II-17 Reasons for HiringNon-regular Staff
II-18 Reasons for Working as aNon-regular Staff
Source: Survey of the Diversification of Employment Status, 2003,Ministry of Health, Labour and Welfare
Source: Survey of the Diversification of Employment Status, 2003,Ministry of Health, Labour and Welfare
10 20 30 40 50 600(%)
Part-time workers
Dispatched workers
Unable to recruit regular staff
Allow regular staffto specialize in
important work
Require personscapable of doingspecialized work
Require persons withexperience and expertise
Need to adjust hiring practices due to changes
in business conditions
Require more workers due to extended
business hours
Require additional personnel on a daily
or weekly basis
Need to meet temporary or seasonal demand
Need to control wage costs
Need to control labor costs other than wages
Wish to reemploy older workers
Substitute for regular staff on childcare
and familycare leave
Others1.7
8.8
1.7
26.6
26.2
14.4
8.0
2.8
26.4
39.6
25.9
17.2
16.9
2.4
2.1
6.4
23.9
55.0
15.4
35.0
20.4
23.4
12.3
10.1
12.8
12.4
10 20 30 40 500(%)
Part-time workers
Dispatched workers
I can put my specialqualifications and
abilities to use
I wanted to earn more money
I couldn't find a permanent position
I am not tied down to the organization
Working hours and working days are short
I can choose my own hours
I want to adjust my working conditions
I want an easy job without much responsibility
I want to defray educational or house
hold expenses
I can strike a good balance between home life and
other activities
Commuting time is short
I don't have the physical strength to work as
a regular staff
Others
I want to earn money I can use freely for myself
4.4
16.7
2.7
15.0
23.5
15.5
6.3
5.0
15.2
14.7
23.1
40.0
15.7
21.1
1.7
28.0
5.6
33.2
25.8
42.3
10.9
12.4
38.8
28.8
7.5
21.6
7.0
9.5
Future Challenges for Non-regular StaffIt is clear that the number of both part-time and
dispatched workers is increasing. Looking at compa-nies’ policies for the future, there is a strong move-ment to combine the use of permanent and non-regu-lar staff to enhance specialization and lower person-nel costs. It is likely therefore that non-regular staffwill continue to increase in the future. In addition, itis worth taking note that the number of young people
working as non-regular staff is expanding consider-ably. Hence the companies that are utilizing thesenon-regular staff are required to further enhance theiremployment management systems through clarifica-tion of working conditions and rearrangement ofemployment regulations, in addition to providingmore social security benefits, and education andtraining opportunities.
32 Labor Situation in Japan and Analysis: General Overview 2006/2007
The Lifetime EmploymentJapanese companies, centered on large corpora-
tions, have few people who change jobs and a highpercentage of employees who work at the same com-pany for long periods of time. The long-term employ-ment system of these companies is referred to as thelifetime employment system. The lifetime employ-ment system is an employment practice where compa-nies hire a specific number of new graduates at fixedtimes every year, and under contracts without a fixedperiod of employment, employees continue to beemployed at the same company or affiliated compa-nies from the time that they are hired as new graduatesto the time they retire, as long as there are no extraor-dinary circumstances such as a management crisis.
Under long-term stable employment practices,employees are trained through in-company capacitydevelopment and reassignments as well as loaning ofpersonnel to affiliated companies. Until the time thatthey retire, they are subject to a personnel system inwhich promotions and wage increases are based onseniority. Since human resources who have beentrained for a long period of time within the samecompany without changing jobs build up skills andknow-how in the organization, the strength of thistype of human resources training system is mostobvious in manufacturing industries in which a con-tinuous accumulation of product development andimprovement is necessary.
Chapter III Human ResourceManagement
1 The Long-Term Employment System
III-1 Attitudes of Companies Towards Lifetime Employment
Source: Survey on Corporate Human Resource Strategies and Workers’ Attitude Towards Work, (Company Survey) (2003), The Japan Institute ofLabour
Will basically maintain the practice (36.1%)
Partial adjustment is inevitable (40.0%)
Do not have lifetime employment practice (5.2%)
Fundamental review is necessary (15.3%)
Unknown/No response (3.3%)
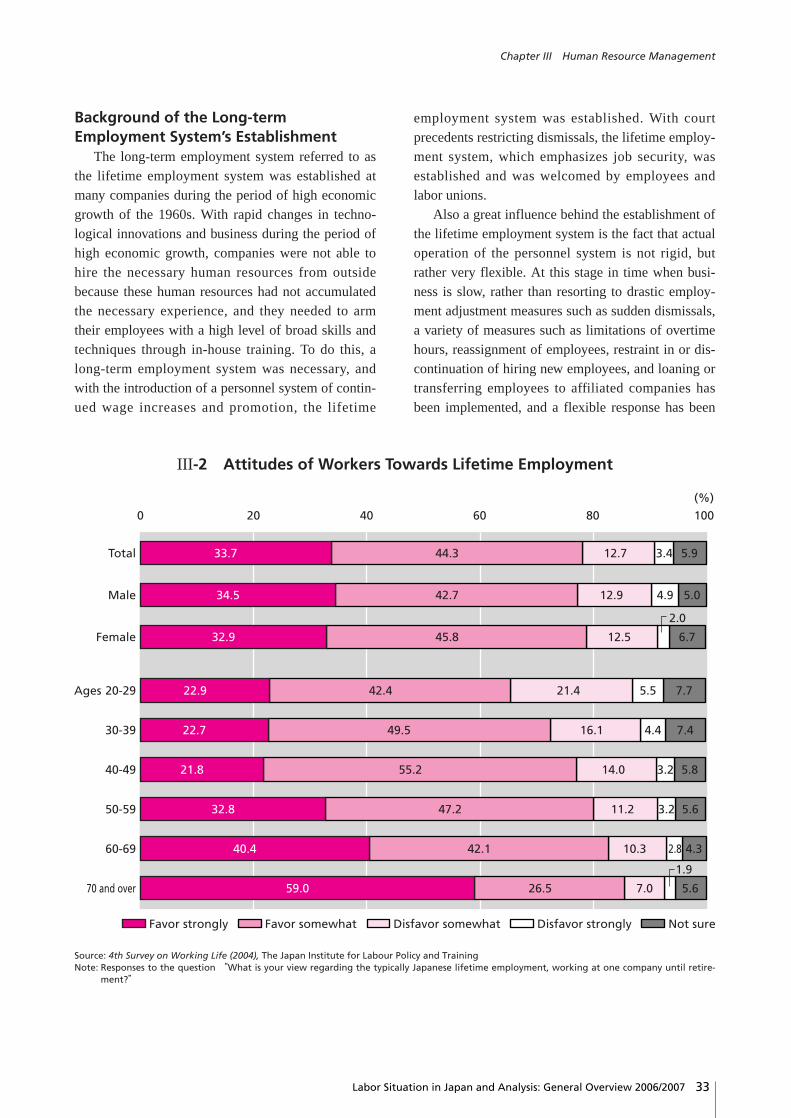
33Labor Situation in Japan and Analysis: General Overview 2006/2007
Chapter III Human Resource Management
Background of the Long-termEmployment System’s Establishment
The long-term employment system referred to asthe lifetime employment system was established atmany companies during the period of high economicgrowth of the 1960s. With rapid changes in techno-logical innovations and business during the period ofhigh economic growth, companies were not able tohire the necessary human resources from outsidebecause these human resources had not accumulatedthe necessary experience, and they needed to armtheir employees with a high level of broad skills andtechniques through in-house training. To do this, along-term employment system was necessary, andwith the introduction of a personnel system of contin-ued wage increases and promotion, the lifetime
employment system was established. With courtprecedents restricting dismissals, the lifetime employ-ment system, which emphasizes job security, wasestablished and was welcomed by employees andlabor unions.
Also a great influence behind the establishment ofthe lifetime employment system is the fact that actualoperation of the personnel system is not rigid, butrather very flexible. At this stage in time when busi-ness is slow, rather than resorting to drastic employ-ment adjustment measures such as sudden dismissals,a variety of measures such as limitations of overtimehours, reassignment of employees, restraint in or dis-continuation of hiring new employees, and loaning ortransferring employees to affiliated companies hasbeen implemented, and a flexible response has been
III-2 Attitudes of Workers Towards Lifetime Employment
Source: 4th Survey on Working Life (2004), The Japan Institute for Labour Policy and TrainingNote: Responses to the question “What is your view regarding the typically Japanese lifetime employment, working at one company until retire-
ment?”
0 20 40 60 80 100
(%)
Female
Male
Total
Ages 20-29
30-39
40-49
50-59
60-69
70 and over
33.7
34.5
32.9
22.9
22.7
21.8
32.8
40.4
59.0
44.3
42.7
45.8
42.4
49.5
55.2
47.2
42.1
26.5
12.7
12.9
12.5
21.4
16.1
14.0
11.2
10.3
7.0
3.4
4.9
2.0
5.5
4.4
3.2
3.2
2.8
1.9
5.9
5.0
6.7
7.7
7.4
5.8
5.6
4.3
5.6
Favor strongly Favor somewhat Disfavor somewhat Disfavor strongly Not sure

34 Labor Situation in Japan and Analysis: General Overview 2006/2007
undertaken in which major changes to the workplaceand content of work have been taken into account.
The percentage of lifetime employment workerswho continued to work at the same company from thetime they were new graduates to the time they retiredis about 20% and not that high. In small and medium-sized companies, the number of continuing workerslargely drop across the ranks of young and middle-aged employees for reasons such as resignation forpersonal reasons, company bankruptcy or businessclosings. At large companies, a major factor is theloaning and transferring of middle-aged employeescentered on management-level and white-collaremployees to affiliated companies or partner compa-nies.
Argument over Reform of the LifetimeEmployment System
Influenced by the long-term recession that has
continued since 1990, increases in the cost of labor asemployees get older and a rise in the number ofemployees who cannot adjust to rapidly developingnew technologies typified by information technology(IT), debate has recently begun over reform that theemployment practices such as the lifetime employ-ment system and seniority-based wage system shouldbe reviewed. Looking at the circumstances of compa-nies, they are consecutively carrying out reformsregarding seniority-based wages, but not that manycompanies are implementing major reviews of theirlifetime employment systems and changing to fluidemployment practices. There is instead an increasingtrend for companies to restrict the number of regularstaffs that are subject to lifetime employment and toincrease the number of non-regular staffs such aspart-time workers for whom making employmentadjustments is relatively easy.

35Labor Situation in Japan and Analysis: General Overview 2006/2007
Chapter III Human Resource Management
Because Japan’s labor market is divided into anew graduate market and a mid-career job seekermarket, or into large enterprises and small businesses,there are accordingly great differences in recruitingand hiring. The collective hiring of a group of newcollege graduates immediately upon graduation is oneof the characteristics of hiring activities in Japan.However, looking at Table III-3, we see that it is ingreat part the large enterprises hiring new graduates,and that as the size of the company decreases, the rateof hiring new graduates also decreases. On the otherhand, for mid-career hires, this difference based oncompany size is not as large as with the new gradu-ates; in particular, the rate of hiring mid-career work-ers in nonclerical positions is higher at small-scalebusinesses (see III-4).
Methods of Recruiting and HiringTable III-5 shows the general methods of recruit-
ing and hiring. For recruiting college graduates,methods such as “job-search magazine or job searchwebsite,” “introduction or recommendation by pro-fessors, etc at college,” “company, etc. hosts a job fairor seminar” are widely used. On the other hand, formid-career hires the most common methods are “pub-lic employment security office, etc.,” “Help Wanted’advertisement or flier in the newspaper,” and “job-search magazine or job search website” (see III-5;survey conducted in 2004).
Compared to the same survey conducted threeyears ago, one notices that methods of recruiting andhiring have drastically changed. “Job-search maga-zine or job search website” became first and third,respectively, for new college graduates and mid-career hires. “Independent company website” camefourth for mid-career hires, and methods involvingthe internet are increasing. On the other hand, “per-sonal connections” (22.9%) which was third in mid-
2 Recruiting and Hiring
III-3 Current Ratio of Hiring for New Graduates (multiple answers)
Source: Survey of Employment Management, 2001, 2004, Ministry of Health, Labour and WelfareNote: The 2004 survey was not categorized into clerical, technical/research, and non-clerical job types.
Clerical
2001
Technical, Research Non-clerical2004
High school graduates
Total of all companies 4.7 2.8 12.9 16.7
5,000 or more employees 27.1 10.9 42.4 44.3
1,000-4,999 employees 14.4 6.3 31.9 37.9
300-999 employees 11.8 4.7 31.0 33.6
100-299 employees 7.0 4.6 22.3 21.1
30-99 employees 3.0 2.0 7.8 13.1
College (including graduate school) graduates
Total of all companies 7.9 9.2 7.0 19.6
5,000 or more employees 76.2 56.8 27.4 94.1
1,000-4,999 employees 57.5 46.0 28.5 81.2
300-999 employees 33.5 36.9 22.4 64.3
100-299 employees 13.1 17.0 11.6 33.8
30-99 employees 2.5 3.2 3.6 9.0
(%)

36 Labor Situation in Japan and Analysis: General Overview 2006/2007
career hires three years ago has dropped to fifth(6.1%) in this survey (see III-5; survey conducted in2001).
The hiring of four-year university graduates in thehumanities and social sciences is generally carriedout in the following way. First, the hiring processstarts with a request for material from the company.
This usually begins during the junior year. The com-pany will then hold a seminar or information sessionfor the students who looked at the company materi-als, and proceed on to the written exam and interviewstages. Ordinarily, conditional job offers are decidedupon after two or three interviews. While the start ofthe communication of these conditional job offers in
Source: Survey of Employment Management, 2004, Ministry of Health, Labour and Welfare
Management Clerical Technical, Research Non-clerical
Total of all companies 13.7 27.5 18.4 50.8
5,000 or more employees 34.9 54.8 51.9 38.4
1,000-4,999 employees 26.5 44.9 38.6 42.4
300-999 employees 23.8 43.6 31.3 48.7
100-299 employees 15.6 34.5 20.0 49.3
30-99 employees 11.7 23.2 15.9 51.7
(%)
III-5 Methods of Recruiting New College Graduates and Mid-career Hires-2004, 2001(multiple answers)
Source: Survey of Employment Management, 2001, 2004, Ministry of Health, Labour and Welfare
College (includinggraduate school)
graduates
Mid-career hires
Introduction orrecommendationby teachers, etc.
at school38.4%
Company, etc.hosts a job fair
or seminar 32.9%
Job search maga-zine or job
search website 29.8%
Independent company website
23.7%
PublicEmployment
Security Office,etc.
18.6%
PublicEmployment
SecurityOffice, etc.
59.6%
”Help Wanted”advertisementor flier in thenewspaper
31.3%
Personal connections
22.9%
Others22.3%
Job search magazine or jobsearch website
18.1%
First Second Third Forth Fifth
(%)2001
College (includinggraduate school)
graduates
Mid-career hires
Job search maga-zine or job
search website 38.2%
Introduction orrecommendationby teachers, etc.
at school33.9%
Company, etc.hosts a job fair
or seminar 32.4%
PublicEmployment
Security Office,etc.
25.2%
Public EmploymentSecurity Office, etc.hosts a job fair or
seminar16.0%
PublicEmployment
SecurityOffice, etc.
64.9%
”Help Wanted”advertisementor flier in thenewspaper
33.3%
Job search maga-zine or job
search website 30.0%
Independent company website
16.2%
Personal connections
6.1%
First Second Third Forth Fifth
(%)2004
III-4 Current Ratio of Hiring for Mid-career Workers (multiple answers)

37Labor Situation in Japan and Analysis: General Overview 2006/2007
Chapter III Human Resource Management
1997 and 1998 peaked during June and July, itpeaked around April in 2004, indicating that the timewas reduced by two months in those years (“Hiringof College Graduates and Human ResourceManagement in a Period of Reform,” Report No. 128,2000, Japan Institute of Labour; “Survey on HiringUniversity Graduates,” 2006, Japan Institute forLabour Policy and Training). As seen in Table III-5,many of the request for materials and application pro-cedures for seminars are made through E-mails orwebsites due to the dissemination of the internet, andprivate-sector portal sites built to support such activi-ties are widely used.
The hiring of graduates of four-year universitiesin the natural and physical sciences generally oftentakes the form of either an introduction and recom-mendation by the student’s academic advisor, or arequest to the advisor from the company for introduc-tion of a student. Furthermore, there are many stu-dents of natural and physical sciences who find jobsafter pursuing a postgraduate degree.
Most of the methods used for recruiting are thosethat have been long used such as individual inter-views, tests on general common knowledge/basicacademic and aptitudes, etc. Among them individual
interviews reaches 90%. Occasions of making thestudents give “presentations” which are sometimestalked about, are still very few (see III-6).
The number of government and public offices aswell as companies carrying out internship programshas been growing steadily, and the number of stu-dents who work at companies through internshipsduring the summer vacation of their junior year, etc.are increasing. The number of students who havedone internships have increased from approximately30,000 to 50,000 in the past two years. (“Survey onInternships at Universities (2002),” Ministry ofEducation, Culture, Sports, Science and Technology,November 2003; “Survey on Internships atUniversities (2004),” Ministry of Education, Culture,Sports, Science and Technology, November 2005).
Points Taken Seriously in Hiring WorkersTable III-7 looks at the points considered impor-
tant when hiring new college graduates. In the 2004survey, where job types were not divided into clerical,technical/research, and non-clerical categories,“enthusiasm and ambition,” “communication skills,”and “drive and executive ability” respectively came asfirst, second, and third priorities. In the 2001 survey
III-6 Methods of Screening New College Graduates (multiple answers)
Individual interview
0.1
3.1
3.3
4.7
12.4
22.5
27.4
42.0
50.6
58.7
90.8
0 10 20 30 40 50 60 70 80 90 100 (%)
No response
Groupwork/ collaborative work
Others
Presentation
Subjects and skills in specialized area
Application sheet
Group interview
Essay/ composition writing
Aptitudes
General common knowledge/ basic
academic proficiency
Source: Survey of Employment Management, 2004, Ministry of Health, Labour and Welfare

38 Labor Situation in Japan and Analysis: General Overview 2006/2007
where job types were divided, for each of the threejob categories-clerical, technical/research, and non-clerical-the number one consideration was “enthusi-asm and ambition.” However, large differences couldbe seen in the number two and number three choices.For clerical positions, importance is attached to “gen-eral common knowledge, well educated and cultured”and “cooperative spirit and sense of balance; ” “tech-nical knowledge and skills” and “understanding andjudgment” are seen as crucial for technical/researchpositions; and for non-clerical work “drive and exec-
utive ability” and “good health and stamina” areviewed as assets.
Looking at points considered important when hir-ing mid-career workers (points with a rate over 50%in III-8), “job experience” is the top consideration forboth management and clerical categories while “tech-nical knowledge and skills” and “job experience”rank high for technical/research positions, and“enthusiasm and ambition” is the most desired attrib-utes for non-clerical workers.
III-7 Points Considered Important when Hiring Recent College Graduates(up to 3 multiple answers)
Source: Survey of Employment Management, 2001,2004, Ministry of Health, Labour and WelfareNote: The 2004 survey was not categorized into clerical, technical/research, and non-clerical job types.
ClericalEnthusiasm,
Ambition74.0%
General commonknowledge,
Well educatedand cultured
39.5%
Cooperative spirit,Sense of balance
39.2%
Drive, Executiveability32.8%
Understanding,Judgement
31.8%
Technical, ResearchEnthusiasm,
Ambition66.7%
Technical knowl-edge, skills
51.1%
Understanding,Judgment
33.6%e39.2%
Drive, Executiveability29.6%
Cooperative spirit,Sense of balance
20.4%
Non-ClericalEnthusiasm,
Ambition76.5%
Drive, Executiveability46.6%
Good health,Stamina38.3%
General commonknowledge,
Well educatedand cultured
35.4%
Cooperative spirit,Sense of balance
29.2%
First Second Third Forth Fifth
(%)2001
2004Enthusiasm,Ambitiion
64.0%
Communicationskills
35.1%
Drive, Executiveability31.0%
Cooperative spirit,Sense of balance
30.9%
Understanding,Judgement
25.9%
First Second Third Forth Fifth
(%)2004

39Labor Situation in Japan and Analysis: General Overview 2006/2007
Chapter III Human Resource Management
III-8 Points Considered Important when Hiring Mid-career Workers(up to 3 multiple answers)
Source: Survey of Employment Management, 2004, Ministry of Health, Labour and Welfare
ManagementJob experience
57.7%
Technical knowledge, skills
48.3%
Enthusiasm,Ambitiion
30.9%
Drive, Executiveability29.7%
Understanding,Judgement
20.0%
ClericalJob experience
52.7%
Enthusiasm,Ambition
41.5%
General commonknowledge,
Well educatedand cultured
33.6%
Cooperative spirit,Sense of balance
28.3%
Technical knowl-edge, skills
25.9%
Technical, ResearchTechnical knowl-
edge, skills68.9%
Job experience58.1%
Enthusiasm,Ambition
36.1%
Drive, Executive ability
16.6%
Good health,Stamina15.7%
Non-ClericalEnthusiasm,
Ambition58.8%
Good health,Stamina47.3%
Job experience38.3%
Drive, Executive ability
26.0%
Cooperative spirit,Sense of balance
23.1%
First Second Third Forth Fifth
(%)

40 Labor Situation in Japan and Analysis: General Overview 2006/2007
The Changing Recruitment SystemJapanese companies have come to place great
importance on the regular hire of recent graduateswhen hiring new employees. Behind this practice isthe human resource management policy that, underthe long-term employment system, in-house trainingof workers having a high level of broad skills andtechniques is best suited for business development.Managers are also strongly influenced by the philoso-phy that new graduates who are trained inhouse aremore likely to fit into the corporate culture.
However, the employers capable of such regularhiring of recent graduates are the large and mid-tiercorporations. Many recent graduates have a strongtendency to seek employment at these large and influ-ential mid-sized companies, where the possibility ofsomething like bankruptcy is low, management is sta-ble, and wages and other working conditions are rela-tively high. Therefore, small and medium-sized com-panies have considerable difficulty in regularly hiringnew graduates and so-compared with large and influ-ential mid-sized companies-are increasingly lookingto workers in midcareer. Naturally, with the recent ITboom and other rapid developments in technical inno-vation, large enterprises too are unable to prepare thenecessary human resources through in-house training,and are quickly coming to strengthen this trend ofhiring mid-career experienced workers.
Human Resource Development andPromotion by Broad Rotation
New graduates are typically trained by experienc-ing different types of work in several departmentswithin a company or corporate group. Most high-school graduates are posted to factories or other non-clerical departments where they gain experience in avariety of related functions and they become moreversatile workers. University graduates experience abroad variety of departments and functions, whichmay even include being loaned to a group company;through such broad rotation, companies can evaluateemployees’ performance and determine the type ofwork for which they are best suited (see III-9). Thiskind of broad rotation is being carried out actively bymajor companies, etc. (see III-10).
In addition, these assignments and transfers arecarried out in conjunction with the management ofpromotions (see III-11).
The promotion management of Japanese compa-nies is known as the seniority-based promotion sys-tem in which promotions are granted based on theorder in which employees entered the company. It isnot as mechanical as it seems since it allows for care-ful evaluation over time of an employee’s abilitiesand achievements, and encourages long-term compe-tition for promotion among employees. The recenttrend toward earlier promotions is prompting an
3 Assignments and Transfers
III-9 Method to Secure Desired Human Resources/Capacities
Sources: Industrial Labour Survey, 2002, Ministry of Health, Labour and Welfare
Enterprises,totalSize of enterprise, industry
Respond byreassigning
personnel, etc.
Strengtheningcapacity devel-
opment ofemployees
Respond by hiring newgraduates
Respond by hiring
mid-careerworkers
Industries Surveyed, total 100.0 29.7 60.2 17.9 52.1
1,000 employees and over 100.0 39.7 69.7 38.9 37.7
100-999 employees 100.0 35.7 64.1 26.0 50.0
30-99 employees 100.0 27.3 58.5 14.4 53.3
(multiple answers up to two, %)

41Labor Situation in Japan and Analysis: General Overview 2006/2007
Chapter III Human Resource Management
increasing number of companies to adopt a rapidadvancement system.
More companies, especially large companies, arenow introducing procedures that give serious consid-eration to employees’ wishes when making assign-ments or transfers in connection with the long-term
human resource training system. For instance, in thedouble-track personnel system, an additional coursefor the training of specialists in a particular field isbeing added to the management track that formed theheart of the old personnel system (see III-12). Thesystem of in-house solicitation of applicants enables
III-10 Ratio of Companies That Did/Did Not Reassign Employees
Sources: Survey on Employment Management, 2002, Ministry of Health, Labour and Welfare
All industriesSize of enterprise, industry
Total
Have reassigned employees (multiple answers)
Clerical work
Technicaland
researchwork
Field work
Have not reas-signed
employees
Total 100.0 47.5 28.3 19.2 35.1 52.5
1) 5,000 employees 100.0 99.1 95.9 61.7 84.3 0.9
2) 1,000-4,999 employees 100.0 95.3 88.7 57.4 77.7 4.7
3) 300-999 employees 100.0 89.2 73.4 49.0 71.6 10.8
4) 100-299 employees 100.0 68.1 45.6 28.7 51.0 31.9
5) 30-99 employees 100.0 36.0 17.0 12.3 25.7 64.0
(%)
III-11 Reasons for Transferring Employees
Clerical
Technical/Research
Field work
Companies that have transferred employees=100
Establish newdepartments
Accommodateemployee preferences
Expand or contractdepartments
Place employeesaccording totheir ability
Improve performanceby enabling employees
to experience avariety of duties
Restructureresponsibilities
41.440.1
35.5
32.235.0
32.8
42.440.7
45.8
32.132.834.1
15.716.418.7
14.014.3
10.0
0
10
20
30
40
50(%)
Source: Survey on Employment Management, 2002, Ministry of Health, Labour and WelfareNote: Respondents were permitted to provide up to three answers

42 Labor Situation in Japan and Analysis: General Overview 2006/2007
companies to recruit from within the personnel theyneed with a new demand accompanying businessexpansions and new ventures, and allows for theselection of the most appropriate candidate from theemployees who applied (see III-12).
Assignment, Transfer, and EmployeeMotivation
Assigning and transferring employees by the in-house solicitation of applicants differs from the exist-ing system in its consideration of employees’ wishes,rather than solely on company needs. From the com-
III-12 Ratio of Companies by Implementation Status of Various PersonnelManagement Systems and by Future Plans
(Multiple-track personnel management system)
(In-house open recruitment system)
Size of enterprise
0
10
20
30
40
50(%)
Companies that have implemented
30-99employees
100-299employees
300-999employees
1,000-4,999employees
5,000 employees and over
Size of enterprise
5,000 employees and over
1,000-4,999employees
300-999employees
100-299employees
30-99employees
0
10
20
30
40
50
60
Companies that have implemented
(%)
Source: Survey on Employment Management, 2002, Ministry of Health, Labour and Welfare

43Labor Situation in Japan and Analysis: General Overview 2006/2007
Chapter III Human Resource Management
pany point of view, this system makes it easier tounearth hidden human resources, at the same timehaving the merit of serving as a motivational measurefor employees. Because an increasing number ofcompanies is using the Intranet to implement in-house recruitment systems emphasizing employeeinitiative, the number of recruitment opportunitiesand transfers is also rising. The number of companies
introducing in-house venture systems that provideopportunities for establishing new businesses basedon plans proposed by their employees is also rising.
In addition to traditional company-initiated careerdevelopment, independent career development atten-tive to employees’ wishes is also becoming firmlyestablished.

44 Labor Situation in Japan and Analysis: General Overview 2006/2007
Seniority-based Wage SystemWage systems that base remuneration on age or
years of service are not unique to Japan, but it is saidthat these are characteristic of Japanese wage sys-tems. This type of wage system is called a seniority-based wage system; but salary increases are notawarded based on age or years of service with totaldisregard of performance and ability. A merit ratingis used to evaluate employees resulting in wage levelsthat reflect differences in performance or ability, evenamong employees with the same seniority.
The seniority-based wage system first appeared inJapan in the 1920s. Although considerable debateabounds regarding the reasons for its establishment,the seniority-based wage system was certainly astrategic move on the part of management who want-ed to attract and retain employees. By staying at onefirm, workers acquired skill with their employers’proprietary technology. Employers, in turn, used pro-motions to reward workers for their skill develop-ment. Additionally, the tendency of the cost of livingto increase as employees aged further justified link-
ing wages to seniority. Thus, promotions followingskill improvement and increases in cost of livingwere connected to longer years of service, and theseniority-based wage system was established to raisewages with advancing age and years of service.
The wage profile by age (and by years of service)charts the status of seniority-based wages by plottingwages for different age groups (and years of service).One characteristic of the Japanese wage profile is thephenomenon called “the white-collarization of bluecollar workers” (however, this only applies to maleworkers). The phenomenon of the white-collar work-ers’ wage profile rising with age is observable notonly in Japan, but in Europe and the U.S. as well.However, the situation for blue-collar workers iscompletely different. In other nations, the wages ofblue-collar workers rise a little with age, but thesewage increases are all but invisible after age 30. InJapan, however, even though the wage profile forblue-collar workers does not rise as sharply as that ofwhite-collar workers, the two curves are similarlyshaped, indicating that wages increase as workers age
4 Wages
III-13 Wage Profile by Age and Gender
Source: Basic Survey on Wage Structure, 2004, Ministry of Health, Labour and WelfareNote: Monthly scheduled earnings are used for wages Manufacturing only.
(¥10,000)
0
10
18-19 20-24 25-29 30-34 35-39 40-44 45-49 50-54 55-59 60-64
20
30
40
50
60
Age group
White-collar workers (male)Blue-collar workers (male)

45Labor Situation in Japan and Analysis: General Overview 2006/2007
Chapter III Human Resource Management
(see III-13).
Bonus SystemAnother distinctive aspect of the Japanese wage
system is the bonus system. Japan is certainly not theonly nation in which bonuses are paid, but the pecu-liarity of Japan’s bonuses is said to be in their largesize. Companies pay biannual bonuses equivalent toseveral months’ salary in the summer and winter.They are not legally required to do so, but after WorldWar II the practice of providing bonuses to allemployees became customary at most companies.
Performance-related SalariesAnother aspect of Japan’s Performance-related
Salaries come to the fore recently is the introductionof a annual salary system linked to performance.With the heightening of competition due to globaliza-tion and predictions of the further aging of Japanesesociety, companies have become concerned about theburden imposed by the high salaries paid to the grow-ing ranks of middle-aged and older employees. Tocreate a better balance between those employees’salaries and their productivity, and to further motivateworkers, an increasing number of companies-mainlylarge corporations-are adopting a salary system basedon annual performance for managers. However, it isnot easy to evaluate performance, and companies willneed to set fair evaluation standards before perfor-mance-based wage systems can be implemented andutilized as measures to improve efficiency.
Wage CompositionIncidentally, the wage composition is another
unique element in Japan’s wage system. The wagecomposition refers to a series of wage items thatcomposes the total salary paid to a worker. Normally,the wage composition consists of base pay (compen-sation for labor) plus various additional allowances,such as a family allowance, commuting allowance,and housing allowance. The term “wage composi-tion” became popular after its coinage under the
Wage Control Ordinance during World War II. The“electrical power industry type of wage composition”acquired by the Council for Electric Power IndustryUnions in 1946 opposed the pre-war wage patternbased on management’s internal class system. TheCouncil forced management to adopt a unified payscale for white collar and blue collar workers. This iswell-known as a wage composition based on factorssuch as workers’ living conditions (age, years of con-tinuous employment, family structure and commutingdistance), and served as the foundation for dissemina-tion of subsequent wage compositions.
Retirement Benefits SystemFinally, mention will be made of the retirement
benefits system, which provides to employees either alumpsum allowance upon retirement or pension, andis a major pillar of enterprise welfare measures.Retirement benefits are paid in proportion to thenumber of years of service at a specific company, butthe scheme is such that differences in the paymentamount arise depending on the reason for retirement.The amount paid is lower for those who retire fortheir own convenience, but higher for those whoretire at the mandatory age after long service, or forthose who retire at the companies request (such asduring a period of recession). Thus, retirement bene-fits have become a factor promoting long-term con-tinuous service by Japanese employees. Until recent-ly, the lump sum retirement allowance has been alarge amount, and many workers have received thissubstantial benefit when retiring at the mandatoryage. However, in recent years the percentage of work-ers receiving a retirement pension has been rising.Behind this development is the fact that the cost bur-den for companies has increased as the aging ofemployees leads to larger payments of lump sumretirement allowances. Added to that are the benefitsof converting retirement benefits to a pension system,such as the advantages a company may receivethrough tax codes.
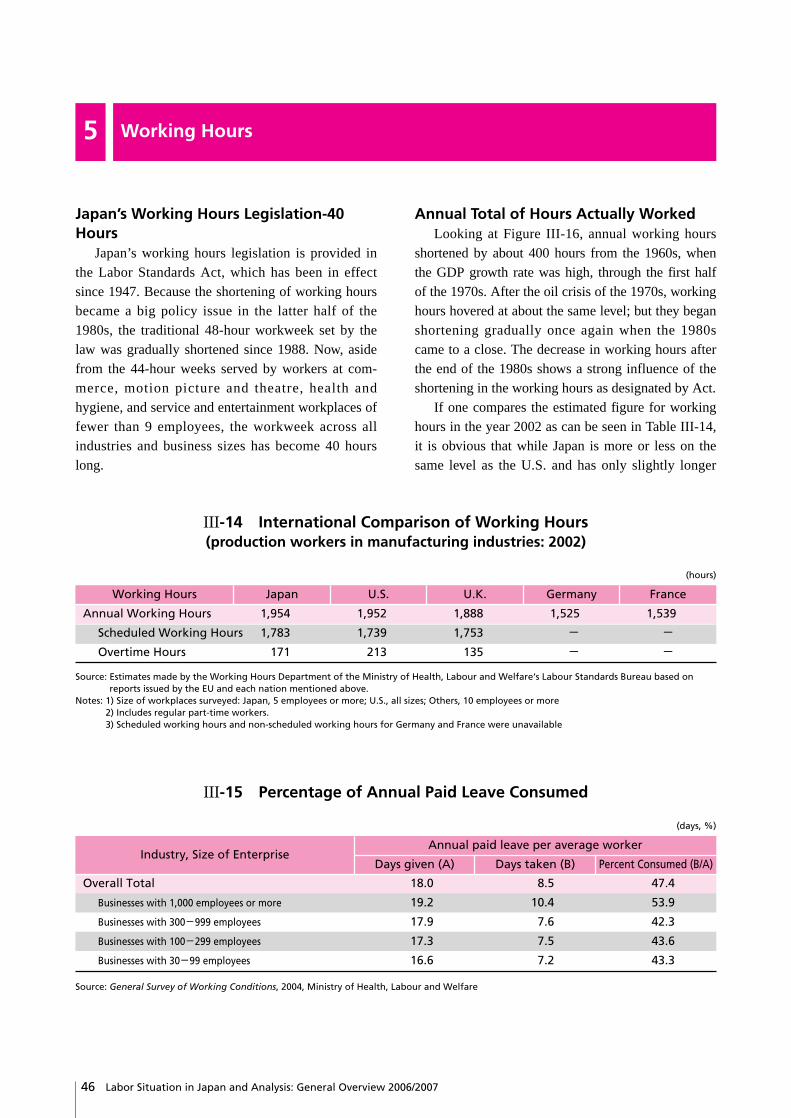
46 Labor Situation in Japan and Analysis: General Overview 2006/2007
III-14 International Comparison of Working Hours(production workers in manufacturing industries: 2002)
Source: Estimates made by the Working Hours Department of the Ministry of Health, Labour and Welfare‘s Labour Standards Bureau based onreports issued by the EU and each nation mentioned above.
Notes: 1) Size of workplaces surveyed: Japan, 5 employees or more; U.S., all sizes; Others, 10 employees or more2) Includes regular part-time workers.3) Scheduled working hours and non-scheduled working hours for Germany and France were unavailable
Working Hours Japan
Annual Working Hours 1,954 1,952 1,888 1,525 1,539
Scheduled Working Hours 1,783 1,739 1,753 - -
Overtime Hours 171 213 135 - -
(hours)
U.S. U.K. Germany France
III-15 Percentage of Annual Paid Leave Consumed
Source: General Survey of Working Conditions, 2004, Ministry of Health, Labour and Welfare
Industry, Size of EnterpriseAnnual paid leave per average worker
(days, %)
Days given (A) Days taken (B) Percent Consumed (B/A)
Overall Total 18.0 8.5 47.4
Businesses with 1,000 employees or more 19.2 10.4 53.9
Businesses with 300-999 employees 17.9 7.6 42.3
Businesses with 100-299 employees 17.3 7.5 43.6
Businesses with 30-99 employees 16.6 7.2 43.3
Japan’s Working Hours Legislation-40Hours
Japan’s working hours legislation is provided inthe Labor Standards Act, which has been in effectsince 1947. Because the shortening of working hoursbecame a big policy issue in the latter half of the1980s, the traditional 48-hour workweek set by thelaw was gradually shortened since 1988. Now, asidefrom the 44-hour weeks served by workers at com-merce, motion picture and theatre, health andhygiene, and service and entertainment workplaces offewer than 9 employees, the workweek across allindustries and business sizes has become 40 hourslong.
Annual Total of Hours Actually WorkedLooking at Figure III-16, annual working hours
shortened by about 400 hours from the 1960s, whenthe GDP growth rate was high, through the first halfof the 1970s. After the oil crisis of the 1970s, workinghours hovered at about the same level; but they beganshortening gradually once again when the 1980scame to a close. The decrease in working hours afterthe end of the 1980s shows a strong influence of theshortening in the working hours as designated by Act.
If one compares the estimated figure for workinghours in the year 2002 as can be seen in Table III-14,it is obvious that while Japan is more or less on thesame level as the U.S. and has only slightly longer
5 Working Hours

47Labor Situation in Japan and Analysis: General Overview 2006/2007
Chapter III Human Resource Management
working hours than the U.K., it exceeds the numberof working hours of Germany and France by as muchas 400 hours. This difference between Japan,Germany and France mainly reflects differences innon-scheduled working hours and the number ofannual paid leaves taken.
Annual Non-scheduled Hours WorkedFigure III-17 shows quarterly fluctuations in over-
time hours. An increase or decrease in the non-sched-uled hours worked in Japan occurs slightly later thanthe actual fluctuations in the economy. This is due tothe fact that overtime work is leveraged by companiesas the principle means to make employment adjust-ments in response to fluctuations in productiondemand. That is, rather than taking on new hires dur-ing times of prosperity, overtime hours for existingemployees are increased; on the other hand, withoutimmediately resorting to measures such as layoffswhen business is slow, the condition is dealt withthrough a reduction in overtime hours. Behind this isthe fact that the cost of overtime allowances for exist-
ing employees is generally less than labor costs relat-ed to hiring additional employees. Non-scheduledworking hours thus constantly exist in a large numberof Japanese companies. At present, an annual maxi-mum of 360 overtime hours per worker is prescribedby the Labor Standards Act; within this range, upperlimits are set for fixed periods, such as 15 hours perweek, 45 hours per month, and 120 hours per 3-month period. However, there is no penalty for violat-ing these standards. Moreover, overtime rate for non-scheduled hours worked is 25% or higher for normalcircumstances, 25% or higher for late-night work,and 35% or higher for non-scheduled work that isconducted on a non-business day.
Annual Paid LeaveFigure III-16 examines the number of days of
annual paid leave given and taken, and, with those fig-ures as denominator and numerator, the percentage ofholidays taken. According to the Labor Standards Act,10 days leave shall be granted to those workers with an80% or greater attendance rate and at least 6 months of
III-16 Long-Term Movements in the Average Annual
Source: Monthly Survey of Labour Statistics, Ministry of Health, Labour and WelfareNotes: The study is based on responses from businesses employing 30 or more employees. Results indicate 12 times the figure for average monthly
hours per worker from the all industries total. Decimal figures have been rounded off. The study includes general as well as part-time work-ers.
(Hours)
2,500
2,400
2,300
2,200
2,100
2,000
1,900
1,800
1,7001955 1960 1965 1970 1975 1980 1985 1990 1995 20042002
Annual Working Hours
Scheduled Working Hours
2,1402,170
2,117
2,039
1,937 1,946 1,932
1,866
1,772
1.691
2,3382,432
2,315
2,239
2,064 2,108 2,1102,052
1,909
1,840
1,700
1,837
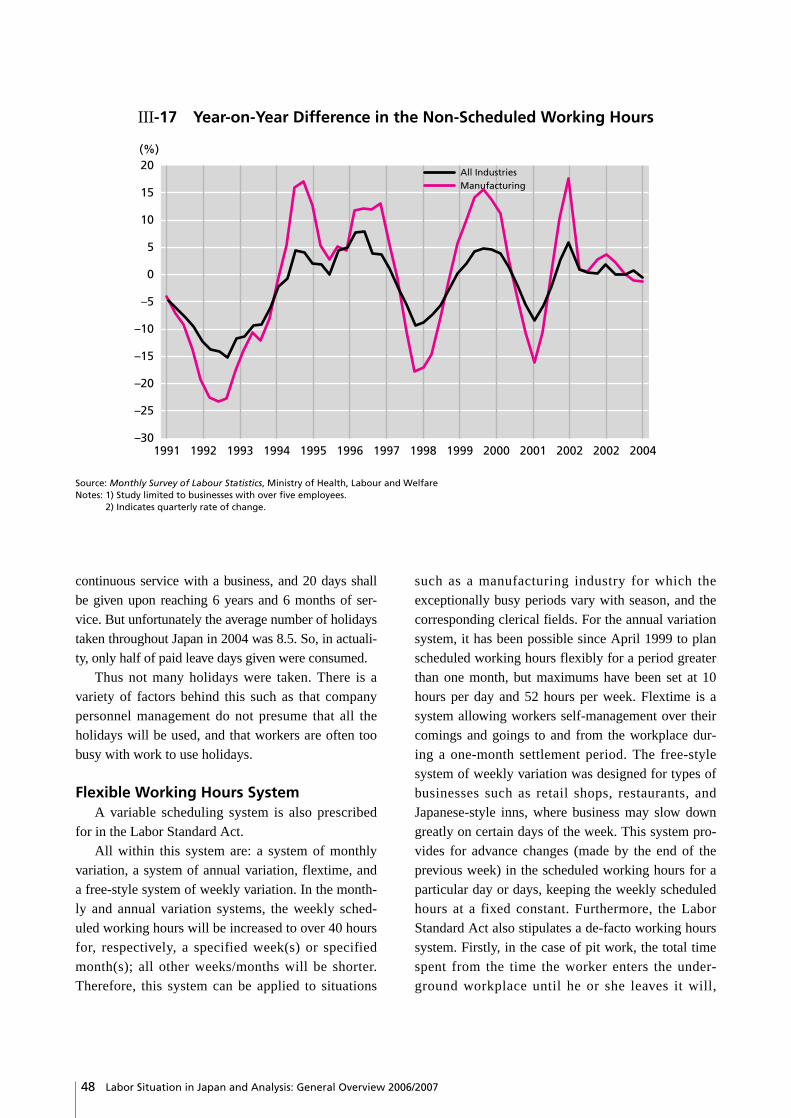
48 Labor Situation in Japan and Analysis: General Overview 2006/2007
continuous service with a business, and 20 days shallbe given upon reaching 6 years and 6 months of ser-vice. But unfortunately the average number of holidaystaken throughout Japan in 2004 was 8.5. So, in actuali-ty, only half of paid leave days given were consumed.
Thus not many holidays were taken. There is avariety of factors behind this such as that companypersonnel management do not presume that all theholidays will be used, and that workers are often toobusy with work to use holidays.
Flexible Working Hours SystemA variable scheduling system is also prescribed
for in the Labor Standard Act.All within this system are: a system of monthly
variation, a system of annual variation, flextime, anda free-style system of weekly variation. In the month-ly and annual variation systems, the weekly sched-uled working hours will be increased to over 40 hoursfor, respectively, a specified week(s) or specifiedmonth(s); all other weeks/months will be shorter.Therefore, this system can be applied to situations
such as a manufacturing industry for which theexceptionally busy periods vary with season, and thecorresponding clerical fields. For the annual variationsystem, it has been possible since April 1999 to planscheduled working hours flexibly for a period greaterthan one month, but maximums have been set at 10hours per day and 52 hours per week. Flextime is asystem allowing workers self-management over theircomings and goings to and from the workplace dur-ing a one-month settlement period. The free-stylesystem of weekly variation was designed for types ofbusinesses such as retail shops, restaurants, andJapanese-style inns, where business may slow downgreatly on certain days of the week. This system pro-vides for advance changes (made by the end of theprevious week) in the scheduled working hours for aparticular day or days, keeping the weekly scheduledhours at a fixed constant. Furthermore, the LaborStandard Act also stipulates a de-facto working hourssystem. Firstly, in the case of pit work, the total timespent from the time the worker enters the under-ground workplace until he or she leaves it will,
III-17 Year-on-Year Difference in the Non-Scheduled Working Hours
Source: Monthly Survey of Labour Statistics, Ministry of Health, Labour and WelfareNotes: 1) Study limited to businesses with over five employees.
2) Indicates quarterly rate of change.
20(%)
15
10
5
0
–5
–10
–15
–20
–25
–30
All IndustriesManufacturing
1991 1992 1993 1994 1995 1996 1997 1998 1999 2000 2001 2002 2002 2004

49Labor Situation in Japan and Analysis: General Overview 2006/2007
Chapter III Human Resource Management
including the recess time, be considered as part of theworking time. Secondly, it deals with a system forwork which is “conducted outside of the officialworkplace without specific command or supervisionprovided and for which it is difficult to calculate theamount of time spent,” and is targeted at work such assales and reporting/information gathering. Thirdly itdeals with what is so-called discretionary schedulingsystem. This consists of two parts: the “discretionaryscheduling system for specialized work” that is aimedat specialized work such as research and develop-ment, computer programming, mass communication-related work such as editing, broadcast and filmdirecting, as well as designing, and the “discretionaryscheduling system for planning work” that is aimed atwhite-collar work involving such areas as planningand project development.
Karoshi (Death from Overwork)The Japanese phenomenon of “karoshi” is known
the world over. This can be translated broadly asdeath that occurs as a result of excessive work(involving such things as extremely long workinghours or unnaturally high stress levels). However itmust be noted that it is extremely difficult to havesuch cases handled by the legal system if a causalassociation with the work is not proved. In a morelimited sense, death as a result of cerebrovascular dis-ease or ischemic heart diseases (such as brain infarc-tions, subarachnoid hemorrhage, cardiac infarction,cardiac angina etc.) that have been a result of work
overload can be termed as “karoshi” or “death fromoverwork,” and death that is triggered as a result ofmental disability that is caused by work overload orunnatural levels of stress can be said to be “suicidethrough overwork”
There is no doubting the fact that the principlefactor behind the “death from overwork” occurrenceis exceptionally long working hours. Due to this, theissue of whether a death qualifies for workmen’scompensation is considered taking into accountwhether the work that the intended recipient wasinvolved in between the stage just prior to occurrenceof the symptoms until the day before the death wasexcessive or not, and to next reflect on the conditionsup until a week before the incident. In addition tothis, from 2001 onwards it has also begun to be takeninto account whether the worker was involved inmore than 45 hours of overtime work between one tosix months prior to the occurrence, or similarlyinvolved in more than 100 hours of non-scheduledwork in the first month, or more than 80 hours permonth in the period between the second to sixthmonth prior to the occurrence.
The number of cases for both the application andcertification of “death from overwork” and “suicidethrough overwork” have been on the rise: in 2004,150 cases from the total number of 335 applicationsfor “death from overwork” and 45 of the total of 121cases (including attempted deaths) for “suicidethrough overwork” were certified as genuine cases.

50 Labor Situation in Japan and Analysis: General Overview 2006/2007
Labor Cost StructureA look at the makeup of labor costs as outlined in
Table III-18 shows that wages cover 80.3% in thecase of Japan, making it higher as compared to othernations. On the other hand the percentage of laborcosts other than wages is low in the case of Japan. Inthis category of non-wage labor costs, compulsorybenefit costs in Japan stand at 9.3%, a figure that isslightly higher than the U.S. or the U.K., but lowerthan Germany and France. In addition to this, costssuch as retirement benefits in Japan form 6.8%; thepercentage for this component is lower in the case ofthe U.K., Germany and France.
Social Insurance Premium RatesTable III-19 compares the social insurance premi-
um rates in each country. In Japan the insurance pre-mium rate is about 22% of total pay. This is a littlehigher than the rate in the U.S., and about the same as
that in the U.K., but lower than that in Germany,France and Sweden. The breakdown of Japan’s22.16% is as follows: medical insurance, 7.43%; pen-sion insurance, 13.58%; and unemployment insur-ance, 1.15%. However, there is a further cost thatonly employers pay-the system of compensation foraccidents at the workplace.
Compulsory Benefit Costs’ StructureFigure III-20 shows the composition of the aver-
age compulsory benefit costs per month per regularworker in 2001. Health insurance premiums are31.7%, and employees’ pension insurance premiumsare 54.4%, so that these two compose about 86% ofthe compulsory benefit costs that organizations arepaying out for employees. Labor insurance premiumoccupies 12.8%, broken down as 7.0% for unemploy-ment insurance and 5.8% for workmen’s compensa-tion insurance.
6 Company Benefits
III-18 Comparison of Labor Cost Structures by Cost Item (manufacturing)
Sources: General Survey of Wages and Working Hours Systems, Ministry of Health, Labour and WelfareEmployer Costs for Employee Compensation, Bureau of Labor Statistics,Labour Costs 2000, Eurostat
Notes: 1) All workers at companies employing 30 or more persons in Japan, 1 or more in the U.S., and 10 or more in the EU.2) Numbers inside ( ) are a breakdown of figures.
Cost Item Japan (2002)
Total labor costs 100.0 100.0 100.0 100.0 100.0
Total wages 80.3 72.6 76.8 75.8 64.8
Wages, salary therein (62.1) (65.2) (67.9) (65.1) (58.4)
Wages for vacation days and (18.1) (7.4) (9.4) (10.7) (6.5)other paid days off
Total of other labor costs 19.7 23.1 23.2 24.2 35.2
Compulsory benefit costs therein (9.3) (8.6) (8.3) (15.7) (20.5)
Non-compulsory benefit costs (2.9) (14.5) (8.7) (7.0) (8.9)
Cost of retirement benefits, etc. (6.8) (1.0) (0.6) (2.2)
Wages paid in kind (0.3) (2.3) (0.4) (0.1)
Vocational training expenses (0.3) (2.4) (0.5) (1.5)
Others (0.2) 0.0 (0.3) (2.1)
(%)
U.S. (2002) U.K. (2000) Germany (2000) France (2000)

51Labor Situation in Japan and Analysis: General Overview 2006/2007
Chapter III Human Resource Management
Retirement Benefits SystemIn Japan, the monetary allowance in the event of
retirement can be divided into the two categories oflump sum retirement allowances and retirement pen-sions. A look at Table III-21 shows that only lumpsum retirement allowances and only retirement pen-sions constitute 46.5% and 19.6% respectively, whilethe figure for cases where these categories are com-bined is 33.9%. However, it should be noted that theincidence of only lump sum retirement allowancesbeing provided is inversely proportional to the size ofthe company in question, whereas the incidence ofboth these allowances is being provided increases in
direct proportion to the size of the company.It is generally seen that both retirement benefits
and retirement pensions are paid in proportion to thenumber of years of continuous service at a specificbusiness. However there is a demarcation done on thebasis of the reason for leaving the company. The ratioof payment is low for those workers who have left ontheir own convenience while the ratio is raised forlong-term workers who have retired at the mandatoryage after long-term employment and for those whohad to resign at a company’s request as those seen inrecession etc. It is for this reason that the retirementbenefits and retirement pension have become a factor
III-19 Social Insurance Premium Rates (workers)
Source: White Paper on Health and Welfare (1999), (former) Ministry of Health and Welfare.Notes: 1) Basically insurance premium rates are based on total salary. In Japan‘s case, the premium rates for medical insurance (government man-
aged health insurance) and pension insurance (employees’ pension) use values calculated on the basis of total salary including bonuses.Figures are shown in ( ) in the case of standard salary base.
2) In addition, there is also compensation for accidents at the workplace, but the insurance premium differs with type of business.3) In addition, there are “social insurance” programs managed at the state level―unemployment insurance and accident compensation
insurance―but the premium rates differ by state.4) Insurance rates differ with income. The insurance premium rates in the figure are those applying to any weekly pay over 64 Pounds.5) Insurance rates differ with income. The insurance premium rates in the figure apply in cases when weekly pay is over 210 Pounds.6) In addition, there are insurance premium rates paid by employers for compensation for industrial accidents and occupational diseases, but
they differ by enterprise (4.0% on average). Premium rates for unemployment insurance differ with income. Also, in terms of expensesborne by workers, there is a general social contribution (7.5% of income) outside of the insurance premium paid. This is a kind of tax usedspecifically for illness insurance and family benefits.
Japan(April 1999)2 22.16% 10.89% 11.27%
Medical insurance (government-managed healthinsurance) 7.43% (standard salary monthly portion8.5%, bonus portion 0.8%),Pension insurance (employees’ pension) 13.58%(standard salary monthly portion 17.35%, bonusportion 1%), Unemployment insurance 1.15%
U.S.(1999)3 15.30% 7.65% 7.65% Old age/survivors/disability pension (OASDI) 12.4%,
Medicare 2.9%
U.K.(April 1997)
20%maximum
10%maximum4
10%maximum5
National insurance (retirees pension, jobhunters-benefits, benefits for those unable towork, etc.)
Germany(1998)
42.20% 20.95% 21.25%
Pension insurance 20.3%, Illness insurance(average) 13.6%, Nursing care insurance 1.5%,Accident insurance 0.3% (average),Unemployment insurance 6.5%
France(January 1998)6 41.58% 9.61% 31.97%
Illness insurance 13.55%, Pension insurance16.35%,Widows’ insurance 0.1%, Family benefits 5.4%,Unemployment insurance 6.18%
Sweden(1998)
35.53% 6.95% 28.58%
Pension insurance 20.38%, Medical insurance(sickness benefits, parent benefits, etc.) 7.93%,workmen’ s compensation insurance 1.38%,Unemployment insurance 5.42%, Others 0.42%
InsurancePremium Rate
Portion Paid byWorkers
Portion Paid byEmployers
(%)
Breakdown

52 Labor Situation in Japan and Analysis: General Overview 2006/2007
that promotes the long-term work tenures of workersin Japan. In addition to this, in the past it was largelythe case that the amount for the lump sum retirementallowance was large, and the worker received a con-siderable amount of money at the time of mandatoryretirement. However in the course of the last few
years the proportion of the retirement pension hasbeen on the rise. A number of reasons lie at the back-ground of this development, such as the fact that theamounts for lump sum retirement allowances hasbeen increasing for companies together with the age-ing of the workforce, thereby causing heavy burdens
III-20 Breakdown of Average Compulsory Benefit Costs perRegular Worker Each Month
Employees’ PensionInsurance Premium
54.4%
HealthInsurancePremium
31.7%
Labor InsurancePremium
12.8%Unemployment
Insurance7.0%
Workmen’sCompensation
Insurance5.8%
Others1.0%
2001
III-21 Existence of Employee Retirement Benefit Systems in Companies andPercentage of Companies by the Employee Retirement Benefit System
Source: General Survey of Working Conditions, 2003, Ministry of Health, Labour and Welfare
Size of Enterprise
Total industries surveyed 100.0 86.7 (100.0) (46.5) (19.6) (33.9) 13.3
1,000 employees and over 100.0 97.1 (100.0) (11.0) (19.1) (69.9) 2.9
100-999 employees 100.0 91.0 (100.0) (31.6) (22.9) (45.5) 9.0
300-999 employees 100.0 95.7 (100.0) (22.7) (26.4) (50.9) 4.3
100-299 employees 100.0 89.5 (100.0) (34.7) (21.6) (43.7) 10.5
30-99 employees 100.0 84.7 (100.0) (54.1) (18.3) (27.7) 15.3
(%)
All EnterprisesOnly Lump
SumRetirementAllowance
OnlyRetirement
Benefit(Retirement
Pension)
Both of LumpSum RetirementAllowance and
RetirementBenefit
(RetirementPension)
No EmployeeRetirement
BenefitAvailable
Total
Enterprises with an Employee Retirement Benefit System
Source: General Survey of Working Conditions, 2001, Ministry of Health, Labour and Welfare
53Labor Situation in Japan and Analysis: General Overview 2006/2007
Chapter III Human Resource Management
of cost, and also that companies become eligible toreceive certain benefits through tax laws by convert-ing retirement benefits to retirement pensions.
Diversification of Company BenefitsLately, changes in corporate welfare have rested
on matters like the increase in companies’ cost bur-den for public welfare-and the diversification ofemployee needs-as well as the development of thesocial security system. Some new mechanisms arecurrently being introduced: 1) a retirement benefitpre-payment system will add the former welfare por-tion of labor costs to wages paid to individual work-ers; 2) a point system in retirement benefits can becombined with a merit-based wage system; and 3) astock option system is being popularized, allowing
workers the choice of purchasing stock in their com-panies at a price fixed in advance.
In addition, to mitigate the welfare cost burdenand to satisfy the diversifying needs of employees,arrangements are being made for a variety of welfarechoices, and a cafeteria-style plan that will allowemployees to use features according to their needs isbeing gradually disseminated.
Furthermore, a “Family-Friendly Company” awardhas been created. This is to commend businesses withpersonnel management systems giving considerationto the household conditions of workers through suchefforts as the creation of a vacation/leave system forchild care and family care, and the establishment of adaycare center. The Ministry of Health, Labour andWelfare began honoring such enterprises in 1999.

54 Labor Situation in Japan and Analysis: General Overview 2006/2007
Changes in In-house Training andEducation
While Japan’s life-long employment practice expe-riences is changed by forcing restructuring, recruitingexternal human resources and other reason, trainingand education are also subject to changes due to theadvocates on importance of individual career develop-ment such as emphasized capacity developmentthrough the independent responsibility of the workerand the introduction of selective education, in additionto long-term human resource development (overallbasic education) in the company based on the assump-tion of long-term employment. Furthermore, humanresource development hear in after HRD in companiesfaces many issues such as the year 2007 problemwhere large numbers of baby boomers face retirementwith the concerns on how to transfer of skills andtechnology, the decrease in young employees accom-panying an aging society, and the increase in “freeters(job hopping part-time worker)” and “NEETs (youngpeople Not in Education, Employment or Training).”
OJT: Practical Training Predicated onLong-term Employment
Workers HRD trainy is based on on-the-job train-ing (OJT) although there have been the changes asseen above, predicated on the assumption thatemployees will stay at one company throughout theircareers, in-house development of human resources atJapanese companies takes place over a long period.Inhouse training-central to this development-consistsprimarily of OJT which gives employees the opportu-nity to develop their skills through actual businessexperience. OJT fulfills an important role in trainyboth blue- and white-collar workers. In factories, forinstance, OJT is used not only to teach personnelabout the production process, but also to enable themto repair malfunctioning machinery and performmaintenance work. Clerical workers in accountingand other departments learn through OJT how tomanage unreliability by, for example, analyzing
divergences between budgeted and actual results.
Two Types of OJTBecause OJT often overlaps with the execution of
everyday work, it is difficult to gain an understandingbeyond surface appearances; however, we can divideOJT into two types-formal and informal. Formal OJTgenerally involves assigning instructors and settingtrainy schedule to train employees, and setting post-training evaluation standards. These points separateformal OJT from informal OJT.
Long-term Informal OJT Builds High-levelTalent
The primary distinguishing features of HRD inJapan are as follows.(1) Informal OJT performs a considerably greater
role than formal OJT. On the other hand, the latteris often given in limited occasions such as tocover only a part of initial skill improvement peri-od of newly hired workers or to provide by-leveltraining to those who assume higher rank posi-tion.
(2) A long-term informal OJT is indispensable foremployees to acquire high-level skills. Some ofthe principle forms of informal OJT include grad-ual progression of work experiences from simpleto more difficult tasks and a rotation systemwhere workers shift and serve in a variety of posi-tions. OJT gives workers the opportunity to gain awide range of experience, thus improving theirbusiness skills.
(3) Long-term informal OJT is implemented in largecompanies in a wide and organized manner. Whilealthough there are only few small- and medium-sized companies that tend to implement in orga-nized manner, they implement in a manner wheresenior workers gives guidance to junior workers.
(4) Off-JT (off-the-job training; those conducted out-side the workplace) is being implemented inbetween the OJT. Workers deem to organize and
7 Career Development through In-house Training and Education

55Labor Situation in Japan and Analysis: General Overview 2006/2007
Chapter III Human Resource Management
systematize the OJT experiences through Off-JT,and acquire the knowledge and theoretical skillsnecessary in handling issues in practical businessaffairs.
OJT is Founded on Seniority-basedPromotion and Promotional Management
This type of OJT functions effectively in Japanthanks to a promotion and pay raise management sys-tem that enables senior workers to smoothly transferskills on to subordinates. Senior workers are notreluctant to train their subordinates, since they areconfident that the latter will not be promoted or givenraises ahead of them; this, in turn, has reinforced
teamwork at the workplace.This approach to HRD has proven to be a positive
way for employees to refine their skills, and is also anaspect of Japanese company culture that makesJapanese companies so competitive.
58.3% of Companies Implement Off-JT,and 46.7% Implement Planned OJT
According to the most comprehensive referenceon Japanese in-house training, “Basic Survey ofHRD” (Ministry of Health, Labour and Welfare),58.3% of Japanese companies implemented Off-JT inFY2003, and 46.7% implemented “formal OJT.”
III-22 Current Situation of Off-JT Implementation
Overall
Size of enterprise
Services
Industry specific
Construction
Manufacturing
Electricity, gas, heat and water supply
Transport and communication
Wholesale and retail trade, eating and drinking places
Financing, insurance,real estate
Less than 30 employees
30–49 employees
50–99 employees
100–299 employees
Over 300 employees
1.3
0 20 40 60 80 100 (%)
Implemented Not implemented No response
58.3
56.2
62.9
81.1
49.3
29.2
40.4
77.8 22.2
58.2 40.7
57.1 42.9
56.6 41.6
41.6
36.3
18.9
49.6
70.81.1
2.2
0.8
59.4 39.90.7
1.8
1.1
62.2 36.41.4
42.9 56.30.8
Source: Basic Survey of Human Resources Development, 2003, Ministry of Health, Labour and Welfare

56 Labor Situation in Japan and Analysis: General Overview 2006/2007
III-23 Current Situation of Formal OJT Implementation
Overall
Size of enterprise
Services
Industry specific
Construction
Manufacturing
Electricity, gas, heat and water supply
Transport and communication
Wholesale and retail trade, eating and drinking places
Financing, insurance,real estate
Less than 30 employees
30–49 employees
50–99 employees
100–299 employees
Over 300 employees
0 20 40 60 80 100 (%)
Implemented Not implemented No response
0.8
1.6
1.1
1.9
1.2
1.0
0.5
0.8
1.3
1.346.7
42.0
53.0
64.6
40.8
22.9
55.6
39.2
42.9
50.0
52.5
46.4
39.7
52.0
59.8
44.4
57.1
48.8
56.4
45.9
34.1
58.4
77.1
45.6
53.1
59.5
Source: Basic Survey of Human Resources Development, 2003, Ministry of Health, Labour and Welfare
Source: Basic Survey of Human Resources Development, 2003, Ministry of Health, Labour and Welfare
III-24 The Current and Future Conditions of the Responsible Actor for HRD
Individual worker is more responsible in his/her HRD
The company is the responsible for HRD of the workers
The company is more responsible for HRD of the workers
No response
Individual worker is the responsible in his/her HRD
0 10 20 30 40 50 60 70 80 90 100(%)
To date
In the future 13.4 48.7 28.7 3.8 5.4
13.3 51.6 25.4 3.9 5.8

57Labor Situation in Japan and Analysis: General Overview 2006/2007
Chapter III Human Resource Management
III-25 Support for Self-development by Employees (multiple answers)
No response
No particular support
Others
Grant of educational training leave
Support for in-house implementation of lectures, etc.
Management education on incentivesfor self-development
Special arrangements for working hours
Provision of informationconcerning external training courses, etc.
Financial support for course etc.
0 10 20 30 40 50 60 (%)
59.6
47.0
26.4
21.1
13.2
7.5
2.1
13.6
2.9
Source: Basic Survey of Human Resources Development, 2003, Ministry of Health, Labour and Welfare

58 Labor Situation in Japan and Analysis: General Overview 2006/2007
Resignation“Retirement” is a cause for the cancellation of
employment contract relations, and is a general termapplying whenever a worker leaves the companywhere he or she is employed (disregarding dis-missals). There are different types of retirement:“general resignation” and “resignation for one’s ownconvenience” take place when the worker unilaterallycancels the employment contract relationship; “resig-nation by agreement,” “resignation by employee’srequest,” and “voluntary retirement” all occur throughconsent between worker and employer; and “retire-ment at the mandatory age” comes about according torules in the employment contract, work rules in thecompany or collective agreement.
Recent problems related to resignation that havearisen are advised resignations and preferential treat-ment when soliciting workers for early retirementwith business restructuring.
Regarding the former, the wrongful urging ofretirement such as through persistent pressing or vio-lence is illegal, and business owners are liable fordamages. The actual situation is not clear, but lookingat the operational statistics of the System forResolution of Individual Labor Disputes, approxi-mately 15% of disputes that develop at the workplaceare over bullying and harassment related to advisedresignation or something closely connected toadvised resignation.
Regarding the latter, there have been lawsuits inwhich workers seek to collect differences in moneyreceived from companies resulting from imbalancedpreferential treatment depending on when workersresign. This type of preferential treatment has nolegal basis, so when, to whom, and what kind of pref-erential treatment is given can basically be decidedby companies. Thus in general, even though usingsuch a system for preferential treatment, the issue ofconsent of users of the system and imbalances inpreferential treatment become legal problems, unlessthese types of systems are acknowledged as being
permanent, applying to all employees and beingclearly part of the conditions of employment, requestsby workers for companies to make up for differencesin pay are not recognized.
Mandatory RetirementAccording to the 2005 survey (2005 Summary of
“General Survey of Working Conditions,” 28November 2005, Ministry of Health, Labour andWelfare), 95.3% of companies provide a mandatoryretirement system; of those 97.6% provide a uniformmandatory retirement system, and 91.1% have set themandatory retirement age at 60.
Although the Elderly Persons EmploymentSecurity Act stipulates that employers may not fix amandatory retirement age below age 60 (Article 8), italso obliges employers to take measures to secureemployment until age 65 (Article 9). This system hasbeen newly stipulated by the revised Elderly PersonsEmployment Security Act of 2004 and has estab-lished three points: 1) rising the mandatory retirementage; 2) introducing a system of continuous employ-ment; and 3) abolishing the mandatory retirement(refer to Policies Designed to Secure Employment forOlder and Disabled Workers regarding the back-ground and contents of the revision of the Act).
Looking at the status of introducing measures thatsecure employment until age 65 in conjunctions tothe enforcement of the revised Elderly PersonsEmployment Security Act as of 1 November 2005, atotal of 86.7% corporations has planned to introducesuch measures. The breakdown is as follows: 23.6%already introduced and 63.1% plan to introduce mea-sures to secure employment beyond 60 and until 65.Of this, corporations that stipulate the maximum ageof the employment security to be 65 (and older) was39.4% and from 62 to 64 was 60.6%. Furthermore,the breakdown of employment security measures thathas already been introduced and that are planned onbeing introduced, is 0.6% for abolishing mandatoryretirement, 6.9% for rising the retirement age, and
8 Resignation, Mandatory Retirement and Dismissals

59Labor Situation in Japan and Analysis: General Overview 2006/2007
Chapter III Human Resource Management
92.5% for introducing continuous employment sys-tem (“Efforts of Corporations towards theImplementation of the Revised Elderly PersonsEmployment Security Act,” 16 December 2005,Ministry of Health, Labour and Welfare).
As can be seen, although the securing of employ-ment is viewed to be widely implemented, there stillseems to be issues remaining for the securing andcontinuation of elderly employment such as how torespond to the issue as a corporation, how to fund thecosts, and the real necessity of public support (seeIII-26, 27).
Meanwhile, there are influential opinions statingthat legally speaking, the mandatory retirement sys-tem lacks rationality in terminating an employmentcontract for reaching a certain age, and goes againstthe principle of employment security. However, thecommon thinking is that the mandatory retirementsystem has rationality in the long-term continuousemployment system based on seniority, and even thecourt does not judge the mandatory retirement systemas unlawful (violation of Article 90 of the Civil Codeon public order).
DismissalsGeneral
The Labor Standards Act only prohibits followingdismissal cases: 1) during a period of leave for aninjury at the workplace or illness, and during the 30days following, as well as 2) for women, during theperiod of leave for pregnancy and delivery and duringthe 30 days following, but dismissal in general is notprohibited. On the other hand, dismissal that isagainst the legal principle of equal treatment betweenmen and women is a breach of Article 90 of the CivilCode on public order and is therefore invalid.Furthermore, malicious or retaliatory dismissals toretort employee who has asserted or exercised statu-tory right are prohibited as disadvantageous treatment(Article 3 and Item 2, Article 104 of the LaborStandards Act; Item 2, Article 13 of the EqualEmployment Opportunity Act; Articles 10 and 16 ofthe Child Care and Family Care Leave Act; Article 7of the Trade Union Act).
Looking at dismissals in general (due to lack ofcapacity, inability to perform labor) under current
legal condition, the restriction imposed by the legalprinciple of abuse of dismissal rights, has attained anespecially important role. This principle, which hasbeen established by precedents of the JapaneseSupreme Court from about the mid-1970s onward, isa legal theory that will examine and restrict the use ofdismissal rights when an employer unilaterally can-cels a employment contract with an employee. TheSupreme Court formulated the context of this princi-ple by stating that “the use of the right of dismissalby an employer shall become invalid, as an abuse ofrights, when lacking in objectively rational pretextand thereby cannot be approved as corresponding toany socially accepted idea.” Further, the Court haspresented specific requisites and methods for inter-pretation of the principle by expressing that “evenwhen there is a reason for general dismissal, theemployer may not always be able to dismiss theemployee. If the basis for dismissal in the specific sit-uation concerned is remarkably unreasonable, orwhen it cannot be approved as corresponding to asocially accepted idea, the concerned expression ofintention to dismiss shall be invalid as an abuse of theright of dismissal.”
These legal principles are stated in an amendmentto the Labor Standards Act (Article 18-2) in 2003.Behind this was the recognition that these legal prin-ciples should be stated because even though the prin-ciples have been playing an important role in Japan’sdismissal regulations, the fact that it was not a lawmade it socially ambiguous. There was also therecognition that by stating the principles, the easydismissal of employees due to the recent economicrecession should be stopped. In addition, punish-ments are not attached at all to the regulations of therevised Labor Standards Act related to dismissalrestrictions, and it is a pure civil mandatory act.
Collective Dismissals for EconomicReasons
The adjustment of employment in Japan isfocused chiefly on the regulation of overtime, and isaccomplished through measures not to bring grief toemployees. As a step to eliminate permanent employ-ees from the enterprise, this adjustment has not beenmade as long as the management situation is not terri-

60 Labor Situation in Japan and Analysis: General Overview 2006/2007
III-26 Special Measures Currently Taken for the Employment of Workers of 60 Years and Over
Category
( 0.0) 100.0 30.1 17.5 1.7 16.1 15.6 2.9 10.8 2.6 0.5 0.5 59.1
( 0.0) 100.0 25.9 14.3 3.7 11.2 10.0 3.7 13.4 2.6 – 1.1 70.7
(68.5) 100.0 34.1 15.7 0.3 16.1 12.0 4.3 19.8 2.3 0.8 0.0 52.7
(64.9) 100.0 31.4 16.5 1.5 16.0 17.1 4.2 7.7 1.4 0.0 0.7 59.3
(68.1) 100.0 57.1 28.9 4.4 45.8 31.8 4.2 14.4 7.3 – 2.0 39.8
(35.3) 100.0 16.2 5.0 3.6 8.6 7.0 0.8 3.6 0.7 1.8 1.4 64.6
(23.9) 100.0 40.6 25.3 4.1 21.5 20.2 3.6 20.4 4.9 – 1.5 48.1
(55.6) 100.0 28.9 18.3 1.4 17.4 17.6 2.6 7.5 3.6 1.0 0.5 61.2
(41.1) 100.0 25.1 14.6 4.4 15.6 9.7 2.4 4.1 3.2 – 0.1 60.5
(27.6) 100.0 23.2 10.9 1.8 14.3 8.5 0.6 10.4 1.8 0.1 0.1 67.0
(51.2) 100.0 34.6 23.9 0.4 19.1 20.1 0.4 10.3 2.9 – 0.0 51.9
(45.8) 100.0 24.9 15.9 1.5 11.9 16.6 1.4 12.0 1.4 0.1 0.2 63.7
(54.9) 100.0 27.2 18.5 3.1 16.0 14.5 2.3 7.3 2.9 0.9 0.2 61.1
(48.3) 100.0 19.9 8.8 1.5 11.7 5.6 3.1 9.5 5.4 – 0.3 74.1
(28.7) 100.0 24.8 14.9 3.4 13.1 11.3 2.3 9.1 2.4 0.9 0.9 66.4
( 0.0) 100.0 47.8 18.8 8.4 36.0 29.3 6.1 17.7 1.5 1.1 2.0 46.8
(92.4) 100.0 40.8 20.0 5.9 24.0 24.1 5.0 14.7 3.9 1.1 1.0 52.4
(85.9) 100.0 36.3 16.5 3.7 22.3 18.8 4.5 14.2 4.1 0.2 0.4 55.6
(80.3) 100.0 37.3 18.7 3.5 20.5 21.5 3.2 12.7 3.6 0.3 0.6 52.9
(69.0) 100.0 28.1 17.2 1.2 14.8 14.2 2.7 10.1 2.3 0.6 0.5 60.7
Total
Industry
Mining
Construction
Manufacturing
Electricity, gas, heat supply and water
Information and communications
Transport
Wholesale and retail trade
Finance, insurance
Real estate
Eating and drinking place, accomodations
Medical health care and welfare
Education, learning support
Compound service industry
Services (not elsewhere classified)
Size of enterprise
1,000 persons and more
300-999 persons
100-299 persons
30-99 persons
5-29 persons
(%)
Enterprises employing workers
over 60 years ofage
Enterpris-es thattake
specialmeasures
Adjustingthe work
load
Re-designing
and develop-ing the
jobdescrip-
tion
All oca-tion to
theappropri-ate job,
adjustingthe
assign-ment
Reducingworkinghours,
introduceflexibility
to theworking
hour
Improvingworkingmethods,develop-ing workfacilities/equip-ments
Considerat-ions on
managinghealth
and safety
Implementing edu-cationaltraining
Introduci-ng work-ing fromhome,
workingin satel-
liteoffices
Othermeasures
No specialmeasuresare taken
Contents of the measure (multiple answers)
Source: Summary Report on 2004 Survey on Elderly Employment-Enterprise Survey, 9 June 2005, Ministry of Health, Labour and WelfareNotes: 1) "Enterprise employing workers over 60 years of age" includes those with unspecified measures for employing workers of over 60 years of
age.2) Figures in ( ) indicate the ratio of enterprises that employ workers of over 60 years of age to the total number of enterprises.

61Labor Situation in Japan and Analysis: General Overview 2006/2007
Chapter III Human Resource Management
III-27 Public Support for Expanding Employment of Workers over 60 Years and Over
Category
100.0 41.8 12.3 7.8 33.5 7.7 5.5 3.5 20.1 31.8
100.0 39.6 6.2 7.2 35.1 4.1 2.3 3.8 22.1 31.9
100.0 43.1 10.6 5.2 38.2 5.4 5.1 2.4 16.8 33.1
100.0 49.0 15.7 9.4 41.7 6.9 3.9 3.8 14.7 30.8
100.0 45.0 6.1 2.7 40.1 19.9 6.3 1.5 27.8 24.4
100.0 41.0 12.5 10.4 31.0 15.4 8.0 2.1 22.5 32.1
100.0 43.0 10.6 5.8 37.3 5.8 4.0 2.5 21.9 28.2
100.0 42.2 11.8 10.6 32.4 9.5 6.2 4.4 21.3 31.0
100.0 41.1 10.3 9.3 28.2 14.5 5.9 1.4 15.8 36.0
100.0 40.6 12.7 5.3 32.9 6.4 4.6 2.6 17.9 35.9
100.0 34.0 12.6 3.8 28.5 4.9 6.0 3.1 25.0 31.8
100.0 37.2 15.3 7.2 26.7 6.1 7.1 3.2 20.7 36.8
100.0 35.2 12.9 3.0 28.1 4.5 3.7 3.2 25.7 33.8
100.0 41.7 9.2 6.7 36.3 7.0 6.5 4.3 13.9 39.3
100.0 41.2 10.3 6.4 31.6 7.9 5.0 3.6 21.9 30.1
100.0 66.1 7.1 14.1 50.3 13.6 12.1 7.8 11.3 19.9
100.0 64.0 14.2 11.6 52.5 14.4 10.4 4.8 12.9 20.7
100.0 56.6 15.3 10.0 45.2 8.5 7.8 4.6 14.8 23.8
100.0 54.4 15.4 9.1 46.0 9.1 6.6 3.5 15.1 25.8
100.0 39.4 11.7 7.5 31.3 7.4 5.2 3.5 21.0 33.0
Total number
Industry
Mining
Construction
Manufacturing
Electricity, gas, heat supply and water
Information and communications
Transport
Wholesale and retail trade
Finance, insurance
Real estate
Eating and drinking place, accomodations
Medical health care and welfare
Education, learning support
Compound service industry
Services (not elsewhere classified)
Size of enterprise
1,000 persons and over
300-999 persons
100-299 persons
30-99 persons
5-29 persons
(%)
Total number ofenterprises
Public support isnecessary Introducing
humanresources
Providingknowledgeregardingemploy-
ment
Promotionof wages
Promotionof capacitydevelop-
ment fees
Providingopportuni-
ties for educational
training
Other support
None necessary
Don’tknow
Contents of public support (multiple answers)
Source: Summary Report on 2004 Survey on Elderly Employment-Enterprise Survey, 9 June 2005, Ministry of Health, Labour and WelfareNote: "Total number of enterprises" includes those with unspecified public support for expanding employment of workers over 60 years and over.

62 Labor Situation in Japan and Analysis: General Overview 2006/2007
bly bad. The basis for this situation is that dismissalsare, in actuality, difficult to carry out becauseJapanese companies have come to view long-termcontinuous employment as important, and the exis-tence of the legal principle fo “abuse of dismissalrights” supports this.
The regulations for collective dismissal are formu-lated originating from the legal principle of abuse ofdismissal rights, and will be considered illegal orinvalid unless it matches the legal principle of collec-tive dismissal constituted of the following four crite-rions.
1) That there was a necessity in personnel cuts, 2)that every effort was made to avoid dismissals (e.g.restrictions on overtime, reassignments, temporarytransfers, freeze on new hires, layoffs, voluntaryretirement, and cuts in part-time and other non-per-manent positions), 3) that there were reasonable crite-ria for selection of dismissal candidates (e.g. numberof late arrivals and absences, history of violation ofwork rules, and lowness of economic blow toemployees such as those with no dependents), and 4)that every effort was made to talk the situation overwith employees or the labor union (to conduct ade-quate explanation and hearing of opinions regardingthe events leading up to the collective dismissals, andthe term and method of carrying out such dismissals).
The concept of the legal principle of collectivedismissals is included in the legal principle of theabuse of dismissal rights stated in the revised LaborStandards Act.
Disciplinary DismissalsWork rules in the company generally provide the
heading “disciplinary actions” for handing down pun-ishments to persons such as those who violate work-place orders. Disciplinary actions are the personal
sanctions or punishments that a company carries outagainst its own employee for the reason that theemployee disturbed the order of that company. Theseactions are, from the most minor: warning, repri-mand, official reprimand, salary reduction, suspen-sion, counseled dismissal, and disciplinary dismissal.
Dismissals lend a great disadvantage to workers,especially in the case of a disciplinary dismissal sincethe worker will be evaluated as a person who has vio-lated the order, and the employee will be at anextreme disadvantage when finding new employment.However, if such a violator of the order is left in thecompany, it is possible that the productivity and dailybusiness of the other employees may be hindered.
Accordingly, an approach from precedent-basedprinciple is being taken where, while considering thedisadvantage to the employee and the benefits to thecompany, rigorous judgment of the legal validity ofdisciplinary dismissal is conducted. In short, the fol-lowing are necessary in the event of a disciplinarydismissal: 1) the reason for action, and the type anddegree of action corresponding to this reason, arespecified in the company rules, etc. (legal principle ofnulla poena sine lege, or no punishment without alaw), 2) the same type and degree of action to be car-ried out as in past cases (principle of equal treat-ment), 3) the substance of the action is appropriatewhen held up against the type and degree of viola-tion, and other circumstances (principle of equiva-lence), and 4) the procedures of the action are fair(appropriate procedures: examination by a discipli-nary committee and an opportunity to defend given tothe person in question).
Since disciplinary dismissals are also dismissals,they are regulated by applying the legal principle ofabuse of dismissal rights stated in the revised LaborStandard Act.

64 Labor Situation in Japan and Analysis: General Overview 2006/2007
In-House Labor-Management RelationsPlay a Key Role
In Japan, there persisted an employment practicewhere dismissal of regular employees was kept to aminimum, and these employees were nurtured andutilized in the internal labor market over a long term.The various systems of employment relations havedeveloped to adjust to this internal labor market. Thisphenomenon had been reflected in the characteristicof individual labor-management relations, in particu-lar at large corporations, with (1) periodic recruitmentof new graduates with the assumption of job securityuntil retirement, (2) education and training throughflexible reassignment of regular employees and on-the-job-training (OJT), and (3) personnel manage-ment by seniority for remuneration and promotion inaccordance with accumulation of work performance.
The labor-management relations between employ-ee groups and companies have also developed intoenterprise labor-management relations, whereby intandem with the long-term employment practice,enterprise unions of mainly large corporations allowtheir regular employees to be an union member.Typically, one enterprise union is organized per com-pany and the union officials are also employees.Since the managers and executives that represent theemployers had once been ordinary employers as wellbefore being promoted to their position, they sharecommon interests with the union members.
In corporations where labor unions exist, collec-tive bargaining takes place between the labor unionand corporation, and working conditions such asannual wage increases, lump-sum benefits, workinghours, welfare issues and others are determined. Atcorporations, in addition to collective bargaining,
labor-management consultation systems exist indiverse formats at voluntary bases. This system iswidely seen also at corporations which are not union-ized and the system is used to discuss such issues asmanagement policy and the formulation of produc-tion plans, among others. This labor-managementconsultation system is said to contribute to the estab-lishment of stable labor-management relations.
Labor-Management Relations at Industryand National Levels
Nevertheless, there is a limit to the bargainingpowers of Japanese enterprise unions, in contrast tothe labor unions which are organized cross-corporateorganizations as seen in Europe. It could be said thatthe Shunto (spring wage offensive) developed as ameans of supplementing the limitations of enterpriseunions. Under Shunto system industrial organizationunions of the labor unions organize a unified, cross-corporate struggle, and national centers perform suchtasks as strategic coordination between industrialtrade unions and arousal of public sentiments. TheShunto system has resulted in the creation of a socialripple-effect system whereby a pattern-setting labor-management grouping determines the wage increaserate, which is in turn used as a reference by otherlabor-management groups in their negotiations.
Rengo (Japanese Trade Union Confederation),which is the national center, and management organi-zations such as Nippon Keidanren (Japan BusinessFederation) have established a venue for regular dis-cussions, and for issues on which they share the sameopinion, a joint policy proposal is duly submitted tothe central government.
A second point of importance is the role in gov-
Chapter IV Labor-ManagementRelations
1 Labor-Management Relations in Japan

65Labor Situation in Japan and Analysis: General Overview 2006/2007
Chapter IV Labor-Management Relations
ernmental councils on the formation of labor andsocial policy. Representatives of labor organizationsand management organizations and managementorganizations participate in these councils andendeavor to ensure that in the process of consensusbuilding on policy, the position of workers andemployers is duly reflected.
Shortcoming of the ConventionalModality
The long-term employment practice is falteringdue to changes in the labor market structure such asdecreasing birth rate and rapidly aging society as wellas long-term economic stagnation since the 1990s,and revision of the seniority-based wage system isbeing advanced.
A rapid increase in atypical workers such as part-time workers has imposed tremendous influence on
the modality of collective labor-management rela-tions.
The unionization rate fell below 20% in 2003, andsank further to 18.7% in 2005. Looking at the privatesector exclusively this figure is even lower at 16.4%.The unionization rate of part-time workers amountsto only 3.3% (see IV-1). Labor unions comprisingmainly regular employees have fallen absolutelybehind the organization of atypical workers. In addi-tion, looking at the situation by scale of corporationreveals stark differences in organization of laborunions. In other words, in 2005, the unionization rateamong corporations with more than 1,000 employeeswas 47.7%, but among corporations with between100 and 999 employees this figure was 15.0%, andfor corporations with less than 99 employees, the fig-ure was 1.2%. This demonstrates that labor unions insmall, medium and micro enterprises have dimin-
IV-1 Changes in the Number of Union Members and the Estimated UnionizationRate for Part-time Workers (Unit labor union)
Source: Survey of Labour Unions, 2005, Ministry of Health, Labour and WelfareNotes: 1) “Part-time workers” are those who work fewer hours than regular workers at the same business operation, or work regular working
hours with a shorter workweek, and referred to as “part-time workers” at the workplace.2) The number of short-time workers is the number of those who are classified as “employed” in the Labour Force Survey with less than 35
working hours per week.3) Estimated unionization rate is calculated by the following formula: Number of union members among part-time workers ÷ Number of
short-time workers.
Year
Number of labor union members among part-time workers
in 1,000 in 1,000 % % in 10,000 %
Year-on-yeardifference
Year-on-yeardifference ratio
Ratio to allunion members
Number ofshort-timeworkers
Estimatedunionizationrate
1999 244 4 1.7 2.1 993 2.5
2000 260 16 6.6 2.3 1,017 2.6
2001 280 20 7.8 2.5 1,042 2.7
2002 292 13 4.5 2.7 1,097 2.7
2003 331 38 13.1 3.2 1,098 3.0
2004 363 31 9.5 3.6 1,107 3.3
2005 389 26 7.3 3.9 1,172 3.3

66 Labor Situation in Japan and Analysis: General Overview 2006/2007
ished even further in presence. Shortcomings can also be seen in the Shunto
method. With international intensifying competition,management have taken such measures as flexiblepersonnel management reflecting corporate results asa modality for wage increases, rationalization ofwage standards that enable the maintenance of inter-national competitiveness, establishment of a wagesystem that recognizes abilities, results and contribu-tions, and as well as the multi-streaming of wagemanagement. It is becoming clear that cross-industry
wage increases are increasingly difficult in such anenvironment.
In contrast to the period when wage hikes couldbe guaranteed thanks to high-speed growth, interna-tional corporate competition has intensified, and inthe increasingly severe corporate management envi-ronment we have entered a period in which labor con-ditions could be lowered. Japan’s labor unions is test-ed whether they can regain their power and influenceand demonstrate their presence in the labor market.

67Labor Situation in Japan and Analysis: General Overview 2006/2007
Chapter IV Labor-Management Relations
Unionization Rate of 18.7%According to the “Survey of Labor Unions” issued
by the Ministry of Health, Labour and Welfare, as ofJune 30, 2005, there were 61,178 unit labor unions inJapan. The estimated unionization rate is 18.7%, withabout 10.138 million out of a total of around 54.16million employed workers belonging to unions.
The organizational structure of Japan’s laborunions is overwhelmingly dominated by enterpriseunions. Craft unions and industry trade unions alsoexist-though in small numbers-but in Japan wherelong-term employment is common, over 90 percentof unions are enterprise unions.
Unionization Rate has Shown a SteadyDecline Since its Peak in 1949
Since its peak in 1949, the estimated unionization
rate has continuously declined because the growth inthe number of union members has not kept up withthe growth in numbers of employees. In addition, thenumber of union members in 1994 peaked at around12.70 million, before going into steady decline (seeIV-2).
Industry-specific unionization rates are high inpublic service (50.7%); electricity, gas, heat supply,and water (58.6%); and financing and insurance(48.6%). In contrast, unionization rates are low inreal estate (3.0%), eating and drinking place, acco-modations industry (3.2%); agriculture, forestry andfisheries (3.5%); service industries (6.0%), wholesaleand retail trade (10.1%) and other sectors. The indus-try with the largest number of union members is themanufacturing industry (25.7%) (see IV-4).
2 Situation for Union Organizations and Structure of Labor Unions
IV-2 Changes in the Number of Employees and Union Members,and the Estimated Unionization Rate
Source: Survey of Labour Unions, 2003, Ministry of Health, Labour and Welfare
0
500
1000
1500
2000
2500
3000
3500
4000
4500
5000
5500
6000
0
5
10
15
20
25
30
35
40
45
50
55
60
19501947 1953 1956 1959 1962 1965 1968 1971 1974 1977 1980 1983 1986 1989 1992 1995 1998 20012003 2005
Esti
mat
ed u
nio
niz
atio
n r
ate
Nu
mb
er o
f em
plo
yees
/ N
um
ber
of
un
ion
mem
ber
s
(10,000 persons) (%)
(Year)
Estimated unionization rate(scale on right axis) Number of
union members
Number ofemployees
Peak figure forunion members :
12.699 million people

68 Labor Situation in Japan and Analysis: General Overview 2006/2007
Primary Reasons for the FallingUnionization Rate are the Growth of theService Sector and Increases in Part-timeWorkers
There are two factors behind the falling unioniza-tion rate. Firstly, the burgeoning of development inthe service economy has increased the proportion ofthe commerce and service among overall industries,in which the unionization rate have historically beenlow. Secondly, the diversification of employment hasresulted in increasing numbers of part-time workerswho are difficult to organize. Another factor is attri-tion of numbers due to retirement of people who usedto be union members and who are not being replacedby new members.
Labor Union Structure Japanese labor unions basically have a “triplicate
structure.” That is, (1) enterprise labor unions orga-nized at each business, (2) industrial trade unions
IV-3 Unionization Rate by Size ofEnterprise
Source: Survey of Labour Unions, 2005, Ministry of Health, Labourand Welfare
Notes: 1) The total number of unit labor unions2) “Others” includes members of unions that embrace more
than one industry and unions whose size is not known3) “Number of employees” represents workers employed by
private enterprises, excluding agriculture and forestry
Size of enferprise
Percentageof the
number ofunion
members
Percentageof the
number ofemployees
Estimatedunionizationrate (2005)
(%)
Total 100.0 100.0 16.4
More than57.4 7.0 47.7
1,000 workers
300–999 workers 15.727.0 15.0
100–299 workers 9.1
30–99 workers 3.352.4 1.2
Fewer than 29 workers 0.5
Others 14.0 – –
IV-4 Unionization by Industry
Source: Survey of Labour Unions, 2005, Ministry of Health, Labour and WelfareNotes: 1) The total number of unit labor unions
2) The “other industries” category covers members of unions that embrace more than one industry (excluding group enterprises) or whoseindustrial classification is unclear
3) Figures in brackets represent female union members
IndustryNumber of union
members(1,000 persons) Percentage (%)
Number ofemployees
(10,000 persons)
Estimatedunionization
rate (2005) (%)All industries 10,034 [2,795] 100.0 5,416 –
Agriculture, forestry, and fisheries 17 [2] 0.2 49 3.5
Mining 6 [1] 0.1 3 21.6
Construction 948 [63] 9.4 467 20.3
Manufacturing 2,750 [443] 27.4 1,071 25.7
Electricity, gas, heat supply and water 199 [27] 2.0 34 58.6
Information and communications 386 [62] 3.8 173 22.3
Transport 872 [64] 8.7 297 29.4
Wholesale and retail trade 971 [397] 9.7 960 10.1
Finance and insurance 724 [355] 7.2 149 48.6
Real estate 19 [4] 0.2 61 3.0
Eating and drinking place, accomodations 83 [32] 0.8 259 3.2
Medical health care and welfare 447 [356] 4.5 530 8.4
Education and learning support 621 [319] 6.2 255 24.4
Combined services 319 [73] 3.2 72 44.3
Services 451 [121] 4.5 754 6.0
Public service 1,166 [463] 11.6 230 50.7
Other industries 54 [16] 0.5 – –
69Labor Situation in Japan and Analysis: General Overview 2006/2007
Chapter IV Labor-Management Relations
organized as loose federations of enterprise unionmembers gathered by industry, and (3) national cen-ters (a typical example being the Japanese TradeUnion Confederation) made up of the industry tradeunions gathered at the national level.
Enterprise Labor Unions: AssertingLabor’s Basic Rights
Enterprise labor unions are Japan’s dominant formof labor organization because each enterprise unionexercises labor’s three primary rights: the rights toorganize, bargain collectively, and strike. Each enter-prise union has most of the staff, funding, and othermaterials necessary to exercise labor’s three primaryrights. Labor unions play the role of maintaining andimproving workers’ quality of life and working con-ditions. In order to do so, they engage in three prima-ry activities: activities with management, activitieswithin the unions, and activities outside the organiza-tion. First of all, as individual unions, enterpriseunions maintain and improve working conditions asin figure IV-5 and participate in management throughcollective bargaining and consultation with the man-agement. Next, as for activities within the unions,enterprise unions not only deal with organizationaloperations but also provide their members with ser-vices through various kinds of mutual aid activities.
Finally, when it comes to activities outside theorganization, enterprise unions individually seek toprovide benefits to their members by using theirinfluence for various policies on the regional, indus-trial, and national levels concerning employment andworking conditions as well as quality of life of theirmembers. In addition, recently, more and more laborunions are getting involved with community and vol-unteer activities in order to improve their public rela-tions.
Incidentally, the enterprise unions are only intend-ed for regular staff employed at the concerned com-panies, and non-regular staffs are generally notincluded. The enterprise union is a mixed union orga-nized as a single trade union for all regular staffs,without distinction between white-collar and blue-collar.
Industrial Trade Unions: The Mechanismand Roles
Enterprise unions are limited by their ownresources to engage in the above-mentioned threeactivities. In order to expand their effectiveness, theyhave established industrial trade unions. Industrialtrade unions support their member unions’ actionsagainst business owners by consolidating requestsconcerning chief working conditions such as wagesand working hours on the industrial level, collectingand providing information and basic materials, andcoordinating negotiation strategies. In terms of activi-ties within the organization, industrial trade unionsprovide their members with a variety of servicesthrough mutual aid activities, including life insurance,pension, medical insurance and so on. In addition,industrial trade unions participate in the formation anddecision-making processes of national industrial poli-cies, consult with economic organizations and devel-op international cooperation among labor unions.
National Centers: The Mechanism andRoles
National centers (mainly Rengo-the JapaneseTrade Union Confederation) provide members withsupport for actions against business owners by, forexample, deciding comprehensive standards forrequests regarding working condition issues such aswages and working hours. However, the most impor-tant role of the national centers is their participationin national politics. Rengo, the largest of the nationalcenters, maintains and improves workers’ quality oflife by sending its members to various advisory bod-ies in the government, participating in the decisionmaking processes of government policy making, andconcluding and maintaining cooperative relationswith political parties.
Acts of Labor Dispute Take Place at theCompany Level
Japan’s labor-management relations are basicallycooperative, but labor disputes do occur occasionally.In Figure IV-6, 6.0% of labor unions “have had labordisputes” between labor unions and employers in thelast three years representing a decline from the figureof the previous survey. Looking at the ratio of labor

70 Labor Situation in Japan and Analysis: General Overview 2006/2007
IV-5 Ratio of Labor Unions by Items Regarding Subject between Labor andManagement, whether or not Negotiation was Held and Session
through which Negotiation was Held (in the past 3 years)Total Labor Unions=100, M. A.
Source: Japanese Labour Unions Today II–Survey Results on Collective Bargaining and Labour Disputes, Policy Planning and Research Department(2003).
Note: The last 3 years means from July 1, 1999 to June 30, 2002.
0 10 20 30 40 50 60 70 80 90 100(%)
Items related to Wage
Wage system
Revision of wages amount (basic wages, allowances, bonus and lump sum payment)
Wage of each union member
Retirement allowances (including retirement pension)
Others on wages
Items related to Working hours
Scheduled work hours
Unscheduled work hours and days off
Holidays and vacations (including five-day work week and consecutive leaves)
Others on work hours
Items related to Employment and personnel affairs
Staff Plan and Hiring Plan
Transfer and secondment
Evaluation system (including conventional practice)
Recruitment of volunteer retirement standard of dismissal
Retirement system (including employment expansion or re-hiring system)
Advancement, promotion or discipline of each union member
Others on employment and personnel management
Working Conditions of Part-time Workers and Contract-based Workers
Child-care leave system, care leave systemTraining
Working environmentHealth management
WelfareEqual treatment of male employee and female employee
Items related to Management policy
Restructure of Company Organization and Reduction of Operating Departments
Other management policy
Interpretation and criticism of collective agreement
Measures on Job Security under Deteriorating Management Environment
Utilization of Part-time Workers, Contract-based Workers and Dispatched Workers
72.6
59.1
70.0
28.9
45.3
46.3
72.8
46.3
56.9
56.2
51.7
72.9
45.7
45.3
45.7
26.0
42.8
34.2
39.2
23.9
26.8
44.0
41.8
67.5
54.7
56.2
34.8
56.4
42.3
51.7
35.1
44.4
unions with labor dispute by their size, while laborunions of all sizes were in the range of 5% to 6%,labor unions with 1,000 to 4,999 members alonemarked a lower rate of 3.2%. Furthermore, in indus-trial trade unions, more labor disputes occurred in thetransport and communication industry than in other
industries. Most labor disputes take place in enter-prises.
Above we examined the structure and function ofJapan’s labor unions, and labor disputes, but enter-prise unions are most familiar to their members andplay the most immediate role in maintaining and

71Labor Situation in Japan and Analysis: General Overview 2006/2007
Chapter IV Labor-Management Relations
improving their quality of life. Furthermore, enter-prise unions serve as the foundation for relations withindustrial unions and national centers. For example,staff and financial resources move from individualenterprise unions to industrial unions in the form ofdispatches and financial contributions, and then flowfurther from industrial unions to national centers.
Accordingly, most board members of industrialtrade unions and national centers are dispatched from
enterprise unions, and hold positions at those enter-prises. Moreover, union dues of major enterpriseunions often exceed those of their affiliated industrialtrade unions. Labor disputes occur almost exclusivelyat the enterprise level. However, there are also casesin which there is a reverse flow of information andpolicies from national centers, through industrialtrade unions, to the individual enterprise unions.
IV-6 Ratio of Labor Unions by Existence of Labor Disputes (in the past 3 years)
Source: Japanese Labour Unions Today II–Survey Results on Collective Bargaining and Labour Disputes, Policy Planning and Research Department 2003.Note: The last 3 years means from July 1, 1999 to June 30, 2002
0 5 10 15 20(%)
Total in the survey in 1997
Total in the survey in 2002
(Industry)
Mining
Construction
Manufacturing
Electricity, gas, heat supply and water
Transport and communication
Wholesale and retail trade, eating and drinking places
Financing, insurance and real estate
Services
(Number of labor union members)
5,000 or more employees
1,000–4,999 employees
500–999 employees
300–499 employees
100–299 employees
30–99 employees
12.8
6.0
0.0
3.2
2.7
1.4
13.5
1.7
5.9
9.3
5.5
3.2
5.7
5.8
6.2
6.1

72 Labor Situation in Japan and Analysis: General Overview 2006/2007
What is Shunto?Shunto-the spring wage offensive-is a united cam-
paign by the labor unions, led by Industrial Unions. Itis launched every year between March and April, themain aim of negotiations being higher wages.Beginning in 1955, Shunto has become a platform forwage rise demands throughout Japan. By establishinga schedule for strike action and unified demands ineach industry, Shunto provided a framework that sur-passed internal individual corporate negotiations,instead creating a bargaining method whereby wageincreases could be secured throughout the entireindustry. The aim of Shunto when it was initiallylaunched was, “the realization of wage increases toput wages on a par with Europe and the US.”
The results of these negotiations did not merelyaffect the industrial sector. Their influence fanned outin the late 1950s to form what became known as the“spring wage settlement” throughout Japan as awhole, including small and medium enterprises andthe public sector. From the 1960s and the period ofrapid economic growth, the driving force behindShunto-the so-called pattern setter-was the labor-management negotiations in the steel industry, whichwas representative of the bullish manufacturing sectoras a whole. In addition, in 1964, the Japan Council ofMetalworkers’ Unions (IMF-JC) was formed as theresult of the merger of labor unions in the followingfour metals industry sectors: steel, ship-building andengineering, electric, and automobiles. This privatesector metalworkers organization took the lead in theShunto wage increase negotiations each year.
An End to Rapid Growth and a Shift inShunto Policy
The period of rapid growth came to an end withthe first oil shock in 1973. Commodity prices jumped20% bringing confusion to the market and for thefirst time in the post-war period real GDP recordednegative figures. It was in 1975 that the “theory ofeconomic conformance” first appeared in the Shunto,
which was essentially a self-imposed limit on wageincrease demands with the aim of achieving price sta-bility. Ever since, Shunto has come to be dominatedby this concept. As a result, the initial direction ofShunto’s achievement, “large scale wage increases”to realize wage that is equivalent to Europe and theUS, was abandoned and an end was brought to theera of two-digit annual wage increases.
After rapid growth ground to a halt, the “theory ofeconomic conformance” espoused by IMF-JC, whichtook the lead in negotiations resulted in inflationbeing controlled and made a significant contributionto the macro-economy and the achievement of mod-erate growth in the 4-5% range. This theory of eco-nomic conformance functioned as a kind of “socialincome distribution mechanism” built in to theJapanese economy. However, following the collapseof the bubble economy, Shunto demands, which hadbeen premised on the theory of economic confor-mance, were faced with a deflationary economy fromthe late 1990s, bringing Shunto to a second point oftransition in its history.
Shunto in the Post-bubble Era The collapse of the bubble economy resulted in
Japan falling into a recession which has becomeknown as the “lost decade.” From the latter half of the1990s deflationary tendencies intensified, and thelabor-side’s demand structure of “annual pay increas-es + commodity price increases + improvements inliving standards” at Shunto lost effectiveness, due tothe fact that they had been premised on continuouseconomic growth. The wage increase rate accordinglyslumped (see IV-7).
Entering the 21st century, Shunto found it difficulteven to maintain the so-called annual pay increases(equivalent to 2%), impacted by the long recession,permeation of performance-based pay system, thepersistent deflationary economy, and the hollowingout of industry, among other factors. From 2002 theIMF-JC ceased to make a unified request for hikes in
3 Shunto: Spring Wage Offensive

73Labor Situation in Japan and Analysis: General Overview 2006/2007
Chapter IV Labor-Management Relations
base pay, and the phenomenon of Shunto ceasing toseek wage hikes continued. Management has thusdeclared that “Shunto is dead” in that industry-widesettlements for hikes in base pay have come to anend. However, with regard to the themes of extendingemployment beyond the age of 60, and the issue ofbalancing family and career, the relevance of Shunto-
style negotiations remains. Shunto certainly have hadreceded from its use of dispute measures such asstrikes and union action, but its role will continue asbefore as a forum for negotiation and consultation onworking conditions, including the issue of wageincreases.
IV-7 Fluctuations in Revisions to Average Per Capita Wage and Rate of Revision(weighted average)
85 86 87 88 89 90 91 92 93 94 95 96 97 98 99 2000 01 02 03 04
(Yen)
(Year)
(%)
Rate of revision Amount of wage revision
0
5,000
10,000
15,000
20,000
0.0
1.0
2.0
3.0
4.0
5.0
6.0
7.0
8.0
Source: Results of Spring Wage Negotiations by major private companies, Ministry of Health, Labour and WelfareNotes: In principle up to 2003, companies surveyed are those with a capital of over 2 billions and whose labor union is comprised of over 1,000
workers, among member enterprises in the first section of Tokyo Stock Exchange or Osaka Stock Exchange (before 1979: simple average,after 1980: weighted average). Meanwhile in principle after 2004, they are those with a capital of over 1 billion and whose labor union iscomprised of over 1,000 workers (weighted average).

74 Labor Situation in Japan and Analysis: General Overview 2006/2007
Declining Collective Labor Disputes andIncreasing Individual Labor Disputes
Given the impact of the diversification of forms ofemployment due to changes in the socio-economicstructure, among other reasons, the labor unionizationrate continues to fall each year, resulting in a trendwhereby unionized dispute settlement functions areweakening and collective dispute settlements (resolu-tion of unfair labor practices and dispute reconcilia-tion) are declining.
According to the Labour Committee AnnualReport, the number of cases of unfair labor practicesresolution (opening of cases in a private sector com-pany) now number no more than 400 cases annually.In addition, the number of labor dispute reconcilia-tion cases stands at around 600 per year. Comparingthese figures with those around the time of the oilshock, we see that the former stood at around 1,000annual cases, and the latter amounted to around 2,000annual cases, clearly demonstrating the decliningtrend.
On the other hand, the diversification of forms ofemployment and the individualization of employmentmanagement this has resulted in increased individuallabor-management disputes. This phenomenon makesthe establishment of a system capable of dealing withthis changed reality an important issue in both practi-cal and policy terms.
In FY2005 the number of consultations directed tothe comprehensive labor consultation service, whichis part of the administrative system, exceeded 907,800separate enquiries (“Status of Implementation ofIndividual Labor Dispute Resolution Systems inFY2005,” Ministry of Health, Labour and Welfare,announced 25 May 2006). In addition, the number ofcases raised as standard civil actions in district courtsin 2005 stood at 2,446. (“Status of Civil/AdministrativeActions Pertaining to Labour Disputes in FY2005,”Administrative Bureau, General Secretariat, SupremeCourt of Japan, 2006, p. 108 onwards of Vol. 58 Issue 8of Lawyer Association Journal).
Individual Labor Dispute ResolutionSystem
In the legal system relating to the resolution ofindividual labor disputes, there are a number ofmeans of resolution through administrative structuresand also through judicial structures. (1) Administrative Structures
The administrative structure pertaining to individ-ual labor dispute resolution is based on the Act onPromoting the Resolution of Individual LabourDisputes, which was enacted in 2001. This act is sig-nificant in that it provides for integrated, systemized,cooperative measures in resolving disputes, includingmeasures to lead to resolution of disputes by coopera-tion among the various administrative organizations,centered on the prefecture labour bureaus, as well asthe establishment of a “one-stop consultation service”on labor issues in general. In addition, disputes thatare the subject to resolution efforts cover a widerange of grievances and issues, comprising the initia-tion of employment, carrying out of work, and termi-nation of employment, as well as issues of discrimi-nation or dismissal (including dismissal due torestructuring and dismissal of fixed-term contractworkers) such as issues at time of hiring, reversal ofinformal decision of employment, job location trans-fer, temporary transfer, permanent transfer, change inworking conditions, and sexual harassment in theworkplace. This system can therefore be seen to havehigh potential for utilization.
The individual dispute resolution system set outby the above-mentioned act, can be said in simpleterms to provide a three-step system to resolution,namely “information provision and consultation” atthe consultation service, followed by “advice andguidance” by the head of the labour bureau in ques-tion in the case that an independent resolution cannotbe achieved between the labor and managementcounterparts, and finally “conciliation” by theDispute Reconciliation Council (see IV-8).
In FY2005 the operational status of the dispute
4 Individual Labor-Management Dispute Settlement

75Labor Situation in Japan and Analysis: General Overview 2006/2007
Chapter IV Labor-Management Relations
resolution system was as follows: Consultation: The number of consultations
amount to approximately 907,800 cases, representinga 10.2% increase on the previous year. Of these, thenumber of consultations regarding individual civillabor disputes (including dismissal not related to con-travention of labour Acts, and lowering of workingconditions) amounted to 176,000 cases, a year-on-year increase of 10.2% (see IV-9). The further break-down of these individual civil labor disputes showsthat the most common consultation was in regard to
“dismissal” at 26.1%, followed by “lowering ofworking conditions” at 14%, “bullying or harassment”at 8.9% and “inducement toward retirement” at 7.2%(the breakdowns for the Guidance and Advice, andConciliation categories was very similar) (see IV-10).
Guidance and Advice: the number of casesreceived that requested guidance or advice from thehead of prefectural labour bureaus amounted to6,369, a 20.5% year-on-year increase. In terms of thescale of the company from which the application foradvice or guidance were made, 32.5% were from
IV-8 Flowchart for Dispute Settlement According to the Act on Promoting theResolution of Individual Labor Disputes
Source: Status of Implementation of Individual Labor Dispute Resolution Systems in FY2005, 25 May 2006 Ministry of Health, Labour and Welfare
Worker Dispute
General Labor Consultation Corner
Case for dispute settlement support
One-stop service for consultation onlabor-related issues and provision of information
Independent in-company resolution
Employer
Labour Standards Inspection Office, PublicEmployment Security Office, Equal Employment Bureau
Guidance and Monitoringin response to contraventions of the Act
DisputeConciliation Committee
Provision of proposalby conciliator
(with experience as academic)
Guidance and adviceby head of prefectural
labour bureau
Consultation availableat prefectural offices(central labour relationsoffice, labour committee,etc.) and atlabor-management-relatedorganizations
Prefectural Labour Bureau
Company
Cooperation

76 Labor Situation in Japan and Analysis: General Overview 2006/2007
companies with 10 to 49 employees, 23.9% werefrom companies with less than 10 employees, and10.4% were from companies with 100 to 299employees. In addition, the proportion of applications
received from workers of companies at which therewas no labor union amounted to 70.4% (the sametrends were witnessed in the Conciliation category).
Of the applications received, 6,345 cases had been
IV-9 Number of Consultations (FY2005)
Source: Status of Implementation of Individual Labour Dispute Resolution Systems in FY2005, 25 May 2006, Ministry of Health, Labour and WelfareNote: The number of cases for FY2001 is for the latter half only (1 October 2001 to 31 March 2002).
FY2001* FY2002 FY2003 FY2005FY2004
41,264
103,194
140,822
734,257
625,572
251,545
160,166
823,664176,429
907,869
Nu
mb
er o
f In
div
idu
al C
ivil
Lab
or
Dis
pu
te C
on
sult
atio
ns
Ove
rall
Nu
mb
er o
f La
bo
r-re
late
d C
on
sult
atio
ns
Number of Individual Civil Labor Dispute Consultations
Overall Number of Labor-related Consultations
0
100,000
200,000
300,000
400,000
500,000
600,000
700,000
800,000
900,000
1,000,000
30,000
60,000
90,000
120,000
150,000
180,000
210,000
IV-10 Breakdown of Civil Consultation Cases (FY2005)
Source: Status of Implementation of Individual Labour Dispute Resolution Systems in FY2005, 25 May 2006, Ministry of Health, Labour and Welfare
Sexualharassment:
2.3%
Recruitment/hiring: 1.5%
Employmentmanagement, etc.:
1.7%
Bullying orharassment:
8.9%
Others:14.1%
Women-relatedlabor problems:
1.2%
Inducement toward retirement
7.2%Transfer or job location
3.4%
Other workingconditions:
19.6%
Dismissal:26.1%
Lowering of working
conditions:14.0%

77Labor Situation in Japan and Analysis: General Overview 2006/2007
Chapter IV Labor-Management Relations
processed by March 2006, and 6,011 cases resulted inguidance or advice being provided (94.3%). 95.6% ofall cases were dealt with within the period of one cal-endar month.
Conciliation: the number of cases received thatrequested conciliation amounted to 6,888, a 14.5%year-on-year increase.
Of the applications for conciliation received,6,856 have been processed, with 2,961 cases (43.2%)resulting in agreement between the parties, 450 cases(6.6%) being withdrawn, and 3,406 cases (49.7%)resulting in conciliation being broken off due to thenon-participation of one or the other of the parties indispute. The time required for conciliation was lessthan one calendar month in 63.5% of cases and one totwo calendar months for 27.9% of cases. (2) Judicial Structures
Resolution by use of judicial structures is natural-ly conducted through recourse to action in courts, andthe number of labor-related law suits brought eachyear is continuing to increase. In 2005, 2,446 labor-related standard civil lawsuits were brought to districtcourts in Japan, of which 2,303 cases were in theform of employee as plaintiff and employer as defen-dant. Of these 2,303 cases, the most frequent casesconcerned claimed regarding wages at 1,437 cases,following by claims for determinations on continua-tion/discontinuation of employment contracts at 507cases, and claims for damages at 236 cases, amongothers.
On the other hand, in 2005 district courts in Japanhanded down a ruling in 2,365 cases, with the aver-age time for deliberations being 11.2 months. 786cases (33.2%) were concluded in less than sixmonths, 699 cases (29.6%) were concluded within
one year, and 708 cases (29.9%) were concluded inless than two years. Approximately 93% of all casestake no longer than two years to conclude. Over thepast five years the time required for deliberation hasbeen gradually reducing.
With regard to dispute resolution as describedabove in the standard civil proceedings, a labor tri-bunal system is in force and is operated under thestipulations of the Labor Tribunal Act. The labor tri-bunal system framework can be described thus (seeIV-11).
The labor tribunal system is aimed at disputesconcerning legal obligations in individual labor cases(individual labor-related civil disputes), and in con-trast to a standard civil lawsuit, procedures for dis-pute resolution are accelerated by the existence of thetribunal panel composed of a judge (labor tribunaljudge) and labor-management experts (labor tribunallay members). This tribunal panel attempts to arriveat a settlement, yet if no settlement can be reached,then the by mediation hands down a ruling (in principle,it is concluded in within three session). Furthermoreif there is any objection to the decision, then proceed-ings automatically transfer to become a standard civillawsuit.
This system can be expected to accelerate theprocess of dispute resolution and ensure justifiablesatisfaction among disputing parties, in addition tothe fact that it promotes consensus-oriented resolu-tion among the dispute parties based on mutual con-cessions. On the other hand, it will be necessary towatch with great care to see if the system lives up tothese expectations and can be operated in this man-ner.

78 Labor Situation in Japan and Analysis: General Overview 2006/2007
IV-11 Overview of the Labor Tribunal System
Source: The Prime Minister of Japan and his Cabinet website
Objectives of theLabor Tribunal System
- Response to increasing number of individual labor-related cases and incidents - Promotion of expedited and appropriate dispute resolution utilizing specialized knowledge and experience of labor-related issues
One judge (labor tribunal judge) and twolabor-management experts (labor tribunallay members) deliberate on dispute settlement in the Labor Tribunal Panel
In principle deliberations are expedited to takeplace on no more than three session
First session date
Second session date
Third session date
Dispute arises
District Court
Worker
Lay member Lay memberJudge
Employer
Application
MediationConclusion of
mediation
Dispute settlement
Submission of objection(s)(within two weeks) (Labor Tribunal enforced)
In the event the case is notappropriate to be judgedby Labor Tribunal byits nature
Transfer to lawsuit litigation - Construed as appeal
and filing of suit
Completedwithout recourse
to LaborTribunal
Labor Tribunal

80 Labor Situation in Japan and Analysis: General Overview 2006/2007
The Japanese Government implements employ-ment policies to respond to changes in economic andsocial conditions. High priority is assigned to mea-sures designed to provide employment opportunities,prevent unemployment, and facilitate re-employmentso that all workers can make maximal use of theirabilities.
As an indicator of the direction of mid-termemployment policies, in August 1999 the Cabinetapproved the “Ninth Project for the Stabilization ofEmployment and Creation of New EmploymentOpportunities,” which will remain in effect until2009. To respond accurately to structural changes inthe labor market, the goals of the project are to stabi-lize employment and create new employment oppor-tunities while motivating workers and enabling themto make effective use of their skills. To achieve thosegoals, a concerted effort will be made to promote thefollowing comprehensive measures:(1) Stabilization of employment and the creation of
new jobs in accurate response to changes in eco-nomic and industrial structures.
(2) Along with the upgrading of workers’ skills, pro-moting human resource training to supportsocioeconomic development.
(3) Aiming for the realization of a society in whichpeople can make the most of their ambition andabilities.
(4) Developing employment policies from a globalperspective.
The Labor Situation 2005The employment and unemployment situation for
2005 was boosted by the news in December that thejobs-to-applicants ratio exceeded 1.03 for the first
time in 13 years and three months since September1992. The annual average for 2005 also rose by 0.12points to stand at 0.95, in addition to which the over-all unemployment rate in December fell to 4.4%, withthe annual average marking a 0.3 percentage pointdecrease to rest also at 4.4%. This would suggest thatthe results of economic recovery and the effect ofemployment measures are bringing about improve-ments in the employment situation, although somedifficulties still exist.
However, looking at the employment situation byregion, although improvements were registered in allregions in the jobs-to-applicants ratio and total unem-ployment rate from 2004 to 2005, regional disparitiesin employment still remain. For example, there wereregions in which the jobs-to-applicants ratio exceeded1.0 and total unemployment stood between 3.0 to3.5% (in the Tokai region, the average figures for2005 were 1.41 and 3.2%, respectively, and forHokuriku 1.06 and 3.3%). On the other hand, therewere also regions where the jobs-to-applicants ratiostood between 0.5 and 0.6 and the unemployment ratewas over 5% (in Hokkaido these figures were 0.57and 5.3% respectively, for Kyushu they stood at 0.67and 5.3% and in Tohoku at 0.68 and 5.0%)
Looking at employment by age in 2005, the jobs-to-applicants ratio for the 15 to 24 year age bracketrose for the first time since 2002 (1.46) to 1.49, andthe total unemployment rate for this age bracketdecreased year-on-year by 0.8 percentage points to8.7%, the first time since 1998 (7.7%) it has droppedbelow 9%. However, given that the average unem-ployment rate for all ages stood at 4.4%, this high fig-ure would suggest that employment mismatches con-tinue to persist at a high level.
Chapter V Labor Administrationand Legislation
1 Employment Measures and Relief for the Unemployed

81Labor Situation in Japan and Analysis: General Overview 2006/2007
Chapter V Labor Administration and Legislation
In addition, the jobs-to-applicants ratio for regularemployees in December 2005 stood at 0.65 (primaryfigure), which, although a year-on-year increase of0.07, still compares unfavorably to the overall jobs-to-applicants ratio (1.03).
Given these circumstances, the government hasformulated the following measures:(1) Enhancement of support measures for local
employment creation, based on the concept ofregions where employment disparities existengaging in self-help measures. Priority will beplaced on regions where improvements in theemployment situation are late in appearing andsupport will be implemented through selection bycontest to municipalities which are engaging inprojects that have a high employment creationeffect, among other efforts.
(2) In order to ensure to reverse the trend where thenumber of freeters (persons not in fixed or perma-nent unemployment) is increasing, in addition topromoting Regular Employment Plan for 250,000Freeters efforts will also be made to provide spe-cialized consultation services to young people, byexpanding the “Wakamono Jiritsu Juku” (schoolof independence for youth) scheme which aims toenhance the desire and ability to work in youngpeople, including those not in education, employ-ment or training (NEETs). This will be furthersupplemented by the establishment of RegionalYouth Support Stations which will form the coreof a regional young persons support network, thecreation of a structure to provide counseling ser-vices by trained personnel at the PublicEmployment Security Offices nationwide, and the
setting up of Internship Combined VocationalTraining.
(3) Revise and enhance services provided at thePublic Employment Security Offices, includingthe provision of individualized services respond-ing to need, such as a service aimed at personsspecifically seeking employment as regularemployees, etc.
(4) Improve employment promotion measures aimedat the elderly, including the smooth enactment ofthe revised Elderly Persons Employment SecurityLaw towards the creation of an environment inwhich anyone, at any age can continue to con-tribute to society, and can continue, if they sodesire and are able to do so, until they reach atleast the age when they become eligible for pen-sion benefits.
(5) Promotion of measures to promote employmentof persons with disabilities, including enhance-ment of guidance to companies which have yet tocomply the employment rate of persons with dis-abilities and the provision of comprehensive jobconsultation, etc.
It was also in 2005 that the total population ofJapan started to decline. In an environment in whichthe working population is therefore declining, inorder to ameliorate this decline and maintain and pro-mote a vibrant society and economy, it will be impor-tant to ensure that all people with the desire and capa-bility to do so can become supporters of society. Tothat end, measures to enhance the employment envi-ronment for the young, women and the elderly willcontinue to be advanced.

82 Labor Situation in Japan and Analysis: General Overview 2006/2007
Measures for Elderly WorkersThe rapid aging of Japan’s population is a phe-
nomenon as yet unobserved anywhere else in theworld. And also in 2007, the baby boom generationwill be entering its sixth decade. In terms of totalpopulation, approximately one person in three will beover 60 years of age, while in the labor force thatratio will be approximately one person in six (2015).To maintain socioeconomic vitality under these cir-cumstances, it will be necessary for as may elderly aspossible to take an active part in supporting societyand the economy. To realize this in the future, weneed to create a society in which motivated and ablepersons can continue to work, regardless of age.
Recognizing the above situation, in 2004 the gov-ernment revised the Elderly Persons EmploymentSecurity Act, to ensure employment opportunitiesuntil 65 years of age, and to promote reemploymentfor the middle-aged and older working population,among other measures.
The revised Elderly Persons Employment SecurityAct aims to ensure stable employment opportunitiesfor elderly persons by obligating employers to ensureemployment opportunities to 65 through one of thefollowing: raising retirement age; introducing a struc-ture for continued employment; or abolishing retire-ment age. In addition, the Law aims to enhance mea-sures to promote reemployment for middle-aged andolder workers (45 to 65), and enhance measures toensure temporary or short-term employment opportu-nities for retirees and other persons.
The revisions to the Act concerning promotion ofreemployment for middle-aged and older workers andsecuring of employment opportunities up to the ageof 65 went into effect from December 1, 2004 andApril 1, 2006, respectively.
In accordance with the passage of the revised Act,from FY2005, the following measures for promotingemployment in the elderly population have been pri-oritized.
Securing Employment for Persons Up toAge 65 to Benefit from Their Knowledgeand Experience
Looking towards the smooth enactment of theAct, aid and guidance is being provided to employersby public employment security offices, which areengaged in awareness-raising activities.
From FY2005, in order to promote employment forpersons up to age 65, the Project for the Employmentof Older Persons Up to the Age of 65 has been imple-mented, which offers advice and guidance throughbusiness owners’ associations concerning revisions towage and personnel systems and the promotion ofcontinuous employment structures.
In addition subsidies are being provided to pro-mote the adoption of continuous employment prac-tices, aimed at employers who have raised theirretirement age, and introduced a system of continu-ous employment.
Assisting and Promoting theReemployment of Middle-Aged andOlder Workers
In order to promote the reemployment of middle-aged and older workers, guidance and awareness-rais-ing activities are being provided, mainly at publicemployment security offices, concerning career con-sultations for middle-aged and older workers, jobintroduction and searching for candidates, and relax-ing age restrictions for candidates.
In addition to guidance for the compilation of ajob-seekers’ manual being provided to business own-ers, they are also being provided with consultationservices and assistance for the establishment of reem-ployment support measures, and subsidies are beingprovided to those who have already put such mea-sures in place.
Regarding the reemployment of middle-agedworkers, such as the heads of households, for whomreemployment is particularly urgent, reemploymentsupport has been implemented in the form of active
2 Policies Designed to Secure Employment for Older and Disabled Workers
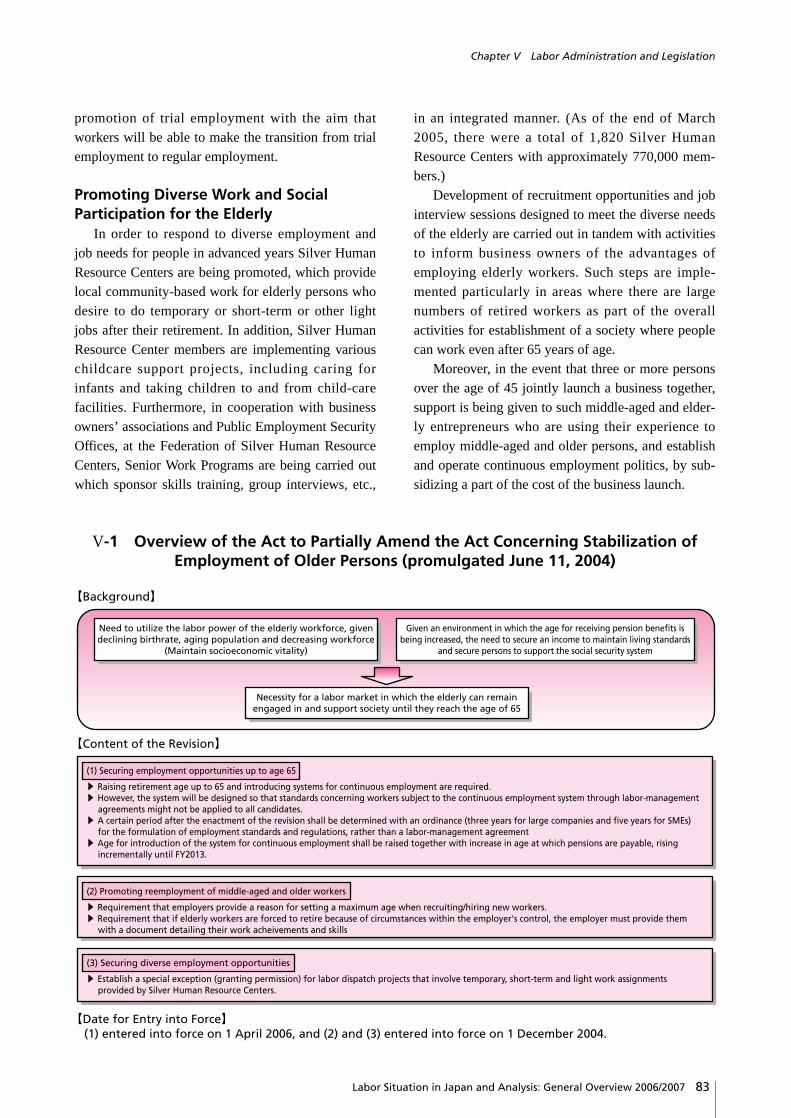
83Labor Situation in Japan and Analysis: General Overview 2006/2007
Chapter V Labor Administration and Legislation
promotion of trial employment with the aim thatworkers will be able to make the transition from trialemployment to regular employment.
Promoting Diverse Work and SocialParticipation for the Elderly
In order to respond to diverse employment andjob needs for people in advanced years Silver HumanResource Centers are being promoted, which providelocal community-based work for elderly persons whodesire to do temporary or short-term or other lightjobs after their retirement. In addition, Silver HumanResource Center members are implementing variouschildcare support projects, including caring forinfants and taking children to and from child-carefacilities. Furthermore, in cooperation with businessowners’ associations and Public Employment SecurityOffices, at the Federation of Silver Human ResourceCenters, Senior Work Programs are being carried outwhich sponsor skills training, group interviews, etc.,
in an integrated manner. (As of the end of March2005, there were a total of 1,820 Silver HumanResource Centers with approximately 770,000 mem-bers.)
Development of recruitment opportunities and jobinterview sessions designed to meet the diverse needsof the elderly are carried out in tandem with activitiesto inform business owners of the advantages ofemploying elderly workers. Such steps are imple-mented particularly in areas where there are largenumbers of retired workers as part of the overallactivities for establishment of a society where peoplecan work even after 65 years of age.
Moreover, in the event that three or more personsover the age of 45 jointly launch a business together,support is being given to such middle-aged and elder-ly entrepreneurs who are using their experience toemploy middle-aged and older persons, and establishand operate continuous employment politics, by sub-sidizing a part of the cost of the business launch.
V-1 Overview of the Act to Partially Amend the Act Concerning Stabilization ofEmployment of Older Persons (promulgated June 11, 2004)
Need to utilize the labor power of the elderly workforce, given declining birthrate, aging population and decreasing workforce
(Maintain socioeconomic vitality)
Necessity for a labor market in which the elderly can remain engaged in and support society until they reach the age of 65
Given an environment in which the age for receiving pension benefits is being increased, the need to secure an income to maintain living standards
and secure persons to support the social security system
【Background】
(1) Securing employment opportunities up to age 65
s Raising retirement age up to 65 and introducing systems for continuous employment are required.s However, the system will be designed so that standards concerning workers subject to the continuous employment system through labor-management
agreements might not be applied to all candidates.s A certain period after the enactment of the revision shall be determined with an ordinance (three years for large companies and five years for SMEs)
for the formulation of employment standards and regulations, rather than a labor-management agreements Age for introduction of the system for continuous employment shall be raised together with increase in age at which pensions are payable, rising
incrementally until FY2013.
(2) Promoting reemployment of middle-aged and older workers
s Requirement that employers provide a reason for setting a maximum age when recruiting/hiring new workers.s Requirement that if elderly workers are forced to retire because of circumstances within the employer's control, the employer must provide them
with a document detailing their work acheivements and skills
(3) Securing diverse employment opportunities
s Establish a special exception (granting permission) for labor dispatch projects that involve temporary, short-term and light work assignments provided by Silver Human Resource Centers.
【Content of the Revision】
【Date for Entry into Force】 (1) entered into force on 1 April 2006, and (2) and (3) entered into force on 1 December 2004.
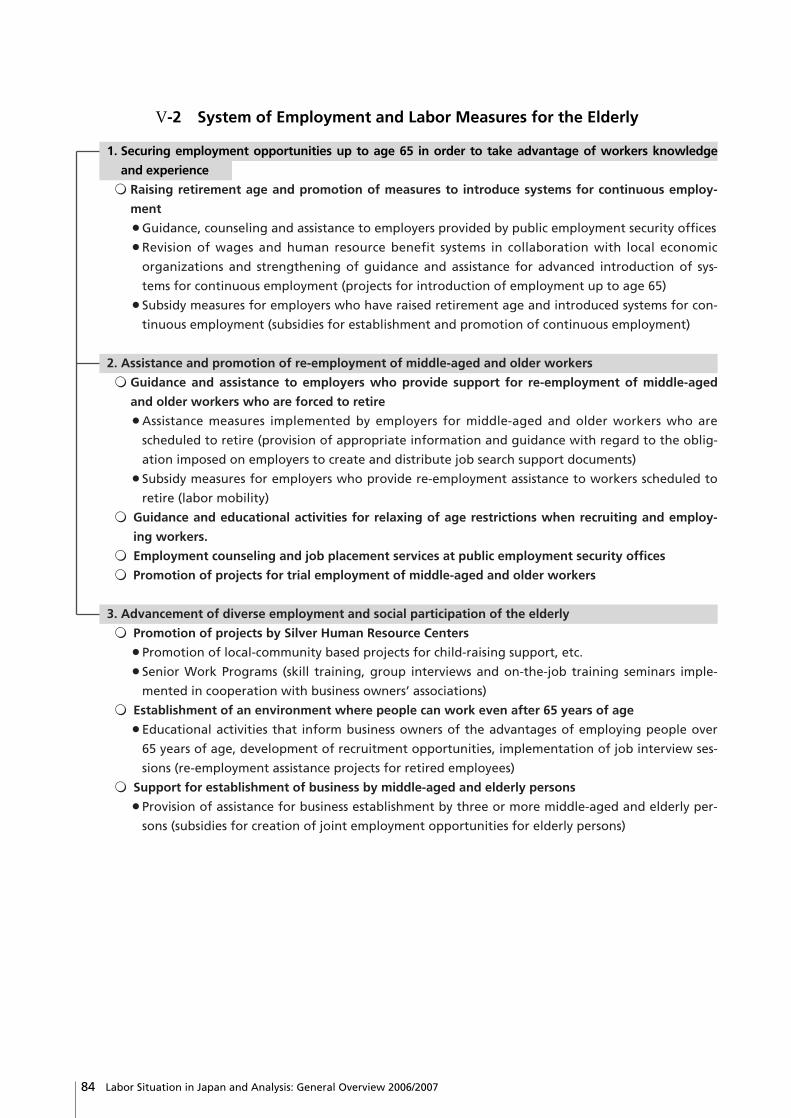
84 Labor Situation in Japan and Analysis: General Overview 2006/2007
V-2 System of Employment and Labor Measures for the Elderly
1. Securing employment opportunities up to age 65 in order to take advantage of workers knowledge
and experience
£ Raising retirement age and promotion of measures to introduce systems for continuous employ-
ment
¡Guidance, counseling and assistance to employers provided by public employment security offices
¡Revision of wages and human resource benefit systems in collaboration with local economic
organizations and strengthening of guidance and assistance for advanced introduction of sys-
tems for continuous employment (projects for introduction of employment up to age 65)
¡Subsidy measures for employers who have raised retirement age and introduced systems for con-
tinuous employment (subsidies for establishment and promotion of continuous employment)
2. Assistance and promotion of re-employment of middle-aged and older workers
£ Guidance and assistance to employers who provide support for re-employment of middle-aged
and older workers who are forced to retire
¡Assistance measures implemented by employers for middle-aged and older workers who are
scheduled to retire (provision of appropriate information and guidance with regard to the oblig-
ation imposed on employers to create and distribute job search support documents)
¡Subsidy measures for employers who provide re-employment assistance to workers scheduled to
retire (labor mobility)
£ Guidance and educational activities for relaxing of age restrictions when recruiting and employ-
ing workers.
£ Employment counseling and job placement services at public employment security offices
£ Promotion of projects for trial employment of middle-aged and older workers
3. Advancement of diverse employment and social participation of the elderly
£ Promotion of projects by Silver Human Resource Centers
¡Promotion of local-community based projects for child-raising support, etc.
¡Senior Work Programs (skill training, group interviews and on-the-job training seminars imple-
mented in cooperation with business owners’ associations)
£ Establishment of an environment where people can work even after 65 years of age
¡Educational activities that inform business owners of the advantages of employing people over
65 years of age, development of recruitment opportunities, implementation of job interview ses-
sions (re-employment assistance projects for retired employees)
£ Support for establishment of business by middle-aged and elderly persons
¡Provision of assistance for business establishment by three or more middle-aged and elderly per-
sons (subsidies for creation of joint employment opportunities for elderly persons)

85Labor Situation in Japan and Analysis: General Overview 2006/2007
Chapter V Labor Administration and Legislation
Employment Measures for Persons withDisabilities
Of the policies designed to support persons withdisabilities, the following deal with support foremployment measures: the Basic Programme forPersons with Disabilities (FY2003 to FY2012) wasformulated in December 2002 and provides a basicdirection for measures for disabled persons over aten-year period. Based on that Programme the gov-ernment has also formulated the Five-Year Plan forImplementation of Priority Measures (FY2003 toFY2007) which incorporates specific priority mea-sures. In addition the Ministry of Health, Labour andWelfare formulated in March 2003 the FundamentalPolicy for Employment Measures for DisabledPersons (FY2003 to FY2007). Specifically, the goalin the Five-Year Plan for Implementation of PriorityMeasures is to “aim to increase the number of per-sons with disabilities who can find jobs throughPublic Employment Security Office to 30,000 in onefiscal year by fiscal year of 2007, and the number ofpersons with disabilities who are hired as noted in theemployment survey of persons with disabilities of fis-cal year of 2008 to 600,000 through promotion oftrial hiring, job coaches, and various grants andimplementation of job training.” Towards the achieve-ment of this goal employment measures for personswith disabilities are being actively advanced.Furthermore, in FY2005, the Act for EmploymentPromotion, etc., of the Disabled was partially revisedand this revision is being smoothly implementedfrom April 2006 in line with the Act for Promotion ofthe Independence of Persons with Disabilifies (seeendnote).
Employment Quota System for DisabledPersons and Levy and Grant System forEmploying Persons with Disabilities
The Act for Employment Promotion, etc. of theDisabled stipulates that quotas be established for thehiring of the physically and or intellectually disabled,specifying the percentage of a company’s workforceto be occupied by persons with disabilities. Businessowners are required to hire persons with disabilitiesin numbers equivalent to or greater than the legallymandated quota.
From April 2006, pursuant to the amended Act,persons with mental disabilities (those holding aHealth Welfare Handbook for Persons with MentalDisabilities) are included in the employment quotasof companies.
The current legal employment quotas are:¡ Private corporations: 1.8%¡ Special government corporations: 2.1%¡ National and local public corporations: 2.1%¡ Designated school boards: 2.0%Public Employment Security Offices promote the
employment of persons with disabilities by directingthe following to submit a hiring plan: (1) businessowners whose hiring practices fall significantly belowthe quota, (2) business owners who need to meet thequota by hiring a large number of persons with dis-abilities, and (3) business owners in the private sectorwho plan to hire a large number of workers in thefuture. A warning is issued to any business ownerwho does not implement a submitted plan.
The Levy and Grant System for EmployingPersons with Disabilities was established to ease theeconomic burden on business owners who hire per-sons with disabilities, and to increase job opportuni-ties for the disabled. Levies are collected from com-panies that fail to fulfill the employment quota, anddistributed as bonuses to companies that employmore physically or intellectually disabled personsthan the quota. A number of grants are also awardedto encourage the hiring of the disabled. By informingbusiness owners of these requirements and dispensinggrants, we seek to stabilize employment of personswith disabilities and maximize their employmentopportunities.
Future Direction of Measures for theEmployment of Disabled Workers
The number of disabled persons finding workthrough the Public Employment Security Offices hasexceeded 38,000, recording growth for three consecu-tive years, and steady growth is also being seen in theprivate sector real employment rate which increased0.03 percentage points to 1.49%. However, the num-ber of disabled persons seeking work remains high at150,000 people and given that only around 40% of

86 Labor Situation in Japan and Analysis: General Overview 2006/2007
V-3 System of Employment Measures for Persons with Disabilities
(1) Guidance and assistance for business owners
£ Employment quota system for disabled persons・ Stipulated employment rate
Private enterprise: General—1.8%, Special government corporations—2.1%National, Local government: 2.1% (selected school boards—2.0%)・ Guidance in fulfilling quotas through order to prepare “A Plan for Hiring Disabled
Persons” £ Support, etc. for employers through the system of levy and grant system for
employing persons with disabilities.・ Adjustment of the imbalance of economic burden between employers by levy and
grant system for employing persons with disabilities・ Support for employers who improve facilities, equipment and so on for disabled
employees; assign assistants; give consideration toward housing and transportation; and continue to employ persons who become disabled while on the job・ Assistance in paying wages through bounty for the employment development for
specified job applicants £ Establishment of a system to support working at home by persons with disabilities・ Payment of special allowance to business owners who outsource jobs to persons with
disabilities working at home£ Provision of expertise regarding employment for persons with disabilities・ Provision of positive examples and employment administration expertise regarding
employment for persons with disabilities
(2) Implementation of occupational rehabilitation based on the characteristics of each persons with disabilities
£ Offer of advice, referrals, and guidance for adaptation to the workplace according to the needs of persons with disabilities, at Public Employment Security Offices
£ Provision of specialized occupational rehabilitation services to persons with disabilities (e.g. performance evaluations) at vocational centers for persons with disabilities (operated by the Japan Organization for Employment of the Elderly and Persons with Disabilities)・ Personal support by Job Coaches for adjustment in the workplace
(3) Education related to employment of persons with disabilities
£ Creation of an opportunity for enterprises to employ persons with disabilities through trial employment
£ Institution of a promotional month for the employment of persons with disabilities
£ Cooperation with the disabled groups in public information and education activities
Basic Plan for Persons with Disabilities and Five-Year Plan for Implementation of Priority Measures
The Fundamental Policy for Employment Measures for Disabled Persons
Comprehensive Promotion of Employment Measures for Persons with Disabilities
Comprehensive promotion of employment measures for disabled persons, aiming at the realization of a society in which persons with disabilities and persons without can participate similarly in their places of employment, according to ability and aptitude.
£ Enhancement and strengthening of support through linking employment with welfare・ Advancing a shift from welfare-type jobs in local communities to ordinary employment・ Promotion of integrated employment and lifestyle support
£ Promotion of development of diversified and effective vocational capabilities・ Promotion of vocational training at schools for development of vocational capabilities
of persons with disabilities・ Vocational training outsourced to various private institutions and other entities in local
communities

87Labor Situation in Japan and Analysis: General Overview 2006/2007
Chapter V Labor Administration and Legislation
V-4 Employment Situation for Disabled Persons at Private EnterpriseFluctuations in the employment rate and the disabled workers
Source: Reports on Employment Situation for Disabled Persons, Ministry of Health, Labour and WelfareNotes: Figures for companies with employment obligations (those with more than 56 regular employees):are collective.
The collective totals are for the following disabled categories:・to 1987 Physically disabled persons (double count for those with severe physical disabilities)・1988 to 1992 Physically disabled persons (double count for those with severe physical disabilities)
Persons with intellectual disabilities・From 1993 Physically disabled persons (double count for those with severe physical disabilities)
Persons with intellectual disabilities (double count for those with severe disability)Severely physically disabled persons as short-term workersSeverely intellectually disabled persons as short-term workers
Rea
l Em
plo
ymen
t R
ate
85 86 87 88 89 90 91 92 93 94 95 96 97 98 99 2000 2001 2002
172187 195
204215
230241 245 247 248 250 251 255 253
168 170
1.49
253 246
1.49 1.491.47
2003
247
1.48
2004 2005
258
1.46
269
1.491.481.471.471.451.44
1.41
1.361.321.321.321.31
1.251.261.26
Real employment rate
Number of disabled workers
1.0
1.1
1.2
1.3
1.4
1.5
(%)
(Year)
Dis
able
d W
ork
ers
100
150
200
250
300
350
(1,000 persons)
Apr. 1988 Jul. 1998Legal employment rate
Oct. 1976 onwards1.5% 1.6% 1.8%
companies achieve their employment quotas for per-sons with disabilities, there is much room for contin-ued improvement.
In FY2005, given the advancing participation insociety of disabled persons and in order to promoteindependence in working lives for disabled personsgiven the heightened desire among disabled personsto seek work, the Act for Employment Promotion,etc., of the Disabled was revised. The revision makesthe following changes to the Act: (1) strengthening ofemployment measures for persons with mental dis-
abilities through including persons with mental dis-abilities (those holding a Health and WelfareHandbook for Persons with Mental Disabilities) inthe employment quota of companies, (2) employmentopportunities for disabled persons are expandedthrough support for working from home, and (3) rein-forcing of cooperation with welfare policies. Basedon this revision the government aims to expandemployment opportunities for disabled persons inorder to support those who are already working andthose who seek to work.

88 Labor Situation in Japan and Analysis: General Overview 2006/2007
V-5 Situation of Employment Placement of Persons with Disabilities at PublicEmployment Security Offices
V-6 Changes in the Number of Employment Cases and of New Applications for Employment
Source: Employment Security Services Statistics, Ministry of Health, Labour and Welfare
0
10,000
20,000
30,000
40,000
50,000
60,000
70,000
80,000
90,000
100,000
Number of new applications for employment
Annual changes
Number of employment cases
2005200420032002200120001999199819971996
74,101
28,216
3.1
28,325 25,653 26,446 28,361 27,072 28,35432,885 35,871 38,882
0.4
▲9.4
3.17.2
▲4.5
4.7 16.09.1 8.4
77,025 78,489 76,432 77,61283,557
85,996 88,27293,102
97,626100
80
60
40
20
0
Year-over-year comparison ofnumber of employment cases
(%)
Year
Number of newapplications for
employment
YoY YoY YoY YoY
Number of validapplicants foremployment
Number ofemployment cases
Employment rate
1998 78,489 1.9 115,848 12.8 25,653 △9.4 32.7 △4.1
1999 76,432 △2.6 126,254 9.0 26,446 3.1 34.6 1.9
2000 77,612 1.5 131,957 4.5 28,361 7.2 36.5 1.9
2001 83,557 7.7 143,777 9.0 27,072 △4.5 32.4 △4.1
2002 85,996 2.9 155,180 7.9 28,354 4.7 33.0 0.6
2003 88,272 2.6 153,544 △1.1 32,885 16.0 37.3 4.3
2004 93,182 5.6 153,984 0.3 35,871 9.1 38.5 1.2
2005 97,626 4.8 146,679 △4.7 38,882 8.4 39.8 1.3
(Persons, %, % points)
Source: Employment Security Services Statistics, Ministry of Health, Labour and Welfare

89Labor Situation in Japan and Analysis: General Overview 2006/2007
Chapter V Labor Administration and Legislation
Against the backdrop of changes such as in theperception of the youth as regards work, as well asthe changing personnel needs of corporations, thecurrent employment environment surrounding theyouth stands in a severe condition: While the unem-ployment rate is rising at the high rate of 8.7% (in2005), at the same time the numbers continue to riseas compared to before for job hopping part-timeworker-“freeters” who do not work as full-timeemployees but engaged instead in employment mod-els such as part-time work and for people not in edu-cation, employment or training-numbering respec-tively at 2.01 million and 640,000 (in 2005). In addi-tion to the obvious influence that the continued exis-tence of this situation will have by causing a hin-drance for young people themselves in accumulatingoccupational skills, it also holds major repercussionsfor the economy and social security of Japan in thefuture. Due to this, there is a need to swiftly under-take measures to meet the situation.
Strengthening and Promotion of theYouth Independence and Challenge Plan
Taking into account the present scenario of a risein the number of freeters and young people who arenot employed or are between jobs, the YouthIndependence and Challenge Plan was formulated inJune 2003, at the Strategy Council to Foster a Spiritof Independence and Challenge in Youth that com-prises all concerned ministers. The objective of thiswas to stimulate the desire for working amongst theyouth, while at the same time to also reverse thetrend of the rise in the number of unemployed youthby promoting the occupational independence of allmotivated young people.
The Action Plan for Youth Independence andChallenge was compiled in December 2004 in orderto raise the effectiveness and efficiency of this plan.Based on this, the government has been collaboratingclosely with the Cabinet Office and relevant min-istries and is in the process of promoting comprehen-
sive measures to raise both the motivation to work aswell as the capabilities of the youth.
Specifically, the government is involved in the fol-lowing types of initiatives:(1) Commissioning the organizing, etc. of seminars
for employment and introducing work opportuni-ties through collaborative effort with the PublicEmployment Security Offices at the One-StopService Centers for Youth (usually referred to asJob Cafés) that are set up through the proactiveinitiatives undertaken by the different local gov-ernments.
(2) In order to support job attainment of unemployedyouth, etc., starting especially with those withinadequate work experience, expertise or knowl-edge such as freeters or school/university gradu-ates with no employment, the government isinvolved in trying to lessen the gap between thestandards of abilities that are demanded by com-panies and the present conditions of the youththrough the means of short-term trial employ-ment, and, while ascertaining the aptitude andwhether or not that work can be followed through,is implementing the Trial Employment Project forYouth to encourage a shift to regular employmentafter the completion of the trial employment.
(3) Implementation of Japanese-style dual system ofeducation that links on-the-job experiential train-ing and classroom education.
(4) Implementation of “Wakamono Jiritsu Juku”(school of independence for youth) that targetsNEET and other youths to evoke and improvetheir confidence and motivation to work through atraining camp involving vocational training, workexperience, etc.
(5) Regarding the employment problem of the youth,the government is promoting a NationalCampaign to lncrease Young People’s HumanCapabilities where the economic world, labor cir-cles, education world, mass media, local commu-
3 Employment Measures for the Youth
90 Labor Situation in Japan and Analysis: General Overview 2006/2007
nities, government, etc. come together to endeavorwith the purpose of raising the interest of all thevarious segments of the society regarding theproblem, to infuse a sense of significance to theyouth regarding work and to raise their capabili-ties and motivation to work.
In addition to this, taking into account the situa-tion wherein the number of freeters was increasing byapproximately 100,000 every year, in May 2005 thegovernment set the target to shift 200,000 freeterseach year to regular employment, and has developedthe Plan to Find Permanent Employment for 200,000Freeters with the purpose of promoting all theemployment support measures to maximum effective-ness. In FY2006, the target figure of the plan forshifting freeters to regular employment was raisedfrom 200,000 to 250,000 based on the Action Planfor Youth Independence and Challenge revised ver-sion (Strategy Council to Foster a Spirit ofIndependence and Challenge in Youth, January2006). Together with taking steps to enhance andstrengthen employment support, the government willcoordinate closely with municipal authorities, healthand welfare agencies, educational institutions, etc. inorder to raise the capabilities and motivation to workof the youth such as NEET, and will continue to takemeasures such as setting up Community YouthSupport Station to support the occupational indepen-dence of youth such as the NEET.
In this manner the government will continue topromote the enhancement and strengthening of themeasures for the employment of young workers withthe purpose of resolving the employment problemfacing the youth.
Major Employment Measures for theYouth in FY2005 (1) Providing support for job attainment and
workplace commitment amongst newgraduates and graduates with no employ-ment.
1. Job attainment support for new graduates① Support for fresh graduates from universities, etc.
* Providing job placement information, careercounseling, job referral and job interview ses-
sion, etc. through the Comprehensive SupportCenters for Student Employment and theStudent Employment Centers, etc.
② Support for fresh junior high school and highschool graduates or graduates who are notemployed* Promoting recruitment development, career
counseling, and job referrals in collaborationwith schools
* Supporting recruitment development, individualconsultations, and work commitment throughyouth job supporters
2. Enhancing measures to promote workplace com-mitment
(2) Strengthening job attainment support forfreeters, etc.
1. Specialized service information desks to improveconfidence and the motivation to work * Providing one-stop service centers for the youth * Setting up career exchange plazas especially for
the youth2. Implementing hands-on skill development
* Promoting regular employment through trialemployment project for youth
* Promoting a Japanese-style dual system, train-ing by public parties, etc.
* Establishing intensive course on basic employ-ment capacities
3. Promoting the Public Employment SecurityOffices operations that support freeters to obtainfull-time employment
(3) Promoting employment awareness amongthe youth
1. Support for university students, etc.* Conducting seminars, etc. aimed at career coun-
selors at universities* Promoting internship programs for university
students, etc. in collaboration with economicorganizations.
2. Support for elementary, junior high, and highschool students * Providing opportunities for job experience
through such means as career search programsand junior internships

91Labor Situation in Japan and Analysis: General Overview 2006/2007
Chapter V Labor Administration and Legislation
3. Develop employability strengthening projects (JobPassport Program) through non-compensated workexperience, etc.
(4) Setting up one-stop service centers for theyouth (re-mentioned)Delegating employment support activities, etc.
through plans made proactively by the youth to One-Stop Service Centers for the Youth (usually referredto as Job Cafés), and supporting parallel activitieswith the Public Employment Security Offices.
(5) Promoting the National Campaign toIncrease Young People’s Human CapabilitiesRaise the interest of all the various segments of
the society regarding the problem of youth employ-ment, in addition to which the representatives fromrelevant people from different arenas such as the eco-nomic world, labor circles, education world, massmedia and local communities, etc. come togetherwith the purpose of raising the capabilities of theyouth and their motivation to work and start a nation-al campain to strive for such endeavors as holding aconference at a national level as well as educationalactivities.

92 Labor Situation in Japan and Analysis: General Overview 2006/2007
Basic Mindset on the Acceptance ofForeign Workers
The acceptance of foreign workers does not mere-ly stop at being the acceptance of “labor power,” andleverages an immense amount of impact on the over-all socioeconomics of the country, including not theleast with the impact on the lives of citizens. In addi-tion to this, the issue is also relevant to the core of themodalities of a nation, a fact that can be seen fromthe examples of the many developed nations whichhave a long history and experience of accepting suchworkers, and is a serious national issue that is capableof dominating the national political scene.
With regard to the issue of foreign workers asviewed from the perspective of the revitalization ofthe Japanese socioeconomy as well as further interna-tionalization, the government should promote theacceptance of foreign workers in specialized andtechnical areas more proactively.
On the other hand, there also exists the sentimentthat the acceptance of foreign workers, includingunskilled workers, should be expanded taking intoview the future decline in the labor force population.However, it is not appropriate to simply consider theacceptance of foreign workers as a means to counterthe quantitative labor shortage. It is of foremostimportance to create an environment wherein theworkers within the country are able to flourish. It ispossible to raise the labor force participation rate andreduce the decline rate of the labor force populationby creating an employment environment that allowspeople such as the youth, senior citizens or women tobe active. In addition to this, it is also considered pos-sible to fill the gap created by the decline in the laborforce by improving productivity through such meansas technological innovations.
From the point of view of the impact on thedomestic labor market, it is necessary to give ade-quate consideration to such issues as the fact thatincreasing the number of accepted foreign workerswould result in a decrease in the employment oppor-
tunities available to senior citizens, women andyoung people within a scenario where a large numberof unemployed people exist already, and a loss of theopportunity to leverage the latent capabilities ofyoung people such as the part-timers called “freeters”or NEET (those not in education, employment ortraining).
In addition to this, the acceptance of foreignworkers will be accompanied by “social costs” suchas education of the children and kin of foreign work-ers, housing, and public security, etc. Who and howto solve such burden will certainly become a vitalissue that has to deal with.
Whatever the case may be, the problem of accept-ing foreign workers remains a national issue thatexerts a tremendous influence on the socioeconomyand life of the people of Japan, and needs to be dis-cussed and studied comprehensively as well as cau-tiously while also adequately reflecting the views ofall segments of the population.
Promoting the Employment Measures forForeigners
With the number of foreign workers in employ-ment in Japan on an increase by the year, issues suchas the proper acceptance of foreign workers, prevent-ing illegal working, and securing the correct employ-ment and labor conditions for foreigners who canwork legitimately are gaining importance.
Taking this into account, in addition to makingefforts to understand the business climate for theemployment of foreign workers, the government isalso making efforts towards job introduction andcareer counseling services to foreigners seekingemployment through the Public EmploymentSecurity Offices, and in the further structuring andenhancement of the framework. In addition to this, itis also seeking to further enhance the training, assis-tance, etc. to employers in order to improve employ-ment management.
4 Issues of Foreign Workers

93Labor Situation in Japan and Analysis: General Overview 2006/2007
Chapter V Labor Administration and Legislation
Regarding measures to counter illegal working, inaddition to strengthening coordination with the relat-ed administrative agencies, the government is alsotaking steps such as disseminating information
regarding the policies and systems etc. of Japan foraccepting foreign workers in order to promote properworking within Japan.
V-7 Overview of Statuses of Residence for Foreigners
Work is possible within the scope stipulated by the status of residence granted
Diplomat (Ambassador, Minister Counselor or Consul of a foreign government and family members)Official (Personnel member at embassy or consulate of a foreign government, and family members)Professor (Professor at a university, etc.)Artist (Composer, painter, writer, etc.)Religious activities (Missionary and other religious activities conducted by members of foreign religious organizations)Journalist (Journalist or photographer of foreign news agency, etc.)
No restriction on work activities
Permanent resident (Person granted permanent permit to reside in Japan)Spouse or child of Japanese national (spouse, biological child, or adopted child of Japanese national)Spouse or child of permanent resident (Spouse of permanent resident or exceptional permanent resident and their child or children who were born and continue to live in Japan)Long-term resident (Refugees from Indochina, Third-generation Japanese people, etc.)
Work may be permitted depending on the nature of the permission provided to the individual
(Appendix 1.5 of Immigration Act)Designated activities (Household staff of diplomat, persons on a working holiday visa, or engaged in skills training, etc.)
Work is not permissible with the following statuses of residence
Cultural activities (Researcher of Japanese culture, etc.) Temporary visitor (Tourist, conference attendee, etc.)
(Appendix 1.1 of Immigration Act)
(Appendix 1.3 of Immigration Act)
College student (Student at university, junior college, advanced vocational school students of specialized course)Pre-college student (Pupil at high-school or at an advanced vocational school (higher or general course of study)Trainee (Trainee)Dependent (Dependant, spouse or child of a foreigner who has one of the statuses of residence above from Professor down to Cultural activities and from College student to Trainee)
(Appendix 1.4 of Immigration Act)
(Appendix 2 of the Immigration Act)
Investor/Business manager (Manager or owner of foreign company) Legal/Accounting services (Lawyer or public accountant, etc.) Medical services (Doctor, dentist, etc.) Researcher (Researcher at governmental or corporate institution, etc.) Instructor (Language teacher at junior high or high school, etc.)Engineer (Science-based degree graduate engaged in a job requiring specialized technical skills and knowledge in the field of natural sciences. Mechanical engineers, etc.) Specialist in humanities/International services (Humanities-based degree graduate engaged in white collar job in the field of humanities, interpreter, or corporate language trainer, etc.) Intracompany transferee (Transferee from overseas corporate office with the same qualifications as the two immediately above) Entertainer (Actor, singer, dancer, professional athlete, etc.) Skilled labor (Chef of foreign cuisine, sports coach, precious metal worker, etc.)
(Appendix 1.2 of Immigration Act)
◎ Status of Residence based on Activities in Japan
◎ Status of Residence Based on Personal Identity or Location
Notes: 1) “College student,” and “Pre-college student” are statuses of residence that do not allow for employment, however, if the holder appliesfor permission to engage in activities other than those previously granted, it is possible to engage in work within a stipulated scope(Article 19.2 of the Immigration Act).
2) Although not a recognized status of residence under the Immigration Act, with regard to persons who have been granted permanent res-idence in Japan as “special permanent residents” according to the Special Act for Immigration Management of Persons who DiscardedTheir Japanese Nationality based on Peace Treaties signed with Japan, the rights of such people shall be the same as permanent residents,and there are no restrictions on work or period of stay.
3) Examples are listed within the parentheses for statuses of residence.

94 Labor Situation in Japan and Analysis: General Overview 2006/2007
V-8 Measures for Foreign Workers
£ Implementation of the System for Reporting on the Employment Situation of Foreigners (a systemrequiring employers to report about the employment situation of foreign workers once a year toPublic Employment Security Office)
£ Employment Services Section for Foreign Workers (Established within 81 Public Employment SecurityOffices) Providing vocational counseling and referral to employment supported by interpreters
£ Employment Services Centers for Foreign Workers (In Tokyo and Osaka)Providing vocational counseling, referral to employment and employment information exclusivelyfor foreign students and foreigners in professional or technical fields
£ Nikkeijin Employment Service Centers (In Tokyo and Nagoya)Providing vocational counseling, referral to employment and labour consultation to foreign workersof Japanese desent
£ Nikkeijin Occupational Life Counseling Office (In Tochigi, Gunma, Chiba, Shizuoka and Osaka)Providing vocational counseling, referral to employment and labour consultation to foreign workersof Japanese descent
£ Japan-Brazil Employment Service Center (In Sao Paulo, Brazil)Providing job information and vocational counseling to Japanese-descent Brazilians seeking jobs in Japan
£ Providing employment guidance and implementing other programs to promote employment bynon-attendant, jobless young people of Japanese descent
£ Instruction to employers to improve employment management ¡Dissemination of the Guidelines Concerning Employment and Working Conditions for Foreign Workers ¡Group guidance and information provision by conducting Foreign Worker Employment Management Seminars ¡Counseling and guidance for individual establishment by implementing the Foreign Worker Employment Management Adviser System £ One-Month Campaign on Foreign Workers’ Affairs (June every year)
£ Program to establish legal employment procedureTo prevent illegal employment, seminars are held in home countries of many illegal foreign workers,where Japan’s policy and system about accepting foreigners are explained.
£ Effective measures to cope with illegal employmentIn cooperation with related administrative organizations including Measures for illegal ForeignWorkers Council, etc.
Overview
① Understanding employment conditions of foreign workers
The
Nin
th B
asic
Pla
n f
or
Emp
loym
ent
Mea
sure
s ② Appropriate response to foreigner job applicants
③ Awareness-raising guidance and employment management assistance to employers
④ Promotion of legal employment
Source: Annual Reports on Health, Labour and Welfare,2006, Ministry of Health, Labour and Welfare

95Labor Situation in Japan and Analysis: General Overview 2006/2007
Chapter V Labor Administration and Legislation
V-9 Number of New Entrant Workers to Japan According to Status of Residence (2005)
Status of residence Total number
Specialized and technical areas
Statuses of residence not permitting work in
principle
Statuses of residence without
restrictions on activities
Professor 2,253Artist 245Religious activities 846Journalist 248Investor/Business manager 604Legal/Accounting services 2Medical services 2Researcher 607Instructor 2,954Engineer 4,718Specialist in humanities/International services 6,366Intracompany transferee 4,184Entertainer 99,342Skilled labor 3,059Subtotal 125,430Cultural activities 3,725Temporary visitor 5,748,380College student 23,384Pre-college student 18,090Trainee 83,319Dependent 15,027Designated activities 16,958Spouse or child of Japanese national 24,026Spouse or child of permanent resident 990Long-term resident 33,756Total 6,093,085
Source: Immigration Bureau, Ministy of Justice
V-10 Number of Registered Foreigners According to Status of Residence (2005 year-end)
Status of residence Total number of registered foreigners
Foreign residents with work purpose
(specialized and technical areas)
Statuses of residence not permitting
work in principle
Statuses of residence with-out restrictions
on activities
Total
Illegal foreign residentsGrand Total
Professor 8,460Artist 448Religious activities 4,588Journalist 280Investor/Business manager 6,743Legal/Accounting services 126Medical services 146Researcher 2,494Instructor 9,499Engineer 29,044Specialist in humanities/International services 55,276Intracompany transferee 11,977Entertainer 36,376Skilled labor 15,112Subtotal 180,369Cultural activities 2,949Temporary visitor 68,747College student 129,568Pre-college student 28,147Trainee 54,107Dependent 86,055Designated activities 87,324Permanent resident 349,804Special permanent resident 451,909Spouse or child of Japanese national 259,656Spouse or child of permanent resident 11,066Long-term resident 256,639Others 36,119
2,011,555
207,2292,218,784
Source: Immigration Bureau, Ministry of Justice

96 Labor Situation in Japan and Analysis: General Overview 2006/2007
The basic purposes of Public EmploymentSecurity Offices, which are located in approximately600 locations all over Japan (including branchoffices), are to provide job seekers with the most suit-able job opportunities according to their wishes andabilities and to introduce the most appropriate per-sonnel to employers who are looking for employees.
The Public Employment Security Offices are con-nected online throughout Japan, and offer serviceusing the Comprehensive Employment InformationSystem to provide information about job vacanciesand job searches immediately through computers.
In addition, in order to respond appropriately tothe recently diversifying needs of users, we havestrengthened our agencies by introducing servicesuch as following measures and operations.
(1) Bank of Human ResourcesThe Public Employment Security Offices estab-lished 18 Banks of Human Resources in majorcities to introduce able personnel to medium- andsmall-sized companies and to promote theemployment of the elderly. The Bank of HumanResources deals primarily with administrative,professional, and technical positions.
(2) Part-time Job BankThe Public Employment Security Offices estab-lished 109 Part-time Job Banks in convenientareas, such as station terminals in major cities, inorder to offer comprehensive job introduction ser-vices for part-time employment.
(3) Mothers’ Hello WorkThe Public Employment Security Offices estab-
lished in FY2006 “Mothers’ Hello Work,” a newstructure to replace the existing Hello Work toSupport Combining Work and Family. Mothers’Hello Work provides comprehensive and thoroughsupport to parents who wish to combine childrearing with early return to employment. Specificsupport measures include the following: establish-ment of a system that facilitates parents to bringchildren to their workplace, and provision ofvocational guidance by experts and of informationuseful for child-rearing through cooperation withlocal authorities and other entities to parents whoare prepared to start searching for jobs and wishto reenter employment immediately.
(4) Hello Work PlazaThe Public Employment Security Offices beganestablishing Hello Work Plazas in each prefecturein 1999 to help job seekers find employment.Job seekers may easily and effectively find jobinformation by using searchable devices for them-selves at the Hello Work Plazas.
(5) Comprehensive Support Center for StudentEmployment, Student Employment Centers andCounseling Offices.The Public Employment Security Offices estab-lished these institutions for the specific purpose ofproviding employment support to graduating stu-dents as well as unemployed graduates. Theseinstitutions offer employment counseling to pro-vide not only a variety of employment informa-tion but also to offer supplemental assistance tojob introduction services offered by universitiesand other institutions.
5 Public Job Introduction System

97Labor Situation in Japan and Analysis: General Overview 2006/2007
Chapter V Labor Administration and Legislation
V-11 The Organization and Functions of the Public Employment Service Institutions(as of March 31, 2005)
£ Employment counseling and assistance, job introduction (for the general public, the elderly, graduates, the disabled, day workers, etc.)
£ Job instruction (providing employment information, implementing vocational aptitude tests, etc.), instruction about vocational training
£ Instruction to improve employment management (providing and managing employment information, continued employment system for the elderly, employment of the disabled, securing personnel for small and medium-sized businesses, etc.)
£ Providing information on employment, job seeking, and the labor market
£ Business transactions concerning employment insurance (applicability and payment)
£ Business transactions concerning subsidies
The Bank of Human Resources introduces able personnel to small and medium-sized companies and promotes the employment of the elderly. The Bank of Human Resources focuses primarily on administrative, professional, and technical positions, offers job consultation, provides information, etc.
The Part-time Job Bank implements job introduction, job consul-tation, information sharing, and vocational training for the benefit of part-time workers.
The Mothers‘ Hello Work implements job introduction, job consul-tation, information sharing, and other services to those who have the willingness and the ability to work, but cannot do so imme-diately because of responsibilities for child care, nursing care, and other duties.
Job seekers can find a wide range of job information by using searchable devices at the Hello Work Plaza.
These institutions implement job introduction, job counseling, information sharing, vocational aptitude tests, etc. for the benefit of newly graduating students as well as unemployed graduates.
The Public Employment Security Offices
Institutions to provide specific services
Bank of Human Resources(18 Banks)
Hello Work Plaza(47 institutions)
Main offices (470 offices)
Branch offices (102 offices)
Supplementary offices(20 offices)
Comprehensive Support Center for Students Employment(1 center),
Student Employment Centers (6 centers),
Counseling Offices(40 centers)
Part-time Job Bank(109 Banks)
Mothers‘ Hello Work(12 institutions)
Note: In addition to the institutions listed above, there are Local Region Employment Support Centers and Employment Service Centers for Foreigners.

98 Labor Situation in Japan and Analysis: General Overview 2006/2007
Working HoursDuring the era of rapid economic growth, annual
working hours steadily declined due to a tight labormarket and higher productivity. In the mid-1970s, thistrend leveled off. Since the revised Labor StandardsAct became effective in 1988, establishing a 40-hourworkweek as the norm, working hours have contin-ued to decrease.
In FY2004, scheduled working hours remained at1,685 (a decrease of 21 hours over the previous fiscalyear) while overtime working hours were 149 (anicrease of 2 hours over the previous fiscal year), sothat total working hours decreased by 19 to 1,834hours.
However, taking a closer look at these figuresshows that the percentage of people “working lessthan 35 hours per week” has increased from 18.2% in1993, to 23.6% in 2004. In addition, that of “workingmore than 60 hours per week” has also increasedfrom 10.6% in 1993 to 12.2% in 2004. Converselythe proportion of people “working more than 35 andless than 60 hours per week” has decreased, indicatedthat the so-called “polarization of working hours” isadvancing. Furthermore, looking at the actual work-ing hours of full time and part time workers showsthat in 2004 each category worked 2,015 hours and1,171 hours respectively, a proportion that hasremained largely unchanged over ten years. Themajor cause for the overall reduction in scheduledworking hours is largely as a result of the increase inpersons with shorter working hours.
With regard to trends in paid holidays and vaca-tion days, the usage rate is showing a declining trend,with workers using on average only 46.6% of theirentitlement in FY2004. The average workers wasentitled to 18.0 days paid annual leave, but generallyused only 8.4 days.
In FY2004 91.2% of all workers worked a five-day week, but looking by type we see that only60.4% of employers have totally adopted this system,with small and medium-sized businesses making par-
ticularly little progress in this direction.
Administration Efforts ConcerningWorking Hours
In economic plans and other policies, the govern-ment has adopted a goal of reducing working hours toa 1,800-working-hour year, and is making efforts tothat end.
However, with intensifying competition and diver-sification of working styles, there has been an increasein both workers working long hours and those work-ing short hours, meaning that a common goal for allworkers will not be realizable. Furthermore, variousnew issues are arising with regard to working hours,including the worsening situation of health problemsdue to long working hours and difficulty in findingtime for other activities, including childcare, nursingcase or self-improvement activities, etc.
In order to respond to such issues the Act con-cerning Temporary Measures for the Promotion ofShorter Working Hours was amended to become theAct on Special Measures for Improvement ofWorking Time Arrangements. This amended act wasentered into force on 1 April 2006.
The aim of this law is not merely to reduce work-ing hours, but to improve working hours, paid holi-days and vacation days in response to the diverse sit-uations for workers and in consideration of the indi-vidual health and lifestyle of each worker.
The shortening of working hours will be promot-ed through efforts that place emphasis on workerstaking their allocated annual paid leave and the dis-semination of planned holiday systems, and measuresto curb excessive out-of-hours working time.
The revised Labor Standards Act prescribes thatlegal working hours be gradually shortened in 1988.
Accordingly, all but exempt businesses wouldshift to a 40-hour work week beginning in April1997.
The government has encouraged the adoption ofthe Variable Scheduling System (note 1) and the
6 Measures to Shorten Working Hours

99Labor Situation in Japan and Analysis: General Overview 2006/2007
Chapter V Labor Administration and Legislation
Discretionary Scheduling System (note 2) in somesectors, to limit working hours to 40 per week.
Notes: 1) Variable Scheduling System
This system involves distributing working hours
over a fixed time period, thus accommodating busi-
ness priorities and ensuring that the total number of
hours worked per week does not exceed 40.
2) Discretionary Scheduling System
Working hours are determined in this system based
on a collective agreement rather than setting a fixed
schedule, when the duties in question require signifi-
cant worker discretion. It can apply to both special-
ized work and creative work.
V-12 Shifts in Average Total Annual Working Hours per Worker (FY, finalized)
2,500
2,400
2,300
2,200
2,100
2,000
1,900
1,800
1,700
(Hours)
65 70 75 80 8586
8788
8990
9192
9394
9596
9798
992000
20012002
20032004
60FY1955
Scheduled working hours
2,115
2,042
1,947 1,9431,933
1,932
1,938
1,912
1,8881,859
1,838
1,814
1,778
1,770
1,775
1,7641,748
1,7341,714
1,7141,710
1,7021,706
1,685
2,164
2,150
2,312
2,239
2,0772,104 2,112
2,104
2,120
2,1002,076
2,0442,008
1,958
1,909
1,903
1,913
1,912
1,8961,868
1,848
1,854
1,843
1,8411,853
1,834
Annual working hours
2,426
2,356
Annualworking hours
Scheduledworking hours
Overtimeworking hours
FY2003 1,853 1,706 147FY2004 1,834 1,685 149
FY2001FY2002
Difference FY2002-2003 12 4 8FY2003-2004 –19 –21 2
(Hours)State of changes in working hours
1,843 1,710 1331,841 1,702 139
FY2001-2002 –2 –8 6
Source: Monthly Survey of Labour Statistics, Ministry of Health, Labour and WelfareNotes: 1) This study was limited to businesses that employ more than 30 workers.
2) Figures were obtained by multiplying monthly averages by 12 and round off to unit.3) Overtime working hours were obtained by subtracting prescribed scheduled working hours from annual working hours. 4) Figures from FY1983 and earlier were obtained by adding up all monthly figures.
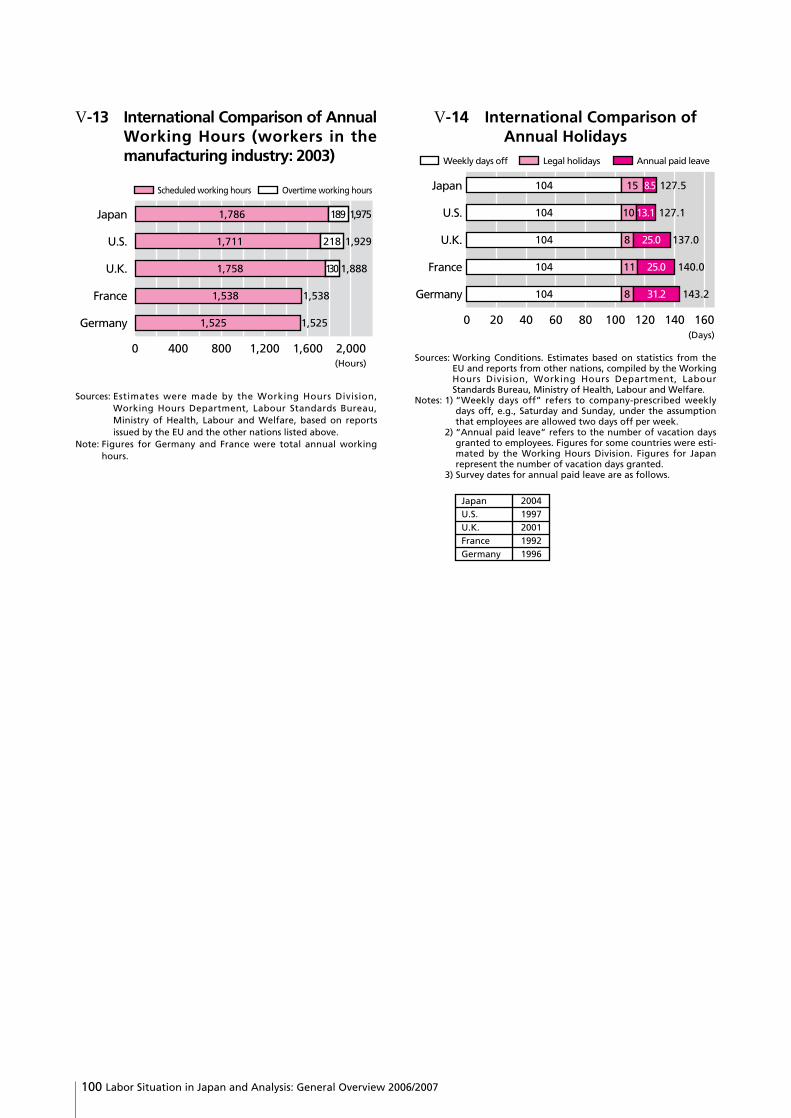
100 Labor Situation in Japan and Analysis: General Overview 2006/2007
V-13 International Comparison of AnnualWorking Hours (workers in themanufacturing industry: 2003)
Sources: Estimates were made by the Working Hours Division,Working Hours Department, Labour Standards Bureau,Ministry of Health, Labour and Welfare, based on reportsissued by the EU and the other nations listed above.
Note: Figures for Germany and France were total annual workinghours.
0 400 800 1,200 1,600 2,000(Hours)
Japan
U.S.
U.K.
Germany
France
Scheduled working hours Overtime working hours
1,786 1,975189
1,711 1,929218
1,758 1,888130
1,538 1,538
1,525 1,525
V-14 International Comparison ofAnnual Holidays
Sources: Working Conditions. Estimates based on statistics from theEU and reports from other nations, compiled by the WorkingHours Division, Working Hours Department, LabourStandards Bureau, Ministry of Health, Labour and Welfare.
Notes: 1) “Weekly days off” refers to company-prescribed weeklydays off, e.g., Saturday and Sunday, under the assumptionthat employees are allowed two days off per week.
2) “Annual paid leave” refers to the number of vacation daysgranted to employees. Figures for some countries were esti-mated by the Working Hours Division. Figures for Japanrepresent the number of vacation days granted.
3) Survey dates for annual paid leave are as follows.
0 20 40 60 80 100 120 140 160(Days)
Japan
Weekly days off Legal holidays Annual paid leave
U.S.
U.K.
Germany
France
104 127.515 8.5
13.1
25.0
25.0
31.2
104 127.110
104 137.08
104 140.011
104 143.28
Japan 2004 U.S. 1997 U.K. 2001 France 1992 Germany 1996

101Labor Situation in Japan and Analysis: General Overview 2006/2007
Chapter V Labor Administration and Legislation
The Minimum Wage ActWith the enactment of the Minimum Wage Act,
drafted to improve working conditions and guarantee aminimum wage to low-paid workers, Japan’s mini-mum wage system came into being in 1959. The lawalso sought to promote the sound development of thenational economy by raising the quality of the laborforce and fostering fair competition among companies.
Setting Minimum WagesMinimum wages are determined in Japan through
(1) Minimum Wages Councils, composed of mem-bers representing labor, management, and the publicinterest, that set minimum wages subsequent toresearch and deliberation; and (2) local minimumwages set by collective agreements.
The majority of minimum wages are set asdescribed in (1) above (296 cases). Only two caseshave been set in accordance with (2).
When minimum wages are determined by (1)above, details such as how much the minimum wageshould be, and how widely it should be applied, willbe decided based on discussion by a Minimum WagesCouncil composed of members representing labor,management, and the public interest.
In its deliberations, a Minimum Wages Councilwill examine statistical data to ascertain the currentwages earned by workers under consideration for aparticular minimum wage. Its members also visit andinspect workplaces to investigate prevailing workingconditions and wages. They ask workers and theiremployers for their opinions. The Council makes adecision after considering the local cost of living,starting salaries paid to new graduates, any collectiveagreement on minimum wage, the distribution ofworkers along the wage scale, and the effects of set-ting a minimum wage.
Since FY1978, the Central Minimum WagesCouncil has been providing guidelines to prefecturalMinimum Wages Councils for minimum wagedescribed below increases to ensure national unifor-
mity. The local councils, in turn, use the guidelines torevise minimum wages to accord with the local situa-tion.
Types of Minimum WageMinimum Wages Councils rule on two types of
minimum wage-local and industry-specific minimumwages.
One local minimum wage is determined for eachprefecture, regardless of the type of industry or occu-pation. Usually, the minimum wage in a given prefec-ture applies to all workers in all workplaces in thatprefecture, and to all employers who have one ormore workers.
There are two types of industry-specific minimumwages: prefectural and national. The prefecturalindustry-specific wage is determined by prefecturallabor authorities for certain industries, while thenational industry-specific minimum wage appliesnationwide. Both are limited to particular industries,as the terms imply.
Minimum Wages vs. Actual WagesThe current minimum wages are determined at the
Local Minimum Wages Council, based on the guide-lines on wage increase amount issued by the CentralMinimum Wages Council, and by comprehensivelycalculating three elements: workers’ cost of living,wages earned by other workers engaged in similaremployment, and employers’ ability to pay.Currently, regional minimum wages are all set onlyby hour. However, industrial minimum wages may bedivided into those set by hour alone or by both dayand hour.
Of the minimum wages set as mentioned above,minimum wages set only by hour apply to all work-ers. Minimum daily wages set both by day and hourapply mainly to workers who are paid according tomethods other than by the hour (e.g. day or month),and minimum hourly wages apply mainly to workerswho are paid by the hour.
7 The Minimum Wage System

102 Labor Situation in Japan and Analysis: General Overview 2006/2007
V-15 Methods Used to Set Minimum Wages(minimum wages set through minimum wage
council investigation and deliberation)
Request for deliberation
Investigation and deliberationby the minimum Wage Council
Drafting of a report
Publication of the report
Decision
Publication of the decision
Implementation
Presentation of objections
V-16 Minimum Wages(weighted national average)
(As of March 31, 2006; yen)
Minimum wage 668by prefecture
Minimum wage 761by industry
Hourly rate

103Labor Situation in Japan and Analysis: General Overview 2006/2007
Chapter V Labor Administration and Legislation
Occupational AccidentsThough industrial accidents have steadily been
decreasing in a long run, there are still approximately540,000 cases annually.
The number of deaths in these cases was 1,620 inFY2002, a decrease of 8 compared with FY2003,resulting in the seventh consecutive year with fewerthan 2000 deaths.
According to the results of periodical healthscreening test, more than 40% of all workers havesome positive-findings. It is also observed that thereare more than 60% of workers who feel some kind ofstress on their job.
Present Conditions and Issues inIndustrial Safety and Health Measures
Since 1958, the Ministry of Labour has imple-mented nine 5-year plans to prevent industrial acci-dents. In accordance with the Tenth IndustrialAccident Prevention Plan (2003-2007), we are striv-ing toward the following goals:(1) Eradication of fatal accidents at the workplace(2) Assuring safety and health in small and medium-
scale enterprises(3) Promotion of health security measures responding
to the increase, etc. of work-related physical andmental burden
(4) Development of managerial methods for safetyand health to decrease risks
(5) Response to the diversification of employmentformats and fluctuation of employment
Workers’ Compensation Insurance SystemThis government insurance system pays the nec-
essary insurance benefits to workers to give them
prompt and equitable protection against injury, ill-ness, disability, death, etc. resulting from employ-ment or commutation. The system also provides wel-fare services to injured workers to promote theirsmooth return to society ( see V-17).
(1) EligibilityAny business that employs workers may partici-
pate in the Workers’ Compensation Insurance System,excluding government employees (except local gov-ernment part-time workers engaged in bluecollarlabor) and seamen who are eligible for the MarinersAct. Certain businesses engaged in agriculture,forestry or fishery, and employing five or fewer work-ers may be eligible on a temporary basis.Additionally, special enrollment may be granted tosmaller business owners and their family employees,sole proprietorships, and workers dispatched on over-seas assignments. In those cases, they are entitled toreceive benefits for injuries sustained at the workplaceand, in some circumstances, for injuries sustainedwhile commuting to or from the workplace.
(2) Insurance Premiums and the Burden ofExpensesEmployers are required to pay insurance premi-
ums, which are calculated by multiplying totalpayable wages by the accident rate determined foreach business category (5/1,000-129/1,000).Companies larger than a specific size may participatein a socalled merit system, whereby premium rates ortotal premium (excluding those related to accidentsoccurring while in commute or benefits for a secondphysical exam) are based on relevant accident rates ateach company.
8 Industrial Safety and Health
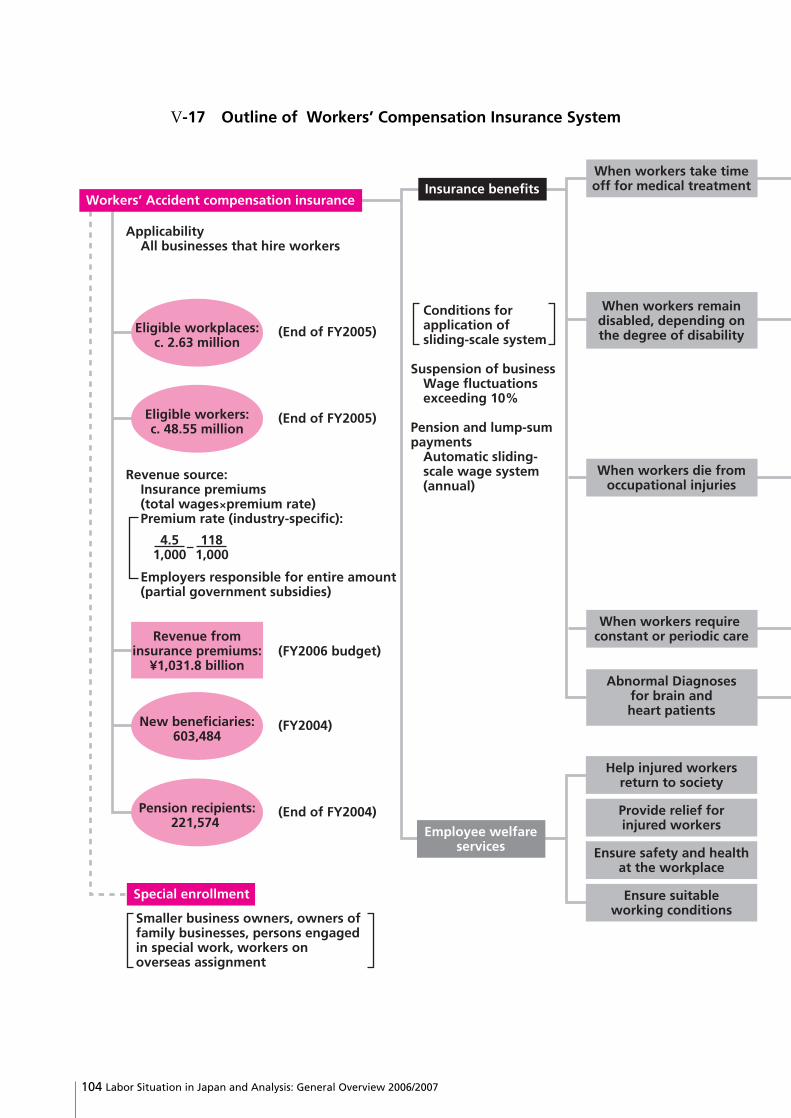
104 Labor Situation in Japan and Analysis: General Overview 2006/2007
V-17 Outline of Workers’ Compensation Insurance System
Pension recipients:221,574
(End of FY2004)
New beneficiaries:603,484
(FY2004)
Revenue frominsurance premiums:
¥1,031.8 billion(FY2006 budget)
Eligible workers:c. 48.55 million
(End of FY2005)
Eligible workplaces:c. 2.63 million
(End of FY2005)
Help injured workersreturn to society
When workers take timeoff for medical treatment
When workers remaindisabled, depending onthe degree of disability
Abnormal Diagnosesfor brain andheart patients
When workers die fromoccupational injuries
When workers require constant or periodic care
Provide relief forinjured workersEmployee welfare
services
Insurance benefitsWorkers’ Accident compensation insurance
Special enrollment
Ensure safety and healthat the workplace
Ensure suitableworking conditions
ApplicabilityAll businesses that hire workers
Revenue source:Insurance premiums
+(total wages premium rate)Premium rate (industry-specific):
Employers responsible for entire amount(partial government subsidies)
4.5 1181,000
– 1,000
Suspension of businessWage fluctuations exceeding 10%
Pension and lump-sum payments
Automatic sliding-scale wage system (annual)
Smaller business owners, owners of family businesses, persons engaged in special work, workers on overseas assignment
Conditions for application of sliding-scale system

105Labor Situation in Japan and Analysis: General Overview 2006/2007
Chapter V Labor Administration and Legislation
Compensation formedical expenses
Compensation formissed work
Compensation forillnesses or injuries
(pension)
Compensation fordisabilities (pension)
Compensation fordisabilities (lump sum)
All medical expenses
60% of standard benefits per day of work missed, beginning on the fourth day of absence
Payment ranging from 245 (Class 3) to 313 (Class 1)days’ worth of pension at standard daily rate tothose who have not recovered from illnesses orinjuries after 18 months of treatment
Payment ranging from 131 (Class 7) to 313 (Class 1)days’ worth of pension at standard daily rate
Payment ranging from 56 (Class 14) to 503 (Class 8)days’ worth of pension at standard daily rate
(Provision of artificial limbs, establishment and administration of industrial accident hospitals)
(Special benefits for injured workers; benefits to defray the cost of educating injured workers’ children)
(Implementation of measures for preventing accidents at the workplace and promoting occupational medicine)
(Compensation for unpaid wages)
Compensation fornursing care
Up to ¥104,970 for constant care and¥52,490 for occasional care, per month
Payment for a secondmedical exam
Second exam to ascertain cardio vascular or heart condition and special health guidance by a doctor
Compensation tosurvivors (pension)
Compensation tosurvivors (lump sum)
Compensation toFuneral expenses
(Full payment)
Payment ranging from 153 days to 245 days’worth of pension at standard daily rate,according to number of survivors
Lump-sum payment amounting to 1,000 days’worth of standard pension to survivorsnot eligible for pensions
¥315,000 + 30 days of standard compensation(minimum compensation: 60 days’ worthat standard daily rate)
+ Additional special special benefits
* Special benefits for missed work
* Special lump-sum payments
* Special pensions
Source: Ministry of Health, Labour and WelfareNotes: 1) Standard daily rate is calculated by dividing total wages paid to a worker during the three calendar
months preceding the injury by the number of calendar days in that period. (minimum compensation: ¥4,080). 2) Minimum and maximum standard daily rates for pensions and long-term (18 months) medical
treatment are determined according to age group.3) There are merit systems that increase or decrease health care rate (amount of insurance premium) according to
the balance of industrial accident insurance for each business (40% for persons occupied in continual business-es, and among businesses for a definite term, 40% for persons occupied in construction business and 35% forpersons occupied in logging business).

106 Labor Situation in Japan and Analysis: General Overview 2006/2007
V-18 Changes in Reported Cases of Occupational Accidents
(Persons)
~~
197374
7576
7778
7980
8182
8384
8586
8788
8990
9192
9394
9596
9798
99 01022000
(Year)
100,000
200,000
300,000
400,000
500,000
1,000
2,000
3,000
4,000
5,000
6,000
387,342
347,407
322,322
333,311
345,293
348,826
340,731
335,706312,844
294,319
278,623
271,884
267,240
246,891
232,963
226,318
217,964
210,108
200,633
189,589
181,900
176,047
167,316
162,862
156,726
148,248
137,316133,598
125,918133,948
5,269
4,330
3,7003,345
3,302
3,3263,077
3,009
Fatalities and casualties on occupational accidents (requiring more than four days sick leave)
Fatalities
2,912
2,674
2,588
2,635
2,572
2,318
2,342
2,549
2,419
2,550
2,489
2,354
2,245
2,301
2,414
2,363
2,078
1,844
1,992 1,790
1,8891,658
Sources: Research done by Labour Standards Bureau, Ministry of Health, Labour and Welfare

107Labor Situation in Japan and Analysis: General Overview 2006/2007
Chapter V Labor Administration and Legislation
Japan is presently faced with a scenario wherein arapid decline in the birth rate and progressive ageingis leading to the advent of a society with a decliningpopulation. Given this scenario, it has become a vitalissue to create an environment for employment whereworkers can leverage their abilities to the fullest with-out facing discrimination on account of gender andwhere motherhood is given due respect.
Based on this, the Equal Employment Subcom-mittee of Labour Policy Council began a discussionin September 2004 as part of the measures to furtherpromote equal employment opportunities betweenmen and women, resulting in a series of proposalspresented to the Minister of Health, Labour andWelfare in December 2005 regarding future measuresfor ensuring equality of employment opportunitiesbetween men and women.
The Ministry of Health, Labour and Welfare sub-mitted to the Diet a bill for Partial Amendments ofthe Equal Employment Opportunity Act, containingamong other things, the (1) strengthening of antidis-crimination regulations, including a ban against indi-rect discrimination, (2) strengthening of regulationsagainst the unfair treatment of workers for reasonssuch as pregnancy or childbirth, (3) strengthening ofan employee’s commitment towards preventing sexu-al harassment, and (4) the relaxation of regulationsregarding the underground (pit) work done bywomen.
The act will be enforced in April 2007.As part of the effort to ensure the implementation
of the Equal Employment Opportunity Act, the EqualEmployment Offices of the prefectural labour bureausthat have been set up within the prefectural govern-ments as local agencies of the Ministry of Health,Labour and Welfare conduct the following services:
(1) Active dissemination of information regarding theEqual Employment Opportunity Act, and consul-tation regarding discriminatory treatment againstwomen employees as regards recruitment, hiring,assignment, promotions, education and training,uniform welfare packages, mandatory retirement,voluntary withdrawal from the workforce or dis-missal, as well as sexual harassment at the work-place.
(2) Advice, guidance and recommendations by thehead of the Prefectural Labour Bureaus for thespeedy resolution of individual disputes betweenwomen employees and employers, as well asmediation by the Equal Opportunity MediationCommission.
(3) Proactive guidance etc. based on the EqualOpportunity Act for the thorough enforcement ofequal treatment between male and femaleemployees as well as assessment of the actualconditions regarding a corporation’s employmentmanagement.
In addition to the above, in order to promote posi-tive action by corporations to remove the actual gapsthat exist between men and women employees due toa system of employment management that is rootedin customary practices and fixed perceptions regard-ing the division of roles and responsibilities, the gov-ernment has been involved, in addition to providinginformation through the means of corporate awardsand seminars, in creating the Positive ActionPromotion Council in collaboration with the employ-ers’ associations in order to promote proactive andvoluntary action by employer organizations to dealwith positive action.
9 Gender Equal Employment Policies
108 Labor Situation in Japan and Analysis: General Overview 2006/2007
It is believed that the rapid progression of thedeclining birth rate will have a substantial impact onJapan’s future society and economy, such as byreducing the labor force population and affectingsocial security programs.
Measures have been taken to cope with the declin-ing birth rate from various angles, but these have notyet brought about a change in the downward trend.Although the number of children accepted at day-carecenters has increased, there are still on the waitinglist. In addition, efforts have not been made enoughfor reconsidering the way people work, such as deep-rooted tendencies like giving priority to one’s work-place and working long hours.
For this reason, in June 2004 the JapaneseGovernment formulated the Promotion of MeasuresAgainst Declining Birth Rate, which serves as com-prehensive set of policy guidelines for responding tothe declining birth rate. This was done in order toforcefully advance various kinds of measures so as toalter the trend toward a declining birth rate. Based onthis outline in December of the same year the govern-ment also formulated the Child and Child RearingSupport Plan as a concrete implementation plan forits priority policies.
This plan addresses, as one of its priority issues,support for balancing work and family as well asreconsiderations of the way people work. It focuseson a variety of policies with the aim of realizing adesirable society with an outlook of roughly 10 yearsinto the future.
Moreover, in order to work towards supporting thedevelopment of the next generation intensively andsystematically, the “Act for Promote Measures to sup-port the Development of the Next Generation” were
fully brought into effect beginning in April 2005. TheAct stipulates setting a framework for local publicentities, enterprises, and other such organizations for-mulate action plans regarding support for the devel-opment of the next generation. On the basis of thisAct, efforts for supporting the development of thenext generation are being made at local public enti-ties, enterprises, and the like.
Furthermore, in order to further advance supportfor efforts like balancing work and childrearing, a billto amend the Child Care and Family Care Leave Actwas enacted in December 2004 and has been in effectsince April 2005. The bill was formulated with con-tents such as expanding the workers subject to childcare and family care leave, extending the period forchild care leave, easing restrictions on acquiring fam-ily care leave multiple times, and establishing a sys-tem for nursing leave.
The MHLW is aiming for the attainment of a soci-ety in which everyone who so wishes can work withpeace of mind while performing activities such aschildrearing. In addition to thoroughly publicizing theChild Care and Family Care Leave Act, the MHLW isengaged in activities such as supporting the formula-tion and implementation of action plans by enterpris-es based on the Next Generation Act, implementingvarious subsidy measures for enterprises striving tosupport balancing work and family, and further popu-larizing and facilitating “family friendly enterprises”where one can engage in a flexible manner of work-ing that gives consideration to balancing work andfamily. Through these, the Ministry is striving to cre-ate an environment in which it is easy to balance bothwork and family.
10 Assistance Measures to Balance Work and Family

109Labor Situation in Japan and Analysis: General Overview 2006/2007
Chapter V Labor Administration and Legislation
V-19 Aspects of the Society We Should Aim for in the Child and Child Rearing Support Plan (excerpt)
Note: The figure for FY2004 and FY2005 are based on the Basic Survey on Employment for Women, Ministry of Health, Labour and Welfare.
Item Target Value FY2005 FY2004
Percentage of men taking child care leave 10% 0.50% 0.56%
Percentage of women taking child care leave 80% 72.3% 70.6%
Diffusion rate of measures such as work hour reduction until the child
starts attending primary school25% 16.3% 10.5%
V-20 Annual Trend of Number of Births and Total Fertility Rate
5(%)
0
1
2
3
4
1949 1955 1965 1975 1985 1990 1995 2000 2005
4.32
2.14
1.58
(10,000 persons)
Nu
mb
er o
f b
irth
s
Tota
l fer
tilit
y ra
te
300
250
200
150
100
50
0
Number of births
Total fertility rate
First baby boom (1947-1949) Marked record-high births:
2,696,638
1966 “Year of Hinoeuma”: 1,360,974
Second babyboom (1971-1974) :
2,091,983
2005 marked record-lowbirths:
1,062,604
“1.57 Shock” (total fertility rate in 1989 recorded below
that of 1966) : 1,246,802
4.5
0.5
1.5
2.5
3.5
1.25
1.57
Source: Vital Statistics, Ministry of Health, Labour and WelfareNotes: 1) Total fertility rate is the total rate of women’s fertility of each age between 15-49 and indicates the assumed number of children a
woman of each categorized age will give birth in all her life.2) “Hinoeuma” is one of the sign in the Oriental zodiac. It is superstitiously believed that females born to this sign will create evil and many
people avoided to give birthon this year.

110 Labor Situation in Japan and Analysis: General Overview 2006/2007
1. Current Status of Part-time WorkersThe number of part-time workers has been on a
significant rise in these past few years. At 12.37 mil-lion, the figure for such part-time workers (those work-ing for under 35 hours per week) reached as much asapproximately a quarter of the total working popula-tion in 2004. With this increase in numbers, part-timeworkers have, over time, taken over such core respon-sibilities as management positions, and have come tobecome indispensable from the point of view of cor-porate management in their role as an importantworking force that supports the Japanese economy.
However, a look at the benefits provided to part-time employees shows that under present conditionsthere has been inadequate improvement of theemployment management for this category, which isindicated by such facts as the trend of a widening gapin wages as compared to full-time employees.
Viewed from the perspective of the need for seek-ing out the necessary labour force within the scenarioof a society that is faced with a declining population,it is expected that the significance of a part-timemodel of working, which makes is comfortable evenfor women or senior citizens to be employed, willcontinue to grow in leaps and bounds in the future aswell. Taking this development into account, it hasbecome a critical issue to position part-time work asan appealing model of employment that allows for aneffective utilization of the abilities of part-time work-ers by removing unreasonable disparities in employ-ment benefits as compared to full-time employees.
2. Current Measures for Part-time Workers(1) Guidelines for part-time work
The government has set down the Guidelines forPart-time Work on the basis of the Part-TimeWork Act with the objective of improving theemployment benefits of part-time workers. Theguidelines cite measures that ought to be under-taken by employers regarding part-time workers,such as approaching the idea of employment ben-
efits (equal compensation) while taking intoaccount such factors as the actual work conditionsand the balance with full-time employees, puttinginto place the conditions for changing the status tofull-time employee, and implementing provisionsfor promoting dialogue between labor and man-agement.
As part of a tangible approach towards balanc-ing the benefits with full-time employees, theguidelines stipulate that employers should incor-porate the following types of approaches: 1) Withrespect to the part-time workers who are involvedin the same work as the full-time workers and forwhom the system and practice of the utilization ofhuman resources, etc. are not substantially differ-ent from those of full-time employees, measures-such as using the same decision-making method(e.g. using the same pay scale or aligning the stan-dards for the issuing, appraisal or ability-rating ofwages)-should be taken to secure balance withregular workers 2)With respect to the part-timeworkers who are involved in the same work as thefull-time workers but for whom the system andpractice of the utilization of human resources, etc.are different from those of full-time employees,efforts should be exerted to secure balance withregular workers by taking such steps as setting upa mechanism for compensating with benefits inaccordance with their enthusiasm, ability, experi-ence, performance, etc..
(2) Tangible Efforts by the Government towardsProviding “Balanced Treatment”The government has been undertaking a series ofmeasures with the objective of spreading andinstilling the idea of a “balanced treatment” offull-time and part-time workers as stipulated inthe Guidelines for Part-time Work across the soci-ety so that the idea becomes true.
First, the Equal Employment Offices of the pre-fectural labour bureaus organize efforts such as 1)holding briefing sessions for employers with the
11 Part-time Work Policies

111Labor Situation in Japan and Analysis: General Overview 2006/2007
Chapter V Labor Administration and Legislation
V-21 Changes in the Number and Percentage of Part-time Workers (people whowork less than 35 hours per week) in Industries besides Agriculture and Forestry
12.217.4 19.3 22.0
27.9 31.636.1 39.3 39.7 40.7 39.9 40.6
50(%)
40302010
0
9.6
6.7 10.0 10.0 11.115.2 17.4
20.0 22.9 23.2 24.1 23.6 24.0
198130
256333
501
632
754829 835
200220012000199519001985198019751970
Number of part-time workers
(10,000 persons)
Number of female part-time workersPercentage of part-time workersamong female employeesPercentage of part-timeworkers among all employees
0
200
400
600
800
1,000
1,200
1,400
1,600
216
351 390471
722
896
1,053
1,205 1,211
861
2003 2004
1,259 1,237
857
2005
1,266
882
82
1965
168
6.2
Source: Labour Force Survey, Statistics Bureau, Ministry of Internal Affairs and CommunicationsNotes: Excludes employees on leave.
Percentage of women among part-time workers 69.7%Percentage of part-time workers among female employees 40.6%Percentage of part-time workers among all employees 24.0%
purpose of instilling the objectives of the Part-time Work Act and the Guidelines for Part-timeWork and 2) recommending the appointment of“part time employment managers” for each work-place where the employers employ ten or morepart-time workers for managing issues concerningobtaining the correct working conditions for part-time workers and for improving their employmentmanagement.
In addition to this, the government is alsoinvolved in such activities as 1) providing subsi-dies to employers that promote the improvementof benefits provided to part-time workers, 2) pro-viding information and consulting sessions
through advisors, 3) supporting the review of thebenefits system through such measures as the dis-patch of personnel management experts (consul-tants on equal treatment practices) or the holdingof conferences for employers and 4) an online“self-diagnosis” system where the employer cancheck for himself/herself whether it has madeadequate efforts towards providing balanced treat-ment. These government efforts are made throughthe Japan Institute of Workers’ Evolution, a desig-nated corporation found under the Part-time WorkAct, in order to support employers who are under-taking efforts towards establishing balanced treat-ment.

112 Labor Situation in Japan and Analysis: General Overview 2006/2007
The term “public vocational training,” in a narrowsense, refers to vocational training conducted at pub-lic human resources development facilities. However,more broadly, public vocational training includes thedisbursement of subsidies to defray educationalexpenses, and is based on the following three poli-cies:(1) Providing vocational training at public human
resources development facilities (the narrow defi-nition of public vocational training).
(2) Encouraging employers and employer associa-tions in the private sector to offer vocational train-ing by awarding subsidies, disseminating informa-tion, and providing consulting services.
(3) Motivating workers to acquire skills voluntarilyby granting subsidies and providing informationaland consulting services.Table V-23 shows the ways in which public voca-
tional training has been implemented in Japan.Graduates from school are offered mainly long-termtraining lasting one to two years, while unemployedworkers receive mostly training of six months or lessand employed workers primarily receive short-termtraining of only a few days. By act, vocational train-ing is offered to those changing occupations (and cur-rently unemployed) and the physically disabled freeof charge, but the cost of texts and other materials isborne by trainees. Some training courses for thosechanging occupations (and currently unemployed) areentrusted to private sector education and traininginstitutions. Training subjects taught at public humanresources development facilities are mostly vocation-al and technical subjects for industries such as manu-facturing and construction, but among the trainingcommissioned to the private sector, courses are estab-lished in various subjects like computers and socialwelfare. Short-term vocational training for theemployed is implemented based on the needs ofemployers or employers’ associations of the region.
The Polytechnic University, a public vocationalcapacity development university, provides training
and education to cultivate public vocational traininginstructors and develops textbooks for that purpose.
Furthermore, among the facilities illustrated inTable V-23 is the Lifelong Human ResourcesDevelopment Center, which acts as a central basefacility for the human resource development of white-collar workers.
Steps taken to promote education and training inthe private sector are outlined in Figure V-22. Careerdevelopment promotion grants appearing therein isintended to promote effective career development foremployees within the organization. Employers will besubsidized to cover part of the wages and expensesassociated with the conduction of educational andtraining activities they provide, based on a plan creat-ed within the business, for the workers employedthere. The financial resources for Career developmentpromotion grants come from a separate body estab-lished under the employment insurance umbrella and,being funds collected universally from business own-ers, shall be returned (again, universally) toEmployers in the form of subsidies for education andtraining.
In terms of support for self-education, there is theEducation and training grants system introduced inDecember 1998. This is for workers who have beenenrolled in employment insurance for at least threeyears, and provides assistance to the amount of 40%of class expenses with a maximum of 200,000 yen(and in the case of an employment insurance periodof at least three years and less than five years, assis-tance of 20% with a maximum of 100,000 yen) paidby workers who attended and completed education ortraining designated by the Minister of Health, Labourand Welfare.
As of October 2005, eligible courses numbered8.807 at 2,552 facilities, and it has become possibleto receive benefits for many courses, such as in com-puters and bookkeeping, as well as preparation for avariety of certifications. Furthermore, starting inApril 2002, we are trying to launch the construction
12 Public Vocational Training Policies

113Labor Situation in Japan and Analysis: General Overview 2006/2007
Chapter V Labor Administration and Legislation
V-22 Outline of Self-education and Training in the Private Sector
・ Support the establishment ofaccredited vocational training
Support smaller business ownersand associations of small-businessowners in their efforts to offeraccredited vocational training
Human Resources DevelopmentInitiatives by Employers
Implementation of Educationand Training
Career Development Promotion Grants
・ Preconditions for paymentTraining based on a plan
・ Amount of grantsTraining expenses and 1/4 of wages whilein training(1/3 at medium-sized and small enterprises)
Training benefitsAppoint human resources devel-opment promoter
Draw up in-house HumanResources Development plans
Draw up annual HumanResources Development plans
Implementation of career counseling
Examination on vocational ability evalu-ation
Provision of education and trainingvacation systems
Provision of Human ResourcesDevelopment vacation
Implementation of both in-house andoff-site education and training
・ Establish regional vocationaltraining centers and the like
Provide training facilities to smallbusiness owners and associationsof small business owners whooffer vocational training toregional workers
・ Furnish information andconsulting services
Furnish information andconsulting services through theAbility Development DatabaseSystem (ADDS)
・ Preconditions for paymentEducation and training based on a plan,allowance for vacation taken for either avocational ability examination orcareer counseling
・ Amount of grantsEnrollment fee for education and trainingor registration fee for vocational abilityExam, as well as 1/4 of wages during thatperiod (1/3 at medium-sized and smallenterprises)
Incentive money for introduc-
tion of a human resources
development vacation system
・ Preconditions for paymentProvide career counseling based on the program
・ Amounts of grants① 1/2 of commission fees for the first year
of system introduction② 150,000 yen for the placement of in-
house career consultants
※In case of business owners who correspond to either (1) or (2) mentioned below, and medium and small enterprises who are either authorized companies or mem-ber companies of authorized association approved by the improvement program based on the Act concerning the Promotion of Improvement of EmploymentManagement in Small and Medium sized Enterpriss for Securing Manpower and Creating. Quality Jobs, subsidy rates of Training Grants and Professional AbilityDevelopment Grants may become 1/3 (1/2 at small and medium-sized enterprises).(1) Business owners of business establishment located in “Agreed areas for promoting employment and human resources development” stipulated by the Act con-
cerning the Promotion of Local Employment Development, and who hired job applicants in the relevant areas.(2) Business owners of business establishment located in “Agreed areas for stabilizing employment utilizing advances skills” stipulated by the Act concerning the
Promotion of Local Employment Development, and who are members of employers’ association approved by the support program to upgrade human resources.
Career consultation promotionbenefits
・ Preconditions for paymentHaving employees take vocationalability examination based on a plan
・ Amount of grantsRegistration fee for vocational abilityexamination, as well as 3/4 of wages while taking the exam
Incentive money for promotionof vocational ability evaluation
・ Preconditions for paymentIntroduction of long-term education and trainingvacation system, etc. based on a plan
・ Amount of grants1) 300,000 yen for introduction of long-term educa-
tion and training vacation system 2) 150,000 yen for introduction of a periodic vaca-
tion system3) 50,000 yen for each person who takes a vacation
Reward of a long-term education and train-ing vacation system

114 Labor Situation in Japan and Analysis: General Overview 2006/2007
V-23 Status on Implementation of Public Vocational Training
Note: Figures in FY2004 results and FY2005 programs for commissioned trainings and for graduates respectively include the number of peoplereceiving the Dual Program with outsourced Trainings and the Dual Program with Specialized/Regular Courses.
FY2003 resultType of training/provider FY2004 result FY2005 plan
For unemployed workers 182,763 191,321 228,329
outsourced 100,609 128,088 153,854
EHRD 135,558 140,733 156,441
outsourced 75,245 94,380 114,946
Prefectural 47,205 50,588 71,888
outsourced 25,364 33,708 38,908
For employed workers 161,345 174,675 213,830
EHRD 95,464 113,217 123,800
Prefectural 65,881 61,458 90,030
For graduates from school 24,206 23,655 36,170
EHRD 7,490 7,599 6,980
Prefectural 16,716 16,056 29,190
Total 368,314 389,651 478,329
EHRD 238,512 261,549 287,221
Prefectural 129,802 128,102 191,108
(Persons)
1. Number of public human resource development facilities (As of 1 April 2005): 288National (Employment and Human Resources Development Organization of Japan, EHRD): 73Polytechnic University: 1Prefectural facilities: 194Municipal facilities: 1Human Resources Development Centers for the Disabled 19
2. Status and Program of Implementation of Public Vocational Training
FY2003 resultTraining for the disabled FY2004 result FY2005 plan
For unemployed workers (in-house) 1,895 2,099 3,250
For unemployed workers (outsourced) 454 3,110 6,000
For employed workers 488 450 1,000
Total 2,837 5,659 10,250
(Persons)
Short-term IT training (outsourced) 222,436 - -
EHRD 207,257 - -
Prefectural 15,179 - -
Source: Ministry of Health, Labour and Welfare

of a new system for human resources training-Pushing ahead with Leading Efforts to Create ahuman resources superpower-with cooperation, etc.of industry, academia, and the government.
In addition, the Comprehensive EmploymentMeasures were laid down in September 2001; thethree main Programs are creation of employmentopportunities by fostering the development of newmarkets and new industries, corrections in employ-ment mismatches, and improvement of the employ-ment safety net. On the development of professionalability, certain measures have already been put intoeffect. For example, the promotion of professionalcapacity development, making use of all educationaland training resources such as private education and
training institutions, universities and graduateschools, business owners and non-profit organiza-tions. Another measure is the placement at publicemployment security offices of advisors to supportdevelopment of abilities. These advisors will do suchthings as provide consultation for job seekers oncapacity development connected with the job searchprocess, based on understanding their work experi-ence and aptitude. Additionally, there will be place-ment of further advisors who clarify the abilitiesrequired to provide such services to job seekers asconsultation support operations for the promotion ofinformation disclosure on the required professionalability.
115Labor Situation in Japan and Analysis: General Overview 2006/2007
Chapter V Labor Administration and Legislation

Dwindling Birthrates and Aging PopulationThe social security system draws upon tax and
social insurance for its revenue, and is a system thatcarries out social welfare programs to cope with thevarious risks in life faced by people such as thosewhose health has been damaged by illness or disabili-ty, and those who have been deprived of their sourceof income as a result of job loss or retirement. Japan’ssocial security system is similar to those in Europeand the U.S. in that, to satisfy each stage of people’slives, it is composed of such elements as medicalinsurance, public health services, social welfare ser-vices, income maintenance, and employment mea-sures (see VI-1). Of these, medical insurances, healthcare programs for the elderly, long-term care insur-ance and pension systems, as well as unemploymentinsurance and industrial accident compensation insur-ance are the social insurances that are mainlyfinanced by social insurance premiums and partlysubsidized by the government revenues. In contrast,welfares for the child, for single mothers and widows,for the elderly, for the physically disabled, and for thepoor as well as public health services are all publicpolicies provided with funds drawn from taxes.
The Benefits and Cost Burden of SocialSecurity
In order to make an international comparison onthe trend of social security, the Organisation forEconomic Co-operation and Development (OECD) isdisclosing information on indices of social expendi-ture that includes pension funds, medical care andwelfare for the poor, child allowance that gets trans-ferred, social security benefits from expenditures onwelfare services and expenditures such as expenses
for facility development that do not get transferreddirectly to individuals (OECD Social ExpenditureDatabase 2001). Looking at the percentage of socialexpenditure occupying the national income, Japan’sratio is lower than European countries, but higher thanthe U.S. (see VI-2). In contrast, based on the figures inclosely related years, the percentage of nationalincome occupied by social security costs is low whencompared with that in Germany, France, and Sweden,but higher than the U.S. and the U.K. (see VI-3).Japan’s total fertility rate was 2.13 in 1970, which isclose to the replacement-fertility level but lowered to1.29 by 2003. Consequently, according to the 2005National Census, the population growth rate ofJapan’s total population of 127.76 million was 0.7%,the worst growth rate since WWII, and the proportionof elderly persons (population aged 65 and over/totalpopulation×100) was 19.5%. The percentage of theelderly in the total population is forecast to increaseinto the future, reaching the 25% mark in 2014, sothat one out of every four persons in Japan will beaged 65 or older (January 2002 Future PopulationProjection, National Institute of Population and SocialSecurity Research).
Since the medical benefit per persons is approxi-mately 5 times for the elderly compared to the gener-ations still working, the progress of an aging societybecame a factor in the increase in social security ben-efits, as can be seen in Figure VI-4. Placing a premisefor future movements in social security reforms andthe trends in economic factors, the Advisory Councilon Social Security released in 2005 an estimateregarding Japan’s future social security benefits andcost burden (see VI-5). How to adjust such growth inthe benefits and burden of social security and to cre-
116 Labor Situation in Japan and Analysis: General Overview 2006/2007
Chapter VI Social Security System
1 The Subject of Japan’s Social Security System

117Labor Situation in Japan and Analysis: General Overview 2006/2007
Chapter VI Social Security System
VI-1 The Social Security System by Life Stage
Source: Annual Reports on Health, Labour and Welfare, Figure 3-1-1, 2001, Ministry of Health, Labour and Welfare
Health and Medical
Creating wellness, physical examinations, treatment for illness,
recuperation
Social Welfare, etc.
Child welfare, welfare for single mothers and
widows
Welfare for the elderly
Welfare for the physically disabled,
welfare for the mentally disabled,
mental health welfare, etc.
Income Security
Pension system
Public assistance
Public Health
Public and environmental
hygiene, water supply, etc.
Employment Measures
Development ofWorking Ability
WorkingConditions
Adjustment of the labor market
Industrial accident insurance,
unemployment insurance
Birth
Pre-schoolyears School years Childrearing and
working yearsPost-
retirement
age6
age15
age18
age20
age40
age60
age70
Physical exam provided by employer
Medical insurance (health services)
Health care for theelderly (health part)
Medical insurance (medical expenses guaranteed)
Day carecenter
Wholesome education services
Childallowance(Child welfare)
Child support allowance
Providing facilities and other servicesfor children requiring special care
Children’s afterschool clubs
Long-term careinsurance
(Welfare for the person with
disability)
Survivors’ pension
Disability pension
Pension forthe elderly
Guarantee of a minimum standard of living for those who have difficulty maintainingtheir livelihood due to a reason such as inability to work brought on by illness
Improvement of public health standards, supply of safe and good quality water,insure safe standards of food and medical goods
Job introduction, job consultation
When involved in an accident at work, upon losing one’s job, etc.
Public vocational training, support of individualworkers’ voluntary skill development
Measures for safety and health of workers
Child-careleave
Employment ofthe elderly
Health carefor
the elderly(medical
part)Medicalsystem
for retirees
Physical exam and medical care for premature babies, preventative vaccinations,
etc.
Physical checkup,parent/child
healthexam notebook
age 10 age 65
• At-home services (visiting home care, long-term care at facility, short-term admittance, supply of supportive apparatus, etc.)
• Institutional services (facility for disabled children, protective facility, rehabilitation facilities, support facilities, etc.)• Promotion of participation in society (promotion of sports, etc.)• Payment of allowances (special allowance for the disabled, etc.)

ate a sustainable social security system in the futurewhen the working generations will decrease hasbecome a challenge faced in Japan.
Social Security Cost Burden Based on theIncrease in Income Difference and BurdenCapacity
Looking at the trends in the Gini index, the indexfor measuring income inequality based on the IncomeRedistribution Survey, due to the increase in incomedisparity in the 1990s (see Gini index of initialincome in VI-6), the need to increase income redistri-bution through social security in response to this hasbeen heightening (see Redistribution Effects bySocial Security in VI-6).
According to the OECD’s international compara-tive study regarding income disparity, comparing theGini index of the household equivalent disposableincome, after-tax and social security (disposable)income (see VI-5), Japan’s Gini index is larger thanWestern European countries, and smaller than theU.S. and U.K. Since there is a necessity to correctincome disparity as the social security cost burdenincreases, the opinion report by the Advisory Councilon Social Security (June 2003) points out that “thereare disparities in income and property between eachand every citizen, and a careful response based onsuch disparities is necessary,” and “appropriate costburdens should be even expected from elderly per-sons if they have income and property.”
118 Labor Situation in Japan and Analysis: General Overview 2006/2007
VI-2 Ratios of Social Expenditures Accounting for National Income and GDP
45
40
35
30
25
20
15
10
5
0
(%)
Japan (2002) Japan U.S. U.K. Germany France Sweden
vs. National income
vs. GDP
Sources: The Cosf of Social Security in Japan 2003 (Reference Figure 1 International Comparison of the Social Expenditures vs. National Income andthe GDP Ratios (2001)), National Institute of Population and Social Security Research, http://www.ipss.go.jp/
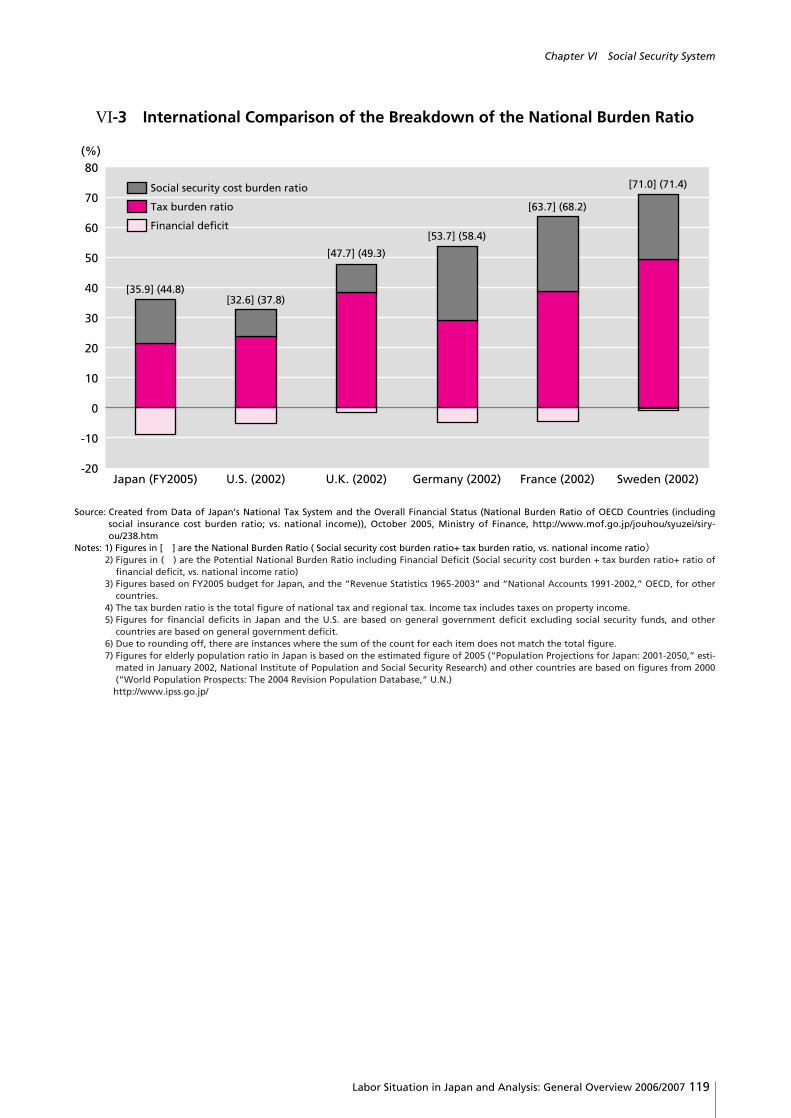
119Labor Situation in Japan and Analysis: General Overview 2006/2007
Chapter VI Social Security System
VI-3 International Comparison of the Breakdown of the National Burden Ratio
80
70
60
50
40
30
20
10
0
-10
-20
(%)
Social security cost burden ratio
Financial deficit
Tax burden ratio
Japan (FY2005) U.S. (2002) U.K. (2002) Germany (2002) France (2002) Sweden (2002)
[35.9] (44.8)[32.6] (37.8)
[47.7] (49.3)
[53.7] (58.4)
[63.7] (68.2)
[71.0] (71.4)
Source: Created from Data of Japan’s National Tax System and the Overall Financial Status (National Burden Ratio of OECD Countries (includingsocial insurance cost burden ratio; vs. national income)), October 2005, Ministry of Finance, http://www.mof.go.jp/jouhou/syuzei/siry-ou/238.htm
Notes: 1) Figures in [ ] are the National Burden Ratio ( Social security cost burden ratio+ tax burden ratio, vs. national income ratio)2) Figures in ( ) are the Potential National Burden Ratio including Financial Deficit (Social security cost burden + tax burden ratio+ ratio of
financial deficit, vs. national income ratio)3) Figures based on FY2005 budget for Japan, and the “Revenue Statistics 1965-2003” and “National Accounts 1991-2002,” OECD, for other
countries.4) The tax burden ratio is the total figure of national tax and regional tax. Income tax includes taxes on property income.5) Figures for financial deficits in Japan and the U.S. are based on general government deficit excluding social security funds, and other
countries are based on general government deficit.6) Due to rounding off, there are instances where the sum of the count for each item does not match the total figure.7) Figures for elderly population ratio in Japan is based on the estimated figure of 2005 (“Population Projections for Japan: 2001-2050,” esti-
mated in January 2002, National Institute of Population and Social Security Research) and other countries are based on figures from 2000(“World Population Prospects: The 2004 Revision Population Database,” U.N.)http://www.ipss.go.jp/

120 Labor Situation in Japan and Analysis: General Overview 2006/2007
VI-4 Changes in Social Security Benefits by Category
Source: Social Security Benefit Costs, 2001, National Institute of Population and Social Security Researchhttp://www.ipss.go.jp/
40
45
35
30
25
20
15
10
5
0
(Trillion yen)
1970 1972 1974 1976 1978 1980 1982 1984 1986 1988 1990 1992 1994 19962000
1999 20012002
2003(FY)
Other benefits12.8669 trillion yen
(15.3%)
Medicalbenefits
26.6154 trillion yen(31.6%)
Pensions44.7845 trillion yen
(53.1%)

121Labor Situation in Japan and Analysis: General Overview 2006/2007
Chapter VI Social Security System
VI-5 Outlook on Social Security Benefits and Cost Burden
Welfare
Long-term care
Medical services
Pension
Social security
Public expense
2004 2025 2004 2025 (Year)
180
160
140
120
100
80
60
40
20
0
(Trillion yen)
Source: Outlook on Social Security Benefits and Cost Burden, estimated in May 2004, Counsellor for Social Security, Office of the Director-Generalof Policy Planning and Evaluation, Ministry of Health, Labour and Welfare
VI-6 Current Condition of Income Disparity and Redistribution Effects by Social Security (Gini Index)
Sources: Study Report on Income Redistribution, Counsellor for Policy Evaluation, 2002, Office of the Director-General of Policy Planning andEvaluation, Ministry of Health, Labour and Welfare
Note: The benefit in kind before 1999 is only for medical care, while medical care, long-term care, and child care are included in 2002.
Initial income Income after redistribution
Income after tax redistribution
(Initial income - tax)
Income after social security redis-tribution (Initial income + benefitin kind + social security benefits -
social insurance premium)
Gini index(A)
Gini index(B)
Improvement rateA - B
A( )Gini index
(C)
Improvement rateA - C
A
Gini index(D)
Improvement rateA - D
A
% % %
1990 0.4334 0.3643 15.9 0.4207 2.9 0.3791 12.5
1993 0.4394 0.3645 17.0 0.4255 3.2 0.3812 13.2
1996 0.4412 0.3606 18.3 0.4338 1.7 0.3721 15.7
1999 0.4720 0.3814 19.2 0.4660 1.3 0.3912 17.1
2002 0.4983 0.3812 23.5 0.4941 0.8 0.3917 21.4
( ) ( )

122 Labor Situation in Japan and Analysis: General Overview 2006/2007
All Japanese citizens are insured in the medicalinsurance and pension systems, which are run underthe principle (insurance for all, pensions for all) thatmedical services or pension benefits be receivableupon becoming ill or reaching old age. WithinJapan’s pension system (see VI-7) is a basic pension;all citizens (persons aged 20 to 59) become membersof this basic pension plan and receive pension bene-fits upon reaching the age for payment of benefits tobegin (age 60 at present, age 65 for men from 2013,and age 65 for women from 2018). For salaried work-ers and government employees, respectively, there areemployees’ pensions and mutual aid pensions to pro-vide pension benefits proportionate to salaries inaddition to the basic pension.
Japan’s pension system is revised once every 5years based on recalculations of pension financing. Inthe pension reform of 2004, it has been decided toadjust the benefits standards along with the economicsituation and the progress of an aging society (how-ever, it is aimed that the standards should not gobelow 50% of the income of the working genera-tions), instead of fixing the future insurance burden toa certain level (18.3% after 2025, in the case foremployees’ pensions), drawing from Sweden’s pen-sion reform of 2001, etc. The basic pension premi-ums for the self-employed are a fixed amount (13,300yen per month in 2004). On the other hand, the pen-sion premiums for salaried workers and governmentemployees are covered equally by the labor and man-agement, and is 13.58% of the total compensationcombining the salaries and bonuses (in 2004).
There is a survivors’ pension for the bereaved ofthe subscriber and beneficiary of the pensions system,and in case the subscriber has or become physically
disabled, a disability pension is provided under spe-cific conditions. The trends of the number of benefi-ciaries of the pension and the amount of benefits paidcan be seen in Table VI-8. Due to the pension reformof FY2004, ever since October 2004 the benefits forthe basic pension has been 65,075yen per month, andthe amount of old-age pension of employees’ pensionwas 230,700 yen when combining the married cou-ples’ basic pension and the husbands’ earnings-relat-ed component.
For the corporate pension that compensates suchpublic pensions, there has been the employees’ pen-sion fund and the tax-qualified pension targetingsalaried workers. However, since there were problemsin protecting vests and the portability of reserves, thedefined benefit corporate pension and the definedcontribution corporate pension were introduced in2001 to solve such problems. Furthermore, there isthe national pension fund as a pension supplementingthe basic pension, for self-employed workers.
The characteristic of Japan’s pension system relat-ing to the labor market is the point that it cooperateswith unemployment insurance. That is, for olderworkers between ages 60 and 64, elderly employmentcontinuation benefits and elderly re-employment ben-efits are provided when wages fall below 85% of hisor her wage around retirement at 60.
Further, to support female workers’ combining ofchildrearing and work activities, payment of employ-ees’ pension insurance premium is excused for boththe worker and employer during the period of childcare leave (For the Assistance Measures to BalanceWork and Family and for the Gender EqualEmployment Policies, see Chapter V ).
2 Pension System

123Labor Situation in Japan and Analysis: General Overview 2006/2007
Chapter VI Social Security System
VI-7 The Pension System
Source: Revised Points of the Pension System Pension Bureau, 2004, Ministry of Health, Labour and Welfare
Dependent spouses of salaried workers*Class 3 insureds
of the national pension
Self-employed workers, etc.*Class 1 insureds of the
national pension
Employees (salaried workers)*Class 2 insureds of the national pension = Insureds of the employees’ pension, etc.
National pension fund
Defined contribution pension (individuals)
Employees‘ pension
National pension (basic pension)
Mutual aid pension
Defined contribution pension (corporate)
Defined benefit corporate pension
Defined contribution pension (corporate)
Employees‘ pension fund (A portion of the main fund is carried out for)
(The portioncarried out)
11.24 million 22.37 million70.46 million persons
*As of the end of 2002
36.85 million
(Occupa-tional)
VI-8 Annual Trends of the Number of Public Pension Subscribers and the Number of Public Pension Beneficiaries
Source: Annual Reports on Health, Labour and Welfare-References, 2005, Ministry of Health, Labour and Welfare
Insured persons
TotalFY
Basic pension
Basic pension
Employees‘pension
Mutual aidassociation
Basic pension
Employees‘pension
Mutual aidassociationTotal
Basic pension by
nationalpensionbefore1986
(Self-employedworkers, etc.:
Class 1insureds)
(Full-timehouse wife:
Class 3)
Number of Beneficiaries
1987 64,105 15,823 9,268 28,216 5,299 22,523 1,118 8,959 8,910 1,488
1990 66,313 17,579 11,956 31,493 5,285 25,001 1,905 9,096 10,647 964
1995 69,952 19,104 12,201 33,275 5,372 32,363 6,898 7,853 14,254 400
2000 70,491 21,537 11,531 32,192 5,231 40,906 13,070 6,234 13,070 137
2003 70,292 22,400 11,094 32,121 4,677 46,901 16,865 5,246 16,865 62
(1,000 persons)

124 Labor Situation in Japan and Analysis: General Overview 2006/2007
Within Japan’s medical insurance there is associa-tion-managed health insurance for employees (andtheir families) of workplaces of five or more workers,government-managed health insurance for employees(and their families) of workplaces with fewer thanfive workers, national health insurance for the self-employed, etc., and medical insurance provided bymutual aid associations for national governmentemployees and local government employees (see VI-9, upper part). Subscribers in medical insurance pro-grams pay the insurance premium themselves, but thesubscribers themselves and their families may receivemedical services at the medical institution of theirchoice by paying only a portion of the medicalexpense. Moreover, the health insurance association,government-managed health insurance association,and national health insurance have an elderly insur-ance system for elderly aged 65 or over requiringlong-term care and for all elderly aged 70 or over. Inthis system (see VI-9, lower part), the medical costburden borne by the elderly is mitigated by contribu-tions from the respective insurance associations,according to the number of elderly subscribers toeach system; the fewer the elderly subscribers, thegreater the contributions.
As seen in Figure VI-3, although medical expens-es increased in the 1990s, the increase has becomemodest in recent years (the ratio of national medicalexpenses to national income has been shiftingbetween 8.0%-8.9% since 2003). However, a reformof high-cost medical care system is being discussedsince the amount of contributions from the nationalhealth insurance and the health insurance associationto the elderly insurance system has increased due tothe aging society, and is making medical insurancefinancing difficult. Given such backgrounds, theelderly insurance system’s self-pay ratio for generalelderly persons became 10% starting October 2002,and that of high-income elderly persons were broughtup to 20% in accordance with the guidelines for theoutline of elderly medical care. Furthermore, in April
2003 the self-pay ratio of the health insurance target-ing workers was raised from the 20% of medical ben-efits to the 30%, the same as in national health insur-ance.
Long-term care insurance has been in operationsince April 2000 to provide public assistance to light-en the care burden for long-term care recipients’ fam-ilies. This assistance makes it easier for bedriddenelderly and other elderly requiring long-term care toreceive this care at home, and for others to receivelong-term care at a facility outside of home. Underthe long-term care insurance system, citizens aged 40and older pay long-term care insurance premium. Inreturn, persons 65 and older who need long-term caremay receive specific long-term care services, such asthe dispatch of a home helper, according to theassessment of committees established locally toapprove the necessity of long-term care. While theinsurance premiums and standards for approval oflong-term care necessity are determined uniformly bythe national government, the above-mentioned localcommittees do the approving based on these stan-dards.
For the provision of long-term care services asbenefits in kind, selection by the person requiringlong-term care shall be regarded highly; services willbe carried out by a provider chosen by the recipientof the care from a list of locally approved long-termcare service providers (see VI-10). Users with certifi-cation of long-term care need are responsible for 10%of the care service expenses. However, there are lim-its to the amount for which the users are held respon-sible so that the burden does not become a significantamount, and for amounts exceeding this limit, thehigh long-term care service cost is provided by themunicipalities, as their insurers.
The Long-term Care Insurance Act was revised in2005 upon the introduction of the long-term careinsurance system (2002) that stipulated to reconsiderit 5 years later. With this, efforts were decided to bemade in the framework of the long-term care insur-
3 Medical Insurance and Long-Term Care Insurance

125Labor Situation in Japan and Analysis: General Overview 2006/2007
Chapter VI Social Security System
VI-9 The Medical Insurance System
Sources: Annual Reports on Health, Labour and Welfare, 2006, Ministry of Health, Labour and WelfareNotes: 1) Persons eligible for health and medical care services for the Aged are the subscribers of any health care insurance aged 75 or older (per-
sons who turned 70 on or before 30 September 2002 are also included as exceptions) as well as those aged 65-74 who are bedridden.2) The proportion of government subsidy provided to the subscribers and their families through the national health insurance association
will be the same as that of government-managed health insurance if they have obtained approval for health insurance eligibilityexemption and re-subscribed anew on 1 September 1997 onwards.
3) Low income person means those who fall under the household exempted of municipal tax.4) Figures for association-managed health insurance, mutual aid insurance, national health insurance, and Health and Medical Service for
Aged are preliminary figures.
Insurance Benefits
Medical Benefits
Payment in part High-Cost MedicalCare Benefits
Hospital Meal
Charge Benefits
30% with following exceptions
Aged less than 3: 20%;
70 and over: 10% (20 % for those whose income exceeds certain level)
10% (20% for those whose income exceeds a certain level)
He
alth
insu
ran
ceN
atio
nal h
ealth
insu
ran
ce
Ord
ina
ry e
mp
loye
es
Mu
tual a
id
insu
ran
ce
Plan
Cash Benefits
Nationalgovernment
29,99014,78715,203
Same as above(additional benefits)
Nationalgovernment
281711
Municipalities2,531
[Administrator]
Municipalities
Seamen’s insurance
Health and Medical Service
Act for the Aged
Nationalgovernment
17566
109Same as above
National governmentemployees
Local governmentemployees
Private schoolinstructors
Same as above(additional benefits)
Farmers; theself-employed
Municipalities2,531
Financial resources
None
9.1% Subsidies
-
-
-
None
43% ofbenefits
Municipalities47,609
51,579
• Sickness benefits• Lump-sum payment for childbirth, child care etc.
• Funeral Expenses etc.
(conditional benefits)
Maximum amount paid by the patient:
(Low income persons) 35,400 yen
(Average income persons) 72,300 yen+ (medical costs – 241,000 yen) x 1%
(High income persons) 139,800 yen+ (medical costs – 466,000 yen) x 1%
Standard amount for aggregation of households:
If there are multiple payments of more than 21,000 yen in the same month, reimbursement is calculated on the basis of their sum.
Burden reduction for those with multiple cases:
If a household has been eligible for reimbursement three times or more within a 12-month peri-od, the amount of payment in part from the fourth time will be:
(Low income persons) 24,600 yen
(Average income persons) 40,200 yen
(High income persons) 77,700 yen
Burden reduction for patients with diseases requiring long-term high-cost medical care
The amount that patients with hemophilia or with chronic kid-ney failure undergoing dialysis treatment, etc. need to bear is:10,000 yen per month
Those aged 70-74: same as elderly insurance
(Standard amount paid by the pa-tient)
* Average income persons: 260 yen/day
* Low in-come per-sons: 210 yen/day for 1-90 days
* Low in-come per-sons: 160 yen/day for 91 days and over
Those aged 70-74: same as elderly insurance
Same as above Low in-come per-sons with excep-tionally low in-come: 300 yen/day
(Very low income among low income persons)
(Low income persons)
(Average income persons)
(Persons with income exceeding a certain income)
(In case of frequent reimbursement)
Maximum amount of payment in part
Outpatient care(per person)
15,000 yen
24,600 yen
40,200 yen
72,300 yen+ (medical cost – 361,500 yen)
x 1%
(40,200 yen)
8,000 yen
8,000 yen
12,000 yen
40,200 yen
Insurer(As of 31
March 2005)
Subscribers(As of 31
March 2005)and
subscriber’sdependents(Unit: 1,000
persons)
Governmentsubsidies
Insurancepremiums
Government-managed
Association-managed
Insured parties,as stipulated in
Article3, Par. 2, HealthInsurance Law
Retired workerseligible foremployees’
insurance benefits
Healthinsurance
associations1,584
Mutual aidassociations
(21)Mutual aidassociations
(54)Mutual aidassociations
(1)
Healthinsurance
associations166
As of theend of
February 200514,532
Employees’insurance
2,676NationalHealth
insurance11,857
Healthinsurance
associations3,970
35,61618,93116,686
9,7114,4495,262
• Sickness benefits• Lump-sum payment for childbirth, child care etc.
• Lump–sum payment for childbirth, child care
Provided byeach medical
insuranceprovider
8.2%
-
Daily rate (Class 1)¥150
Daily rate (Class 13)¥3,010
Each householdis assessed a
fixed amountbased on ability
to pay
Calculations varysomewhataccordingto insurer
54%46%
[Bearer of expenses]• Insures• Public
(Breakdown of public expenses)
National : Prefectures : Municipals 4 : 1 : 1
(from October 2005 to end of September 2006)
32–55% ofbenefits
13.0% ofbenefits
(16.4% ofbenefits
for the elderly)
Subsidies(Budgetary
Aid)
13.0% ofbenefits
(16.4% ofbenefits
for the elderly)
(As of April 2006)
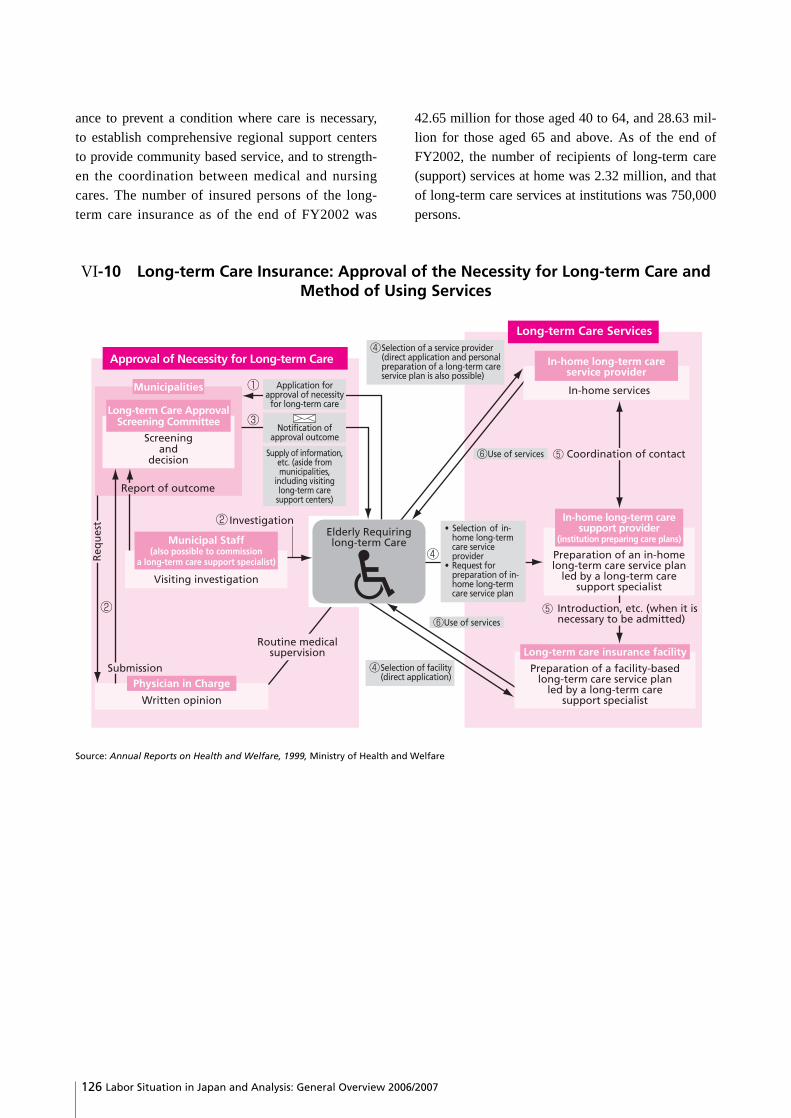
ance to prevent a condition where care is necessary,to establish comprehensive regional support centersto provide community based service, and to strength-en the coordination between medical and nursingcares. The number of insured persons of the long-term care insurance as of the end of FY2002 was
42.65 million for those aged 40 to 64, and 28.63 mil-lion for those aged 65 and above. As of the end ofFY2002, the number of recipients of long-term care(support) services at home was 2.32 million, and thatof long-term care services at institutions was 750,000persons.
126 Labor Situation in Japan and Analysis: General Overview 2006/2007
VI-10 Long-term Care Insurance: Approval of the Necessity for Long-term Care andMethod of Using Services
Source: Annual Reports on Health and Welfare, 1999, Ministry of Health and Welfare
①
④
③
②
Approval of Necessity for Long-term Care
Long-term Care Services
Municipalities
Screeningand
decision
Report of outcome
Municipal Staff(also possible to commission
a long-term care support specialist)
Visiting investigation
② Investigation
Physician in Charge
Written opinion
Req
ues
t
Submission
Routine medicalsupervision
Elderly Requiringlong-term Care
④ In-home long-term care
service provider
In-home long-term caresupport provider
(institution preparing care plans)
Long-term care insurance facility
In-home services
⑥ Use of services
⑥ Use of services
⑤ Coordination of contact
•
•
④ Selection of facility (direct application)
⑤ Introduction, etc. (when it is necessary to be admitted)
Long-term Care ApprovalScreening Committee
Supply of information,etc. (aside frommunicipalities,
including visitinglong-term care
support centers)
Notification ofapproval outcome
Application forapproval of necessity
for long-term care
Selection of a service provider(direct application and personalpreparation of a long-term careservice plan is also possible)
Selection of in- home long-term care service provider Request for preparation of in- home long-term care service plan
Preparation of a facility-basedlong-term care service plan
led by a long-term caresupport specialist
Preparation of an in-homelong-term care service plan
led by a long-term caresupport specialist

127Labor Situation in Japan and Analysis: General Overview 2006/2007
Appendix
Appendix (International Comparisons)
Appendix 1 Population, Labor Force and Labor Force Participation Rate by Gender and Age
(1,000 persons, %)
JAPAN (2004) (15+)
Agegroup
Total
Total population
Active population
Activityrate
Men Women
Total 127670 66420 52 62290 39050 62.7 65380 27370 41.9Total 109910 66410 60.4 53190 39030 73.4 56740 27360 48.2(15+)0–14 17770 . . 9110 . . 8660 . .15–19 6820 1110 16.3 3500 570 16.3 3320 540 16.320–24 7750 5330 68.8 3970 2720 68.5 3790 2610 68.925–29 8840 7450 84.3 4500 4230 94 4340 3210 7430–34 9790 7760 79.3 4940 4770 96.6 4850 2980 61.435–39 8620 6870 79.7 4340 4200 96.8 4280 2670 62.440–44 7880 6600 83.8 3960 3850 97.2 3920 2760 70.445–49 7870 6680 84.9 3940 3820 97 3920 2860 7350–54 9440 7740 82 4700 4500 95.7 4740 3240 68.455–59 9530 7270 76.3 4710 4390 93.2 4830 2880 59.660–64 8590 4700 54.7 4160 2940 70.7 4430 1760 39.765–69 7360 2530 34.4 3490 1590 45.6 3870 930 2470–74 6440 1380 21.4 2940 860 29.3 3500 520 14.975+ 10980 990 9 4040 590 14.6 6950 400 5.8
Total population
Active population
Activityrate
Total population
Active population
Activityrate
GERMANY (2004) (15+)
Agegroup
Total
Total population
Active population
Activityrate
Men Women
Total 82491.000 40047.000 48.5 40330.000 22232.000 55.1 42161.000 17814.000 42.3Total
70667.000 40048.000 56.7 34267.000 22232.000 64.9 36402.000 17814.000 48.9(15+)0–9 7497.000 . . 3848.000 . . 3648.000 . .10–14 4327.000 . . 2216.000 . . 2111.000 . .15–19 4695.000 1347.000 28.7 2410.000 776.000 32.2 2285.000 571.000 25.020–24 4715.000 3253.000 69.0 2416.000 1764.000 73.0 2300.000 1489.000 64.725–29 4448.000 3535.000 79.5 2261.000 1932.000 85.4 2186.000 1603.000 73.330–34 5226.000 4484.000 85.8 2653.000 2508.000 94.5 2573.000 1976.000 76.835–39 6697.000 5872.000 87.7 3407.000 3268.000 95.9 3290.000 2604.000 79.140–44 6852.000 6098.000 89.0 3498.000 3338.000 95.4 3355.000 2760.000 82.345–49 6025.000 5309.000 88.1 3038.000 2864.000 94.3 2987.000 2445.000 81.950–54 5671.000 4722.000 83.3 2807.000 2533.000 90.2 2864.000 2188.000 76.455–59 4680.000 3327.000 71.1 2356.000 1892.000 80.3 2324.000 1434.000 61.760–64 5762.000 1647.000 28.6 2842.000 1071.000 37.7 2920.000 576.000 19.765–69 5437.000 304.000 5.6 2609.000 188.000 7.2 2828.000 117.000 4.170–74 3761.000 95.000 2.5 1708.000 63.000 3.7 2054.000 31.000 1.575+ 6698.000 55.000 0.8 2262.000 35.000 1.5 4436.000 20.000 0.5
Total population
Active population
Activityrate
Total population
Active population
Activityrate
FRANCE (2004) (15+)
Agegroup
Total
Total population
Active population
Activityrate
Men Women
Total ... 27447.400 . ... 14771.100 . ... 12676.300 .Total
49584.900 27447.400 55.4 23811.000 14771.100 62.0 25774.000 12676.300 49.2(15+)15–19 3904.500 452.700 11.6 1991.800 288.000 14.5 1912.700 164.700 8.620–24 3940.800 2225.400 56.5 1992.300 1218.700 61.2 1948.500 1006.600 51.725–29 3741.000 3156.300 84.4 1878.300 1704.500 90.7 1862.700 1451.800 77.930–34 4274.400 3735.800 87.4 2142.000 2042.300 95.3 2132.400 1693.500 79.435–39 4305.100 3804.600 88.4 2140.900 2045.000 95.5 2164.200 1759.600 81.340–44 4351.100 3891.200 89.4 2147.000 2045.000 95.2 2204.100 1846.300 83.845–49 4213.400 3705.400 87.9 2068.100 1948.600 94.2 2145.400 1756.900 81.950–54 4156.600 3481.400 83.8 2047.300 1858.100 90.8 2109.300 1623.300 77.055–59 3879.800 2400.400 61.9 1920.800 1299.500 67.7 1959.000 1100.900 56.260–64 2666.900 468.800 17.6 1306.300 247.900 19.0 1360.500 220.800 16.265–69 2583.700 85.100 3.3 1213.900 50.300 4.1 1369.800 34.900 2.570–74 2527.600 24.700 1.0 1119.800 15.200 1.4 1407.800 9.400 0.775+ 5040.000 15.600 0.3 1842.500 8.000 0.4 3197.600 7.600 0.2
Total population
Active population
Activityrate
Total population
Active population
Activityrate
ITALY (2003) (15+)
Agegroup
Total
Total population
Active population
Activityrate
Men Women
Total 57478.000 24229.000 42.2 27952.000 14765.000 52.8 29525.000 9465.000 32.1Total
49207.000 24229.000 49.2 23697.000 14764.000 62.3 25513.000 9465.000 37.1(15+)0–9 5414.000 . . 2780.000 . . 2634.000 . .10–14 2856.000 . . 1476.000 . . 1379.000 . .15–19 3006.000 446.000 14.8 1540.000 273.000 17.7 1466.000 173.000 11.820–24 3466.000 1836.000 53.0 1751.000 1059.000 60.5 1716.000 777.000 45.325–29 4321.000 3170.000 73.4 2177.000 1793.000 82.4 2144.000 1377.000 64.230–34 4665.000 3716.000 79.7 2357.000 2197.000 93.2 2308.000 1519.000 65.835–39 4709.000 3796.000 80.6 2378.000 2276.000 95.7 2332.000 1520.000 65.240–44 4132.000 3260.000 78.9 2075.000 1989.000 95.9 2057.000 1271.000 61.845–49 3777.000 2886.000 76.4 1884.000 1784.000 94.7 1893.000 1102.000 58.250–54 3915.000 2634.000 67.3 1941.000 1679.000 86.5 1974.000 955.000 48.455–59 3319.000 1420.000 42.8 1625.000 931.000 57.3 1694.000 489.000 28.960–64 3461.000 712.000 20.6 1661.000 527.000 31.7 1801.000 185.000 10.365–69 3072.000 207.000 6.7 1425.000 156.000 10.9 1647.000 51.000 3.170–74 2776.000 84.000 3.0 1215.000 61.000 5.0 1561.000 23.000 1.575+ 4588.000 62.000 1.4 1668.000 39.000 2.3 2920.000 23.000 0.8
Total population
Active population
Activityrate
Total population
Active population
Activityrate
UNITED STATES (2004) (16+)
Agegroup
Total
Total population
Active population
Activityrate
Men Women
Total ...147401 . ... 78979 . ... 68422 .16–19 16222 7114 43.9 8234 3616 43.9 7989 3498 43.820–24 20197 15154 75 10125 8057 79.6 10072 7097 70.525–29 18985 15569 82 9478 8618 90.9 9506 6952 73.130–34 19954 16638 83.4 9879 9180 92.9 10075 7457 7435–39 20573 17169 83.5 10135 9397 92.7 10438 7772 74.540–44 22653 18989 83.8 11121 10142 91.2 11532 8847 76.745–49 21886 18310 83.7 10729 9581 89.3 11158 8729 78.250–54 19359 15448 79.8 9432 8054 85.4 9927 7394 74.555–59 16327 11603 71.1 7916 6139 77.6 8411 5463 6560–64 12592 6410 50.9 5978 3408 57 6614 3002 45.465–69 9800 2710 27.7 4573 1490 32.6 5227 1220 23.370–74 8381 1280 15.3 3721 721 19.4 4660 560 1275+ 16429 1007 6.1 6391 576 9 10038 431 4.3
Total population
Active population
Activityrate
Total population
Active population
Activityrate
UNITED KINGDOM (2004) (16+)
Agegroup
Total
Total population
Active population
Activityrate
Men Women
Total 58494.701 29369.392 50.2 28513.074 15825.883 55.5 29981.627 13543.509 45.20–9 6966.131 . . 3566.643 . . 3399.488 . .10–15 4637.682 . . 2373.708 . . 2263.974 . .16–19 3044.802 1770.291 58.1 1550.865 912.422 58.8 1493.937 857.869 57.420–24 3612.643 2718.980 75.3 1785.374 1431.443 80.2 1827.269 1287.537 70.525–34 7744.095 6445.519 83.2 3770.657 3465.030 91.9 3973.438 2980.489 75.035–49 12891.802 10937.798 84.8 6342.076 5817.720 91.7 6549.726 5120.078 78.250+ 19597.546 7496.804 38.3 9123.751 4199.268 46.0 10473.795 3297.536 31.5
Total population
Active population
Activityrate
Total population
Active population
Activityrate

128 Labor Situation in Japan and Analysis: General Overview 2006/2007
Appendix 2 Ratio of Part-time Workers to Number of Employed
Source: Labour Force Statistics, OECDThe figures from 2001 to 2004 are based on OECD Employment Outlook 2005
Notes: “Part-time workers” refers to those who usually work less than 30 hours per week in their main job. However, figures for Australia arebased on actual working hours. Figures for Japan are for those who have less than 35 actual working hours per week. Figures for the UnitedStates of America are for wage and salaried workers.
Country 1980 1985 1990 1995 2001 2002 2003 2004Total 15.7 16.6 19.2 20.1 24.9 25.1 26.0 25.5
JAPAN Men 7.5 7.8 9.5 10.0 13.7 14.0 14.7 14.2Women 28.6 30.0 33.4 34.9 41.0 41.2 42.2 41.7Total 14.2 14.4 13.8 14.1 13.4 13.3 12.8 13.0
UNITED STATES OF AMERICA Men 8.1 8.4 8.3 8.4 8.0 8.0 8.0 8.1Women 21.9 21.5 20.0 20.3 18.0 18.5 18.8 18.8Total 14.4 17.0 17.0 18.6 18.1 18.8 18.9 18.5
CANADA Men 6.8 8.8 9.1 10.6 10.5 11.0 11.1 10.9Women 25.9 28.2 26.8 28.2 27.0 27.7 27.9 27.2Total 19.7 22.3 22.7 23.0 23.3 24.1
UNITED KINGDOM Men 4.3 5.3 7.3 8.3 8.9 9.6 10.0Women 41.1 40.7 40.3 40.1 40.1 40.4Total 11.0 13.4 14.2 18.3 18.8 19.6 20.1
GERMANY Men 1.7 2.3 3.4 5.1 5.5 5.9 6.3Women 25.4 29.8 29.1 35.0 35.3 36.3 37.0Total 11.2 12.2 14.2 13.8 13.7 12.9 13.4
FRANCE Men 4.3 4.4 5.6 5.1 5.2 4.7 4.8Women 20.3 21.7 24.3 24.4 24.1 22.7 23.6Total 7.5 8.8 10.5 12.2 11.9 12.0 14.9
ITALY Men 3.5 3.9 4.8 5.4 4.9 4.9 5.9Women 16.0 18.2 21.1 23.7 23.5 23.6 28.8Total 14.5 15.1 13.9 13.8 14.1 14.4
SWEDEN Men 5.3 6.8 7.3 7.5 7.9 8.5Women 24.5 24.1 21.0 20.6 20.6 20.8Total 4.5 4.4 7.3 7.6 7.7 8.4
REPUBLIC OF KOREA Men 3.1 2.9 5.2 5.4 5.3 5.9Women 6.5 6.7 10.4 10.6 11.2 11.9Total 18.1 20.4 22.6 25.0 27.2 27.5 27.9 27.1
AUSTRALIA Men 8.3 10.1 11.3 13.5 15.8 16.3 16.5 16.1Women 34.9 36.9 38.5 40.2 41.7 41.4 42.2 40.8
(%)
Source: LABORSTA, ILO
(1,000 persons, %)
REPUBLIC OF KOREA (2004) (15+)
Agegroup
Total
Total population
Active population
Activityrate
Men Women
Total ... 23417.000 . ... 13727.400 . ... 9689.600 .Total
37716.900 23417.200 62.1 18311.700 13727.300 75.0 19405.200 9689.500 49.9(15+)15–19 3070.300 300.500 9.8 1582.000 135.400 8.6 1488.300 165.100 11.120–24 3277.700 1911.300 58.3 1374.500 716.300 52.1 1903.200 1194.900 62.825–29 3792.600 2778.200 73.3 1926.300 1586.400 82.4 1866.300 1191.800 63.930–34 4363.200 3163.000 72.5 2213.700 2079.800 94.0 2149.500 1083.200 50.435–39 4150.400 3214.400 77.4 2119.700 2018.900 95.2 2030.700 1195.500 58.940–44 4253.800 3417.400 80.3 2146.500 2036.700 94.9 2107.300 1380.700 65.545–49 3774.900 2936.000 77.8 1902.500 1761.900 92.6 1872.400 1174.000 62.750–54 2700.500 1969.500 72.9 1355.900 1213.800 89.5 1344.600 755.700 56.255–59 2215.100 1442.700 65.1 1105.800 893.600 80.8 1109.300 549.000 49.560–64 1924.000 1032.400 53.7 913.700 593.500 65.0 1010.300 438.800 43.465–69 1734.800 735.800 42.4 773.800 416.400 53.8 961.000 319.400 33.270–74 1155.600 336.800 29.1 479.300 182.600 38.1 676.300 154.200 22.875+ 1304.000 179.200 13.7 418.000 92.000 22.0 886.000 87.200 9.8
Total population
Active population
Activityrate
Total population
Active population
Activityrate
THAILAND (2004) (15+)
Agegroup
Total
Total population
Active population
Activityrate
Men Women
Total 65197.400 36291.200 55.7 32474.900 20040.100 61.7 32722.500 16251.100 49.7Total
49447.700 36291.200 73.4 24497.200 20040.100 81.8 24950.500 16251.100 65.1(15+)0–14 15749.700 . . 7977.700 . . 7772.000 . .15–19 5518.100 1733.300 31.4 2794.000 1040.200 37.2 2724.100 693.100 25.420–24 5753.000 4151.700 72.2 2918.700 2330.300 79.8 2834.300 1821.400 64.325–29 5796.700 5093.200 87.9 2949.000 2816.600 95.5 2847.700 2276.600 79.930–34 5572.900 5046.700 90.6 2838.600 2742.500 96.6 2734.300 2304.200 84.335–39 5171.000 4716.300 91.2 2599.800 2526.200 97.2 2571.200 2190.100 85.240–49 8992.800 8035.500 89.4 4443.300 4296.400 96.7 4549.500 3739.100 82.250–59 6195.100 4998.100 80.7 3008.500 2756.700 91.6 3186.600 2241.400 70.360+ 6448.100 2516.400 39.0 2945.300 1531.200 52.0 3502.800 985.200 28.1
Total population
Active population
Activityrate
Total population
Active population
Activityrate
SINGAPORE (2003) (15+)
Agegroup
Total
Total population
Active population
Activityrate
Men Women
Total ... 2150.000 . ... 1188.000 . ... 962.000 .Total
2152.000 . 1189.000 . 963.000 .(15+)15–19 ... 36.000 . ... 18.000 . ... 18.000 .20–24 ... 217.000 . ... 87.000 . ... 130.000 .25–29 ... 297.000 . ... 132.000 . ... 165.000 .30–34 ... 313.000 . ... 159.000 . ... 154.000 .35–39 ... 304.000 . ... 173.000 . ... 131.000 .40–44 ... 301.000 . ... 180.000 . ... 121.000 .45–49 ... 267.000 . ... 164.000 . ... 103.000 .50–54 ... 211.000 . ... 132.000 . ... 79.000 .55–59 ... 116.000 . ... 79.000 . ... 37.000 .60–64 ... 54.000 . ... 38.000 . ... 16.000 .65–69 ... 23.000 . ... 17.000 . ... 6.000 .70–74 ... 9.000 . ... 7.000 . ... 2.000 .75+ ... 4.000 . ... 3.000 . ... 1.000
Total population
Active population
Activityrate
Total population
Active population
Activityrate

129Labor Situation in Japan and Analysis: General Overview 2006/2007
Appendix
Appendix 3 Unemployment Rate (official release)
(%)
Country
JAPAN 2.6 2.1 3.2 5.4 5.3 4.7
UNITED STATES OF AMERICA2) 7.2 5.6 5.6 5.8 6.0 5.5
CANADA11) 10.5 8.1 9.5 7.7 7.6 7.2
UNITED KINGDOM2), 4) - 6.9 8.8 5.1 4.8 4.6
GERMANY1), 4) 8.2 6.4 10.1 8.7 10.03 11.04
FRANCE4) 10.2 8.9 11.4 8.9 9.72 9.9
ITALY 10.3 11.0 11.3 9.0 8.7 -
SWEDEN2), 3) 2.8 1.6 7.7 4.0 4.9 5.5
RUSSIA2), 4) - - 9.5 7.9 8.0 7.8
CHINA4), 5) 1.8 2.5 2.9 4.0 4.3 4.2
CHINA, HONG KONG SAR12) 3.2 1.3 3.2 7.3 7.92 6.8
TAIWAN 2.9 1.7 1.8 5.2 5.0 -
REPUBLIC OF KOREA 4.0 2.4 2.0 3.3 3.6 3.7
SINGAPORE4), 6) 4.1 1.7 2.7 5.2 5.4 -
MALAYSIA2), 7) 6.9 5.1 2.8 3.5 3.6 -
THAILAND2), 3), 4) 3.7 3.5 1.7 1.8 1.5 1.5
INDONESIA4) - 2.8 7.2 9.1 - -
PHILIPPINES4) 6.1 8.1 8.4 10.2 10.2 10.9
AUSTRALIA8) 8.3 6.9 8.4 6.4 6.0 5.6
NEW ZEALAND3), 9) 4.0 7.8 6.3 5.2 4.7 3.9
BRAZIL2), 4), 10) 3.4 3.7 6.1 9.2 9.7 -
1985 1990 1995 2002 2003 2004
Sources: Yearbook of Labour Statistics, ILORussia and Indonesia: Cabinet Office Overseas Economic DataJapan: Labour Force Survey, Bureau of Statistics, Ministry of Internal Affairs and CommunicationsLabour Market Trends, United Kingdom National StatisticsThe figures for 2002 and 2004 are based on LABORSTA, ILO
Notes: 1) 1985 and 1990 figures are for the former West Germany.2) Ages: United States Of America and United Kingdom, 16 and above; Thailand, 13 and above; Brazil, 10 and above; Sweden, 16–64;
Russia, 15–72; Malaysia, 15–64; all other countries, 15 and above.3) 1985 ages: Sweden, 16–74; Thailand, 11 and above; New Zealand, 15–60.4) Figures: China, as of December; Singapore, as of June; Philippines, as of October (fourth quarter in 1985); Brazil, as of September;
Thailand, as of August, Indonesia, as of May, Russia, as of October, France, Prior to 2003: March of each year, UK, as March - May ofeach year, Germany, as of April in 2002, May in 2003, March in 2004.
5) Figures in urban areas.6) 1990 figures are based on population survey.7) Figures obtained by subtracting employment rate from 100%.8) 1985 figures include unpaid family business working less than 15 hours 1995 figures are estimates based on national census.9) 1985 figures include students on vacation seeking jobs.
10) Average among the six largest cities.11) Excl. residents of the Territories and indigenous persons living on reserves. Excl. full-time members of the armed forces.12) Methodology revised.

130 Labor Situation in Japan and Analysis: General Overview 2006/2007
Appendix 4 Wages (manufacturing industries)
(Total Men/Women)
Country, Region 1985 1990 1995 2000 2001 2002
(Yen/month) 299,531 352,020 390,600 406,707 406,089 401,469
JAPAN (E)2) (Yen/day) 14,129 17,006 19,727 20,645 20,719 20,483
(Yen/hour) 1,667 1,909 2,383 2,469 2,493 2,451
UNITED STATES OF AMERICA (E)3) (Dollars/hour) 9.54 10.83 12.37 14.37 14.83 15.30
CANADA (E)4) (Dollars/hour) 11.64 14.20 16.62 18.29 18.58 19.10
UNITED KINGDOM (E)5) (Pounds/hour) 3.64 6.05 7.85 9.86 10.49 11.08
GERMANY (E)6) (Marks/hour) 16.20 20.07 25.48 27.78 14.42 14.72
FRANCE (E)7) (Francs/hour) 37.75 45.46 52.78 - - 1,563
ITALY (R)8) (1990 figure = 100) - 100.0 128.7 113.1 115.2 104.2
SWEDEN (E)9) (Kroners/hour) 58.58 87.33 106.95 111.30 114.90 118.20
RUSSIA (E)10) (Rubles/month) - - 464,792 - - -
CHINA (E) (Yuan/month) 92.58 172.25 430.75 729.00 - 916.75
CHINA, HONG KONG SAR (R) (Dollars/day) 98.3 179.5 278.0 335.4 342.6 326.1
REPUBLIC OF KOREA (E)11) (Won/month) 270.00 590.8 1,123.9 1,601.5 1,702.4 1,907.0
SINGAPORE (E)12) (Dollars/month) - 1,395 2,157 3,036 3,117 3,054
THAILAND (R)13) (Baht/month) 2,826 3,357 4,994 - - -
PHILIPPINES (E)14) (Pesos/month) 1,951 4,263 6,654 - - -
INDIA (E) (Rupees/month) 740.2 988.4 1,211.0 - - -
AUSTRALIA (E)15) (Dollars/hour) 9.45 12.89 15.59 - - 20.45
NEW ZEALAND (E)16) (Dollars/hour) 8.36 13.31 14.78 16.98 17.53 18.00
BRAZIL17) (Real/month) 1,607.20 26.08 631.00 762.55 846.00 901.85
Sources: Yearbook of Labour Statistics, 2003, ILOMonthly Labour Survey, 2003, Ministry of Health, Labour and Welfare
Notes: 1) (E) = Actual wages (R) = Wage ratio2) Regular employees at establishments with more than 30 employees according to the Monthly Labour Survey. Special wages such as
bonuses are included. Working hours are the total actual working hours.3) Manufacturing and construction workers on a non-management level in the private sector (from 1985). From 1988 the industrial classifi-
cations were changed.4) Employees paid an hourly wage.5) Figures for April each year, showing the wage ratio for adult, full-time employees, excluding Northern Ireland, but including quarry
workers (1985).6) Figures prior to 1998 are for the former West Germany, including family allowances paid directly by the employer. Years 2000 and prior
based on marks. 1 euro = 1.95583 marks.7) Figures for October each year. Years 1999 and prior based on francs/hour. 1 euro = 6.55957 francs.8) Using 1990 = 100, from 1996, December 1995 = 100.9) Figures are for adult employees in the second quarter each year, and before 1996 include holiday allowances, allowances for sick leave
and appraisal value for wages in kind. From 1993 the industrial classifications were changed.10) Firgures for 1997 based on 1995 result and on new ruble from 1997. 1 new ruble = 1,000 old rubles.11) In units of 1,000 (from 1985). Includes appraisal value for wages in kind and family allowances. From 1993 the industrial classifications
were changed.12) From 1998 the industrial classifications were changed.13) Figures for March each year. Wage ratio against fixed working hours, excluding publicly owned enterprises (from 1994).14) Companies with more than 10 employees. Calculation based on annual salary. Targets corporations with 20 persons and over
(from1998).15) Figures for May each year for full-time non-management staff (from 1990). Figures for 1985 are for November. In 1994 and from 1996
the industrial classifications were changed.16) Companies with more than 0.5 (equivalent) full-time employees (from 2000). Figures from 1989 to 1999 are for companies with more
than 1 (equivalent) full-time employee. Figures prior to 1988 are for companies with more than 2 (equivalent) full-time employees.From 1994 the industrial classifications were changed.
17) Figures based on value in December every year and on Cruzeiro for years 1994 and prior. 1 cruzeiro = 2,750×1,000 reals.
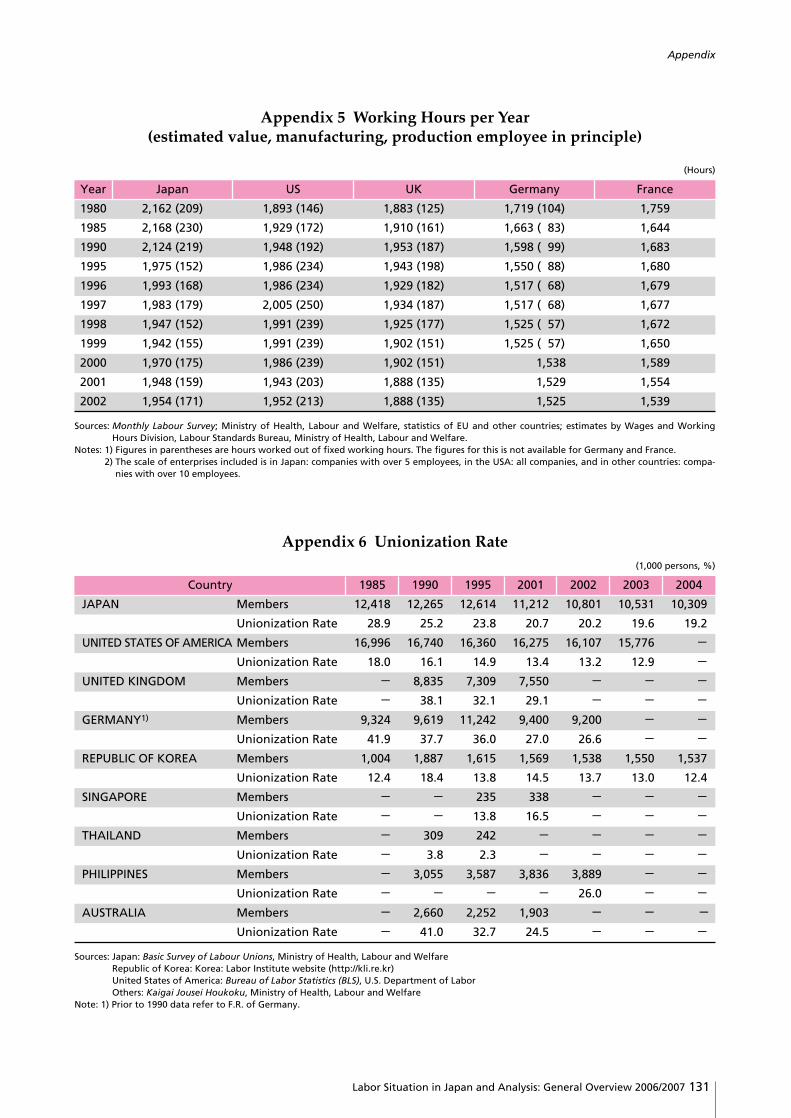
131Labor Situation in Japan and Analysis: General Overview 2006/2007
Appendix
Appendix 5 Working Hours per Year (estimated value, manufacturing, production employee in principle)
(Hours)
Sources: Monthly Labour Survey; Ministry of Health, Labour and Welfare, statistics of EU and other countries; estimates by Wages and WorkingHours Division, Labour Standards Bureau, Ministry of Health, Labour and Welfare.
Notes: 1) Figures in parentheses are hours worked out of fixed working hours. The figures for this is not available for Germany and France.2) The scale of enterprises included is in Japan: companies with over 5 employees, in the USA: all companies, and in other countries: compa-
nies with over 10 employees.
Year
1980 2,162 (209) 1,893 (146) 1,883 (125) 1,719 (104) 1,759
1985 2,168 (230) 1,929 (172) 1,910 (161) 1,663 ( 83) 1,644
1990 2,124 (219) 1,948 (192) 1,953 (187) 1,598 ( 99) 1,683
1995 1,975 (152) 1,986 (234) 1,943 (198) 1,550 ( 88) 1,680
1996 1,993 (168) 1,986 (234) 1,929 (182) 1,517 ( 68) 1,679
1997 1,983 (179) 2,005 (250) 1,934 (187) 1,517 ( 68) 1,677
1998 1,947 (152) 1,991 (239) 1,925 (177) 1,525 ( 57) 1,672
1999 1,942 (155) 1,991 (239) 1,902 (151) 1,525 ( 57) 1,650
2000 1,970 (175) 1,986 (239) 1,902 (151) 1,538 1,589
2001 1,948 (159) 1,943 (203) 1,888 (135) 1,529 1,554
2002 1,954 (171) 1,952 (213) 1,888 (135) 1,525 1,539
Japan US UK Germany France
Appendix 6 Unionization Rate(1,000 persons, %)
Sources: Japan: Basic Survey of Labour Unions, Ministry of Health, Labour and WelfareRepublic of Korea: Korea: Labor Institute website (http://kli.re.kr)United States of America: Bureau of Labor Statistics (BLS), U.S. Department of LaborOthers: Kaigai Jousei Houkoku, Ministry of Health, Labour and Welfare
Note: 1) Prior to 1990 data refer to F.R. of Germany.
Country
JAPAN Members 12,418 12,265 12,614 11,212 10,801 10,531 10,309
Unionization Rate 28.9 25.2 23.8 20.7 20.2 19.6 19.2
UNITED STATES OF AMERICA Members 16,996 16,740 16,360 16,275 16,107 15,776 -
Unionization Rate 18.0 16.1 14.9 13.4 13.2 12.9 -
UNITED KINGDOM Members - 8,835 7,309 7,550 - - -
Unionization Rate - 38.1 32.1 29.1 - - -
GERMANY1) Members 9,324 9,619 11,242 9,400 9,200 - -
Unionization Rate 41.9 37.7 36.0 27.0 26.6 - -
REPUBLIC OF KOREA Members 1,004 1,887 1,615 1,569 1,538 1,550 1,537
Unionization Rate 12.4 18.4 13.8 14.5 13.7 13.0 12.4
SINGAPORE Members - - 235 338 - - -
Unionization Rate - - 13.8 16.5 - - -
THAILAND Members - 309 242 - - - -
Unionization Rate - 3.8 2.3 - - - -
PHILIPPINES Members - 3,055 3,587 3,836 3,889 - -
Unionization Rate - - - - 26.0 - -
AUSTRALIA Members - 2,660 2,252 1,903 - - -
Unionization Rate - 41.0 32.7 24.5 - - -
1985 1990 1995 2001 2002 2003 2004

132 Labor Situation in Japan and Analysis: General Overview 2006/2007
Index
annual paid leave, 46, 47, 98, 100
annual working hours, 46, 47, 98, 99
association-managed health insurance, 125
bank of human resources, 96, 97
basic pension, 122, 123
broad rotation, 40
bubble economy, 3, 8, 17, 24, 72
care services, 124, 125, 126
career development, 43, 54, 112, 113
Child Care and Family Care Leave Act, 59, 108
collective bargaining, 64, 69, 70, 71
collective dismissals, 59, 62
collective labor disputes, 74
completely unemployed persons, 17, 20, 22
Comprehensive Support Center for Student Employment,
90, 96, 97
compulsory benefit costs, 50, 52
de-facto working hours, 48
disabled workers, 58, 82, 85, 87
disciplinary dismissals, 62
discretionary scheduling system, 99
dismissals, 33, 58, 59, 62
dispatched workers, 8, 19, 21, 27, 28, 30, 70
double-track personnel system, 41
electrical power industry type of wage composition, 45
employees’ pensions, 122
employment measures for the youth, 89, 90
employment quota system for disabled persons, 85, 86
employment structure, 24
employment structure by main industries, 24
employment structure by type of work, 24
enterprise labor unions, 68, 69
enterprise unions, 64, 67, 69, 71
estimated unionization rate, 65, 67
family care leave, 59, 108
foreign population, 15, 17
foreign workers, 92, 93, 94
freeters, 9, 11, 54, 81, 89, 90, 92
Fundamental Policy for Employment Measures for
Disabled Persons, 86
future population, 116
G5 Plaza Accord in 1985, 24
government-managed health insurance, 51, 124, 125
Hello Work Plaza, 96, 97
high economic growth, 14, 33
hiring process, 36
industrial safety and health measures, 103
industry trade unions, 67
In-house Training, 33, 40, 54, 55
in-house venture systems, 43
insurance premiums, 50, 103, 104, 116, 124, 125
internet, 35, 37
IT, 3, 9, 24, 27, 34, 40, 114
Japanese-style dual system, 89, 90
labor costs, 3, 9, 28, 47, 50, 53
E
F
G
H
J
L
I
A
B
C
D

133Labor Situation in Japan and Analysis: General Overview 2006/2007
Index
labor disputes, 58, 69, 70, 71, 74, 75
labor force, 8, 11, 14, 16, 17, 18, 20, 22, 82, 92, 108, 127
labor force ratio, 17, 18
Labor Standards Act, 46, 47, 59, 98
labor tribunal system, 77, 78
labor unions, 33, 64, 65, 66, 67, 68, 69, 70, 71, 72
labor-management consultation, 64
labor’s basic rights, 69
Act on Promoting the Resolution of Individual Labor
Disputes, 75
legal employment quotas, 85
levy and grant system for employing persons with
disabilities, 86
lifetime employment, 20, 32, 33, 34
lifetime employment system, 32, 33
local minimum wage, 101
long-term care insurance, 116, 124, 126
long-term employment, 32, 33, 40, 51, 54, 64, 65, 67
“M” curve, 18
mandatory retirement system, 58, 59
medical insurance, 50, 51, 116, 117, 122, 124, 125
mid-career job seeker, 35
Minimum Wage Act, 101
Minimum Wages Councils, 101
mutual aid pensions, 122
national centers, 64, 69, 71
national health insurance, 125
NEET, 9, 11, 89, 90, 92
new graduate market, 35
non-regular staff, 8, 19, 21, 27, 28, 30
non-scheduled working hours, 9, 46, 47, 48
Off-JT, 54, 55
oil crises, 2
OJT, 54, 55, 56, 64
overtime working hours, 98, 99, 100
part-time job bank, 96, 97
part-time workers, 11, 19, 21, 27, 28, 29, 30, 34, 46, 47, 65,
68, 70, 97, 103, 110, 111, 128
pattern setter, 72
pension insurance, 50, 51, 52, 122
points considered important when hiring, 38, 39
population growth rate, 14, 116
positive action, 107
Public Employment Security Offices, 81, 82, 83, 84, 85, 86,
90, 91, 94, 96, 97
public pensions, 122
public vocational training, 112, 114, 117
regional migrations, 14
regular hire, 40
regular staff, 8, 19, 20, 21, 27, 28, 29, 30, 69
relationship between social security benefits and costs,
retirement, 33, 45, 50, 51, 52, 53, 54, 58, 59, 62, 64, 68, 70,
75, 76, 82, 83, 84, 107, 116, 122
retirement benefits system, 45, 51
scheduled earnings, 9, 44
scheduled working hours, 9, 46, 47, 48, 98, 99, 100
seniority-based promotion system, 40
seniority-based wage system, 34, 44, 65
sexual harassment, 74, 107
Shunto (spring wage offensive), 64
Silver Human Resource Centers, 83, 84
social insurance premium, 50, 51, 121
social security costs, 116
social security system, 83, 116, 117, 118
spring wage offensive, 64, 72
temporary workers, 11, 19, 21, 27, 28
M
N
O
P
R
S
T

134 Labor Situation in Japan and Analysis: General Overview 2006/2007
Tenth Industrial Accident Prevention Plan, 103
total fertility rate, 109, 116
unemployment insurance, 50, 51, 52, 116, 117, 122
unemployment rate, 2, 4, 8, 9, 10, 12, 20, 22, 23, 80, 129
variable scheduling system, 48, 98, 99
wage composition, 45
wage profile, 44
white-collarization of blue collar workers, 44
Workers’ Compensation Insurance System, 103, 104
working conditions, 20, 30, 40, 46, 52, 58, 64, 69, 70, 73,
74, 75, 94, 100, 101, 104, 111
year 2007 problem, 54
W
Y
U
V

135Labor Situation in Japan and Analysis: General Overview 2006/2007
Contributing Authors
Hirokazu Fujii, The Japan Institute for Labour Policy and TrainingChapter I Section 1 The Japanese Economy: Current Situation and Outlook for the FutureChapter I Section 2 Characteristics of the Recent Labor Situation
Ryoji Nakamura, The Japan Institute for Labour Policy and TrainingChapter II Section 1 Population and Labor Force
Hiroaki Watanabe, The Japan Institute for Labour Policy and TrainingChapter II Section 1 Population and Labor Force
Minoru Ito, The Japan Institute for Labour Policy and TrainingChapter II Section 2 Employment and Unemployment TrendsChapter III Section 1 The Long-Term Employment SystemChapter III Section 3 Assignments and Transfers
Keiichi Akiyama, The Japan Institute for Labour Policy and TrainingChapter II Section 3 Changes in the Employment Structure
Hiromi Hara, The Japan Institute for Labour Policy and TrainingChapter II Section 4 Diversification in Forms of Employment
Shinsaku Matsumoto, The Japan Institute for Labour Policy and TrainingChapter III Section 2 Recruiting and Hiring
Haruhiko Hori, The Japan Institute for Labour Policy and TrainingChapter III Section 4 Wages
Kazuya Ogura, The Japan Institute for Labour Policy and TrainingChapter III Section 5 Working HoursChapter III Section 6 Company Benefits
Yoichi Kimura, The Japan Institute for Labour Policy and TrainingChapter III Section 7 Career Development through In-house Training and Education
Hirokuni Ikezoe, The Japan Institute for Labour Policy and TrainingChapter III Section 8 Resignation, Mandatory Retirement and DismissalsChapter IV Section 4 Individual Labor-Management Dispute Settlement
Shunichi Uemura, The Japan Institute for Labour Policy and TrainingChapter IV Section 1 Labor-Management Relations in Japan
OH, Hak-Soo The Japan Institute for Labour Policy and TrainingChapter IV Section 2 Situation for Union Organizations and Structure of Labor Unions
Noboru Ogino, The Japan Institute for Labour Policy and TrainingChapter IV Section 3 Shunto: Spring Wage Offensive
Employment Security Bureau, Ministry of Health, Labour and WelfareChapter V Section 1 Employment Measures and Relief for the UnemployedChapter V Section 2 Policies Designed to Secure Employment for Older and Disabled WorkersChapter V Section 3 Employment Measures for the YouthChapter V Section 4 Issues of Foreign WorkersChapter V Section 5 Public Job Introduction System
Labour Standards Bureau, Ministry of Health, Labour and WelfareChapter V Section 6 Measures to Shorten Working HoursChapter V Section 7 The Minimum Wage SystemChapter V Section 8 Industrial Safety and Health
Equal Employment, Children and Families Bureau, Ministry of Health, Labour and WelfareChapter V Section 9 Gender Equal Employment PoliciesChapter V Section 10 Assistance Measures to Balance Work and FamilyChapter V Section 11 Part-Time Work Policies
Human Resources Development Bureau, Ministry of Health, Labour and WelfareChapter V Section 12 Public Vocational Training Policies
Yoshihiro Kaneko, National Institute of Population and Social Security ResearchChapter VI Section 1 The subject of Japan’s Social Security SystemChapter VI Section 2 Pension SystemChapter VI Section 3 Medical Insurance and Long-Term Care Insurance
URL: http://www.jil.go.jp/english/lsj.html
© The Japan Institute for Labour Policy and Training, 2006.
All rights reserved.
No part of this book may be reproduced without the permission of the publisher.
First published in 2006
by The Japan Institute for Labour Policy and Training
4-8-23, Kami-Shakujii, Nerima-ku, Tokyo 177-8502, JAPAN
Telephone: +81-3-5903-6316 Facsimile: +81-3-3594-1113
Printed in Japan
Labor Situation in Japan and Analysis: General Overview 2006/2007
(日本の労働事情と分析 総論版 2006/2007)
2006年11月30日第1刷発行
編 集 独立行政法人 労働政策研究・研修機構
発行者 吉田 克己
発行所 独立行政法人 労働政策研究・研修機構
〒177-8502 東京都練馬区上石神井4丁目8番23号
電話:03-5903-6316(編集)ファクシミリ:03-3594-1113
製 作 大東印刷工業株式会社
Printed in Japan