Embed Size (px)
Citation preview
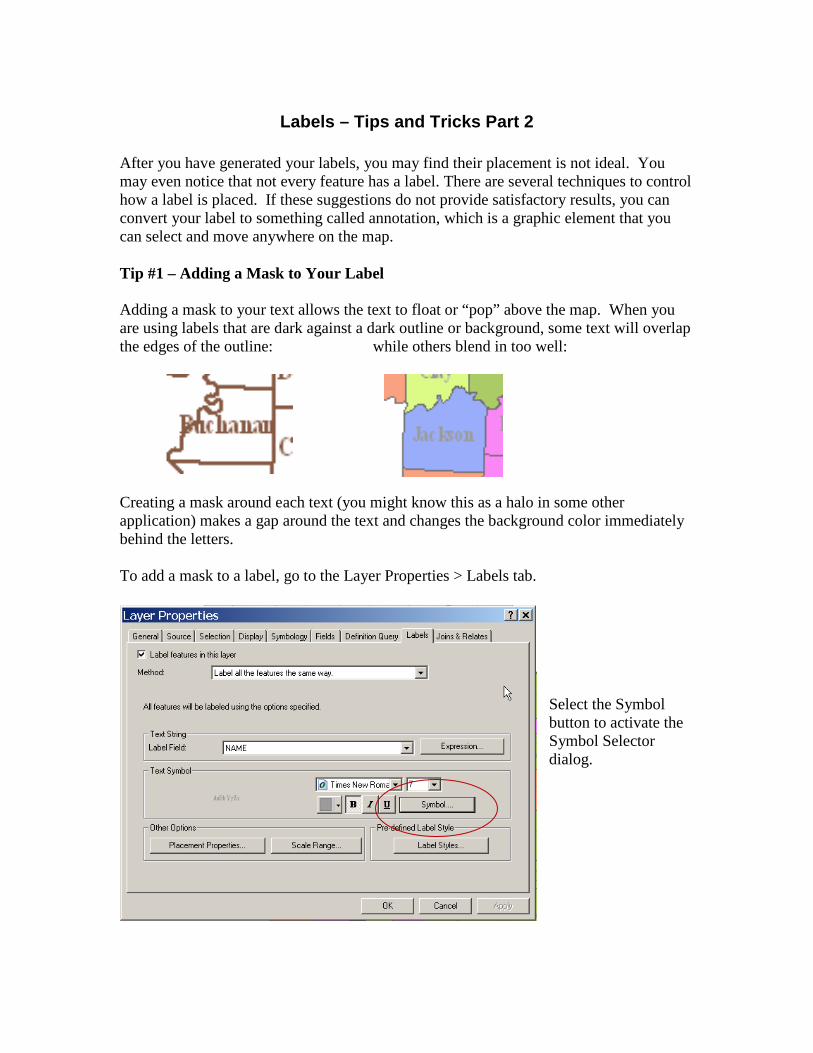
Labels – Tips and Tricks Part 2 After you have generated your labels, you may find their placement is not ideal. You may even notice that not every feature has a label. There are several techniques to control how a label is placed. If these suggestions do not provide satisfactory results, you can convert your label to something called annotation, which is a graphic element that you can select and move anywhere on the map. Tip #1 – Adding a Mask to Your Label Adding a mask to your text allows the text to float or “pop” above the map. When you are using labels that are dark against a dark outline or background, some text will overlap the edges of the outline: while others blend in too well:
Creating a mask around each text (you might know this as a halo in some other application) makes a gap around the text and changes the background color immediately behind the letters. To add a mask to a label, go to the Layer Properties > Labels tab.
Select the Symbol button to activate the Symbol Selector dialog.
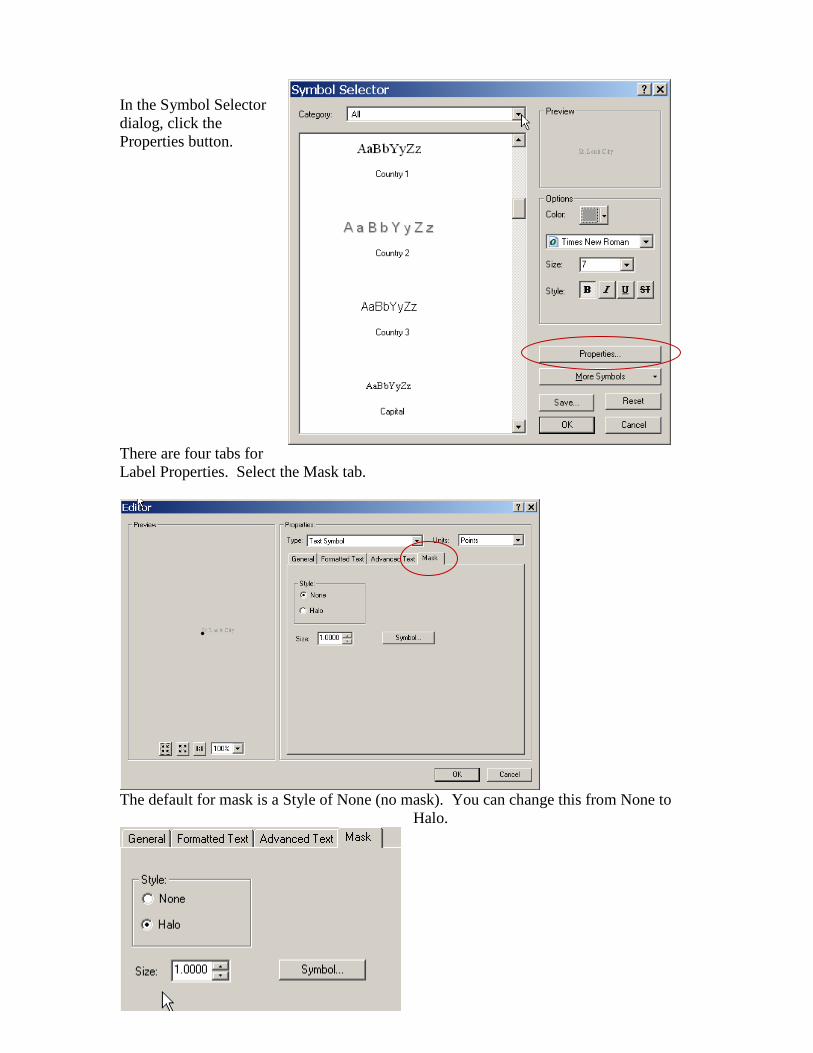
In the Symbol Selector dialog, click the Properties button. There are four tabs for Label Properties. Select the Mask tab.
The default for mask is a Style of None (no mask). You can change this from None to
Halo.
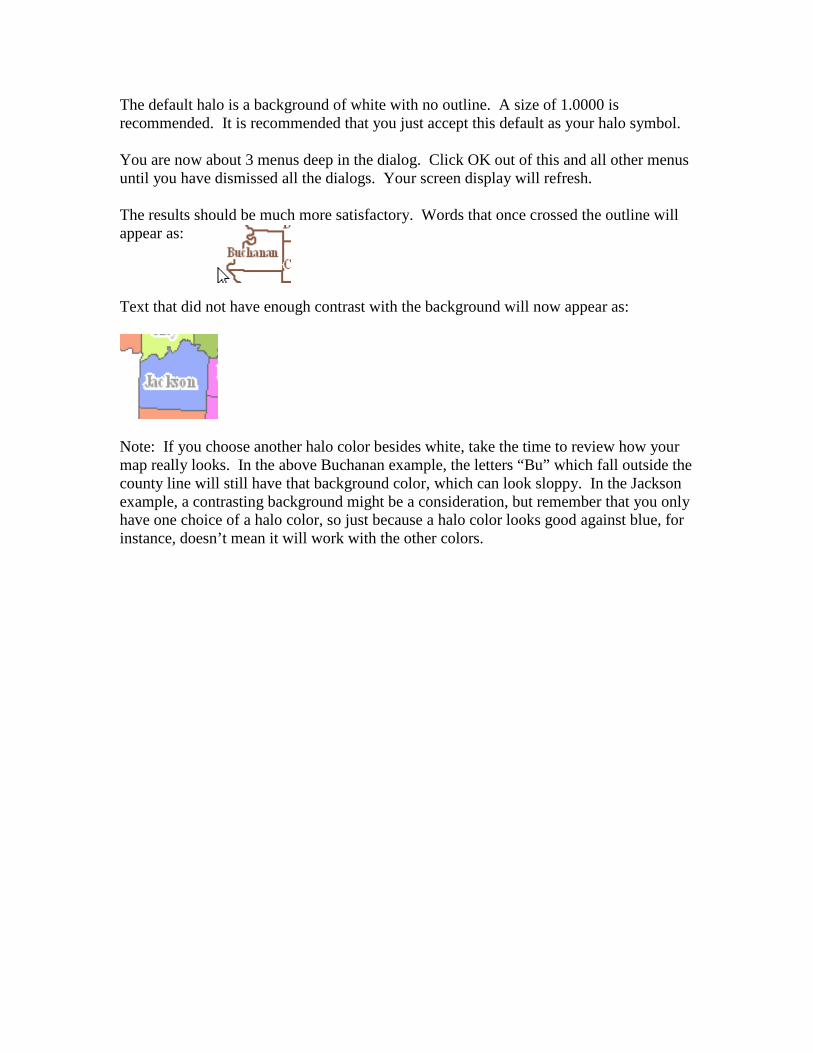
The default halo is a background of white with no outline. A size of 1.0000 is recommended. It is recommended that you just accept this default as your halo symbol. You are now about 3 menus deep in the dialog. Click OK out of this and all other menus until you have dismissed all the dialogs. Your screen display will refresh. The results should be much more satisfactory. Words that once crossed the outline will appear as: Text that did not have enough contrast with the background will now appear as:
Note: If you choose another halo color besides white, take the time to review how your map really looks. In the above Buchanan example, the letters “Bu” which fall outside the county line will still have that background color, which can look sloppy. In the Jackson example, a contrasting background might be a consideration, but remember that you only have one choice of a halo color, so just because a halo color looks good against blue, for instance, doesn’t mean it will work with the other colors.
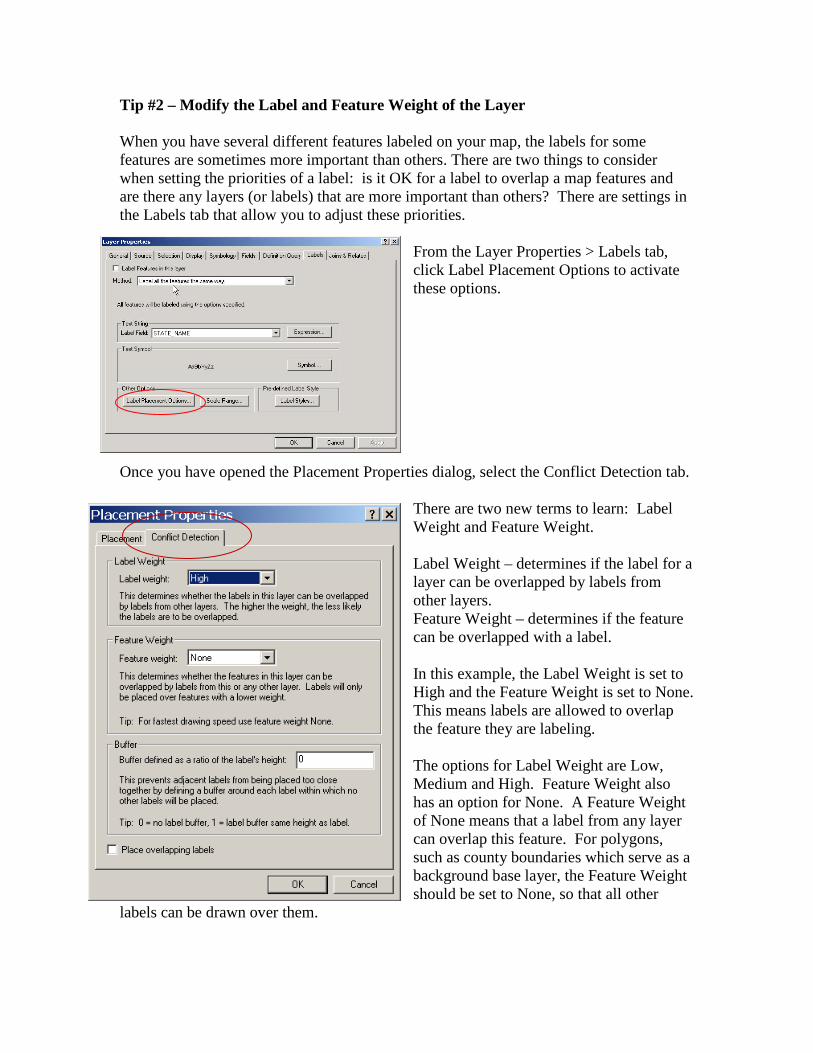
Tip #2 – Modify the Label and Feature Weight of the Layer When you have several different features labeled on your map, the labels for some features are sometimes more important than others. There are two things to consider when setting the priorities of a label: is it OK for a label to overlap a map features and are there any layers (or labels) that are more important than others? There are settings in the Labels tab that allow you to adjust these priorities.
From the Layer Properties > Labels tab, click Label Placement Options to activate these options.
Once you have opened the Placement Properties dialog, select the Conflict Detection tab.
There are two new terms to learn: Label Weight and Feature Weight. Label Weight – determines if the label for a layer can be overlapped by labels from other layers. Feature Weight – determines if the feature can be overlapped with a label. In this example, the Label Weight is set to High and the Feature Weight is set to None. This means labels are allowed to overlap the feature they are labeling. The options for Label Weight are Low, Medium and High. Feature Weight also has an option for None. A Feature Weight of None means that a label from any layer can overlap this feature. For polygons, such as county boundaries which serve as a background base layer, the Feature Weight should be set to None, so that all other
labels can be drawn over them.
If it is important that no labels overlap the features they are labeling (generally the case with point features), you should change the Feature Weight to High. Click OK and view the results on the map. The more changes you make to labels, the longer it is likely to take to redraw. Be patient while this is happening because clicking anywhere on the map while labels are trying to generate acts as a Stop Drawing to the screen. If you want to use this is a quick way to interrupt the drawing that’s fine; just be aware that you have stopped a process that was not done yet (and you won’t be seeing a completed set of labels for all your layers).
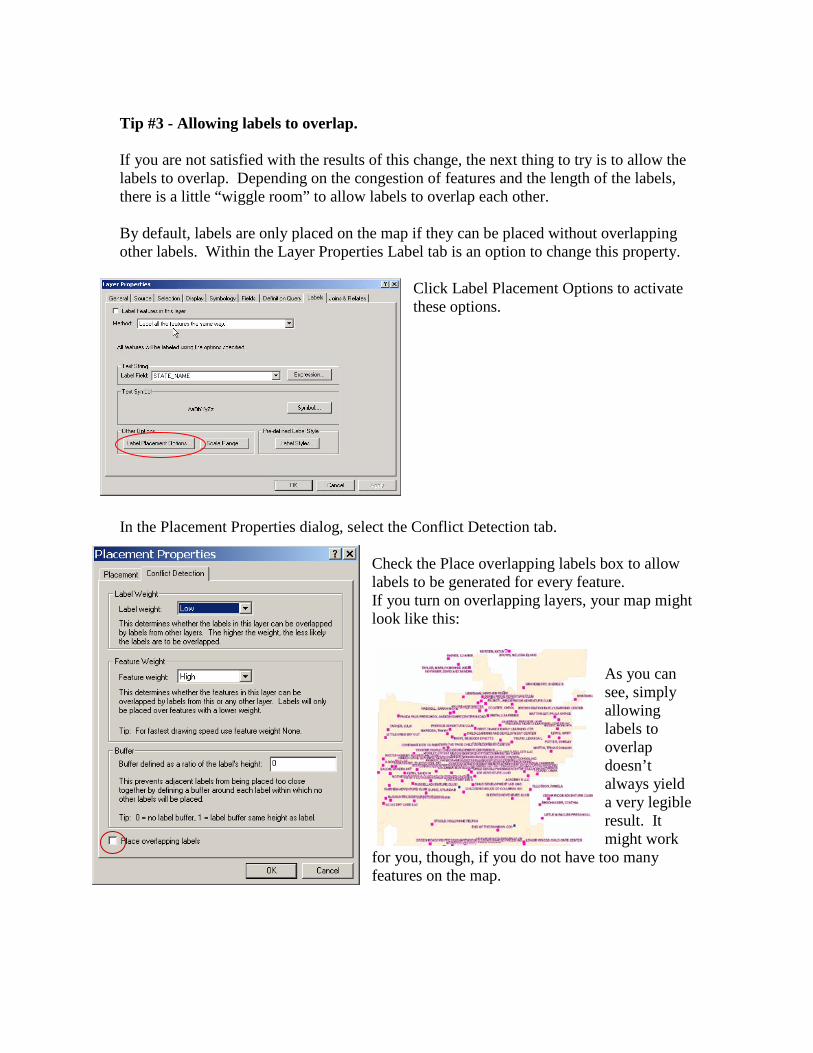
Tip #3 - Allowing labels to overlap. If you are not satisfied with the results of this change, the next thing to try is to allow the labels to overlap. Depending on the congestion of features and the length of the labels, there is a little “wiggle room” to allow labels to overlap each other. By default, labels are only placed on the map if they can be placed without overlapping other labels. Within the Layer Properties Label tab is an option to change this property.
Click Label Placement Options to activate these options.
In the Placement Properties dialog, select the Conflict Detection tab.
Check the Place overlapping labels box to allow labels to be generated for every feature. If you turn on overlapping layers, your map might look like this:
As you can see, simply allowing labels to overlap doesn’t always yield a very legible result. It might work
for you, though, if you do not have too many features on the map.
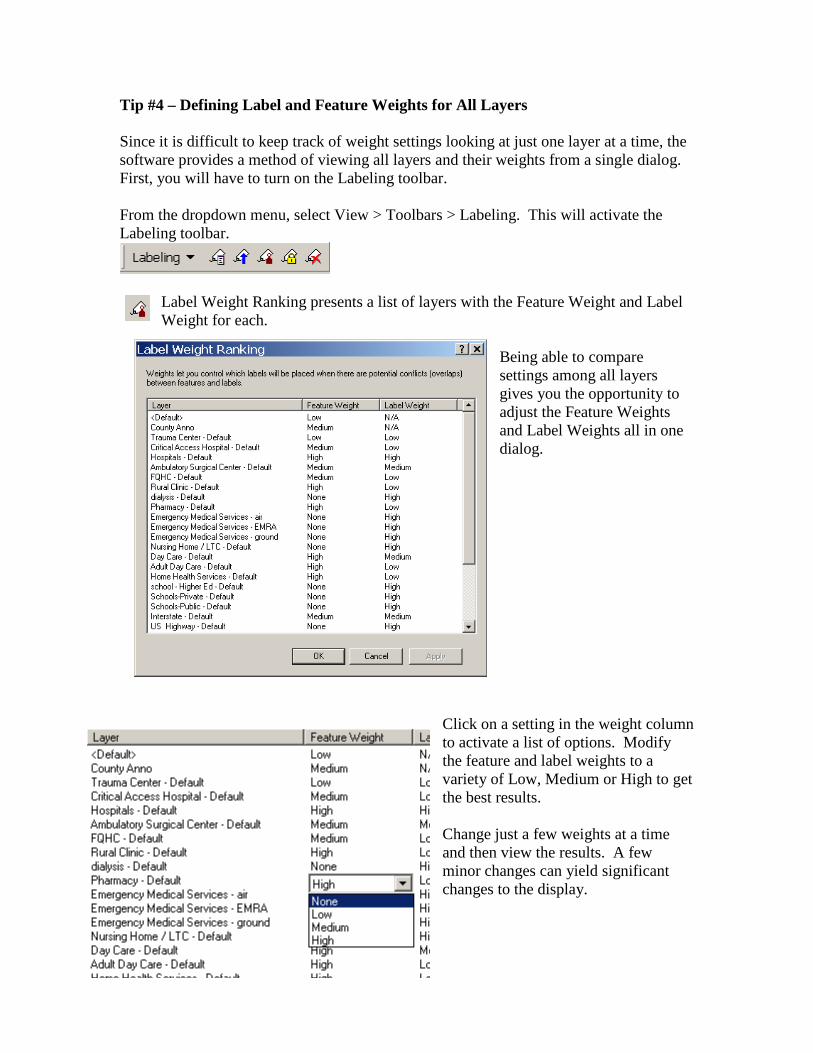
Tip #4 – Defining Label and Feature Weights for All Layers Since it is difficult to keep track of weight settings looking at just one layer at a time, the software provides a method of viewing all layers and their weights from a single dialog. First, you will have to turn on the Labeling toolbar. From the dropdown menu, select View > Toolbars > Labeling. This will activate the Labeling toolbar.
Label Weight Ranking presents a list of layers with the Feature Weight and Label Weight for each.
Being able to compare settings among all layers gives you the opportunity to adjust the Feature Weights and Label Weights all in one dialog.
Click on a setting in the weight column to activate a list of options. Modify the feature and label weights to a variety of Low, Medium or High to get the best results. Change just a few weights at a time and then view the results. A few minor changes can yield significant changes to the display.
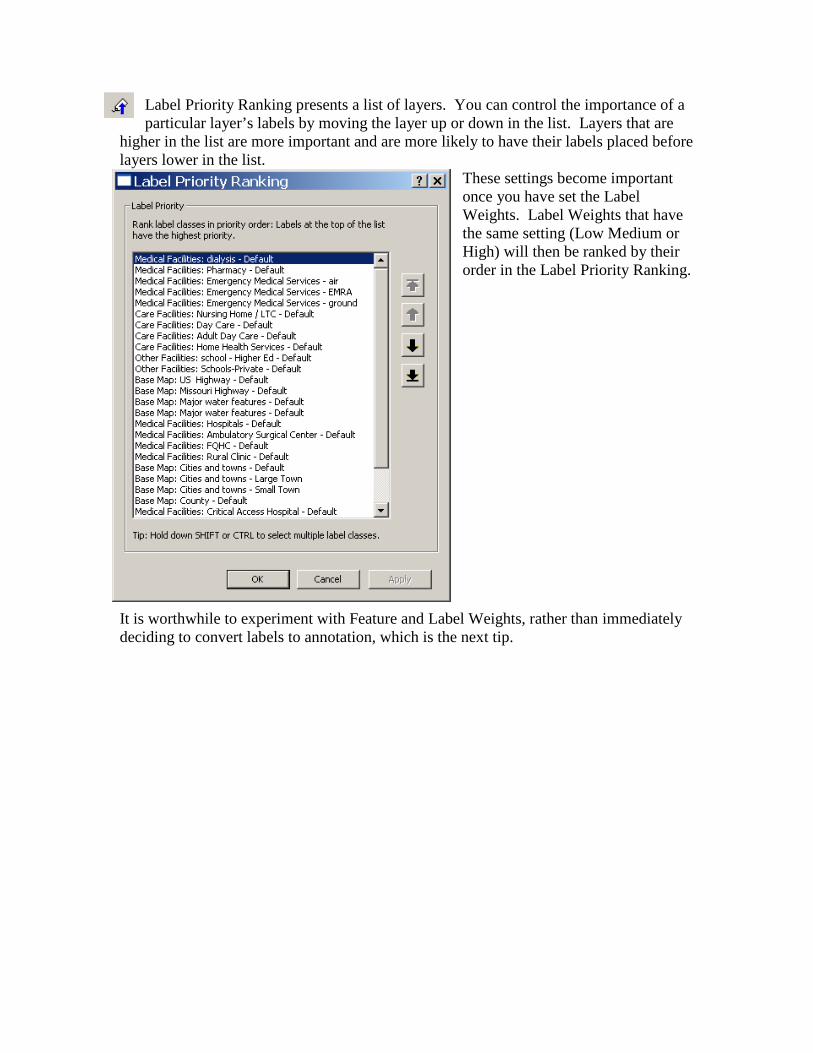
Label Priority Ranking presents a list of layers. You can control the importance of a particular layer’s labels by moving the layer up or down in the list. Layers that are
higher in the list are more important and are more likely to have their labels placed before layers lower in the list.
These settings become important once you have set the Label Weights. Label Weights that have the same setting (Low Medium or High) will then be ranked by their order in the Label Priority Ranking.
It is worthwhile to experiment with Feature and Label Weights, rather than immediately deciding to convert labels to annotation, which is the next tip.
Tip #5A – Converting Labels to Annotation – In the Map Converting labels to annotation has both Pros and Cons. On the one hand, you have complete control over exactly where a label is placed. You can click and drag each piece of text into position. On the negative side, the labels are not longer controlled by the Layer Properties Label tab and are no longer tied to the field with which they were generated. So if there are any changes in the values of the column you used to generate them or if you change your mind about what symbology you want, you have to get rid of the annotation and start these steps over. Also, moving annotation by hand can be extremely time consuming and tedious. Once you have decided that you must have control over the placement of individual labels, it is a simple task to convert the labels to something called annotation. You have two options when converting to Annotation, you can place the annotation in the map or you can put in a database (see Tip #5B).
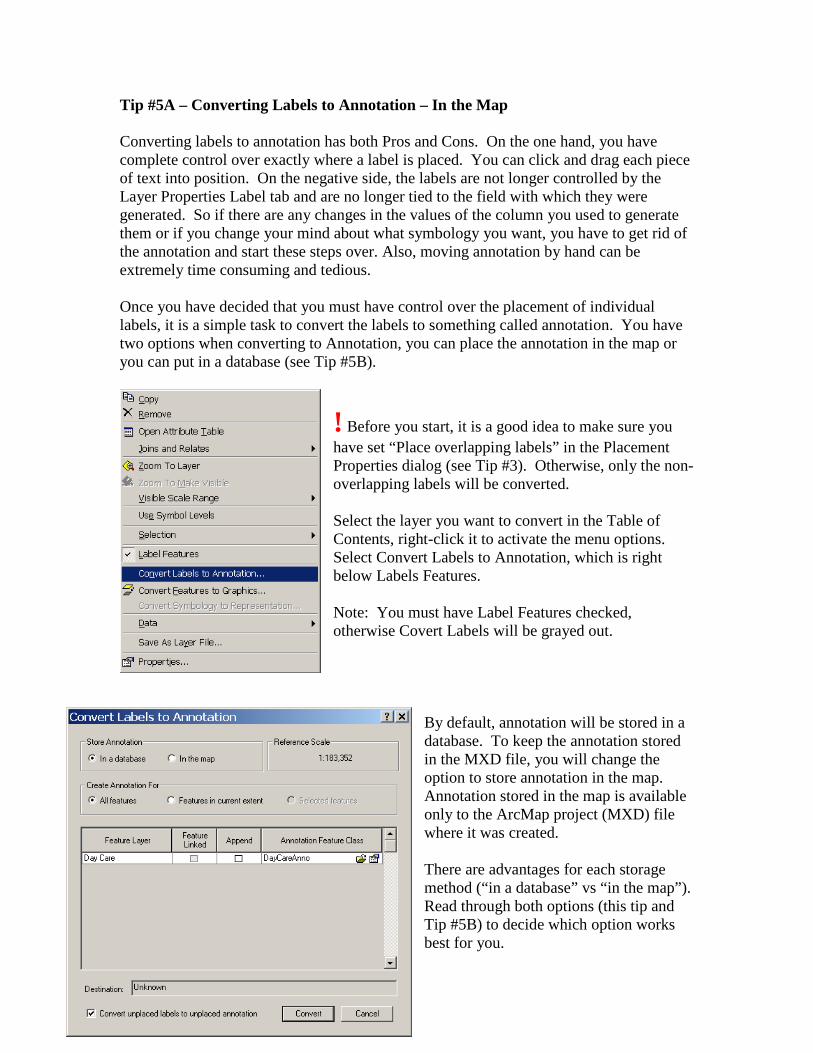
! Before you start, it is a good idea to make sure you have set “Place overlapping labels” in the Placement Properties dialog (see Tip #3). Otherwise, only the non-overlapping labels will be converted. Select the layer you want to convert in the Table of Contents, right-click it to activate the menu options. Select Convert Labels to Annotation, which is right below Labels Features. Note: You must have Label Features checked, otherwise Covert Labels will be grayed out.
By default, annotation will be stored in a database. To keep the annotation stored in the MXD file, you will change the option to store annotation in the map. Annotation stored in the map is available only to the ArcMap project (MXD) file where it was created. There are advantages for each storage method (“in a database” vs “in the map”). Read through both options (this tip and Tip #5B) to decide which option works best for you.
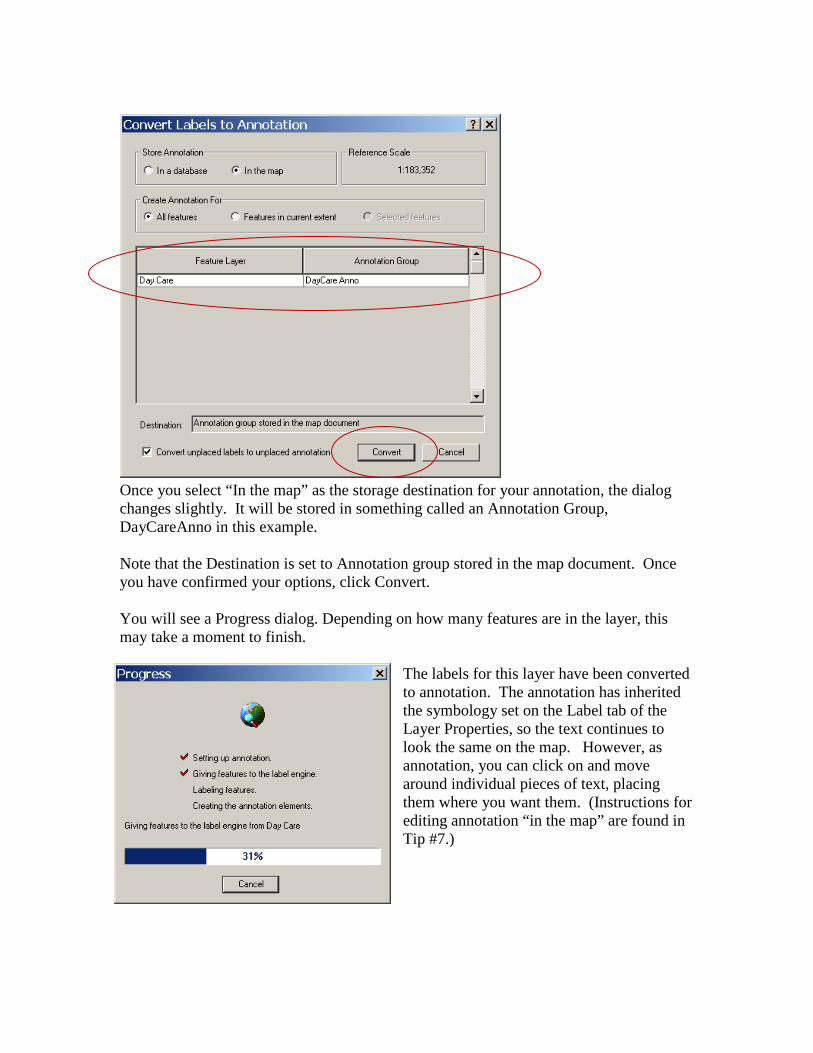
Once you select “In the map” as the storage destination for your annotation, the dialog changes slightly. It will be stored in something called an Annotation Group, DayCareAnno in this example. Note that the Destination is set to Annotation group stored in the map document. Once you have confirmed your options, click Convert. You will see a Progress dialog. Depending on how many features are in the layer, this may take a moment to finish.
The labels for this layer have been converted to annotation. The annotation has inherited the symbology set on the Label tab of the Layer Properties, so the text continues to look the same on the map. However, as annotation, you can click on and move around individual pieces of text, placing them where you want them. (Instructions for editing annotation “in the map” are found in Tip #7.)
Tip #5B – Converting Labels to Annotation – In a Database Whether you decide to store your Labels as Annotation “in the map” or “in a database”, you start out by selecting the layer from the Table of Contents, doing a right-click and selecting Convert Labels to Annotation.
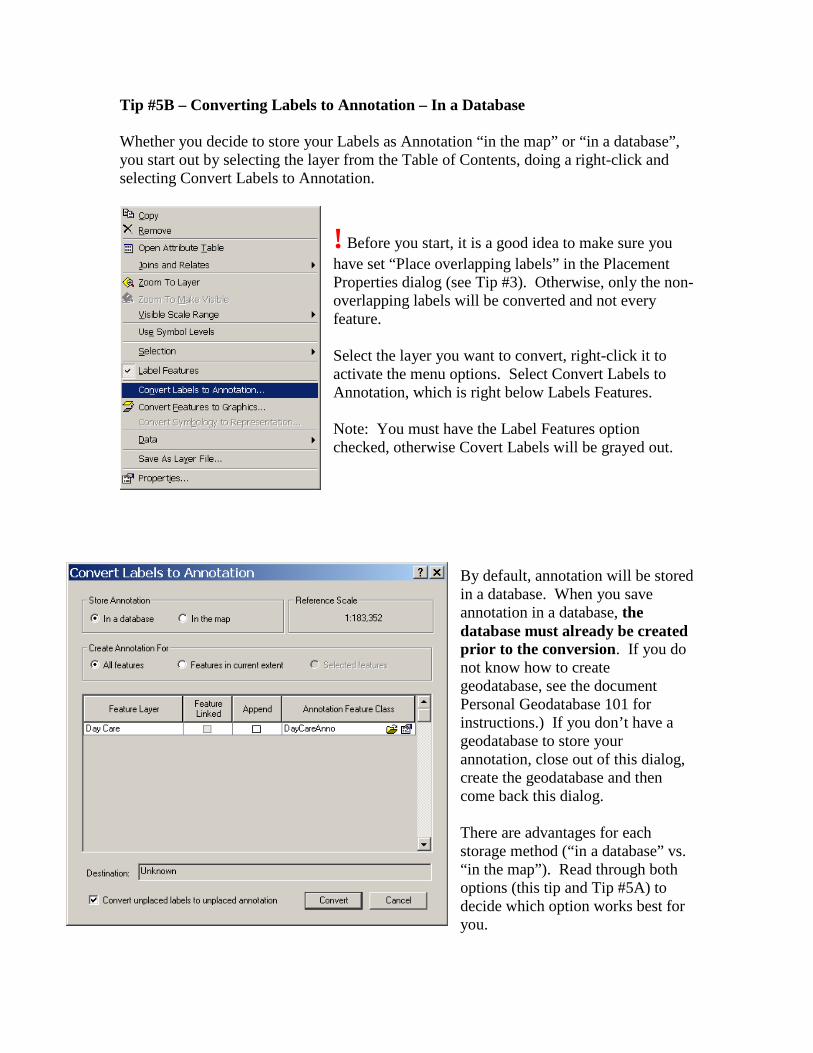
! Before you start, it is a good idea to make sure you have set “Place overlapping labels” in the Placement Properties dialog (see Tip #3). Otherwise, only the non-overlapping labels will be converted and not every feature. Select the layer you want to convert, right-click it to activate the menu options. Select Convert Labels to Annotation, which is right below Labels Features. Note: You must have the Label Features option checked, otherwise Covert Labels will be grayed out.
By default, annotation will be stored in a database. When you save annotation in a database, the database must already be created prior to the conversion. If you do not know how to create geodatabase, see the document Personal Geodatabase 101 for instructions.) If you don’t have a geodatabase to store your annotation, close out of this dialog, create the geodatabase and then come back this dialog. There are advantages for each storage method (“in a database” vs. “in the map”). Read through both options (this tip and Tip #5A) to decide which option works best for you.
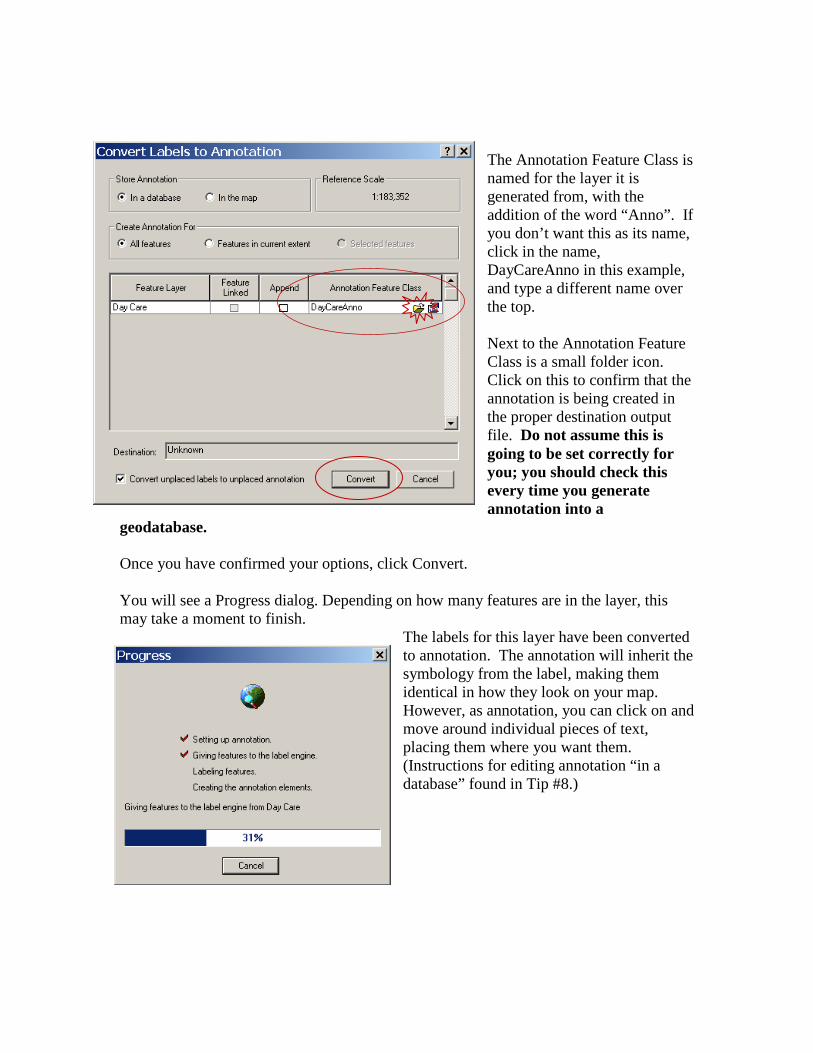
The Annotation Feature Class is named for the layer it is generated from, with the addition of the word “Anno”. If you don’t want this as its name, click in the name, DayCareAnno in this example, and type a different name over the top. Next to the Annotation Feature Class is a small folder icon. Click on this to confirm that the annotation is being created in the proper destination output file. Do not assume this is going to be set correctly for you; you should check this every time you generate annotation into a
geodatabase. Once you have confirmed your options, click Convert. You will see a Progress dialog. Depending on how many features are in the layer, this may take a moment to finish.
The labels for this layer have been converted to annotation. The annotation will inherit the symbology from the label, making them identical in how they look on your map. However, as annotation, you can click on and move around individual pieces of text, placing them where you want them. (Instructions for editing annotation “in a database” found in Tip #8.)
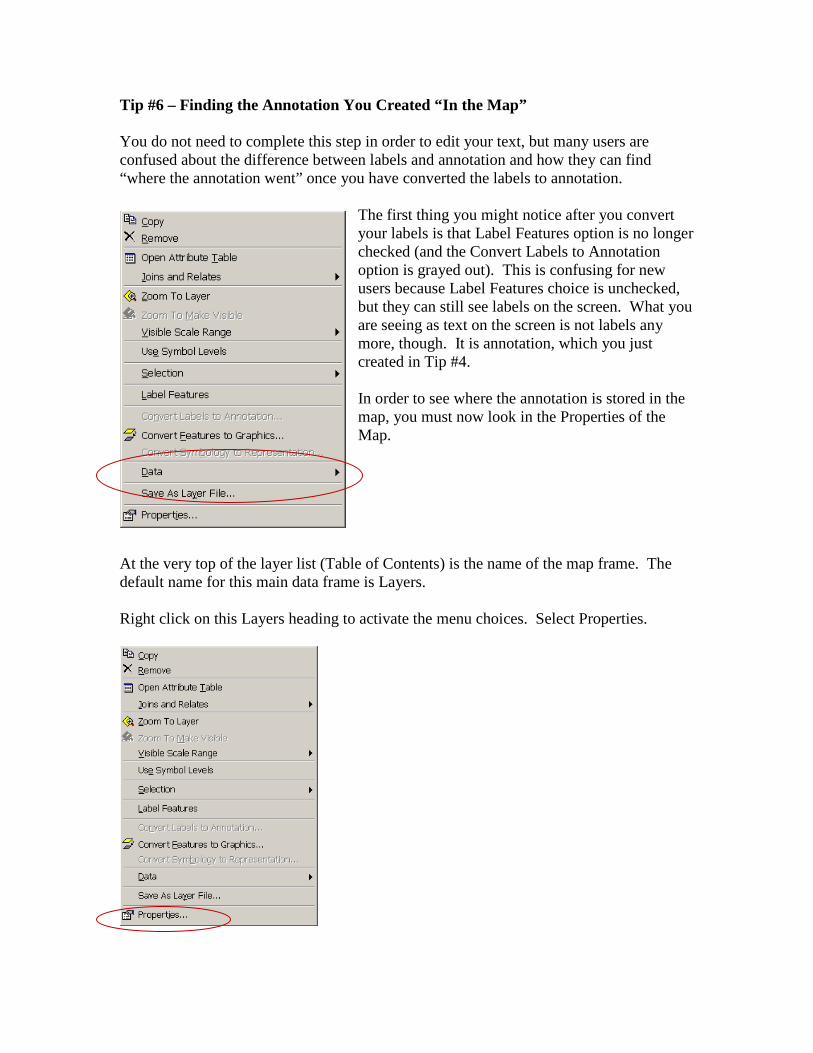
Tip #6 – Finding the Annotation You Created “In the Map” You do not need to complete this step in order to edit your text, but many users are confused about the difference between labels and annotation and how they can find “where the annotation went” once you have converted the labels to annotation.
The first thing you might notice after you convert your labels is that Label Features option is no longer checked (and the Convert Labels to Annotation option is grayed out). This is confusing for new users because Label Features choice is unchecked, but they can still see labels on the screen. What you are seeing as text on the screen is not labels any more, though. It is annotation, which you just created in Tip #4. In order to see where the annotation is stored in the map, you must now look in the Properties of the Map.
At the very top of the layer list (Table of Contents) is the name of the map frame. The default name for this main data frame is Layers. Right click on this Layers heading to activate the menu choices. Select Properties.
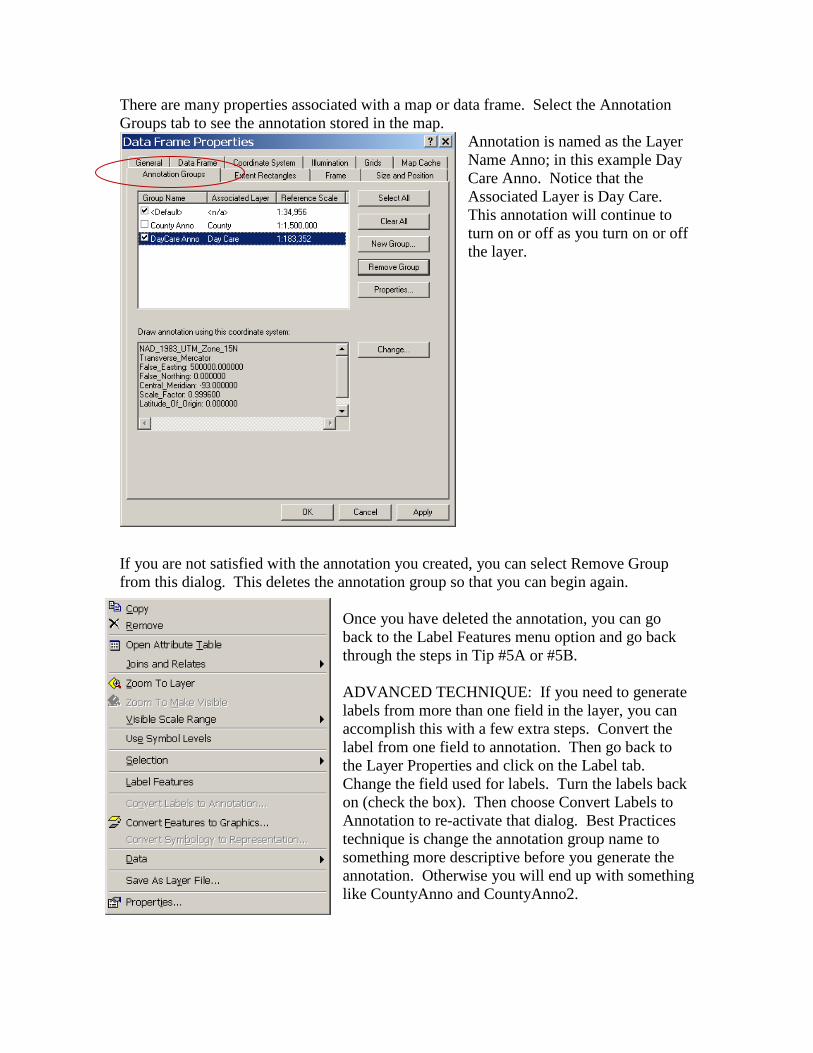
There are many properties associated with a map or data frame. Select the Annotation Groups tab to see the annotation stored in the map.
Annotation is named as the Layer Name Anno; in this example Day Care Anno. Notice that the Associated Layer is Day Care. This annotation will continue to turn on or off as you turn on or off the layer.
If you are not satisfied with the annotation you created, you can select Remove Group from this dialog. This deletes the annotation group so that you can begin again.
Once you have deleted the annotation, you can go back to the Label Features menu option and go back through the steps in Tip #5A or #5B. ADVANCED TECHNIQUE: If you need to generate labels from more than one field in the layer, you can accomplish this with a few extra steps. Convert the label from one field to annotation. Then go back to the Layer Properties and click on the Label tab. Change the field used for labels. Turn the labels back on (check the box). Then choose Convert Labels to Annotation to re-activate that dialog. Best Practices technique is change the annotation group name to something more descriptive before you generate the annotation. Otherwise you will end up with something like CountyAnno and CountyAnno2.
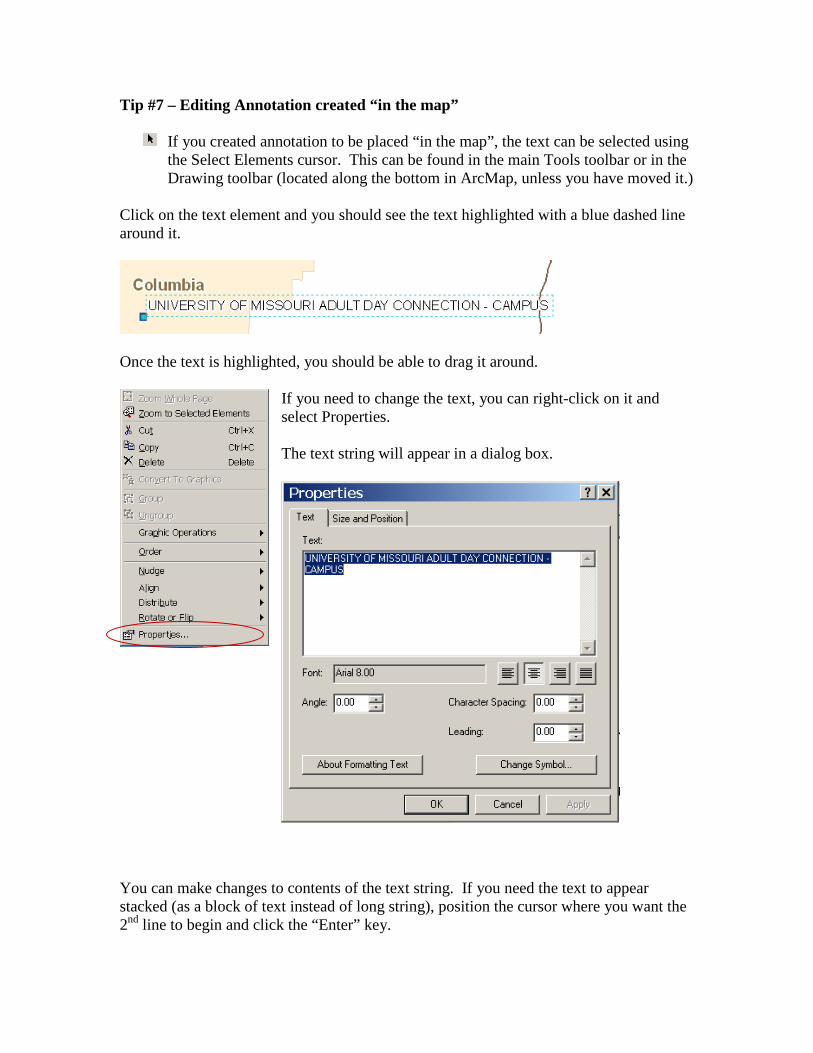
Tip #7 – Editing Annotation created “in the map”
If you created annotation to be placed “in the map”, the text can be selected using the Select Elements cursor. This can be found in the main Tools toolbar or in the Drawing toolbar (located along the bottom in ArcMap, unless you have moved it.)
Click on the text element and you should see the text highlighted with a blue dashed line around it.
Once the text is highlighted, you should be able to drag it around.
If you need to change the text, you can right-click on it and select Properties. The text string will appear in a dialog box.
You can make changes to contents of the text string. If you need the text to appear stacked (as a block of text instead of long string), position the cursor where you want the 2nd line to begin and click the “Enter” key.
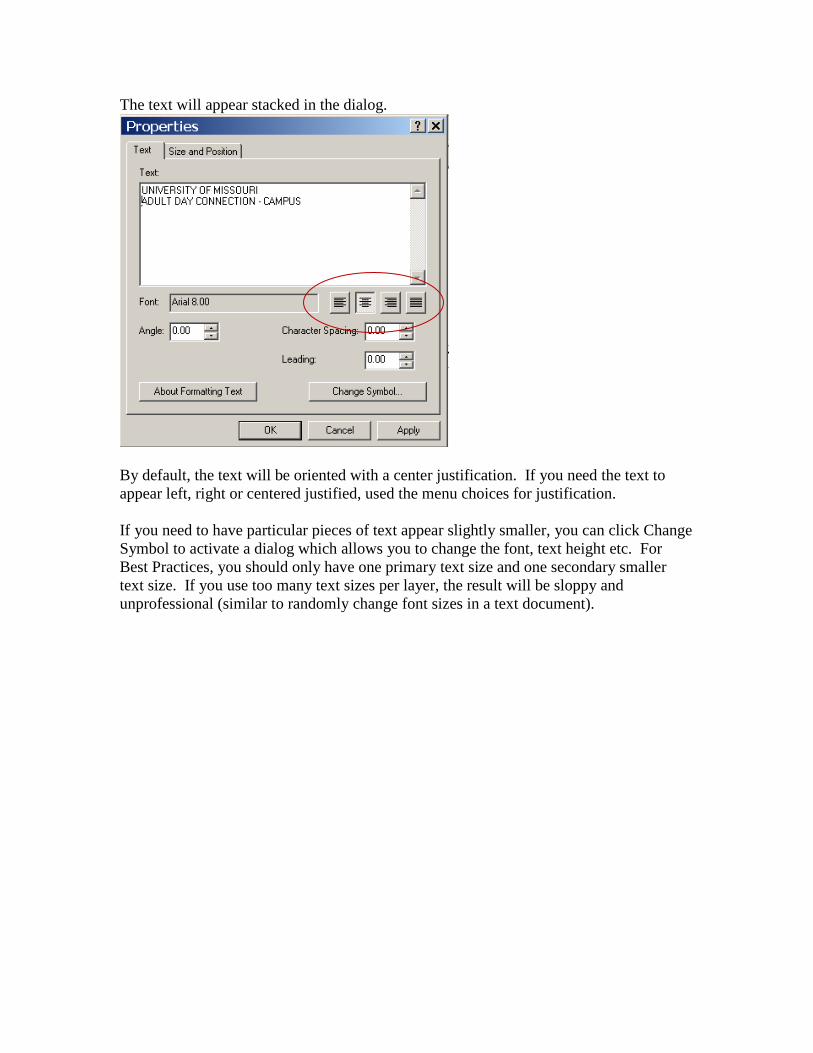
The text will appear stacked in the dialog.
By default, the text will be oriented with a center justification. If you need the text to appear left, right or centered justified, used the menu choices for justification. If you need to have particular pieces of text appear slightly smaller, you can click Change Symbol to activate a dialog which allows you to change the font, text height etc. For Best Practices, you should only have one primary text size and one secondary smaller text size. If you use too many text sizes per layer, the result will be sloppy and unprofessional (similar to randomly change font sizes in a text document).
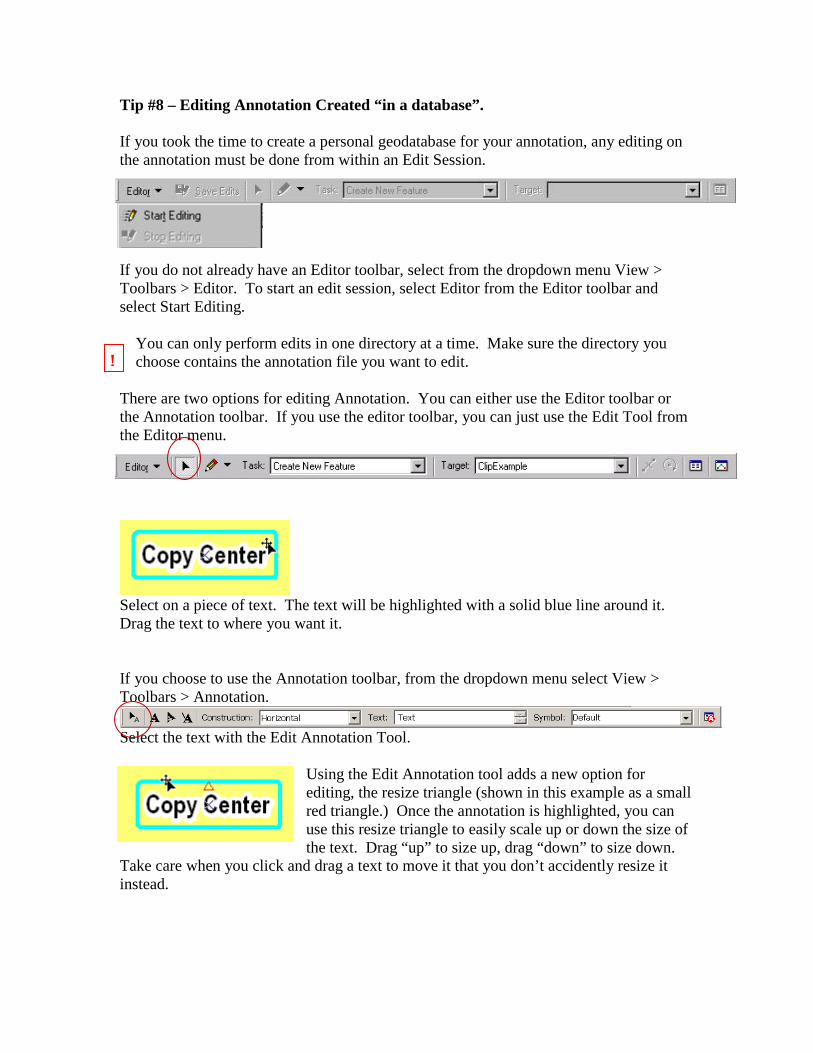
Tip #8 – Editing Annotation Created “in a database”. If you took the time to create a personal geodatabase for your annotation, any editing on the annotation must be done from within an Edit Session.
If you do not already have an Editor toolbar, select from the dropdown menu View > Toolbars > Editor. To start an edit session, select Editor from the Editor toolbar and select Start Editing.
You can only perform edits in one directory at a time. Make sure the directory you choose contains the annotation file you want to edit.
There are two options for editing Annotation. You can either use the Editor toolbar or the Annotation toolbar. If you use the editor toolbar, you can just use the Edit Tool from the Editor menu.
Select on a piece of text. The text will be highlighted with a solid blue line around it. Drag the text to where you want it. If you choose to use the Annotation toolbar, from the dropdown menu select View > Toolbars > Annotation.
Select the text with the Edit Annotation Tool.
Using the Edit Annotation tool adds a new option for editing, the resize triangle (shown in this example as a small red triangle.) Once the annotation is highlighted, you can use this resize triangle to easily scale up or down the size of the text. Drag “up” to size up, drag “down” to size down.
Take care when you click and drag a text to move it that you don’t accidently resize it instead.
!
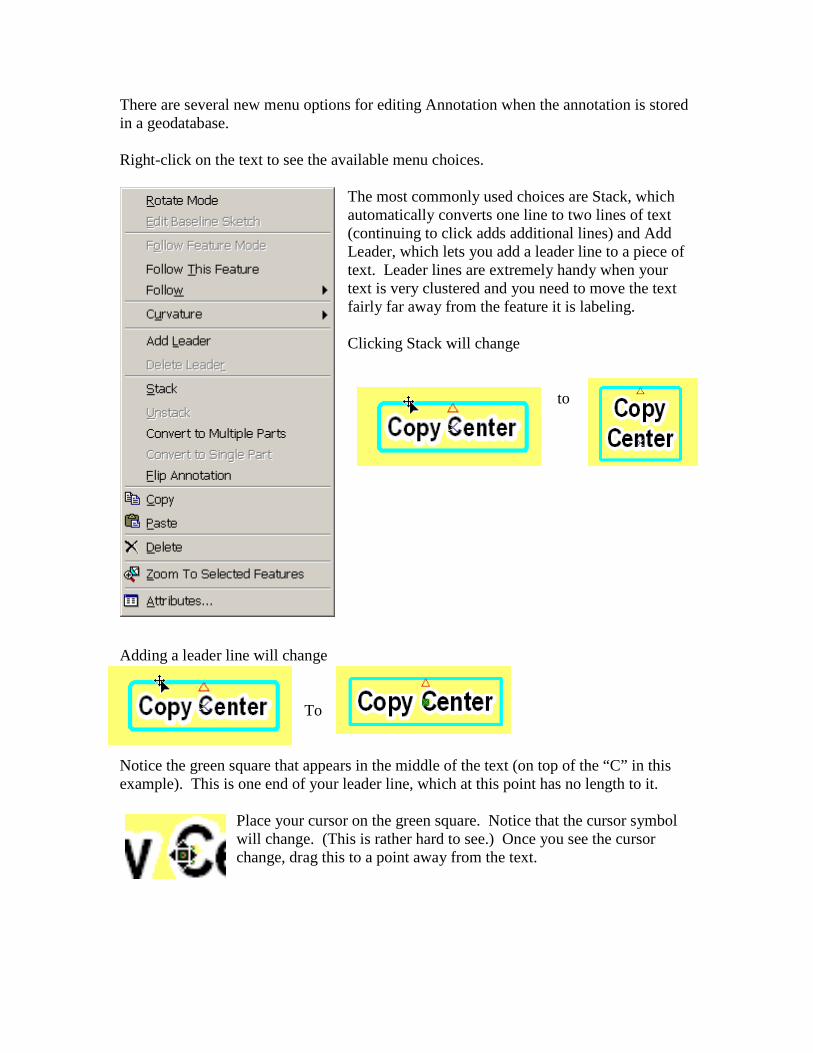
There are several new menu options for editing Annotation when the annotation is stored in a geodatabase. Right-click on the text to see the available menu choices.
The most commonly used choices are Stack, which automatically converts one line to two lines of text (continuing to click adds additional lines) and Add Leader, which lets you add a leader line to a piece of text. Leader lines are extremely handy when your text is very clustered and you need to move the text fairly far away from the feature it is labeling. Clicking Stack will change
to
Adding a leader line will change
To
Notice the green square that appears in the middle of the text (on top of the “C” in this example). This is one end of your leader line, which at this point has no length to it.
Place your cursor on the green square. Notice that the cursor symbol will change. (This is rather hard to see.) Once you see the cursor change, drag this to a point away from the text.
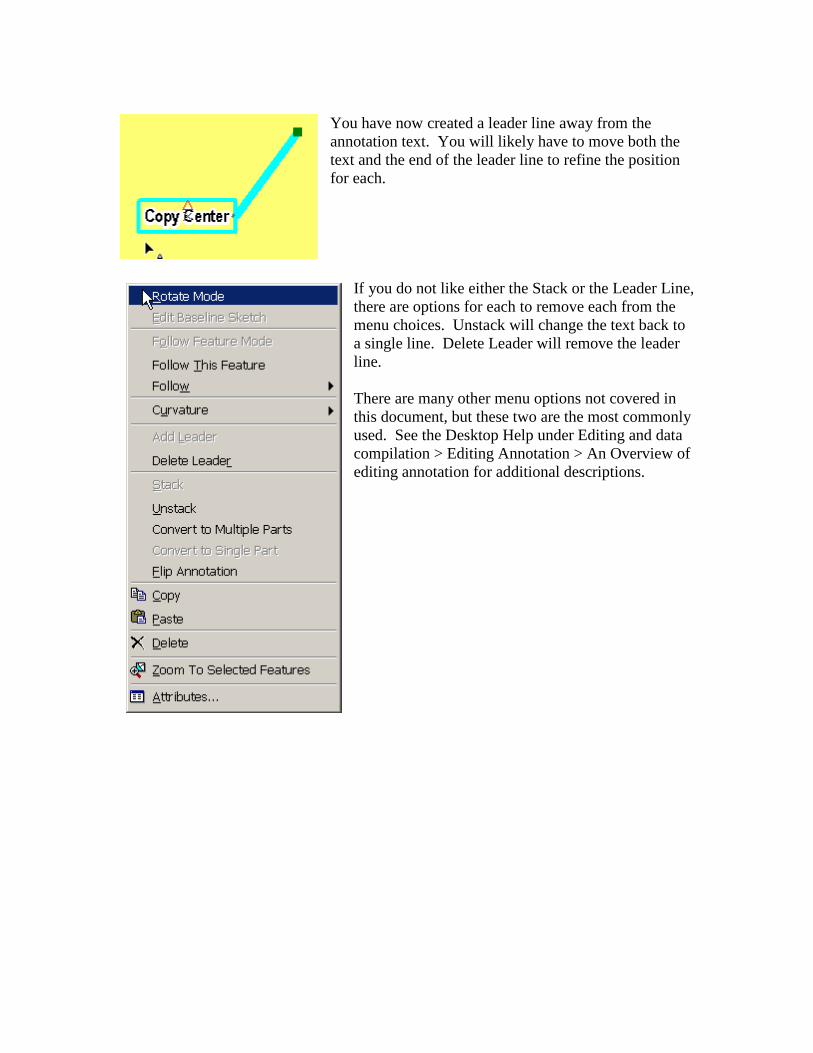
You have now created a leader line away from the annotation text. You will likely have to move both the text and the end of the leader line to refine the position for each.
If you do not like either the Stack or the Leader Line, there are options for each to remove each from the menu choices. Unstack will change the text back to a single line. Delete Leader will remove the leader line. There are many other menu options not covered in this document, but these two are the most commonly used. See the Desktop Help under Editing and data compilation > Editing Annotation > An Overview of editing annotation for additional descriptions.
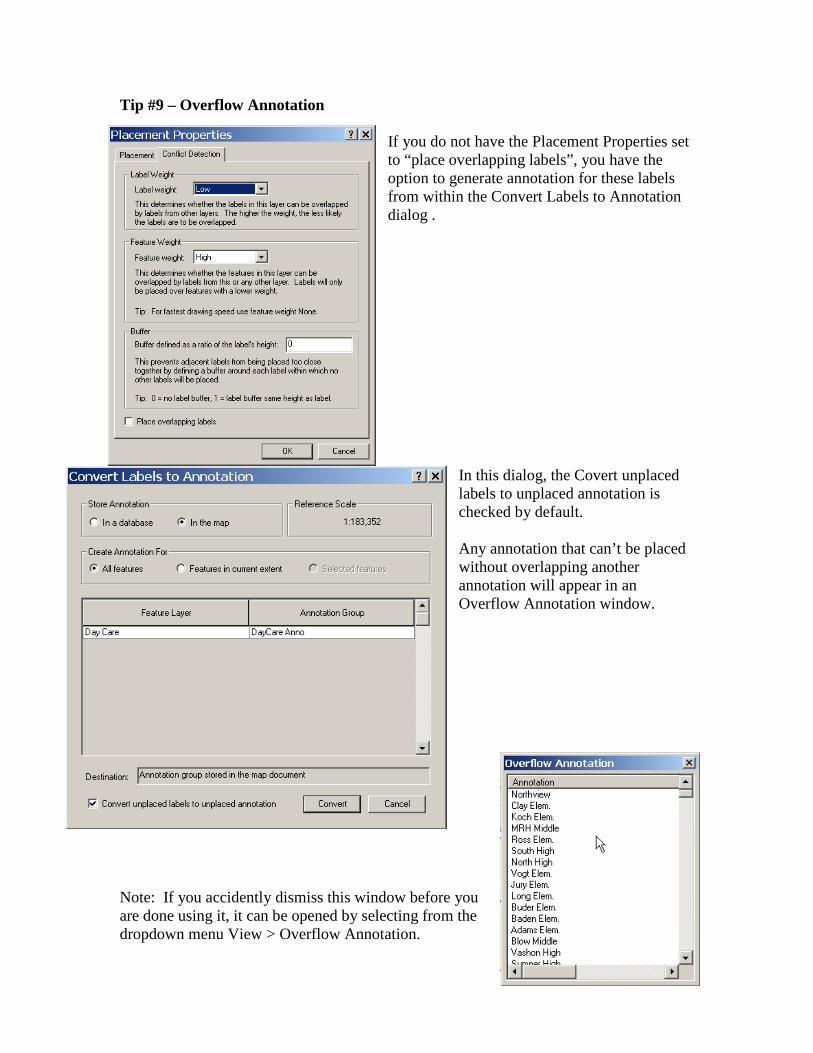
Tip #9 – Overflow Annotation If you do not have the Placement Properties set to “place overlapping labels”, you have the option to generate annotation for these labels from within the Convert Labels to Annotation dialog .
In this dialog, the Covert unplaced labels to unplaced annotation is checked by default. Any annotation that can’t be placed without overlapping another annotation will appear in an Overflow Annotation window.
Note: If you accidently dismiss this window before you are done using it, it can be opened by selecting from the dropdown menu View > Overflow Annotation.
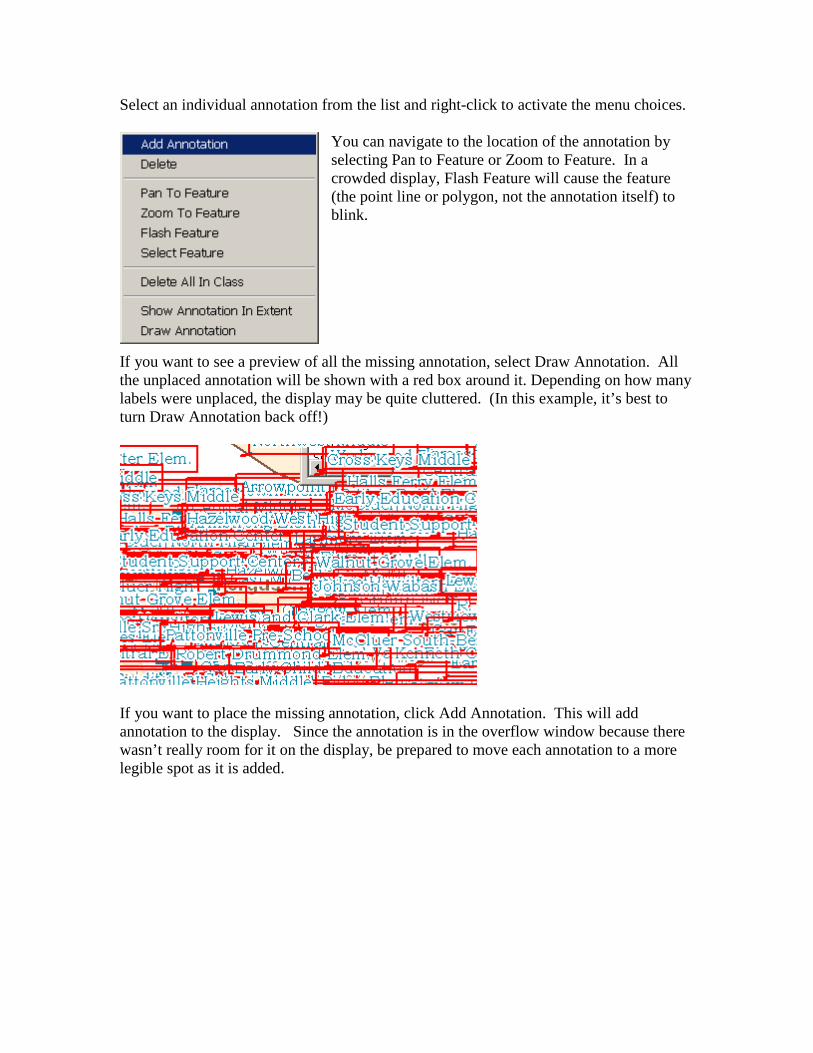
Select an individual annotation from the list and right-click to activate the menu choices. You can navigate to the location of the annotation by selecting Pan to Feature or Zoom to Feature. In a crowded display, Flash Feature will cause the feature (the point line or polygon, not the annotation itself) to blink.
If you want to see a preview of all the missing annotation, select Draw Annotation. All the unplaced annotation will be shown with a red box around it. Depending on how many labels were unplaced, the display may be quite cluttered. (In this example, it’s best to turn Draw Annotation back off!)
If you want to place the missing annotation, click Add Annotation. This will add annotation to the display. Since the annotation is in the overflow window because there wasn’t really room for it on the display, be prepared to move each annotation to a more legible spot as it is added.
Tip #10 – Miscellaneous Techniques for Better Looking Labels and Annotation To create a professional looking map, here are some guidelines for labels and annotation:
• Use a variety of font styles and sizes within your map. Recommended fonts are Arial, Times New Roman and Tahoma. The visual interest between these fonts will help the viewer distinguish which labels go with each feature.
• Limit your font sizes within a layer to one or two. • Try using a font like Arial Narrow which creates letters that are not quite as wide.
This allows you to use the same text height, but takes up less space width wise. • Try using leader lines to pull away some of the worst cluttered text, leaving
enough space to see the features you are trying to label. • Make sure you have enough contrast between any background colors and your
label colors. If you are using a light to dark color ramp, chances are that at least some of the colors are going to be close to your label color. Try using a mask to overcome this problem.
• Remember that everything in ArcView has a property. If you are in a dialog setting some symbology and you see an option for Properties, don’t be afraid to see what you can set. There are numerous ways to define your symbology, especially when dealing with labels.
• The Desktop Help for ESRI is quite good. If you don’t know how to do something, the Help is arranged so that you should be able to find what you are looking for. Some dialogs have a Help button right on them, these are especially useful.
Created by Tracy Schloss Last Updated 9/25/2008