Embed Size (px)
Citation preview

1
Label-free detection of Giardia lamblia cysts using a deep learning-enabled
portable imaging flow cytometer
Zoltán Gӧrӧcs1,2,3, David Baum1, Fang Song1, Kevin DeHaan1,2,3, Hatice Ceylan Koydemir1,2,3, Yunzhe Qiu1, Zilin Cai1, Thamira Skandakumar2, Spencer Peterman2, Miu Tamamitsu1, and Aydogan Ozcan1,2,3,*
1Electrical and Computer Engineering Department, 2Bioengineering Department, and 3California NanoSystems Institute (CNSI)
University of California, Los Angeles, CA, 90095, USA
Abstract
We report a field-portable and cost-effective imaging flow cytometer that uses deep learning to
accurately detect Giardia lamblia cysts in water samples at a volumetric throughput of 100 mL/h. This
flow cytometer uses lensfree color holographic imaging to capture and reconstruct phase and intensity
images of microscopic objects in a continuously flowing sample, and automatically identifies Giardia
Lamblia cysts in real-time without the use of any labels or fluorophores. The imaging flow cytometer is
housed in an environmentally-sealed enclosure with dimensions of 19 cm × 19 cm × 16 cm and weighs
1.6 kg. We demonstrate that this portable imaging flow cytometer coupled to a laptop computer can
detect and quantify, in real-time, low levels of Giardia contamination (e.g., <10 cysts per 50 mL) in both
freshwater and seawater samples. The field-portable and label-free nature of this method has the
potential to allow rapid and automated screening of drinking water supplies in resource limited settings
in order to detect waterborne parasites and monitor the integrity of the filters used for water
treatment.

2
Introduction
Waterborne diseases are caused by the presence of pathogens in drinking water due to the lack of
filtration or improper sanitation. Giardia lamblia is a microscopic waterborne parasite that affects 200
million people every year with the diarrheal illness known as giardiasis1. This parasitic microorganism is
found in the feces of infected animals or humans, and can spread through contaminated soil, water or
food. Giardia takes two forms during its lifecycle: trophozoite and cyst. The trophozoites of Giardia
lamblia are motile and multiply in the intestines of the host to produce the oval-shaped cyst form of the
parasite. The motile form of the parasite cannot survive in the environment, but the cyst form can survive
for >2 months in water temperatures of less than 10 °C2. If a water sample contaminated with Giardia
cysts enters the body of a host, the cysts will grow to continue their life cycle. Within 3 to 25 days of the
ingestion of cysts, symptoms such as abdominal cramps and bloating begin to appear.
There have been major efforts by federal agencies and governments to reduce the risk of giardiasis by
using systems to filter or disinfect water sources (see e.g., Environmental Protection Agency (EPA)’s
Surface Water Treatment Rules (SWTRs))3. However, there is still a need to detect and count Giardia cysts
in water samples to ensure proper operation of such filter systems and adjust the level of disinfecting
agents for water treatment. For example, EPA Method 1623.1 is focused on the detection of
Cryptosporidium and Giardia in water samples by using filtration, immunomagnetic separation, and
fluorescence microscopic analysis. This EPA method has been widely adopted and enables the detection
of Giardia lamblia cysts in water samples with high specificity and sensitivity. However, this method
requires a laboratory infrastructure to perform the measurement as it requires Giardia specific
fluorescence labels and a microbiology expert to operate the fluorescence microscope and perform
analysis. There have been a variety of Giardia detection/identification methods4 reported in the literature
to eliminate these drawbacks such as smartphone-based microscopy5, spectroscopy6, molecular methods
(e.g. PCR7 and LAMP8), flow cytometry9–11, and laser scanning cytometry12. Despite providing some unique
advantages such as high sensitivity and specificity, these approaches still require Giardia specific chemical
labels and related sample preparation methods that require a lab infrastructure.
Here we report a portable imaging flow cytometer that is capable of detecting and enumerating Giardia
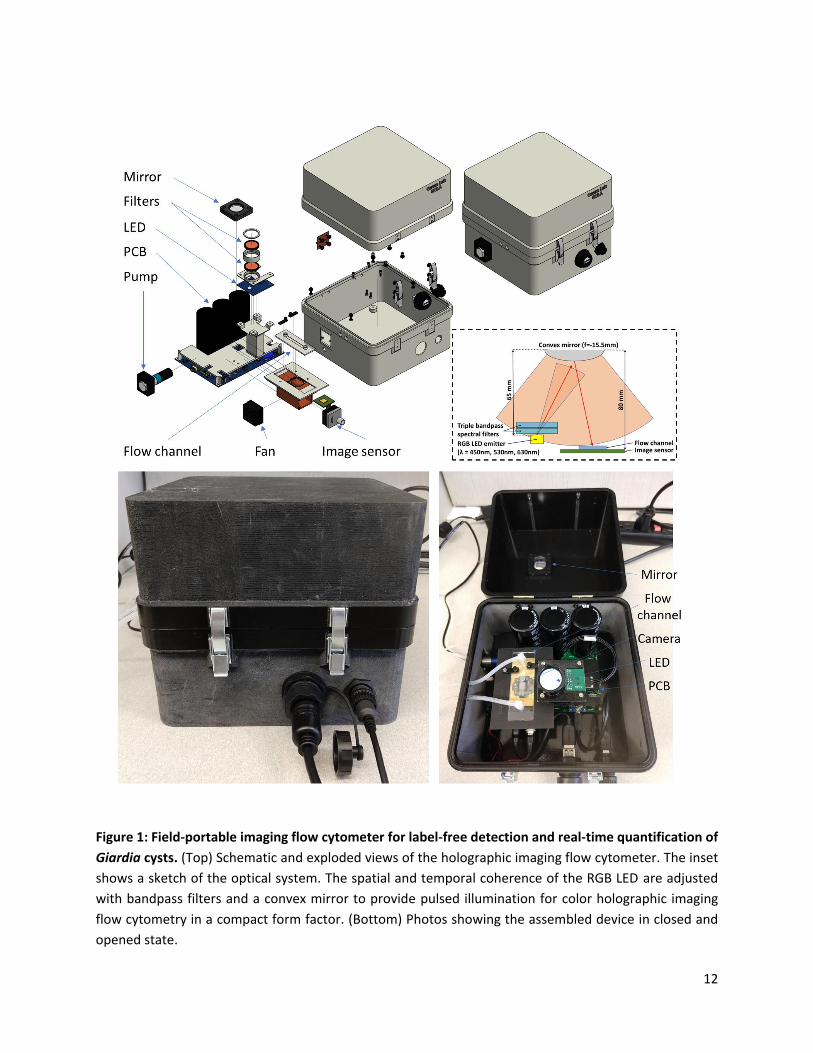
Lamblia cysts in water samples in real-time and without the use of any labels (see Figure 1). This portable
imaging flow cytometer analyzes continuously flowing water samples at a throughput of 100 mL/h and is
based on lensfree on-chip holographic microscopy.13–16 The system uses a small peristaltic pump to
continuously flow the water sample through a 5 mm wide and 0.8 mm tall rectangular channel, which is
placed in direct contact with the image sensor chip without any optical components in between.
Synchronized 120 µs long light pulses from a red, green and blue LED provide partially coherent
illumination on the sample volume, and generate the holographic signatures of all the objects in a sample
volume of 24 µL (6.5 mm × 4.6 mm × 0.8 mm) per each captured image frame. As the objects are flowing
through the channel, these captured holograms are reconstructed in real-time using a laptop computer
to obtain their color intensity and phase images. These reconstructed holographic images are then
automatically classified by a convolutional neural network, and the images containing Giardia Lamblia
cysts are digitally sorted and counted in real-time (Figure 2). This system weighs 1.6 kg and is field-

3
portable, spanning 19 cm × 19 cm × 16 cm; it is also cost effective with a total cost of <$2500, excluding
the laptop computer used to control the system.
We experimentally demonstrate that our imaging flow cytometer can accurately identify water samples
contaminated by Giardia lamblia cysts with a detection limit better than 10 cysts/50 mL, with the
test/imaging taking ~30 min without the use of any labeling or sample preparation. We also demonstrate
that this imaging flow cytometer system is compatible with mechanical filtration based pre-concentration
techniques, and can be used to analyze 1 US Gallon water samples containing Giardia lamblia cysts within
~1 hour. This field-portable and label-free imaging cytometer can especially be useful to monitor the
quality of water purification systems and treatment plants17,18 by providing automated Giardia cyst
detection without the use of any chemicals and sample preparation.
Results & Discussion
The presented computational imaging flow cytometer achieves label-free Giardia lamblia cyst detection
and quantification by performing deep neural network-based classification of the acquired phase and
intensity images of each microscopic object within the water sample under test. Unlike other established
methods, there is no labeling or related sample preparation needed to provide specificity to the detection
process. Since this imaging flow cytometer analyzes the water sample of interest nondestructively,
without contaminating the sample with chemicals (Fig. 2), it also allows subsequent testing of the
measured sample with alternative methods that can be used for comparison and validation. This is
especially important as we observed a low and unstable rate of Giardia cyst recovery from the
manufacturer provided Giardia sample vials, and therefore comparison to the manufacturer’s reported
nominal cyst count in the sample was not practical. Instead, after each experiment we collected the
effluent of the imaging flow cytometer on a 0.45 µm pore size filter paper. Fluorescence staining and
benchtop microscopy were then used to provide gold standard cyst counts, which were compared with
each one of our measurements for validation of our label-free test results (see Methods). Accordingly, we
tested our system with 50 mL water samples spiked with Giardia cysts: as shown in Figure 3, the cytometer
correctly identified all the spiked samples as positive (even the samples spiked with less than 10 cysts per
50 mL), all the control samples as negative, and exhibited a ~83% recovery rate on counting the number
of Giardia cysts within the sample, which is approximately 3-fold higher than the EPA requirement
(>27%).19 Since Giardia lamblia can also be transmitted by recreational swimming in both freshwater and
marine waters that are contaminated by raw sewage20–22, next we explored the applicability of our flow
cytometer to detect Giardia cysts in water samples with higher salinity. For this purpose, we tested Giardia
spiked seawater samples and achieved a cyst recovery rate of 74% (see Figure 4).
We also investigated the measurement repeatability of our system (Figure 5). For these repeatability tests,
we prepared a 50 mL reagent grade water sample, spiked with several thousand Giardia cysts, and
repeatedly measured it, i.e., the imaging flow cytometer was used to test the same sample three times
by collecting and re-testing the effluent. While the resulting numbers of Giardia and non-Giardia particles
detected by our system were similar in all three measurements, some particle loss in the subsequent
measurements was observed, most likely due to particles adhering to the sample container and thus

4
disappearing from the solution. This effect was relatively more pronounced for the Giardia cyst counts,
which might be due to the known preference Giardia cysts to adhere to hydrophobic surfaces like the
walls of the disposable tubes that were used to hold the water samples during our experiments23.
Next we investigated the use of pre-filtration to concentrate the water sample of interest and thus
increase the overall throughput of each measurement. For this, we spiked bottles of drinking water with
Giardia cysts (each 1 US gallon containing ~1,200 cysts), rapidly filtered each gallon though a membrane
with a pore size of 0.45 µm, and then re-suspended the filtered particles into 50 mL test samples that
were automatically screened by our imaging flow cytometer (see Methods section for details). This pre-
filtration step also introduces non-Giardia particles from the filter into the concentrated volume. We
repeated these experiments with three independent positive samples (each 1 US Gallon) and our system
was successful in identifying all three samples as positive, and the control sample as negative (see Table
1). This pre-concentration step is performed in ~30 min, and allows the presented system to screen ~1 US
Gallon of water within ~1 hour (30 min for imaging and 30 min for pre-filtration) for the presence of
Giardia cysts.
Different from existing fluorescence based Giardia cyst detection methods, which rely on fluorescence
staining for the detection and identification of the cysts, our imaging method is label-free, and solely uses
the captured phase and intensity images of the particles to perform the sensing task. An important
advantage provided by our technique is its ability to measure the flowing water sample in real-time and
undisturbed/unprocessed, as no chemicals are added and no incubation time is needed. This technology
allows for continuous, cost-effective, and automated screening of water samples for Giardia cyst
contamination. In order to perform this detection and classification task automatically, we trained a
convolutional neural network (Methods) using labeled image datasets of Giardia cysts as well as other
non-Giardia particles, with each set containing tens of thousands of objects. Imaging of these thousands
of objects for training the neural network can be accomplished in a single run of our cytometer due to its
high throughput. However, to provide a more diverse training image dataset, accounting for e.g., the
salinity of the sample and potential variations in the imaging conditions, measurements taken over several
days were used to train the neural network. Creating a labeled dataset containing the phase and intensity
images of Giardia cysts, however, is relatively challenging since some non-Giardia particles can look
similar to Giardia cysts, thus manual labeling can be noisy. Generating a training water sample that
contains only Giardia cysts is also difficult, as even filtered water samples will collect some other particles
from the air and the sample holders used. Therefore, during the training phase we spiked each 50 mL
filtered water sample to be measured with a high concentration (>1000 cyst/mL) of Giardia cysts in order
to reduce the ratio of non-Giardia particles within the sample to be <5% of the detected objects. This
image dataset was further processed to remove non-Giardia particles based on their size and shape,
improving the purity of our training labels. To allow real-time processing of the imaged particles using a
laptop computer, we selected a fairly compact neural network model (DenseNet-121)24 to perform rapid
detection of target cysts, which may be further improved in terms of its specificity using larger/deeper
networks, at the cost of additional computation time.
During the training of the classification neural network, we prioritized minimizing the likelihood of false
positives. This was necessary as in a practical scenario, each water sample under test (including bottled

5
drinking water samples) will naturally contain thousands of non-Giardia particles and misclassifying even
a small portion of them would make the whole sample test positive (false) for Giardia contamination. Our
trained neural network has an average probability of 0.25% to misclassify a non-Giardia particle as a cyst,
which we have digitally compensated for by subtracting 0.5% of the number of total detected/counted
particles in a given measurement from the final Giardia cyst count. This offset subtraction procedure helps
us avoid false positive decisions at the sample level and can be fine-tuned based on the type of water
under test. We should also note that the presented method can be used along with some of the existing
sample concentration methods, such as immunomagnetic separation25, which might further help with its
specificity and detection efficiency.
Using the computational power of the Nvidia GTX 2080 GPU installed on the controlling laptop computer,
the presented field-portable imaging flow cytometer, on average, can read in the data to the GPU,
perform background subtraction, and automatically segment objects from a single full field of view
hologram, all within ~34 ms, which is a one-time effort for the entire image FOV. During the processing of
the individual segmented sub-images of a given FOV, our program can autofocus on a single object in ~7
ms, perform high resolution color reconstruction of a detected object in 2.5 ms, determine its size in ~6
ms, and finally achieve Giardia detection/classification using the trained convolutional neural network in
~9 ms, making the total time to reconstruct, measure, and classify a single object <30 ms. Our portable
imaging cytometer captures holograms at a rate of three frames per second, which allows ~10 objects per
field of view to be processed in real-time, which corresponds to a maximum of ~1000 objects/1mL for
real-time processing at a flowrate of 100 mL/h. For larger sample concentrations (>1000 particles/mL),
the device can either save the raw sensor data during the experiments to process it later or real-time
operation is also possible at a reduced flowrate and sample throughput. However, this does not set a
practical limitation since the statistically significant number of detection events does not change between
dense and sparse samples; for denser samples with >1000 particles/mL, by reducing the flowrate one can
still accumulate enough particle statistics within the same total test time that is used under lower density
(<1000 particles/mL) samples since the total processing time per particle is the same in both cases (<30
ms). In fact, our system permits dynamic control and adjustment of the flowrate on demand, which can
be automatically adjusted based on the density of the particles for a given water sample under test. The
maximum sample concentration that can be processed by this system is by and large determined by the
speed of the used GPU, and therefore the emerging generation of faster GPUs will automatically improve
the performance of this imaging flow cytometer, also allowing larger, and potentially more accurate
networks to perform cyst classification in real-time.
Materials and Methods
Imaging flow cytometer hardware
Our imaging flow cytometer uses a 14 Megapixel color CMOS camera with a pixel size of 1.4 µm (Basler
aca4600-10uc) to capture lensfree holograms of flowing objects. To gain access to the image sensor, we
removed the camera’s original housing and replaced it with a fan cooled copper housing to reduce the

6
heating of the camera board. The new housing also serves as a secure holder for the flow channel placed
in direct contact with the image sensor’s cover glass. The illumination is provided by an RGB LED (Ledengin
LZ4-04MDPB), which is filtered by a pair of triple bandpass filters (Edmund Optics #87-246, Chroma Inc.
69015m), and then reflected from a convex mirror (Edmund Optics #64-061) to adjust its temporal and
spatial coherence, respectively. The resulting illumination has its center wavelengths at 450nm, 530 nm
and 630 nm, and a bandwidth of <10 nm per each color channel, respectively. All the illumination
wavelengths are emitted simultaneously in 120 µs pulses to allow the capture of sharp holograms from
continuously moving objects. The device is powered with 5V, which can be provided by a wall mount
power supply or external (e.g., smartphone) batteries. A capacitor charge controller (LT3750, Linear
Technologies) is charging three 0.1F capacitors to ~12V, which are used to supply the charge needed for
the high current LED pulses. The LEDs are driven by a triple output LED controller (LT3797, Linear
Technologies), which is triggered by the image sensor’s flash output signal to provide constant current
pulses to the LEDs. The drive current of each LED is set independently by the controller software using i2c
controlled potentiometers (TPL0401A, Texas Instruments) to achieve adequate white balance. The PCB
also integrates a control circuit to power and control a small peristaltic pump (Instech p625) facilitating
the sample flow. The speed of the pump, and thus the sample flowrate can also be controlled by the
software. An Arduino microcontroller (TinyDuino, Tinycircuits) provides an interface for i2c
communications between the device and the controlling laptop. The power consumption of the device
during a measurement is under 5 W, which includes the image sensor’s typical power consumption of
~2.8 W.
Hologram reconstruction
During the measurement of a sample at a flowrate of 100 mL/h the image sensor inside the flow cytometer
acquires three frames per second. Each of these frames contains the holograms of all the microscopic
objects in a 24 µL sample volume directly above the image sensor at that time point during the flow. This
full field-of-view raw frame undergoes several processing steps to localize and reconstruct the particles
present in the liquid volume above the image sensor. First, the static objects (dust, etc.) in the field of
view are digitally removed using a background subtraction algorithm and only the holograms of the
objects located inside the continuously flowing water sample are preserved. This background subtraction
algorithm calculates the background by calculating the average of the preceding 20 frames captured by
the device. To eliminate static objects from a newly acquired frame, the background frame is first
subtracted, and then the mean value of the background frame for each corresponding color channel is
added back to preserve the image quality. The result is a full field-of-view image where only the diffraction
patterns of the objects that move with the flow are present. The center coordinates of each object’s
hologram in the background subtracted frame is located by performing circular Hough transform on the
image. For each of the located objects a 512×512-pixel region of interest, containing the hologram of the
corresponding particle at the center, is cropped from the full field-of-view background subtracted image.
Next, the red, green, and blue color holograms are extracted from these segmented Bayer patterned
images, also removing the color crosstalk between the color channels. Since the color image sensor’s
Bayer pattern contains twice as many green pixels than red or blue pixels, the individual monochromatic
holograms are resampled to generate a uniform regular sampling grid in each one of the color channels.

7
Here we did not interpolate in the green pixel grid, instead used a resampling process where the image
gets rotated by 45° to maximize the quality of the reconstruction26. To obtain the three dimensional
location of each one of the segmented objects, we automatically determine the reconstruction height by
using the edge sparsity of the field’s complex gradient in the blue color channel as an autofocusing
metric27. The algorithm stores the three dimensional location of all the detected particles in previous
frames, estimates their current location based on the flow profile inside the channel, and compares them
to the newly detected particles’ coordinates from the currently processed frame in order to avoid
reconstructing or counting the same object twice during its flow through the device. At this point the list
of newly detected objects in the frame and their corresponding three dimensional coordinates are
determined. To create high resolution reconstructions of these detected objects of interest, the
corresponding holograms are upsampled by a factor of four and then all the three color channels are
propagated corresponding to their incidence angle and wavelength to the previously determined
reconstruction distance using the angular spectrum method13,28. This process results in phase and
intensity images at three different wavelengths, each with a size of 1024×1024 pixels for the detected
objects in the flow, which are then processed by a Giardia classifier network (detailed next).
Convolutional neural network for Giardia cyst classification
The classification of the detected objects was performed using a deep neural network following the
Densenet-121 architecture24, with two output classes (Giardia and non-Giardia). Before passing through
the network, the centers of the phase and intensity images are each cropped to 256×256 pixels. The three
color channels of both the intensity and phase images are concatenated into a single matrix with six
channels. Each of these matrices is then normalized by dividing them by the median value of each channel,
as this process will remove slight intensity differences in between subsequent measurements. In order to
train the network, a softmax cross-entropy based loss function (L) is used. To penalize false positives, the
loss for the non-Giardia images is weighted twice as heavily, i.e.:
𝐿 = − 𝑦𝑐=𝐺𝑖𝑎𝑟𝑑𝑖𝑎 log(𝑝𝑐=𝐺𝑖𝑎𝑟𝑑𝑖𝑎) − 2 𝑦𝑐=𝑛𝑜𝑛 𝐺𝑖𝑎𝑟𝑑𝑖𝑎 log(𝑝𝑐=𝑛𝑜𝑛 𝐺𝑖𝑎𝑟𝑑𝑖𝑎) (1)
where yc is a binary one-hot vector encoding the true label (i.e., it has a value of one if the object belongs
to that class and is zero otherwise). The pc variables represent the probability of a classification decision,
and are calculated using the softmax function, i.e.:
𝑝𝑐 =exp(𝑧𝑐)
∑ exp(𝑧𝑐=𝑘)2𝑘=1
(2)
where zc is the value output by the neural network for each class, 𝑐 = 𝐺𝑖𝑎𝑟𝑑𝑖𝑎 or 𝑐 = 𝑛𝑜𝑛𝐺𝑖𝑎𝑟𝑑𝑖𝑎.
The network further reduces the number of false positives by adding a bias to the classification. In order
for an object to be classified as a Giardia cyst, the output of the neural network for the Giardia class has
to be higher than the output of the non-Giardia class by an empirically determined value of 2. Therefore,
an object is only classified as a Giardia cyst when the following equation is satisfied:
𝑧𝑐=𝐺𝑖𝑎𝑟𝑑𝑖𝑎 > 𝑧𝑐=𝑛𝑜𝑛 𝐺𝑖𝑎𝑟𝑑𝑖𝑎 + 2 (3)

8
This network was trained using 243,774 images captured by our imaging flow cytometer, consisting of
131,215 Giardia images and 112,559 images coming from mixtures of other objects, classified as “non-
Giardia”. 80% of the images were used for training while the remaining 20% of these images were used
for validation. The network training was implemented in Python version 3.6.2 using Pytorch version 1.2.
The trained network was subsequently implemented in CUDA for real-time processing using a laptop
computer (MSI GE75 with an Intel Core i7-8750H CPU, 16 GB of RAM and an Nvidia RTX 2080 GPU). The
network was trained on a Windows computer using an Nvidia GTX 1080 Ti GPU.
Graphical User Interface (GUI)
The user operates the imaging flow cytometer through a custom developed GUI (see Figure 2). The user
is able to set the liquid flow speed, the illumination pulse duration, the brightness of each LED, and the
gain of the image sensor. All the image processing steps are done in real-time as the algorithm is running
on the laptop’s GPU. The GUI provides instantaneous visual feedback on the density of the objects present
in the full field of view, and also shows, in real-time, reconstructed intensity images of the objects. The
user can observe the size histogram of the detected particles and the number of Giardia cysts identified
in the sample since the start of the measurement in real-time. The software is also capable of processing
and analyzing a previously saved raw sensor image dataset.
Water sample testing
Flow cytometer enumerated and irradiated 1 mL Giardia lamblia cyst suspensions (Waterborne Inc.) were
used for preparing the spiked water samples. The concentrations of these suspensions were 10, 50, 100,
and 500 cysts in 1 mL of reagent grade water according to the manufacturer. The cysts suspensions were
stored at a temperature of 6°C ± 2°C until the experiments were performed. Prior to the measurement,
the cyst suspensions were brought to room temperature. The cyst suspensions were vortex mixed for 2
min and poured into a 50 mL disposable centrifugation tube (05-539-9LC, Fisher Scientific) containing 40
mL of sterile-filtered reagent grade water (FB12566506 or SE1M179M6, Fisher Scientific). To improve the
recovery rate from the manufacturer’s vial, 1 mL of sterile-filtered reagent grade water (23-249-581,
Fisher Scientific) was added to the emptied 1mL tube which was vortexed mixed again for 15 seconds and
then the contents were poured into the same 50 mL tube. This last step was repeated 8 times per sample
to improve the recovery of cysts from the manufacturer’s vial. Finally, the tube was filled up to 50 mL
using filtered reagent grade water.
We used the same protocol to prepare G. lamblia spiked sterile-filtered seawater samples. Here, instead
of sterile-filtered reagent grade water, we used filtered seawater (SEABH20L, Bigelow National Center for
Marine Algae and Microbiota) and sterilized it using a disposable filtration unit.
Preparation of 50 mL concentrated samples from 1 US gallon bottled water samples
Each gallon of bottled water (Spring water, Ralphs) was on purpose contaminated with four vials (each
1mL) of G. lamblia cyst suspensions (Waterborne Inc.), two vials with a nominal cyst count of 500 and two
others with a manufacturer provided cyst count of 100. A glass vacuum filtration unit (XX1019022, Fisher
Scientific) was equipped with a filter membrane which had a pore size of 0.45 µm (1270061, Sterlitech

9
Corporation). The spiked 1-gallon sample was then poured into a glass vessel and filtered at a pressure of
50 kPa. The 1-gallon plastic bottle was rinsed twice using 250 mL of sterile-filtered reagent grade water
and the rinse water was poured into the glass vessel for filtration. The filter membrane containing all the
particles from the sample was removed from the filtration unit and placed into a sterile Petri-dish. ~15 mL
of 0.05% [v/v] Tween®20 in sterile-filtered reagent grade water was added to the Petri-dish. Using a cell
scraper (B002VBW7H0, Amazon Inc.) the particles captured on the membrane were released into the
solution that was then collected in a 50 mL Falcon tube. This procedure was repeated 3 times per filter
membrane to improve the particle recovery rate and to yield a final volume of ~50 mL concentrated water
sample.
Measurement workflow
At the start of each measurement a new set of disposable components was installed into the flow
cytometer to avoid cross-contamination between the samples. In case the effluent was used for
subsequent fluorescence microscope based analysis (for comparison purposes), the output tube of the
system was placed over a vacuum filtration unit containing a 0.45 µm pore size filter membrane (1270061,
Sterlitech Corporation). Then, the flow cytometer was turned on and the controlling software was
initialized. To reduce the amount of Giardia cyst adhesion within the inner walls of the disposable
components (e.g., plastic tubing and sample channel) we have flown the washing buffer for 5 minutes at
a flow rate of 100 mL/h. After surface activation, the inlet tube was placed from the washing buffer to the
50 mL tube containing the sample and the image acquisition and real-time analysis started using the GUI.
The imaging flow cytometer automatically images and analyzes the 50 mL sample in 30 min using a laptop
computer, counts the number of Giardia and non-Giardia particles and sorts the images of the objects
identified as Giardia from the images of the rest of the detected micro-objects.
Comparative fluorescence microscopy analysis of the effluent
To perform comparative analysis for validation of our results, fluorescent labeling of the cysts captured
on the filter membrane was performed using fluorescein labelled Giardia specific antibodies (A300FLR-
20X, Waterborne Inc.). The stain was diluted to 1× according to the manufacturer’s instructions. 200 µL
of dye suspension was spread on the filter membrane containing the filtered effluent and was incubated
at 37°C for at least 30 minutes for labeling the G. lamblia cysts. Manual counting of cysts captured on the
filter membrane was performed using a FITC filter set and 20× to 40× objective lenses using a benchtop
fluorescence microscope (Olympus BX51). The analysis of the membranes was completed within 24 hours
after staining. Each membrane was manually scanned in a systematic snake scanning pattern to avoid
missing any Giardia cysts. These results were then compared against label-free classification and
quantification results obtained with our imaging flow cytometer.
Conclusions
We demonstrated a cost effective, field-portable and label-free, computational imaging flow cytometer
that can perform in real-time automated detection and quantification of Giardia lamblia cysts in fresh and

10
seawater samples. The system uses lensfree holographic microscopy with pulsed illumination to obtain
in-focus phase and intensity images of the microscopic particles continuously flowing in a channel and
subsequently classifies them as Giardia or non-Giardia using a trained convolutional neural network. The
flow cytometer analyzes the Giardia content of liquid samples in real-time at a throughput of 100 mL/h,
and was demonstrated to detect Giardia contamination in water samples containing < 10 cysts per 50 mL.
This label-free cytometry technology can be useful to analyze and detect Giardia cysts in drinking water
samples in resource limited settings and to periodically monitor the integrity of filters in water purification
systems.
Acknowledgements
The authors acknowledge the US Army Research Office (ARO, W56HZV-16-C-0122).
References
1 H. Hooshyar, P. Rostamkhani, M. Arbabi and M. Delavari, Gastroenterol. Hepatol. Bed Bench, 2019, 12, 3–12.
2 L. Cernikova, C. Faso and A. B. Hehl, PLOS Pathog., 2018, 14, e1007250. 3 O. US EPA, Surface Water Treatment Rules, https://www.epa.gov/dwreginfo/surface-water-
treatment-rules. 4 A. Efstratiou, J. Ongerth and P. Karanis, Water Res., 2017, 123, 96–112. 5 H. Ceylan Koydemir, Z. Gorocs, D. Tseng, B. Cortazar, S. Feng, R. Y. Lok Chan, J. Burbano, E. McLeod
and A. Ozcan, Lab. Chip, 2015, 15, 1284–1293. 6 K. R. Wigginton and P. J. Vikesland, Analyst, 2010, 135, 1320–1326. 7 P. A. Rochelle, R. D. Leon, M. H. Stewart and R. L. Wolfe, Appl. Environ. Microbiol., 1997, 63, 106–114. 8 J. Plutzer and P. Karanis, Parasitol. Res., 2009, 104, 1527–1533. 9 D. A. Veal, D. Deere, B. Ferrari, J. Piper and P. V. Attfield, J. Immunol. Methods, 2000, 243, 191–210. 10 D. Jin, J. A. Piper, R. C. Leif, S. Yang, B. C. Ferrari, J. Yuan, G. Wang, L. M. Vallarino and J. W. Williams,
J. Biomed. Opt., 2009, 14, 024023. 11 H.-A. Keserue, H. P. Füchslin, M. Wittwer, H. Nguyen-Viet, T. T. Nguyen, N. Surinkul, T. Koottatep, N.
Schürch and T. Egli, Environ. Sci. Technol., 2012, 46, 8952–8959. 12 M.-R. D. Roubin, J.-S. Pharamond, F. Zanelli, F. Poty, S. Houdart, F. Laurent, J.-L. Drocourt and S. V.
Poucke, J. Appl. Microbiol., 2002, 93, 599–607. 13 Z. Gӧrӧcs, M. Tamamitsu, V. Bianco, P. Wolf, S. Roy, K. Shindo, K. Yanny, Y. Wu, H. C. Koydemir, Y.
Rivenson and A. Ozcan, Light Sci. Appl., 2018, 7, 1–12. 14 A. Greenbaum, W. Luo, T.-W. Su, Z. Göröcs, L. Xue, S. O. Isikman, A. F. Coskun, O. Mudanyali and A.
Ozcan, Nat. Methods, 2012, 9, 889–895. 15 O. Mudanyali, D. Tseng, C. Oh, S. O. Isikman, I. Sencan, W. Bishara, C. Oztoprak, S. Seo, B.
Khademhosseini and A. Ozcan, Lab. Chip, 2010, 10, 1417–1428. 16 W. Bishara, T.-W. Su, A. F. Coskun and A. Ozcan, Opt. Express, 2010, 18, 11181–11191. 17 J. D. Eisnor, K. C. O’Leary and G. A. Gagnon, Water Qual. Res. J., 2001, 36, 105–119. 18 K. C. O’Leary, J. D. Eisnor and G. A. Gagnon, Environ. Technol., 2003, 24, 1–9.

11
19 US EPA, Method 1623.1: Cryptosporidium and Giardia in Water by Filtration/IMS/FA, https://www.epa.gov/ground-water-and-drinking-water.
20 D. C. Johnson, K. A. Reynolds, C. P. Gerba, I. L. Pepper and J. B. Rose, Water Sci. Technol., 1995, 31, 439–442.
21 A. H. Hilles, A. I. Al Hindi and Y. A. Abu Safieh, J. Environ. Health Sci. Eng., 2014, 12, 26. 22 W. Q. Betancourt, D. C. Duarte, R. C. Vásquez and P. L. Gurian, Mar. Pollut. Bull., 2014, 85, 268–273. 23 D. X, B. J, H. Me and A. De, Colloids Surf. B Biointerfaces, 2004, 34, 259–263. 24 G. Huang, Z. Liu, L. Van Der Maaten and K. Q. Weinberger, in 2017 IEEE Conference on Computer
Vision and Pattern Recognition (CVPR), 2017, pp. 2261–2269. 25 H.-A. Keserue, H. P. Füchslin and T. Egli, Appl. Environ. Microbiol., 2011, 77, 5420–5427. 26 S. O. Isikman, A. Greenbaum, W. Luo, A. F. Coskun and A. Ozcan, PLOS ONE, 2012, 7, e45044. 27 Y. Zhang, H. Wang, Y. Wu, M. Tamamitsu and A. Ozcan, Opt. Lett., 2017, 42, 3824–3827. 28 W. Luo, Y. Zhang, Z. Göröcs, A. Feizi and A. Ozcan, Sci. Rep., 2016, 6, 22738.
12
Figure 1: Field-portable imaging flow cytometer for label-free detection and real-time quantification of
Giardia cysts. (Top) Schematic and exploded views of the holographic imaging flow cytometer. The inset
shows a sketch of the optical system. The spatial and temporal coherence of the RGB LED are adjusted
with bandpass filters and a convex mirror to provide pulsed illumination for color holographic imaging
flow cytometry in a compact form factor. (Bottom) Photos showing the assembled device in closed and
opened state.

13
Figure 2: Workflow of the field-portable imaging flow cytometer and a screenshot of the graphical user
interface. (Top) The flow cytometer screens the continuously flowing water sample for Giardia cysts at a
flowrate of 100 mL/h by capturing lensfree holograms of microscopic objects inside the fluidic channel.
Each frame has a sample field-of-view of ~30 mm2 and corresponds to a liquid volume of 24 µL at a given
time-stamp. The pulsed holograms of individual objects are segmented and reconstructed automatically.
The measured phase and intensity information of all the objects are processed by a trained neural network
to automatically identify Giardia Lamblia cysts in real-time using a laptop computer. During each
measurement, the GUI (bottom image) displays a full field-of-view image, which allows the user to track
the contents of the fluidic channel. The user can enable to view the reconstructed intensity images of the
objects detected on the current frame. The user can also enable to view a size histogram of the objects

14
detected in the sample since the start of the measurement. On this histogram, the particles classified as
Giardia cysts are shown in red color, while the non-Giardia particles are shown in green.
Figure 3: Measurement results for 50 mL reagent water samples spiked with Giardia lamblia cysts. For
the samples containing over 20 cysts, the flow cytometer achieved a recovery rate of ~83% with a standard
deviation of ~7%. For lower concentration samples containing less than 20 cysts the standard deviation of
the measurements was ~4 cysts. The flow cytometer was able to correctly identify all 12 different water
samples containing Giardia lamblia cysts as positive.

15
Figure 4: Measurement results for 50 mL seawater samples spiked with Giardia lamblia cysts. The flow
cytometer achieved a recovery rate of ~74% with a standard deviation of ~6%. The flow cytometer was
able to correctly identify all the 5 different seawater samples containing Giardia lamblia cysts as positive.

16
Figure 5: Repeatability of the imaging flow cytometer. A 50 mL sample was spiked with Giardia lamblia
cysts and was measured three times in succession by collecting the effluent from the system and testing
it again using the same device. The number of particles is slightly decreasing in between successive
measurements due to the adhesion of the particles to the sample holder. This effect is more pronounced
for the Giardia cysts, most likely due to their preferred adhesion to hydrophobic surfaces of our
measurement system.

17
Giardia cysts count Number of Non-Giardia particles
Prediction
Fluorescence microscope
Flow cytometer
Sample 1 126 97 23253 Positive
Sample 2 70 38 20902 Positive
Sample 3 139 31 25102 Positive
Control 0 0 14973 Negative
Table 1: Experimental results on water samples (each 1 US gallon) spiked with Giardia cysts. Each one
of these 1 US gallon water samples was pre-filtered using a mechanical filter into a test volume of 50 mL
before being analyzed by the portable imaging flow cytometer. All the positive samples as well as the
control sample were correctly classified by the portable label-free cytometer.


![Giardia Lamblia [Modo de Compatibilidad]](https://img.dokumen.tips/doc/110x75/577cc3cd1a28aba7119738fc/giardia-lamblia-modo-de-compatibilidad.jpg)