Embed Size (px)
Citation preview
Lab Manual
IMPEDANCE MEASUREMENT OF
THE PIEZOELECTRIC TRANSDUCER
Wayne Kerr LCR Meter 4235
Created by
Hong-Van Tran
Lab of Electromechanical Energy
Department of Precision Engineering.
National Chung Hsing University
September 27, 2018

CONTENTS
DESCRIBE .......................................................................................................... 1
PURPOSE ........................................................................................................... 1
MAIN FLOW CHART ............................................................................................ 1
A. Equipment ............................................................................................................. 2
B. Preparing (Preparing for a Measurement) .......................................................... 2
C. Calibration ............................................................................................................. 7
D. Measurement ...................................................................................................... 17
E. Analysis (Results of Analysis) ........................................................................... 19
LIST OF FIGURES
Figure B.1: Voltage Selector .................................................................................................. 3
Figure B.2: Don’t touch the PZT ............................................................................................. 3
Figure B.3: Hold the piezoelectric transducer correctly. ......................................................... 4
Figure B.4: Turn ON the power to the LCR meter 4235. ........................................................ 4
Figure C.1: Calibrate mode .................................................................................................... 7
Figure C.2: Open-circuit the Kelvin clips ................................................................................ 8
Figure C.3: Open the test Leads ............................................................................................ 8
Figure C.4: Open circuit trim .................................................................................................. 9
Figure C.5: Short-circuit the Kelvin clips................................................................................. 9
Figure C.6: Short the test leads ........................................................................................... 10
Figure C.7: Short circuit trim ................................................................................................ 10
Figure C.8: Settings Lost ..................................................................................................... 10
Figure C.9: The Soft Keys .................................................................................................... 11
Figure C.10: Non-Soft Key MEASUREMENT MODE Parameters ........................................ 13
Figure C.11: The Navigation Keys ....................................................................................... 14
Figure C.12: The Data Entry Keypad ................................................................................... 14
Figure C.13: Example of an Error Message from an Invalid Keypad Entry ........................... 14
Figure C.14: Highlight the selected drive level ..................................................................... 15
Figure C.15: Highlight the selected frequency ...................................................................... 15
Figure C.16: Trim Options .................................................................................................... 16
Figure D.1: The DUT connection of the Kelvin clips ............................................................. 17
Figure D.2: The DUT connection of the Kelvin clips ............................................................. 17
Figure D.3: Measuring the capacitance ................................................................................ 18
Figure D.4: Measuring the capacitance ................................................................................ 19
Figure E.1: Impedance of Piezoelectric transducer .............................................................. 20
Figure E.2: Piezo Electric Transducer .................................................................................. 21
Figure E.3: RLC Circuits ...................................................................................................... 22
1 | 2 2 I m p e d a n c e m e a s u r e m e n t o f t h e p z t t r a n s d u c e r
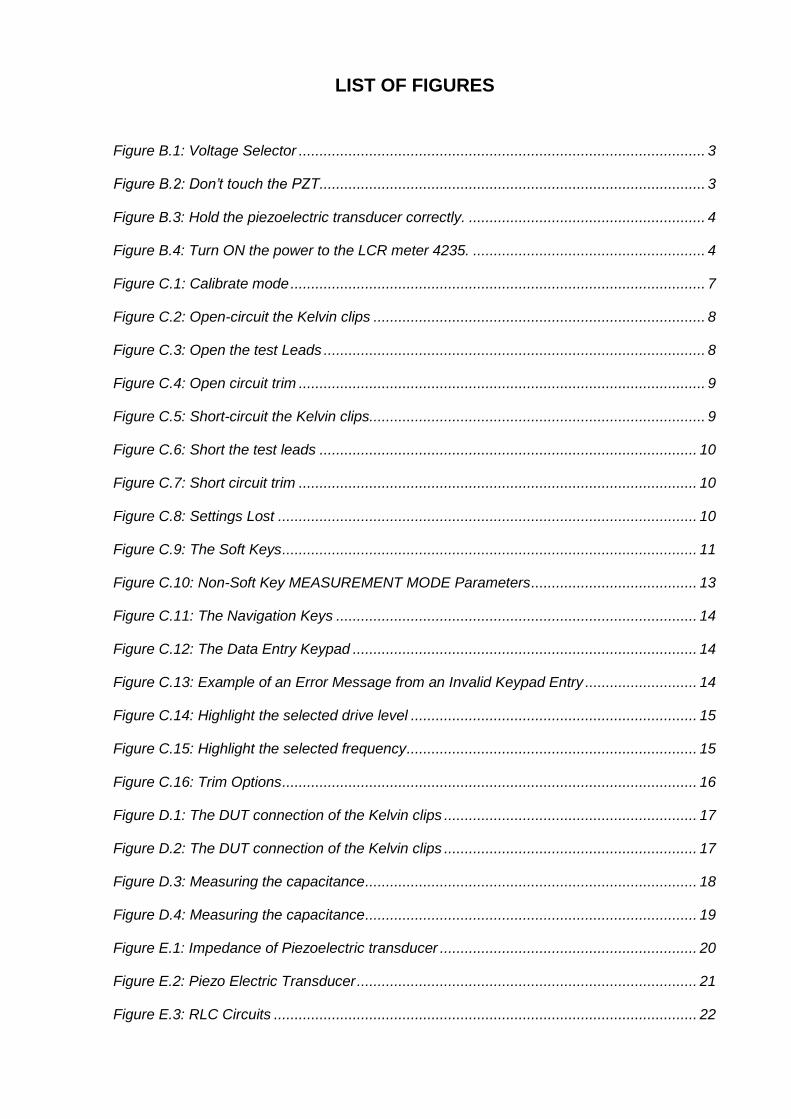
DESCRIBE
This manual guides you measure impedance of the piezoelectric transducer.
PURPOSE
- Prepare the LCR meter 4235 for measurement.
- Measure capacitance, impedance and phase Angle of the piezoelectric
transducer.
- Calculate the power of the piezoelectric transducer at each frequency.
- Understanding the piezoelectric transducer
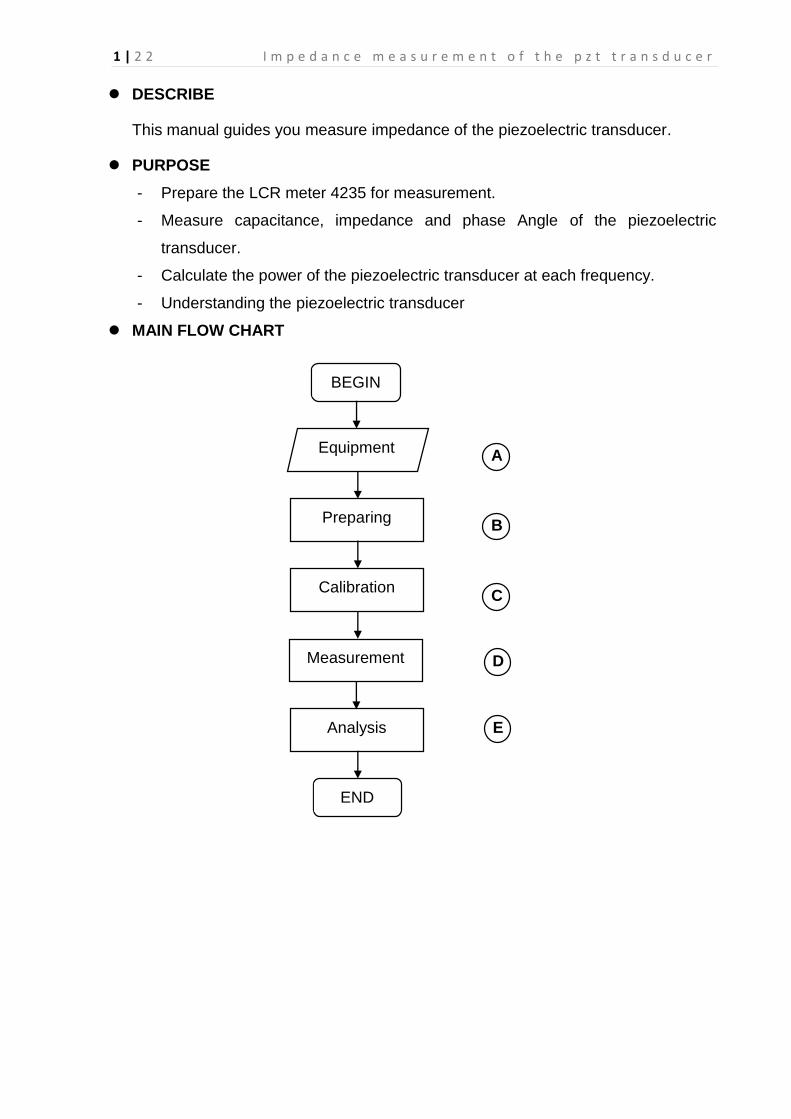
MAIN FLOW CHART
BEGIN
Equipment A
Preparing B
C
END
Measurement
Analysis E
Calibration
D
2 | 2 2 I m p e d a n c e m e a s u r e m e n t o f t h e p z t t r a n s d u c e r
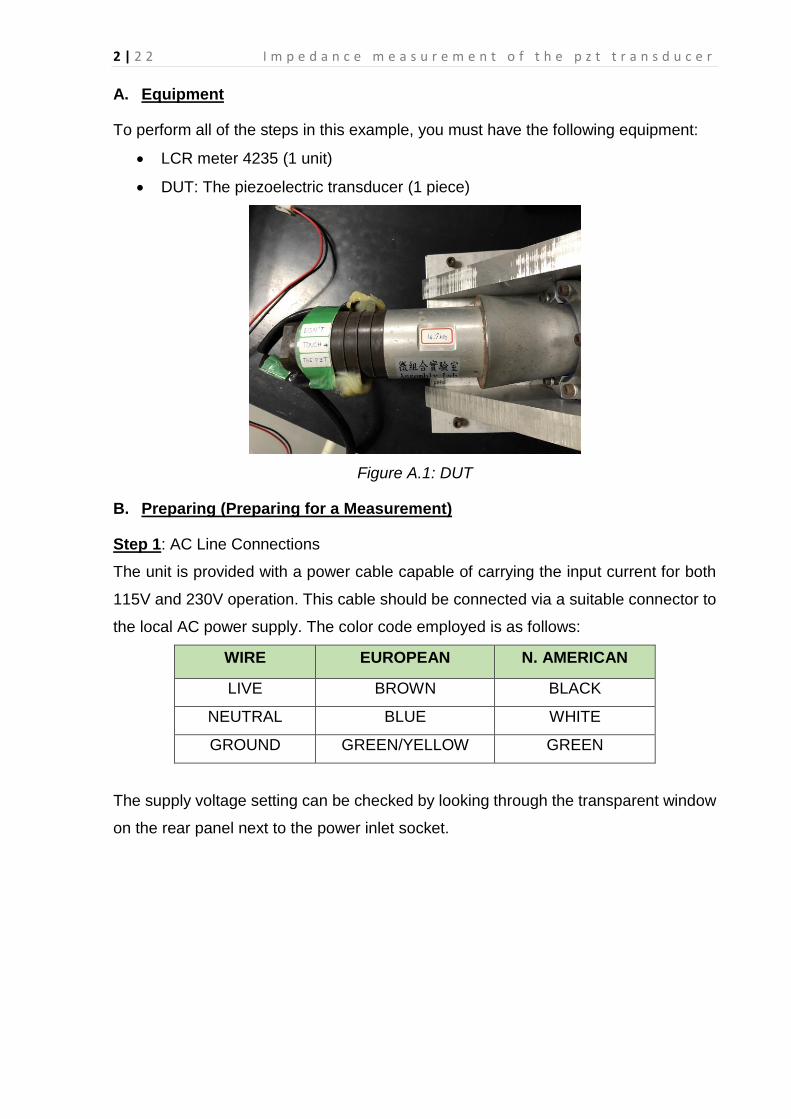
A. Equipment
To perform all of the steps in this example, you must have the following equipment:
LCR meter 4235 (1 unit)
DUT: The piezoelectric transducer (1 piece)
Figure A.1: DUT
B. Preparing (Preparing for a Measurement)
Step 1: AC Line Connections
The unit is provided with a power cable capable of carrying the input current for both
115V and 230V operation. This cable should be connected via a suitable connector to
the local AC power supply. The color code employed is as follows:
WIRE EUROPEAN N. AMERICAN
LIVE BROWN BLACK
NEUTRAL BLUE WHITE
GROUND GREEN/YELLOW GREEN
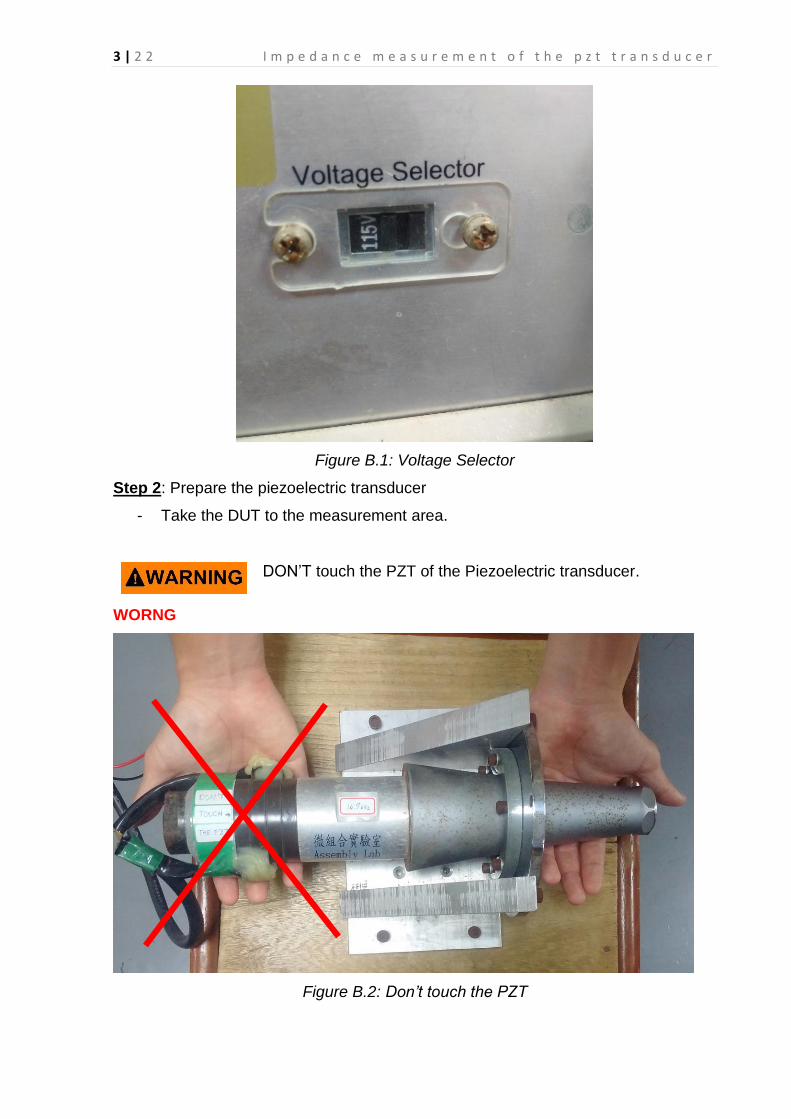
The supply voltage setting can be checked by looking through the transparent window
on the rear panel next to the power inlet socket.
3 | 2 2 I m p e d a n c e m e a s u r e m e n t o f t h e p z t t r a n s d u c e r
Figure B.1: Voltage Selector
Step 2: Prepare the piezoelectric transducer
- Take the DUT to the measurement area.
DON’T touch the PZT of the Piezoelectric transducer.
WORNG
Figure B.2: Don’t touch the PZT
4 | 2 2 I m p e d a n c e m e a s u r e m e n t o f t h e p z t t r a n s d u c e r
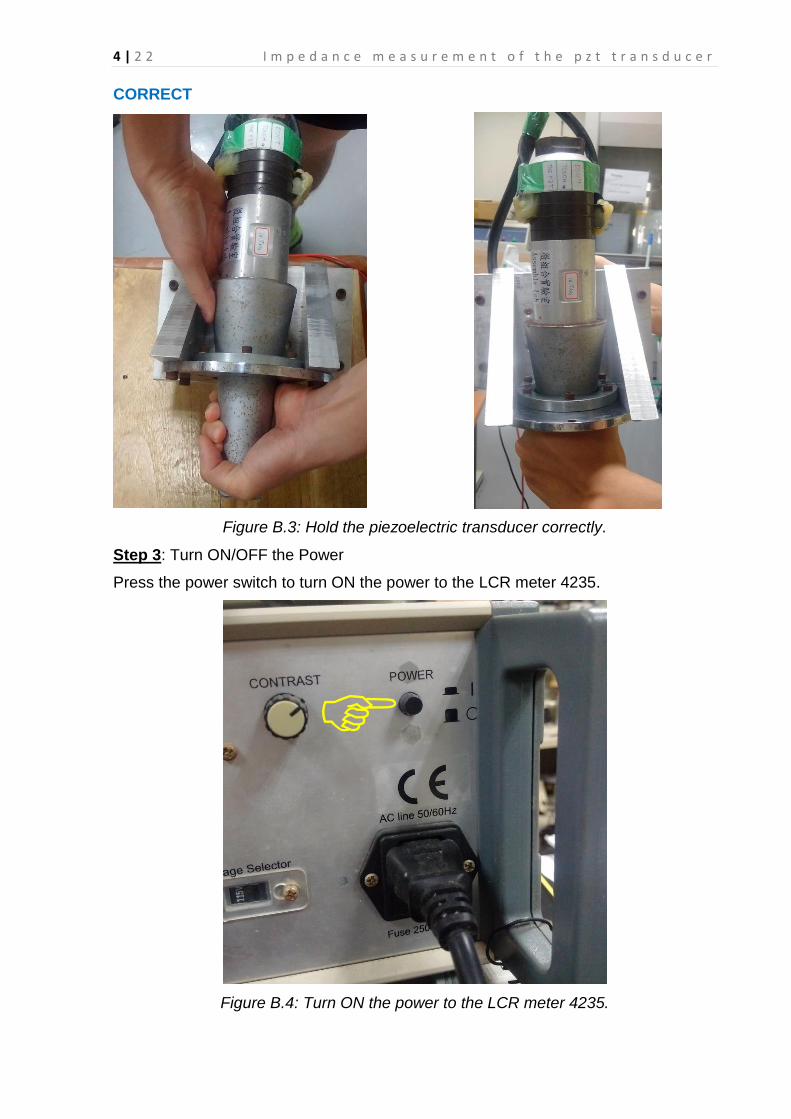
CORRECT
Figure B.3: Hold the piezoelectric transducer correctly.
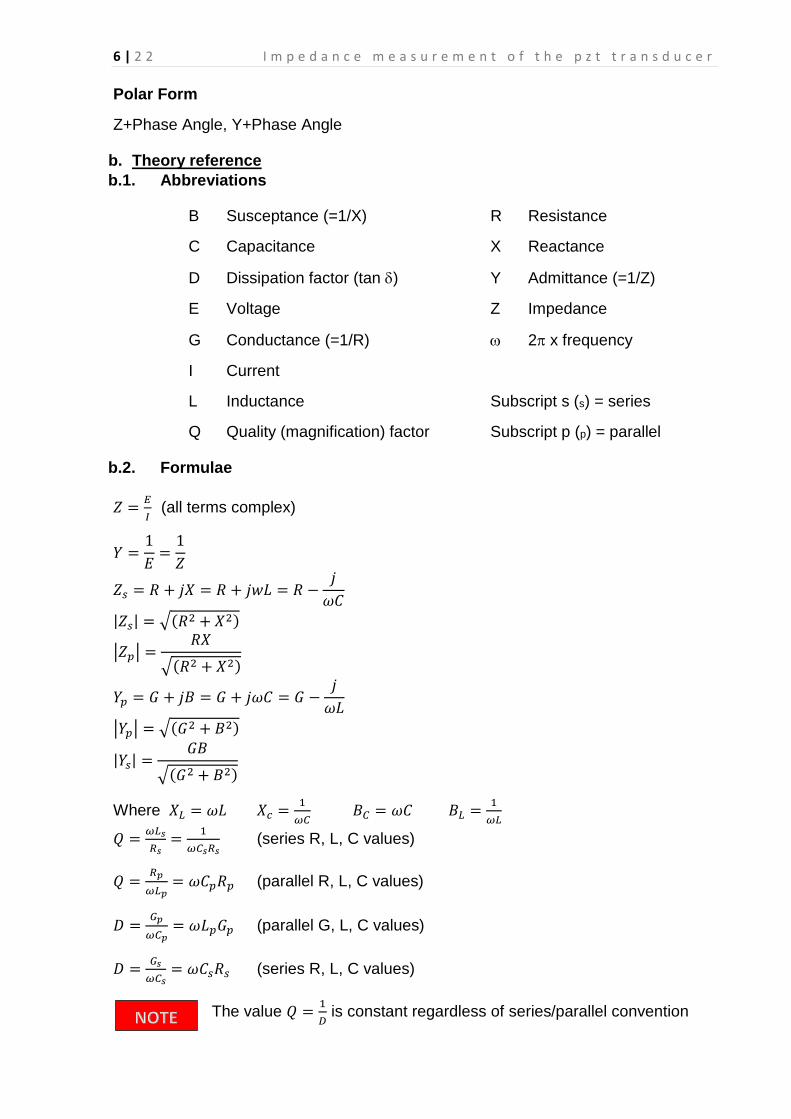
Step 3: Turn ON/OFF the Power
Press the power switch to turn ON the power to the LCR meter 4235.
Figure B.4: Turn ON the power to the LCR meter 4235.

5 | 2 2 I m p e d a n c e m e a s u r e m e n t o f t h e p z t t r a n s d u c e r
Switching the Instrument ON
With the instrument connected to the correct AC power supply press
the POWER switch. The power indicator will light and the instrument
will display the mode and settings selected when the instrument was
last switched off.
If the display is too bright or too dark, use the CONTRAST control
above the power switch to set the contrast level.
Switching the Instrument OFF
The power can be switched OFF at any time without damage to the
instrument, but to avoid losing trim and calibration data, the instrument
should be switched OFF when it is in a quiescent state rather than when
it is running a routine, e.g. trimming, calibration or data entry.
NEVER use a power cable showing any sign of damage. Faulty
cables can cause electrical shock.
a. Measurement Parameters
Any of the following parameters can be measured and displayed:
DC Function
Resistance (Rdc).
AC Functions
Capacitance ©, Inductance (L), Resistance (R), Conductance (G), Susceptance (B),
Reactance (X), Dissipation Factor (D), Quality Factor (Q), Impedance (Z), Admittance
(Y) and Phase Angle ().
The following display formats are available:
Series or Parallel Equivalent Circuit
C+R, C+D, C+Q, L+R, L+Q
Series Equivalent Circuit Only
X+R, X+D, X+Q
Parallel Equivalent Circuit Only
C+G, B+G, B+D, B+Q
6 | 2 2 I m p e d a n c e m e a s u r e m e n t o f t h e p z t t r a n s d u c e r
Polar Form
Z+Phase Angle, Y+Phase Angle
b. Theory reference
b.1. Abbreviations
B Susceptance (=1/X) R Resistance
C Capacitance X Reactance
D Dissipation factor (tan ) Y Admittance (=1/Z)
E Voltage Z Impedance
G Conductance (=1/R) 2 x frequency
I Current
L Inductance Subscript s (s) = series
Q Quality (magnification) factor Subscript p (p) = parallel
b.2. Formulae
𝑍 =𝐸
𝐼 (all terms complex)
𝑌 =1
𝐸=1
𝑍
𝑍𝑠 = 𝑅 + 𝑗𝑋 = 𝑅 + 𝑗𝑤𝐿 = 𝑅 −𝑗
𝜔𝐶
|𝑍𝑠| = √(𝑅2 + 𝑋2)
|𝑍𝑝| =𝑅𝑋
√(𝑅2 + 𝑋2)
𝑌𝑝 = 𝐺 + 𝑗𝐵 = 𝐺 + 𝑗𝜔𝐶 = 𝐺 −𝑗
𝜔𝐿
|𝑌𝑝| = √(𝐺2 + 𝐵2)
|𝑌𝑠| =𝐺𝐵
√(𝐺2 + 𝐵2)
Where 𝑋𝐿 = 𝜔𝐿 𝑋𝑐 =1
𝜔𝐶 𝐵𝐶 = 𝜔𝐶 𝐵𝐿 =
1
𝜔𝐿
𝑄 =𝜔𝐿𝑠
𝑅𝑠=
1
𝜔𝐶𝑠𝑅𝑠 (series R, L, C values)
𝑄 =𝑅𝑝
𝜔𝐿𝑝= 𝜔𝐶𝑝𝑅𝑝 (parallel R, L, C values)
𝐷 =𝐺𝑝
𝜔𝐶𝑝= 𝜔𝐿𝑝𝐺𝑝 (parallel G, L, C values)
𝐷 =𝐺𝑠
𝜔𝐶𝑠= 𝜔𝐶𝑠𝑅𝑠 (series R, L, C values)
The value 𝑄 =1
𝐷 is constant regardless of series/parallel convention
7 | 2 2 I m p e d a n c e m e a s u r e m e n t o f t h e p z t t r a n s d u c e r
b.3. Series/Parallel Conversions
𝑅𝑠 =𝑅𝑝
(1+𝑄2) 𝑅𝑝 = 𝑅𝑠(1 + 𝑄2)
𝐶𝑠 = 𝐶𝑝(1 + 𝐷2) 𝐶𝑝 =𝐶𝑠
(1+𝐷2)
𝐿𝑠 =𝐿𝑝
(1+1
𝑄2) 𝐿𝑝 = 𝐿𝑠 (1 +
1
𝑄2)
Conversion using the above formulae will be valid only at the test frequency.
b.4. Polar Derivations
𝑅𝑠 = |𝑍| cos 𝜃 𝐺𝑝 = |𝑌| cos 𝜃
𝑋𝑠 = |𝑍| sin 𝜃 𝐵𝑝 = |𝑌| sis 𝜃
Note that, by convention, +ve angle indicates an inductive impedance or capacitive
admittance.
If capacitance is measured as inductance, the L value will be –ve.
If inductance is measured as capacitance, the C value will be –ve.
𝐷 = tan 𝛿 where 𝛿 = (90 − 𝜃)0 admittance measurement.
𝑄 =1
tan𝛿 where 𝛿 = (90 − 𝜃)0 impedance measurement.
C. Calibration
Step 1: Set the Drive level to 2Vac
- Using the Navigation Keys, highlight the selected Drive level (Non-Soft Key)
- Using the Data Entry Keypad input the value 2Vac
Step 2: Calibrate Mode
- Using the Soft keys to select CALIBRATE, either from the MAIN MENU, or
from a mode which has CALIBRATE as an option (in which case pressing the
RETURN soft key will return the analyzer to the original mode). The analyzer
will enter CALIBRATE MODE.
Figure C.1: Calibrate mode
8 | 2 2 I m p e d a n c e m e a s u r e m e n t o f t h e p z t t r a n s d u c e r
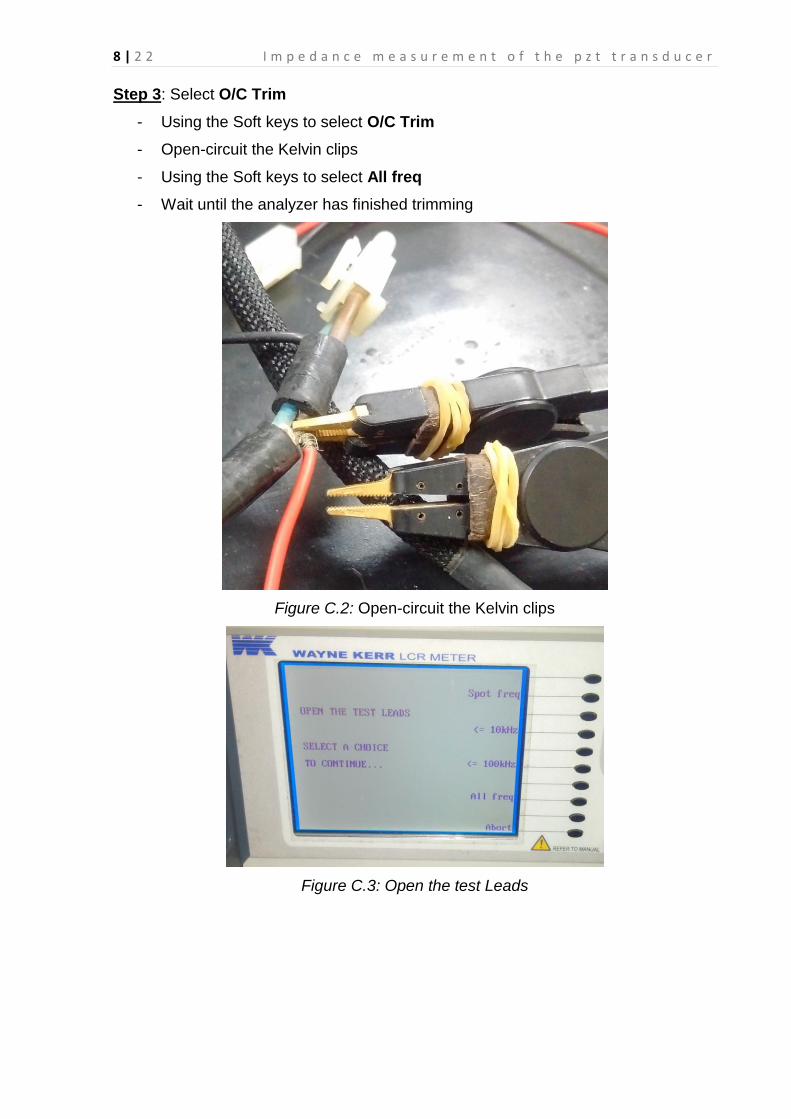
Step 3: Select O/C Trim
- Using the Soft keys to select O/C Trim
- Open-circuit the Kelvin clips
- Using the Soft keys to select All freq
- Wait until the analyzer has finished trimming
Figure C.2: Open-circuit the Kelvin clips
Figure C.3: Open the test Leads
9 | 2 2 I m p e d a n c e m e a s u r e m e n t o f t h e p z t t r a n s d u c e r
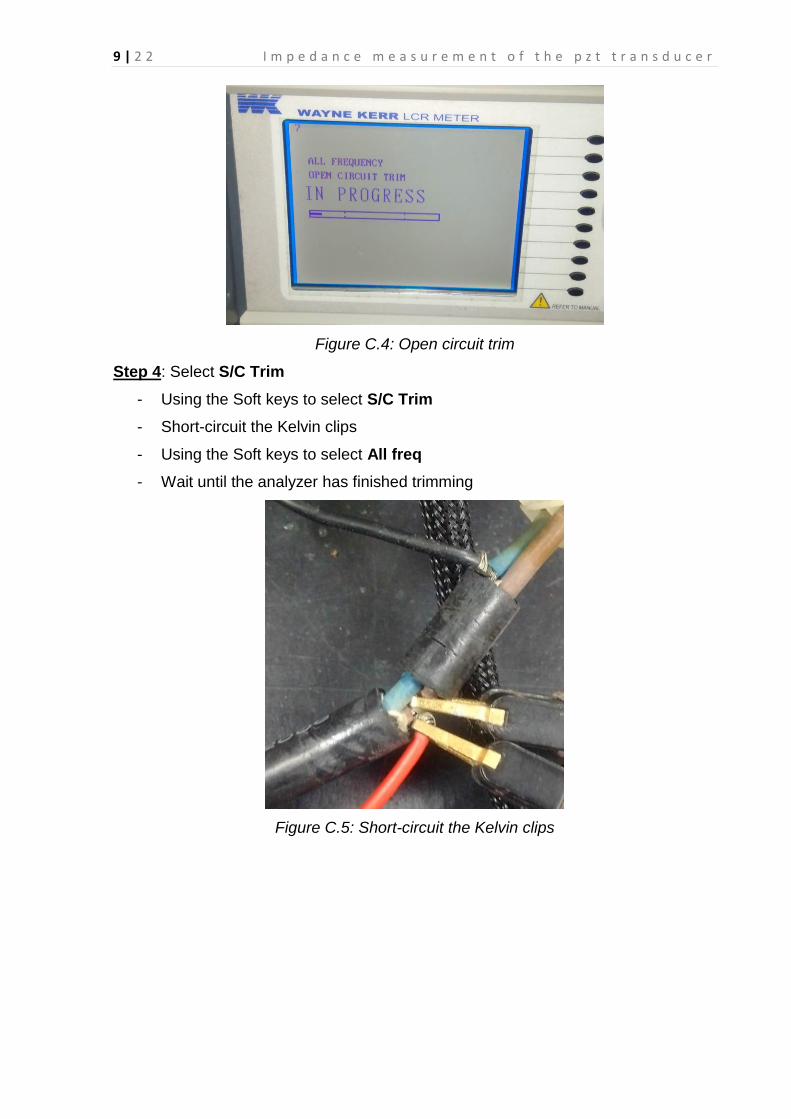
Figure C.4: Open circuit trim
Step 4: Select S/C Trim
- Using the Soft keys to select S/C Trim
- Short-circuit the Kelvin clips
- Using the Soft keys to select All freq
- Wait until the analyzer has finished trimming
Figure C.5: Short-circuit the Kelvin clips

10 | 2 2 I m p e d a n c e m e a s u r e m e n t o f t h e p z t t r a n s d u c e r
Figure C.6: Short the test leads
Figure C.7: Short circuit trim
If the instrument is switched OFF during O/C trim or S/C trim, the
message shown in Figure C.8 will be displayed when the instrument is
next switched ON. MEASUREMENT MODE will be reset to the default
settings and or will be displayed at
the top of the screen. These messages will only be cleared by
performing the appropriate trim. The instrument can be used with the
default settings but it is recommended that and/or is
run for full measurement accuracy.
Figure C.8: Settings Lost
Figure C.8 will also be displayed when power is removed during other
critical routines, such as calibration and data entry.
11 | 2 2 I m p e d a n c e m e a s u r e m e n t o f t h e p z t t r a n s d u c e r
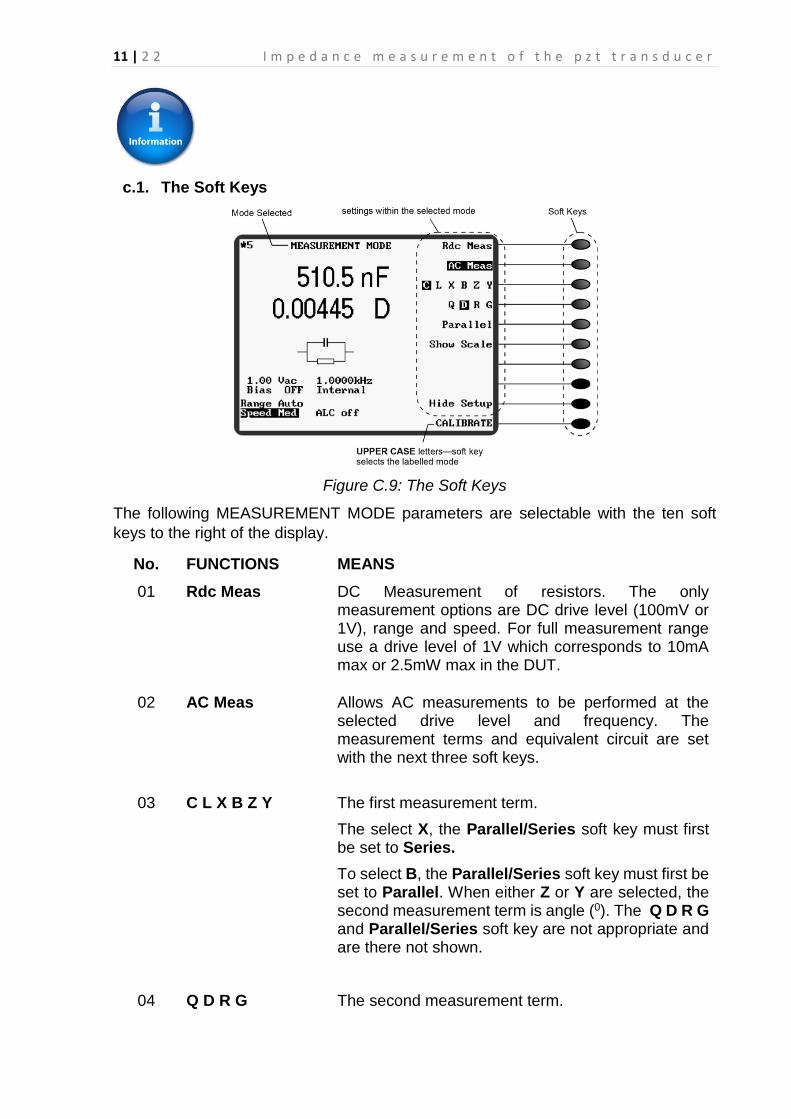
c.1. The Soft Keys
Figure C.9: The Soft Keys
The following MEASUREMENT MODE parameters are selectable with the ten soft
keys to the right of the display.
No. FUNCTIONS MEANS
01 Rdc Meas DC Measurement of resistors. The only measurement options are DC drive level (100mV or 1V), range and speed. For full measurement range use a drive level of 1V which corresponds to 10mA max or 2.5mW max in the DUT.
02 AC Meas Allows AC measurements to be performed at the selected drive level and frequency. The measurement terms and equivalent circuit are set with the next three soft keys.
03 C L X B Z Y The first measurement term.
The select X, the Parallel/Series soft key must first be set to Series.
To select B, the Parallel/Series soft key must first be set to Parallel. When either Z or Y are selected, the second measurement term is angle (0). The Q D R G and Parallel/Series soft key are not appropriate and are there not shown.
04 Q D R G The second measurement term.
12 | 2 2 I m p e d a n c e m e a s u r e m e n t o f t h e p z t t r a n s d u c e r
To select G, the Parallel/Series soft key must first be set to Parallel.
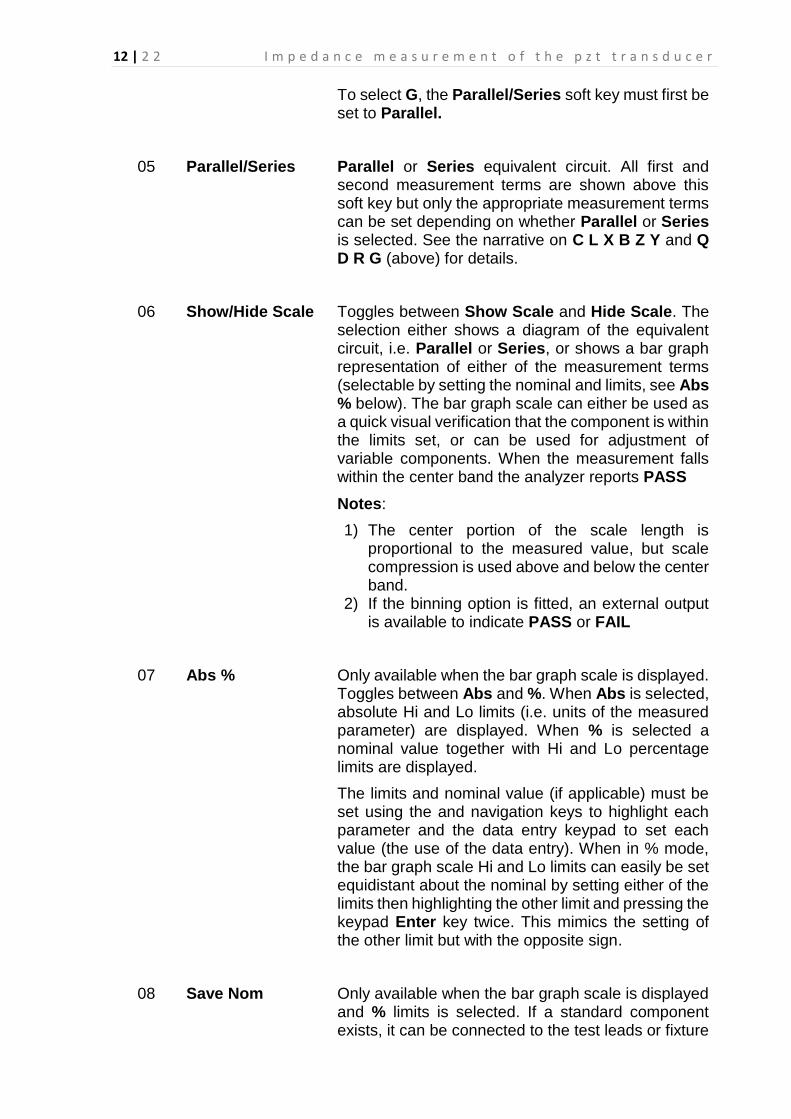
05 Parallel/Series Parallel or Series equivalent circuit. All first and second measurement terms are shown above this soft key but only the appropriate measurement terms can be set depending on whether Parallel or Series is selected. See the narrative on C L X B Z Y and Q D R G (above) for details.
06 Show/Hide Scale Toggles between Show Scale and Hide Scale. The selection either shows a diagram of the equivalent circuit, i.e. Parallel or Series, or shows a bar graph representation of either of the measurement terms (selectable by setting the nominal and limits, see Abs % below). The bar graph scale can either be used as a quick visual verification that the component is within the limits set, or can be used for adjustment of variable components. When the measurement falls within the center band the analyzer reports PASS
Notes:
1) The center portion of the scale length is proportional to the measured value, but scale compression is used above and below the center band.
2) If the binning option is fitted, an external output is available to indicate PASS or FAIL
07 Abs % Only available when the bar graph scale is displayed. Toggles between Abs and %. When Abs is selected, absolute Hi and Lo limits (i.e. units of the measured parameter) are displayed. When % is selected a nominal value together with Hi and Lo percentage limits are displayed.
The limits and nominal value (if applicable) must be set using the and navigation keys to highlight each parameter and the data entry keypad to set each value (the use of the data entry). When in % mode, the bar graph scale Hi and Lo limits can easily be set equidistant about the nominal by setting either of the limits then highlighting the other limit and pressing the keypad Enter key twice. This mimics the setting of the other limit but with the opposite sign.
08 Save Nom Only available when the bar graph scale is displayed and % limits is selected. If a standard component exists, it can be connected to the test leads or fixture

13 | 2 2 I m p e d a n c e m e a s u r e m e n t o f t h e p z t t r a n s d u c e r
and measured by the analyzer. Pressing Save Nom enters the most recent analyzer measurement of the component as the nominal test value for comparing all subsequent components with.
Notes:
1) To change this function from the firs to the second measured parameter (or vice versa), first enter a dummy value with units via the keypad;
e.g. to change from L to R, enter [1] [unit] [] [Enter] then press the Save Nom key.
2) Do not use the Save Nom function if the measured value is negative (e.g. an inductor measured above its self-resonant frequency).
09 Show/Hide Setup Once the measurement parameters have been set, Hide Setup can be selected to clear them from the screen. The parameter settings are still valid and will be used for component measurements. The bar graph scale and limits will still be displayed. Hide Setup is used primarily to unclutter the display, making it more easily readable. Selecting Show Setup will redisplay the parameter settings.
10 CALIBRATE Enters CALIBRATE MODE which is used for Trimming and Self Calibration.
c.2. Non-Soft Key MEASUREMENT MODE Parameters
Figure C.10: Non-Soft Key MEASUREMENT MODE Parameters
14 | 2 2 I m p e d a n c e m e a s u r e m e n t o f t h e p z t t r a n s d u c e r
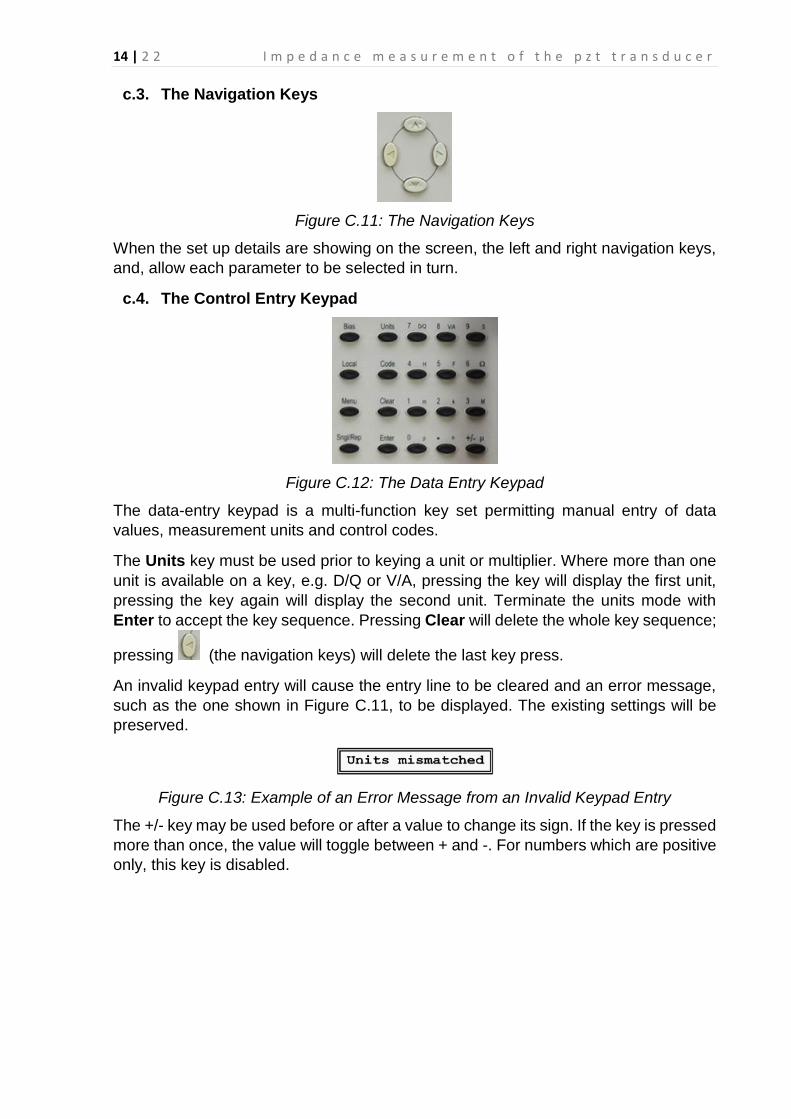
c.3. The Navigation Keys
Figure C.11: The Navigation Keys
When the set up details are showing on the screen, the left and right navigation keys,
and, allow each parameter to be selected in turn.
c.4. The Control Entry Keypad
Figure C.12: The Data Entry Keypad
The data-entry keypad is a multi-function key set permitting manual entry of data
values, measurement units and control codes.
The Units key must be used prior to keying a unit or multiplier. Where more than one
unit is available on a key, e.g. D/Q or V/A, pressing the key will display the first unit,
pressing the key again will display the second unit. Terminate the units mode with
Enter to accept the key sequence. Pressing Clear will delete the whole key sequence;
pressing (the navigation keys) will delete the last key press.
An invalid keypad entry will cause the entry line to be cleared and an error message,
such as the one shown in Figure C.11, to be displayed. The existing settings will be
preserved.
Figure C.13: Example of an Error Message from an Invalid Keypad Entry
The +/- key may be used before or after a value to change its sign. If the key is pressed
more than once, the value will toggle between + and -. For numbers which are positive
only, this key is disabled.
15 | 2 2 I m p e d a n c e m e a s u r e m e n t o f t h e p z t t r a n s d u c e r
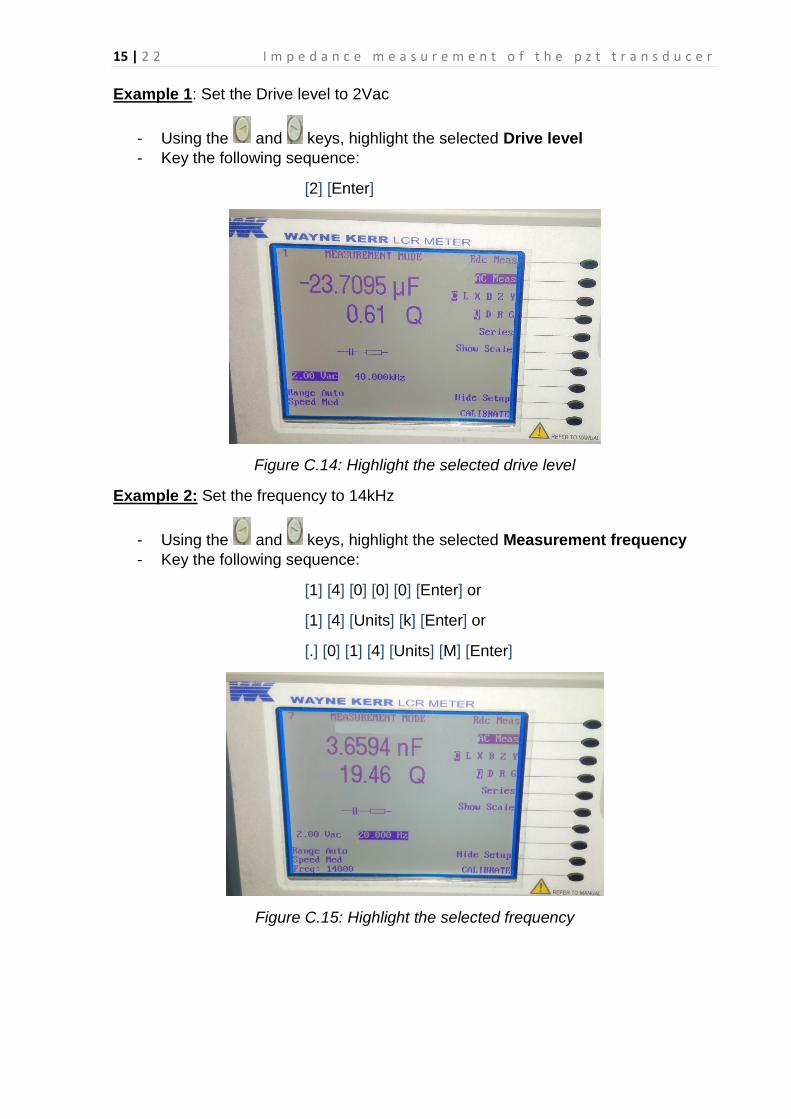
Example 1: Set the Drive level to 2Vac
- Using the and keys, highlight the selected Drive level
- Key the following sequence:
[2] [Enter]
Figure C.14: Highlight the selected drive level
Example 2: Set the frequency to 14kHz
- Using the and keys, highlight the selected Measurement frequency
- Key the following sequence:
[1] [4] [0] [0] [0] [Enter] or
[1] [4] [Units] [k] [Enter] or
[.] [0] [1] [4] [Units] [M] [Enter]
Figure C.15: Highlight the selected frequency
16 | 2 2 I m p e d a n c e m e a s u r e m e n t o f t h e p z t t r a n s d u c e r
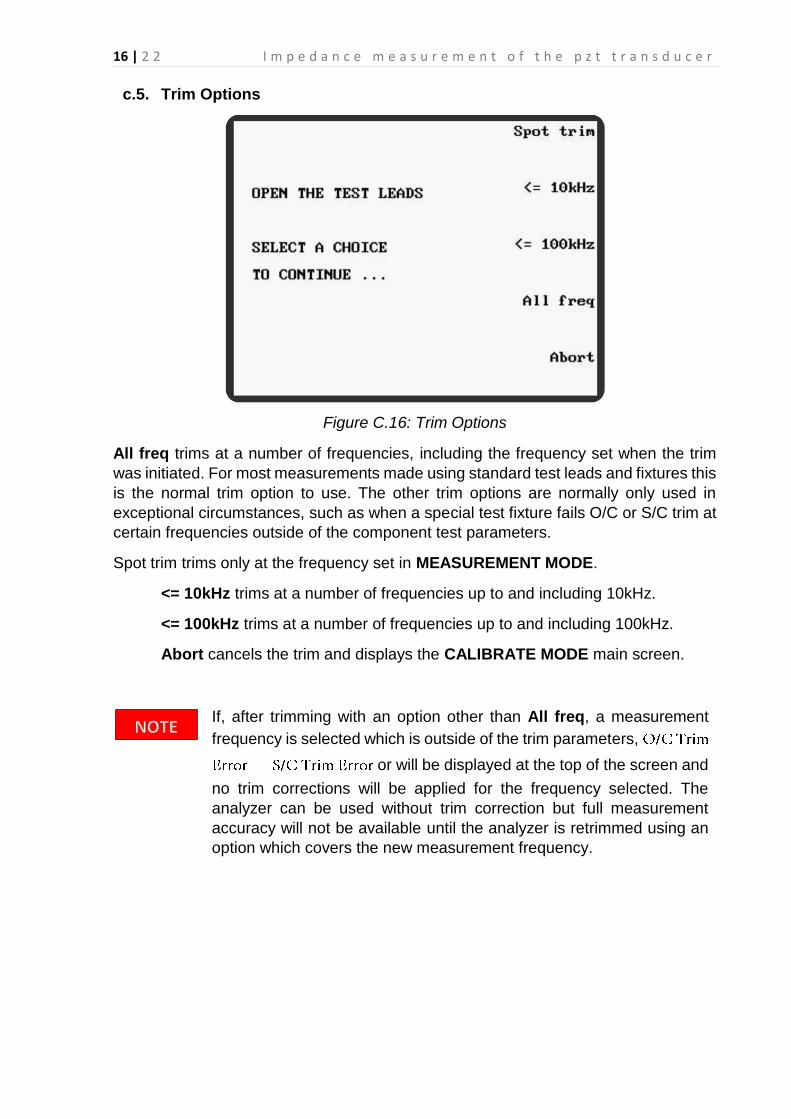
c.5. Trim Options
Figure C.16: Trim Options
All freq trims at a number of frequencies, including the frequency set when the trim
was initiated. For most measurements made using standard test leads and fixtures this
is the normal trim option to use. The other trim options are normally only used in
exceptional circumstances, such as when a special test fixture fails O/C or S/C trim at
certain frequencies outside of the component test parameters.
Spot trim trims only at the frequency set in MEASUREMENT MODE.
<= 10kHz trims at a number of frequencies up to and including 10kHz.
<= 100kHz trims at a number of frequencies up to and including 100kHz.
Abort cancels the trim and displays the CALIBRATE MODE main screen.
If, after trimming with an option other than All freq, a measurement
frequency is selected which is outside of the trim parameters,
or will be displayed at the top of the screen and
no trim corrections will be applied for the frequency selected. The
analyzer can be used without trim correction but full measurement
accuracy will not be available until the analyzer is retrimmed using an
option which covers the new measurement frequency.

17 | 2 2 I m p e d a n c e m e a s u r e m e n t o f t h e p z t t r a n s d u c e r
D. Measurement
Step 1: Connect the DUT
After performing open and short compensations, the DUT is connected into the
Kelvin clips.
Figure D.1: The DUT connection of the Kelvin clips
Step 3: Select MEASURE
Using the Soft keys to select MEASURE
MEASUREMENT MODE will be displayed
Figure D.2: The DUT connection of the Kelvin clips
18 | 2 2 I m p e d a n c e m e a s u r e m e n t o f t h e p z t t r a n s d u c e r
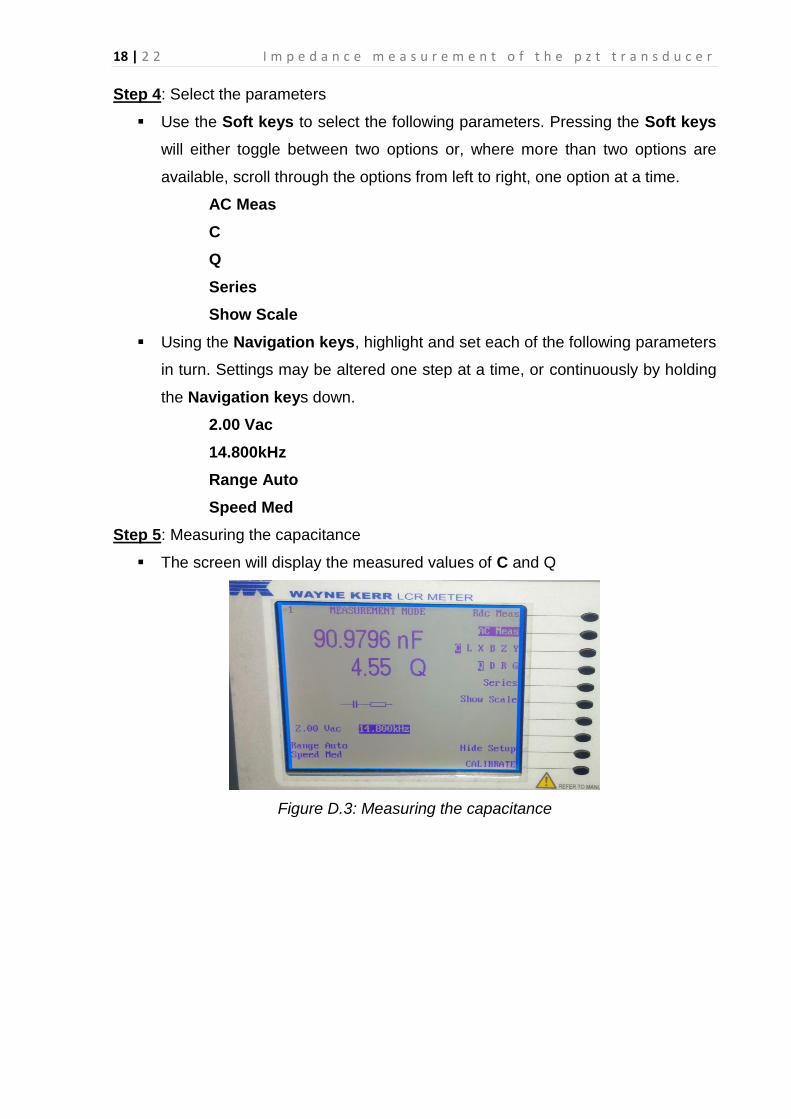
Step 4: Select the parameters
Use the Soft keys to select the following parameters. Pressing the Soft keys
will either toggle between two options or, where more than two options are
available, scroll through the options from left to right, one option at a time.
AC Meas
C
Q
Series
Show Scale
Using the Navigation keys, highlight and set each of the following parameters
in turn. Settings may be altered one step at a time, or continuously by holding
the Navigation keys down.
2.00 Vac
14.800kHz
Range Auto
Speed Med
Step 5: Measuring the capacitance
The screen will display the measured values of C and Q
Figure D.3: Measuring the capacitance
19 | 2 2 I m p e d a n c e m e a s u r e m e n t o f t h e p z t t r a n s d u c e r
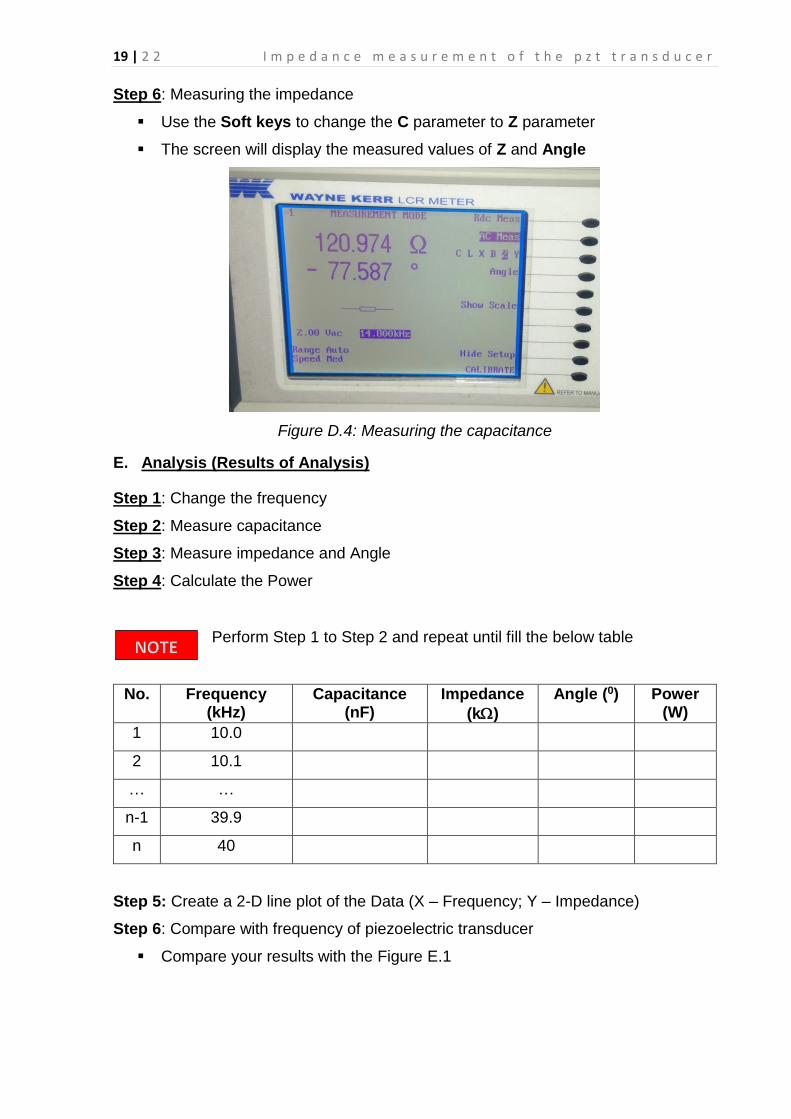
Step 6: Measuring the impedance
Use the Soft keys to change the C parameter to Z parameter
The screen will display the measured values of Z and Angle
Figure D.4: Measuring the capacitance
E. Analysis (Results of Analysis)
Step 1: Change the frequency
Step 2: Measure capacitance
Step 3: Measure impedance and Angle
Step 4: Calculate the Power
Perform Step 1 to Step 2 and repeat until fill the below table
No. Frequency (kHz)
Capacitance (nF)
Impedance
(k)
Angle (0) Power (W)
1 10.0
2 10.1
… …
n-1 39.9
n 40
Step 5: Create a 2-D line plot of the Data (X – Frequency; Y – Impedance)
Step 6: Compare with frequency of piezoelectric transducer
Compare your results with the Figure E.1
20 | 2 2 I m p e d a n c e m e a s u r e m e n t o f t h e p z t t r a n s d u c e r
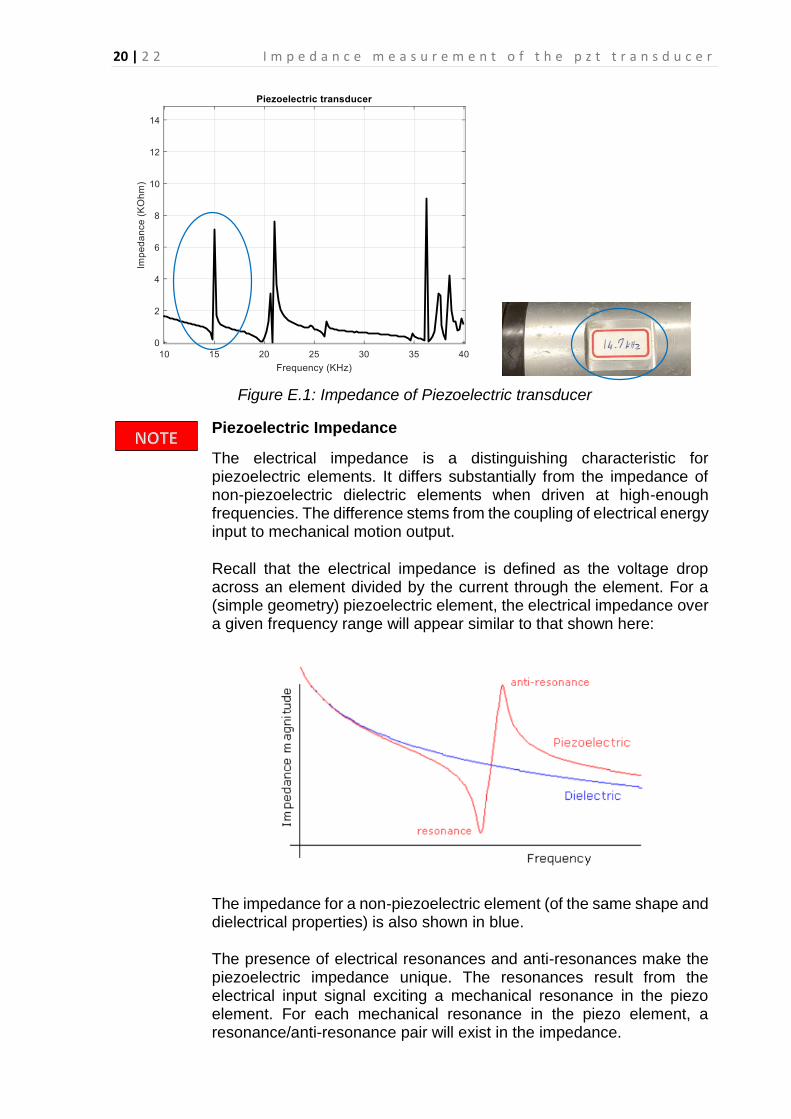
Figure E.1: Impedance of Piezoelectric transducer
Piezoelectric Impedance
The electrical impedance is a distinguishing characteristic for piezoelectric elements. It differs substantially from the impedance of non-piezoelectric dielectric elements when driven at high-enough frequencies. The difference stems from the coupling of electrical energy input to mechanical motion output.
Recall that the electrical impedance is defined as the voltage drop across an element divided by the current through the element. For a (simple geometry) piezoelectric element, the electrical impedance over a given frequency range will appear similar to that shown here:
The impedance for a non-piezoelectric element (of the same shape and dielectrical properties) is also shown in blue.
The presence of electrical resonances and anti-resonances make the piezoelectric impedance unique. The resonances result from the electrical input signal exciting a mechanical resonance in the piezo element. For each mechanical resonance in the piezo element, a resonance/anti-resonance pair will exist in the impedance.

21 | 2 2 I m p e d a n c e m e a s u r e m e n t o f t h e p z t t r a n s d u c e r
e.1. Piezoelectric Transducer Working Principle:
Piezoelectric Transducer Working Principle – A symmetrical crystalline materials such
as Quartz, Rochelle salt and Barium titanate produce an emf (electromotive force)
when they are placed under stress. This property is used in Piezoelectric transducer
working principle, where a crystal is placed between a solid base and the force-
summing member as shown in Figure E.2.
Figure E.2: Piezo Electric Transducer
An externally applied force, entering the transducer through its pressure port, applies
pressure to the top of a crystal. This produces an emf across the crystal proportional
to the magnitude of applied pressure.
The following electric circuit can be used to model a resonance/ anti-resonance pair
the electrical impedance of piezoelectric.
The following 2 conditions are required for the circuit to accurately simulate
piezoelectric resonance behavior:
The value of C must be much smaller than Cp
C1 and Cp in parallel must equal the piezo’s low-frequency capacitance
The frequencies (in Hz) of the electrical resonance and anti-resonance are given by
the following equations (which assume as small series resistance R):
𝑓𝑟𝑒𝑠𝑜𝑛𝑎𝑛𝑐𝑒 =1
2𝜋√𝐿1𝐶1 𝑓𝑎𝑛𝑡𝑖−𝑟𝑒𝑠𝑜𝑛𝑎𝑛𝑐𝑒 =
1
2𝜋√𝐿1𝐶1𝐶𝑝
𝐶1+𝐶𝑝
22 | 2 2 I m p e d a n c e m e a s u r e m e n t o f t h e p z t t r a n s d u c e r
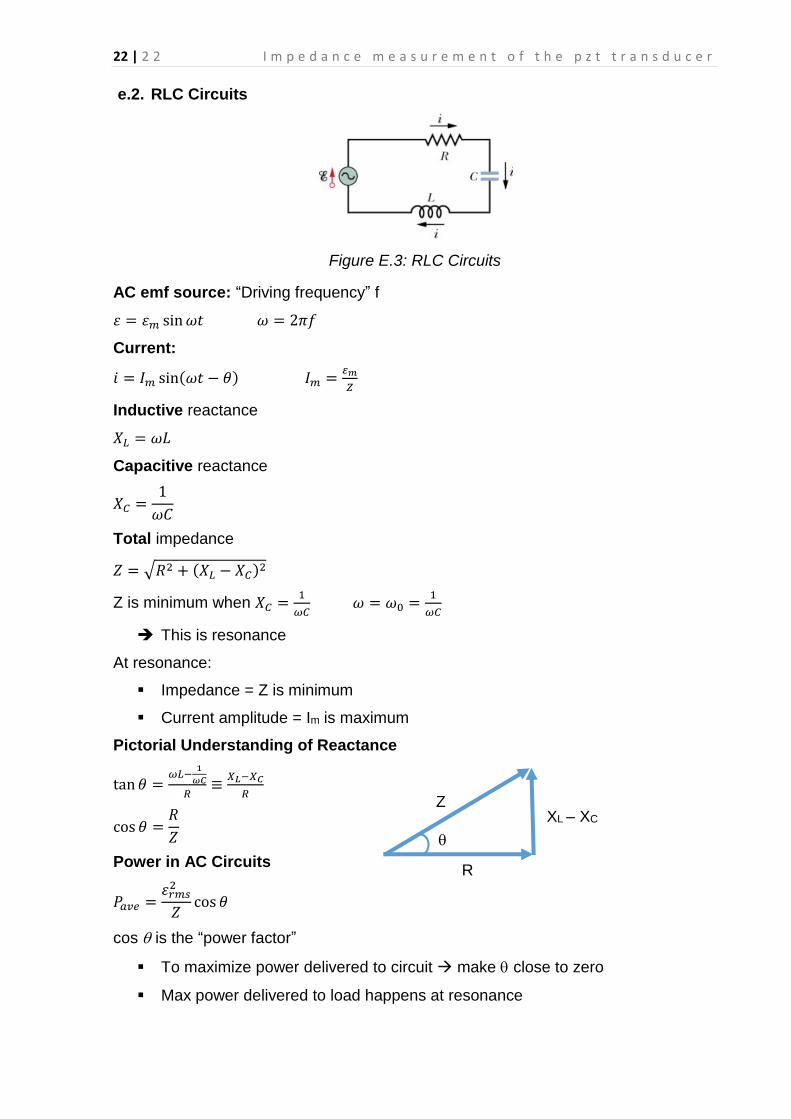
e.2. RLC Circuits
Figure E.3: RLC Circuits
AC emf source: “Driving frequency” f
휀 = 휀𝑚 sin𝜔𝑡 𝜔 = 2𝜋𝑓
Current:
𝑖 = 𝐼𝑚 sin(𝜔𝑡 − 𝜃) 𝐼𝑚 = 𝑚
𝑍
Inductive reactance
𝑋𝐿 = 𝜔𝐿
Capacitive reactance
𝑋𝐶 =1
𝜔𝐶
Total impedance
𝑍 = √𝑅2 + (𝑋𝐿 − 𝑋𝐶)2
Z is minimum when 𝑋𝐶 =1
𝜔𝐶 𝜔 = 𝜔0 =
1
𝜔𝐶
This is resonance
At resonance:
Impedance = Z is minimum
Current amplitude = Im is maximum
Pictorial Understanding of Reactance
tan 𝜃 =𝜔𝐿−
1
𝜔𝐶
𝑅≡
𝑋𝐿−𝑋𝐶
𝑅
cos 𝜃 =𝑅
𝑍
Power in AC Circuits
𝑃𝑎𝑣𝑒 =휀𝑟𝑚𝑠2
𝑍cos 𝜃
cos is the “power factor”
To maximize power delivered to circuit make close to zero
Max power delivered to load happens at resonance
Z XL – XC
R