Embed Size (px)
Citation preview

7/30/2019 Lab Manual Chemistry
http://slidepdf.com/reader/full/lab-manual-chemistry 1/48
JOGINAPALLY B.R. ENGINEERING COLLEGE
(Approved by AICTE & Affiliated to JNTU, Hyderabad)
Yenkapally (V), Moinabad (M), Himayatnagar (P.O.) R.R. Dist,
Hyderabad -500075
Phone : 08413-235684, TeleFax : 91-8413-235753, 235685Web Site : www.jbrec.org Email : [email protected]
DEPARTMENT OF SCIENCE & HUMANITIES
B. Tech – Ist year 2010-11
(COMMON TO ALL BRANCHES)
JBREC
JBREC

7/30/2019 Lab Manual Chemistry
http://slidepdf.com/reader/full/lab-manual-chemistry 2/48
ENGINEERING CHEMISTRY
LABPRACTICAL
MANUAL
JBREC

7/30/2019 Lab Manual Chemistry
http://slidepdf.com/reader/full/lab-manual-chemistry 3/48
ENGINEERING CHEMISTRY LAB
LIST OF EXPERIMENTS
TITRIMETRY
1. Estimation of hardness of water by EDTA method..
2. Estimation of manganese dioxide in Pyrolusite.
PREPARATION OF ORGANIC COMPOUNDS
3. Preparation of Organic Compound Aspirin.
.
4. Preparation of Thiokol Rubber
PHYSICAL PROPERTIES
5. Determination of Surface tension of lubricants by using Stalagnometer.
6. Determination of Viscosity of sample oil by Ostwald’s Viscometer
INSTRUMENTAL ANALYSIS
CONDUCTOMETRY
7. Conductometric titration of strong acid Vs strong Base.
COLORIMETRY
8. Determination of Ferrous iron in cement by colorimetric method
POTENTIOMETRY
9. Potentiometric titrations of weak acid Vs strong Base.
JBREC

7/30/2019 Lab Manual Chemistry
http://slidepdf.com/reader/full/lab-manual-chemistry 4/48
COMMON APPARATUS USED IN CHEMISTRY LABORATORY
EXPERIMENTS
Apparatus;
1. Pipette: Pipettes permit the transfer of accurately known volumes from one
container to another. Commonly we use volumetric pipettes.
2. Burette: Burettes are like a measuring pipette makes it possible to deliver any
volume up to the maximum capacity of the device. A burette consists of a calibrated
tube to hold titrant + a valve arrangement by which the flow of titrant is controlled.
3. Volumetric Flask: Volumetric flasks are manufactured with capacities ranging from
5ml to 5 liter and are usually calibrated to contain a specific volume when filled inline etched on the neck. They are used for the preparation of standard solution and for
dilution of samples to a fixed volume prior to taking aliquots with pipettes.
4. The Burette Stand
5. Standard Flask: The flask filled with standard solution known as standard flask.
Terms involved in titrations:
1. Titration; The process of finding out the volume of one of the solution
required to react completely with definite volume of the other solution of
known concentration is called as titration
2. Titrant : the solution of known strength is called titrant.
3. Titrate : the solution which contains the substance to be estimated
4. Indicator: The reagent which indicate the end point are equivalent point of the
titration
5. Standard Solution : A solution of known concentration that is exactly used in
titrimetric analysis is known as “standard solution”.
6. Equivalence Point : equivalence point is the point in a titration when the
amount of added standard reagent is exactly equivalent to the amount of
analyte.
7. End Point: End point is the point in a titration when a physical change occurs
i.e., associated with the condition of chemical equivalence.
JBREC

7/30/2019 Lab Manual Chemistry
http://slidepdf.com/reader/full/lab-manual-chemistry 5/48
1. HARDNESS OF WATER : Hardness of water is a particular characteristic
property which prevents lathering of soap.
Water are two typesHard water: Is a one which contains Ca, Mg bicarbonates, carbonates,
silicates and sulphates
When a sample of hard water treated with soap solution it does not give lather
Soft water: soft water Is a one which does not contain Ca, Mg bicarbonates,
carbonates, silicates and sulphates
When a sample of soft water treated with soap solution it gives more lather
Hardness can be expressed by the following units
(i) Ppm parts per million
(ii) Degree/ clark
(iii) Degree/ french
(iv) In terms of caco3 equivalentHardness are two types
a. Temporary hardness: the hardness which can be easily removed by the
process of boiling is called temporary hardness it is caused due to the presence
of bicarbonates of ca & mg.
b. Permanent hardness: The hardness which cannot be removed by the process
of boiling is called permanent hardness it is caused due to the presence of ca &
mg chlorides, sulphates
(a) EDTA Titrations (or complexometric titrations): The titrations
involving EDTA as a complexing agent is known as”EDTA Titrations” (or)
“Complex Formation Titrations” .EDTA stands for ‘ Ethylene Diamino Tetra Acetic acid ” or “Diamino Ethane
Tetra Acetic Acid ”.
The structure of EDTA is given by
CH2COOH CH2COOH
N - CH2 – CH2 – N
CH2COOH CH2COOH
EDTA forms complexes with metal ions like Ca2+, Mg2+ in aqueous solution.
Complexometric Titration is the titration of metal ion with a reagent, usually
EDTA, which forms chelate complex with a metal.
The indications used are commonly,
(i) Erichrome Black T Indicator (EBT) The colour generally changes from
wine red to blue.
(ii) The structure of EBT:
JBREC

7/30/2019 Lab Manual Chemistry
http://slidepdf.com/reader/full/lab-manual-chemistry 6/48
2. MNO2 IN PYROLUSITE:
Mno2 exists in nature in the form o0f pyrolusite The
Mno2 present in the pyrolusite sample is reduced to a known excess of standardsodium oxalate as acid medium the un reacted sodium oxalate is titrated against a
standard solution of KMno4, here Kmno4 acts as a self indicator
3. ASPIRIN:
The mechanism involved in the preparation of aspirin is Acetylation
4. POLYMER
A polymer is a macro molecule which is obtained by the combination of
monomers. The repeating unit of a monomer is called a polymer.
RUBBERS
The polymer which posses the property of elasticity is called a rubber.
They are of 2 types.
i. NATURAL RUBBER
The rubber which is obtained from nature is called natural rubber.
The latex obtained from heavea brasinilies & gutta percha are examples of
natural rubber
ii. SYNTHETIC RUBBER
The rubber which is prepared from laboratory is called synthetic rubber
These rubbers neither Resemble natural rubber in structure (nor)properties they hare
good resistance to solvents and can with stand cold but not heat
a. They are cheap and can be easily shaped but hare an unpleasant smell .
because of their being practically unaffected by phenol , fuel oils and
lubricating oils they are mostly used for making house pipe and tank
lining for handling these materials
JBREC

7/30/2019 Lab Manual Chemistry
http://slidepdf.com/reader/full/lab-manual-chemistry 7/48
b. vulcanizing of Thiokol using sulphur is not done since it does not yield
the hardened rubber ,vulcanization is done using active material oxides
like Zno
E.g.: Thiokol, Buna-S rubber
5. VISCOSITY The force which apposes between two layers is called
viscous force and the phenomenon is called viscosity .viscosities are 2types
1. Absolute Viscosity: It is the share force required to move a layer of the oil of
one-centimeter thickness over an area of one square centimeter thickness. In
C.G.S system it is expressed in poise and in SI system it is expressed in 1 N-
sec/m2.
1 N-sec/m2 = 10 poise; dyne-sec/cm2=poise
2. Kinematic Viscosity: The ratio of Absolute Viscosity to the density is called
Kinematic Viscosity. In C>G>S system it is expressed in Stokes and is SI
system it is expressed m2/sec.
1m2
/sec = 104
stokes ; 1stoke=cm2
/sec
Effect of temperature on Viscosity: Increase in temperature causes a
decrease in the viscosity of liquid, where as viscosity of gases increase with
temperature, The coefficient of viscosity of unknown liquid is determined by
using Ostwald’s viscometer
coefficient of viscosity
The force acting per unit area is called coefficient of viscosity represented by
A
F =
η
6. SURFACE TENSION
The force per unit length acting along the direction of flow of liquid is called
surface tension. Surface tension is denoted by “r”.
If “f” be the force acting per unit length in the direction
of flow of liquid and “l” be the length of the liquid flows then by definition the
surface tension is given by
r=f/l
. The unit for force is dyne and the unit for ‘l’ is cm so dyne / cm is the unit for
Surface tension. r=f/l dyne / cm.
As the temperature increases surface tension value gradually decreases. The
surface tension is the most important property of fluids.
The phenomenon of rise and fall of a liquid in a capillary tube due to surface
tension known as ‘Capillarity’
JBREC

7/30/2019 Lab Manual Chemistry
http://slidepdf.com/reader/full/lab-manual-chemistry 8/48
7. CONDUCTOMETRIC TITRATIONS :
The titrations involving the addition of standard reagent from the burette to
the analyte present in the conductivity cell involving the change in the
conductance of the analyte with the addition of the standard reagent.
Conductometric titrations are those in which the conductance can be
determined with the help of conductivity measurements. While carrying out
the conduct metric titrations, the following apparatus are to be used.(i) Thermostat
(ii) Conductivity cell
(iii) Conductivity water
(iv) Conductometer.
(v)
The conductance of each volume should be correct for dilution using the formula.
C’= c(v+µ)
V
Where C ‘= corrected conductance
c= observed conductancev= initial volume of solution in a beaker
µ = volume of titrating solution added
a. Conductance : The reciprocal of resistance is known as conductance. It is
denoted by ‘C’.
C=1/R
Units: mho.
b. Conductance Curves:
(a) The curves which is drawn between the volume of the solution added in ml
& corrected conductance C* is known as “conductance curves”.For ex: - (1) for strong acid vs. strong base the conductance curve is given by
(b) Conductance curve of mixture of acids vs. strong base is given by
JBREC

7/30/2019 Lab Manual Chemistry
http://slidepdf.com/reader/full/lab-manual-chemistry 9/48
Advantages of Conductometric Titrations :
Conductometric titrations have several advantages:
(a) Coloured solutions cannot be titrated by ordinary volumetric method
using indicator, Conductometric titrations can be successfully carried in
such cases.(b) The end point is not sharp in the case of volumetric titration of weak acid and
weak base.Conductometric titrations give sharp end point.
(c) The results in conduct metric titrations are graphically represented and hence no
special care is necessary near the end point. The results are very accurate.
(d) In order to get accurate results the change of volume during the titration should
be as small as possible. For this purpose, the the titrating solution in the
burette is usually 5 to 10 times more concentrated than the solution taken
into the conductivity cell.
(e) Since the conductivity changes with temperatures, it is necessary to keep the
vessel containing reaction mixture, in water bath at constant temperature.
8. POTENTIO METRIC TITRATIONS :
A potentiometric titration involves measurement of the potential of a suitable
electrode (indicator) as a function of titrant volume. While carrying out the
potentiometric titrations the following apparatus are to be used.
(a) Potentiometer
(b) Magnetic stirrer
(c) Calomel electrode
(d) Pipette
(e) BurettePotentiometric titrations offer additional advantages over potentiometry.
Because the measurement is based on the titrant volume that causes a rapid change in
potential near the equivalence point for detecting end point.
a.Potentiometric Curve : A graph is drawn between EMF and the volume
of the titrant added near the end point 0.1ml portions of the titrant is added each
time and measure. The EMF then drawing graphs to the two jumps the end points
are located. From the graphs the concentrations are calculated. These graphs are
called “Potentiometric titrations curves”. For example potentiometric curve of
weak acid vs. strong base is shown by as shown in figure 2
JBREC

7/30/2019 Lab Manual Chemistry
http://slidepdf.com/reader/full/lab-manual-chemistry 10/48
Potentiometric Curve rough
Potentiometric Curve fine
JBREC

7/30/2019 Lab Manual Chemistry
http://slidepdf.com/reader/full/lab-manual-chemistry 11/48
9. COLORIMETRY:
(i) Lambert’s law: This law was put forward by Lambert and is applicable to
pure Homogenous medium.
When a medium absorbs appreciable amount of light, the intensity of incident
light, is greatly Reduced on passing through it. This reduction in the intensity of light
is given by Lambert’s law.
When beam of monochromatic light is passed through a pure Homogenous
medium, the decrease in the intensity of light with thickness of the absorbing medium
at any point X is proportional to the intensity of the incident light, at that point(X).
Where ‘K’ is constant called coefficient (Absorption) (or) extinction coefficient of the
medium for light of a particular wavelength.
The above equation is known as “Lamberts law equation”
(ii) Beer’s law: (Lambert’s – Beer law)
When the light absorbing substance is present in the solution the decrease in theintensity of light with thickness of solution of given by Beer’s law.
“When a bean of monochromatic light is passed through a solution the decrease in
the intensity of light, with the thickness of the solution is directly proportional to the
intensity of incident light as well as the concentration of the solution
Where є (apsylum) is a constant of proportionality and is called “Molar absorption
coefficient”.
JBREC

7/30/2019 Lab Manual Chemistry
http://slidepdf.com/reader/full/lab-manual-chemistry 12/48
Iron (II) React with 110 – phenanthralene solution in the presence of Buffer (PH – 4 –
S). Buffer (PH – 4 – S) to give red colour ion 1, 10 – phenathralene complex.
Depending upon the concentration of metal ion solution and Reagent solution. Thecomplex can be formed as [Fe (phcn)3]2+
Fe2+ + n(1,10 – phenathralene) Fe(phenathralene)n]2+ By measuring the Absorbance
with suitable filter a graph is plotted between the absorbance and volume of Reagent
(or) metal solution. A curve is obtained from which the volume of metal ion (or)
Reagent (at a maximum Absorbance) is calculated.
JBREC

7/30/2019 Lab Manual Chemistry
http://slidepdf.com/reader/full/lab-manual-chemistry 13/48
TITRIMETRY
Experiment No 1
JBREC

7/30/2019 Lab Manual Chemistry
http://slidepdf.com/reader/full/lab-manual-chemistry 14/48
AIM Estimation of hardness of water by EDTA method
APPARATUS: Burette, Pipette, conical flask, conical flask, burette stand
CHEMICALS REQUIRED: EDTA, buffer solution (pH 9-10), Erichrome Black-T
indicator, sample solution etc…
PRINCIPLE: Hard water contains Ca2+ and Mg2+ ions form wine red coloured
complex with the indicator Erichrome Black-T
The structure of EDTA (sodium salt)
CH2COONa CH2COOH
N - CH2 – CH2 – N
CH2COOH CH2COONa
EDTA forms a colorless complex with free metal ions (Ca2+, Mg2+)
Ca+2 + EBT pH 9-10 [Ca-EBT]
(Blue colour) (Wine red colour)
Mg+2 + EBT pH 9-10 [Mg-EBT]
(Blue colour) (Wine red colour)
Metal indicator complex is lesser stability than the metal EDTA complex.
During the titration of EDTA the wine red colour changes to blue colour, it indicates
Ca-BET complex react with EDTA and forms Ca-EDTA complex and regenerated
EBT it gives colour of the solution.
Ca-EBT Ca-EDTA
(Or) + EDTA ------------------ (or) + EBT
Mg-EBT Mg-EDTA (blue colour)
JBREC

7/30/2019 Lab Manual Chemistry
http://slidepdf.com/reader/full/lab-manual-chemistry 15/48
PROCEDURE:
1 STANDARDISATION OF EDTA SOLUTION
Pipette out 20ml of standard hard water solution into a conical flask and add 2ml of buffer solution + 2-3 drops of indicator and titrate the wine red colour
complex with EDTA solution taken in the burette, the wine red colour changes to blue
colour, repeat the titration until we get the concurrent values, note down the
corresponding burette reading.
2 STANDARDISATION OF HARD WATER
Pipette out of 50ml of water sample into 250ml conical flask and add
2ml of buffer solution and 3drops of EBT indicator, and titrate the wine red colour
complex with EDTA solution taken in the burette, the wine red colour changes to bluecolour, repeat the titration until we get the concurrent values, note down the
corresponding burette reading.
3 STANDARDISATION OF PERMANENT HARDNESS OF WATER
Pipette out 100ml of hard water sample into beaker and boil the
water till the volume reduced to 50ml. cool the solution and filtered by using a conical
flask now a white precipitate is formed wash the precipitate completely by using
distilled water now a clear solution is obtained,Now add 3 drops of EBT indicator and buffer solution to our water
sample and titrate with EDTA solution till a clear blue coloured end point is obtained,
repeat the titration till we get concurrent values.
JBREC

7/30/2019 Lab Manual Chemistry
http://slidepdf.com/reader/full/lab-manual-chemistry 16/48
1 STANDARDISATION OF EDTA SOLUTION
Volume of hard water Burette reading Volume of EDTA
(ml) Initial final Run down
20
20
20
0
0
0
Volume of EDTA solution (V1) = burette reading
Molarity of EDTA solution (M1) = 0.1 M
Volume of hard water (V2) = 20 ml
Molarity of hard water (M2) = ?
M1V1=M2V2
M2=M1V1
V2
Amount of Ca+2 present in given sample of water= M1 x GMw of Ca2+(38) x100ml
1000
2 STANDARDISATION OF HARD WATER
Volume of water sample Burette reading Volume of EDTA
(ml) Initial Final Run down
50
50
50
0
0
0
Total hardness of water = volume of EDTAVolume of sample water x 1000 ppm
Volume of sample water = 50 (ml)
Volume of EDTA = burette reading
JBREC

7/30/2019 Lab Manual Chemistry
http://slidepdf.com/reader/full/lab-manual-chemistry 17/48
3 STANDARDISATION OF PERMANENT HARDNESS OF WATER
Volume of permanent
. hard water
Burette reading Volume of EDTA
Run down(ml) Initial Final (ml)
100
100
100
0
0
0
Permanent hardness of water = . volume of EDTA .
Volume of permanent hardness of water x 1000
Temporary hardness of water
= Total hardness of water - permanent hardness of water
RESULT:
Temporary hardness of water =
Permanent hardness of water =
Total hardness of water =
Amount of Ca+2 ions present in given solution=
JBREC

7/30/2019 Lab Manual Chemistry
http://slidepdf.com/reader/full/lab-manual-chemistry 18/48
Experiment no 2
AIM; To estimate amount of manganese dioxide (Mno2) in the given sample of
pyrolusite.
APPARATUS: Balance, pipette, burette, conical flask, glass rod, weighing bottle,
funnel, beaker.
CHEMICALS: Pyrolusite, sodium oxalate. Dilute H2SO4, KMn04.
PRINCIPLE: Mno2 present in the pyrolusite sample is reduced to a known excess of
standard sodium oxalate as acid medium the un reacted sodium oxalate is titrated
against a standard solution of KMno4, hear it act as self indicator
END POINT: Pink colour
REACTIONS
Mno2 +2H2So4 +Na2C2O4------------------ Na2SO4 + 2H20 +MnSO4+2CO2
5Na2C2o4+2KMno4+8H2So4--------2MnSo4+K 2So4+5Na2So4+10Co2+8H2o
PROCEDURE:
In the presence of MnO2 :
weigh about 0.15gm of powdered pyrolusite and transfer the substance into clean
conical flask. Add a known volume of standard 40 ml sodium oxalate and 50 ml of
dilute H2S04. Keep the funnel with the mouth of the conical flask and heat the
solution until the substance dissolves in the solution. Rinse the funnel by using
distilled water completely and titrate the contents of conical flask with standard
solution of KMno4 until pale pink colour is obtained note down the corresponding
burette reading (y) ml
Absence of Mno2
Take 40 ml of standard sodium oxalate solution and 50 ml of dilute H2S04. Keep the
funnel with the mouth of the conical flask and heat the solution until the bubbles are
obtained, now cool the solution Rinse the funnel by using distilled water completely
and titrate the contents of conical flask with standard solution of KMno 4 until pale
pink colour is obtained note down the corresponding burette reading (2x) ml
JBREC

7/30/2019 Lab Manual Chemistry
http://slidepdf.com/reader/full/lab-manual-chemistry 19/48
1PRESENCE OF MNO2
Pyrolusite + Volume of Burette readings Volume of Kmno4 (y)
Na2C2o4 Dil.H2So4 Initial Final
4040
40
5050
50
00
0
2 ABSENCE OF MNO2
Volume of Burette readings Volume of Kmno4 (2x)
Na2C2o4 Dil.H2So4 Initial Final
4040
40
5050
50
00
0
CALCULATIONS:
Weight of pyrolusite W = 0.15 gm
20 ml of Na2C2O4 required x ml of KmNo4
40 ml of Na2C2O4 required 2x ml of KmNo4 =
Unreacted 40 ml sodium oxalate required y ml KMno4 =
Reacted sodium oxalate pyrolusite = (2x-y) ml
1N of Kmno4 (M1=0.1N) is equivalent to 0.043461 gm of Kmno4
(2x-y) ml of XN1 Kmno4 = 0.043461 x (2x-y) x N1 gm of Kmno4
100% of pyrolusite is given by = 0.043461 x (2x-Y) x 0.1 x 100 / W
RESULT:
The amount of manganese dioxide (Mno2) present in given sample
JBREC

7/30/2019 Lab Manual Chemistry
http://slidepdf.com/reader/full/lab-manual-chemistry 20/48
Preparation of
organic compounds
JBREC

7/30/2019 Lab Manual Chemistry
http://slidepdf.com/reader/full/lab-manual-chemistry 21/48
Experiment No:3
AIM: To prepare Aspirin from salicylic acid by using sulphuric acid and acetic
anhydride in the laboratory (Acetylation)
APPARATUS REQUIRED: conical flask and tripod stand.
CHEMICAL REQUIRED: (i) salicylic acid-1gm
(ii) Acetic anhydride-1.5ml
(iii) conc.H2so4 - 2 drops
PRINCIPLE: salicylic acid reacts with acetic anhydride in the presence of acid to
form Acetyl salicylic acid (aspirin) via electrophilic substitution
REACTION:
Ortho hydraxy benzoic acid Acetic an Acetyl Salicylic(or) + Hydride ------------- acid (or)
Salicylic acid ASPIRIN
OH-C6H4-COOH (CH3-CO)2O COOH-C6H4-COOCH3
MECHANISM
PROCEDURE: 1 grams of salicylic acid and 3 ml of Acetic anhydride are mixed in a
100ml conical flask and 2 drops of conc. H2so4 is added, the mixture is wormed on a
water bath at 50—600c with occasional shaking 20 ml of water are then added the
mixture is stirred well and filtered, the crude aspirin is purified by dissolving in about
6 ml of hot alcohol and pouring into about 16ml of warm water the solution which
then becomes turbid is warmed to give a clear solution and then allowed to cool
slowly the needles which separate are filtered , the yield and M.P are reported
JBREC

7/30/2019 Lab Manual Chemistry
http://slidepdf.com/reader/full/lab-manual-chemistry 22/48
CALCULATIONS:
Theoretical yield = M.wt of product
M.wt of starting substance x amount taken
= 180138 x 1
= 1.304 gm
Practical yield = 11 gm
Aspirin C9H8O4 M.w = 180
Salicylic acid M.w = 138
Theoretical yield= 1.304 gm
% of yield = practical yield / theoretical yield
= 11/ 1.304 = 84.3%
RESULT: Aspirin is prepared it is colorless substance
(i) molecular weight of aspirin = 180
(ii) Melting point of aspirin = 118
(iii) % of yield = 84.3 %
JBREC

7/30/2019 Lab Manual Chemistry
http://slidepdf.com/reader/full/lab-manual-chemistry 23/48
Experiment No :4
AIM: Preparation of Thiokol Rubber form Ethylene dichloride and sodium
Tetrasulphide by the process of condensation
APPARATUS: conical flask, glass rod, try pod stand, Bunsen burner.
CHEMICALS REQUIRED: 1,2-dichloro ethane, sodium hydroxide, sulphur power.
PRINCIPLE: The principle involved in the preparation of Thiokol Rubber is the
condensation (or) copolymerization between Ethylene Dichloride and sodium tetra
sulphide.
The reaction is given by
Na-S-S-Na
NaOH + S ----------- ll llS S
(sodium teta sulphide)
Na-S-S-Na -- CH2-CH2-S-S---
Cl-Ch2-CH2-Cl + ll ll ------------ ll ll
S S S S
1,2-dichloro ethane (Thiokol rubber)
PREPARATION OF THIOKOL RUBBER:
PROCEDURE: In a 100 ml Beaker dissolve 2 g NaOH in 50-60 ml of water ,Heat
the solution continuously and to this add 4grms of sulphur powder and it turns into
yellow colour. Stir the solution continuously until the yellow colour changes to deep-
red. cool the solution and. add 10ml of 1,2 dichloro ethane with continuous stirring.
Continue the process of stirring until the rubber lumps separate out. The obtained
Thiokol rubber is washed with water and pressed it between filter papers.dry it and
weigh it , the yield obtained is about 1.5gms
Properties: (i) These rubbers neither Resemble natural rubber in structure
(nor)properties they hare good resistance to solvents and can with stand cold but not
heat
6. They are cheap and can be easily shaped but hare an unpleasant smell
. because of their being practically unaffected by phenol , fuel oils andlubricating oils they are mostly used for making house pipe and tank
lining for handling these materials
7. vulcanizing of Thiokol using sulphur is not done since it does not
yield the hardened rubber ,vulcanization is done using active material
oxides like Zno
REPORT: Thiokol rubber is prepared using Ethylene dichloride and sodium
Tetrasulphide, the obtained yield is 1.5 gm
JBREC

7/30/2019 Lab Manual Chemistry
http://slidepdf.com/reader/full/lab-manual-chemistry 24/48
PHYSICAL PROPERTIES
JBREC

7/30/2019 Lab Manual Chemistry
http://slidepdf.com/reader/full/lab-manual-chemistry 25/48
Experiment No:5
AIM: To determine surface tension of unknown liquid by stalagnometer method.
APPARATUS: Stalagnometer, beakers.
CHEMICALS: known liquid(water), unknown liquid.
PRINCIPLE: The liquid drop falling from capillary tube pocesses certain weight and
this is equal to surface tension of liquid.
DESCRIPTION OF APPARATUS:
A stalgnometer is having bulb at the middle and capillary at lower end, there are two
ends, one end is open and the other end has a minute hole for counting the number of
drops. A capillary tube is present at the lower end .Two marks A and B are etched on
the stalagnometer.
PROCEDURE:
KNOWN LIQUID:
Clean the stalgnometer by using the distilled water completely. Now, immerse the
lower end of stalgnometer in a beaker containing distilled water and suck the water
up to level A, release the thumb slowly and count the number of drops until the liquid
level of water present in capillary decreases from A to B, repeat the experiment 2-3
times and calculate the mean it indicates no of drops of water
UNKNOWN LIQUID:
Now, immerse the lower end of stalgnometer in a beaker containing unknown
liquid and suck the water up to level A, release the thumb slowly and count the
number of drops until the liquid level of water present in capillary decreases from A
to B, repeat the experiment 2-3 times and calculate the mean it indicates no of drops
of water, Repeat this experiment three times and calculate the mean it indicates
number of drops of unknown liquid.
JBREC

7/30/2019 Lab Manual Chemistry
http://slidepdf.com/reader/full/lab-manual-chemistry 26/48
The surface tension of a given unknown liquid is found by using following formula
Surface tension of nw x d1 x r wUnknown liquid = n1 dw
r 1 - surface tension of unknown liquid
r w - Surface tension of known liquid (water) – 72.14 dyne/cmdl – density of liquid – 0.97 gm/cc
dw – density of water – 1gm
nw – no.of drops of water
nl – no.of drops of unknown liquid
TABULAR FORMS AND OBSERVATIONS:
CALCULATIONS:
JBREC
Known liquid Unknown liquid
No.of drops Mean No.of drops Mean

7/30/2019 Lab Manual Chemistry
http://slidepdf.com/reader/full/lab-manual-chemistry 27/48
SURFACE TENSION OF WATER AT DIFFERENT TEMPERATURES:
Temp 5 10 15 20 25 30 35 40
Surface
tension
(dyne/cm)
75.09 74.36 73.62 72.88 72.14 71.70 70.6
6
69.92
RESULT:
The Surface tension of a given unknown liquid is dyne/cm
JBREC
7/30/2019 Lab Manual Chemistry
http://slidepdf.com/reader/full/lab-manual-chemistry 28/48
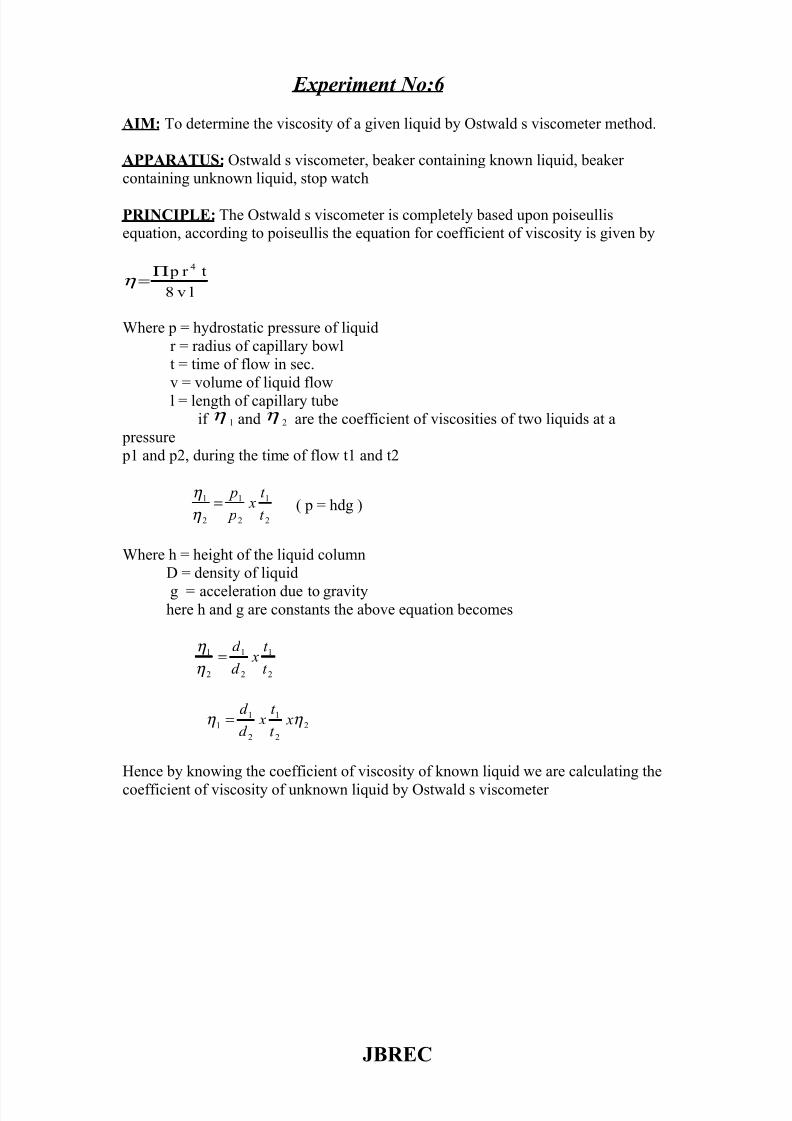
Experiment No:6
AIM: To determine the viscosity of a given liquid by Ostwald s viscometer method.
APPARATUS: Ostwald s viscometer, beaker containing known liquid, beaker
containing unknown liquid, stop watch
PRINCIPLE: The Ostwald s viscometer is completely based upon poiseullis
equation, according to poiseullis the equation for coefficient of viscosity is given by
lv8
tr p
4Π
=η
Where p = hydrostatic pressure of liquid
r = radius of capillary bowl
t = time of flow in sec.
v = volume of liquid flow
l = length of capillary tube
if η 1 and η
2 are the coefficient of viscosities of two liquids at a
pressure
p1 and p2, during the time of flow t1 and t2
2
1
2
1
2
1
t
t x
p
p=
η
η ( p = hdg )
Where h = height of the liquid column
D = density of liquid
g = acceleration due to gravityhere h and g are constants the above equation becomes
2
1
2
1
2
1
t
t x
d
d =
η
η
2
2
1
2
1
1 η η xt
t x
d
d =
Hence by knowing the coefficient of viscosity of known liquid we are calculating the
coefficient of viscosity of unknown liquid by Ostwald s viscometer
JBREC

7/30/2019 Lab Manual Chemistry
http://slidepdf.com/reader/full/lab-manual-chemistry 29/48
DESCRIPTION OF APPARATUS:
The Ostwald s viscometer consists of two bulbs A & B , bulb B is bigger than bulb
A, two marks X,Y are mentioned on the capillary tube above and below the bulb A, a
capillary tube is present on the bulb B
PROCEDURE:
1. Clean the viscometer by using distilled water now introduced the sufficient
volume of given liquid with the help of pipette in bulb B
2. Suck the liquid from bulb A until the liquid level comes to mark X ,
3. Now release the thumb slowly and allow the liquid to fall freely through the
capillary from mark X – Y,
4. Start the stopwatch and note down the time t1 for the flow of liquid from mark
X –Y5. Repeat the experiment thrice and calculate the mean
6. Repeat the same procedure for unknown liquid and calculate the time of flow
t2 thus by knowing the coefficient of viscosity known liquid we are
calculating the coefficient of viscosity of unknown liquid by Ostwald s
method.
JBREC

7/30/2019 Lab Manual Chemistry
http://slidepdf.com/reader/full/lab-manual-chemistry 30/48
TABULAR FORM AND OBSERVATIONS:
S.no Given unknown liquid ( Water) known liquid
Time of flow in
(sec)
Mean
(t1)
Time of flow in
(sec)
Mean
(t2)
1.
2.
3.
liquid.knownof secinflowof timet
liquidunknownof secinflowof timet
1gm/ccliquidknownof densityd
1.0217liquidunknownof densityd
poise)(18.91 liquidknown
liquidunknown
2
1
2
1
2
1
=
=
=
=
=
=
η
η
CALCULATIONS:
2
1
2
1
2
1 *d
d
T
T =
η
η
RESULT:
The coefficient of viscosity of unknown liquid is = milli poise
JBREC

7/30/2019 Lab Manual Chemistry
http://slidepdf.com/reader/full/lab-manual-chemistry 31/48
\
INSTRUMENTAL ANALYSIS
JBREC

7/30/2019 Lab Manual Chemistry
http://slidepdf.com/reader/full/lab-manual-chemistry 32/48
CONDUCTOMETRY
Experiment No:7
JBREC

7/30/2019 Lab Manual Chemistry
http://slidepdf.com/reader/full/lab-manual-chemistry 33/48
CONDUCTOMETRIC TITRATIONS OF
STRONG ACID-STRONG BASE.
AIM;
To determine the concentration of Hcl by titrating with NaoH solution
conductometrically.
APPARATUS AND CHEMICALS:
Conduct meter, conductivity cell, beakers, pipette, micro burette, Hcl, NaoH,
conductivity water.
PRINCIPLE;
When a strong acid like hydrochloric acid is titrated with strong base like sodium
hydroxide, initially the HCL has a high content of highly mobile hydrogen ions,
which gives the solution a high conductance as the alkali is added the hydrogen
ions are removed to form water, and their place is taken by the much slower
cations of the base. Consequently the conductance of the solution decreases and
keeps falling with the addition of the base until the equivalence point is reached.Further addition of alkali introduces now an excess of the fast hydroxyl ions, and
this causes the conductance to raise again. When the variation of the conductance
of the solution is plotted against the volume of alkali added, a V shape graph is
obtained. The descending branch of this curve gives the conductance of mixtures
of the salt and excess base. At the minimum point, there is no excess acid or base
present and hence it is the end point.
e.q: Hcl + NaoH -------------------- Nacl + H2O
PROCEDURE: The conductivity cell is washed well with water and finally rinsed
with conductivity water. 20ml of 0.1N hydrochloric acid is taken in a beaker and
20ml of conductivity water is added to it. The conductivity cell is immersed into the
solution and is further connected to the conductometer. Standard sodium hydroxide of
1N concentration is taken into micro-burette and 0.2ml of aliquots are added each
time and conductance is measured. The addition of sodium hydroxide is continued till
the end point is reached. There is a fall in conductance at the end point. Once the end
point is reached, the conductance will increase due to the addition of excess sodium
hydroxide. A graph is plotted between the corrected conductance and volume of
sodium hydroxide added. The point of intersection gives the end point. Once the end
point is noted, the concentration of sodium hydroxide is calculated. The experiment is
repeated with the unknown solution and its concentration is determined using the
concentration of sodium hydroxide obtained above. The conductance of each volume
should be correct for dilution using the formula.
JBREC

7/30/2019 Lab Manual Chemistry
http://slidepdf.com/reader/full/lab-manual-chemistry 34/48
C’= c(v+µ)
V
Where C ‘= corrected conductance
c= observed conductance
v= initial volume of solution in a beaker
µ = volume of titrating solution added
Conductometric Titration of Strong Acid Vs Strong Base:
Tabular form and Observations :
Known concentration: Strong Acid Vs Strong Base
s.no Volume of NaOH
added (ml
Measured
conductance
(c)
Corrected Conductance
C’= c(v+µ)
V
JBREC

7/30/2019 Lab Manual Chemistry
http://slidepdf.com/reader/full/lab-manual-chemistry 35/48
Unknown concentration: Strong Acid Vs Strong Base
Sl No Volume of NaOH
added (ml)
Measured
Conductance
Corrected Conductance
C’= c(v+µ)
V
JBREC

7/30/2019 Lab Manual Chemistry
http://slidepdf.com/reader/full/lab-manual-chemistry 36/48
Calculations:
Known concentration:
Volume of NaoH (V1) = ml
Normality of NaoH (N1) = ?
Volume of HCl (V2) = ml
Normality of HCl (N2) = N
We know that
N1V1 = N2V2
N1 = N2V2
V1
N1 = N
Unknown concentration:
Volume of NaoH (V1) = ml
Normality of NaOH (N1) = ?Volume of HCl (V2) = ml
Normality of HCl (N2) = N
We know that
N1V1 = N2V2
N1 = N2V2
V1
N1 = N
Model Graphs: A graph is drawn between the volume of NaOH solution addedand corrected conductance (C’) for both known and unknown. The graph is as
shown by
Graphs
Result:
The concentration of the given unknown acid solutions is ---- N
JBREC

7/30/2019 Lab Manual Chemistry
http://slidepdf.com/reader/full/lab-manual-chemistry 37/48
COLORIMETRY
JBREC

7/30/2019 Lab Manual Chemistry
http://slidepdf.com/reader/full/lab-manual-chemistry 38/48
Experiment No:8
AIM: To determine the amount of ferrous iron in cement by calorimetric method.
APPARATUS: Calorimeter,50 ml standard flask (5)
CHEMICALS REQUIRED:
(i) A standard solution of Ferrous Ammonium Sulphate 0.1N is prepared.
(ii) 0.25% solution of 110 – phenanthralene mono hydrate in water is prepared.
(iii)A Buffer solution of pH – 4 – 5 is prepared by mixing 65ml of 0.1m Acetic acid
and 35ml of 0.1m sodium Acetic solution.
PROCEDURE:
Take 5 clean dry 50ml of standard flasks take in different liquids of Fe(II) solutions.
In these flasks that is 2ml in first 4ml in second, 6ml in third, 8ml in fourth, 10ml fifth
and add to these 5ml of Buffer solution and 6ml of 1, 10 phenathralene solution to
each standard flasks.
Make up each standard flask up to the mark with distilled water. An interface read
colour develops. Shake well each standard flask and measure the absorbance of each
solutions at 515nm. Using the solvent blank then draw a calibration plot by curve
given by plotting concentration of Fe(II) against absorbance.
From the graph the concentration of unknown Fe(II) solution is determined.
JBREC

7/30/2019 Lab Manual Chemistry
http://slidepdf.com/reader/full/lab-manual-chemistry 39/48
Tabular form and observations:
(I)
S.No. Filter Number Absorbance
1. 45
2. 47
3. 51
4. 52
5. 54
6. 57
7. 60
8. 67
(II)
S.No. Volume of Fe2+ solution Absorbance
1. 2
2. 4
3. 6
4. 8
5. 10
6. Unknown
JBREC
7/30/2019 Lab Manual Chemistry
http://slidepdf.com/reader/full/lab-manual-chemistry 40/48
From graph the volume of given known solution =
Concentration of Fe2+
ion in 50ml solution is
Amount of Fe2+ present in 50ml solution
Result: Amount of Fe2+ present in 50ml of given solution =
JBREC

7/30/2019 Lab Manual Chemistry
http://slidepdf.com/reader/full/lab-manual-chemistry 41/48
POTENTIOMETRY
JBREC
7/30/2019 Lab Manual Chemistry
http://slidepdf.com/reader/full/lab-manual-chemistry 42/48
Experiment No:9
AIM: To determine the concentration of CH3COOH by titrating with NaoH Standard
solution potentio metrically.
Apparatus and Chemicals:
Potentiometer, burette, pipette, beakers, quinhydrine, calomel electrode, platinum
electrode, CH3COOH & NaoH.
Principle:
When a platinum electrode is dipped in an acid container solution, which is saturated
with quinhydrone solution. The potential of this electrode, changes with the change of
hydrogen ions. When NaoH is added the potential decreases slowly at first and as the
amount of alkali added approaches the end point. The potential change increases
rapidly for the same amount of alkali added after the end point the change in potential once again becomes small. The change in the potential is due to the small
change in concentration of H+ ions and is according with the equation.
E= E1-0.0591 log H+
Procedure:
20ml of 0.1 N CH3COOH is pipette out into a clean 100ml beaker to this pinch of
quinhydrone is added and the solution is stirred well. A Platinum electrode is dipped
into it and this is combined with a colomel electrode and the cell is set up as shown
below
Pt + / quinhydrone in acid // Kcl salt, Hg2cl2 / Hg
NaOH is taken in the burette is added to the acid solution and potential for each
addition is noted, The titration is carried out till there is large jump in potential once
the end point is located, a fine titration is carried out again with 20ml of 0.1 N
CH3COOH by adding 0.1 ml of NaOH near the end point region a large change in the
potential for 0.1 ml addition of NaOH is observed at the end point the graph is plotted
between CH3CooH Vs volume of NaOH. The equivalence point is noted from the
graph and the concentration of the NaOH is determined. The experiment is repeated
with CH3COOH of unknown concentration and its concentration is determined usingthe concentration of NaOH obtained above
JBREC

7/30/2019 Lab Manual Chemistry
http://slidepdf.com/reader/full/lab-manual-chemistry 43/48
Tabular forms and observations
Known concentration- CH3CooH Vs NaoH (rough)
s.no Volume of NaOH
SOLUTION
EMF (volts)
JBREC

7/30/2019 Lab Manual Chemistry
http://slidepdf.com/reader/full/lab-manual-chemistry 44/48
CH3CooH Vs NaoH (fine)
s. no Volume of
NaOH in
ml(v)
Potential EMF
(volts)
E E/V
JBREC

7/30/2019 Lab Manual Chemistry
http://slidepdf.com/reader/full/lab-manual-chemistry 45/48
NaOH CH3COOH
V2=--------- V1=-------------------
N2=---------------- N1=---------------------
V1 N1= V2 N2
N2=N1V1
V2
N2=------
The above table shows known concentration.
unKnown concentration- CH3CooH Vs NaoH (rough)
s.no Volume of NaOH
SOLUTION
EMF in (volt)
JBREC

7/30/2019 Lab Manual Chemistry
http://slidepdf.com/reader/full/lab-manual-chemistry 46/48
CH3CooH Vs NaoH (fine)
s. no Volume of
NaOH inml(v)
Potential EMF
(volts)
E E/V
JBREC

7/30/2019 Lab Manual Chemistry
http://slidepdf.com/reader/full/lab-manual-chemistry 47/48
Unknown
NaOH HCL
V2= V3=ml
N2= N3
V2 N2= V3 N3
N3=N2V2
V3
N3= N
Model graphA graph is drawn between volume of NaOH solution and EMFis shown by
Result: The concentration of the given un known acid solution is N
JBREC

7/30/2019 Lab Manual Chemistry
http://slidepdf.com/reader/full/lab-manual-chemistry 48/48


![AR[1].ENGINEERING CHEMISTRY LAB MANUAL](https://img.dokumen.tips/doc/110x75/5571f97a49795991698fa97e/ar1engineering-chemistry-lab-manual.jpg)


