Embed Size (px)
Citation preview

Lab 8
Properties of Galaxies
8.1 Introduction
Have you ever stayed up late on a dark summer night, and noticed a faint, narrow bandof light streaming across the sky like spilled milk (the “Milky Way,” shown in Figure 8.1)?That band is created by billions of stars within our own galaxy. We live two-thirds of theway out along the disk of the Milky Way, a round, flat disk of stars which rotates aroundthe center of the Galaxy. When we look inwards towards this center, the assembled lightof the disk (and from other stars near the Galactic Center) forms that diffuse band of lightrunning across the sky.
You’ve probably seen a number of pictures of other galaxies. Why don’t we ever look atsimilar pictures of our own galaxy? We are caught inside it, so this would be like a pictureof your house taken from inside the kitchen pantry. We can map the distribution of starssurrounding us, however, and based on these measurements we have a fairly good idea ofwhat our galaxy would look like if viewed from a nearby neighbor like the Andromeda galaxy(see the doppelganger in Figure 8.1). The Milky Way is an intermediate-type spiral galaxywith a central barred structure. (Don’t worry – all of the stars inside the bar are at least21 years old!) As expected, our galaxy is neither the brightest nor the faintest, neither thesmallest nor the largest. The Milky Way will never be lonely, because it has many closecousins scattered throughout the nearby Universe.
At the most basic level, a galaxy is simply the sum of its parts – billions of stars, some very oldand others quite young, diffuse gas clouds which slowly cool, collapsing inwards to form futuregenerations of stars, and elusive dark (non-luminous) matter. (Astronomical studies suggestthe existence of dark matter even though telescopes cannot “see” it, because the amount ofluminous matter found in galaxies is not sufficient to explain the strong gravitational forcesobserved at play on large size-scales.) The stars are the dominant component shown in images
1

Figure 8.1: An image of the Milky Way as seen from Earth (left), and an image of a nearbygalaxy quite similar to our Milky Way (right). Note the golden bright central bar whichbisects the galaxy nucleus, and the bluer spiral arms which begin at the ends of the barand loop outward around the center of the galaxy, outlining the disk. The Milky Way is anintermediate-type spiral galaxy, one of many such found in the nearby Universe.
of galaxies, while both stars and gas can be detected in spectra (plots of light intensity versuswavelength). By examining images and spectra of galaxies, we can determine the currentstate of the matter which makes up galaxies. We can then construct scenarios that explainhow each galaxy formed and slowly evolved into its current state.
When we study galaxies, we compare and contrast their observed properties. We group themaccording to similarities, and define broad morphological classes of the most common forms.(The word “morphology” simply refers to the patterns observed in form and structure forgalaxies, and can be applied to almost any object. For example, we can say that both theSun and an inflated balloon have a spherical morphology, or shape, while both the MilkyWay and a pizza have a disklike morphology.) You may have already studied the HubbleTuning Fork, a simple diagram which describes the basic shapes for galaxies. Early telescopeimages of nearby galaxies were divided into families such as the ellipticals and spirals whichmake up the two sturdy prongs of the fork (and the lenticular, peculiar, and interactinggalaxies which also exist).
Don’t be overly concerned if you have not previously considered the many shapes which agalaxy can take; we will learn about them in this laboratory exercise. We will study theappearances of galaxy images and spectra, and consider how best to describe and to quantify(define with numbers) key properties that shed light on the evolutionary state of galaxies.
2

8.1.1 Goals
The primary goal of this lab is to realize that the Universe is made up of billions of galaxies,some with properties quite similar to those of our own Milky Way galaxy and some whichare quite different. We will explore galaxy luminosities, colors, sizes, and morphologies, andrealize that the evolution over the last fourteen billion years of the stars and gas whichmake up these galaxies, and interactions between galaxies, have created these variations inobserved properties.
8.1.2 Materials
All online lab exercise components can be reached from the GEAS project lab URL.
http://astronomy.nmsu.edu/geas/labs/labs.html
You will also need a computer with an internet connection, and a calculator. This documentcontains many color photos of galaxies, so it is best viewed online.
8.1.3 Primary Tasks
You will measure luminosities, colors, sizes, and redshifts, and determine morphologies, fromoptical images and spectra for a sample of nearby galaxies.
8.1.4 Grading Scheme
There are 100 points available for completing the exercise and submitting the lab reportperfectly. They are allotted as shown below, with set numbers of points being awarded forindividual questions and tasks within each section. Note that §8.6 contains 5 extra creditpoints.
Table 8.1: Breakdown of PointsActivity Mosaic Images Spectra Questions SummarySection §8.2.1 §8.2.3, §8.2.4 §8.3.2 §8.4 §8.5Page 4 10, 16 23 32 35Points 12 27 22 14 25
8.1.5 Timeline
Week 1: Read sections §8.1–§8.2, complete activities in §8.2.1, §8.2.3, and §8.2.4, and beginfinal (Post-Lab) questions in §8.4.
Week 2: Read §8.3, complete activities in §8.3.2, finish final (Post-Lab) questions in §8.4,write lab summary, and submit completed lab report.
3

8.2 Studying Galaxy Images
We can deduce many properties of galaxies by studying images taken with telescopes. In thisexercise, we will focus on images of nearby galaxies taken with the Sloan Digital Sky Survey(SDSS) 2.5-meter telescope at Apache Point Observatory in New Mexico. Each galaxyis imaged through five filters ranging in wavelength from 3500A to 9000A, covering theentire visual spectrum and small portions of the ultraviolet spectrum and the near-infraredspectrum on either side. We can deduce the colors of the galaxies by comparing how brightthey are at various wavelengths; galaxies which emit their light primarily at ultraviolet andblue wavelengths appear bluish, while those dominated by low-mass, cool stars which emitlight at red and infrared wavelengths appear yellow and red.
8.2.1 Grouping Galaxies Based on Appearance
Your first activity is to inspect a small set of galaxies, and to group them according to thefeatures which seem most important to you. There are no “wrong answers” in this process,so take your time, carefully observe shapes, color variations, and subtle differences betweenthe galaxies, and have fun.
Reload the GEAS project lab exercise web page (see the URL on page 3 in §8.1.2), and clickon the link for this exercise labeled “Web application #1 (galaxy mosaic).”
You will be presented with a 6 by 6 grid containing 25 galaxies and 11 blank spaces. Yourtask is to sort the galaxies into rows, placing those which seem most similar together. (Theblank spaces are provided so that you can place between 1 and 6 galaxies on each row.) It isup to you to decide what features that you see in the galaxy images are the most important,including brightness, color, shape, and orientation. Your goal is not to duplicate the preciseordering done by anyone else, but to investigate all of the information provided in the imagesand to decide which common factors matter most. You need to decide which features aremost significant, and then to describe clearly what you have done.
1. When you have sorted the galaxies to your satisfaction, save a JPG- or PNG-format copyof the mosaic and add it to your lab report. (5 points)
2. Add a detailed explanation which describes the key properties of the galaxies assigned toeach row of your mosaic (such as “Row #1: Galaxies have a uniform golden color, no clearfeatures or substructures, and elliptical shapes.”). If there were particular cases which youfound most perplexing (such as a galaxy that seemed to belong equally well to two rows),make a note of them as well. (For example, “The last galaxy on the right in row #2 couldhave gone in row #3 as well, if I prioritized shape over color.”) (3 points)
4

Once you have printed your mosaic and written up your notes on your sorting process, aska fellow student, or a friend or family member, to sort the mosaic as well. (Make sure thatthey do not see your final mosaic until they are done, so that their decisions about how togroup the galaxies are independent from yours.) Then compare the results, and discuss howyour differing impressions of the images produced different groupings of galaxies.
3. Save a JPG- or PNG-format copy of your partner’s mosaic and add it to your lab report.(1 point)
4. Describe your sorting partner. Are they a man or a woman, or a boy or a girl? (If achild, please tell us their age.) Are they engaged in a profession where attention to detail iscritical (such as seamstress or electronics technician), or are they Big Picture people? Arethey color blind? Have they ever looked at pictures of galaxies before? (1 point)
5. Describe the differences and the similarities between your two final galaxy mosaics. Didyou agree broadly, or did you focus on very different aspects of the images? Can you eachunderstand what the other did? (2 points)
5
Remember that your goal is not to have identical (or even similar) results. By examining howdifferent people group galaxies differently, you will better understand your own patterningprocess and become more aware of any details contained in the images that you may havemissed.
8.2.2 Observational Properties of Galaxies
Now that we have looked at some images of galaxies, let’s learn about how to connect theirappearances with their contents, and relate their basic properties to their histories.
Galaxy Colors (Tracing Different Types of Stars)When we study optical images of galaxies we see primarily the light emitted by the memberstars. Stars of different types have different colors, blue for the hottest, shortest-lived Oand B stars, yellow for intermediate-mass stars like the Sun, and red for cool, low-mass K,M, and T stars. When we look at a galaxy, the combination of different stars (the stellarpopulations) produces a colorful image, and different colors indicate the presence of stars ofdifferent masses, ages, and temperatures. The left-hand panel of Figure 8.2 illustrates thecolors and forms of the most common massive galaxies.
We measure colors by comparing the amount of light emitted at blue wavelengths (we callthis portion of the spectrum the B-band, B for blue) and the amount emitted at longerwavelengths, at the center of the visual spectrum (V-band, V for visual). A value below 0.5is very blue while a value above 1.0 is very red, so a difference of even 0.1 in B–V color issignificant. Optical colors range from violet and blue (at the shortest wavelengths) throughgreen, yellow, and red (at the longest wavelengths). For simplicity, we thus call the lightemitted at short wavelengths “bluish” or “blue”, and the autumnal shades of yellow, orange,and red are all grouped together under the banner of “reddish” or “red.”
Wherever we see blue colors in a galaxy, we know that there is active star formation goingon there. The bluest stars, being the hottest stars, burn through their fuel quickly, so theyare very short-lived. If we see them at all, we know that new stars are forming at present.
Contrast these regions with areas with red or golden colors, indicating the presence of cooler,lower-mass stars. These stars have long lives, and can spend ten billion or more years steadilyburning hydrogen in their cores at relatively constant rates (we call this phase the MainSequence of the stellar life cycle). Most of the stars that we observe in the Milky Way fallinto this category. including the Sun.
What do we see if we look at a region containing both blue and red stars? Because blue
6

Semi−major axis
Major axis
Sem
i−m
inor
axi
s
Min
or a
xis
.
Figure 8.2: Left panel: Simple sketches illustrate the patterns behind the elliptical galaxysequence (top row), lenticular or S0 galaxies (second row), and unbarred (third row) andbarred (final row) spiral galaxies. Right panel: The definition of the semi-major axis a foran ellipse (the largest radial length you can fit inside it) and the semi-minor axis b (theperpendicular radial length). The axial ratio is b/a. If the semi-major axis were pointingstraight up, we would say that the galaxy had a position of 0◦; as it is tilted over by 90◦, ithas a position angle of 90◦.
stars are so much more luminous than their cooler neighbors, their light overwhelms the lightfrom the other stars, even if they are few in number. Blue colors thus definitely indicatethe presence of hot O-type and B-type stars, while redder colors tell us that no such starsare present. Though blue stars are the hottest, they are also the shortest-lived. Imaginethat a sudden burst of star formation creates lots of stars with a range of masses (and thuscolors). The blue stars will dominate the light profile initially, drowning out the other stars,but they will soon burn through their fuel supplies and die. Redder colors thus tell us thatstars formed in a region in the past, but that few have formed recently.
Some galaxies have uniform red and gold colors, indicating that they have experienced littleor no recent star formation. Other galaxies can be divided into reddish regions (made upof old stars) and bluish regions (where star formation is on-going). Some extreme galaxiesare dominated by blue light, indicating that they have rich reserves of gas clouds which are
7

being turned into new stars throughout the galaxy. Galaxy colors thus indicate the differentstellar types (the stellar populations) that are present within different regions.
Galaxy Luminosities and SizesWhat else can we observe from galaxy images? We can determine the luminosity of galaxies(how much light they emit), and so estimate the number of stars present. We can measuretheir apparent (angular) sizes, and combine them with the distances to the galaxies todetermine intrinsic sizes. (A galaxy which looms large on the sky is either intrinsically large,or just nearby.)
It can be helpful to fit an ellipse to the galaxy image, and then measure the amount oflight found within the ellipse (the total galaxy luminosity). We can orient the ellipse ata particular angle (the position angle), and by varying its ellipticity from 1 (round) to 0(elongated along one axis into a long oval shape) determine the galaxy’s axial ratio (see theright-hand panel in Figure 8.2).
Galaxy Concentration and Asymmetry Indices (CI, AI)Once we have placed an ellipse to contain the galaxy, we can also estimate two more quan-tities. The first is the concentration index (CI), which tells us how concentrated the lightfrom the galaxy is within the central regions. The concentration index is just the fractionof light emitted by the galaxy within the inner 30% of the ellipse. We can “draw” a second,smaller ellipse using only 30% of the semi-major axis and only 30% of the semi-minor axis,and count up all of the light contained within this smaller ellipse. If the bulk of the galaxylight comes from the core, then this will be a sizable fraction of the total light. Concentrationindices are generally highest for elliptical and lenticular galaxies, and decrease as we movethrough the spiral galaxy sequence (from Sa to Sd).
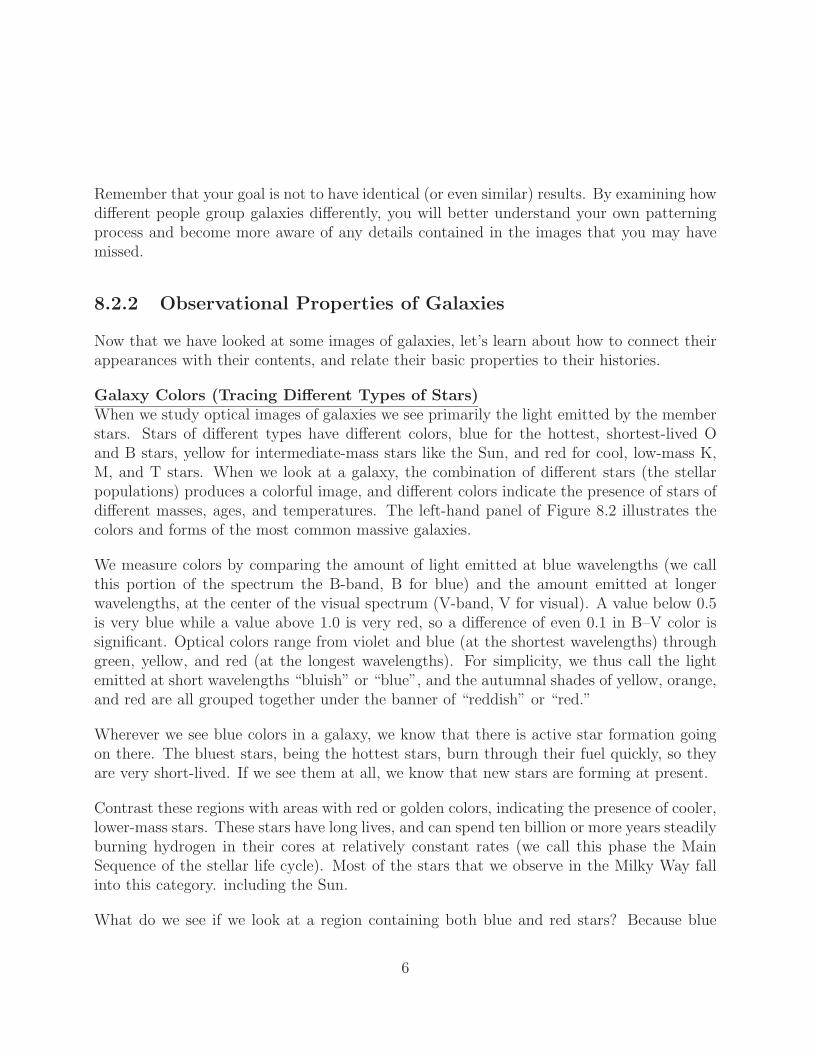
The second morphological index is the asymmetry index (AI), which tells us whether thegalaxy appears smooth and symmetric, or displays substantial amounts of substructure (suchas the spiral arms in the Milky Way disk). The asymmetry index is calculated by taking thegalaxy image and rotating it by 180◦, and subtracting this from the original image. (This“differenced” image is then divided by the original image, resulting in a map which showcasesthe percentage residuals across the face of the galaxy.) A galaxy which is symmetric willsubtract from itself and leave virtually no residue, while one with structure will leave apattern behind.
Examine the three sample galaxies shown in Figure 8.3. The first galaxy is an elliptical, anddisplays the round, even contours of light expected for this class. The rotated image looksalmost identical to the observed one, and the difference between the two images looks likeempty space – the entire galaxy has been canceled out. This tells us that such galaxies havevery uniform properties, suggesting that the stars have been in place for a long time (longenough for variations in orbital paths to be smoothed away by the passage of time). Thesecond galaxy is a spiral, and because of the detailed structures found in the galaxy disk,the outer regions of the galaxy contain large residuals when differenced against a rotatedimage. The central regions (including the central bar) of the galaxy, marked by gold colors
8
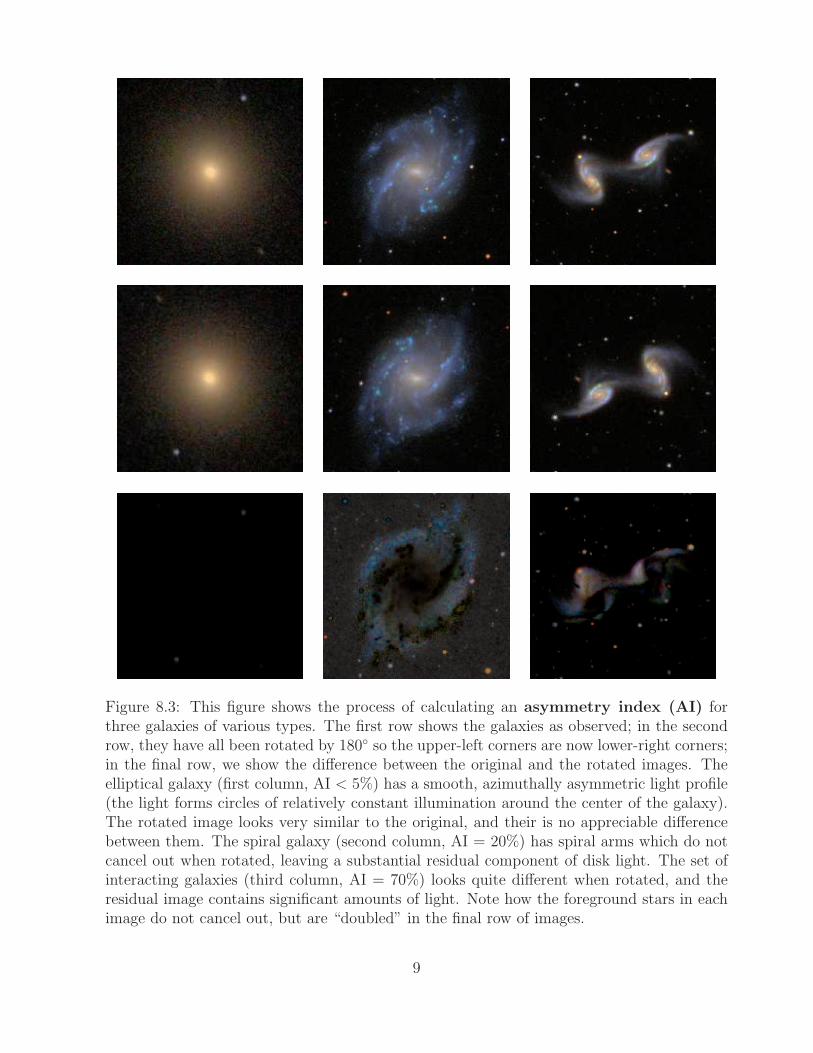
Figure 8.3: This figure shows the process of calculating an asymmetry index (AI) forthree galaxies of various types. The first row shows the galaxies as observed; in the secondrow, they have all been rotated by 180◦ so the upper-left corners are now lower-right corners;in the final row, we show the difference between the original and the rotated images. Theelliptical galaxy (first column, AI < 5%) has a smooth, azimuthally asymmetric light profile(the light forms circles of relatively constant illumination around the center of the galaxy).The rotated image looks very similar to the original, and their is no appreciable differencebetween them. The spiral galaxy (second column, AI = 20%) has spiral arms which do notcancel out when rotated, leaving a substantial residual component of disk light. The set ofinteracting galaxies (third column, AI = 70%) looks quite different when rotated, and theresidual image contains significant amounts of light. Note how the foreground stars in eachimage do not cancel out, but are “doubled” in the final row of images.
9

Figure 8.4: A set of elliptical (E) galaxies display the characteristic golden colors andcentrally-peaked, smoothly-varying light profiles of these massive galaxies. Because ellipticalgalaxies are elongated along one axis (like American footballs, or zeppelin airships) someappear round (see upper-left corner) because they are viewed nose-on, while others appearelongated because they are viewed from the side. Elliptical galaxies are most commonlyfound in dense clusters of galaxies with many companions – how many additional galaxies(of various types) can you find in each image?
indicating longer-lived stars, subtract off well. The final case, of two interacting galaxies, isvery non-symmetric, as expected.
8.2.3 Morphological Types for Galaxies
Now that we have discussed the primary observable properties of galaxies, let’s refocus ourattentions on how to classify the galaxies themselves. Galaxy morphologies are traditionallydivided into two large classes, the elliptical (E) and the spiral (S) galaxies. Each of thesetwo classes is farther divided, according to subtle details. There are also additional classesof galaxies: lenticulars (also called S0s, which bridge the gap between ellipticals and spirals),and the riffraff of the Universe – peculiar and interacting galaxies.
Elliptical GalaxiesThe elliptical galaxy sub-classes are defined as E0 through E7 accordingly to whether they
10

appear round (E0) or elongated (E2 – E7) on the sky (see Figure 8.5). As elliptical galaxiesare all intrinsically shaped like ellipsoids (like American footballs or zeppelin airships), thesub-class is purely a function of whether the galaxy appears to be looking down its nose atus (E0) or presents a partial or entire side-view (E2 – E7, where the E7 galaxies are the mostelongated).
Figure 8.5: Left panel: Elliptical galaxies have a prolate spheroid shape (like an egg). If itviewed down the nose they will appear round with an E0 classification, but if viewed fromthe side they will appear elongated (E2 – E7). Right panel: Spiral galaxies have thin rounddisks with spiral arms. If viewed from the side of the disk (from within the plane of the disk)the disk will appear as a flat edge-on band, but if viewed from above or below the disk theywill appear round and face-on, with spiral arms in clear view.
As Figure 8.4 illustrates, these galaxies are characterized by stars with a reddish-gold cast,indicating that there has been little or no recent star formation and suggesting that thesegalaxies are gas-poor. The stars in these galaxies are clustered tightly to the central region,so the galaxies have high concentration indices (40 – 60% of the light can be found in theinner 30% of the galaxy). The asymmetry indices hover near to zero, again because of thesmooth light contours.
Elliptical galaxies are more massive and more luminous on average than their spiral cousins;they are the giants of the Universe. They tend to be found in dense environments, suchas loose groups of 5 – 10 galaxies and the dense clusters which can contain as many as athousand galaxies in total. The brightest galaxy lurking at the heart of each galaxy clusterwill typically be a large elliptical. These brightest cluster galaxies (BCGs) are larger andcontain more stars than their neighbors because they consume smaller galaxies (literallyabsorbing their stars); they are thus the cannibals of the Universe. Examine Figure 8.4 andsee how uniform the colors and shapes of elliptical galaxies are. Note also the number ofgalaxies surrounding them (it is quite rare to find an elliptical galaxy without companions).
Spiral GalaxiesSpiral galaxies are divided into sub-classes (Sa – Sd, as shown in Figure 8.6) based on theirbulge and disk component characteristics. They are also segregated according to whether
11

Figure 8.6: We explore the range of morphologies along the spiral sequence (Sa – Sd),starting with massive Sa galaxies (top row), and progressing through the Sb (second row),Sc (third row), and Sd galaxies (final row).
12

they have a central bar or not – a literal barlike structure stretching across the central regions,often serving as a conduit to funnel gas (and encourage central star bursts) in the nucleus.A spiral galaxy has a central bulge which is analogous in the simplest sense to the shape ofan elliptical galaxy, with the same reddish colors and older, long-lived stellar populations.It is surrounded by the galaxy disk, a thin pancake which rotates rapidly around the galaxycenter. (There is also a stellar halo, a large, diffuse cloud of older stars which surrounds theentire galaxy at large radii, but is is harder to see than the bulge and disk.)
Figure 8.7: A set of lenticular (S0) galaxies illustrating that this class can appear similarto an elliptical galaxy (see upper-left corner), or with prominent disk structure (lower row).
The disk is characterized by a spiral arm structure, where each arm forms at the end of thebar or bulge and spirals outward. The arms are usually the bluest regions of the galaxy;they are sites of recent and current star formation, and appear because pile-ups of materialin the disk collapse gas clouds, forcing the formation of new stars. The disk can be thoughtof as a round disk marked by alternating spiral arms and gaps, indicating highs points andlow points in the disk density.
The classic spiral sequence is defined by the size of the golden central bulge relative tothe bluer outer disk, by the “flocculence” of the disk (whether it has a fluffy or woollyappearance), and by how tightly wound the spiral arms are around the galaxy center. As weshift from Sa to later and later spiral types, the galaxy bulges become less important thantheir increasingly magnificent disks, and the galaxy colors grow bluer and bluer.
13

The spiral galaxies shown in Figure 8.6 are sorted from face-on (round) to edge-on (elongated)from left to right in each row, a designation based on each galaxy’s orientation (the viewingangle, as shown in Figure 8.5) relative to the Milky Way. Note that the first and last Sagalaxies, the first Sb galaxy (counting from the left), and the last two Sd galaxies all havecentral bars, a designation which is decidedly easier to determine for face-on than for edge-ongalaxies.
Lenticular (S0) GalaxiesLenticular galaxies are the bats (neither beast nor bird) of the galaxy world, sharing charac-teristics of both elliptical and spiral galaxies, as shown in Figure 8.7. An edge-on lenticularcan be one of the most difficult galaxies to classify, because most of the morphological infor-mation on the disk component is hidden from view. Lenticular galaxies have massive diskcomponents, but these disks have the colors (and thus stellar populations) of elliptical galax-ies and spiral galaxy bulges. They are fairly gas-free, and so with no recent star formationthey do not display blue colors.
Figure 8.8: Three peculiar galaxies (top row) and three sets of interacting galaxies (bottomrow) show off the distinct morphologies. Can you identify the two coalescing galaxies (andtheir nuclei) within each panel on the bottom row?
14

Peculiar and Interacting GalaxiesWhen the first galaxy surveys were conducted, they were dominated by elliptical, lenticular,and spiral galaxies. With the benefit of larger modern surveys, and a greater sensitivityto fainter galaxies, we have now learned a great deal about peculiar galaxies (those whichdisplay anomalous structures) and interacting galaxies (see Figures 8.8 and 8.9). Peculiargalaxies often have a basic morphology tied to the elliptical, lenticular, or spiral classes, butdisplay unusual shapes, structures, or colors on top of that structure. These variations oftenindicate that the galaxy was gravitationally perturbed by another galaxy in the past (onethat may have moved so far away that it is no longer associated with the disturbed galaxy).
The three peculiar galaxies shown in Figure 8.8 are characterized by non-symmetric shapes,and disturbed dust lanes (dark regions within the galaxy disks where dust prevents the lightfrom shining through). Notice the x-marks-the-spot pattern of dust lanes in the galaxy inthe first column, how the ends of the disk of the galaxy in the middle column flare up andoutwards, and how the outer edges of the disk of the galaxy in the final column have beendrawn out and extend into faint thin strands.
Interacting galaxies are involved in a short-lived transfer of stars and gas between galaxies,where the two galaxies are being disturbed by each other’s gravitational attraction. Simu-lations of these interactions can appear similar to a beautiful dance by birds, where the twoparticipants bob and weave, approaching close to each other and then darting away.
Figure 8.9: An optical image of galaxy M81 (left) and a radio telescope map of the HI gasdistribution (right). If we could only see the optical image, we might wonder whether thethree galaxies shown were connected (and even whether the two smaller ones might lie ata greater distance from us). The gas distribution shows us unequivocally that gas is beingtransferred between these galaxies – they are truly interacting. Note the presence of severallarge clumps of gas slightly above and to the left of M81 in the HI map, clumps which donot even have clear optical analogs on the left.
Though this exercise focuses on optical images of galaxies, it is worth mentioning that wecan learn a great deal about galaxy interactions by viewing radio telescope maps of the
15

distribution of gas around galaxies as well as by tracking their stellar populations (theirstars). Figure 8.9 shows how extended the distribution of gas can be beyond the boundsof the stellar light. In this example, galaxy M81 is revealed to be siphoning gas from twosmall neighboring galaxies, though there is no clear evidence of the interaction in an opticalimage.
Galaxy Morphology Questions
1. A galaxy emitting lots of blue light must contain many ( hot / cool ), ( high- / low- )mass ( short- / long- ) lived stars. The stellar classification of these blue stars is ( O and B/ A, F and G / K, M and L ). (1 point)
2. Galaxies which appear more disturbed tend to have ( higher / lower ) asymmetry indices,and (bluer / redder ) colors. (1 point)
3. Elliptical galaxies tend to be ( bluer / redder ), ( more / less ) massive, and contain( more / less ) gas than spiral galaxies. Their concentration indices are ( higher / lower ),while their asymmetry indices are ( higher / lower ). (1 point)
4. The Milky Way is a galaxy, with a sub-classification of ( Sa / Sb / Sc
/ Sd ). It also has a central . (1 point)
5. It is much easier to trace the spiral arm structure on a(n) ( face-on / edge-on ) spiralgalaxy than on a(n) ( edge-on / face-on ) one. (1 point)
6. The force which binds all of the stars and gas in a galaxy together is theforce. (1 point)
8.2.4 Measuring Galaxy Properties from Images
We will now measure the sizes and shapes of ten nearby galaxies by fitting an ellipse ofappropriate size and orientation to each one of them. As we do so, we’ll also measure theamount of light contained within this elliptical aperture to see how bright they are. We’ll thendetermine a morphological type for each galaxy for ourselves, based on all of the availableinformation and the information discussed in §8.2.2 and §8.2.3.
Reload the GEAS project lab exercise web page (see the URL on page 3 in §8.1.2), and clickon the link for this exercise labeled “Web application #2 (galaxy images).”
Imaging Tool Tips
The image tool interface contains five primary panels, as well as a set of key options acrossthe top of the screen. Start by clicking on the button labeled “Help” to learn about the basicproperties of the tool. The three top panels all have to do with the image of the galaxy.
The left panel contains the controls to adjust the position, size, and orientation of the green
16
ellipse on top of the galaxy image shown in the middle panel. Each image is just wide enoughto contain a particular galaxy, so every galaxy (whether intrinsically large or small, whethervery nearby or farther away) will fill the image. The right panel shows the distribution oflight within the ellipse. It is split in half along its shortest dimension, called the minor axis,so if you have centered it properly on the galaxy the radial plot should appear symmetricabout the point labeled Pixel Position = 0.
The bottom left panel contains a table of galaxy properties, including the position of theellipse on the image, its position angle (0◦ for a tall ellipse and 90◦ for a fat one), its axial ratio(0 for a skinny ellipse, 1 for a circular one), the length of the semi-major axis (the longestradius you can fit into the ellipse), the amount of light contained within the ellipse (comparedto the Milky Way), the average color of the light within the ellipse, the concentration indexand the asymmetry index, and the morphological type. On the right we have the spectrumof each galaxy. As you work with each image, examine the spectrum as well to see if thereare any correlations – can you make any predictions about the spectra based on the images,or vice versa?
1. Once in a great while, a network error will interfere with the loading of one of the galaxyimages in this tool. A warning message will appear when you first load the tool if this occurs.If this happens to you, force your browser to reload the application (most will do so if youhold down the control key or the shift key while reloading the page). If you do not do this,then at least one of your radial plots will not contain any data and you will not be able tocomplete this exercise.
2. Examine the presence of the green ellipse on top of the image of Galaxy #1. We can varyits eccentricity by changing the axial ratio in the Control Panel, and rotate it in place bychanging the position angle. The four arrows shift the ellipse left or right and up or down,and the two buttons to their right make the ellipse grow bigger or smaller. Try changing allof the setting in the Control Panel until you are confident that you understand how theywork.
3. Select “hide ellipse” from the list of options at the top of the screen and then “zoom in”to inspect the galaxy image more closely. Then select “show ellipse” to draw the ellipticalaperture again.
4. Decide whether the galaxy is more oval or more round, and set the axial ratio for theellipse accordingly (0 for very elongated, 1 for round). Identify the longest axis of the galaxy,and rotate the ellipse to match by varying its position angle.
5. Use the four position arrows to move the aperture around so that its center coincideswith the center of the galaxy (the bright core).
6. Use the two remaining arrows on the Control Panel to increase or decrease the size of theellipse. Your goal is to have the aperture contain all of the light from the galaxy, includingits faint (nearly-invisible) outer regions, and a minimum of light from foreground Milky Waystars, other galaxies, and the background sky.
17

7. Use the radial distribution of counts plot to finalize the aperture. Make the aperturelarge enough that the counts are distributed symmetrically on either side of the centralposition (where the pixel position is zero). Set the size so that the boundaries (shown as twogreen vertical lines on the counts plot) are placed where the number of counts starts to risenoticeably upward relative to the background level. You may sometimes need to decreasethe aperture size to keep a foreground star or another galaxy outside of the ellipse; sometimeyou can avoid doing this by instead changing its position angle.
8. Steps 6 and 7 above involve making difficult decisions, and compromising your desire toinclude all of the galaxy flux with your need to include as little as possible of the light fromother stars and galaxies. The key is to be consistent in your approach and to treat all tengalaxies uniformly. Try to place the ellipse to mark the same brightness level on all images,as best you can. For some galaxies there will be no “perfect” solution; we have given yousome difficult cases to consider to illustrate the type of decisions that are often made whendealing with real astronomical data.
Read through the notes shown below for each galaxy as you fit them, and keep them inmind as you work. Jot down a few comments for each galaxy as well. These could rangefrom “confident about this fit” to “neighboring galaxy obscures part of the light profile”, or“could be an Sb or an Sc; hard to tell as so edge-on” and should help you to remember howyou chose a morphological type for each galaxy.
Imaging Tool Questions
1. Save a copy of the final galaxy data table and include it in your lab report. (5 points)
Galaxy #1To set the position angle for the galaxy, ask yourself on what axis you would rotate thegalaxy into or out of the page to turn your ellipse into a circle. That axis is the major axis(the longest line that fits across the galaxy). It should lie at a position angle of roughly 15◦.Then increase the axial ratio to make your ellipse slightly rounder, and adjust the galaxycenter point down by at least one step. Now increase the size of ellipse to contain all of thelight in the outer regions of the galaxy. Then inspect all of the values you have set in theControl Panel to see if you want to update any of them.
2. Note the “ripples” that appear at large radii in the radial counts profile. What do youthink causes them? (1 point)
3. Galaxy #1 Comments: (1/2 point)
Galaxy #24. This galaxy is far less luminous that our Milky Way. How many galaxies of this luminositywould you need to match the light output of the Milky Way? (1 point)
18
5. Notice how the light profile (the radial plot of counts) can be divided into an innerregion and an outer region (with a change of slope between them). The names for the
two galaxy components that these two regions represent are the and the
. (1 point)
6. What do you think causes the patches of blue in the outer regions of this galaxy? (1 point)
7. Galaxy #2 Comments: (1/2 point)
Galaxy #3Be sure to adjust the central coordinates to match the center of the light profile for thisgalaxy. Note how smooth the radial profile is (suggesting a single component rather than abulge and a disk), and how steeply it declines.
8. Does this galaxy have a fairly uniform color? ( yes / no ) (1 point)
9. Galaxy #3 Comments: (1/2 point)
Galaxy #4To set the position angle easily, first dial the axial ratio down to 0.1 and align the elongatedellipse with the major axis of the galaxy. Then reset the axial ratio to a more appropriatevalue.
10. Consider the total B–V color measured across the entire galaxy. What value do you findif you reduce the size of the ellipse to contain just the bright golden nucleus of the galaxy?What types of galaxies have this B–V color overall? (1 point)
11. Galaxy #4 Comments: (1/2 point)
19

Galaxy #5Our simple ellipse is poorly shaped to contain the light from this galaxy and exclude thesurroundings. Note how much of the light is found in the bright core.
12. What do you think this object might have looked like a few billion years ago? (1 point)
13. Galaxy #5 Comments: (1/2 point)
Galaxy #6To adjust the galaxy center, compromise between making a sharp central peak in the radialprofile and containing all of the galaxy light at large radii.
14. Note the dark band running along this galaxy disk, and the bright splotch slightly offsetfrom the center as defined by the rest of the galaxy. These factors will lead to a ( higher /lower ) asymmetry index. (1 point)
15. Galaxy #6 Comments: (1/2 point)
Galaxy #716. Does the edge-on orientation of this galaxy make it more difficult for us to calculate anasymmetry index and to define a morphological type? (1 point)
17. Galaxy #7 Comments: (1/2 point)
Galaxy #818. A larger neighboring galaxy above our target scatters light across this entire image.Because of this, the ( left / right ) side of the radial profile is slightly higher than it shouldbe. (1 point)
19. Galaxy #8 Comments: (1/2 point)
20

Galaxy #9Note how this galaxy has smooth light profiles and golden colors like an elliptical, but alsoshows some structure in the outer regions like a spiral.
20. Galaxy #9 Comments: (1/2 point)
Galaxy #10Don’t hesitate to let your ellipse “fall off” the square image on one side, to contain as muchgalaxy flux as possible within it. The tool will treat the off-image area as if it were black.Note the fleecy flocculence in the outer regions of galaxy, and the strong contrast betweenthe central and outer region colors.
21. Galaxy #10 Comments: (1/2 point)
22. Which of the ten galaxies posed the largest challenge to fit? Which was the easiest toanalyze? Explain your choices. (1 point)
8.3 Studying Galaxy Spectra
8.3.1 Determining Galaxy Velocities from Spectra
We can measure distances to galaxies by measuring their recessional velocities (how quicklythey and the Milky Way are separating from each other). We determine these velocities byexamining galaxy spectra. Let’s walk through this process, explaining our terms as we go.
If you’ve ever listened to the siren of a speeding police car, ambulance, or fire truck, you’veheard the high-pitched sound as it approaches you drop to a lower frequency as it passes byand recedes. This “Doppler Effect” is due to successive sound waves from the approaching
21
source piling up in time (as each new wave travels a shorter distance to reach you), so thatyour ear absorbs more of them with every second. Once the siren starts to move away fromyou, the sound waves start to space out again (as they have to cover more and more groundto reach you) and the siren seems to drop in pitch.
Light waves undergo a similar effect. While it’s most natural to talk about sound waveschanging in pitch (or frequency), the analogous effect for light waves is typically describedas a change in wavelength. We detect visual light emitted from approaching sources to beshifted in wavelength toward the blue end of the spectrum, and we find light from sourcesmoving away from us to be redshifted to longer wavelengths. The amplitude of the shift isdefined by a change in wavelength, ∆λ. The ratio of ∆λ to the original wavelength of thelight (called λrest, as it is emitted by a source at rest with respect to an observer) is definedas redshift (z). We can write this as an equation:
z =∆λ
λrest
. (8.1)
The redshift z is the change in wavelength of a spectral feature, relative to its wavelengthat rest. The larger the redshift, the faster the object is moving away from the observer.
Example 8.1
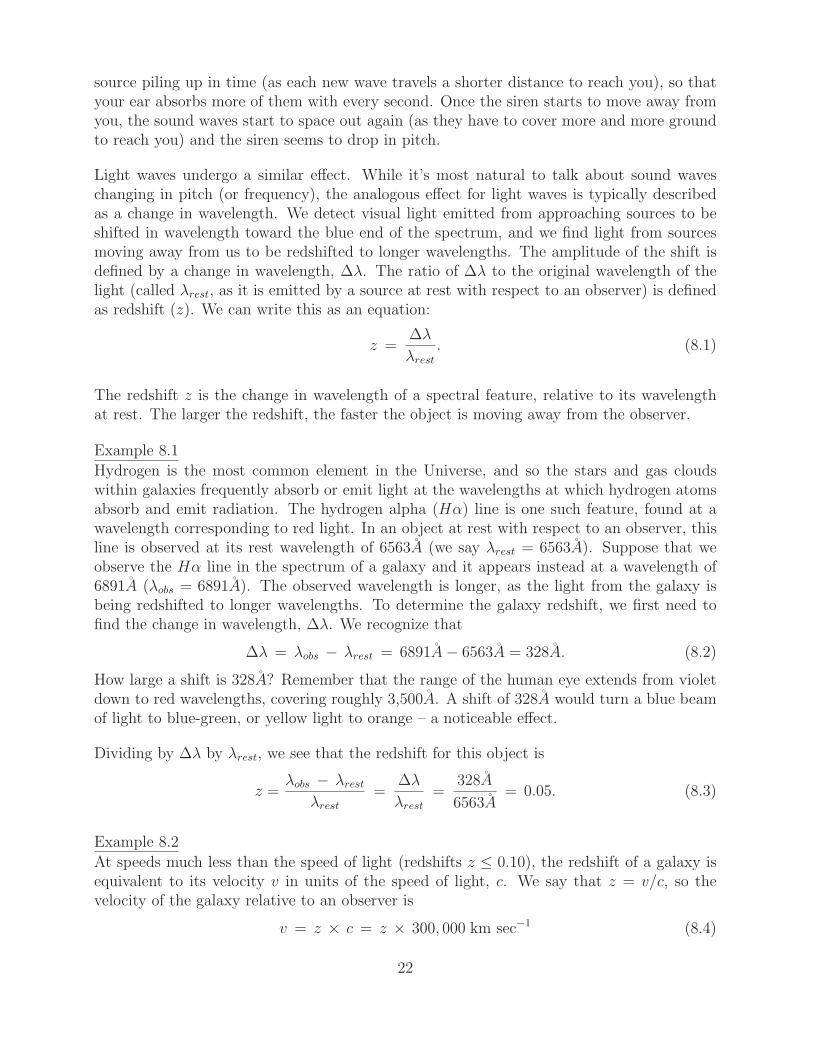
Hydrogen is the most common element in the Universe, and so the stars and gas cloudswithin galaxies frequently absorb or emit light at the wavelengths at which hydrogen atomsabsorb and emit radiation. The hydrogen alpha (Hα) line is one such feature, found at awavelength corresponding to red light. In an object at rest with respect to an observer, thisline is observed at its rest wavelength of 6563A (we say λrest = 6563A). Suppose that weobserve the Hα line in the spectrum of a galaxy and it appears instead at a wavelength of6891A (λobs = 6891A). The observed wavelength is longer, as the light from the galaxy isbeing redshifted to longer wavelengths. To determine the galaxy redshift, we first need tofind the change in wavelength, ∆λ. We recognize that
∆λ = λobs − λrest = 6891A− 6563A = 328A. (8.2)
How large a shift is 328A? Remember that the range of the human eye extends from violetdown to red wavelengths, covering roughly 3,500A. A shift of 328A would turn a blue beamof light to blue-green, or yellow light to orange – a noticeable effect.
Dividing by ∆λ by λrest, we see that the redshift for this object is
z =λobs − λrest
λrest
=∆λ
λrest
=328A
6563A= 0.05. (8.3)
Example 8.2
At speeds much less than the speed of light (redshifts z ≤ 0.10), the redshift of a galaxy isequivalent to its velocity v in units of the speed of light, c. We say that z = v/c, so thevelocity of the galaxy relative to an observer is
v = z × c = z × 300, 000 km sec−1 (8.4)
22

as the speed of light, c, is 300,000 km sec−1.
How quickly is the galaxy described in Example 8.1 moving away from us? With a redshiftof 0.05,
v = z × c = 0.05 × 300, 000 km sec−1 = 15, 000 km sec−1. (8.5)
Due to the overall expansion of the Universe, this galaxy and the Milky Way are separatingat one-twentieth the speed of light!
Recall that the “spectrum” of a galaxy is simply a plot of the amount of light that it emits as afunction of wavelength. A continuous (or continuum) spectrum is one which varies smoothlyand slowly as a function of wavelength, appearing in the visual as a rainbow containing allof the saturated colors. Imagine that there was a sudden gap in a continuum spectrum,where the light was removed at a particular wavelength. We would say that it containedan “absorption” feature because light had been absorbed out at that wavelength, leavingan empty dark space. When we observe stars, we often observe a gap at the wavelength ofthe Hβ or the Hα lines, where hydrogen in the stellar atmosphere has absorbed photonsemitted by the stellar core.
Example 8.3
Consider the spectrum of a galaxy at a redshift z ≈ 0.10 (z = 0.095), shown in Figure 8.10.We have marked seven significant absorption and emission lines in this spectrum, and identi-fied the elements responsible for them (hydrogen, oxygen, magnesium, sodium, and sulfur).The presence of these lines tells us that these elements are present in this galaxy. Note how,at each of the marked wavelengths, there is either a peak or a drop in the spectral flux,indicating an emission or absorption feature. Find the Hα line, and determine its observedwavelength along the x-axis – if you estimated a value just below 7200A (7185A), you didwell! We determined in Example 8.1 that a galaxy with a redshift of 0.05 should show theHα line at a wavelength of 6891A, so we can tell that this galaxy has a redshift higher thanthan 0.05.
In this laboratory exercise, you will compare real galaxy spectra like this to a rest-framespectrum showing the wavelengths and intensities of various features as they would appearin a galaxy at rest with respect to our Milky Way galaxy. You will align the spectra byshifting the rest-frame spectrum back and forth in wavelength to match the observed galaxyspectrum, in order to determine its redshift, as described in Figure 8.11.
8.3.2 Determining Galaxy Types from Spectra
Morphological typing of galaxies is traditionally done from images. However, we can alsoestimate types for our galaxies based on their spectral properties, by comparing them torepresentative spectra of different galaxy types. What more can we learn from studyinggalaxy spectra?
A galaxy spectrum is simply the sum of the light emitted by the stars within the galaxy,
23

Figure 8.10: The optical spectrum of a nearby galaxy, observed by the Sloan Digital SkySurvey (SDSS). This plot shows the amount of light emitted by the galaxy as a function ofwavelength. The spectrum has a smooth underlying shape which rises gently toward longer(redder) wavelengths, with emission and absorption features superimposed on top of it atparticular wavelengths. We have identified several of these key features by name: the oxygen[OII] line at 3727A, the hydrogen Balmer lines Hδ, Hβ, and Hα, the magnesium Mg I line,the sodium Na line, and the sulfur [S II] line. As we know the rest wavelengths of theselines, by finding their observed wavelengths we can determine the redshift of the galaxy.
and light emitted from gas clouds as well. If a galaxy spectrum resembles the spectrum ofa particular type of star, that tells us that this galaxy contains many of those stars. (Forexample, elliptical galaxy spectra and K-type stellar spectra share many common features.)
When we describe a galaxy spectrum, we first note its general, underlying shape (the con-tinuum level). Does it peak at short, blue wavelengths, or is most of the light emitted in thered?
Once we have determined the shape of the continuum, we turn our attention to featureswhich appear at specific wavelengths superimposed on top of the continuum. Absorptionfeatures in galaxy spectra (where the line flux drops down and forms a deep trough) echothe absorption features found in the stellar spectra of the stars found within the galaxy.
Emission features, however, reflect the presence of gas clouds which are absorbing and thenre-radiating energy from nearby stars, at specific wavelengths corresponding to atomic tran-sitions within the atoms that make up the cloud. If a galaxy spectrum shows strong Hβ orHα emission (at 4861A or at 6563A in the rest-frame), this means that there is hydrogen gas
24
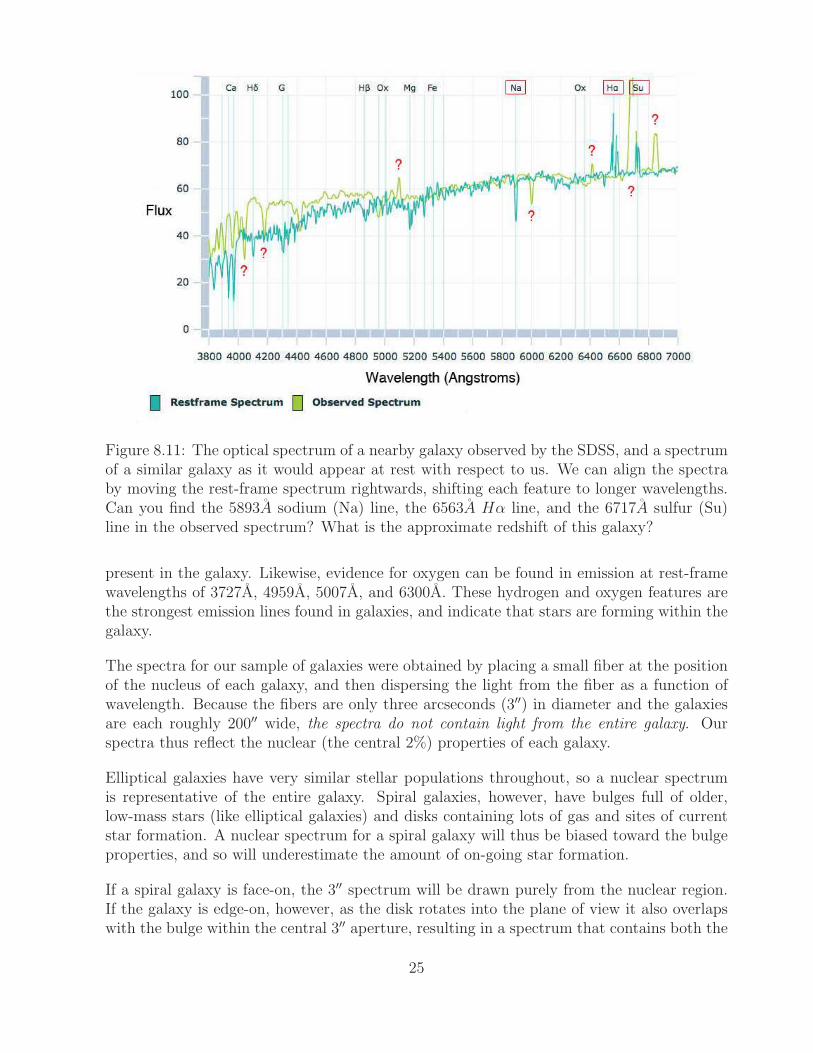
Figure 8.11: The optical spectrum of a nearby galaxy observed by the SDSS, and a spectrumof a similar galaxy as it would appear at rest with respect to us. We can align the spectraby moving the rest-frame spectrum rightwards, shifting each feature to longer wavelengths.Can you find the 5893A sodium (Na) line, the 6563A Hα line, and the 6717A sulfur (Su)line in the observed spectrum? What is the approximate redshift of this galaxy?
present in the galaxy. Likewise, evidence for oxygen can be found in emission at rest-framewavelengths of 3727A, 4959A, 5007A, and 6300A. These hydrogen and oxygen features arethe strongest emission lines found in galaxies, and indicate that stars are forming within thegalaxy.
The spectra for our sample of galaxies were obtained by placing a small fiber at the positionof the nucleus of each galaxy, and then dispersing the light from the fiber as a function ofwavelength. Because the fibers are only three arcseconds (3′′) in diameter and the galaxiesare each roughly 200′′ wide, the spectra do not contain light from the entire galaxy. Ourspectra thus reflect the nuclear (the central 2%) properties of each galaxy.
Elliptical galaxies have very similar stellar populations throughout, so a nuclear spectrumis representative of the entire galaxy. Spiral galaxies, however, have bulges full of older,low-mass stars (like elliptical galaxies) and disks containing lots of gas and sites of currentstar formation. A nuclear spectrum for a spiral galaxy will thus be biased toward the bulgeproperties, and so will underestimate the amount of on-going star formation.
If a spiral galaxy is face-on, the 3′′ spectrum will be drawn purely from the nuclear region.If the galaxy is edge-on, however, as the disk rotates into the plane of view it also overlapswith the bulge within the central 3′′ aperture, resulting in a spectrum that contains both the
25
bulge and disk light of the galaxy. We thus need to be somewhat careful when interpretingour spectra to take into account the regions of the galaxy that were sampled.
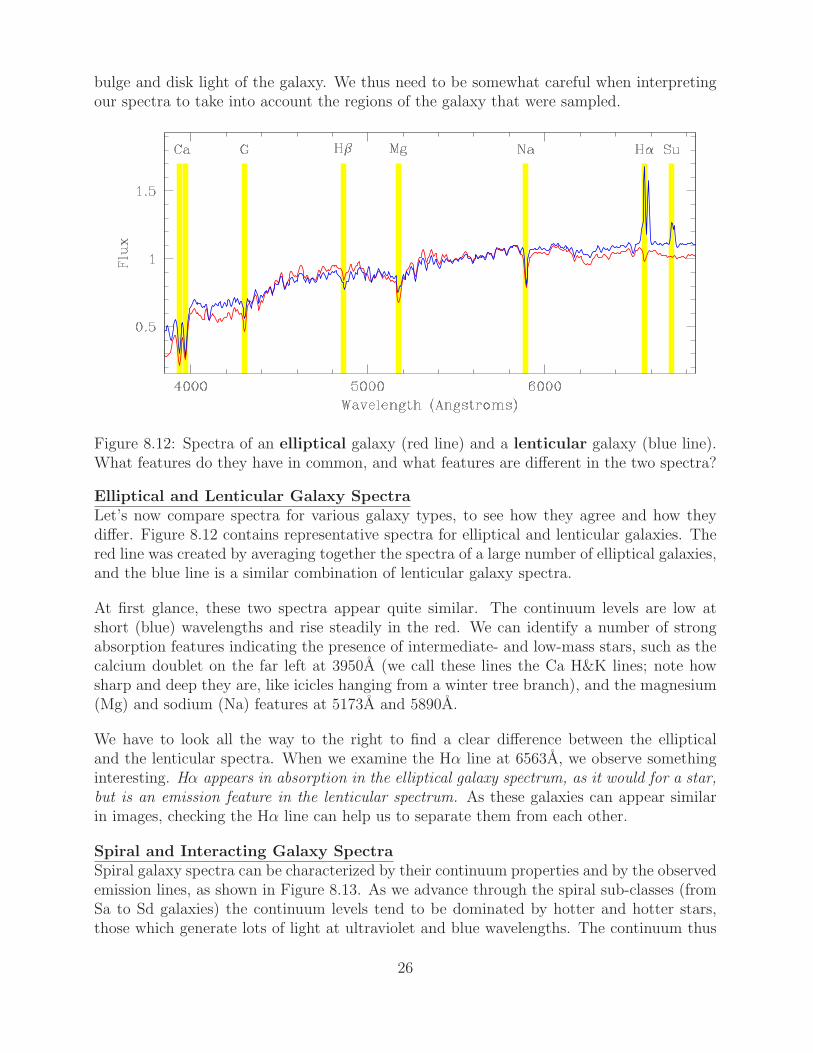
Figure 8.12: Spectra of an elliptical galaxy (red line) and a lenticular galaxy (blue line).What features do they have in common, and what features are different in the two spectra?
Elliptical and Lenticular Galaxy SpectraLet’s now compare spectra for various galaxy types, to see how they agree and how theydiffer. Figure 8.12 contains representative spectra for elliptical and lenticular galaxies. Thered line was created by averaging together the spectra of a large number of elliptical galaxies,and the blue line is a similar combination of lenticular galaxy spectra.
At first glance, these two spectra appear quite similar. The continuum levels are low atshort (blue) wavelengths and rise steadily in the red. We can identify a number of strongabsorption features indicating the presence of intermediate- and low-mass stars, such as thecalcium doublet on the far left at 3950A (we call these lines the Ca H&K lines; note howsharp and deep they are, like icicles hanging from a winter tree branch), and the magnesium(Mg) and sodium (Na) features at 5173A and 5890A.
We have to look all the way to the right to find a clear difference between the ellipticaland the lenticular spectra. When we examine the Hα line at 6563A, we observe somethinginteresting. Hα appears in absorption in the elliptical galaxy spectrum, as it would for a star,but is an emission feature in the lenticular spectrum. As these galaxies can appear similarin images, checking the Hα line can help us to separate them from each other.
Spiral and Interacting Galaxy SpectraSpiral galaxy spectra can be characterized by their continuum properties and by the observedemission lines, as shown in Figure 8.13. As we advance through the spiral sub-classes (fromSa to Sd galaxies) the continuum levels tend to be dominated by hotter and hotter stars,those which generate lots of light at ultraviolet and blue wavelengths. The continuum thus
26

peaks strongly at short wavelengths. We have drawn these spectra so that they all have avalue of unity at 5500A (the lines all cross at the point x = 5500, y = 1). As you tracethe continuum for each spiral sub-class from this point to the left side of the plot, you cansee how the Sc and Sd galaxy fluxes rise above those for the Sa and Sb galaxies. At redderwavelengths the pattern reverses, and the fluxes for the Sa and Sb galaxies are higher.
Figure 8.13: Spectra of spiral galaxies (red for Sa, magenta for Sb, green for Sc, and bluefor Sd).
The continuum levels for the Sa and Sb galaxies are thus similar to those for elliptical andlenticular galaxies, while the Sc and Sd galaxies (as well as interacting galaxies) peak morestrongly at blue wavelengths.
You may notice at this point that there is no line on the plot for interacting galaxies. Thisis because their spectra are very similar to those of Sd galaxies, so similar that we would notbe able to distinguish the two lines from each other on the plot. As two galaxies interact,the disruptive process sends jolts (shock waves) through the gas reservoirs of each galaxy,compressing the gas clouds and stimulating star formation. Their spectra thus resemblethose of Sd galaxies because in both cases there is on-going young star formation.
Spiral galaxies have weak absorption lines, such as the sodium (Na) line at 5890A, but theirdefining features are their strong emission lines. How do the emission lines of the spiral sub-classes compare? Let’s examine the blue Hβ and oxygen lines first (highlighted in yellow onthe plot), as they are easy to read. As we progress from Sa to Sd galaxies, these featuresgrow in strength (height). This pattern is repeated on the right for the oxygen, Hα, andsulfur lines. (These are a bit harder to read because though the Sd galaxies still have thestrongest lines, their continuum level is the lowest, so the lines now overlap.) The strongerthe hydrogen, oxygen, and additional emission lines are, the further we have moved from Sato Sd in spiral galaxy sub-class. Note for example the oxygen line at 6300A, which is only
27

visible for the Sd galaxy line.
8.3.3 Measuring Galaxy Velocities and Types from Spectra
We can now measure recessional velocities and morphological types for our sample, by takingrest-frame spectra of typical galaxies of various types (the spectra as they would appear fora galaxy at rest with respect to the Milky Way) and redshifting them to match the spectrumof each of our ten galaxies.
Reload the GEAS project lab exercise web page, and click on the link for this exercise labeled“Web application #3 (galaxy spectra).”
Spectral Tool Tips
The spectral tool interface contains four primary panels, as well as a set of key options acrossthe top of the screen. Start by clicking on the button labeled “Help” to learn about the basicproperties of the tool. The largest panel (on the left) shows the spectrum of each galaxy (inpale green) and the rest-frame spectrum of a typical galaxy of various types (in pale blue).The controls at the bottom of the panel allow you to shift the rest-frame spectrum left andright (by defining a redshift for it) until it matches up with the observed spectrum.
Use the slider bar to set an approximate value, and then “touch up” the redshift with themore delicate button controls on either side. Note that several strong emission and absorptionfeatures have been marked by element in the rest-frame spectrum (Ox for oxygen, Fe foriron, Ca for calcium, Hα through Hδ for hydrogen, Mg for magnesium, Su for sulfur, andNa for sodium). If these features are strong, then these elements are present in the galaxy.
You can position the rest-frame spectrum two ways: either pay attention to the broad,underlying shape of the continuum (the overall shape of the spectrum), or select the deepestabsorption lines in the two spectra and match them up. The sodium line at rest-frame 5890Ais a popular choice, as this is often a deep well-defined absorption feature. To fine-tuneyour redshift value, use the outermost redshift button controls to make small shifts until thecorrelation coefficient is maximized. When this value, printed next to the recessional velocityon the bottom of the panel, is as close to 100% as possible, you will have found a match tothe velocity for the galaxy. The second panel (from left to right) is a visual representationof the correlation coefficient – try to raise the value of the “correlation thermometer” all theway (to 100%) in each case.
Don’t be disappointed if your final correlation coefficient is not equally high in all cases;there can be a lot of variation between individual galaxy spectra of a single morphologicaltype. You should, however, be able to reach a value of at least 60% for all of the galaxies.
Once you have a first estimate of the galaxy velocity, toggle through the seven morphologicaltypes by using the final control on the top masthead (labeled ‘E’ for elliptical galaxy at first).Compare the rest-frame of each galaxy type to the target galaxy spectrum, and select the
28

best-fitting type.
The data table on the right records the galaxy velocities and derived distances, as well asthe final correlation coefficients, and morphological types. In the lower right corner you willfind an image of each galaxy. Keep an eye on the images as you fit the spectra, and try toidentify trends that you see between the two types of data.
Read through the notes shown below for each galaxy as you fit them, and keep them inmind as you work. Jot down a few comments for each galaxy as well. These could rangefrom “confident about this redshift” to “Hα line key to determining morphological type”,or “could be an Sd or interacting galaxy; hard to discriminate from spectrum alone” andshould help you to remember how you chose a morphological type for each galaxy.
Spectral Tool Questions
1. Save a copy of the final galaxy data table and include it in your lab report. (5 points)
Galaxy #1Begin by roughly estimating the redshift for the galaxy, focusing on the Na (sodium) featureat 5890A. Then try all seven of the morphological types in turn, and examine the shape ofeach spectrum compared to the galaxy spectrum. Notice how the correlation coefficient risesmost closely to 100% for the best-fitting type.
2. The presence of which very strong emission line in this spectrum rules out the ‘E’ (forelliptical) morphological class? (1 point)
3. Is it the presence or absence of key absorption or emission lines, or the poorly fittingshape of the continuum (the overall shape of the spectrum, ignoring emission and absorptionfeatures) which rules out the Sc, Sd, and interacting galaxy types? (1 point)
4. Describe the general pattern formed by the galaxy spectrum and the type-specific spectrawhen the correlation coefficient drops below 0. For which galaxy types does this occur, forthis galaxy? (1 point)
5. What morphological type yields the second-highest correlation coefficient? Can you pointto a feature shown in the accompanying galaxy image which also suggests that this is notthe correct type? (1 point)
29

6. Galaxy #1 Comments: (1/2 point)
Galaxy #2Note that the galaxy appears smaller in the accompanying image. These galaxy images areall the same size on the sky (each snapshot is the same width, in arcseconds), so if onegalaxy appears smaller than the other it is either intrinsically smaller and/or lies furtheraway. Keep in mind that the displayed spectra contain the light from just the cores of thegalaxies (from a few central pixels), so they represent the stars within the central regionsmuch more than the outer regions for a face-on galaxy like this one.
7. More distant galaxies appear ( smaller / larger ) on the images, and their observed spectraare shifted to the ( left / right ) to ( shorter / longer ) wavelengths. (1 point)
8. If we took a second spectrum of this galaxy and sampled a small region near the galaxyedge rather than the nucleus, how would you expect the spectrum to change? The ( absorp-tion / emission ) lines would become much stronger, indicating ( increased / decreased ) starformation in this region of the galaxy. (1 point)
9. Galaxy #2 Comments: (1/2 point)
Galaxy #3We suspect at once that this galaxy lies further away from us than the first two, as itsobserved size is so much smaller. Shift the redshift bar by hand or use the large arrow onthe right side first to shift to a large redshift, and then fine-tune your value with the twosmaller arrows.
10. The redshift measured for this galaxy confirms that it appears so small in the imagebecause it is ( very far away / an intrinsically small galaxy ). (1 point)
11. Galaxy #3 Comments: (1/2 point)
Galaxy #4We observe both strong emission features (Hα and the longer wavelength sulfur line) andstrong absorption features (sodium, the calcium doublet at 3950A) in this spectrum.
12. Galaxy #4 Comments: (1/2 point)
Galaxy #513. This galaxy was very easy to type based on its image, but should give us a different
30
answer based on its core spectra alone. Why is this the case?
14. Galaxy #5 Comments: (1/2 point)
Galaxy #6This galaxy is viewed almost edge-on, and there is a dust lane running across the galaxy.This can cause absorption, and diminish the strength of the observed Hα and Hβ emissionlines.
15. Galaxy #6 Comments: (1/2 point)
Galaxy #7Are you surprised when you contrast this galaxy’s best-fitting spectral type and its color?Remember that the spiral sub-classes are based on the disk structure (bulge prominence,tightness of spiral arms) not on galaxy color.
16. Many galaxies of this morphological type have ( bluer / redder ) disks. (1 point)
17. Galaxy #7 Comments: (1/2 point)
Galaxy #8The companion galaxy to this galaxy is clearly evident above our target in this image witha large field of view.
18. Are both of the galaxies in this image of the same type? ( yes / no ) (1 point)
19. Galaxy #8 Comments: (1/2 point)
Galaxy #9Like Galaxy #4, this galaxy spectrum has both emission and absorption features.
20. Galaxy #9 Comments: (1/2 point)
31

Galaxy #1021. Can you identify a single feature which is very strong in this observed spectrum butmuch weaker in the reference spectrum for this type of galaxy? How would you expect thisto affect the correlation coefficient? (1 point)
22. Galaxy #10 Comments: (1/2 point)
23. Which of the ten galaxies posed the largest challenges in determining redshifts? Whichwas the easiest to fit? Explain your choices. (1 point)
8.4 Final (Post-Lab) Questions
Now that you have spent some time working with galaxy images and spectra, let’s take asecond look at the mosaic of 25 galaxies that you sorted into rows at the beginning of thisexercise.
1. Given what you now know, describe how you grouped galaxies together initially. (Towhich galaxy properties were you most sensitive?) (2 points)
32

2. If you were to resort these galaxies now, what would you change? Are there aspectswhich you emphasized which you now think are unimportant? Are there properties whichyou dismissed which now seem more important, in view of what you have learned? (2 points)
3. What are the basic observed properties of elliptical galaxies, in images and in spectra?What does this tell us about the distribution of stars and gas in these galaxies? (2 points)
4. What are the basic observed properties of spiral galaxies, in images and in spectra? Whatdoes this tell us about the distribution of stars and gas in these galaxies? (2 points)
33
5. Which of the ten galaxies in our sample is the best match to the Milky Way galaxy, andwhy? (2 points)
6. Compare your derived morphological types based first on images and then from spectrafor the ten sampled galaxies. For which galaxies did you estimate different morphologicaltypes from the image and from the spectrum? Where your type estimates differed, did theydiffer by one step (Sb versus Sc), or by several steps (E versus interacting)? (2 points)
7. Consider the galaxies for which you found the greatest disagreement between image-basedtypes and spectrum-based types. Discuss the cause(s) of the differences, and explain whichtype classification you think is the most accurate in each case. (2 points)
34
8.5 Summary
After reviewing this lab’s goals (see §8.1.1), summarize the most important concepts exploredin this lab and discuss what you have learned. (25 points)
Be sure to cover the following points.
• Describe the primary observable properties of elliptical, spiral, lenticular, peculiar, andinteracting galaxies, derived from optical images and spectra.
• Discuss the major differences between these galaxy types, based on their stellar popu-lations (the types of stars they contain) and their gas content.
• Describe the particular challenges that you faced and surmounted in determining mor-phological types for our sample of ten galaxies. What made this process difficult?What insights led to answers?
Use complete, grammatically correct sentences, and be sure to proofread your summary. Itshould be 300 to 500 words long.
8.6 Extra Credit
This lab exercise uses a large set of beautiful images and spectra drawn from the Sloan DigitalSky Survey (SDSS). Research this ambitious astronomical survey project on the internet,and describe its major features and goals.
Where is the SDSS 2.5-meter telescope located? What are the primary survey outputs(what types of images and spectra are taken, covering what ranges in wavelength)? Howmany objects have been observed by the SDSS? How far from us (at what redshift) is themost distant object ever observed by the SDSS?
You can start your reading at the project web site, at http://www.sdss.org. Make sure to alsocheck out some of the project’s loveliest images, at http://cas.sdss.org/dr7/en/tools/places.(5 points)
35


![Properties of Spiral Galaxiespersonal.psu.edu/rbc3/A504/spirals.pdf · Properties of Dwarf Galaxies [Mateo 1998, A.R.A.A., 36, 435] Dwarf galaxies have very different properties](https://img.dokumen.tips/doc/110x75/5ed2238f7280ad2d9636cdd2/properties-of-spiral-properties-of-dwarf-galaxies-mateo-1998-araa-36-435.jpg)
![ENVIRONMENTAL PROPERTIES OF z~[1-3] AGN AND STARFORMING GALAXIES:](https://img.dokumen.tips/doc/110x75/56813224550346895d988756/environmental-properties-of-z1-3-agn-and-starforming-galaxies.jpg)