Embed Size (px)
Citation preview

IELM151/ Stuart X. Zhu 1
Lecture 2 Descriptive Statistics
• Source of Data• Types of Data• Graphical methods for describing a set of
data• Numerical methods for describing a set of
data• Summary• Readings: Chap. 1

Source of Data
• Data distributed by an organization or an individual – HK Census and Statistics Department
• A survey• A designed experiment• An observational study
IELM151/ Stuart X. Zhu 2

IELM151/ Stuart X. Zhu 3
Types of Data
• Quantitative– Numerical, computable, describes quantity– E.g., height, weight, salary, cost, time, distance
• Qualitative– Nonnumerical, categorical, describes an
attribute– E.g., blood type, gender, grading, professional
rank

Types of DataData
Categorical Numerical
Discrete ContinuousExamples:
Marital StatusPolitical PartyEye Color(Defined categories)
Examples:
Number of ChildrenDefects per hour(Counted items)
Examples:
WeightVoltage
(Measured characteristics)
IELM151/ Stuart X. Zhu 4

Graphical Approaches
• (Relative) Frequency Histogram
• Stem and Leaf Plot
IELM151/ Stuart X. Zhu 5

IELM151/ Stuart X. Zhu 6
Company % Company % Company %
1 9.4 11 7.5 21 11.12 8.4 12 10.2 22 8.53 12.5 13 9.9 23 9.44 6.7 14 8.2 24 9.75 10 15 8.8 25 12.36 7.8 16 11.7 26 10.67 10.2 17 7.9 27 8.98 9.5 18 10.3 28 8.19 6.5 19 7.5 29 6.910 11.4 20 11 30 10
PR Example: Here are the data concerning the percentages of revenue (PR) spent on R&D for 30 HK companies.

IELM151/ Stuart X. Zhu 7
(Relative) Frequency HistogramPrinciples for constructing histograms:
• Determine the number of classes– Sturges’ Formula: k = 1 + 3.3 × log10 (n)
• Determine class width– Approximate to (Maximum – Minimum ) / k
• Locate the class boundaries– Start from the lowest class boundary which is smaller than the
minimum and locate the others one by one. Note that a measurement cannot fall on a boundary. (See “L02_Descriptive_s1.xls”)
Usage of Relative Frequency Histogram– Proportion of PR > 10.05% in the 30 HK companies (Sample)– Estimate “the fraction of PR > 10.05% for all HK companies”
(Population)

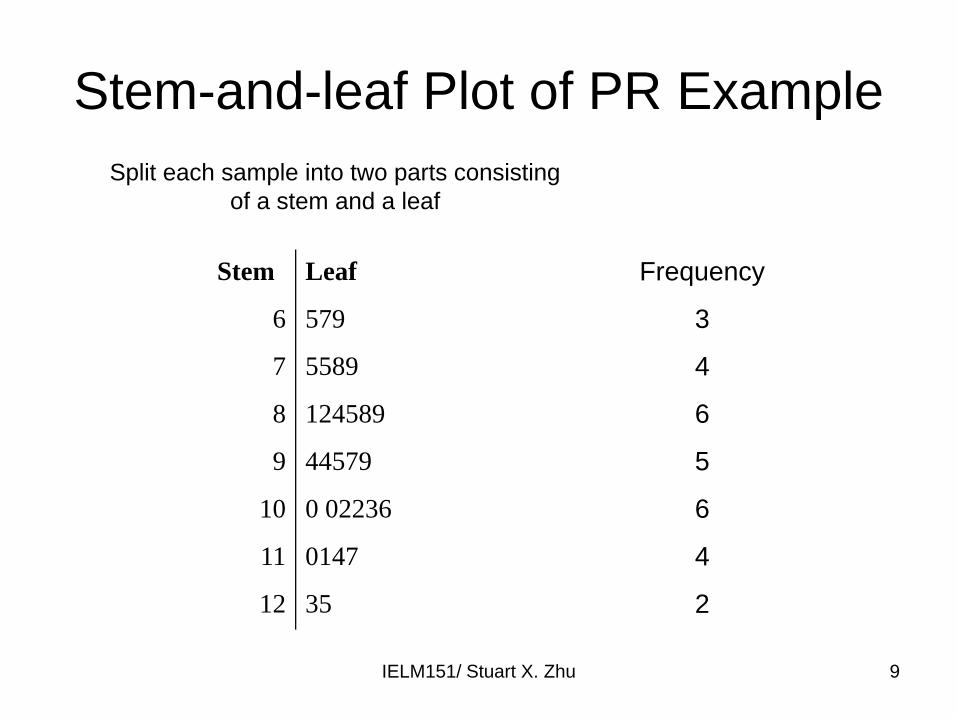
Stem and Leaf Plot
• A stem-and-leaf plot organizes data into groups (called stems) so that the values within each group (the leaves) branch out to the right on each row.
IELM151/ Stuart X. Zhu 8
IELM151/ Stuart X. Zhu 9
Stem-and-leaf Plot of PR Example
Stem Leaf
6 579
7 5589
8 124589
9 44579
10 0 02236
11 0147
12 35
Frequency
3
4
6
5
6
4
2
Split each sample into two parts consisting of a stem and a leaf

IELM151/ Stuart X. Zhu 10
Stem and Leaf Plot
• Rotate the plot counterclockwise 90o
(Relative) Frequency Histogram versus Stem and Leaf Plot
012345678
6.55 7.55 8.55 9.55 10.55 11.55 12.55Fr
eque
ncy
Percentage of Revenue
Frequency Histogram

IELM151/ Stuart X. Zhu 11
Double-Stem-and-leaf Plot of PR ExampleStem Leaf
6 5797 55898. 1248* 5899. 449* 57910. 0022310* 611. 01411* 712. 312* 5
Frequency
343323513111

IELM151/ Stuart X. Zhu 12
Numerical Approaches
• Parameters– Numerical descriptive measures computed from
POPULATION measurements• Statistics
– Numerical measures computed from SAMPLE measures
• Facts– Parameters are constant though they may be
unknown– Statistics change from sample to sample (random)

IELM151/ Stuart X. Zhu 13
Measure of Location (Central Tendency, (Center of the Distribution)
• Mean– Sample mean– Population mean– Sample: 5, 15, 7, 34, 450
• Median– The middle value of xi’s (even / odd)– Can be obtained from the stem
and leaf plot
∑
∑
=
=
=+++
=
=+++
=
N
ii
N
n
ii
n
xNn
xxx
xnn
xxxx
1
21
1
21
1
1
L
L
μ
⎪⎩
⎪⎨⎧
+=
+
+
even isn If),(21
odd isn If,~
12/2/
2/)1(
nn
n
xx
xx

• Mode– The value that appears most frequently in all
the xi’s– Sample: 3, 7, 24, 5, 9, 11, 13, 15, 66, 66– Modal Class in (Relative) Frequency
Histogram
IELM151/ Stuart X. Zhu 14

IELM151/ Stuart X. Zhu 15
Skewness of Data• Three types
– Symmetric:mean = median
– Skewed to the right:mean > median
– Skewed to the left:mean < median
• PR Example– mean = 9.36 <
median = 9.45A little bit skewed to the left
• Remark– More skewed, the
differences among the measures of central tendency become greater
– When skewed or contain extreme values, median& mode are better descriptions.
– Advantage of mean over median & mode
• More amenable to mathematical & theoretical treatment
• More stable if n is large

IELM151/ Stuart X. Zhu 16
Measure of Variability (Dispersion of the Distribution)
• Range = Maximum – Minimum– Sample 1: 5, 15, 7, 34, 30– Sample 2: 5, 19, 18, 20, 34
• Measure of deviation from the mean– Mean Absolute Deviation (MAD)– Variance
• Population variance• Sample variance
∑=
−=n
ii xx
nMAD
1||1
∑=
−−
=n
ii xx
ns
1
22 )(1
1
∑=
−=N
iix
N 1
22 )(1 μσ

IELM151/ Stuart X. Zhu 17
An Exercise• Exercise 1:
(a) Sample 1: 12, 6, 15, 3, 8, 7, 10, 10, 9, 9. Compute mean, median, range, MAD, and sample variance.(b) Sample 2: 12, 6, 15, 3, 4, 7, 10, 15, 9, 7. Do the same calculation. (See “L02-04_Descriptive_s2-1.xls”)
• An important and useful ‘short-cut’ formula
)1()(
11
2
11
2
1
22
−
⎟⎠
⎞⎜⎝
⎛−
=−−
=∑∑
∑ ==
= nn
xxnxx
ns
n
ii
n
iin
ii

IELM151/ Stuart X. Zhu 18
Another Exercise
• Exercise 2:Sample: 17, 5, 4, 10, 2, 11Verify that mean = 8.1667, median = 7.5, s=5.5648, n=6, Now, the and the maximum of three additional data are respectively 75, 991, and 20. What are the sample mean, sample median, and the sample standard deviation of the combined set of 9 data?

IELM151/ Stuart X. Zhu 19
Measure of Relative Variation• Coefficient of variation CV (for positive
measurements only)
• Sample A: 3, 10, 7, 4, 6, mean =6, s = 2.7386, CV = 45.64%
• Sample B: 30, 100, 70, 40, 60, mean = 60, s= 27.386, CV = 45.64%
• Sample C: 13, 20, 17, 14, 16, mean = ?, s = ?, CV =?
%100×=xsCV

IELM151/ Stuart X. Zhu 20
Measure of Relative Standing
• Percentile– Population: The pth percentile is the value of x such
that p% of the measurements are less than that value of x and (100 – p) % greater.
– Sample: – Lower Quartile (QL) 25%, Upper Quartile (QU) 75%
• Sample 1: 12, 6, 15, 3, 8, 7, 10, 10, 9, 9Sorted: 3, 6, 7, 8, 9, 10, 10, 12, 15QL = (10 + 1)/4 th obs.
= (6 + 7)/2 = 6.5QU = (10 + 1)×3/4 th obs.
= (10 + 12)/2 = 11

IELM151/ Stuart X. Zhu 21
Concepts based on Percentile
• Interquartile range = QU –QL
• Trimmed mean– The mean of ‘trimmed’ sample by eliminating data
below pth percentile and above (1 – p) th percentile• Sample 1: 12, 6, 15, 3, 8, 7, 10, 10, 9, 9
– Interquartile range = QU – QL = 10.5 – 6.75 = 3.75– The 10% trimmed mean is the mean of the following
sample 12, 6, 8, 7, 10, 10, 9, 9, which is 8.875

IELM151/ Stuart X. Zhu 22
Z-Score (Standard Score)• The sample z-score corresponding to a particular
observation x is
• Criterion – 2<|z-score|<3 is quite likely– |z-score|>3 is very unlikely
• If |z-score|>2, the observation is a possible OUTLIER.• Sample: 5, 15, 27, 14, 20, 35, 27, 450; |z-score| = 2.47
for the last data; check the source of data before further analysis
sxxscorez −
=−

IELM151/ Stuart X. Zhu 23
Summary
• Graphical methods are good in presenting data, not easy for comparison, and difficult to use of statistical inference.
• Numerical methods mainly focus on the CENTRAL VALUE and the SPREAD of data.
• Different measures have their own advantages and disadvantages. Be careful and smart in using them.

IELM151/ Stuart X. Zhu 24

Cathay Pacific’s Experiment
• The marketing group wanted to increase the number of business class seats sold on its off-peak flights. Key factors were identified as advertising level and pricing strategy. There exist two levels of advertising campaigns and three pricing strategies in geographically.
• Question– Which level and strategy are the best?
IELM151/ Stuart X. Zhu 25

334 Reform
• Effect on HKUST undergraduate education– The development of students’ ability– Employment opportunity
IELM151/ Stuart X. Zhu 26


