Embed Size (px)
Citation preview

-1 ' L , . I : ....-_C_
,, . . . . . . . . i ,
li.Ml. ....... 6.31- 7. .8 .... I
.............. C7c:aa ...... f
.... itup . . . . . . . : L... .,-= 2-- 1
INFORMATION TECHNIQUES FOR : 2...(+ . 1 6 5 4 6
IRRIGATION SYSTEMS
Selected proceedings of the Second International Network Meeting on lnformation Techniques for lmgation Systems
held in LahoreBahawalnagar, Pakistan
5 - 8 December 1994
Edited by Marcel Kuper Daniel Renault Jacques Rey
and Remy Pochat
International Irrigation Management lnstltute Punjab Irrigation and Power Department
Centre National du Machinisme Agricole du Genie Rural des Eaux et des Forhts

Kuper. M.; Renault, D.; Rey, J. and Pochat. R. (Eds.). 1995. Information techniques for irrigation systems: Selected proceedings of the Second International Network Meeting on Information Techniques for Irrigation Systems held in Lahore/Bahawalnagar, Pakistan, 5-8 December 1994. Colombo, Sri Lanka: IIMI. v, 74p.
/ irrigation management / irrigation systems / decision support tools / decision making / information systems / computer techniques /models / water management / Malaysia / Pakistan / Sn Lanka /
0 IIMI, 1995
All rights reserved
Responsibility for the contents of this publication rests with the individual authors. All rights reserved
IIMI International Irrigation Management Institute ~ ~ ~ ~ ~~ ~~ ~
P 0 Box 2075, Colombo, Sri Lanka. Telephone. 94-1-867404 Telex: 22318 IlMlHQ CE
Facsimile: 94-1-866854 €-Mail: llMl (CGNET), [email protected] (INTERNET)

Contents
Foreword . . . . . . . . . . . . . . . . . . . . . . . . . . . . . . . . . . . . . . . . . . . . . . . . . . . . . . . . . . . . . . . . . v
PART I: SUMMARY AND DISCUSSION . . . . . . . . . . . . . . . . . . . . . . . . . . . . . . . . . . . . . . . . . . . 1
Summary and discussion . . . . . . . . . . . . . . . . . . . . . . . . . . . . . . . . . . . . . . . . . . . . . . . . . . . . . . 3
1 . INTRODUCTION . . . . . . . . . . . . . . . . . . . . . . . . . . . . . . . . . . . . . . . . . . . . . . . . . . . . . . . . . 3 2 . ITlS IN THE FIELD . . . . . . . . . . . . . . . . . . . . . . . . . . . . . . . . . . . . . . . . . . . . . . . . . . . . . . . . 4
General Discussion of DSS . . . . . . . . . . . . . . . . . . . . . . . . . . . . . . . . . . . . . . . . . . . . . . . 4 Site Specific Experiences . . . . . . . . . . . . . . . . . . . . . . . . . . . . . . . . . . . . . . . . . . . . . . . . 5 Discussion . . . . . . . . . . . . . . . . . . . . . . . . . . . . . . . . . . . . . . . . . . . . . . . . . . . . . . . . . . . 6
3 . ITlS IN PAKISTAN . . . . . . . . . . . . . . . . . . . . . . . . . . . . . . . . . . . . . . . . . . . . . . . . . . . . . . . . 6 Synthesis of Discussion . . . . . . . . . . . . . . . . . . . . . . . . . . . . . . . . . . . . . . . . . . . . . . . . . 6 Conclusions/Recommendations . . . . . . . . . . . . . . . . . . . . . . . . . . . . . . . . . . . . . . . . . . . . 8
4 . ORIENTATION FOR 1995 . . . . . . . . . . . . . . . . . . . . . . . . . . . . . . . . . . . . . . . . . . . . . . . . . . 9
Synthesis of Key Points and Trends for the Future . . . . . . . . . . . . . . . . . . . . . . . . . . . . . . 9 Workplan of lTlS '95 . . . . . . . . . . . . . . . . . . . . . . . . . . . . . . . . . . . . . . . . . . . . . . . . . . . 11
PARTkCOUNTRY PAPERS . . . . . . . . . . . . . . . . . . . . . . . . . . . . . . . . . . . . . . . . . . . . . . . . . 13
ITlSinthefield . . . . . . . . . . . . . . . . . . . . . . . . . . . . . . . . . . . . . . . . . . . . . . . . . . . . . . . . . . . . . 15
Decision Support Systems: Threat or Promise? . . . . . . . . . . . . . . . . . . . . . . . . . . . . . . . . . . 15 Chris Peny
Information Systems in the Muda Irrigation Scheme: Lessons and Experiences Teoh Weng Chaw and €ow Boon Tiak
21
Study on the Use of Computer Models in Improving the Operation and Management of Irrigation Systems in Sri Lanka . . . . . . . . . . . . . . . . . . . . . . . . . . . . . . . 33 B . M.S. Samarasekera, G . G.A. Godaliyadde. H . M . Jayathilake and U.S. Wjesekera
ITlS in Pakistan: Pakistan's Irrigation System . . . . . . . . . . . . . . . . . . . . . . . . . . . . . . . . . . . . 39 M . H . Siddiqi
iii

Rules and Regulations in Pakistan and Review of Applications . . . . . . . . . . . . . . . . . . . . . . . 43 Ch . Muhammad Shafi
The Application of Decision Support Systems to Pakistan's Irrigation Systems: Resuits of a Pilot Study in the Chishtian Subdivision . . . . . . . . . . . . . . . . . . . . . . . . . . . . . . . . . . . . 51 Zaigham Habib. Marcel Kuper and P . 0 . Malaterre
PARTIII: ANNEXES . . . . . . . . . . . . . . . . . . . . . . . . . . . . . . . . . . . . . . . . . . . . . . . . . . . . . . . . 65
Annex 1: Program of the Network Meeting . . . . . . . . . . . . . . . . . . . . . . . . . . . . . . . . . . . . . . . . . 67
Annex 2: List of Participants . . . . . . . . . . . . . . . . . . . . . . . . . . . . . . . . . . . . . . . . . . . . . . . . . . . 71
iv

Foreword
THE PROCEEDINGS FORM the synthesis of discussions during the Second International Network Meeting on Information Techniques for Irrigation Systems (ITIS). The meeting was held in Lahore and Bahawalnagar (Pakistan) from 5 through 8 December 1994. The Network brings together researchers and irrigation system managers that are applying information techniques in irrigation systems around the world.
Day 1 (Monday) was dedicated to genetic aspects of information techniques and to the exchange of country experiences in the application of these techniques in irrigation systems. About 50 professionals were present during the Monday session, while some 25 participants took part in the whole four-day program. Section 2 in Summary and Discussion gives more details about the Monday session.
Days 2 and 3 were spent in the Fordwah Irrigation System in South-East Punjab. A site visit was made, afler which there was a discussion about the opportunities for implementing an information System in the Fordwah area. A synthesis of the discussion along with the conclusions/recommendations are given under Section 3 in Summary and Discussion.
On day 4, the meeting focussed on a review of the progress made in 1994, while a workplan for 1995 was decided upon (see Section 4 in Summary and Discussion).
V

PART I
SUMMARY AND DISCUSSION

Summary and Discussion
1. INTRODUCTION
AFTER ONE YEAR of existence, the ITlS (Information Techniques for Irrigation Systems) Network has gained some momentum and is now moving from a phase of establishment to a phase of more mature forward looking development. The ITlS Network can be characterized by five elements:
1. An IIMCCEMAGREF (International Irrigation Management Institute-Centre National du Machinisme Agricole du GBnie Rural des Eaux et des Forets [France]) Coordinating Committee.
2. A database of individuals and institutions.
3. A database of irrigation systems.
4. A newsletter.
5. An annual meeting.
The Coordinating Committee is responsible for publishing the newsletter, organizing the annual meeting, faciltating the contacts between Network members and raising funds.
The list of individuals and institutions affiliated to the Network (which basically means receiving and contributing to the newsletter and, for some, attending the annual meeting) comprises of irrigation managers, researchers, donors andlor their parent institutions who have been identified as having an interest in the Networks thematic field: information techniques for irrigation systems.
The irrigation systems of special interest to the ITlS Network are those where a specific experience on DSS (Decision Support Systems) has been conducted, shared and discussed within the Network (through direct research by IlMl or CEMAGREF, through a presentation in the newsletter or during the annual meeting).
The newsletter is published by IlMl at a rate of two issues per year (MaylDecember). Its present format comprises 6 sections, namely:
I. Forum (general articles)
2. Backflow (readers' feedback and suggestions).
3. ITlS in the field (articles on specific irrigation systems).
4. Tools and techniques (progress made in measurements, transmission of data and Software). .
3

5. Workshops and seminars,
6. Publications.
The annual meeting permits the discussion and synthesizing of the advances made during the previous year by the irrigation community in the field of the application of information techniques. The meeting is organized around three main sessions:
1. Presentation of specific field experiences by irrigation managers.
2. Field visit and case study by the participants in a system of interest in the host country.
3. Special session on a topic of generic interest prepared in advance by a group of Network members (state of the art in one field, reviews, methodologies, etc.).
Proceedings of the Network meeting are made available to all participants. The ITlS Network has a light and flexjble structure. As demonstrated in Lahore this year, its
mandate is to help crystallize the thinking and experience of practitioners of the irrigation community in a field with immense potential for the improvement of their business: generating and using better information for decision making.
2. ins IN THE FIELD
General Discussion of DSS
The first part of the Monday session (day 1) was dedicated to generalities on DSS. Different aspects of the problem were tackled. The complexity of the irrigation systems was first identified as a major challenge in modeling. The dynamics of the different flows, i.e., downward flow of water, upward flow of information, downward flow of decision, time gap between decision and effect, gap between information treatment and acquisition, and fanner behavior are some of the critical points that need to be taken into account. A well-balanced DSS is probably a combination of an information system and simulation models. The nature of the models depends on the goal of DSS.
DSS benefts from the rapid development of computer science, but this contains at the same time a threat. as the balance in adequacy between goals and means and between means and resources can be easily disturbed. In other words, we must use the tools appropriately and not be controlled by the tools. This warning is especially appropriate for the new generation of tools that are powerful, convivial and expressive (full of colors). With this in mind, there is obviously an interest in testing new techniques in Some particular irrigation systems, e.g., GIS (geographic database), or expert systems such SICODE which has been developed in Mexico (presented during the Monday session).
4

Site Specific Experiences
The second part of the Monday session was on site specific experiences. Four different national approaches were presented and discussed with the participants.
In Pakistan, IlMl in joint collaboration with CEMAGREF. is leading a project on the Chistian Subdivision-the downstream portion of the Fordwah Canal. The project aims to investigate the canal operational rules and suggest possible improvements. Variability in discharge occurs very often, especially at the downstream end of the canal. Furthermore, these perturbations are usually amplied by the gate operators themselves adjusting the gates too frequently. The research project combined an irrigation management information system (IMIS) to monitor the state of the system and a simulation model (SIC) to test and work out new operational rules to attenuate the variability effect. Some simulated rules and management scenarios had already been drawn, reducing the number of gate operations at cross structure from 15 to 2 per day. In 1995, the Chistian Subdivision Authority (Punjab Irrigation Department), IlMl and CEMAGREF will test these new operation rules in the field.
In Mexico, the presentation focussed on the automatization of the Yaqui Canal Alto in Sonora. The project is carried out by IMTA (Instituto Mexican0 de Tecnologia del Agua), in the context of the privatization of irrigation systems. The goal is to provide new or future management associations with pertinent flow control methodologies. The idea of evolving towards a more user-driven system with more flexibility, is also a great motivation for the development of new methodologies.
In Malaysia, the Muda Irrigation Scheme has a long history of using information systems. The system's 97,000 hectares (ha) of rice fields are supplied by different water sources (50% direct rainfall, 30% remote reservoirs, 15% river flow and 5% recycled drainage). Since completion, water management at the two upstream dams (two days of transfer) has always had to take into account real-time information from the irrigation district (demand) and from the other sources (supply). In 1988, the information system was improved to better assess the water demand from the districts, taking into account the high spatial variability of the rainfall, to better transmit the information using wireless means, and to better process the data including an evaluation pmcedure.
In Sri Lanka. the Irrigation Department in conjunction with the Irrigation research Management Unit (IRMU), is now conducting a comprehensive program to develop and disseminate generic methods for applying decision support systems. This program has been built to improve the operation and management of irrigation systems in Sri Lanka. It follows a decade of experiences in introducing computer tools and modern data systems (collecting and processing), which had been conducted independently (e.g., Gal Oya) orjointly with other organizations (e.g., with IlMl and CEMAGREF in Kirindi Oya). The program focusses on four selected systems with the goal of building in each an information system. The preliminary study, the establishment of a measurement Network, the operationalization of a data collection process and the introduction of computer models, are the main points on which the program supports the selected system managers. The program also attempts to synthesize and disseminate the findings through meetings, workshops, and initial and ongoing training for irrigation Staff.
L
5

Discussion
Following the outcomes of the 1993 meeting, the participants focused their presentations on DSS in support of water distribution, as this was judged an area that needed more attention. The 1993 meeting also stressed the need for simple (minimal hardware requirements) and fast and explicl (refusal of black box approaches) tools, which guided the 1994 workplan of the participants and was reflected in this year's presentations. Cost efficiency was another issue that was prominent in the previous year's discussions. This featured much less in this year's presentations, mainly because the case studies in the different countries are all based on relatively cheap methods of data processing and especially data collectionnransmission. The Mexican case is a good example, as all the DSS tools are sold to the +en (in this case farmer organizations). It was stressed in 1993 that a better understanding of exibting decision making processes in irrigation systems was required before implementing DSS. The Network addressed this issue on days 2 and 3 of the meeting when the Pakistan case was discussed. More news on this would be disseminated in 1995 through the ITlS Newsletter.
Finally, it was concluded during the previous year that a sustained interest of policymaken in DSS could be generated by a quantification of performance improvements through interventions. Most of the tools presented included an evaluation module, although there is much room for improvement. In Muda, for instance, evaluation can be carried out on a seasonal basis only at present and there appeared to be a need to do this more often. Policymaken have not been involved in the Network so far, but once firmly established, the Network will attempt to create more significant links between policymaken and irrigation managerslresearchers. '
In the discussion, the participants stressed the need for a classification of tools, to make these tools accessible to researchers and managers working in irrigation systems.
3. ITlS IN PAKISTAN
Synthesis of Discussion
This section is based on the (group) discussions that were held on day 3 (Wednesday) in Bahawalnagar, and on the individual responses of participants to questions formulated in a questionnaire that was distributed affer the site visit on day 2 (Tuesday).
Three groups were formed to discuss the following questions:
1. Strengths and weaknesses of water management of the Fordwah System.
2. Brainstorming on possible improvements.
3. Prioritization of practical proposals for implementation.
The results of these discussions are synthesized below:
6
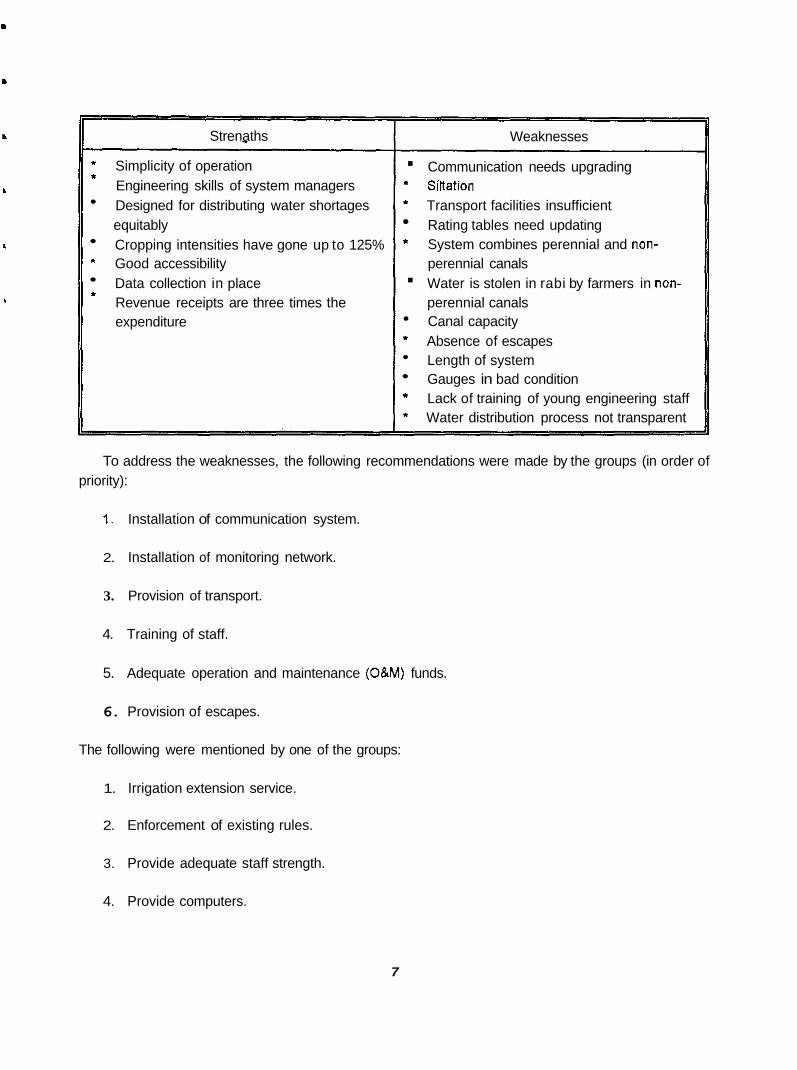
Strenaths
* Simplicity of operation " Engineering skills of system managers
Designed for distributing water shortages equitably Cropping intensities have gone up to 125%
* Good accessibility Data collection in place
' Revenue receipts are three times the expenditure
Weaknesses . " .. *
. t
" "
Communication needs upgrading Siltation Transport facilities insufficient Rating tables need updating System combines perennial and non- perennial canals Water is stolen in rabi by farmers in non- perennial canals Canal capacity Absence of escapes Length of system Gauges in bad condition Lack of training of young engineering staff Water distribution process not transparent
To address the weaknesses, the following recommendations were made by the groups (in order of priority):
I. Installation of communication system.
2. Installation of monitoring network.
3. Provision of transport.
4. Training of staff.
5. Adequate operation and maintenance (O&M) funds.
6. Provision of escapes.
The following were mentioned by one of the groups:
1. Irrigation extension service.
2. Enforcement of existing rules.
3. Provide adequate staff strength.
4. Provide computers.
7

5. Strengthen ID-IIMI (Irrigation Department-International Irrigation Management Institute) collaboration.
6. Prioritize maintenance.
Before the field visit, forms were distributed asking for the need of a DSS in the Fordwah System. The following questions were posed:
1. Key points to be addressed by a DSS in the Fordwah System.
2. Suggested DSS in the Fordwah System.
3. Workplan for implementation in the Fordwah System.
1. The respondents indicated that the quality of service to the users was the most important issue to be addressed by a DSS, while the second issue was variability. Other issues that were mentioned were maintenance, financial evaluation, communication and equity. Operation was considered to be more important than maintenance.
2. The Fordwah System needs to be partitioned (scale, level of decisions). The data need to be centered as the objectives are centralized (equity). The respondents stressed the need for simplicity and building on the existing system.
3. The concept of a clear, agreed pilot study was indicated. For this, the objectives of the System need to be clarified. A way should be found to include a study on groundwater (conjunctive use). Finally, the evaluation of the pilot study should be based on objectives with user feedback and the participation of field staff.
ConclusionslRecommendations
Based on the group discussions and the individual responses to the questions pertaining to the implementation of a DSS in the Fordwah Irrigation System, the following conclusionslrecommendations were formulated:
Operational Criteria
a. The general objective of the operation of the canal system needs to be agreed upon (e.g., equity, steady flow, etc.).
b. The means to achieve the objective is to implement a rotational plan (perenniallnon- perennial).
8

.
.
.
. r
.
.
.
.
.
.
.
.
.
.
.
.
.
.
c. There is a need for the planning of maintenance.
Needs: Transparency. Clarity of operational criteria and rotational plan Regular funds.
Information
a. Update data collection process, data processing.
Needs: To share objectives, information. To improve data analysis. To monitor groundwater.
Equipment
a. Communication system.
b. Transport facilities.
c. Measurement devices (gauges, etc.).
d. Computers.
Needs: Improvement and development.
Training
a. At all levels including users on collection, transmission and processing of data.
Needs: Coordination improved between PID and IIMI.
4. ORIENTATION FOR 1995
Synthesis of Key Points and Trends for the Future
This section is based partly on the (group) discussions that were held on the fourth day (Thursday) and partly on the response to questions posed in forms that were filled in by the participants. Every participant of the meeting was asked to answer three questions, prioritizing keypoints presented during the meeting and identifying the gaps and needs for future research or actions. The key points have been grouped following the 1993 classification:
9
1. Tools.
2. Implementation methodology.
3. Institutional arrangements
DSS Tools
1. There is a need l o make a database of available tools: this database should include the experiences that users have had with a particular tool.
2. Tools that are developed should be as generic as possible; however, they need to be adapted l o site specific situations.
3. Tools need to be as transparent as possible; simplicity in using the tool was stressed.
4. A DSS is considered as a chain, and the data collection (measurements) appears to be the weaker link. It is followed by data transmission and then the data process (software). The needs for improvements are accordingly acknowledged, and simplicity and reliability are keywords regarding the future developments identifed by the participants.
Implementation Methodology
1. The success in implementing a DSS within an irrigation scheme is largely attributed to a good preliminaty diagnosis and the possibility of referring to pilot studies.
2. A good coordination between manages and researchers was emphasized
3. There is a need for a good system l o monlor and evaluate pilot studies as well as the implementation of DSS with appropriate indicators.
4. Funds need l o be set aside for pilot studies as well as the implementation of DSS
5. There is still a need to gather and improve the knowledge on information systems dedicated to irrigation schemes (diagnosis, implementation, evaluation).
lnstitutional Arrangements
1. A good way lo insthtionalize DSS and information systems is to create a special unit inside an Irrigation Department.
2. There needs to be an emphasis on the exchange of experiences on the implementation of DSS, both internally in Irrigation Departments as well as with external partners (researchers. Irrigation
10

.
.
.
.
.
.
.
. m
. I
Departments in other countries). The Sri Lanka case is often cited as a good example of a network mixing managers, researchers, top managers of the Irrigation Department and training center staff.
3. Training of staff needs to be undertaken; this training needs to be focussed and consistent with the global objectives of DSS implementation.
4. Need for coordinating committees, in which managers and farmers participate.
5. The consistency of the approach is seen as the keypoint to success. It ranges from the definition of clear global objectives for agriculture and water management to users' acceptance of the project.
6. Finally, it is a matter of facilitating the knowledge flows: production and storage of data (what knowledge), allocation (for whom, e.g., local managers), and distribution (how to train and disseminate).
Workplan of ITlS '95
Following the discussions during the workshop, a number of practical proposals were put forward by the participants, which need to be realized in 1995.
1. The continuation of sharing of information on experiences in the implementation of DSS in irrigation schemes. Modes of communication:
a. ITiS newsletter.
b. ITlS technical papers that can be shared with members of the Network. One such output will be produced by Daniel Renault on the review of DSS tools.
2. The organization of an exchange meeting at the end of 1995 in Mexico. There will be three parts to the meeting:
a. Exchange of country experiences
b. Case study, related to the host country.
c. Specific topic of generic interest (e.g.. tools, implementation methodologies, instiiutional arrangements). In the Mexico meeting the theme will be DSS soffware.
3. A review of DSS methodologies and tools used in irrigation management will be carried out by IIMVCEMAGREF.
11

ITIS IN THE FIELD
Decision Support Systems: Threat or Promise?
Chris Perry'
Decision support systems: A set of fools and procedures which, if used by the management of a PaffiCUlaf system, would enhance the qualify of the decision making process in the system.
On 13 November 1994, the Government of Sfi Lanka was due to induct a new cabinet, following the presidential elections held earlier in the week. The inducfion ceremony was delayed until 14 November, because ashologers advised the incoming president that this would be a more auspicious date.
The two statements recorded above are related: the first a general definition of DSS, and the second one practical example. While the example chosen may strike some as extreme or unusual, it allows us to recognize some important characteristics of DSS, and also shows that the range of DSS is sufficiently large that we may need to be very specific in defining words such as "enhance" and "quality."
The purpose of this introductory paper is primarily to set out some notes of caution that might help us understand the importance and contribution of the more technical papers that follow. The examples may seem trivial, but all are taken from real life-mistakes that many of us have seen made (though not actually made ourselves, of course), And while the examples may sometimes seem tangential to DSS, the foundations upon which analytical DSS approaches are based derive directly from such simple analyses and simple relationships.
SIMPLE CONCERNS
False Clarity-Never Mind What We Are Seeing, What Are We Looking For?
There is something beguilingly persuasive about "modem" digital analysis, and its associated laser- printed, 300 dots per inch output, with multiple pages of supporting calculations, and three dimensional graphics. (The reader is probably taking this paper more seriously in its printed form than if it were handwritten). "Modem" information is oflen challenging in both scale and detail (we can correlate anything against anything, in a matter of seconds). This ease of processing and presenting data
'Senior irrigation Specialist, International irrigation hknagernent tnstnute. coiombo, sri Lanka.
15

encourages analysis without purpose, and reduces the preliminary effort that the analysts should put in before running the models, to clarify the hypotheses they are testing, the linkages being explored and the mechanisms underlying those linkages. IlMl is perhaps much closer to having tested Cfly performance indicators in one project than one indicator in fifty projects.
False Precision-And the Unpopularity of Ignorance
An internal World Bank paper with the title "Estimates of Poverty" (or "The Poverty of Estimates") argued in the late 1970s that existing data on, and indicators of poverty were an inadequate base for policymaking. The paper pointed to many methodological diftkulties-definitions, measurements, trends-and complicating factors of local preferences, non-quantifmble social and environment issues, and how to compare four bowls of rice in 1920 with three bowls of rice plus color coverage of international cricket in 1980. The conclusions were neither accepted nor popular. Analytically oriented people do not like ignorance, and prefer to move at least into a probabilistic mode, from which it is a short step to approximate, then presumed, certainty.
False Measurements-How to Ensure a Perfect Concrete Mix Every Time
Any measurement may be wrong, and techniques exist to safeguard against genuine errors and random events. But it is not only in quantum mechanics that links exist between observers and experimental results.
In a recent large construction project, observations of concrete slump tests (the amount by which a moulded cone of wet concrete compresses when left freestanding) indicates that extraordinary consistency was being obtained in the results, and by implication the concrete mix. On checking, it was found that the mould was undersize to precisely the amount needed to indicate a perfect mix. This helped the checker (no bad news to report); the mixer (no rejected samples); the contractor (smooth progress of work); and the construction supervisorj (lots of records of successful tests).
The Cosy World of Models-The Complexity of Reality, and the Collapse ofthe Strawberry Market
Modelling is intellectually demanding, but at least we have control of our environment. We set the rules, define the relationships, specify the indicators, and activate the perturbation to be examined, or the objective to be fulfilled.
But our models are only as aware as we an?: if we have never experienced a pest attack, or an unexpected delivery of PL480 wheat, our model will not face such problems either, and our simulated farmers will make their simulated decisions in ignorance of such threats. That their decisions may vary from those of the real farmers should therefore come as no surprise, and indeed should be a cause for concern at our own ignorance, not theirs.
Most of us will have built linear programming models that predict every fanner will grow strawbemes-the best use of available resources. The process of "calibrating" the model to satisfactorily
d
f
I
16

predict the present is daunting as one realizes that models with thousands of constraints have failed to
under vegetables, for example-which are intellectually dishonest since they act as a proxy for many other constraints which could be captured in the modelling framework. More wonyingly, due to their inappropriate formulation, such constraints disguise "real" results as we move towards analysis of new situations (better water management, for example) that might actually allow a relaxation of the observed limit-and the production of more strawberries.
. meet this basic challenge. The solution all too often is "flexibility" constraints-no more than 10 percent
.
DSS without Rules
Decision support systems by definition can only exist where objectives have been defined (use less water), or targets specified (deliver Xm3/ha). In the absence of such targets it is hard (impossible?) to formulate a DSS.
Many irrigation systems run without formal rules ortargets. and indeed where such targets nominally exist, they may be ignored. While this situation may limit the application of DSS, the discipline which DSS requires in translating rules and procedures into mathematical formulations will undoubtedly be an important benefi of the approach.
Who is Deciding What for Whom: If You are Out of Work the Unemployment Rate is 100 Percent
Wriers on irrigation have noted that the various actors in the sector (state and national governments, irrigation and agricultural departments, system managers, farmer organizations, individual farmers, etc.) have differing sets of objectives-some of which are complementary, and others conflicting. The formulation of DSS requires careful attention to such issues, An "enhanced" decision for one group may be disaster for another-for example, if water to one area is cut off to ensure maturity of the crop in another area which is chosen for its social backwardness. This is not to say that such decisions are wrong, or do not need to be made. But the mechanism underlying the decision must be clearly elaborated in the DSS, and the priorities underlying weightings subjected to careful review from the perspectives of all effected parties.
COMPLEX CONCERNS
The problems set out above are relatively simple. No doubt all the approaches we shall be discussing embody clarity of purpose, precise information accurately recorded and realistic model formulations, in the contekt of clearly specified rules and properly weighted concerns. Other problems seem leSS tractable.
17

Static and Dynamic Responses to Enhanced Decision Making
Irrigation systems are complex living organizations and as such respond to their environment in sophisticated ways. Assuming the problems noted above are resolved, and we have at least a clear indicator for "enhancement"-say gross project value of production--what kind of responses can we expect?
First. we should hope for a simple shim along the existing production function-more yield per unit of input (land, water labor, or whatever) from the existing technology. But we know that fanners are rarely behaving "rationally" in relation to the existing technological options-planting too late, applying too l i l e fertilizer, not weeding optimally, etc. This gives cause for concern even in respect of the static response. Perhaps the farmers will follow a completely different path as they perceive a changed environment.
The dynamic response-a shifl of the production function-is even more difficult to predict and contains more worrying uncertainties. Note for example the case of the Pakistani system of canal rostering and warabandka completely mechanistic and transparent approach to canal operation.
A combination of rainfall and unexpected shortages may lead to a situation where one canal group has clearly suffered in relation to other groups, and reallocating water to them would appear rational and equitable. Such an action might have unpredictable effects on the future response of fanners to the system. Irrigation exists to protect against uncertainty, and the (crude) certainty embodied in the warabandi system has led to many sophisticated responses on the part of the farmers: planting larger areas than can be fully irrigated to maximize beneffis from rainfall, cropping mixes of water sensitive and water insensitive crops that directly mirror the expectations of different irrigation availability, and field technologies to encourage deeper rooting in the early growth stages. These important techniques are a response to a known system, and indeed have not developed in systems with higher levels of water availability, but less transparent systems of allocation. DSS which are viewed by fanners as unfathomable black boxes risk losing all that innovation.
Lessons from Neural Networks
The range of DSS is huge. The Romans watched the sky to see whether birds would appear first from the "sinister lefl-a sign of bad luck. Modem neural networks observe and leam from humans. In between are improved measuring and reporting systems (management information systems) which to the extent they interpret and present processed data, increasingly occupy a grey area between management information systems and decision support systems.
Recent experiences from neural networks present new opportunities. or new threats, depending on the interpretation. It was reported in a recent New Scientist that neural networks were being used to identify and classify ancient stone artefacts. Slowly the performance of the neural system improved, and eventually surpassed that of the experts in speed and accuracy. The experts were unable to figure out how the neural networks performed this feat-apparently the system identified variables which the humans were either not using or were using subconsciously. while this holds great promise for DSS in one sense, it perhaps casts doubt on our human ability to provide an appropriate counterpoint (as system operators, planners, constructors. and farmers) to the artificial expert in charge.
d
d
i
i i
1 i
18

.
. CONCLUSIONS . The modern capacity to collect, distribute and analyze large volumes of data presents irrigation managers with opportunities to improve the performance of their systems, subject to a number of constraints. When we are clear as to the quality of the data, the appropriateness of the analysis, and the location of the goals we are seeking, digital processing is indeed a valuable additional tool. Such situations will mostly occur when systems are operating close to an identified constraint: schedules need to be calculated more quickly or precisely; inaccurate gate operations result in hydraulic instability, etc. Where constraints to better operation are not well identified, DSS may have little to offer, and indeed may prove misleading.
Particular care is needed in two areas. First, irrigation performance is the result of dynamic interaction between system operation and farmer response: Our understanding of what affects farmer response is limited. Second, many "rules of thumb" embody the knowledge of generations. Translating this into digital black boxes requires that we be able to fully articulate that knowledge.
19
.
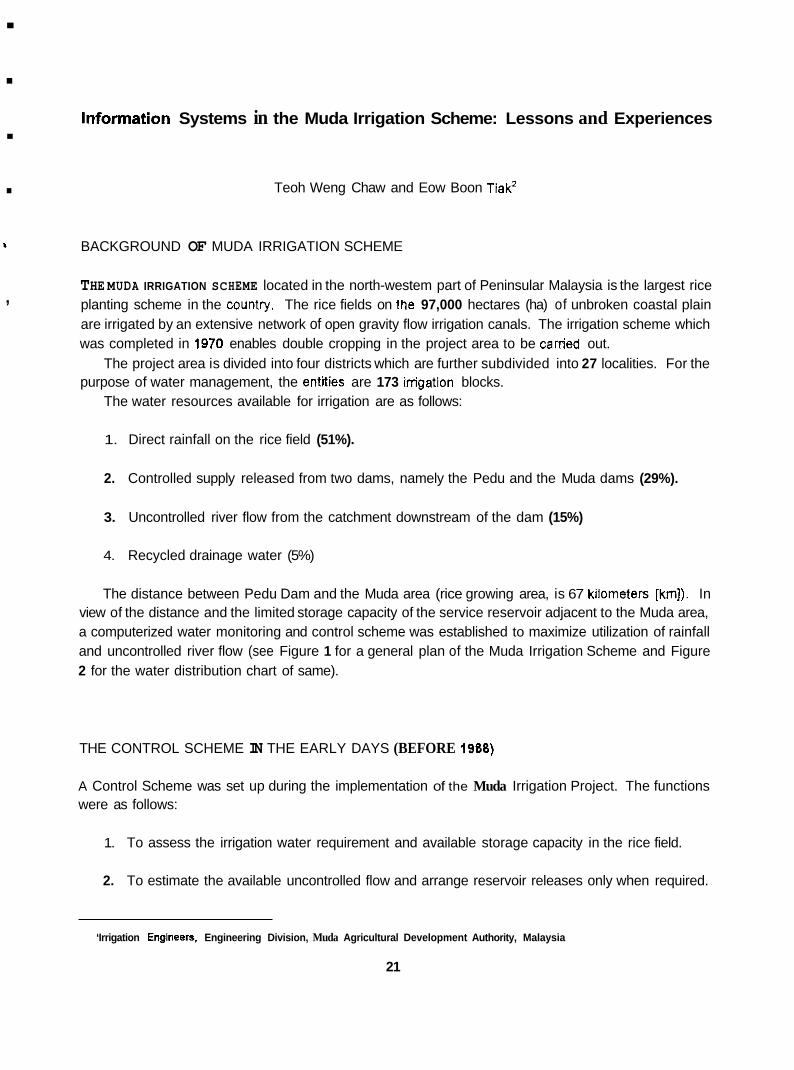
. Information Systems in the Muda Irrigation Scheme: Lessons and Experiences .
. Teoh Weng Chaw and Eow Boon Tiakz
BACKGROUND OF MUDA IRRIGATION SCHEME
THE MUDA IRRIGATION SCHEME located in the north-westem part of Peninsular Malaysia is the largest rice planting scheme in the countfy. The rice fields on the 97,000 hectares (ha) of unbroken coastal plain are irrigated by an extensive network of open gravity flow irrigation canals. The irrigation scheme which was completed in 1970 enables double cropping in the project area to be carried out.
The project area is divided into four districts which are further subdivided into 27 localities. For the purpose of water management, the entities are 173 irrigation blocks.
The water resources available for irrigation are as follows:
1. Direct rainfall on the rice field (51%).
2. Controlled supply released from two dams, namely the Pedu and the Muda dams (29%).
3. Uncontrolled river flow from the catchment downstream of the dam (15%)
4. Recycled drainage water (5%)
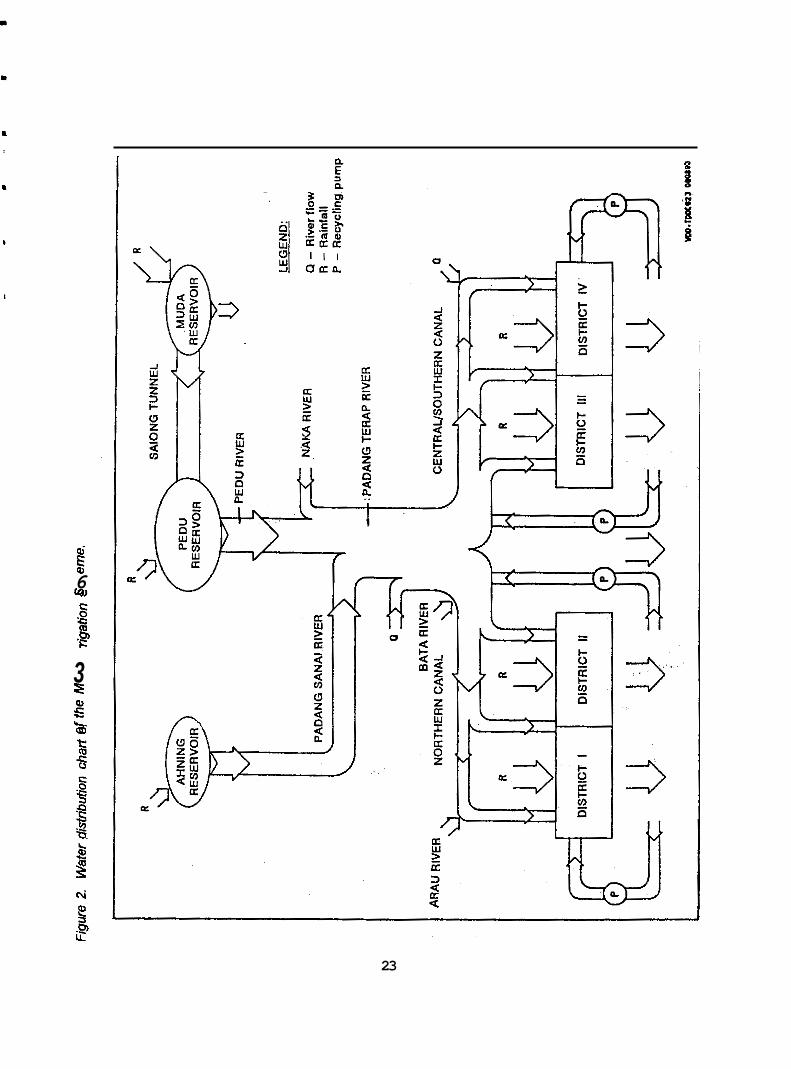
The distance between Pedu Dam and the Muda area (rice growing area, is 67 kilometers [km]). In view of the distance and the limited storage capacity of the service reservoir adjacent to the Muda area, a computerized water monitoring and control scheme was established to maximize utilization of rainfall and uncontrolled river flow (see Figure 1 for a general plan of the Muda Irrigation Scheme and Figure 2 for the water distribution chart of same).
,
THE CONTROL SCHEME IN THE EARLY DAYS (BEFORE 1388)
A Control Scheme was set up during the implementation of the Muda Irrigation Project. The functions were as follows:
1. To assess the irrigation water requirement and available storage capacity in the rice field.
2. To estimate the available uncontrolled flow and arrange reservoir releases only when required.
‘Irrigation Englneers. Engineering Division, Muda Agricultural Development Authority, Malaysia
21

22
d E 6 v)
3 T c c 0
23

3. To arrange the distribution of water to the imgation blocks.
4. To keep those responsible informed of the water situation throughout the Muda area.
The Hardware of the Control Scheme
The hardware of the scheme consisted of a telemetry network monitoring discharge from the Pedu Dam, rivers and main canals; a telex system for communication from the districts regarding irrigation demand and a 16 kilobytes IBM 11/30 computer for the computation of demand.
The status of water levels and gate setting of the main regulators were scanned hourly from the Control Center located at the Headquarters through the telemetry system. The release from the Pedu Dam, the water levels in the main rivers and the water levels and gate settings of the main regulators were displayed on a mimic control panel for monitoring in the Control Center.
The four districts in the Muda area submitted daily field condition data reports to the Control Center via the teleprinter systems provided after the irrigation staff had inspected and assessed the situation at the relevant rice plots. Each district also sent in an average daily rainfall value. The Control Center then fed in the relevant data from paper tape into a Data Processing Unit which evaluated and updated the information received. The Control Center also received stream flow data from the telemetry river stations and water levels, and gate openings and discharge data from the telemetry outstations at the main regulators along the primary canals. The water requirement for rice fields was computed strictly based on the reported water depth status-"more, enough, less." After processing the water requirement of the rice fields, it then arranged for the release of water from Pedu Dam if necessary and at the same time allocated the required discharge to each secondary offtake. The Control Center operated the main regulators and offtakes for bulk deliveries to the districts which in turn operated all offtakes of the distributaries (secondary canals), feeder pipes and other imgation control structures.
Each district was given the authority to redistribute the water given according to the situation and condition of the rice fields or distributaries at that time. The Senior Control Engineer was responsible to vet the printout by the computer and was empowered to override any instruction given by the computer, if necessav.
For effective communication, the irrigation field staff at the districts and the Control Center were given VHF communication equipment. This had greatly facilitated the operation of the irrigation system as well as flood routing and warning of operations when most of the landlines were damaged by fallen tree branches, etc.
The Major Drawbacks of the Old Control Scheme
1. The computation of water demand based on observation of the water depth in the field which was classified as "less", "enough or "more" and the rate of supply was given according to the status of water depth irrespective of cultural practice and the stage of growth of rice. Rainfall data were not used in the calculation of water demand. Instead, the observation of water depth in the field was thought adequate. These led to inaccuracies and often, overassessment of
24
.
.
. water demand occurred as the field staff would often report "less," especially when they were under pressure from the farmers.
2. The telemetry landlines employed in the Control Scheme were subjected to constant damage, lightning surges and interference, resulting in either complete breakdown or corrupted data being transmitted to the Control Center. The system as a whole was so technically advanced and delicate at that time that there was a lack of competent backup service in the region, to enable the effective maintenance of these sophisticated equipment. Hence, the telemetry system was very expensive to maintain and hardly functioned as a total system.
3. No feedback of flow from each distributary canal to the Control Center was made. The Constant Head Orifice (CHO) though capable of measuring flow rate, was only used to set the allocated flow for the day. Hence, the Control Center was not aware of how much irrigation water had been supplied to the irrigation blocks.
4. There was lack of participation of field staff in the scheme as their only job was to report rice field water depth status.
5. The Control Scheme did not have a feedback and evaluation system for both the field staff and the staff at the Control Center.
THE PRESENT WATER MANAGEMENT AND CONTROL SCHEME (AFTER 1988)
The present scheme is called the Water Management and Control Scheme (WMCS) as it is thought that the scheme's objective is not merely to control the flow of water but also, more importantly, to establish a system whereby, monitoring, control, management and evaluation of the water resources utilization in the Muda Scheme can be effectively and efficiently carried out.
In developing the present scheme, we took cognizance of the reasons for the shortfall of the previous scheme and hence were pragmatic in our goals. The tremendous advances in computer and telecommunication technology which made possible voluminous data to be collected, transmitled and processed speedily has definitely made the planning of the scheme a less formidable task. Basically, an Information System which collects, transmits, processes and analyzes the various water management data forms the backbone of the WMCS.
Hardware Setup
Telemetric Hydrological Network
A new Telemetric Hydrological Network which employs wireless transmission has been installed to replace the landline telemetry system. It consists of the following:
25

1. Sixty one rainfall stations evenly distributed over the whole Muda area and also the dam catchment areas. In addition, 6 rainfall-cum-water level stations were Installed at strategic locations in the major tributaries to the project area. All these stations are equipped with automatic recorders and telemetry slave controllers.
2. A Telemetry Master Controller in the Control Center at the Headquarters enables the remote stations mentioned in (1) above to be scanned.
3. A Repeater Station to relay data between the telemetry master and slgve controllers.
4. A data retrievingltransfemng system to transfer data from the master controller to the mainframe computer.
This telemetry system has enabled MADA (Muda Agricultural Development Authority) to acquire real- time rainfall data and uncontrolled flow data. Immediate action, if necessary, could then be taken to adjust the dam discharge, taking into consideration the available uncontrolled flow and the rainfall distribution pattern. Flood routing is also effectively carried out with the available real-time flood data from the telemetry system.
VHF Voice Channels
Three voice channels are leased from the Telecom Department. There are 104 VHF transceivers installed at the locality offices, district offices and major control structures throughout the project area and the Control Center. These voice channels enable effective communication between the irrigation field staff at the districts and the Control Center.
Mainframe Computer
A Fujisu 340-R mainframe computer is situated in the Headquarters and linked to dummy terminals in the district offices by modems. This setup enables more efficient communication of field data and the sending of daily water management reports than the previous punch-card type of telex system.
Together with the purchase of the computer, MADA also leased a Statistical Analysis System (SAS) and a General Purpose Contouring Program (GPCP) which help a great deal in producing a versatile water management system.
Major Processes
Data Acquisition
Water management is based on a reasonably accurate water balance model. This requires detailed field data such as the available water resources (rainfall, uncontrolled flow); crop demand (agronomic practice.
26

.
. growth stage, Evapotranspiration) and feedback of actual irrigation supply (CHO discharge, pumping).
management and for the control scheme to be operationaliied We have taken another step forward from the old “less-enough-more” operational rule.
Data Transmission
I The various types of data collected are as outlined in Table 1, These data are essential for good water
I
There are three main modes of data transmission from the field to the Control Center in the Headquarters:
a. The telemetly system which transmits rainfall and water level data in the form of radio signals from the telemetric stations to the Control Center.
b. The VHF telecommunication system is used by the field staff to transmit water management data to the district offices or directly to the Control Center.
c. The computer operation staff in the district offices key in data obtained from the field staff at the dummy terminals to the Control Center.
Data Processing and Decision Making
a. This process is principally carried out by the mainframe computer at the Control Center where the raw data fed back from the field are processed into appropriate parameters for the water balance model. The output from the model are the discharge to be allocated to each irrigation block and subsequently, the summation of the irrigation requirement for the project area.
b. The actual discharges of the previous day are also calculated and are used to analyze the performance of the irrigation system.
c. Printouts of daily, weekly, monthly and seasonal reports of the above results are produced.
d. Daily instructions to set the control structures (CHO offtakes, main regulators, pump stations and dam release) according to the revised allocated discharge are given to the field staff via the VHF voice channels and the computer mentioned in the previous section.
e. The main objective of the water management program is to optimize the water resource available to the scheme by maximizing the effectiveness of rainfall and minimizing water released from the dam.
These major processes are summarized in the flow chart in Figure 3.
27

Data collector Types of data
~~
Line Ooerator
Frequency of collection Purpose in water balance model
CHO discharge Field water depth Cropping activities
Three times a day Once a week Once a week
To compute irrigation supply to an irrigation block As a criterion whether to supply water to an irrigation block To determine the crop water requirement (growth stage and cultural practices), and planning of next crop
~ ~ r
Data Reader Manual rainfall reading Daily Manual W.L. reading Daily Manual E-pan reading Daily
Telemetric Station Tele. rainfall reading Daily Tele. W.L. reading Daily
Main Regulator Operator U/S water level Three times a day D/S water level Gate opening
No. of pump running
Three times a day Three times a day
Major Recycling Pump Three times a day Operator Hr. o f pumping Three times a day
Notes: CHO = Constant Head Orifice U/s = Upstream D/s = Downstmm. W.L. = Water level. Hr. = Hour@). Tele. = Telemetric.
To compute effective rainfall to an irrigation block To compute uncontrolled river flow using stage-discharge Curve To compute the evapotranspiration (ET=k.EP)
To compute effectiie rainfall to an irrigation block To compute uncontrolled river flow using stage-discharge curve
) ) To compute discharge through a regulator for the previous ) day and to compute new gate setting
) To compute irrigation water supplied by recycling pump
~~~ ~ ~
Dam Technician W.L. in reservoir Dam release (if any)
Daily Daily
To compute resewoir storage using stage-volume curve To meet the demand that cannot be fulfilled by other sources

Figure 3. Flow chart of infomation system in Muda.
Line Operator Data Reader Telemetric Station CHO discharge
Field m!er depth Water lml Water level Croppinp acUVnies E-pan
Locality Office
CHO ofttake setting
District Office Terminal I
1 Data Darn discharge aquisltlon
Dam release
I Actual supply for record and future analysis
0 thru' regulator, etc.
Gate seniip Pumplng required CHO drchame / Cumulatiie depth supptiid I I
I 1 -
I
Master Tele. Controller
I I Retrieve and Tnnsler
PC - Mainframe
I
Mainframe computer
Field dala tranrmlnian
Pmefllng and declslon making
Tnnrminion at Instruction
VHF
Regulator Operator Record Pump Opwatw Darn Technician
1- Notes: CHO ='Canstant Head Orifice. W.L. =Water level. U/S = Upstream. D/S = Downstream. Hr. = Hour@). VHF = Very high frequency. PC = Personal computer.

Some Problems in the Present Information System
1. The radio channels which are leased from the Telecom Department sometimes corrupt the telemetric data and interrupt the VHF voice communication. Preliminary findings show that it is due to the aged repeater station. Manual reading of the rainfall and water level data parallel to the telemetry system is therefore still required to avoid loss of valuable hydrological data, should the telemetric data be corrupted.
2. The E-pan data are still collected manually. It means that the hydrological stations concerned still need to be manned.
3. The present mainframe computer used for the water management program is outdated and not user friendly.
4. The WMCS computer program also needs updating due to changes in cultural practices.
5. There are weaknesses in the database management. Beside the major types of data collected for the WMCS. there are also miscellaneous data collected arising from specific needs. The various types of data collected are not very well organized and needs quite a bit of effort to retrieve for further analysis. Furthermore, there is no link to the agronomic data collected by the Agriculture Division.
6. There are no performance evaluation tools in the WMCS, except computing the overall irrigation efficiency at the project level using the actual supply and allocated supply data at the end of the season.
FUTURE DEVELOPMENT
As a remedial action to the problems outlined in the above section, the following suggestions to upgrade and enhance the existing WMCS have been proposed:
1, Install own repeater station to overcome the problem of unreliable transmission of telemetric data via the leased radio channels. If proven reliable afler a period of observation, the manual reading of rainfall and water levels for all the telemetric stations can be discontinued.
Replace the manual E-pan with automatic evaporation recorders which can be incorporated into the existing telemetry system. Together with suggestion 1 above. all the telemetry stations can then be fully automatic and need not be manned.
3. Upgrading of the telemetry system to collect additional operational data as follows:
30

4.
5.
a,
b.
C.
Operational data for the major regulators and tidal gates such as gate opening and upstream and downstream water levels. A pilot project for the remote control of gate operation is already being planned.
Monitoring and control data of the recycling pump stations.
Rainfall in the fringe areas and dam catchments for more accurate forecasting of the uncontrolled flow and dam inflow, respectively.
A new PC (personal computer) networking system based on the "open system" concept is proposed to replace the old mainframe computer. Two main applications with the new system will be the GIS application and the establishment of "distributed databases." The new system is more user friendly, hence would encourage greater parlicipation of the lower rung operational staff in the WMCS. The GIS package can be used to establish a graphic database and also a planning and monitoring tool for operational purposes.
The existing WMCS computer program will be modified or redeveloped using the new computing facilities. A database framework will also be set up to reorganize the existing data bank to enable easier retrieval in the future. The raw data would be processed into a readily usable format for analysis work later on.
CONCLUSION
Despite the problems outlined above, the information system plays an important role in ensuring the effective use of the scarce water resources in the Muda Irrigation Scheme for double cropping of rice to be carried out. This is through timely data feedback which enable prompt decision making, and hence a more effective WMCS. W#h further fine-tuning of the information system and the WMCS, it is hoped that a more efficient usage of water could be achieved in the future.
A lesson we learn from the evolution of the WMCS is that in this world where new technologies emerge every day, it is essential for any development work to provide for future expansion and upgrading, othervvise the entire system will be rendered obsolete in a very short time and expensive remedial or upgrading works would be required. Daniel Burrus in his book Techno Trends (1993) remarks, "When it works, it's obsolete!" It is therefore a dynamic process to keep pace with the fast- moving technology.
31

References
Burrus, Daniel. 1993. Techno trends. New York, USA: Harper Business.
Teoh. W.C. and Chua., T.S. 1989. Irrigation management practices in MADA. Unpublished paper presented at Jabafan Parit Dan Taliair, Malaysia, Di Ming Court, Port Dickson. 2 to 5 April 1989.
32

Study on the Use of Computer Models in improving the Operation and Management of Irrigation Systems in Sri Lanka
B.M.S. Samarasekera. G.G.A. Godaliyadde, H.M. Jayathilake and U.S. Wijesekera'
IN MY KiNGDoM are many rice fields cultivated by means ofrain water, but few indeed are those which are cultivated by means of perennial streams and great tanks. By rocks, and by many thick forests, by great marshes is the land covered. In such a country let not even a small quantity of wafer obtained by rain, go to the sea, without benefitting man. Rice fields should be fomed in every place, excluding those only that produce gems, gold and other precious things.
King Parakramabahu I (1 153-1 186) (Mahavamsa)
BACKGROUND
On 15 and 16 July 1993, the Irrigation Research Management Unit (IRMU) and the Irrigation Training Institute (ITI, Galgamuwa) of the Sri Lankan Irrigation Department collaborated in organizing a workshop on "The Use of Computer Operated Models as Decision Support Tools in Operation and Management of Irrigation Systems: Sri Lankan Experience" at the Irrigation Training Institute, Galgamuwa. Representatives from the Irrigation Department (ID), Irrigation Training Institute (ITI), National Irrigation Rehabilitation Project (NIRP). International Irrigation Management Institute (IIMI), Irrigation Research Management Unit (IRMU) and the Mahaweli Economic Agency (MEA) attended this workshop.
At the workshop, several computer-operated models used or now in use in different irrigation systems were presented and reviewed. It appeared that all the computer models available at present satisfy different data processing requirements with a varying level of sophistication, i.e., from simple spread sheet application to advanced hydraulic simulation. The first successful attempt to use a computer model for irrigation was reported from the Gal Oya Irrigation System in 1984. During the last decade many models have been used in different schemes with a varying degree of success. In general, all the participants accepted that the use of computer tools to improve the performance of irrigation systems is promising.
The workshop recommended a number of follow up actions to disseminate the available technology to other irrigation systems and to try out other innovations. The proceedings of the workshop are now available at the Irrigation Department (Irrigation Department I 993).4
~~ ~ ~
%eputy Directors and Chief Resident Engineer, respectidy, lmgation Department, Colombo. Sri L a n k
'The Use of Computer Operated Models as Decision Support Toois in Operation and Management of Mgation Systems: Sri Lankan Experience. Proceedings of the Workshop held at the Irrigation Training Institute in Gaigamuwa, 15-16 July 1993.
33
As a result of the workshop. a meeting was held on 17 August 1993 by the IRMU to discuss a work plan for implementing the recommendations of the workshop. At this meeting a decision was made to conduct a pilot study using selected computer models (preferably locally developed) to test the feasibility of using them for operation and management of irrigation systems more efticiently.
CONTEXT
At present, in many irrigation systems in Sri Lanka the productivity of water can be improved. This gap in productivity can be attributed to the suboptimal use of irrigation water due to many technical, social and economic reasons. The less efficient conventional methods used for allocating, scheduling and distributing water from the source to farmers’ fields are the most important among the main technical constraints paving the way for this situation.
The use of computer models in Sri Lanka for irrigation water management was begun in 1984 in the Gal Oya Irrigation System. Since then, a number of models have been used in different schemes mainly where rehabiliation and improvement projects were undertaken. In some cases the use of computer models was attempted by individuals because of their own interest or because of the availability of resources, both financial and human, for this type of activity. However, results of most of these attempts are not well documented and only a few publications are available.
The Gal Oya model has been mainly used in the Lefl Bank of the Gal Oya Irrigation System since 1984 for system operation and water management in a cultivated area of about 16,000 hectare (ha). The model computes irrigation water requirements at each off-take level, based on soil crop water demands. It is also capable of computing the diversion requirement at each key point taking into account the off-take requirements and canal losses. The model has been used for irrigation scheduling and has eliminated the difficulty of manual computation of water allocation for this large irrigation system. The model helps to achieve smooth operation of the system throughout the cultivation season and increases the confcience of the farmers as far as the reliability of the supply is concerned. The main findings derived from the Gal Oya experience are as follows:5
1. For large systems, the use of a computer for system operation is effective
2. The need and effectiveness of computer models are more significant in water shortage situations and water short systems.
3. The use of a computer-operated model has helped to guide system operation and eliminate the large operational water losses caused by ad hoc water management practices.
‘Godaliadde. G.G.A. 1%. Use of mmputer operated models as decision support took in operation and management of irrigation systems: Gaioya Experience. Paper presented at the Workshop on the Use of Computer Owrated Modab as Decision Suppon Tools in Operation and Management of Irrigation Systems: Sii Lankan Experience. 15-16 July 1993.
34

.
. In the Kirindi Oya Irrigation System, a scheduling model' developed by ID has been used since
introduced along with a comprehensive monitoring network. The main findings derived from the Kirindi Oya experience are as follows:
. 1987. More recently (1991), a management information system package'developed by IlMl and ID was
1. Standard packages (LOTUS 123, dbase Ill+) can be effective platforms for model developments.
2. A good monitoring network can be implemented by ID at a reasonable cost. A key role was played by messengers carrying data ftom the field to the manager's office.
3. The interventions had a positive impact on staff accountability. water duties and relationships between ID and farmers.
Experiences of the other attempts of the use of computer models in Hakwatuna Oya, Kantalai, Polonnaruwa Irrigation Systems Management Project, Sri Lanka ((ISMP]) and Uda Walawe (MEA) are available in detail in the workshop proceedings.
A significant number of officers of ID and MEA have been trained in this field both locally and overseas, and there is an increased demand from system managers to apply these new techniques to increase the efficiency and performance of the irrigation systems they manage.
Even though there are successful results available since 1984 concerning the use of computers for improved water management, the diffusion of this technology to other systems has not taken place in general. It is expected that in the future. IRMU can play the role of facilitator by influencing policy makers and disseminating technologies. IRMU. through its research program, can help in evaluating the models used, in promoting the testing of new models and in selecting the appropriate and cost-effective models usable by the implementing agencies.
THE ONGOING STUDY IN SRI LANKA
Rationale
The problems raised by irrigation water management are relatively well-known and various alternative solutions and tools can be envisaged to assist system managers. The use of personal computers for this purpose can bring significant improvements in performance. The rapid expansion of the modern computer industry and the availability of a wide range of off-the-shelf software packages provide
'Jayasundara. B.K. 1993. Appticalon 01 computer models on water management in the kirindi oya project. Paper presented at the Workshop on the Use of Computer Operated Modeis as Decision Support Tools in Operation and Maintenance of Irrigation Systems: Sri Lanbn Experience. 15-16 July 1993.
'Rey, J.; Hemakurnara. M.: Mahanmjah. S. and Junald, H.M. 1993. Introduction of monitoring activities at the main canal level. Working Paper No. 23. Colombo: International inigation Management Institute.
35

tremendous potential for using personal computers. This technology can now be introduced at an affordable cost and is widely acceptable to the managers of irrigation systems.
It is now a realistic vision to consider that each Sri Lankan irrigation engineer in charge of a few irrigation systems in a division will, in the near future, handle most of his technical, administrative and financial tasks with the support of a personal computer.
Objectives
1. Assist the system managers in some selected pilot irrigation systems to introduce computerized decision support systems and to monitor the consequences of introducing such a new technology.
2. Based on pilot studies, develop and test a methodology and training modules for installing data collection networks with the view of establishing computerized decision support tools for the system managers.
3. Based on pilot studies, test existing/develop appropriate generic computerized decision support tools for seasonal planning, scheduling and system operation, develop training modules and make recommendations for dissemination.
Components
The study includes the following principal components:
Preliminary Study
Assist the management at each of the selected pilot systems to identi i the minimal set of data required for better water management decisions. This activity is based primarily on field observations and studying system plans, issue trees, etc.
Establishment of Measurement Network
In the selected systems, prioritize and undertake the essential improvements in existing structures for the purpose of measurement and when necessary, incorporate simple and cost-effective measuring devices.
Operationalization of Data Collection Process
In the selected systems, develop formats, procedures and mechanisms for data collection, transmission and preliminary processing. Set up mechanisms for evaluating the performance of the systems.
36

.
. Introduction of Computer Models
Study the existing computer tools and modify them if necessary. and/or develop new tools in the form of generic models. Such models will be developed as decision support tools for seasonal planning,
. , scheduling and system operation and will be field tested in the selected schemes,
Synthesis and Dissemination L
Conduct meetings and workshops for deriving generic methods, tools and recommendations from the pilot studies.
Training
Initial and ongoing training of the personnel involved in the study will be undertaken, depending on the needs.
INTERIM RESULTS
The study is progressing on schedule in three pilot schemes selected on the basis of the type of scheme, i.e., whether diversion or reservoir, and the size. The project sites are as follows:
1. Rajangana System-a major reservoir scheme
2. Buttala System-a medium diversion scheme.
3. Badagiriya System-a medium reservoir scheme.
Measurement networks have been established and a data collection process has been operationalized to a reasonaMy satisfactory level in these project sites. An important feature in the measurement network is the utilization of the existing structures for measurement af&er calibration. It has been found that most of the time, the predicted behavior by structure formula holds good with marginal deviations in the discharge coefficient.
Initial results indicate that there is inequity and overall overuse of water in general, and hence there is potential for improvement.
A database for IMlS and SIC models has been created in one system while in the other two this work is in progress. Other locally developed models are to be tried for water scheduling during this season.
37

INSTITUTIONAL ASPECTS
It has been realized that the performance of most of the irrigation systems in terms of equity, efficiency and productivity are below their potential. In addition, there is also an urgent need to increase the present production potential of them, as not much new land will be available to put under irrigation to meet the ever increasing demand for food.
Hence, the introduction of improved management practices and new technology has become very essential at this juncture if we are to solve at least a part of the problem.
To face the challenges ahead in this regard, ID is currently undergoing major structural changes placing more emphasis now on intensive irrigation management. The institutional changes being implemented include among other things: the creation of separate subdepartments for Irrigation Management and Human Resources Development, the establishment of IRMU, the formation of Irrigation Management Cells (IMAC) at regional level, and the strengthening of the Irrigation Training Institute (ITI).
The main objective of IRMU established in 1992 supported by the ongoing National Irrigation Rehabilitation Project (NIRP), is to identify research needs on a priority basis: carry out, collaborate or contraci for research: evaluate results; and adopt them for implementation. Technical assistance will initially be provided by IlMl for the formation and functioning of the unit.
The IT1 will assist in disseminating and adopting the research results while some of the training staff too are actively involved in some selected research. Research findings which will help improve system performance will be implemented through the IMAC (Irrigation Management Cell) which is responsible for system management at the regional level.
38

.
.
. ITlS in Pakistan: Pakistan's Irrigation System
M.H. Siddiqi'
BACKGROUND
PAKISTAN Is THE land of the six rivers, namely, Sutlej, Beas, Ravi, Chenab, Jhelum and Indus. The five tributary riven converge into one single channel at Panjnad and ultimately join the lndus River near the southem tip of the Punjab Province. The lndus River flowing through the Province of Sindh ultimately discharges into the Arabian Sea. The rivers of Pakistan are snowfed and carry perennial discharges varying from a few thousand cusecs (cubic feet per second) in the winter to more than 100 thousand cusecs in the summer. The alluvial plains of Pakistan built by these six rivers are ideally suited for canal irrigation.
The total area of Pakistan is roughly 196 million acres. The total cultivated area is about 52 million acres, of which about 40 million acres are irrigated.
Agriculture is the main stay of Pakistan's economy. Agriculture produces most of the country's food, accounts for 26 percent of GDP (gross domestic product) and employs 54 percent of the labor force. Agriculture has also important linkages with other sectors of the economy. It is the source of raw material for major domestic industries, particularly those producing cotton-based products and accounts for 80 percent of the overall value of exports. It is also important because of its relationship to both poverty alleviation and private sector development. The chief input for assured agricultural productivity is water.
DEVELOPMENT OF IRRIGATION
Historically, irrigation in Pakistan was confined to small strips of land along the river banks. However, the first weir-controlled canal (Western Jamna Canal, off-taking from Jamna River at Tajewala Headworks in India) was completed and commissioned in 1825. Based on the successful experience of this canal, the network of canals in Pakistan was developed over about 100 years, progressively bringing more and more land under cultivation.
The existing canal network in Pakistan is a closely interconnected system with limited flexibility. The system comprises 43 main canal systems in the four provinces of Pakistan with an aggregated length of about 38,000 miles (60,000 km), delivering canal water to the cultivated lands through about 107,000 outlets. The system is designed as a gravity flow on run-of-the-river basis to support subsistence agriculture at a low designed cropping intensity of 50 to 75 percent. The system is also designed to
'Consultant to the Government of the Punjab. lmgation and Power Department. Pakistan.
39

sewe as large an area as possible and to beneffi as large a rural population as possible at low cost and staffing levels, and to ensure equitable distribution of canal water with minimum human interference.
OPERATIONAL CRITERIA
lndus Water Treaty
Prior to independence of Pakistan in August 1947, the available river supplies were distributed amongst the various canals by the various commissions and committees appointed by the then Brilish Government of India. However, after pariii in of the Indo-Pak Subcontinent in 1947 into independent and sovereign states of India and Pakistan, a serious dispute arose between the two countries regarding the distribution of the lndus Basin river waters. This dispute was resolved through the good offices of the World Bank after prolonged negotiations and the lndus Waters Treaty was signed between the two countries in September 1960. The Treaty inter alia provided that:
1. All the waters of the eastern rivers (Sutlej, Ravi and Beas) shall be available for the unrestricted use of India.
2. Pakistan shall receive all waters of the western rivers (lndus, Jhelum and Chenab) except for some specified uses from these rivers by India.
3. Pakistan shall construct suitable replacement works to meet requirements of its eastern river canals from the westem rivers by inter-river transfer, by constructing storage in order to offset the effect of assignment of three eastern rivers to India.
lndus Basin Replacement Works
As a consequence of the lndus Waters Treaty, water for the areas lying on the eastem rivers had to be carried from western rivers across the width of the Punjab Province. As a result, besides the remodelling of a number of existing works, an impressive number of replacement works were constructed to replace the supplies of the eastem rivers with waters of the westem rivers. Two dams, Tarbela on the river lndus and Mangla on the river Jhelum provided storage for the canal system. Also, six barrages and seven link canals were constructed to transfer supplies from the western to the eastem rivers. This was in addition to three link canals that had been conceived earlier. All these works were completed within a period of 10 years (1960-1970).
40

.
. Post-Treaty Arrangements
In the post-Treaty arrangements the canal systems in Pakistan were grouped into two zones for the purpose of regulation, namely Mangla command canals (or Jhelum Chenab Zone) and Tarbela command canals (or lndus Zone).
.
Mangla Command Canals (or Jhelum Chenab Zone)
A total number of 13 canals in the Punjab Province are located in this zone, covering a culturable command area of 13.34 million acres with an aggregate diversion capacity of 78,400 cusecs of water during kharif (summer).
Tarbela Command Canals (or lndus Zone)
Twenty eight canal systems were included in this zone to receive flow-cum-storage supplies from lndus and Kabul riven and TarbelaKhashma resewoirs. Two in the North-West Frontier Province, 11 in the Punjab and 15 in Sindh. The lndus Zone canals cover about 22 million acres of culturable command area and have an aggregate diversion capacity of about 181,000 cusecs of water during kharif.
APPORTIONMENT OF INDUS WATER ACCORD 1991
In the post-Treaty period, ad hoc arrangements were made by the Pakistan Government to distribute the available flow-cum-storage supply in the canals of the four provinces. Pending finalization of the apportionment of lndus waters, the provinces were not allowed to undertake any new canal irrigation schemes. Thus, the further development of canal irrigated agriculture in Pakistan remained suspended. Appreciating the need for early apportionment of the waters of the lndus River System the Government of Pakistan with the consensus of the four provinces approved the apportionment of the lndus waters in 1991.
This accord not only apportions the river water for the existing canal systems but it also distributes the surplus flood flows amongst the provinces for future development of irrigated agriculture. To fully utilize the share of flood flows, provinces are undertaking feasibility studies of new irrigation projects to bring about 0.60 million acres of new area under irrigation.
Regulation of Canals
The regulation of Pakistan's canals is planned for each crop season separately. i.e.. kharif crops or summer crops and rabi crops or winter crops. The forecast of anticipated availability both for the flow and storage supplied is prepared at the beginning of each crop season. Efforts are made to run all the channels according to full capacity. However. if the anticipated availabiliiy is less than the full capacity of canals, the channels are run according to or in proportion to the 10-daily allocation approved in the
41

Water Accord. The regulation is done on a ID-daily basis and the discharges are adjusted to remain within the sanctioned allocations/provincial shares.
The regulation program for each crop season and for all the canals is prepared on ID-daily basis in the Irrigation and Power Departments. These programs are notified to the public to facilitate the farmers to plan their sowing. The actual running of canals is monitored in the Central Regulation Directorate at provincial level where a proper Water Account of each canal system is prepared and maintained.
In a canal system the indents of supply required are placed by the Subdivisional Officer (SDO) of the tail end subdivision with the SDO ofthe upper subdivision, who, adding his own requirements, places his indents with the SDO of the next (upstream) subdivision until these indents reach the SDO incharge of the headworks. The supplies released in the channels from the headworks are in accordance with either these indents or with allocations made by the Central Regulation Directorate, whichever quantity is less. The Chief Engineer and the SDOs keep a strict watch on the regulation of supplies in their respective areas and immediately inform the Central Regulation Directorate at the provincial level if there are any variations in the supply over their indents or allocations.
The lndus River System Authority (IRSA) is established under the Water Accord to distribute the available river supplies to the various canal systems in accordance with the Accord allocations and monitor the actual flows in each canal system. An Advisory Committee comprising Secretaries of the Irrigation and Agriculture Departments as well as WAPDA (Water and Power Development Authority, Pakistan) is constituted under the provisions of the Water Accord. This Advisory Committee normally meets twice a year before each crop season to advise IRSA regarding the distribution of the available river supplies and the operation of the storage reservoin. The Advisory Committee has also constituted a Subcommittee to hold monthly meetings to review the operation of canals and resolve any questions that may arise regarding the distribution of the available river supplies between the provinces. IRSA also maintains water accounts on 5-daily basis to ensure distribution of the available river supply strictly in accordance with the provisions of the Accord.
42

. Rules and Regulations in Pakistan and Review of Applications .
Ch. Muhammad Shafi'
INTRODUCTION
RIVER WATER is diverted by barrages and weirs into main canals and subsequently into branches, distributaries and minors. The water is delivered to the farmers through watercourses from the distribution system through !he outlets. The system is based on gravity and is supply based. WAPDA (Water and Power Development Authority, Pakistan) is responsible for the operation and maintenance (OBM) of resetvoirs. The 0BM of the rest of the canal system is the responsibility of the Irrigation Department (ID), and farmers are responsible for the maintenance of watercourses.
The Canal and Drainage Act of 1873 is the main law regulating the levy of water dues and the 0BM of !he channel system. The act was passed when irrigation in the area was in its infancy. It has been revised subsequently, and the latest revision was done in 1975. Superintending Engineers. Executive Engineers and Subdivisional Officers are vested with the power of canal officers. For discharging their functions as canal of icen they seek !he assistance of Commissioners, Deputy Commissioners as well as Collectors and Assistant Commissioners.
Besides the Canal Act, the Irrigation Department has prepared books on various subjects for the OBM of this large and unique system. Practices have been codified. The Manual of /miation Practice is the main book which documents the technical aspects of the system. The Revenue Manual is a book which contains instructions regarding the assessment procedure and the duties of the assessing staff.
DESIGN AND MAINTENANCE STANDARDS
Main and branch canals have mostly been designed on Lacey's silt theory with the concept of non-sitting. non-scouring velocity. Banks have been designed to cover hydraulic gradients of 1:4 to 1%. The width of the patrol (inspection) bank including dowel is kept at 25 feet with a free board of 3 feet. Similarly distributaries are also designed with Lacey's theory with a bank width of 4 to 8 feet, depending upon the discharge, with the provision of pushta for coverage of hydraulic gradient. Free board for distributaries and minors is 1.5 feet. The banks generally require strengthening after a period of 5 to 10 years and desining is also to be done in the tail portion periodically where the slopes are inadequate. In order to execute strengthening works and to maintain the inner section of the channel to the designed condition, funds are provided under the OBM grant. The following yardsticks have been approved by the Government during 1992 for maintenance funds for main canal branches, distributaries and minors.
'superintending Engineer. Bahawalnagar Circle. irrigation and Power Department, Bahawalnagar. Pakistan
43

Discharge upto 6,000 cusecs Rs 19,500 per mile Discharge upto 6,000 to 10,000 cusecs Rs 21,500 per mile Distributaries and minors Rs 7,200 per mile
Structures are also repaired out of the above yardstick of funds. In order to attend to minor operational problems, an establishment is provided on the channels to
perform day-to-day maintenance work. In main canals and branches one man is to look affer both banks of the channel for a two-mile length, and in case of distributaries one man looks after 6 miles of the channel. On non-perennial channels, the establishment on distributaries and minors is reduced to 50 percent during the winter, and in some of the cases the reduction is even 100 percent. A reach of the channel is specified to evely gang man individually to work on.
REGULATION AND DISTRIBUTION OF CANAL SUPPLIES
Use of Discharge Tables
Discharge tables are provided at every regulation site to work out the discharge from a gauge. Similarly, the discharges are to be reported to the head of the distributary. Usually enamelled gauges w l h division upto the first decimal of a foot is used. The modular fall is designed to work as a meter flume. Meter flumes are also provided where working head (potential head) is available at the start of the channels. In case no meter flume is available a discharge site is constructed in the open channel by pitching the bed and sides of the channel up to 150 feet so as to ensure a 100-feet straight run of the flow. On main regulators the gauge is located in a gauge well.
Indents
The Subdivisional Officer is the regulation officer of the Depariment. Every Subdivisional Officer works out the requirement of supply for the subdivision. The tail Subdivisional Officer wires his indent to the upper Subdivisional OPficer, and the upper Subdivisional Officer to the next Subdivisional Officer and so on, to the Subdivisional Officer Headworks of the canal. The indent should specify gauge and discharge at the indenting gauge together with the time when the indent should be met with, and sometimes, the raising schedule. The time lag is calculated at the rate of 3 miles an hour in main and branch canal, and at the rate of 2 miles an hour in distributaly. Regulation is a very important pati of the duty of the Irrigation Engineer. In case of accidents to canals, emergency indents are issued for reduction. The foremost duty of the officers and the regulation staff is to attend to such indents. The regulation staff and the signallers are supposed to attend to the telephone and telegraph instruments from 6 a.m. to 9 p.m.
44

. Rotational Program
During summer the supplies are ample and are generally sumcient for the running of distributaries to their requirement, but during winter the supplies fall short of the requirement. As such, the Irrigation Engineer has to resort to rotational running of channels. Rotational programs are prepared in each canal division and are circulated amongst cultivators and various departments concerned with agriculture. These programs are prepared for an &day subperiod on the understanding that the tail of the distributary system will run to full supply for at least 7 days so that each cultivator can get a supply during his turn because the turn of the cultivator changes every 7 days.
.
Annual Closure
Every year canals are closed during December-January for a period of 15 to 20 days for the examination of the structures and the carrying out of desilting works and minor repairs to the beds of structures. The annual closure dates are notified through the print as well as the electronic media. During closure each structure of a canal system is examined in detail. Sounding probing plans are prepared to monitor the condition of masonry works under water. Cross sections of the main canal and branches are obsewed at an interval of 1 mile so as to study the regime of the channel. Future works depend upon the data so checked during annual closure.
Handling of Breaches
As mentioned above, breaches and accidents to canal banks are handled by getting a reduction either from the headworks or passing the supply through an escape if available on the system. The breaches are closed with the help of farm machinery. In general. a breach is closed in the loop shape so that less earthwork is involved, thus avoiding scour pits. The loop is allowed to silt up and is straightened subsequently. In case of damage to crops and property compensation is admissible under the law.
Maintenance of Watercourse
The cultivators are responsible for the maintenance of watercourses themselves. In case of failure they are liable for the action of closure of their outlets for a period of 12 days.
45

Water Distribution to Cultivators
Outlets
Water to the cultivators is provided through a structure at the head of the watercourse which is called an outlet (turnout). The distributary. including outlet structures. is in the charge of a government or a public organization. The internal working of the watercourse is managed by the cultivators themselves. The outlets are designed to keep the discharge constant in the channel and to allow slight variation in the discharge when discharge in the channel is reduced. It is designed to work in high as well as low heads, some as low as 3 inches. The following types of outlets are used in the irrigation system:
Aajbsrab/e Proportional Module (APIW). This is an outlet which is being used where wh (working head) is ample. It is ffied with a machine which can be adjusted if more area is brought under the outlet. It is difficuit to tamper wfih as the orifice is located at the bottom of the operational channels. The discharge formula is Q = 7.3 B Y (H-V)lR where B equals the width of the orifice. Y equals the height of the orifice and H is the height of water above crest level. A fairly high wh is needed for working the outlet with modularity. A minimum modular head of 0.75 (H-Y) is needed to deliver the discharge according to design. A crest length of H + 1.25 is provided for this type of outlet.
Open Flume Outlets (OF). This outlet is used in the middle and tail portions of the channel where the wh is on average. The outlet is a simple broad-crested weir with crest length = 2H. The discharge formula Q = CB Hw is used for the designing of this outlet. The value of C, i.e., coefficient of discharge is kept from 2.9 to 3. A small wh which is 0.2H is needed to keep the outlet modular. In case of silting of the channel, the height of water above the crest level rises. A roof block is Wted with the height of 0.7H from the crest level of the outlet to check the excessive withdrawal of supply. This type of outlet is liked by the cultivators and is also used as tail clusters and above falls, so as to work as a safety device in case of excess in the channel due to closure of outlets or due to rainfall.
Scrafch/ey Outlets. This type of outlet is used where the wh is less. A discharge formula, Q = 6.4A (wh)’”, is used where the discharge is dependent on the wh of the outlet. A is the area of the orifice.
Pipe Outleis. This type of outlet is also used where wh is less. The discharge formula, Q = 6A (wh)’R is used to work out this size. This type of outlet is used to give supplies of a temporary nature, i.e.. reclamation of the growth of more food supplies.
Monitoring of Outlets
In order to watch the rise in water level and the functioning of the outlets, the observation of H and wh are periodically made and are entered in a register called the H-Register. The outlets which are nonmodular are substtuted with a new type suitable for the site. The H observations are helpful in planning silt clearance of the channels in the tail portion. On certain channels, module gauges are also provided so as to depict the sudden rise and fall of water supplies in the channel.
46

.
. Water Distribution
On the request of cultivators warabandi programs (water distribution programs) are prepared for individual outlets. This is done under Section 68 of the Canal Act by the Subdivisional Canal Officer or
equitable share afler a period of 7 days. The warabandi programs are changed every year with an offset of 12 hours so that a cultivator who has been getting his turn of water during night time during the current year would get his turn during the day time during the following year. The appeals against the orders of the Subdivisional Canal Officers are heard by the Divisional Canal Officers.
I the Deputy Collector. The warabandi are prepared for a 7-day period and each cultivator gets an
Theft of Water
An important issue in the distribution of canal water to cultivators is the prevention of unauthorized use of canal water or water thefl. There are a number of ways in which these practices are indulged in by the cultiiators, such as through cuts in channels, damage to outlets to increase their capacity. syphoning away water by use of rubber pipes and other similar malpractices. There is no doubt that these cases ought to be detected promptly. Special charges are levied under Sections 31 and 33 of the Canal Act by the Divisional Canal Officers of the area in which water is used in an unauthorized manner.
Changes in Chakbandies
Cases of the change of source of area from one outlet to another, the change of site of outlet, or the change of site of watercourse and the inclusion of new area into the culturable command (CCA) are the common factors which require changes in the cbakbandi ofthe outlet. The chakbandi cases are decided by the Executive Engineer (Divisional Canal Officer) under Section 20 of the Canal Act, and are subsequently confirmed or modifed by the Superintending Engineer (Superintending Canal Officer). The change of chakbandi requires a change in size of outlet if the increase or decrease of the area is more than 10 percent. The changes in the size of the outlet so needed are done at the expense of the cultivator.
Special Supplies
During summer, reclamation supplies are allowed in the areas where the salts need to be suppressed. Such supplies are run in addition to the normal supplies. The duration of such supplies is generally from 1 June to 30 September. In case surplus supplies are available in the river more food supplies are also run in the channels. These surplus food supplies are meant for areas which have not been provided with any kind of Irrigation facilities. Garden supplies to the extent of 2.5 percent of the total outlet capacity of a canal system are also allowed for the propagation of the growth of fruit trees. Initially, such garden supplies are exempted from assessment for a period of 4 to 5 years. In order to promote fish culture an area comprising of 24 acres of fish farm is also allowed for extra supplies on a canal system.
47

SERVICE CHARGES, BOOKING, MEASUREMENTS, ASSESSMENT AND RECOVERIES
Booking of the area cultivated by each cultivator is made at the start of a crop season. When the crop reaches its maturity the final measurements are made. The measurements are made by canal Patwaris (Irrigation Record Keepers). There are in-built systems to check Patwaris' work and a certain percentage of area has been specified for each canal system to be checked by the Si//adar (a Canal Officer who supervises the work of about ten Patwaris), the Deputy Collector, the Subdivisional Officer and the Executive Engineer. In order to ensure that the system of booking goes on properly, a staff officer, i.e., a Canal Collector in the office of the Chief Engineer also oversees revenue work in the field. At the end of each crop, a demand statement, i.e., a bill for the service chargeshater charges is prepared by the Deputy Collector and the Assessment Clerk. The demand statement is then submitted to each Tehsil (smallest administrative unit-a town and surrounding countryside) by the Executive EngineedDivisional Canal Officer. The Deputy CommissionedCollector and his staff are responsible for the recovely of the water charges from the cultivators. The actual recovery is made through the agency of Lambardars (Village Representatives who coordinate collection of water charges and liaise with government officials and villagers) who are provided remuneration charges of 6 percent each for collecting the amount and depositing it in the Government Treasury. The Lambardar is also required to help the Irrigation establishment in the booking process.
The following types of community services and irrigation facilities are exempted from water charges:
1. Filling of tanks in villages for drinking purposes of the villagers as well as cattle.
2. Making kacha (pise) bricks for use by the cultivators in building mud houses
3. The area which is brought under cukivation (during 6 harvests)
4. Gardens and trees, initially for a period of 4 to 5 years.
5. There is a tax holiday equal to 25 percent of the abiana (water rate, i.e.. rate charged for canal water supplied for the purpose of irrigation, also interpreted as the occupier's rate) if the supplies are augmented by the Cultivator with the private tubewell supplies.
6. Trees grown along the ridges of fields in villages and along village roads are free from water charges.
In case the crop does not reach its maturity or the yield is less than the scale fixed in the assessment of a district, the cultivator is granted a remission of water charges. Such remissions are granted by the Divisional Canal Officer. In case of calamity and crop diseases, such remissions are granted suo mot0 by the Department in collaboration with the Revenue Department.
The main idea behind the assessment system is that those areas are liable for assessment where the crop has reached its maturity and its yield is not less than the prescribed limit.
48

PENALTIES AND FINES
Section 70 of the Canal Act defines the offences together with the extent of punishment for the violation of rules and regulations. A maximum punishment of 3 months and a fine of Rs 200 is provided for the offenders. Subdivisional Officers of the Department have been given powers as Magistrates to try the cases falling under the Canal Act. For the theft of canal water there is a provision under the law for the imposition of special charges in addition to the penalty.
REVIEW OF APPLICATION
There is always room for improvement and so the Irrigation system and its laws and regulations require updating. For this purpose the Government of the Punjab has framed a high-level committee comprising the members of the Provincial Legislation and technocrats. All the rules and regulations relating to the improvement and updating of the Irrigation system will be reviewed by this committee. The following improvements in the system are likely to be considered by the committee.
Modernization of the Telecommunication System
The modernization of the present telegraphic communication system in the Irrigation and Power Department for the dissemination of information from higher to lower levels and vice versa has long since been felt to be of utmost necessity. The committee will also look into this matter and will give its recommendation to the Government for the replacement of this old system with a new wireless telecommunication system.
Discharge Observation Equipment
At present, the Irrigation and Power Department is using wooden floats for the measurement of velocity (discharge) of the channels. The current meters for the measurement of discharge are only being used at the headworks. The Department is going to facilitate its staff with the modem/latest equipment for the measurement of discharge such as digital current meters and pygmy current meters, water level recorders, echo sounders, etc.
Transport
The transport facilities in the Department in general are inadequate and being a very important organization its shortage has effected the efficiency of the Department. The issue will also be taken into account in the review meeting of the committee. It is hoped that in the coming years, with the approval
49

of the improvement suggestions for the Department, the problem will be tackled and better transport facilities will be available.
Breach Closing Squads
Most of the channels in the irrigation system of the PakistanlPunjab area are earthen in nature. Breaches occur in the channels off and on resulting in a lot of damage being caused to the property, in addition to the waste of valuable irrigation water and standing crops. To close the breaches within the shortest possible time is impossible without modern machinery and equipment.
Thus, the necessity of having breach closing squads equipped with modem machinery and tools like dozers, dumpers, tractors. etc., has been felt badly. The proposal in this respect is also under review and is likely to be sent to the Department in a few months.
In addition to these breach dosing squads the necessity of the construction of escapes in the irrigation system is also to be considered. These escapes, in addition to reducing the damage from breaches, would also help in the closing of breaches within the shortest possible time.
Lining of the Canal Systems
With the construction of reservoirs for irrigation water the supplies coming from these reservoirs are free of sediment and as a result clear water flows in the system. The weed growth has been observed in the channels to be resulting in inefficiency of the system and occurrence of operational problems in regulating supplies.
The Government of the Punjab Irrigation and Power Department is seriously working on a project which will include the lining of almost all the channels which will in addition to saving water will increase the efficiency of the Irrigation system, and better ensure the water supply to the tails of the channels.
50
The Application of Decision Support Systems to Pakistan's Irrigation Systems: Results of a Pilot Study in the Chishtian Subdivision
Zaigham Habib, Marcel Kuper,'' and Pierre-Olivier Malaterre"
THIS PAPER PRESENTS the scope and results of testing and implementing Decision Support System components in the Fordwah Canal System of the Chishtian Subdivision, located in South-East Punjab, Pakistan. The objectives of this activity, undertaken through a joint effort of the Punjab lnigation Department. CEMAGREF and IIMI, are twofold. First. it aims at implementing and evaluating different options for the improvement of irrigation operations (water allocation and delivery), impacting on the services delivered to users. At the same time, this activity provides an opportunity for the system manager" to update the managerial control and planning through an improved understanding of the system and a more frequent interaction and communication at field level.
To address the issues of operational water management and technical improvements with a full awareness of the existing management context, a careful examination of the existing situation was carried out. The extent and methods of the original manager-system interaction (information collection and communication) were studied. Also, the recent history of applications in this field was reviewed. A management intervention package is proposed that includes procedures to improve the monitoring, evaluation of allocation and distribution processes.
In the first section the background history is presented briefly, followed by a system analysis, using a management intervention package. Two tools are described: the IMlS (Irrigation Management Information System) is a database-oriented information system used for storage, processing and analysis of field data; while SIC (Simulation of Irrigation Canals) is a hydrodynamic model.
CONTEXT OF THE STUDY
A brief account of the traditional information system (data collection, storage and communication) is summarized in Table 1. The type and level of suggested procedures indicate that a good deal of permanent and daily data are supposed to be collected by the Irrigation Department staff. Following a straightfoward format, the procedures cover a wide range of information.
"Systems Analyst and Irrigation Engineer, IlMI.Pakistan. respectively
"lnigation Engineer, Centre National du Machinisme Agricole du Genie Rurale des Eaux et des Forets (CEMAGREF). Montpellier, France.
"The irrigation system at main canal and secondary levels is managed by the Punjab Irrigation and Power Department (PID).
51

Table 1. Traditional infomation management structure.
~ ~~ ~
Permanent and semi-penanent records
*
* * *
L-Section of canal and design drawings of structures Outlet register, showing outlet dimensions and discharge Cross-sections, yearly updated during canal closure Yearly maintenance estimates and drawings Rating tables of all on-line and off-line structures
Daily or weekly information
* Daily gauge register
* Field books of sub-engineers Daily patrolling by laborers
Field inspections by SDO and XEN
Communication setup II * Canal telegraph network
Telephones Direct reports of field staff to signaler (usually verbal)
Notes: SO0 = Subdivisional Omcer XEN = Executive Engineer
These data are preserved in registers and design sheets. The information collected by ID relates to canal and structure design. operation and maintenance. A good communication system was provided at the inception of the canal system, to transfer infonation from field to subdivisional and divisional offices, and vice versa. Today, this communication system no longer functions the way it was supposed to and is incapable of handling present day communication requirements.
Only recently, computers have been introduced to PID, where they are mainly used in central offices for documentation and report writing purposes. The use of computer tools for water distribution and management at field level is still non-existent. Only consultants and research organizations (e.g.. IIMI) have used standard soflware for data storage and analysis in Pakistan, and have developed computer packages for design and other studies. These limited experiences have not been transferred or adopted by the Irrigation department upon completion of projects. A list of computer tools that have been used in Pakistan is given in Table 2.
The present study aims to facilitate the transfer of modem technology to irrigation managers for routine tasks in the operation and maintenance of the irrigation system.
52

Table 2. Computer fools used in Pakistan.
Design and rehabilitation
CADIS (Computer-Aided Design for Irrigation Systems)--developed by a USAID (United States Agency for International Development) project and used by PID Sindh and LBOD consunants
* CADLIN-a package developed in BASIC language by the Design Oftice of PID Punjab
Design Soflware-(mostly a combination of LOTUS 123 and AUTOCAD) developed and used by consultants
*
Information tools
*
*
Flood Control Software in dBase 111
Outlet Register-a spreadsheet containing outlet dimensions, design calibration, accumulated discharges and seepage losses
* Regulation and GPM Software
* Irrigation Management Information System-used by IlMl for pilot study
Analytical and simulation tools
* Equilibrium Software (EQ-to calculate different flow parameters under equilibrium conditions
CFLOW Water Sediment Balance Mode!-developed by Delfl Netherlands
MISTRAL Hydraulic Simulation Model-developed by the French institute SOGREA
SIC Hydraulic Simulation ModeMeveloped by CEMAGREF
*
*
53

INSTALLATION OF IMlS IN CHlSHTlAN
IMlS is a generic information package to support managerial decision making regarding water distribution tasks. Its structure is derived from a general framework representing the various management activities of an irrigation scheme. Different modules developed in dBASE 111 are organized for data storage, analysis and optimization of system operations Structured to support three main management functions defined as COMMAND, OBSERVE and EVALUATE, These three main processes consist of several activities, briefly characterized as follows:
Process of Command
1. Decision making regarding operational strategies.
2. Decision making regarding real time adjustments.
3. Routine implementation of instructions.
4. Facing perturbations at the implementation stage.
Process of Observation
1. Collection of data
2. Observation of hydraulic state and behavior of the system.
Process of Evaluation
1. Collection of data.
2. Analysis of performance.
IMIS has been adapted to the local requirements of the Fordwah Branch Canal and installed in the office of the Irrigation Manager of the Chishtian Subdivision (Subdivisional Officer ISDO]). Permanent (e.g., structure dimensions, reference levels) and dynamic (water levels, discharges) files were made to match the existing data collection/processing system of PID. In the present setup, for instance, a lot of information is available with the field staff, so that they can intervene in case of emergencies. This setup was left intact. Existing calibration procedures (based on the relation between the water depth downstream of structures [which is dependent on the sedimentation rate] and the discharge) form !he basis of discharge computations in IMIS. The PID staff enters daily gauges of different control structures. Performance indicators are based on PID rules.
54

A more comprehensive (research) prototype is used in IIMl’s Head Ofice, where discharge computations are based on structure formulas and a greater number of indicators can be calculated.
BEHAVIOR AND PERFORMANCE OF THE SYSTEM IN KHARIF ’94
Reliable daily data about water levels and discharge provides a valuable set of information to understand and analyze system behavior and performance. In the following section a sample set of the IMlS output is described.
VARIABILITY
An important feature of the supplies to the Chishtian Subdivision is the large number of fluctuations in water levels and discharges. Figure 1 shows the exLent of these perturbations at the regulator, RD 245, of the subdivision. A part of these fluctuations can be attributed to the supply from the Suleimanki Barrage, while the second cause is the weekly rotation of the preference order for the three subdivisions (amongst which Chishtian) in the Fordwah Canal System. These perturbations in the hydraulic state of the canal generate frequent interventions by gate keepers in the Chishtian Subdivision, which increase the variability of supplies to distributaries and downstream sections of the canal.
Hydraulic Indicators
Table 3 below shows four hydraulic indicators computed for fourteen distributaries of the Chishtian Subdivision. These indicators, volume issued, number of operations, level of submergence, and upstream water level fluctuations can be generated through IMlS for any period of time. The analysis presented here is based on daily data of a 10-day period at the end of July. Variations in allocations from 10 millimeters (mm) to 40 mm indicate a combined effect of inequity and preference order of distributaries. The number of operations is 0 for those distributaries that have broad-crested weirs as intake structures, while other distributaries (with gated ofilakes) have at least one operation per day. A closer look at the calculated submergence ratios reveals that most of the intake structures were submerged during this period with, in some cases, only a few centimeters difference between upstream and downstream water levels. The upstream level fluctuations, finally, are taken with reference to the average level of the entire period. The numbers indicate that generally, upstream levels are better controlled for gated regulators than for the weirs.
55

Figure 1. Operation of regulator at RD 245: Discharge, water surface level and gate opening.
Oparaliins (number)
2.6-,- , " 23
Submergence UIS level (ratio) fluctuations
16
06/25/94 06127/94 06/29/94 07f01194 07/03/94
Daulat Mohar 5 L Phogan Khem 4-L Jagir Shahr Farid Masood Soda 5-L Fordwah Azim Mahmoud
Date
25 n 18 40 15 20 35 20 12 20 39 14 10 28
- GOPR - Discharge ---_ UPWSL ---- DW WSL I
16 8 0 7
11 0 0
23 17 7 0 39 45 0
Notes: G-OPR = Gate operation. UP WSL = Upstream water service level. OW WSL = Downstream water Service level.
Table 3. Average values of hydraulic indicators for a ten-day period.
.a .ffi
.90 .06
.91 .L%
.75 .39
.70 .27
.80 .27 32 .35 . I9 .I4 .82 .I4 .36 .A0 .95 31 .64 .12 .13 .12 .74 .I2
~~ ~
Distributary Allocation
Note: UIS = Upstream
56

Performance Indicators
IMlS (i.e., the Pakistan version) generates seven performance indicators, adequacy, efficiency, reliability and equity (ADQ. EFF, DEP, EQY in Table 4) following the definitions of Molden and Gates (1990), ratio of actual versus design discharge (RAD), ratio of actual versus target or indent discharge (RAP), and water depth at the tail of the distributary (indicator used by PID and farmers).
The definition of Molden and Gates indicators is given hereafter:
QA is the water delivered at a considered point of imgation network and QT, the targeted water delivery at the same point. These two variables are thus a function of time and space:
QA(x,t) and QT(x,t)
The computation of Molden and Gates indicators requires three basic mathematical notions:
1. The notion of sill function: Y(x) = x if x < 1, 1 otherwise
2. The notion of average of a function F during a period [t l ,t2], within a special range [xi ,Q]: < F(x.t) 7 [xl,x2] [tl,t2]
3. The notion of standard deviation of a function F regarding temporal or spatial fluctuations Sx or t (F(x,t)) x,t
Then we have:
Adequacy = < Y(QA/QT) 7 x,t
Efficiency = < Y(QT/QA) > x,t
Dependability = < St(QNQT) 7 x
Equity = < Sx(QA/QT) > t
The other three indicators generated by IMlS are simple ratios. Table 4 gives the seven indicators for the first week of July 1994.
57
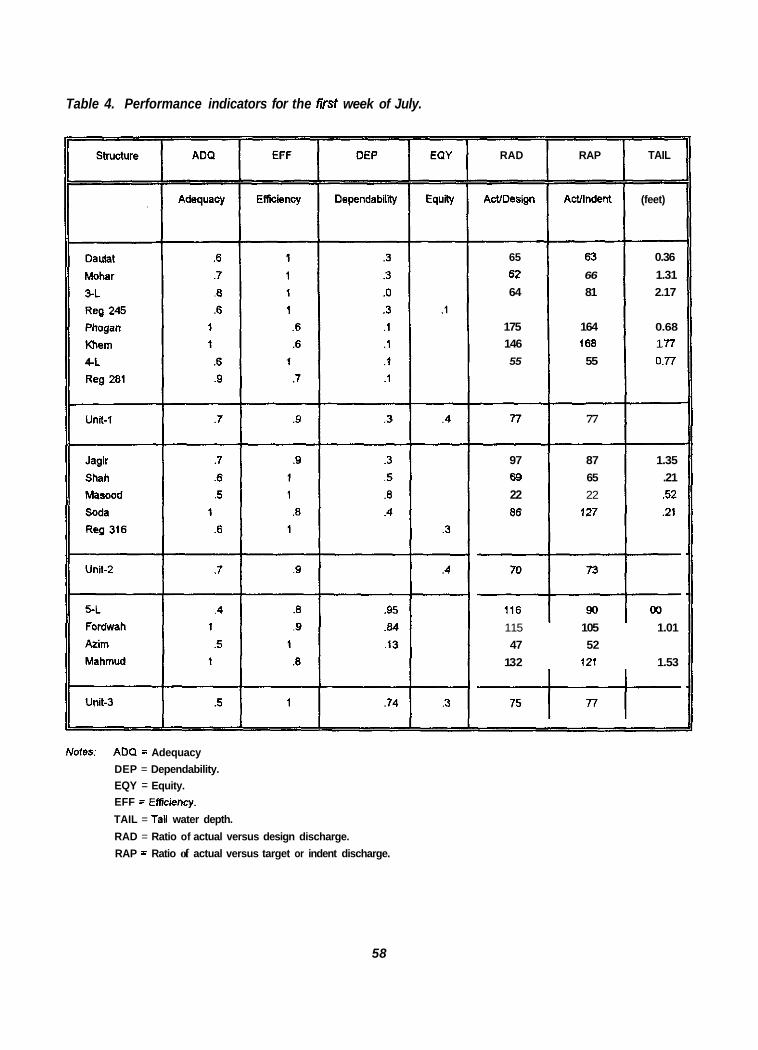
Table 4. Performance indicators for the first week of July.
Notes: ADQ 5 Adequacy DEP = Dependability. EQY = Equity. EFF = Emiency. TAIL = Tail water depth. RAD = Ratio of actual versus design discharge. RAP = Ratio of actual versus target or indent discharge.
RAD RAP TAIL
ActlDesign AcVlndent (feet)
65 63 0.36 62 66 1.31 64 81 2.17
175 164 0.68 146 168 1 .77 55 55 0.77
'77 77
97 87 1.35 69 65 .21 22 22 .52
115 105 1.01 47 52
1 32 121 1.53
58

While a value of one for the adequacy indicator means that for the entire time period a distributary was getting the target (or higher) discharge, the efficiency indicator quantifies the amount of water that was supplied in excess of the target value. Seven out of fourteen distributaries received (occasionally) more than the target discharge. The dependability indicator gives more evidence of the large differences in variabiliy for the distributaries. A comparison between ratios of actual flows (weekly average) with respect to design and indent shows the difference between indent and design. Those cases are interesting when the values of adequacy and RAP indicate different trends, as in the case of Jagir and 5-L; average supplies of the week were quite good in these cases but there have been daily variations. Equity along the main canal is shown at the cross regulators and at the end of each Unit. The tail water depth (TAIL) is a traditional indicator for the water distribution at secondary canal level. If discharges at the head are at design value, the tail water indicator should be one foot. Masood and 5-L, for instance. were getting good supplies at the head but their tails were short of water.
While a performance analysis, like the one carried out above, reveals a number of weaknesses in the distribution of water, it leaves us with a number of questions at the strategic and tactical levels of water distribution. How are the system objectives translated into actual operational targets and how do local operators try to match actual supplies with these targets? Following the performance analysis, a more detailed (hourly) monitoring was carried out for a ten-day period. Analyses were carried out and operational scenarios, changing the present water distribution patterns, were formulated. These scenarios were simulated in a hydro-dynamic model (SIC-Simulation of irrigation canals) to estimate the scope for improvement, The results of this analysis have been documented more comprehensively in another ~ a p e r , ’ ~ but are synthesized here in order to have a more complete review of IIMl’s experiences in Decision Support Systems.
SIMULATION MODEL AS A DECISION SUPPORT TOOL
Two possible approaches of stabilizing the water levels in the main and secondary canals have been formulated and tested. The first scenario assumes that the gauge readers remain as decision makers to make gate adjustments to meet targets. Their decisions are based on local variables, but will be optimized to demonstrate the potential for improvement. This scenario will be referred to as “improved localized control.” The second scenario goes away from the present setup and assumes a tighter control of the system managers on operations in their (sub) division. Also, it is assumed that the managers have an intimate hydraulic knowledge of their system that enables them to predict changes in the hydraulic state of the canal when they instruct a change in gate settings at a certain location. This type of control will be referred to as “centralized feed-forward control.”
“Kuper, M.; Habib, 2. and Malaterre. P.O. 1994. System objectives and localized control: Equity v e m s adequacy. P a p r presented at IIMl‘s inlemal Program Review, Colombo. Sri Lanka.
59

Improved Localized Control
For this option, regulation point RD 245 (first distribution point of the subdivision) is studied to demonstrate the potential of the hydraulic stabilization virtue of local improved control. Figure 1 above, shows the actual water levels and gate operations for the cross regulator, RD 245. The hourly data for 10 days indicate that the gate operator has achieved the target of keeping level fluctuations at a minimum but wkhout any improvement in discharge variations.
The following changes will be made in the present operations at the regulating point:
1. Large gate adjustments, which are presently usually followed by successive corrective changes in gate settings, will be avoided.
2. Gates will not be operated when the discharge to offtaking distributaries is within the range Of
85 to 110 percent of the target.
3. Operations that do not seem to be justified hydraulically will be eliminated.
4. Discharge tables will be based on the structure (gate) formula."
The operations at the regulating point were reduced according to the above mentioned criteria. Both actual and reduced operations were simulated in SIC to quantify the effect of the operation of the cross-regulator on the local hydraulic conditions. Figures 2a and 2b show the actual and modified gate operations and the resulting discharge that is passed on downstream. Two waves are received during the simulation period from the upstream regulation point (D 199), which will have to be passed on downstream of D 245, as Daulat Distributary is in first preference. However, the figures show that in the present (actual) situation, there are many other significant perturbations passed on downstream of D 245, which can be attributed to operations at this regulation point. These are the perturbations that are addressed in the modified scenario. The operator changes the gate settings of the regulator 19 times during the period of simulation, while for the modified scenario only 7 operations were made on the cross-regulator. Many of the actual perturbations passed on downstream in actual condilions are smoothed out.
A closer look at offtaking Daulat explains much of this. The operator attempts to achieve the target discharge for Daulat and succeeds at least once a day. He needs a lot of operations on the cross-regulator to achieve this, which obviously will create many perturbations in the main canal. If a more stable discharge is supplied to Daulat (deviation from the target is about E%), many of these gate operations would become unnecessary. The difference in total delivered volume to Daulat for both cases is only about 5 percent.
"Presently, discharge tables are based on the relation between discharge and the downstream water deplh. without taking the gate setting into account
60

Figure 2a. Actual operation of regulator RD 245.
REACH 5
748OR rn nJ/r CANAL DISCHARGE 0245 26.00
O'ENING
1 .5(
20.00 I T Lk .50 I I I I I 0 120. 140. 160. 180. 200. 220. 240. 260. 280. - 02- - -s"z
REACH 5 CANAL D I SCHARGE ml/r 26.00
Figure 2b. Improved operation of regulator RD 245.
O'ENING
I I Fordwah B r o n c h RD 199
24.00-
22.00-
i/ v ~ -
-
4 I I I I I T' 20.00 dE .40
61
Centralized Feed-Foward Control
This scenario presumes that future targets are known and the System Manager is aware of future perturbations (e.9.. a change in discharge at the head of the Fordwah Canal). The Manager also knows, because of an intimate hydraulic knowledge of the system, the effect of specific operations on the global water levels and discharges. In industries, this system usually goes hand in hand w lh a feedback loop, which gives Managers direct feedback on the effect of their operations so that adjustments can be made if necessary. A similar loop can be easily pictured in the case of canal operations where information on water levels and discharges are not dimcult to obtain. However, the scenario presented in this section will not take the feedback loop into account and only the feed-forward loop will be analyzed.
The analysis was conducted by carrying out simulations with SIC for the ten-day period studied. The following information is assumed to be known:
1. The discharge at the head of the system
2. Target discharges to offtaking distributaries.
3. Target upstream water levels for cross-regulators
A training period to gain an understanding of the hydraulic behavior of the system is simulated by carrying out a steady flow simulation. This module computes all required gate settings at cross-regulatocs and offlaking (gated) distributaries (opening computation mode) in order to meet the targets. All flumes, except Soda, are switched to the discharge computation mode. Upstream targeted water levels at cross-regulators are then adjusted by trial and error to correctly feed offtaking flumes. Water levels and discharges for Soda flume are calculated in the crest level computation mode, as the operator uses wooden stop logs (kames) to regulate this distributary. Azim is particular in the sense that it is defined as the downstream boundary condition in SIC and can, therefor not be computed in the opening computation mode. When Azim has priority, the targeted discharge of further upstream located distributaries is adjusted (by trial and error) to feed Azim. An operational print of SIC synthesizes the results of the steady flow computation, which will form the basis of the unsteady flow simulation for the 1 0-day period.
In the unsteady flow simulation, all structures are operated once a day, at 6 a.m. Figures 3a and 3b show that the obtained results are very satisfactory with very little water level and discharge fluctuations. The maximum difference between supplied discharge and indent is around 10 percent. The calculated gate settings and obtained results are validated by the good calibration of the model.
62

Figure 3a. Feed-fotward control of regulator RD 316.
F o r d w a h B r o n c h RD 199
4 . 4 0
1 0 . 0 0 120. 140. 160. 180. 200. 220. 240. 260. 280 .
pnlm __ 0,-
REACH 10 OFFTAKE DISCHARGE FORDWAH S F A R I O
" W S ....................................................................................................................... ?.fi,4,.in
Figure 3b. Feed-fonvafd control: Supply to the distributaw upstream of the Regulator RD 316.
4.00- 3 . 8 0 - 3.60- 3 .40 - 3 .20 - 3,OO- 2.80- 2 .60 - 2 . 4 0 - 2.20- 2.00- 1.80- 1 .60- 1.40- 1 .20 - 1 .oo
F o r d w o h B r a n c h RD 199
- -
I_ I
NlNG
5(
: .cc I . ................ -8-2 - yn" - IM.
63

CONCLUSIONS
1.
2
3
4
The performance and hydraulic analyses carried out in this study indicate that the management intervention package introduced in the Chishtian Subdivision has the potential to fulfill the Managers' needs of information collection, system analysis and decision making support. Data stored and processed by IMlS give a comprehensive picture of water acquisition and distribution in the subdivision, while the hydraulic model SIC helps to understand the hydraulic and physical limitations of the system and evaluate the potential for improvement. A detailed investigation of the proposed operational plans (options) using the unsteady state module of SIC provides valuable knowledge to Ihe Manager.
The study has indicated specific areas of attention for main canal management. The formulation of targets, the monitoring of the water balance in the main canal, physical conditions, and a global approach to the hydraulic state of the main canal are the subjects that need to be addressed in this subdivision.
The methodology used for the performance analysis of the system is a starting point in identifying an appropriate set of indicators for the Fordwah System, and in contributing to the efforts to have a generic set of indicators at the global level.
The present phase of IIMI-ID collaboration is quite critical and important for both partners. Field testing of alternate ways of irrigation management is the nexi step and ID is the major actor in this activity. Persistent and serious efforts should be made by both parties to accomplish Constructive and long lasting results to the system from this pilot study.
References
Kuper, M.; Habib, 2. and Malaterre, P.O. 1994. System objectives and localized control: Equity versus adequacy. Paper presented at IIMl's Internal Program Review, Colombo, Sri Lanka.
Molden, David J. and Gates, Timothy K. 1990. Performance measures for evaluation of irrigation-water-delivery systems. In Journal of Irrigation and Drainage Engineering, Volume 116, No. 6, American Society of Civil Engineers (ASCE).
Public Works Department (PWD). 1961. A manual of irrigation practice. Irrigation Branch, Lahore, Pakistan.
64

PART 111
ANNEXES

Annex 1
Program of the Network Meeting
Monday 6 December
Venue : Government Engineering Academy, (near Thokar Niaz Baig), Lahore
FIRST SESSION - Opening
Chairman : Prof. Gaylord V. Skogerboe, Director, //MI Pakistan Chief Guest : Mr. Rana Akhtar, Chief Engineer, Punjab lm.gation and Power Department
09:oo Recitation from The Holy Quran
09:05 Opening remarks Prof. Gaylord V. Skogerboe, Director, IlMl Pakistan
09:15 Welcome address Mr. Ria2 Ahmad Khan, Secretary, lmiation and Power Department Mr. Rana Akhtar. Chief Engineer, lnigation and Power Department
09:30 Irrigation in Pakistan Mr. M.H. Siddiqi, Consubant, Irrigation and Power Department
Introduction to the Network meeting Mr. RBmy Pochat
10:30 Information technology and DSS Dr. Daniel Renault
1o:oo
SECOND SESSION - Experiences on DSS
Chairman :
11:30
12:10
Mr. R6my Pochat
Classification and review of tools and techniques Mr. Jacques Rey and Mr. Pascal Kosuth
Development and application of SICAMIS in Pakistan Ms. Zaighum Habib, Mr. Marcel Kuper and Dr. P.O. Malaterre
67

14:30
1515
16:15
The information system in Muda: Lessons and experiences Mr. Teoh Weng Chaw and Mr. Eow Boon Tiak
SICODE, Expert system for irrigation management Ing. Marlin Mundo Molina
Canal Alto Automatization: The automatization techniques applied in the Yaqui Canal Alto in Sonora MBxico Mr. Ariosto Aguilar Chhvez
Applications and institutional arrangements for DSS in Sri Lanka Mr. B.M.S. Samarasekera, Mr. G.G.A. Godaliyadde. Mr. H.M. Jayathilake and Mr. US. Wjesekera
Open discussion and progress since 1993 meeting 17:OO
Tuesday 6 December
07:OO Departure for SuleimankilBahawalnagar (by coach)
1130 Visit to Suleimanki Headworks: Briefing by Mr. Muhammad Akbar, Executive Engineer, Suleimanki
Presentation of the Fordwah Irrigation System Ch. Muhammad Shafi
Visit to the Fordwah Irrigation System
Visit to Chishtian Subdivision: Subdivisional Officer, Chishtian
13:45
Wednesday 7 December
THIRD SESSION - Information Systems in Pakistan
Chairman :
Venue :
0830
09:15
Mr. RImy Pochat
Bahawalnagar Canal Rest House
Rules and regulations in Pakistan's Punjab and a review of applications Chaudhry Muhammad Shafi, S€, Bahawalnagar Circle
Group discussions: Formulation of a master plan for the implementation of DSS in Pakistan
68
d
i
1
i
i
i 4
i i

10:15 Presentation of results by Chairmen of the Groups
11:15 Discussion and identification of issues and possible solutions
13:30 Departure for Lahore
Thursday 8 December
Venue : Government Engineering Academy, (near Thokar Niaz Baig), Lahore
FOURTH SESSION - Identification of Issues
Chairman : Mr. RImy Pochat
09:oo Summary of findings and experiences of the Network meeting wRh particular reference to progress made since the 1993 meeting Mr. RBmy Pochat
09:30 Discussion on issues that need further attention Mr. Remy Pochat (Moderator)
Group discussions on issues identified 1o:oo
11:oo Presentations on findings
11:30 Discussion
CONCLUDING SESSION - Action Program
Chairman : Mr. RCmy Pochat
1300 Presentation of an acfon program for 1995
13:30 Discussion and drafl conclusions of the meeting Mr. RBmy Pochat (Moderator)
14:30 Evaluation of the Network meeting and datelvenue for next meeting
89

Annex 2
List of Participants
Irrigation Department - Pakistan
1. Mr. M.H. Siddiqi Consultant lndus Basin Water Treaty Irrigation and Power Department Irrigation Secretariat Old Anarkali, Lahore
2. Mr. Mian Hafiz Ullah Chief Engineer Irrigation and Power Department Bahawalpur Zone
3. Mr. Tahir Ahmad Malik Chief Engineer Irrigation Research Institute Irrigation Secretariat OM Anarkali, Lahore
4. Dr. Bagh Ali Shahid Superintending Engineer Drainage Circle Irrigation Department Canal Office Faisalabad
5. Dr. Tariq Makhdoom Deputy Secretaly Development Irrigation and Power Department Lahore
6. Mr. bar-ul-Haq Deputy Director Design Coordination Zone Irrigation and Power Department Lahore
71

7. Chaudhry Muhammad Shafi Superintending Engineer Bahawalnagar Circle Irrigation and Power Department Bahawalnagar Canal Colony
8. Mr. Muhammad Javid Qureshi Executive Engineer Fordwah Canal Division Bahawalnagar Canal Colony
9. Mr. Rashid Ahmad Subdivisional Officer Chishtian Subdivision Chistian
10. Mr. M. Akbar Executive Engineer Suleimanki Headworks
11. Mr. M. Ali Virk Executive Engineer Hakra Canal Division Bahawalnagar Canal Colony
CEMAGREF - France
1. Mr. RBmy Pochat (Chairman ITIS) Head of Department Water and Environment CEMAGREF France
2. Dr. Pascal Kosuth Head of Irrigation Division CEMAGREF France
3. Dr. Daniel Renauk Senior Lecturer ENGREF France
72

Irrigation Department - Sri Lanka
1. Mr. B.M.S. Samarasekera Deputy Director, IRMU
230, Bauddhaloka Mawatha Colombo 7
I
. Irrigation Department
2. Mr. G.G.A. Godaliyadde Deputy Director Irrigation Department Moneragala
3. Mr. H.M. Jayathilake Deputy Director Irrigation Training Institute Galgamuwa
4. Mr. U.S. Wijesekera Chief Resident Engineer Kirindi Oya Project Tissamaharama
llMl - Sri Lanka
1. Mr. H. Manju Hemakumara Research Officer IlMl Colombo
2. Mr. Jacques Rey Associate Irrigation Specialist IlMl Colombo
3. Dr. Upali Amarasinghe Research Data Analyst IlMl Colombo
4. Mr. Vaseeharan Nesiah Communications Officer IlMl Colombo
73

Malaysia
1. Mr. Teoh Weng Chaw Muda Agricultural Development Authority Ibu Pejabat Mada, Malaysia Ampang Jajar. Peti Surat 136, 05710 Alor Setah Kedah
2. Mr. Eow Boon Tiak Muda Agricultural Development Authority Ibu Pejabat Mada, Malaysia Ampang Jajar, Peti Surat 136, 05710 Alor Setah Kedah
IMTA - Mexico
1, Mr. Martin Mundo Molina IMTA, Paseo Cuauhnahuac No. 8532. C.P. 62550
2. Mr. Ariosto Aguilar Chavez Coordination Hydraulic Systems IMTA, Paseo Cuauhnahuac No. 8532. C.P. 62550
IlMl - Pakistan
1. Prof. Gaytord V. Skogerboe Director, IlMl Pakistan Lahore
2. Mr. Marcel Kuper (Convenor) IlMl Pakistan Lahore
3. Ms. Zaigham Habib Systems Analyst, llMl Pakistan Lahore
4. Mr. Shahid Sarwar Field Research Hydrologist. IlMl Pakistan Lahore
5. Mr. Muhammad Akram Khan Secretary, IlMl Pakistan Lahore
74