Embed Size (px)
Citation preview

1
Kwara State
Education Sector Analysis
Second draft, March 2008
by
K. Gannicott

2
Table of Contents Chapter 1: Economy, demography and government finance 1. An introduction to Kwara 2. Economic context 3. Demographic context 4. Government finance in Kwara Chapter 2: Enrolment patterns and education coverage 1. Organisation and policy 2. Education coverage: Access to primary and secondary education in Kwara (i) Growth of school enrolments: different sources, different evidence (ii) Measuring the disparity between CWIQ and EMIS (iii) Putting the numbers together (iv) Kwara in Nigerian perspective (v) Intake and completion in primary and secondary schooling 3. Education coverage: Access to post-secondary education in Kwara (i) Organisation and structure (ii) Access and participation Chapter 3: Education costs and finance 1. A complex story 2. The overall pattern of funding 3. Allocation between sub-sectors of education 4. Functional composition of expenditure 5. Private and household expenditure 6. Unit costs by educational level Chapter 4: Educational Quality 1. Measuring the quality of schooling 2. The evidence for Kwara 3. The determinants of high quality in education 4. Resources for quality schooling in Kwara Chapter 5: Disparity and equity 1. Gender equity 2. Disparity in education by poverty/income category 3. Disparity by administrative area Chapter 6: Management of education service delivery 1. Roles and responsibilities in education provision 2. Supervision, monitoring and inspection 3. Financial management Chapter 7. Conclusions and key policy issues

3
List of Tables, Charts and Boxes Table 1: Poverty in Nigeria: Kwara is among the six poorest states Table 2: Income sources for Kwara State Government, 2000-2006 (Naira m) Table 3: Expenditure by Kwara State government, 2006 Table 4: Public primary school enrolment disparity in selected Kwara LGAs Table 5: Enrolment disparity in Kwara public secondary schools Table 6: School enrolments in Kwara, 2005-06 Table 7: Primary enrolments by grade, gender and type of school Table 8: Secondary enrolments by grade, gender and type of school Table 9: Enrolments in post-secondary institutions in Kwara Table 10: Public Educational Expenditure in Kwara, 2006 Table 11: State and LGA education expenditure per capita, 2005 Table 12: Intra-sectoral allocation of public expenditure 2006 Table 13: Functional distribution of recurrent expenditure, Kwara 2005 Table 14: Private Educational Expenditure in Kwara, 2006 Table 15: Unit costs in education, Kwara 2006 Table 16: P4 Literacy and Numeracy in 3 states, 2007 (%) Table 17: Teacher indicators for primary and secondary schooling, Kwara 2005 Table 18: Student-teacher ratios in selected African countries Table 19: Teacher qualification profile by level of education and gender, 2005 Table 20: Highest level of education achieved by expenditure category, Nigeria 2005 Table 21: Primary education indicators by LGA, Kwara 2006 (public schools) Table 22: Educational responsibilities and functions of Federal, State and Local Governments Table 23: Indicative FTI benchmarks Chart 1: Nigeria and Kwara State Chart 2: Population growth in Nigeria, 1991-2006 Chart 3: School-age populations in Kwara, 2006-2016 Chart 4: Primary enrolments in Kwara: evidence from the yearly school census Chart 5: Secondary enrolments in Kwara: evidence from the yearly school census Chart 6: Primary net enrolment rates for all Nigerian states, 2005 Chart 7: Secondary net enrolment rates for all Nigerian states, 2005 Chart 8: Education stock and primary enrolment, all Nigerian States, 2005 Chart 9: Education stock and secondary enrolment, all Nigerian States, 2005 enrolment rates for all Nigerian states, 2005 Chart 8: Secondary net enrolment rates for all Nigerian states, 2005 Chart 9: Education stock and primary enrolment, all Nigerian States, 20 Chart 10: Education stock and secondary enrolment, all Nigerian States, 2005 Chart 11: Public educational expenditure shares by type of education, 2005 Chart 12: Academic performance in Primary 4, 1996 and 2003 Chart 13: Academic performance in Primary 6, 2003 Chart 14: Achievement in Secondary School, average percentage scores, 2003 Chart 15: Determinants of effective learning Chart 16: Primary enrolment rates by location and income category, Kwara 2006

4
Box 1: The white farmers of Kwara Box 2: HIV/AIDS in Kwara State Box 3: Types of religious instruction in Kwara Box 4: Determinants of educational quality Box 5: The Education For All Fast Track Initiative (FTI)

5
Kwara State
Education Sector Analysis
Chapter 1: Economy, Demography and Government Finance
1. An introduction to Kwara Kwara State was formed out of the former northern region in 1967. At its creation, the state was initially named West Central State but was later changed to “Kwara”, a local name for the River Niger. The capital (and only sizeable city) is Ilorin. Located in western Nigeria (part of North Central Zone in official terminology), Kwara State now occupies 36,825 square kilometres, little more than half its original size. Boundary changes and the creation of new states in 1976 and 1991 meant that Kwara lost substantial portions of its original territory. Chart 1: Nigeria and Kwara State
There is an unmistakable sense in Kwara planning literature1 that these boundary adjustments left Kwara severely disadvantaged through the loss of choice infrastructural facilities such as the Kainji Dam (located on the River Niger and the second largest hydro plant in the country) and mineral deposits that could have stimulated economic development and strengthened the revenue base of the State. At the same time there is also a recognition that Kwara has not made the best of its resources and circumstances. In 2003 the State Governor, in a statement that was nothing less than frank, noted that “our story has been one of squandered resources, massive wastage, and leakages through abandoned projects, while corruption in
1 See, for example, Kwara State Economic Empowerment and Development Strategy (KWA-SEEDS), 200?

6
all its forms has become the norm, and integrity has become a subject for disdain”.2 Such a harsh judgement is hardly applicable only to Kwara, but even by the standards of the new reform-minded Federal administration the current State Government has been forthright in identifying a legacy of economic decline, social neglect and mismanagement.3 2. Economic context The most prominent “stylised fact” of the Nigerian economy is that it is dominated by the capital-intensive oil sector, which provides 20 percent of GDP, 95 percent of foreign exchange earnings, and about 65 percent of budgetary revenues. Kwara plays no direct part in this petroleum-based economy except as a recipient of federal revenue (described in more detail in a later section). Kwara is instead an economy based on subsistence farming, small-scale manufacture, and government-driven economic activity. It is now widely accepted in Kwara that few parts of this economic structure have performed well. The State has a favourable climate, a substantial cultivable area, and good soil to support agriculture, livestock and inland fishing. The main cash crops include cashew, cocoa, coffee, sugarcane, palm oil, groundnuts and cotton. Food crops include cassava, maize, yam, sorghum, cowpea and vegetables. Most farming is small scale (between one and two hectares), the area under cultivation is only 11 percent of the total cultivable area, and yields and productivity are low. More than 80 percent of agricultural production is generated by subsistence farmers, with little contribution from commercial farming practices (but see Box 1). Box 1: The white farmers of Kwara In what might be fairly described as an audacious move, in 2004 the Government of Kwara invited a group of displaced Zimbabwean farmers to assess the potential for commercial agriculture development in Kwara. The state government and commercial farmers' union from Zimbabwe signed a collaborative agreement on agriculture in July 2004. This has led to a pilot scheme involving thirteen farmers who have now moved to Kwara State from Zimbabwe. The scheme has already attracted international investment from outside Africa. The government undertook to grant leasehold of agricultural land of approximately 1,000 hectares to each of the 13 farmers. The farmers were also given loans by the government for their projects, which would be paid back after five years. The government further assisted in securing additional loans from financial institutions for the farmers. The anticipation is that the project will enhance food production, encourage skills and technology transfer, generate export earnings and stimulate local agro-allied industries. The farms are located in Edu Local Government Area, and there are plans to extend the scheme to other LGAs to boost agricultural activities in the state. Other states (including Kaduna) have also expressed interest.
2 Dr Abubakar Bukola Saraki, quoted in KWA-SEEDS, Chapter 1 3 KWA-SEEDS 2000, Foreword by Executive Governor, Kwara State.

7
The manufacturing sector in Kwara is small, consisting of some 20 small and medium enterprises and employing only 3.2 percent of the wage labour force, compared to 4.5 percent nationally. Five of these 20 enterprises are state-owned (furniture-making, paper milling, textile manufacturing, sugar production and rice milling) but in terms of output state ownership accounts for 60 percent of the SME sector. Performance has been poor, with little capital investment and few revenues accruing to the state. There are now plans to privatise the government-owned enterprises. There are extensive mineral deposits in Kwara, but at present there is no commercial exploitation. Critical infrastructure such as sealed roads, water supply and electricity generation are all inadequate. The core civil service is not over-large with 5,850 employees, but it is characterised by a lop-sided staff composition, with over 70 percent of staff in senior positions, near-collapse of the middle levels skills, and heavy arrears in salary and pension payments. Public sector employment as a whole (that is, including teachers and parastatal employees) amounts to some 11.6 percent of total wage employment, above the Nigerian average of 9.1 percent.4 Almost exactly half of employment is derived from self-employment or household activity. Data do not exist to make a direct comparison between the economic performance of Kwara and other Nigerian States, nor to estimate state-level gross domestic product per head. It is clear, however, that as a result of its poorly-performing economy Kwara is among the poorest states in Nigeria. Table 1 shows that on a simple headcount of the incidence of poverty, Kwara is among the six poorest States in Nigeria. It is also characterised by a substantial poverty gap (that is, depth of poverty), again being among the six worst States; and it is among the few States to experience a worsening incidence of poverty between 1996 and 2004 at a time when the overall national average fell from 65.6 to 54.4. Table 1: Poverty in Nigeria: Kwara is among the six poorest states
State Poverty Incidence 1996 2004 Poverty Gap 2004
Jigawa 71.0 95.1 0.44 Kebbi 83.6 89.7 0.40 Kogi 75.5 88.6 0.54
Bauchi 83.5 86.3 0.32 Yobe 66.9 83.3 0.32
Kwara 75.5 85.2 0.42 Note: Poverty incidence is the proportion of the population falling below a given poverty line that divides the poor from the non-poor. Poverty incidence is a simple head-count measure and therefore treats all poor people equally regardless of whether they are severely poor or fall just below the poverty line. The poverty gap takes the depth or severity of poverty into account by incorporating the extent to which a poor person’s consumption falls below the poverty line. Source: National Bureau of Statistics, Nigerian Living Standards Survey, Abuja, 2006.
4 National Bureau of Statistics, Core Welfare Indicator Questionnaire Survey, Abuja, 2006.

8
Kwara is not especially disadvantaged in the broader social indicators of welfare. Its indicators for health access, child vaccination, secure housing tenure, and access to safe water and sanitation are no worse than (and often above) the national average. Primary and secondary enrolment rates (to be discussed later in greater detail) are also both above the national average. Given the paucity of data, any conclusions about the impact of HIV/AIDS on health, education and employment must be tentative (Box 2), but it seems likely that HIV/AIDS is not presently a major issue on Kwara. Box 2: HIV/AIDS in Kwara State Rotberg (2004) has observed that “it is difficult to reconcile apparently contradictory findings from different studies (for example, in 1995 in Kwara State one study had the highest levels of HIV infections among prostitutes, 74 percent, while another study of patients with STDs found that those tested in Kwara State had the lowest rate of HIV, 0 percent, of any site in the study”. The National Action Committee on AIDS has reported an HIV/AIDS prevalence rate for Kwara of 2.7 percent in 2003, well below the Nigerian average of 5.0 percent. KWA-SEEDS also quotes the prevalence rate of 2.7 percent and acknowledges that while the measured rate is low, HIV/AIDS is considered a major health problem in Kwara. KWA-SEEDS foreshadows a battery of new policies, including awareness campaigns, the provision of instructional materials in schools, improving health care management with a greater emphasis on HIV/AIDS, and re-equipping health facilities throughout the state. Most of these health and schooling activities have been supplied by the public sector, and Kwara’s satisfactory showing on these wider social indicators may be a legacy of a state economy accustomed to being government-driven. While the basic fabric of social welfare may still be functioning in Kwara, the underlying economic and employment structure of the state is leaving large numbers of people without sufficient household resources to meet levels of consumption above the poverty line. 3. Demographic context Nigeria’s population is growing rapidly. In 1991 total population was 86.452 million and this had reached 140.003 million by the time of the 2006 Census. This is equivalent to an annual average rate of increase of 3.27 percent, which is high by international standards.5 This national average conceals substantial differences between states. Enuga’s population barely changed, Bauchi increased by only 0.6 percent a year, and Ondo, Plateau and Sokoto all had a population smaller in 2006 than in 1991. Chart 2 indicates that Kwara’s rate of population growth of 2.8 percent is below the national average and towards the low end of growth by the individual states, with a 2006 total of 2,371,089.
5 The phenomenal growth of the Federal Capital Territory (over 9.0 percent a year) is apparent from Chart 2, but Abuja’s total 2006 population of 1.405 million, up from 379,000 in 1991, is not sufficient to account for the substantial national growth rate.

9
What really matters for education planning is not the overall population but the current and projected size of the school age groups. This is problematic in Nigeria because the Chart 2: Population growth in Nigeria, 1991-2006
Kwara
-2.00
0.00
2.00
4.00
6.00
8.00
10.00So
koto
Ond
oPl
atea
uEn
ugu
Bauc
hiK
ebbi
Abi
a Ri
vers
Akw
a Ib
om Edo
Ada
maw
aK
atsin
aK
war
aBe
nue
Kad
una
Cros
s-Ri
ver
Tara
baO
sun
Kog
iIm
oLa
gos
Nig
erO
gun
Del
ta
Born
oO
yoN
IGER
IAY
obe
Kan
oA
nam
bra
FCT
Abu
ja
Ave
rage
ann
ual r
ate
of g
row
th
Source: Calculated from population Census for 1991 and 2006 age distribution for the 2006 Population Census has not yet been published. One proxy measure is to use the known 1991 age structure adjusted for the overall population growth rates between 1991 and 2006. The alternative is to use the school age groups taken directly from the 2006 CWIQ sampling fraction for Kwara.6 On balance, the CWIQ Household Survey is likely to provide the more reliable results because the school-age population is calculated directly from the survey rather than being dependent on growth rates from a national population census now more than 15 years old.7 Chart 3 combines the CWIQ and 2006 Census data to show the current and projected size of the educational sub-sectors. Chart 3 is only an approximation. In the absence of more
6 The Core Welfare Indicators Survey (CWIQ) of 2006 was the latest in a series of household surveys carried out by the National Bureau of Statistics. The 2006 CWIQ was a nationwide sample survey designed to produce welfare indicators for the population at national and sub-national levels, particularly Zones, States and Senatorial Districts. Throughout this paper all enrolment ratios are calculated by using the relevant age groups taken directly from the CWIQ sampling fraction for Kwara. These age group fractions were kindly provided by Paul Bennell, using the CWIQ household roster. 7 It is possible to compare the two methods because the Nigerian EMIS, based upon the annual school census, used the first method of extrapolating the 1991 age structure. The EMIS adjustment results in a 6-11 age group of 432,271 for Kwara in 2006, whereas applying the CWIQ sampling fractions to the known state population of 2,371,089 produces an 6-11 age group of 438,580. For the 12-14 age group the figures are 199,172 (CWIQ) and 189,463 (EMIS). Differences are more substantial for the senior secondary age group 15-17: 182,574 for CWIQ and 158,858 for EMIS.

10
detailed evidence it assumes that the primary, junior secondary and senior secondary age groups derived from CWIQ will all grow at the same rate as Kwara’s overall population. Chart 3: School-age populations in Kwara, 2006-2016
0
100,000
200,000
300,000
400,000
500,000
600,000
2006 2011 2016
PrimaryJunior SecondarySenior Secondary
Source: Calculated from population census for 2006 and CWIQ Household Survey 2006 Despite its limitations, Chart 3 provides at least an order-of-magnitude of the task ahead. Over the next ten years, Kwara is likely to have 578,000 children in the primary age group, compared to 438,000 today; there will be around 262,000 in the junior secondary age group, 32 percent more than today; and the 15-17 senior secondary cohort is likely to amount to nearly 241,000, compared to 182,500 in 2006. Not all the 15-17 age group will actually be seeking entry into senior secondary school, but the projections for the primary and junior secondary groups demonstrate the size of the task that must be faced if Kwara wishes to achieve Education for All. 4. Government finance in Kwara Table 2 summarises the sources of revenue for Kwara State. The Table is dominated by receipts from the Federation Account Allocation Committee (FAAC). Funds from the FAAC comprise a statutory allocation and a share of excess crude oil revenue. The pattern of the FAAC allocation is closely correlated to the price of crude oil in the international market; in a time of rising oil prices it is not surprising that this has provided a buoyant source of revenue. FAAC has made up between 60-70 percent of Kwara’s revenue in recent years. Internally generated revenue consists of taxes, fines and fees, licences, rent on government property, interest repayments, and retained earnings from para-statal organisations. In recent years it has provided around 10 percent of Kwara’s revenue. Grants and reimbursements have increased sharply in recent years. In 2006 they included amounts from UNDP and UNICEF but for present purposes the most significant amounts were 281.787 million Naira as the Federal contribution to Universal

11
Basic Education; 31.1 million from the Educational Trust Fund; and 56.2 million Naira for State Universal Basic Education. In addition to development loans from donor agencies such as the African Development Bank and the World Bank, External Loans include payments from (and to) the London Club and the Paris Club.8 The amount of 1,104.9 million Naira for Internal Loans in 2006 refers to new loans received in that year. At the start of 2006 Kwara’s debt from past loans amounted to 4,375.6 million Naira. Table 2: Income sources for Kwara State Government, 2000-2006 (Naira m) Receipts 2002 2003 2004 2005 2006
Federal allocation 8,204 9,870 14,089 15,332 17,102
Internally generated revenue
1,831 1,640 2,009 2,734 3,202
Value added tax 1,074 1,307 1,575 1,789 2,235
Grants and reimbursements 1,780 503 491 2,519 5,122
External loan 0 0 0 151 510
Internal loan 1,809 609 1,030 4,250 1,105
Repayment from beneficiaries
0 0 13 221 240
Total receipts 14,693 13,919 19,202 26,997
29,516
Source: World Bank, Public Expenditure Review, 2007 and Annual Reports from the Accountant-General, Government of Kwara. Table 3 summarises the main items of recurrent and capital expenditure in 2006. Prominent in Table 3 is the high proportion of recurrent spending which goes to the Consolidated Fund. Some of this is for pensions, salaries and grants to para-statal organisations, but 61 percent of this recurrent item is for payment of interest and principal on past loans as the legacy of past high rates of borrowing. Table 3 suggests that the state government spends a low 10.6 percent of its recurrent budget on education, but this does not exhaust the full amount of public finance for education in Kwara. That complex story is explored in Chapter 3. 8 Debts owed by developing countries are usually rescheduled in the London Club or the Paris Club. The London Club is an ad-hoc grouping of commercial banks exposed to third world debts while the Paris Club reschedules debts owed to official creditors.

12
Table 3: Expenditure by Kwara State government, 2006 Recurrent expenditure: Actual expenditure (Naira,
millions) Percentage of recurrent
Education services 2,175 10.6 Transport service 79 0.4 Health service 756 3.7 Mining & petro-chemical services 18 0.1 Agricultural services 194 1.0 Miscellaneous 7,964 38.9 Consolidated Fund Charges 8,484 41.5 Transfer to Capital Development fund
788 3.9
Total recurrent expenditure 20,457 100 Capital expenditure: Percentage of capital Economic sector 2,351 22.3 Education 1,146 10.9 Other social services 996 9.4 Regional development 2,293 21.7 Administration 2,270 21.5 Purchase of financial instruments 1,500 14.2 Total capital expenditure 10,556 100 Total recurrent + capital 31,013
Note: The purchase of financial instruments (Naira 1,499,998,500) is the balancing item which accounts for the discrepancy between total expenditure and total revenue in Tables 2 and 3. Source: Accountant-General, Annual Report, 2006

13
Chapter 2: Enrolment patterns and education coverage 1. Organisation and policy In common with all the 36 states of the Federal Republic of Nigeria, the state education system in Kwara comprises a 6-3-3-3/4 cycle. That is to say, there are six years of primary school, three years of junior secondary, three years of senior secondary and then 3-4 years of post-secondary education. This conventional structure is in the process of being transformed in order to create a stronger nine-year basic education cycle followed by a three-year secondary cycle. The overall goal (to be achieved over the next three years) is to create single integrated nine-grade basic education schools.
The overall policy framework for the education sector is the responsibility of the federal government. The new civilian government introduced the Universal Basic Education Programme in 1999, and the Federal government passed the UBE Act in 2004. The key objective of the current National Educational Policy, which was adopted in 2004, is the attainment of universal basic education by 2015, in line with the international Millennium Development Goals for education. These formal MDG policy targets were given powerful reinforcement in 2004 with the National Economic Empowerment and Development Strategy (NEEDS). NEEDS was launched as a medium-term reform plan to confront numerous challenges. Among these challenges were near-collapse of the social and economic infrastructure, external debt that had reached 70 percent of GDP, high macroeconomic volatility, and what was described by the IMF as a dysfunctional educational system of low academic standards and institutional decay (IMF, 2007). Education is a core ‘pillar’ of NEEDS, with targets to:
• Increase adult literacy from 57 percent to 65 percent; • Raise primary school enrolment to 100 percent; • Expand institutional capacity; • Increase transition from junior to senior secondary education; • Ensure that 60 percent of secondary schools have conducive teaching
and learning environment; • Ensure that 80 percent of teachers are professionally qualified; and • Review school curricula to incorporate technical, vocational and
entrepreneurial skills. While the IMF’s verdict was that impressive progress had been made with macroeconomic and financial reform, the judgement was that on national average education had made only slow but steady progress. NEEDS was conceived as an integrated and coordinated development approach, with the state governments preparing complementary State Economic Empowerment and Development Strategies (SEEDS). The Kwara contribution is known as KWA-SEEDS. Jut like its parent, education was selected as one of the core areas of KWA-SEEDS. The Kwara educational targets were ambitious, especially in view of the tight time scale:

14
• Increase registration rate in primary and secondary schools to 100 percent by 2007;
• Increase attendance and retention in secondary schools to 80 percent by 2007;
• Achieve 100 percent transition from primary to junior secondary and at least 50 percent transition from junior to senior secondary by 2007;
• Increase adult literacy from 40 to 75 percent by 2007; • Increase the balance of science/technology students relative to students in
the humanities, especially in Kwara State Polytechnic, also by 2007 (KWA-SEEDS, 2004, Chapter 7).
Although data are not yet available to carry out a formal evaluation of KWA-SEEDS outcomes, it is safe to conclude that these targets, however desirable as a medium and longer-term objective, could not plausibly be achieved within the three-year time span of KWA-SEEDS. At present Kwara is preparing an Education Sector Plan (ESP) and an Education Sector Operational Plan (ESOP). These will specify operationally the linkage between education sector development and broader development plans, the role of a policy framework in developing strategies for sector reform, prioritise government interventions, and prepare an ESP financing framework. 2. Education coverage: Access to primary and secondary education in Kwara (i) Growth of school enrolments: different sources, different evidence Problems with the accuracy of enrolment statistics in Nigeria are well recognized by state and federal ministries of education, and much effort has been devoted to data collection in recent years, particularly through an annual school census (ASC/EMIS). Chart 4 shows the growth of primary enrolments in Kwara according to State Ministry of Education data (1999-2005), together with data for 2006 from the latest complete annual school census. These data show a primary enrolment of 442,858 students in 2006, with a plausible and statistically well-fitting trend of steady annual increase in recent years. Chart 5 shows similar data for secondary enrolments. The latest EMIS data for 2006 show an apparently sharp increase on previous years, but there is, just as with primary enrolments, a plausible and statistically well-fitting trend of steady annual growth. Despite the fact that the latest EMIS data fit comfortably into a longer-term pattern of steady enrolment increase, there is good reason to believe that both primary and secondary enrolments are (at least in recent years) substantially greater than shown in Charts 4 and 5. Looking first at primary enrolments, the CWIQ Household Survey of 2006 estimates a primary GER of 115.6 percent compared to the ASC/EMIS estimate of 101.0 percent. The raw data for enrolments are not published by CWIQ, but it is possible to use the size of the 6-11 age group (438,580, as noted in footnote 7 of chapter 1) to infer that the CWIQ GER of 115.6 percent corresponds to a total primary enrolment of 507,000. This is some 15 percent higher than the 443,000 primary enrolments estimated by ASC/EMIS.

15
Chart 4: Primary enrolments in Kwara: evidence from the yearly school census
Trendline equationy = 18310x + 267422
R2 = 0.7780
100,000
200,000
300,000
400,000
500,000
1999
2000
2001
2002
2003
2004
2005
2006
Male
Female
Total
Linear(Total)
Source: Data for 1999-2005 are calculated from Ministry of Education, Science and Technology, Kwara State Education Sector Plan 2005-15, September 2005 and which were in turn derived from the school census for each year; data for 2006 are from the latest complete annual school census (ASC/EMIS). Chart 5: Secondary enrolments in Kwara: evidence from the yearly school census
Trend line equationy = 12806x + 63511
R2 = 0.9101
0
40,000
80,000
120,000
160,000
200,000
1999
2000
2001
2002
2003
2004
2005
2006
Junior
Senior
Total secondary
Linear (Totalsecondary )
Source: As for Chart 4.

16
The disparity in secondary education is more dramatic. CWIQ reports a GER of 74 percent, substantially greater than EMIS’ 46.9 percent. With a secondary age group (12-17 years) of 381,746, the total secondary enrolment measured by CWIQ can be estimated as 281,299. This is 58 percent higher than the 2006 EMIS estimate of 178,891 secondary students shown in Chart 5. It is not unusual for household surveys and school-based information systems to give different results. In the general case the great strength of school-based data is that they measure the number of students who have actually enrolled, rather than being dependent on responses from parents. Many parents may themselves never have attended school and may not be sufficiently confident or familiar with the system to give reliable information. No doubt some parents give the answer for school attendance they think is expected of them. School-based data avoid these problems. But the apparent strength of a school census can be one of its weaknesses: returns are typically based on registrations at the start of the new school year and can overstate enrolments by making no allowance for dropouts in the course of the year. In the specific case of Nigeria, EMIS is a relatively recent tool, and the data available reflect the fact that coverage, verification, and allowance for non-response by some schools are still being refined. On the one hand it seems likely that private schools are being under-counted. On the other, over-reporting of enrolments in public school is a continuing concern. Enrolments in public primary school are linked with financial allocations, so there is an incentive to inflate student numbers. More benignly, but with equally problematic outcomes, when the school is the basic unit of measurement the practice (widespread among Muslim families) of attending public school in the morning as well as a private school for religious instruction later in the day can result in the double counting of enrolments. Box 3 (over) describes the main types of religious instruction. No household survey can collect the wealth of school data (on teachers, classes, facilities) that are possible in a well-functioning EMIS, but the sheer simplicity of the CWIQ household survey’s main question on school attendance --- “Is [name] currently in school?” --- is its great strength. It avoids the twin problems of school non-response or the double-counting that can arise when students attend more than one school. Misunderstandings or deception seem unlikely in the face of trained enumerators asking a sequence of follow-up questions.9 Derived statistics such as gross and net enrolment rates may be more accurate because the school-age population is calculated directly from the survey rather than being dependent on growth rates from a national population census now more than 15 years old. The CWIQ Household Survey is likely to provide the more reliable results for broad-brush statistics such as enrolments and enrolment ratios. 9 In CWIQ the simple introductory question on school attendance is followed by questions on grade and type of school.

17
Box 3: Types of religious instruction in Kwara There are, first, what might be termed conventional religious schools managed by the various Christian denominations. Such schools offer much the same syllabus as secular government schools but within a religious framework. More complex are the different types of Islamic schools. Tsangta/Qur’anic schools provide children with the opportunity to learn and recite the Qur’an and in the process learn to speak and read Arabic. Learning is generally self-paced and there is no formal grade structure. Students attending these schools often combine this form of religious education with some other type of formal or non-formal schooling. Islamiyya schools are community-based schools which provide a broader Islamic education and generally have age-based classroom teaching and whole group instruction. It is common for these schools also to include conventional/academic subjects as part of the syllabus. Because Islamiyya schools include some government/secular subjects and may well take government examinations in these subjects, they are eligible to apply for registration with the State Universal Basic Education Board. This potentially gives them access to government resources such as teachers, assistance with infrastructure and the provision of learning materials. Ilmi schools denote an informal type of usually one-on-one religious instruction and guidance conducted in Arabic. While not necessarily providing religious education, mention should also be made of Nomadic schools which target nomadic pastoralist populations as well as migrant fishermen. It is likely that all these types of schooling are represented in Kwara, but the tentative nature of that statement is because EMIS does not collect data specifically distinguishing these schools. It is not always possible to discern the type of school simply from its name. Nor is it evident that all types of religious school meet the test of providing what is generally understood as a full education for a child. The CWIQ Survey includes religious schools where academic subjects are taught as well as religious instruction, but excludes Qur’anic schools where only religion is taught. (ii) Measuring the disparity between CWIQ and EMIS It is one thing to argue that, on balance, CWIQ provides the more reliable source of data. It is much more difficult to explain why the disparities between EMIS and CWIQ are so large. It might be argued that the variation in primary enrolments (CWIQ enrolments are 15% higher than EMIS) falls within the usual margin of error of different systems of measurement, but that does not account for secondary enrolments, which are 58% higher according to CWIQ. And, when the primary school data are disaggregated and checked against locally verified information, it becomes clear that the primary disparity is not 15% but nearer 23%, well outside any customary margin of error. The explanation for the CWIQ/EMIS disparity lies in a complicated mixture of over-counted public and under-estimated private enrolments. Looking first at enrolments in public primary school, there is now convincing evidence, despite the plausible patterns of growth shown in Chart 4, that enrolment in public schools is being substantially over-counted. Disaggregation of the 2006 EMIS makes it clear that some local government authorities (LGAs) in Kwara (and no doubt other states) have returned implausible enrolments. In Patigi, for example, the claimed 2006 primary enrolment of 87,481 is equivalent to a gross enrolment ratio of 394 percent and a net enrolment ratio of 265

18
percent. There are, in other words, apparently 2.65 times as many children aged 6-11 enrolled in public primary in Patigi than there are 6-11 year children actually alive.10 Alarmed by results such as this, the Kwara SUBEB carried out for the 2006-07 school year a detailed verification exercise of public primary enrolments (that is, for LGEA schools) in the seven LGAs with a pattern of returning the most implausible EMIS results. These results are shown below, together with the EMIS public PR1-PR6 total for 2006 shown for comparison on the right. Table 4: Public primary school enrolment disparity in selected Kwara LGAs
LGA SUBEB confirmed enrolments 2006-07 ASC/EMIS 2005-06
Baruten 20,177 33,342 Ekiti 3,840 16,462 Kaiama 19,206 43,668 Moro 22,820 35,752 Offa 12,064 17,332 Oke Ero 4,023 20,588 Patigi 14,140 85,731 Source: Enrolment data provided by Kwara SUBEB and EMIS 2006 Similarly, the Kwara Teaching Service Commission, which is responsible for the allocation of teachers to public secondary schools, has developed its own database of enrolments (as with SUBEB and primary school, verified by direct tally within each school by officers from TSC) for every public secondary school in Kwara. The summary statistics are shown below, again with EMIS data for comparison. Table 5: Enrolment disparity in Kwara public secondary schools
Public secondary schools Teaching Service Commission confirmed enrolments (Feb
2006)EMIS 2006
Junior secondary school 72,345 90,823 Senior secondary school 65,226 74,816 Total secondary 137,571 165,639
Source: Data provided by Teaching Service Commission, Kwara But if confirmed enrolments from Tables 4 and 5 suggest that student numbers in public schools are being substantially over-counted by EMIS, what explains the fact that enrolments according to CWIQ are considerably higher than EMIS? The answer is that in previous years enrolment in private schools has been considerably under-estimated in Kwara. If we start with the confirmed total of public primary enrolments (96,270) for the
10 Hypothetically this can be explained by the enrolment of out-of-LGA students or the spasmodic attendance of nomadic children, but the differences in Patigi (and the other LGAs cited in Table 4) are too great for such effects to be the main explanation for the discrepancy.

19
seven LGAs directly verified by SUBEB (Table 4), this leaves a further nine LGAs whose enrolments are considered plausible and reasonably accurate. Primary enrolments for these nine LGAs in 2006 (301,786) were taken from SUBEB records.11 Total public primary enrolment for the entire 16 LGAs becomes 398,056. If the CWIQ total of 507,043 primary enrolments is accepted, this leaves a discrepancy of 507,043 minus 398,056 equals 108,987. The logic of this arithmetic is that there are 398,056 students in public primary school and therefore the remaining enrolments --- 108,987 --- are students attending private schools. Similar calculations produce a more dramatic finding for private secondary enrolments. The CWIQ data show a total secondary enrolment of 281,299. The confirmed enrolment in public secondary is 137,571 (Table 5). The difference between these numbers implies that there are 143,728 students in private secondary school. EMIS for 2006 shows a total enrolment in private secondary schools (JSS and SSS) of just 13,252, an under-estimate of more than 130,000 private students. No doubt the CWIQ enrolment totals cannot be taken totally at face value. It is also true that these calculations by necessity mix data from two school years, 2006 and 2007. For these reasons the actual number of private (and total) enrolments may differ somewhat from these calculations. What is beyond argument, however, is that private enrolments of this magnitude in Kwara are fully consistent with other evidence for Nigeria which has recently become available (Tooley and Dixon 2005). This recent research studied the size and quality of private schooling in Nigeria, Ghana, Kenya and India. One of their consistent findings was that many more children than previously thought were attending private schools. Often there were more private than government schools, and often a majority of the private schools were simply unknown to the relevant ministry or authority because they were unregistered. In Nigeria they studied three districts in Lagos State (Surulere, Kosofe, and Badagry) together with the shanty town of Makoko. Of the 540 schools in this sample, almost exactly two-thirds (355) were private unaided schools. That is, a large majority of schools were private. Of those schools, the largest number were unregistered (233 schools or 43% of the total) compared with 122 private schools that were registered. There were, in short, more unregistered private schools than registered private and more unregistered private than government schools. They found that if their sample was typical of the state as a whole, one-third of Lagos’ primary enrolments were in unrecognized/unregistered private schools that were completely “off the radar” as far as the education authorities were concerned. Kwara is not Lagos, and there is no direct evidence for Kwara to confirm directly the private enrolments estimated above. But the results for Lagos (and for the other countries in the Tooley and Dixon study) cannot be dismissed as irrelevant: Badagry is a rural district, just as Kwara is predominantly rural. Their research is strongly suggestive of the 11 Kwara State Universal Basic Education Board, Recurrent and Capital Budget Estimates, November 2005, Overall Summary, page 5.

20
fact that there are many more private schools operating in some developing counties, Nigeria among them, than previously thought. The evidence from CWIQ and EMIS strongly implies that the same is true of Kwara.12 (iii) Putting the numbers together Table 6 summarises the overall enrolment statistics and ratios derived from the CWIQ household survey. Table 7 shows the details of primary enrolment by grade, gender and type of school. Table 8 shows similar data for secondary enrolments. Table 6: School enrolments in Kwara, 2005-06 Enrolments Gross enrolment rates Net enrolment rates Male Female Total Males Female Total Male Female Total Primary 260,679 246,365 507,043 114.6 116.7 115.6 77.8 79.6 78.6 Junior secondary 83,559 66,064 149,623 80.9 68.9 75.0
n.a. Senior secondary 69,405 62,271 131,676 80.0 65.5 72.8
Total Secondary 152,964 128,335 281,299 77.3 69.8 74.0 50.2 45.4 48.1
Source: All enrolments and enrolment rates for Primary and Total Secondary are calculated from the CWIQ Household Survey. CWIQ does not report separate data for junior and senior secondary. Enrolments and rates for junior and senior secondary are estimated by applying the JSS/SSS and male/female proportions from EMIS 2006 to the aggregate CWIQ data. While EMIS is under-counting aggregate enrolments, there is no evidence of systematic bias between levels of schooling or between genders. This means that the entries for junior and senior secondary in the Table are not precise, but they are consistent with the overall CWIQ data and are likely to be more accurate than using EMIS alone. Table 7: Primary enrolments by grade, gender and type of school PRY1 PRY2 PRY3 PRY4 PRY5 PRY6
Total Primary M F M F M F M F M F M F
Public 50,552 46,537 40,510 36,877 32,930 31,968 30,429 29,606 26,951 26,610 23,178 21,908 398,056
Private 13,872 12,712 11,116 10,073 9,036 8,733 8,350 8,087 7,395 7,269 6,360 5,985 108,987
Total 64,424 59,249 51,626 46,950 41,966 40,701 38,779 37,693 34,346 33,879 29,538 27,893 507,043
Source: The grade and gender structure for public primary is calculated from the detailed statistics calculated for the seven LGAs with confirmed and verified enrolments, scaled up to the overall total of 398,056 public school enrolments calculated in the text. The disadvantage of relying on these seven LGAs is that they do not take account of the possibly different structure applying in the more urban Ilorin LGAs. However, the seven LGAs offer meticulously accurate data covering a substantial 35% of the public primary sector, and are likely to be more accurate than derivation from EMIS. Little is known of the structure of private primary enrolments and the data in EMIS is inconsistent from grade to grade. In the absence of more direct evidence, the gender and grade structure of private primary enrolments is assumed to be the same as for public primary. 12 This chapter is concerned with the measurement of public and private enrolments rather than the quality of education, but it is worth noting that Tooley and Dixon found clear evidence that even the unregistered private schools, often dismissed as being little more than “diploma factories”, were in fact, on the basis of standardized tests, offering schooling that was often of a higher quality than in government schools. This finding is entirely consistent with the evidence from Chapter 4 of this study that private schools in general performed better than government schools in the 1996 and 2003 tests of P4 and P6.

21
Table 8: Secondary enrolments by grade, gender and type of school JS1 JS2 JS3 Total JSS M F M F M F Public 13,434 11,638 13,211 10,858 12,632 10,572 72,345 Private 14,405 10,007 15,987 12,576 13,890 10,413 77,278 Total 27,839 21,645 29,198 23,434 26,522 20,985 149,623 SS1 SS2 SS3 Total SSS M F M F M F Public 12,578 10,087 12,038 9,408 11,951 9,164 65,226 Private 11,819 12,809 11,048 11,569 9,971 9,234 66,450 Total 24,425 20,285 23,395 19,185 22,389 17,147 131,676
Source: Enrolments in public school show the details of the confirmed secondary enrolments already summarized in Table 5. In the absence of specific information, the grade and gender structure of private secondary is assumed to follow the same pattern as public secondary. (iv) Kwara in Nigerian perspective With the derivation of the specifically Kwara enrolments complete, it is useful to see how Kwara compares with other States in Nigeria. This evidence is shown in Charts 6 and 7. These charts show net enrolment rates for primary and secondary respectively, with the states arranged in rank order and the quadrants demarcated by the national average in both the qualitative sense (horizontal axis) and quantitatively (vertical axis). Kwara is significantly “above the line” for primary net enrolments, but is only just above average in its secondary enrolment rate. Chart 6: Primary net enrolment rates for all Nigerian states, 2005
Kwara
20.0
40.0
60.0
80.0
100.0
Zam
fara
Jigaw
aSo
koto
Keb
biG
ombe
Born
oY
obe
Bauc
hiK
atsin
aK
ano
Nig
erTa
raba
Nat
. Ave
rage
Ada
maw
aK
adun
aN
asar
awa
Baye
lsaEb
onyi
Rive
rsEd
oCr
ossR
iver
Oyo
Benu
eD
elta
Akw
a Ib
omK
war
aPl
atea
uEn
ugu
Kog
iA
bia
Lago
sFC
TIm
oO
gun
Osu
nO
ndo
Ana
mbr
aEk
iti
Prim
ary
NER
Source: Calculated from data in National Bureau of Statistics, 2006 Core Welfare Indicator Questionnaire Survey (CWIQ), Abuja.

22
Chart 7: Secondary net enrolment rates for all Nigerian states, 2005
Kwara
0.0
20.0
40.0
60.0
80.0
Jigaw
aG
ombe
Soko
toZa
mfa
raK
ebbi
Bauc
hiK
atsin
aY
obe
Born
oK
ano
Tara
baN
iger
Ada
maw
aK
adun
aPl
atea
uEb
onyi
Nas
araw
aBe
nue
Nat
. Ave
rage
Kw
ara
Baye
lsaO
gun
Edo
Del
taFC
TA
kwa
Ibom
Rive
rsK
ogi
Enug
uA
bia
Imo
Cros
sRiv
erO
sun
Ana
mbr
aO
yoO
ndo
Lago
sEk
iti
Seco
ndar
y N
ER
Source: Calculated from data in National Bureau of Statistics, 2006 Core Welfare Indicator Questionnaire Survey (CWIQ), Abuja. Charts 8 and 9 presents these enrolment rates in different perspective. Kwara’s progress with primary and secondary enrolments can be judged not just in relation to performance by other states, but in relation to the size of the task. A state with an already high level of education embodied in the adult population faces a less demanding task than a state which has to make up much lost ground through earlier inadequacies. Charts 8 and 9 combine the stock of education (measured by the proxy of adult literacy) with the flow indicator of net enrolment rates for primary and secondary. The stock indicator shows the state of a country’s educated population. That is to say, it reflects past efforts. The flow indicator provides information about current efforts to provide opportunities for education. The figures illustrate how all the states in Nigeria can be ranked on these stock and flow indicators, with the quadrants demarcated by the mean values for each variable. The top-right quadrant of each Chart shows the “good performers”, those states which have an already above-average level of adult literacy and which are continuing to experience above-average primary and secondary enrolment rates. The bottom-left quadrant displays those states which are below average on both past and present educational provision. Chart 8 suggests that Kwara lies in what might be termed the “improving category”, (top left quadrant) with a low stock of educated people but now performing well with primary enrolments. Chart 9 indicates that Kwara only just slips into the improving category for secondary education, with a secondary enrolment rate barely above the Nigerian average.

23
Chart 8: Education stock and primary enrolment, all Nigerian States, 2005
Kwara
0
20
40
60
80
100
0 20 40 60 80 100
Adult l iteracy (%)
Prim
ary
net e
nrol
men
t (%
)
Source: Calculated from data in National Bureau of Statistics, CWIQ Survey, 2006 Chart 9: Education stock and secondary enrolment, all Nigerian States, 2005
Kwara
0
20
40
60
80
100
0 20 40 60 80 100
Adult literacy (%)
Seco
ndar
y ne
t enr
olm
ent (
%)
Source: Calculated from data in National Bureau of Statistics, CWIQ Survey, 2006

24
(v) Intake and completion in primary and secondary schooling Gross and net enrolment rates offer a useful overview of student numbers, but by themselves they do not provide two critical pieces of information. The first of these is that if Kwara is to achieve improvements in enrolment (for example, progress towards universal basic education) the key indicator is not so much the total number enrolled in school as the proportion of children who start primary or junior secondary. The second key indicator is that students must not just start school: they must also complete the education cycle. A student who, say, attends university for only a year or two may acquire some additional skills, but as a general rule completion of the cycle (and the leaving certificate as evidence of completion) is necessary to derive the full educational, economic and social benefit. In primary school, there is considerable international evidence to suggest that at least 4-5 years of attendance are necessary to achieve functional literacy and numeracy. In addition, it is desirable that completion is achieved in an efficient way, which is to say that the necessary skills and knowledge are obtained without costly high rates of grade repetition. Data do not exist in Kwara to calculate the usual efficiency indicators directly from the enrolment data. The enrolment rates calculated earlier are for a single year, so it is not possible to measure grade progression, dropout and survival from a reconstructed cohort.13 In the absence of such data, a proxy method is to relate intakes and completion to the relevant age groups. For example, the primary completion rate can be measured as total enrolment in PRY6 divided by the population of finishing age (which is 11 years in Kwara). Age-related indicators such as this work well in a relatively stable system where most students enrol and complete at the notionally correct age. In the dynamic enrolment situation which characterises today’s Kwara, with surging primary and junior secondary enrolments and classes containing a very wide distribution of ages, age-related indicators are a secondary order of business. Right now, the Kwara State Government is intently serious in getting all children into school and making sure that they complete the cycle. To put this another way, the critical question in current circumstances is not whether enrolment or completion approaches 100% in relation to the notionally correct age. The important question is whether the 64,424 males and 59,249 females who started PRY1 in 2005-06 (Table 7) will survive to complete the primary cycle and then move on to junior secondary. While the evidence is limited, it is possible to put together bits and pieces of information that tell a generally benign story of dropout, repetition, and survival. First, while uncertainty about both enrolments and the size of the age group makes it reasonable to quibble about the precise size of the numbers, the very high enrolments in PRY1 shown in Table 7 (which correspond to an intake rate of 159% for boys and 158% for girls) is likely to be an accurate reflection of what is happening with the cohort starting primary school. It is not the only State to be doing this, but Kwara takes very seriously the task of getting everyone into primary school. Parents are actively encouraged to enrol their 13 Provided grade enrolments and repetition are known for two adjacent years, it is possible to infer (or reconstruct) the flow of an entering cohort of students through a school system on the assumption that the pattern for the two years will remain constant.

25
children, not just through the usual publicity programs but also through more direct methods.14 Tuition fees are no longer payable for primary or junior secondary. As elsewhere in the developing world, fee removal has led to a surge of enrolments. The age-by-grade data in Kwara are only patchy, but there is clear evidence of substantial over-age enrolments, with many over-age children who would not have enrolled 2-3 years ago now starting primary school.15 There is also substantial under-age enrolment. In past years pre-school was the preserve of private providers, but by deliberate policy there is an increasing number of public pre-schools. These are generally located within a primary school, often using the same teachers. The effect has been to blur the distinction between pre-primary and primary grades, so that Primary grade 1 (especially in the urban areas) now contains numbers of under-age children.16 Second, it seems likely that Kwara is not just enrolling very high numbers in PRY1 but is also keeping them in school. Grade repetition is no longer an issue, because automatic grade progression has been introduced. The educational outcomes of this policy are debatable,17 but the result in terms of student flow is unmistakeable: once enrolled, students will generally flow through the system. Moreover, dropout rates in public school are low, with only marginally higher rates for females than for males. Specialist opinion from the Technical Working Group is that dropout rates in public primary and junior secondary are as low as 1.0-1.5%. Dropout from senior secondary is even lower, and dropout from private schools is minuscule, with the high motivation of parents who pay for private schools resulting in a readiness to allow their child to repeat if necessary for good performance rather than dropout. These low rates of dropout seem extraordinary for a developing country, but fragmentary evidence from the Nigeria DHS EdData Survey of 2004 (Tables 5.5 and 5.6) supports the argument that dropout rates at all levels are no greater than 1%.
14 The Ministry of Education operates a “truancy bus” which cruises the streets of Ilorin rounding up school-age children and youths who are not in school. The first stop is the grounds of the Ministry where they are given a thorough dressing-down, in the instance witnessed by this writer not always gently administered. This is followed by a visit to their home where their parents are given advice on the importance of ensuring school attendance. 15 In 2007 in Ilorin West, preliminary evidence shows that 18% of PRY1 students were over-age; in Baruten the figure was 21%; in Edu the majority of PRY1 were over-age (61%), including some students aged 11 and 12. 16 Again to cite the example of Ilorin West, 18% of PR3 students were younger than the nominal age of 8 years. That is, nearly one-fifth of third grade students must have enrolled in PRY1 aged 4 or 5 years rather than the nominal 6 years. 17 In the international literature there has been a strong body of educational opinion that forcing students to repeat achieved very little, either academically or in terms of the child’s social development. Many developed countries have stopped the practice of grade repetition. It subsequently became common for donors and consultants to recommend that developing countries should also adopt the practice of automatic grade promotion. There has been some recent rethinking of this view. Automatic grade promotion is highly effective in the short run because it moves students through the system and raises the measured efficiency. It may be appropriate in developed countries where extra resources can be devoted to individual students. In developing countries with more limited budgets automatic promotion may simply defer the problem, ultimately producing a body of primary or secondary graduates who have not mastered the required curriculum.

26
With zero rates of repetition and near-zero rates of dropout the effect is that those substantial numbers of children who are now starting primary school are also completing PRY6, girls at about the same rate as boys. Even if we allow a dropout rate of 1.5% and a notional repetition rate (because even with automatic progression there is generally a small number of students who perhaps through extended illness are required to repeat a grade), more than 90% of today’s PRY1 students will survive to complete PRY6 and do so in minimum time. Moreover, it seems likely that an increasing proportion of those completing PRY6 now move on to junior secondary. As noted earlier, it is not possible to calculate true transition rates, but it is possible to estimate registration rates. These are defined as JSS1 and SSS1 enrolments net of repeaters (which in practice are close to zero) divided by the number of PRY6 and JSS3 enrolments respectively. This procedure results in registration rates of 95% and 85% for males and females respectively in JSS1, and 93% and 90% for males and females in SSS1.18 These numbers are, to say the least, high for a developing country, but again specialist opinion from the Technical Working Group confirms that they are the right order of magnitude, with most boys now moving on to junior secondary but female participation lagging some ten percentage points behind. The removal of fees and the automatic grade progression have lowered the direct costs of remaining in school. While there are of course other costs which a family incurs from keeping its children in school (transport, uniforms, etc), it is important to record the view of the Technical Group that many parents are now well aware that a primary leaving certificate is no longer a passport to any sort of job. The Kwara economy has performed poorly, and only those with increasing amounts of schooling stand a chance of wage employment. In short, for many families the indirect or opportunity costs of keeping children in school are also low. 3. Education coverage: Access to post-secondary education in Kwara (i) Organisation and structure If primary and secondary education in Kwara are in a state of dynamic change, so too is the post-secondary sector, with many changes taking place at the time of writing. As recently as late 2007, it was possible to offer a crisp summary of Kwara’s post-secondary institutions, as follows. The state government has overall responsibility for eight higher education institutions. Five of these are the responsibility of the Ministry of Education:
• Kwara State Polytechnic, Ilorin 18 The usual data limitations mean that these have the weakness of measuring leavers from one cycle and enrolments into the next in the same year. They are, however, not tied to any specific age of completion or intake and so are unaffected by the substantial age distribution of those leaving PRY6 and JSS3 and enrolling in the next cycle.

27
• College of Education, Ilorin • College of Education, Oro • College of Education, Lafiagi • College of Arabic and Islamic Legal Studies, Ilorin
Three come under the responsibility of the Ministry of Health:
• Kwara State Nursing School, Ilorin • Kwara State School of Midwifery, Ilorin • Kwara State School of Health Technology, Offa
In addition, the University of Ilorin, situated in the state capital, is funded by the Federal Government.19 Kwara State Polytechnic has the most diversified range of training activities, offering a total of 67 courses with a strong focus on engineering and management subjects. The three Colleges of Education provide mainly three-year, pre-service teacher training for both primary and secondary schools. They all award the National Certificate of Education. The College of Education at Lafiagi specialises in training teachers for technical subjects. The College of Arabic and Islamic Legal Studies provides mainly diploma-level training in Sharia law, Arabic and Islamic arts subjects. Most of its legal diplomate graduates are employed as administrative and court officers. The Nursing School and the School of Midwifery are classified as ‘monotechnics’ since they train only nurses and midwives. The School of Health Technology at Offa trains laboratory and health technicians. It is now clear that the State Government is undertaking a major re-organisation: First, Kwara intends to remedy the situation of being one of the few states in Nigeria without its own State University. The proposed Kwara State University will start life in two ways. It will have a pre-degree programme (School of Remedial Studies) located at the existing College of Education, Ilorin; and the main degree activities will commence at the present site of the polytechnic. Second, it is not clear at present how the Polytechnic activities and awards will change, either remaining as a free-standing institution oriented to engineering and management or alternatively continuing to offer those programmes but within a new State University. What is clear is that as a matter of urgency it will be relocated from its main campus, because that campus will be used for the new university. The polytechnic is being relocated to the old mini-campus of the federally-funded University of Ilorin.
19 Because this paper focuses on educational institutions which are a Kwara responsibility, only passing references are made to the University of Ilorin.

28
Third, the three Colleges of Education are being amalgamated into one institution based at Oro, but that broad policy decision is not yet backed up by detailed operational structures. In principle the existing departments and functions of the colleges at Ilorin and Lafiagi will move to Oro, “stressing that the development was to increase the number of departments and academic curricula of the institution”.20 In practice it seems likely that some rationalisation of teacher education programmes will take place. As noted above, the Ilorin campus will offer basic or remedial studies as part of the university, and anecdotal comment suggests that the Lafiagi campus will also affiliate will the university but specialising in agricultural studies. (ii) Access and participation Table 9 shows the pattern of enrolments at the various institutions as they are currently constituted. Table 9: Enrolments in post-secondary institutions in Kwara Institution 2005 2006 State Ministry of Education
M F M F
Kwara State Polytechnic 12,726 14,284 College of Education, Ilorin 4,070 6,512 2,846 4,501 College of Education, Oro 2,025 2,447 College of Education, Lafiaji 838 624 897 566 Coll. of Arabic & Islam. Legal Stud. 853 271 351 217
Sub-total 27,919 26,109 State Ministry of Health Nursing School, Ilorin 70 430 30 380 School of Midwifery, Ilorin 9 165 School Health Technology, Offa 354 1,386 384 1,584
Sub-Total Grand Total Source: All data provided directly by the institutions. Women are very well represented in higher education in Kwara. It may not be surprising that they form 68.3 percent of enrolments in the traditional role of nursing and midwifery training, nor perhaps that they comprise 60.1 percent of students in the teacher training colleges. What is interesting is that women also make up 54.9 percent of enrolments in
20 Kwara State Government home page, “Why Kwara Poly was relocated”, February 2008.

29
the College of Arabic and Islamic Legal Studies and 38.1 percent in the engineering- and management-oriented Polytechnic. A total of 48,145 full and part-time students were enrolled in Kwara’s higher education colleges in 2005/06. Part-time students are concentrated in the College of Education in Oro and the Polytechnic.21 If each part-time student is counted as half, the full-time equivalent total enrolment is 44,010. Using the age group 18-21 as the denominator, this gives a gross enrolment rate of 25 percent. Inclusion of the 14,000 students (2004) in the University of Ilorin raises the gross enrolment rate to 33 percent. Because the age range of post-secondary students is often very wide --- with some students going to college straight from school and others going back to study as mature adults --- an alternative to using the gross enrolment ratio is to ignore age structure and simply relate enrolments to population. This gives a result of 1,983 per 100,000 Kwara inhabitants. This is high by both Nigerian and international standards. In Nigeria as a whole tertiary enrolments amount to 1,024 per 100,000 inhabitants. This itself is far higher than the average for Sub-Saharan Africa, which stands at 708 students per 100,000 inhabitants (UNESCO 2006). While Kwara has a large number of higher education students, Tables 6 and 7 make it clear that the rate of growth has substantially slowed. Full-time enrolments increased by only 9 percent in the five years up to 2005, and part-time enrolments declined. Even with slower enrolment growth, a critical issue for education policy (to be reviewed in later chapters) is whether this very high level of tertiary enrolments is appropriate.
21 Part-time students in Kwara, as elsewhere in Nigeria, are not simply those who choose to pursue their qualification by part-time study. They enrol in special or “parallel” courses which cater for separate intakes of students who usually pay much higher fees than the official intakes of students and who have lower passes in public secondary school examinations.

30
Chapter 3: Education Costs and Finance 1. A complex story It is easy in Kwara, as it is in Nigeria generally, simply to itemise the main sources of State Government revenue and expenditure. Those details were summarised in Chapter 1. The problem is that State finances present only a very partial picture of educational finance. While State Governments and LGAs notionally fund most aspects of education, in practice much of that funding originates with the Federal Government. The difficult task is then to identify the funding from each source while at the same time avoiding omissions or double-counting. The pattern of centralised funding but decentralised provision and responsibility is common in countries with a federal structure, but the Nigerian situation is complicated not only by lack of data but because the Federal and State Governments and Local Government Authorities (LGAs) all have responsibilities for providing and funding education, but often with overlapping responsibilities for the different levels of education. State governments have responsibilities in all sub-sectors of education, but in Kwara transfers from the Federation Account Allocation Committee have made up 60-70 percent of Kwara’s revenue in recent years. Similarly, LGAs shoulder the brunt of costs for primary education because they are responsible for paying teachers’ salaries, but LGAs have few own-source revenues: most of their funding comes from the local governments’ share of the Federation Account. Even then the role of the LGAs is more nominal than a statement of actual practice. The LGAs have effectively lost much control over primary funding because primary teacher salaries are deducted as a “first charge” from the gross federal allocations to the LGAs and are now paid through State Universal Basic Education Boards (SUBEB). The State Ministry of Education is responsible for its SUBEB and each SUBEB is dependent on the Ministry for its salaries and operating resources. 2. The overall pattern of funding In Kwara there are three main sources of funding: (i) Kwara State Government: a. The State Government is the main source of public funding for all secondary education and for the State higher education institutions described in the previous Chapter;

31
b. The State Government supports primary school non-salary recurrent items and capital costs and provides matching funds for the Universal Basic Education Committee (UBEC) Intervention Fund. 22 (ii) Local Government Authorities There are 16 LGAs in Kwara State which pay the salaries (through SUBEB) of all teaching and support staff in public primary schools. In addition, local governments (again through SUBEB) commit amounts for non-salary recurrent expenditure and capital expenditures. These latter amounts need to be interpreted with some care. Capital expenditure for 2006 was N659 million, 13.5% of its proposed total expenditure, but virtually all of this (N571 million) came from the UBE Intervention Fund. Although all of this Fund is classified as capital expenditure in the SUBEB accounts, 15% of it is allocated to textbooks and instructional materials (more usually considered a recurrent item) in line with UBE Intervention requirements.23 Conversely, in 2006 only slightly more than half (55%) of SUBEB spending on so-called “overhead” or non-salary recurrent items actually went to instructional materials or printing: the rest was allocated to a variety of expenses such as utilities, bank charges and transport.24 (iii) Federal Government a. Until 2005, direct federal funding of state-level schools and other education and training institutions was limited. Social services (under which education falls in the national budget) received poor allocations, falling to a low of 7.5 percent in 2002. Much of this --- 60 percent in 2004 --- went to tertiary education. b. The Education Tax Fund (ETF) was established in 1993 as the main source of direct funding of education by the Federal Government at the state level. The tax is financed by a 2 percent levy on the assessable profits of all registered companies in Nigeria. ETF is made available for specific capital projects, and here too there has been a heavy bias towards post-secondary institutions. Out of a total amount of N38,451.9 million disbursed by ETF between 1999 and 2003, 10,673.4 million went to primary (28 percent) and 6,796.8 million (18 percent) went to secondary.
22 It would make a small but useful contribution to education planning in Nigeria if government documents (Federal and State) ceased referring to non-salary recurrent expenditure in schools as “overheads”. If only that were true! In standard usage overheads are those expenses such as office rent or interest on borrowing which at least in the short term have to be met regardless of the volume of transactions or the level of business. They are, in short, the “first charge” on a company’s or ministry’s income. This is quite different from the non-salary recurrent items of books, materials and teachers’ guides in education. There is ample evidence from right around the developing world that so far from being treated as overheads or fixed in the short term, these items are the first to be cut when budgets are tight, to the great detriment of educational quality. Because it is usually hard to fire teachers, as a general rule it is teachers’ salaries which constitute the “first charge” in public educational budgets. 23 It is a condition of UBE Intervention that 70% should be spent on infrastructural development, 15% on textbooks and 15% on teachers’ development and research. 24 All these data are provided in Kwara State Universal Basic Education Board, Kwara State 2006 Budget Estimates, Recurrent and Capital Budget Estimates, November 2005.

32
c. Under the provisions of the Universal Basic Education Act of 2004, a UBE Intervention Fund has been created. The UBE legislation provides for funding of UBE from three sources: (i) block grants, in the form of federal matching contributions to state financing of primary and junior secondary education of not less than 2 percent of federal Consolidated Revenue Fund; (ii) funds or contributions in the form of federal guaranteed credits and loans; and (iii) access to international donor grants. It is apparent from even this brief summary that it is not easy to compile a composite picture, net of all transfers, of educational expenditure. Table 10 attempts to summarise the main items. Table 10: Public Educational Expenditure in Kwara, 2006 Source/spending unit 2005 2006
Recurrent education expenditure (i) by Kwara State Government 2,206,939,035 2,207,700,030 of which Ministry of Education 2,177,041,967 2,175,101,901 of which Ministry of Health 29,897,068 32,598,129(ii) by LGA/SUBEB 3,682,815,845 4,236,806,660Total public recurrent expenditure on education 5,889,754,880 6,444,506,690 Capital education expenditure (i) by Kwara State Government 575,800,000 1,165,553,960 of which Ministry of Education 555,800,000 1,145,553,960 of which Ministry of Health 20,000,000 20,000,000(ii) by LGA/SUBEB 95,403,876 659,362,744Total public capital expenditure on education 671,203,876 1,824,916,704 Total public expenditure on education 6,560,958,756 8,269,423,393Total public expenditure, all activities 47,318,486,956 44,914,002,114 of which Kwara State Government 34,449,478,097 31,012,498,590 of which Kwara LGAs 12,869,008,859 13,901,503,524 Education expenditure as % of all public expenditure in Kwara (State Govt +LGAs)
13.9% 18.4%
Source: All data for Ministry of Education comes from Kwara State Government, Report of the Accountant General for the years ended 31st December 2005 and 2005. In these accounts for 2005 (but not 2006) the Ministry of Education includes as part of its own spending N313.884 million for State Universal Basic Education. Partly for consistency between the two years, but more importantly because this amount is also included as part of SUBEB’s income and expenditure, SMOE spending in 2005 was adjusted to exclude this item. Data on recurrent expenditure for the Ministry of Health was provided directly by the Schools of Midwifery and Health Technology; recurrent spending by the Nursing School was provided for 2005 by Bennell et al., Education Public Expenditure Review, 2007, and the same figure was used for 2006. Capital expenditure for 2005 for the three Ministry of Health schools also came from the EPER, and in the absence of other information the same figure was used for 2006. All data for LGA/SUBEB educational expenditure came from Kwara State Universal Basic Education Board, Recurrent and Capital Budget Estimates, 2005 and 2006. Data on total public expenditure, all activities, is not available for the LGAs. Assuming they spend all their receipts, total expenditure was measured by their total revenue. Much the largest component of LGA revenue is the federal allocation to each LGA, downloaded from the Federal Ministry of Finance website, www.fmf.gov.ng.

33
Because of its “lumpy” nature, capital expenditure is notoriously volatile, and indeed part of the increase in total educational expenditure shown in the Table is due to the substantial rise in capital spending between the two years. But the overall increase in education expenditure is not illusory: it is clear from Table 10 that recurrent spending also increased by almost 10%. The rise between 2005 and 2006 is part of a longer-term increase in spending since 2001, with Kwara having the fastest-growing rate of growth of educational spending of the nine Nigerian states for which there is evidence (EPER, 2007:47). Kwara is now spending some 18.4% of its combined State and LGA expenditure on education, which compares favourably with the share of the Nigerian federal budget devoted to education and is close to the average of the nine states whose spending has been tallied. An alternative comparison is to measure education expenditure per head of state population. Table 11 shows these data. Table 11: State and LGA education expenditure per capita, 2005
Borno 1,680 Cross River 2,322 Enugu 2,698 FCT 4,618 Jigawa 1,755 Kaduna 1,902 Kano 1,406 Kwara 3,070 Lagos 3,945
Source: Data for Kwara calculated from Table 10 and population total of 2.371 million. Data for other states from Bennell et al (2007) p.48. 3. Allocation between sub-sectors of education The evidence of Tables 10 and 11 is that Kwara is not out of line by Nigerian and indeed by international standards in the proportion of its overall state expenditure which goes to education. But that satisfactory total amount tells as nothing about whether it is being allocated effectively within education. At least as important as overall spending is the way that expenditure is distributed between the different levels of education. Table 12 shows the percentage distribution for Kwara.25 Chart 13 compares Kwara with five other states for which evidence exists.
25 It is possible to calculate the percentage shares in the Table in a “top-down” manner by disaggregating the overall expenditures shown in Table 10. The shares presented in Table 12 were estimated by a “bottom-up” method using the quantities of books, teachers, other staff, etc and the average amounts of public money spent on those quantities. These latter estimates were derived from the EPSSIM projections of future resource requirements presented in the second volume of this report.

34
Table 12: Intra-sectoral allocation of public expenditure 2006
Primary education (public) includes public pre-primary 53.9%Junior Secondary education (public) 12.5%Senior Secondary education (public) 13.2%Higher education (public) 19.5%Mass Literacy 0.4%Cross-cutting expenditures 0.6%Total 100.0%
Chart 11: Public educational expenditure shares by type of education, 2005
0
10
20
30
40
50
60
70
Borno Cross River Kaduna Kano Kwara Lagos
Primary
Secondary
Tertiary
Source: Calculated from Bennell et al (2007) Table A5.4 There is no uniquely correct intra-sectoral allocation: it depends upon the existing structure and the policy objectives. But Kwara is not out of line by the standards of other states. The six states for which data are available do not constitute a large sample, but the evidence of Chart 12 suggests that by some distance Kwara allocates a higher proportion of its public spending to primary (59 percent) than other states, with a slightly below average allocation to secondary (27 percent). Its allocation to higher education of 10-15 percent in recent years is average for the six states shown, but, like those states, is low by the standards of other Sub-Saharan countries.

35
4. Functional composition of expenditure Table 13 gives a quantitative perspective on what can be directly observed in many Kwara schools. With salaries accounting for more than 90 percent of expenditure, very little money is available for textbooks, teachers’ guides and other essential learning materials. All these items are in very short supply. It is Kwara State policy that every primary school student should have exclusive use of the five core subject textbooks, which is equivalent to a student-book ratio of 0.2:1. In practice, the overall ratio is 3.4:1, nearly 20 times higher than this norm. The textbook situation is even worse in junior and senior secondary schools. According to the EMIS school census, the student-textbook ratios average 5.5:1 in junior secondary and 7.4:1 in senior school. Table 13: Functional distribution of recurrent expenditure, Kwara 2005 Salaries Other recurrent
items Total
Primary 95 5 100 Secondary 91 9 100 Tertiary 70 30 100 Source: Calculated from Bennell et al 2007, Tables 2.7 and 5.7 SUBEB has been active in providing books for primary schools, but the number supplied has fallen far short of the number of students in each LGEA. Only 53,000 books were supplied between January and September 2006 (for a total of 390,000 primary students) and the distribution of books between LGEAs appears to be quite uneven. Ilorin south distributed 7,384 books among 7,384 primary students, a ratio of 3:1, but Edu distributed fewer books (4,506) among many more students (51,292) to give a ratio of 11:1. It is not uncommon in many countries for students and their families to purchase their own school books, but the heavy incidence of poverty in Kwara is a severely limiting factor. With many students lacking access to basic textbooks for each subject, teaching often consists of an extreme form of “chalk and talk”, with students spending most of their time transcribing notes written by teachers from the blackboard. Higher education has a better balance, with some 30 percent of recurrent spending going towards non-salary items. Private and household expenditure Table 14 6. Unit costs by educational level Table 15 displays summary information on the unit costs of education in Kwara. The Table is characterised by two key, related findings: secondary and tertiary unit costs are both low and highly compressed relative to benchmark primary costs. Primary unit cost falls within the normal range of international experience. Using again the figure of GDP per head of US$660 estimated earlier, the ratio of primary unit cost to GDP per head in

36
Kwara is 16 percent, which compares well with the average for Sub-Saharan Africa of 14 percent of GDP per head (UNESCO, Institute of Statistics, 2007, Table 19). Table 15: Unit costs in education, Kwara 2006 Recurrent public
expenditure (Naira, millions)
Enrolments in public schools
(000s)
Unit costs (Naira)
Unit costs (US$)
Primary 3,566.2 312 11,430 104 Secondary 1,551.3 129 12,026 109 Tertiary 2,006.0 44 45,581 414 Notes and Sources: Primary and secondary unit costs are calculated by applying the sectoral shares of expenditure in Table 9 to the total public recurrent expenditure calculated in Table 8. These sectoral totals are divided by enrolments in government schools as noted in Bennell et al 2007, Table 4.14. Tertiary unit expenditure is from Bennell et al 2007, Table 5.6, plus the amount of household expenditure for tertiary education estimated in Table 8. While Table 11 matches government expenditure with students in government schools at primary and secondary level, the fact that private expenditure adds 50 percent to public spending at tertiary level means that such expenditure cannot be excluded if a realistic picture of per-student cost is to be estimated. Tertiary enrolments are full-time equivalents, with each part-time student counted as one-half, as estimated in Chapter 2. Given that primary benchmark, it would be expected that secondary costs would be around 28 percent of GDP per head, the average for SSA countries. In Kwara, however, cost per student in secondary school is imperceptibly higher than in primary school. Given that secondary school should be offering more highly skilled (and therefore better paid) teachers, more teachers per class to cope with the specialised subject teaching typical of secondary school, and laboratories, libraries and computers, the implication from Table 11 is that Kwara’s secondary schools are not supplied with these things. Similarly, even if it is acknowledged that Kwara’s polytechnic, teacher training and health colleges are not research-oriented but predominantly teaching institutions, unit costs in Kwara’s higher education colleges are extremely low. Even in a mainly teaching college, well-qualified staff and small classes would be expected, with the result that tertiary unit costs may well amount to 10-20 times larger than primary costs. In Kwara the ratio is just 4:1.

37
Chapter 4: Educational Quality 1. Measuring the quality of schooling The measurement of educational quality is one of the most difficult and indeed one of the most contentious issues in education planning. Few would deny the multifaceted nature of schooling. In any country schools try to achieve a wide range of social, personal and cultural objectives and these objectives are all part of what is meant by “educational quality”. In attempting to measure educational quality, it is obviously desirable to have performance or outcome measures which are not confined to the limited indicator of cognitive achievement such as success in the “three Rs” of reading, writing and ‘rithmetic. On the other hand, it has to be acknowledged that some of the broader educational objectives are immensely difficult to define (not least because they are often value-laden concepts) and are even more difficult to measure in quantitative terms. These problems do not mean that attempts to define and measure quality are fruitless. Student academic achievement is by far the most important and fundamental issue in schooling. Whatever the variety of objectives they pursue, all schools have as their central purpose the academic development of their students. Even this critical indicator of quality is not always measured appropriately. Most commonly, the quality of cognitive achievement is measured by exam results, and results over time are seized upon as evidence of improving or deteriorating quality. In most countries, national or provincial examinations are norm- rather than criterion-referenced so comparisons over time are not meaningful.26 Poorly-designed examinations may not even measure academic achievement in a convincing way because they do not accurately distinguish between good and bad students.27 The answer to this problem is to measure academic quality through standardised tests, but this still leaves the critical question of distinguishing good students from good schools. There is much evidence from the international literature that family background --- family income, education of parents, parental expectations for their children ---are an important and perhaps decisive influence on student achievement. And, not least, there is often a problem of what is known technically as endogeneity, or reciprocal causality. One example of this is selection bias. Not all students, especially in towns where there may be a choice of school, simply attend the nearest school: parents may choose to send
26 That is to say, the examinations show how well students have performed in relation to each other, not whether they have mastered a particular body of knowledge. Norm-referenced examinations are typically used for selection purposes, such as competing for a limited number of secondary or tertiary places. They do not measure absolute levels of achievement, and improvements in the pass rate over time may reflect nothing more than easier conditions of entry to the next level of education. 27 A good examination consists of well constructed test items that distinguish between good and bad students. Where virtually every pupil is able to answer a question correctly, that item may have been poorly constructed; conversely, where virtually all pupils fail an item, that item may have been badly constructed. In each case the item is not distinguishing between students. The ideal item is one which most of the best pupils are able to answer correctly while most of the weak pupils fail it.

38
their children to perceived “good” schools, whether public or private. Such schools may owe their high performance at least partly to selection by motivated families, and so a mutual cause-and-effect relationship between family background and school performance is established.28 Statistical techniques can in principle disentangle these relationships, but only by the difficult task of identifying exogenous variables that are genuinely a cause but not an effect of school performance. Distinguishing good schools from good students is by no means an easy task. 2. The evidence for Kwara These conceptual and measurement problems should not be ignored, but nor do they diminish the value of even partial evidence on such a wide and complex issue. Much progress has been made in recent years in designing standardised tests of cognitive achievement. Such tests no longer consist merely of a crude true-or-false approach but can examine sophisticated components of problem-solving ability as well as numeracy and literacy. Today’s tests can do so in a format that permits genuine comparability between the school systems of different countries.29 Nigeria does not yet participate in the major international testing exercises, but has made strong progress in its own testing, mostly within the Dakar 2000 framework for action of Education for All, which encouraged governments to enhance education quality at all levels. The first national test was limited to Primary 4 students in 199630, but subsequent testing has been extended to Primary 6 and to junior and senior secondary students.31 A series of tests with coverage limited to Kaduna, Kano and Kwara was undertaken in 2007.32 The initial tests in 1996 produced results characterised as poor, and the rationale for the 2003 tests was largely to establish whether, having noted the poor performances with primary 4 in 1996, there were positive changes in learning acquisition by the time the pupils were in primary 6. This gives two critical questions of interest for Kwara. First, whether Kwara performed well or badly relative to other states in 1996 and 2003. Second, since Primary 4 achievement was tested in both years, did Kwara’s performance, again relative to other states, improve between 1996 and 2003? These two questions can be answered with the help of Chart 13. The Chart shows the composite scores for 28 There can also be the complication of “selecting out”, in which schools attempt to retain only the potentially high-performing students in the assessable upper years of high school. 29 The two best known international examples are Trends in International Mathematics and Science Study (TIMSS) conducted by the International Association for the Evaluation of Education Achievement (IEA) and Program for International Student Assessment, conducted by OECD. 30 Reported in The EFA 2000 Assessment: Country Reports, Nigeria, World Education Forum, 2003 31 Makoju et al., Nigerian Education Sector Analysis, Assessment of Learning Achievement of Primary Four and Six Pupils in Nigerian Schools, draft report 2005; Makoju et el., Nigerian Education Sector Analysis, Monitoring of Learning Achievement Project 2003, Assessment of Learning Achievements of JS2 and SS2 Students, Federal Ministry of Education 2006. 32 Johnson, D., J. Hseish, et al. (2007). CUBE baseline study: final draft report.

39
numeracy, literacy and life skills for Primary 4 students in 1996 and 2003, with the quadrants demarcated by the national average scores in each year.33 For example, the horizontal axis measures the composite scores for 1996, and the national average for that year (shown by the vertical line near the centre of the graph) was 29.9. The composite score for 2003 is shown on the vertical axis, and here too the national average score of 36.7 percent is drawn on the chart. By definition, the national average score in both years is the observation located at the intersection of the two lines. Chart 12: Academic performance in Primary 4, 1996 and 2003
Kwara
20.0
25.0
30.0
35.0
40.0
45.0
50.0
55.0
20.0 25.0 30.0 35.0 40.0
Composite score 1996 (% )
Com
posit
e sc
ore
2003
(%)
Source: Calculated from Makoju et al 2005, 2006 This procedure means that all states to the left of the 29.9% vertical line were below the national average in 1996. Everything above the horizontal line of 36.7% was above average in 2003. The top-right quadrant shows the states which performed above-average in both years; the bottom-left quadrant shows those which performed poorly in both years; and the top left displays those states which improved over time. Kwara fits into this latter category. It was clearly below the national average in 1996, but by 2003 its Primary 4 students were performing just above average. While test differences mean that actual scores in each year cannot be directly compared, Kwara improved relative to other states. In the light of its Primary 4 improvement in 2003, the critical next question for Kwara is whether that improvement was apparent in the Primary 6 and secondary school tests of
33 For both years the composite score is the weighted average of scores for numeracy, literacy and life skills, where the weights are the number of observations for each test and state.

40
2003. Chart 13 shows the ranking by states for Primary 6.34 As with the previous chart, this too shows the overall performance in numeracy, literacy and life skills, properly adjusted for the sample size in each category. Little needs to be said about the result for Kwara, except that (like the P4 results for 2003) the Primary 6 scores are just above national average. Chart 13: Academic performance in Primary 6, 2003
Kwara
20.0
25.0
30.0
35.0
40.0
45.0
50.0
55.0
Ebony
iBorn
oEdo
Nassaraw
a
Katsina
AdamawaPlat
eau
A/IbomOsunIm
oNiger
GombeDelt
aAbia
C/River
National
BauchiKanoKog
i
Zamfar
aKwaraOyo
AnambraLago
sYob
eEkiti
TarabaKebb
iOgu
nEnu
gu
Kaduna
Jigaw
aBenu
e
Com
posi
te P
rim
ary
6 sc
ore
(%)
Source: Calculated from Makoju et al 2006 Chart 14 displays the results of the secondary tests, with the quadrants being demarcated by the national average scores for JSS and SSS, just as in previous charts. The secondary tests assessed achievement in mathematics, English language, social studies and integrated science for JS2 students, and mathematics and English language for SS2 students.35 Chart 15 shows that Kwara scored just above average in the junior secondary assessments but below average in the senior secondary tests. Two principal conclusions can be drawn from these assessments. The first is that Kwara is consistently located around the average score for Nigeria as a whole. Sometimes, as in the P4 tests of 1996 or the senior secondary assessments of 2003, the overall result for Kwara is below the national average. Sometimes, as in P4, P6, and junior secondary for 2003, Kwara lies just above national average. But in no case is the Kwara result dramatically high or low. In terms of educational quality, it is fair to describe the quality of education in Kwara as being entirely typical of quality in the country as a whole. 34 The composite score is the weighted average of state scores for numeracy, literacy and life skills in Primary 6, where the weights are the number of observations for each test and state. 35 The number of students who sat each of the subject tests is not reported, so the scores shown in the Chart are the simple average of the results for the four subjects at JS2 and the two subjects for SS2.

41
Chart 14: Achievement in Secondary School, average percentage scores, 2003
Kwara
20.0
30.0
40.0
50.0
20.0 30.0 40.0 50.0
Senior secondary
Juni
or se
cond
ary
The second conclusion to be drawn is that there is no cause for complacency just because quality in Kwara is about the same as the rest of Nigeria. In general the quality of academic outcomes in Nigeria is low, and accordingly it is also low in Kwara. Consider the Primary 6 results in 2003, where Kwara performed not only better than national average but better than in 1996. As Chart 14 indicates, Kwara’s overall score of 36.1% was slightly above national average, but its mathematics score was 35%, its literacy score 41% and its life skills result was less than 25%. In other words, Kwara’s P6 students could get barely more than one-third of the maths questions right and only one-quarter of the life skills questions correct. Even in the best subject, literacy, on average Kwara’s students could not get even one-half of the questions correct. Kwara’s junior secondary quality was a little above national average, but even so Kwara’s JS2 students could score only 33% in English, 31% in Mathematics, 37% in social studies and only 34% in science. In short, in the core curriculum subjects at JS2, students could, on average, get only one-third of the questions right. When it comes to educational quality Kwara is in general performing no better and no worse than the Nigerian average, but this still means that its students --- whether P4, P6, JS2 or SS2 --- are not acquiring sufficient academic skills in school. This conclusion is supported by the latest evidence. In 2007, a study was conducted as part of the Capacity for Universal Basic Education (CUBE) project to measure primary learning achievements in Primary 4 and 6 (Johnson, Hseish et al. 2007). The study covered approximately 300 schools and 7,500 students in Kaduna, Kano and Kwara. Tests were based on the national primary school curriculum with questions designed to test the associated competencies. Primary 4 results are shown in Table 12.

42
In general Kwara performed well compared to Kana and Kaduna, especially in all tested aspects of literacy. But if the absolute level of achievement is considered, the results have to be described as very poor. In no case could students get even 10% of the numeracy questions correct, despite the tests being based on the national primary school curriculum. The level of reading accuracy is low, and unsurprisingly the result is that students are reading without understanding: even in Kwara, the best-scoring state, the score for reading comprehension was well below 10%. Table 16: P4 Literacy and Numeracy in 3 states, 2007 (%) Literacy Numeracy
Reading accuracy
Reading comprehension
Listening comprehension
Male Female Total
Kaduna 26.4 1.4 35.7 10.0 7.6 8.8 Kano 7.3 0.6 25.0 8.2 6.5 5.6 Kwara 29.7 6.9 47.9 8.2 8.8 8.2
Source: Johnson, Hseish et al (2007).
3. The determinants of high quality in education In the light of these poor outcomes for Nigeria, the critical issue is to identify those factors which produce good academic outcomes. There is a vast international literature exploring the determinants of educational quality and there is today a good understanding that high quality is the outcome of system-wide policies and actions, including conditions in the home as well as in school, and extending to intangible issues such as school autonomy as well as more specific items such as class size. Box 4 presents a summary of these multiple issues.36
Box 4: Determinants of educational quality Supporting inputs: Strong parent and community support; Effective support from the education system, such as providing information, incentives and training to help schools succeed; Adequate material support, such as frequent and appropriate teacher development activities, sufficient textbooks and other learning materials, and adequate facilities. Enabling conditions at the school level: Effective school leadership, for example the head teacher must support teachers and maintain high expectations and standards; Capable teaching force; Flexibility and autonomy, for example, the extent to which schools have decision making independence in how to translate resources into outcomes; High time in-school. Teaching-learning process: High learning time; Variety in teaching strategies; Frequent homework; Frequent student assessment and feedback. School climate : High expectations of students; Positive teacher attitudes, for example, in terms of their ability to teach and levels of motivation; Order and discipline, so that there is a safe and orderly environment conducive to learning; Organised curriculum; Rewards and incentives for pupils and teachers: Children’s characteristics The health of the child, previous schooling investments and other demands on children’s time are examples of children’s characteristics that will effect the quality of education.
36 Box 4 is summarised from Heneveld and Craig (1996).

43
While there is ample evidence to support the view that school quality is multi-faceted, and that stand-alone interventions that do not build a framework of systemic policies may not have much impact on quality, it is also important to recognise that not all the policies summarised in Box 4 are equally important: it is essential to establish priorities in this aspect of educational planning just as in any other. Chart 15 is a useful guide to establishing such priorities. Based on evidence from more than 25 developing countries, it shows the percentage of studies which had a statistically significant and positive effect on quality in primary schools. For example, small class size shows up as having a positive effect, but it had the lowest rank, with only 36% of studies showing this effect. Similarly, setting high teacher salaries or building lavish laboratories do not appear to be effective determinants of improved quality. Their importance is swamped by libraries, instructional time and homework, all of which had a significant positive impact on quality in more than 80% of studies. Teacher subject knowledge is also important. The cultural and social setting of policies must be taken into account, and there is nothing in Chart 15 which negates the value of the wider enabling framework described in Box 4, but the Chart demonstrates that what really matters, as a critical priority, are generously-provided learning and teaching materials, teachers who have sufficient mastery of the curriculum subjects to make good use of those materials, and plenty of time on task. Chart 15: Determinants of effective learning
0
20
40
60
80
100
Librari
es
Instruct
ional tim
e
Homework
Textbo
oks
Teacher
knowled
ge
Teacher
experi
ence
Laborat
ories
Teacher
salary
Class s
ize
Source: World Bank 1995
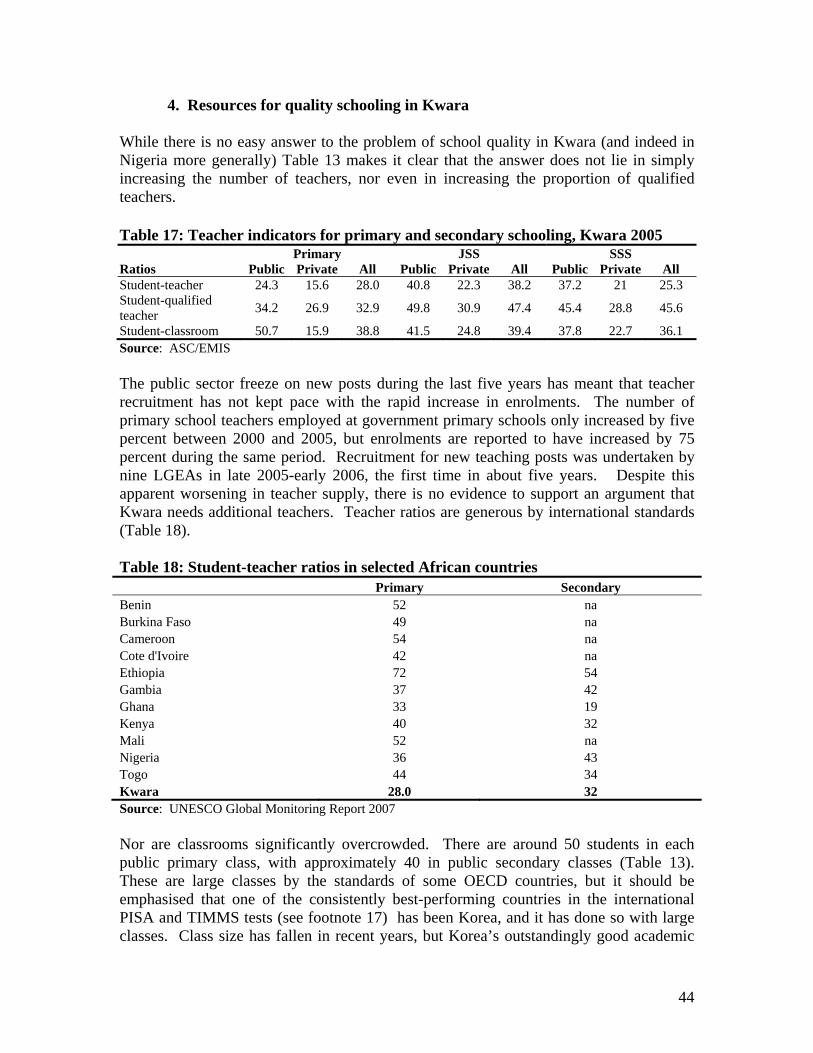
44
4. Resources for quality schooling in Kwara While there is no easy answer to the problem of school quality in Kwara (and indeed in Nigeria more generally) Table 13 makes it clear that the answer does not lie in simply increasing the number of teachers, nor even in increasing the proportion of qualified teachers. Table 17: Teacher indicators for primary and secondary schooling, Kwara 2005
Primary JSS SSS Ratios Public Private All Public Private All Public Private All Student-teacher 24.3 15.6 28.0 40.8 22.3 38.2 37.2 21 25.3 Student-qualified teacher 34.2 26.9 32.9 49.8 30.9 47.4 45.4 28.8 45.6
Student-classroom 50.7 15.9 38.8 41.5 24.8 39.4 37.8 22.7 36.1 Source: ASC/EMIS The public sector freeze on new posts during the last five years has meant that teacher recruitment has not kept pace with the rapid increase in enrolments. The number of primary school teachers employed at government primary schools only increased by five percent between 2000 and 2005, but enrolments are reported to have increased by 75 percent during the same period. Recruitment for new teaching posts was undertaken by nine LGEAs in late 2005-early 2006, the first time in about five years. Despite this apparent worsening in teacher supply, there is no evidence to support an argument that Kwara needs additional teachers. Teacher ratios are generous by international standards (Table 18). Table 18: Student-teacher ratios in selected African countries Primary Secondary Benin 52 na Burkina Faso 49 na Cameroon 54 na Cote d'Ivoire 42 na Ethiopia 72 54 Gambia 37 42 Ghana 33 19 Kenya 40 32 Mali 52 na Nigeria 36 43 Togo 44 34 Kwara 28.0 32 Source: UNESCO Global Monitoring Report 2007 Nor are classrooms significantly overcrowded. There are around 50 students in each public primary class, with approximately 40 in public secondary classes (Table 13). These are large classes by the standards of some OECD countries, but it should be emphasised that one of the consistently best-performing countries in the international PISA and TIMMS tests (see footnote 17) has been Korea, and it has done so with large classes. Class size has fallen in recent years, but Korea’s outstandingly good academic

45
quality was built on a foundation of large classes: as recently as 1995 there were over 36 students in primary school and nearly 50 in middle and high school classes. Table 19 suggests that in terms of formal qualification, teacher knowledge and competence is not a serious issue for Kwara. Over three-quarters of secondary school teachers are university graduates. Over half of primary teachers have the National Certificate of Education (more than two-thirds of females) and another 12 percent of primary school teachers are university graduates.37 Grade II and unqualified teachers now account for only 20 percent of all teachers employed at government primary schools. The percentages of qualified teachers vary considerably from one LGEA to another, but on state average there is nothing in the pattern of teacher qualifications to suggest that lack of qualified teachers are a major contribution to poor-quality student outcomes. Table 19: Teacher qualification profile by level of education and gender, 2005 (percentages) Qualification Female Male Total Primary Graduate with teaching qualification 10.3 14.4 12.3 Graduate without teaching qualification 1.3 2.1 1.7 National Certificate of Education 67.5 41.8 54.7 Diploma 5.1 14.7 9.9 Grade II 11.4 14.5 12.9 Others 4.4 12.5 8.5 Total 100.0 100.0 100.0 Secondary Graduate with teaching qualification 63.3 62.6 62.9 Graduate without teaching qualification 9.7 14.3 12.0 National Certificate of Education 23.9 16.8 20.3 Diploma 2.1 4.8 3.5 Grade II 0.1 0.2 0.2 Others 0.9 1.3 1.1 Total 100.0 100.0 100.0 Notes: The 'Others' category includes Grade I, HSC/GCE A' level, Special Teachers and WASC/GCE 'O' level/SSCE Source: EMIS 2005 The problem is that the teachers’ formal qualifications are likely to be a misleading guide to their competence. A major finding from Chart 16 is that teachers’ knowledge is a major determinant of good school quality. Despite the fact that the large majority of teachers are now qualified, Kwara’s teachers do not have adequate knowledge. Complaints about newly appointed teachers, who have low levels of numeracy and literacy skills as well inadequate knowledge in their chosen areas of subject specialisation, are commonplace. The low quality of graduates from the teacher training colleges and universities who are joining the teaching profession is a major issue, and the three Colleges of Education are seriously under-resourced given the very rapid increase in enrolments during the last five years. The assessment tests summarised earlier make it 37 Teacher with diplomas are not considered to be fully qualified.

46
clear that students enter colleges and universities with very low levels of cognitive skills. It is impossible for tertiary institutions to remedy the lack of such skills in the time available --- and it makes no sense for expensive tertiary institutions to spend time teaching basic skills that should have been properly taught in primary and secondary school. Kwara’s students are caught in cycle of low achievement, teachers with inadequate cognitive skills, and then further low achievement by students. The second major finding for Kwara --- and a finding which should occupy a prominent place in policies to break out of the cycle of low quality --- is that textbooks and other essential learning materials are in very short supply. Given the very limited non-salary funding of primary and secondary schooling in the state, which seriously affects the provision of teaching and learning materials, the evidence from Chart 16 is clear: the lack of such materials seriously diminishes the overall effectiveness of schooling quality. It is SMOE policy that every primary school student should have exclusive use of the five core subject textbooks, which is equivalent to a student-book ratio of 0.2:1. In practice, the overall ratio is 3.4:1, which is nearly 20 times worse than this norm38. Five LGEAs have a student: textbook ratio worse than 5:1. The textbook situation is even worse in junior and senior secondary schools. According to ASC/EMIS, the student-textbook ratios average 5.5:1 and 7.4:1 in JSS and SSS respectively. Senior secondary schools in four LGEAs have a student: textbook ratio worse than 10:1. Serious shortages of other key learning materials and consumables are also commonplace. Difficult economic conditions for many households, coupled with escalating costs of textbooks, have prevented most students from accessing the basic textbooks for each subject. Consequently, students spend most of their time transcribing notes written by teachers from the blackboard. In effort to alleviate this situation, the state government has begun to distribute textbooks to secondary schools. A Book Revolving Scheme finally got off the ground in 2006. Nearly three-quarters of a million books had been supplied to secondary schools by September 2006. Prior to the inauguration of this Scheme, the ETF was the only funding source for library books. SUBEB has also been active in providing books for primary schools. However, the number of textbooks supplied to primary schools falls far short of the number of students in each LGEA. Only 53,000 books were supplied between January and September 2006 and the distribution of these books between LGEAs appears to be quite uneven.
38 These ratios include textbooks provided by schools, which are generally very few in number.

47
Chapter 5: Disparity and equity 1. Gender equity
The evidence on gender disparities is mixed, and the lack of time series means that it is impossible to review trends. The CWIQ results presented in Chapter 2 present an optimistic picture, suggesting only the most minor differences between males and females in primary enrolments, either gross or net, and a gender parity index of 90 percent at secondary level. These results are consistent with those from the National Living Standards Survey, which for Nigeria as a whole showed no gender difference in enrolment in primary school and only a small difference in secondary school.
EMIS suggests a starker picture of lower female participation in primary school. These data show a difference of seven percentage points (boys 107 percent and girls 98 percent) in gross enrolment rates, and an especially substantial (almost twenty percentage points) lower net enrolment rate for females: only 66 percent for girls in primary school, compared to 82.3 percent for boys. This combination of gross and net rates suggests that fewer girls go to primary school and when they do they start later than boys. EMIS also tells a more pessimistic story than CWIQ of male/female disparity in secondary enrolments, with a gender parity index (using gross enrolment rates) of 85 percent for junior secondary, falling to 82 percent for senior secondary.
It was argued in Chapter 2 that on balance the CWIQ data offered the more reliable picture of enrolments. On this view gender disparities in Kwara are relatively minor. Boys and girls seem to be entering primary school at about the same proportion of the starting age, and there are no significant differences in repetition or dropout. If Kwara is doing well with gender equality at primary level, the data suggest that it still has some way to go at secondary level. Enrolment data (supported by expert opinion from the Technical Working Group) suggest that fewer girls make the transition from primary to junior secondary. While some 95% of boys move on to JS1, the proportion of girls is around 85%. The evidence for Nigeria as a whole is consistent with what is known of other developing countries: the most common reason for non-enrolment is the need for children’s labour in the household.39 Both boys and girls participate in household and farming duties, but females spend substantially more time on these duties. Distance to school and safety is an important reason for non-enrolment as girls reach puberty, and early marriage, pregnancy or betrothal are additional factors in not continuing school beyond primary. These social and cultural factors may not be amenable to rapid change, but gender equity in secondary school remains a challenge for Kwara. 2. Disparity in education by poverty/income category Where data permit it is usual to consider a second type of disparity, that between household income (typically using expenditure as a proxy for household income) in order
39 World Bank, Nigeria, Poverty Assessment, 2006 (draft report); National Bureau of Statistics, Nigeria National Living Standards Survey, 2006.
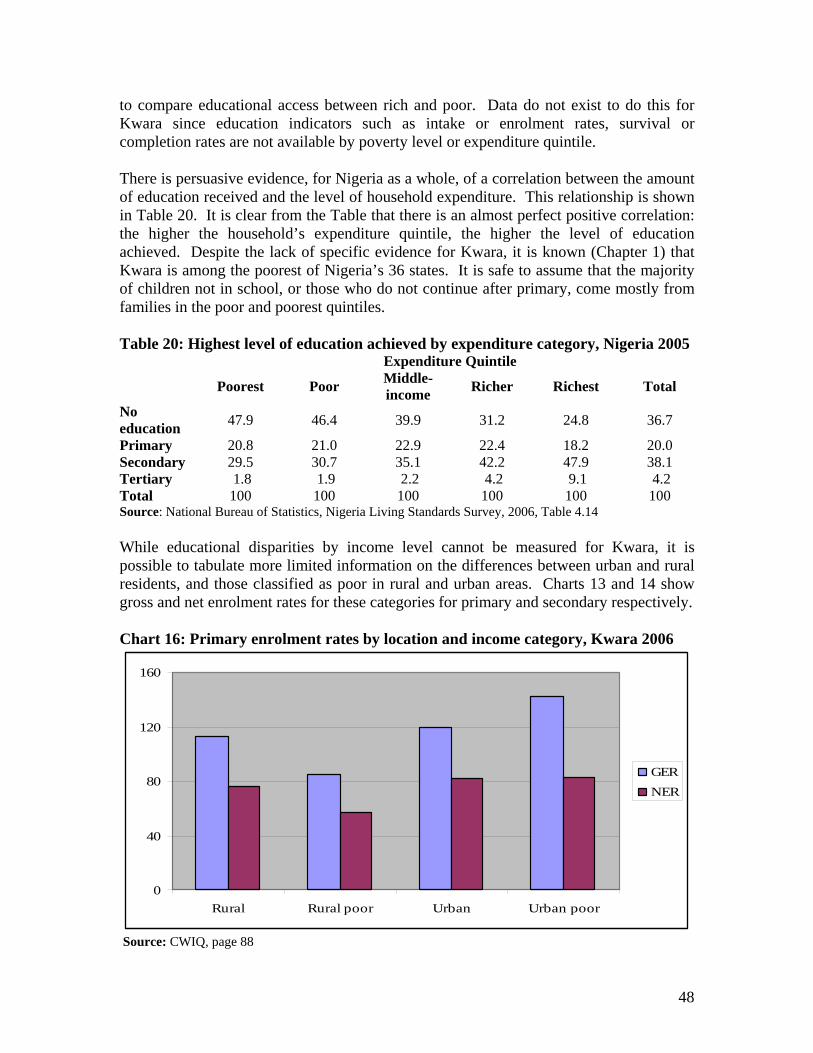
48
to compare educational access between rich and poor. Data do not exist to do this for Kwara since education indicators such as intake or enrolment rates, survival or completion rates are not available by poverty level or expenditure quintile. There is persuasive evidence, for Nigeria as a whole, of a correlation between the amount of education received and the level of household expenditure. This relationship is shown in Table 20. It is clear from the Table that there is an almost perfect positive correlation: the higher the household’s expenditure quintile, the higher the level of education achieved. Despite the lack of specific evidence for Kwara, it is known (Chapter 1) that Kwara is among the poorest of Nigeria’s 36 states. It is safe to assume that the majority of children not in school, or those who do not continue after primary, come mostly from families in the poor and poorest quintiles. Table 20: Highest level of education achieved by expenditure category, Nigeria 2005 Expenditure Quintile Poorest Poor Middle-
income Richer Richest Total
No education 47.9 46.4 39.9 31.2 24.8 36.7
Primary 20.8 21.0 22.9 22.4 18.2 20.0 Secondary 29.5 30.7 35.1 42.2 47.9 38.1 Tertiary 1.8 1.9 2.2 4.2 9.1 4.2 Total 100 100 100 100 100 100 Source: National Bureau of Statistics, Nigeria Living Standards Survey, 2006, Table 4.14 While educational disparities by income level cannot be measured for Kwara, it is possible to tabulate more limited information on the differences between urban and rural residents, and those classified as poor in rural and urban areas. Charts 13 and 14 show gross and net enrolment rates for these categories for primary and secondary respectively. Chart 16: Primary enrolment rates by location and income category, Kwara 2006
0
40
80
120
160
Rural Rural poor Urban Urban poor
GERNER
Source: CWIQ, page 88

49
For primary schooling, the rural poor demonstrably fare worst. Gross enrolment rates reach only 85 percent, and the net enrolment rate (57 percent) is well below the NER in urban areas (83 percent). The combination of a very high GER but slightly better-than-average NER for the urban poor indicates that many children from this category start their education late. The story for secondary enrolments is broadly similar, with large disparities between urban and rural areas. The rural poor do especially badly at secondary level, and unlike primary education where there are no perceptible differences in net enrolments in urban areas, the urban poor have substantially lower net secondary enrolments than richer urban residents. Chart 14: Secondary enrolment rates by location and income category, Kwara 2006
0
20
40
60
80
100
Rural Rural poor Urban Urban poor
GERNER
Source: CWIQ, page 88 3. Disparity by administrative area The third aspect of enrolment disparities is that of locational disparity within Kwara. Table 21 needs to be interpreted very cautiously. It is compiled from SUBEB-confirmed enrolments which are considered reliable, but in the absence of CWIQ-based age groups by LGA the size of the 6-11 age group is derived from EMIS data. The resulting gross enrolment ratios are therefore approximations rather than precise figures. Even with this limitation, there is much in the Table to suggest that there are many equity (and efficiency!) improvements to be gained from a radical investigation into LGA disparities. Even if the GERs for each LGA need to be seen as an approximation, it is clear that there is very substantial variation between the LGAs in the proportion of their children attending primary school. Some of this is explicable by the urban-rural distinction noted above, but this does not account for the difference between, for example, Asa and Baruten. We come closer to an explanation by looking at the right-hand columns of the Table and noting that the LGAs vary widely in the share of their federal revenue which

50
they devote to education. The average for the 16 LGAs is 36%, but Baruten and Kaiama spend only 14-15% of their allocation, whereas some LGAs spend half or more. The range of expenditures is even greater (38:5 or more than 7:1) when we calculate expenditure per student in the final column. It can be plausibly argued that education is costly to provide in rural areas with their high transport and construction costs and their small and scattered schools. The very low expenditure per student in Ilorin West (Naira 7,109) may therefore tell us more about the economies of an average school size of 1,410 than about any apparent inequity. While there are certainly real differences between the LGAs in the cost of educational provision, there is enough evidence in Table 21 to indicate that there is considerable room for improvement in the allocation of resources --- and a more equitable outcome. Offa has almost as many teachers as Edu, despite having only one-quarter of Edu’s primary enrolment. Ekiti employs almost as many teachers as Patigi, but has only 27% of Patigi’s students and spends only half as much per student. Asa and Irepodun have near-identical numbers of teachers, but the latter LGA has only 73% of Asa’s enrolments and spends 60% more per student. The number of classes is not reliably known at LGA level, but in primary school, where the general rule is one teacher equals one class, we can take the number of pupils per teacher as a reasonable proxy for class size. Relative to the Kwara average, Oyun is spending large amounts of money both as a share of its federal allocation and as expenditure per student to fund only 9 students per teacher (and few students enrolled overall). Ekiti, Irepodun, Offa and Oke Ero all spend relatively large amounts of money per student but have wastefully small classes. The reasons for this pattern of teacher and financial allocation are not known, but with the exception of Baruten, all the LGAs with a large number of teachers and very small classes were those whose enrolments were reduced substantially after SUBEB’s check of the implausibly high student numbers. It seems likely that these LGAs were over-staffed, and the pattern of teacher allocations has not yet been corrected for the lower student numbers. Even if this explanation is only part of the story, the numbers in Table 21 confirm the anecdotal impression when visiting some LGAs of near-empty classrooms and low rates of teacher utilisation. It is difficult to avoid the conclusion that the allocation of teachers and financial resources by the LGAs needs urgent review and possible reform. At present it seems likely that human and financial resources are being allocated in highly inefficient ways --- and an economically inefficient allocation produces unacceptable differences in equity.

51
Table 21: Primary education indicators by LGA, Kwara 2006 (public schools)
Primary
enrolment Population Age 6-11 GER
No. of Schools
Average school
size No. of
Teachers
Teachers per
school
Pupils per
teacher
Federal allocation
(000s)
Expenditure on
education (000s)
Expend as share of federal
allocation
Expend per
student Asa 22,102 22,422 99 123 180 1,073 9 21 719,243 327,645 46 14,824 Baruten 20,177 37,150 54 108 187 686 6 29 1,127,434 170,198 15 8,435 Edu 47,392 35,736 133 109 435 892 8 53 832,905 260,442 31 5,495 Ekiti 3,840 9,724 39 38 101 444 12 9 600,151 142,350 24 37,070 Ifelodun 45,831 36,543 125 142 323 1,533 11 30 978,287 506,467 52 11,051 Ilorin East 50,071 36,235 138 75 668 1,246 17 40 828,905 429,794 52 8,584 Ilorin South 22,300 37,005 60 51 437 912 18 24 839,365 303,810 36 13,624 Ilorin West 81,756 64,664 126 58 1,410 1,723 30 47 1,161,539 581,224 50 7,109 Irepodun 16,065 26,352 61 69 233 1,044 15 15 758,967 379,775 50 23,640 Isin 9,013 10,590 85 25 361 396 16 23 624,532 142,463 23 15,806 Kaiama 19,206 22,032 87 65 295 529 8 36 948,696 129,144 14 6,724 Moro 22,820 19,292 118 122 187 1,297 11 18 824,860 382,338 46 16,755 Offa 12,064 15,903 76 43 281 869 20 14 671,859 309,182 46 25,628 Oke Ero 4,023 10,214 39 28 144 360 13 11 600,703 134,999 22 33,557 Oyun 7,245 16,715 43 78 93 818 10 9 649,601 274,662 42 37,911 Patigi 14,140 19,932 71 68 208 474 7 30 701,868 144,582 21 10,225 Total 398,045 420,509 95 1,202 331 14,296 12 28 12,868,916 4,619,075 36 11,604

52
Chapter 6 Management of education service delivery One of the key findings from Chapter 4 is that effective support from and to the education system is a key factor in determining good quality outcomes at the school level. The current chapter provides an overview of the institutions that support schools in Kwara and reviews evidence on their effectiveness. It focuses on the roles and responsibilities of different levels of government, supervision, monitoring and inspection, and aspects of financial management, transparency and budget accountability. 1. Roles and responsibilities in education provision The institutions and their responsibilities for education provision in Kwara have been mentioned in a number of places throughout this ESA. Table 22 (over) brings this information together to provide a summary outline of the functions and responsibilities of the three levels of government. The dominant impression from the Table is one of substantial overlap in roles across levels of government. These overlapping responsibilities have to be understood in the context of Nigeria’s Constitutional requirements. The 1999 Constitution of the Federal Republic of Nigeria defined the nation’s educational objectives and regulated the broad responsibilities for attaining these goals among the three tiers of government. The Constitution sets out the areas in which both Federal and State governments can act concurrently in the delivery of education services at all levels of the education sector. These areas include primary, secondary and tertiary education. Furthermore, the Constitution provides a list of functions that are the responsibilities of the State, but in which Local Governments can participate at the discretion of the State Government and through legislation. These areas include the provision and maintenance of primary, adult and vocational education. The UBE Act of 2004 and the National Policy on Education (2004) added a further layer of complexity by stipulating that Local Government Education Authorities (LGEAs) shall have the responsibility for the financing and management of primary education in their areas. In addition, both Federal and State authorities are empowered to establish parastatals through which some of their responsibilities can be discharged. And civil society has the right to play a role in education. The result is that the Constitution and Federal Law enable a wide range of stakeholders to be engaged in education but the lack of specificity regarding particular roles and responsibilities at the different tiers of government gives rise to overlaps and tensions in the execution of policies. At worst this produces excessive fragmentation and disputes. This has been particularly evident in recent years in relation to where the responsibility should lie for the financing and payment of primary teacher’s salaries and in the creation of State universities. A second example is that instructional materials are potentially provided by all levels of government, a duplication which makes effective provision of instructional materials more difficult. Still further examples of substantial overlap and

53
Table 22: Educational responsibilities and functions of Federal, State and Local Governments
Government Responsibilities Functions Supporting Legislation/ Implementing Structures.
Federal • National education policy formulation.
• Standard setting and quality control at all levels nationwide.
• Coordination for a balanced national educational development.
• Preparation and implementation of national education development plans and programmes.
• Issuance of national education policy guidelines and directives.
• Curriculum development and provision at all levels.
• Infrastructure provision at all levels. • Instructional materials provision at all
levels. • Staff recruitment, welfare and
development at the tertiary level, in Federal Unity Secondary schools and Primary schools through the UBE programme.
• Monitoring and schools inspection at all levels.
• Decree 16 of 1985. • National Council on
Education. • National Policy on Education. • UBE Act, 2004. • National EFA Plan. • Federal Ministry of Education
and its parastatals.
State • State Education Policy formulation at all levels in line with Federal policy.
• Standard setting and quality control at primary and secondary level
• Coordination within the State for a balanced educational development.
• Preparation of State plans and programmes.
• Management and supervision of pre-primary, primary, secondary, adult and non-formal education.
• Issuance of State education policy guidelines and directives.
• Infrastructure provision and maintenance at all levels.
• Instructional materials provision at all levels.
• Staff recruitment, welfare and professional development at all levels. (Except primary school Staff on Grades Levels 01 to 06).
• Monitoring and schools inspection at all levels.
• State Education Laws. • UBE Act, 2004. • State Universal Basic
Education Board Law. • State EFA Plans. • State Ministries of Education,
parastatals and agencies.
Local
• Management and supervision of pre-primary, primary, adult and non-formal education.
• Infrastructure provision at primary level. • Provision of teaching and learning
materials in primary schools. • Recruitment of primary school staff and
teachers on Grade levels 01 to 06. • In-service training for primary school
teachers. • Payment of emoluments of all
categories of primary school staff. • Day-to day supervision of primary
schools.
• UBE Act, 2004. • State Universal Basic
Education Board Law. • Local Government
Education Authority Laws. • Local Government
Education Authorities and District Education Authorities.
Source: Packer S. and Oladimeji E (2006), Institutional Assessment, Kwara State, Final Draft.
shared responsibility for education across levels of government can be found, most notably in planning, standard setting and monitoring (discussed in more detail below). In Kwara State, it is the Ministry of Education, Science and Technology which has primary responsibility for overseeing the development and provision of education services across the State. SMOE discharges its responsibilities in conjunction with a

54
group of parastatals and colleges some of which, such as SUBEB, are the manifestation of national bodies at State level although their specific powers derive from State legislation. The relationship between SUBEB and Local Governments is a case study in overlapping institutional relationships. The 16 Local Government Authorities in Kwara are answerable to the Ministry of Local Government. Each has its own Local Government Education Authority (LGEA) which is answerable to its LGA administratively but to SUBEB operationally in the implementation of its services to and for primary schools. In practice it is the State Universal Basic Education Board (SUBEB) and neither SMOE nor the LGAs which has principal responsibility for delivering UBE. Under the National Policy on Education, LGEAs should pay primary teacher’s salaries, pensions and gratuities, retrain teachers, and supervise the quality of education in their schools. But LGEAs only do this by proxy: the LGAs provide most of SUBEB’s revenue, but SUBEB is the implementing agency. SUBEB’s responsibilities are being extended to junior secondary schooling, and the respective responsibilities of SMOE, SUBEB and Teaching Service Commission are being reviewed as Junior Secondary Schools are “disarticulated” from the Senior Secondary Schools of which many of them are currently a part. 2. Supervision, Monitoring and Inspection40 Compared with many African education systems, schools are visited remarkably regularly in Kwara, the more so in compact urban areas. Indeed some schools complain about the frequency of visits. The problem is that visits are made by a number of different bodies. The critical function of school inspection is the responsibility of a myriad of federal, state and local government agencies. The Federal Inspectorate Service (FIS) inspects all schools to ensure that standards of quality education are maintained. In addition to federal level inspection, SMOE and its departments inspect schools on a similar basis as well as providing approval for private schools. SMOE’s Inspectorate has the legal mandate to inspect and monitor schools for the maintenance of standards at all levels of the education system. In practice the Ministry focuses on secondary schools, leaving SUBEB and LGEAs to concentrate on primary inspection. The Ministry undertakes scheduled and unscheduled visits and operates four types of inspection (Advisory, Subject Recognition, Routine and Monitoring Inspection). It considers its 39 inspectors to be an insufficient number to fulfil its mandated role and its funding levels totally inadequate, so school visits are irregular, especially when transport is a major problem in rural areas. Visits to primary schools are more commonly made by LGEA staff and by SUBEB, again following different categories of inspection. Occasionally schools may be visited by Federal Inspectors. It is clear that a great deal of inspection and support is available to schools but it is questionable whether the current arrangements are particularly effective. There is very little coordination between the different inspection authorities, resulting in substantial
40 This section draws extensively upon the analysis of Packer S. and Oladimeji E (2006), Institutional Assessment, Kwara State, Final Draft.
55
duplication of effort. The absence of clear lines of responsibility weakens the accountability of inspection services to education stakeholders. Given the current physical state of schools in Kwara, the poor supply of books and materials, and the low academic outcomes, the notion of monitoring the maintenance of academic standards must (to put it very mildly) be a difficult task. Ideally there should be a significant rethink about what supervision, monitoring, advice and support really mean (terms that are often used interchangeably although they are very different). With an emphasis on quality schooling, the notion of what quality should mean needs restating and making explicit, preferably in an environment that encourages school improvement, school planning, greater school authority and greater control over resources. There clearly are basic standards for which conformity is needed e.g. teacher attendance, but inspection and support should be about school improvement and not merely adherence to administrative standards and procedures. If such an approach is considered possible in Kwara this is likely to lead to some further rethinking about how inspection and advice services should be organised. One possibility is a separate and independent inspectorate enabled to fulfil the inspectorate’s existing mandate fully and professionally. At the same time urgent thought needs to be given to strengthening the capacity and the ability of those who work in rural LGEAs and zones. One further critical aspect of monitoring and evaluation is the Education Management Information System (EMIS) in Kwara. This could be a key resource for monitoring progress in the education sector, but it is not at present adequately performing that role. Previous chapters of this report have shown that there are major inconsistencies and data management systems are generally weak. The main weaknesses with the EMIS are: • The system is too centralised, with forms issued and printed at the federal level only
when resources are released, often leading to delays in data collection which in turn affect the comparability of data across states and time;
• Information collected on the state of the education system generally passes up the system but rarely passes back down to allow schools to judge their own performance relative to other schools.
• There is a lack of capacity in SUBEB, SMOE and LGEAs to undertake the annual school census effectively. This is not a lack of technical capability, which in Kwara is excellent, but a lack of resources. The outcome is poor quality reporting and poor coverage. School census forms are often poorly completed and systems for verifying and cleaning data appear weak. In recent years the annual school census has attempted to achieve full coverage, but it evident that simply delivering census forms to schools for them to complete achieves neither full coverage (especially of private schools) nor accurate reporting (especially of public schools). Furthermore, some schools (e.g. Qur’anic and non-integrated Islamiyya schools) are not included in the annual school census.
The very substantial discrepancies in enrolments between CWIQ and EMIS, and between EMIS and the detailed school follow-up by SUBEB and TSC, suggest that better data

56
would emerge if the annual school returns were checked by on-site verification, even if the resources to do this had to be found by adopting a sample of schools rather than attempting full coverage.
The absence of accurate information on the education system in Kwara seriously hampers the effective monitoring and management of the system. If current policy targets are to be effectively implemented and monitored, serious efforts are needed in improving information systems. 3. Financial management It needs to be emphasised that in Kwara the basic financial issues of procurement, audit and reporting are carried out in exemplary fashion. Procurement arrangements are set out under SMOE’s Contract Policy and Guidelines. Awards of under N10 million have to be endorsed by a ministerial tender board chaired by the Commissioner of SMOE and with representatives from the Ministries of Works, Finance, Justice and Lands and Housing. Above N10 million the approval of the Cabinet Tenders Board is required after due process by the Ministerial Board. The Cabinet Board recommendation has to be approved by the Governor. Before these Board processes, all projects identified for action require the approval of the Governor, and tender documents require a certificate from the State’s Price Intelligence Unit prior to public advertisement. The opening, processing and selection of successful contractors is the responsibility of the Ministerial Board. The Ministry of Finance has very precise requirements for the submission of vouchers for the approval and release of funds and for monthly expenditure returns in order to monitor the use of funds. All departments have their own audit departments able to produce recently audited accounts and there is also evidence of increased levels of efficiency in the manner in which annual financial statements are prepared and issued at the State level. The result is that State finances in Kwara are operated in a transparent manner and on the issues of good housekeeping and stewardship the quality of its public financial administration (including the education sector) cannot be faulted. As a recent World Bank study observed, “very good mechanisms to control expenditure at all levels of government already exist in the education sector. ….there are established procedures for the release and the use of money, for the keeping of books and reporting of expenditures. Numerous rules aimed at ensuring that allocated funds reach their intended destination, that no irregularities occur, and that no overspending takes place are on the books. To ensure that these procedures and rules are adhered to, there are internal statutory audit units in each organisation at all levels …and in all of the States the law requires an annual external audit.41
41 World Bank, 2004, The Capacity of Nigerian Government to Deliver Basic Education Services, Africa Region Human Development Working Paper Series Number 61, Washington, World Bank.

57
Twenty years ago public expenditure management could be accurately described as a topic of only specialized interest to policymakers in education. It was a subject principally concerned with procedurally correct budget administration, an approach grounded in a long historical tradition of stewardship of the budget. In this approach, expenditure management was seen as the following of appropriate procedures: the task was to ensure that disbursement of the public budget was carried out in accordance with the amounts appropriated under law, that “due process” would be followed in all aspects of revenue collection and expenditure authorization, and that auditing and accountability would check the correct application of those procedures. Kwara scores well on these measures.
All these elements of procedurally correct public administration and budget discipline were (and remain) important, but in recent years public expenditure management has been transformed into an important tool of policy-making, in the education sector and elsewhere. This extended version of expenditure management offers an integrated approach to public finance which encompasses not just budgeting but also policy making, planning, and performance measurement, and it is in this area that Kwara is performing much less well. This is showing itself in two particular aspects of financial management. Public budgets should be prepared in relation to specific objectives, indicators of performance of those objectives, and the likely 3-5 year resource envelope derived from a medium term expenditure framework. None of these elements exists in Kwara’s financial management and planning. Instead, incremental budgeting characterises the budgetary process in Kwara and this has led to poor linkages between sector priorities and budget allocations (Bennell, Dandago et al. 2007). A further consequence of incremental budgeting is the automatic transfer of spending on areas of the budget with little review of how well they function and whether they meet their objectives. Thus, budgeting is not driven by particular sector objectives or performance related outcomes but by adjustments to the levels of funding of particular inputs --- and primarily for personnel. Changes have to be justified, but the fundamental premises on which the budget is based and their relations with education outcomes are not an integral component of budget preparation. Second, dependency on federal allocations which are in turn dependent on fluctuating international oil prices does not make for a stable public financial life. Budgets are unpredictable because of the unpredictability of federal allocations to states and state projections of revenue at the time of budget making. One example is that the federal allocation to Kwara’s 16 LGAs was twice as much in September 2006 as it had been the previous month and also twice as much as in September 2005. In October 2006 the total allocation fell back almost to the August figure. This unpredictability and volatility has led to low budget execution rates in the education sector. Or, differently expressed, there continues to be a substantial discrepancy between approved and actual expenditures. Actual spending has consistently fallen far short of approved estimates. Some of the shortfall in actual spending may result from genuine difficulties in implementation. It is likely, too, that the underlying problem of oil price fluctuations will

58
remain, although its impact on States and LGAs can perhaps be mitigated by switching from a monthly to an annual allocation from the federal government. But the resulting behaviour in which agencies have learned the art of submitting budgets which are known to be unreal should be fixed, because budget discrepancies on the Kwara (indeed, Nigerian) scale are much more than merely technical accounting issues. “Unreal” budgeting applies more to capital budgets than recurrent, although it also occurs under the non-salary part of the recurrent budget. The unreality arises from the very considerable differences that often exist between initial estimates, approved estimates and the monies that are actually released. As a result the funds that are actually used may bear a very limited relationship to the initial request. If this happens year on year the merits of the budgeting process are brought into question. At worst the budget becomes something of an irrelevance, especially when it is known with some certainty that releases will not match approved estimates. This system needs to be replaced with predictable annual budgets drawn from a medium term expenditure framework. This will allow the agencies responsible for education to make realistic plans in the knowledge that realistic funds are likely to be available for implementation.
59
Chapter 7 Conclusion and key policy issues
This chapter attempts to draw out the main policy issues arising from the findings of the Education Sector Analysis. It does not pretend to be a complete list of policy-relevant topics nor a strategy for the sector’s development, but focuses instead on the main findings that need to be addressed as Kwara State develops its education system. Nor does this concluding chapter attempt to summarise all the issues that have been canvassed in this ESA, but it is impossible to start a review of policy issues without summarising one critical, dominating, and indeed unexpected result from the ESA. Kwara appears to have virtually all children in primary school, and through low dropout and repeater rates it is keeping them in school until almost every child completes the primary cycle. Moreover, most boys now enrol in junior secondary, and although girls’ transition to JSS is some ten percentage points lower than boys it is now becoming possible to talk of achieving nine-year basic education for everyone in Kwara within the foreseeable future. This is a considerable achievement, but before announcing “mission accomplished” it should be emphasised that the enrolment data in Kwara (as elsewhere in Nigeria) leaves much room for doubt about the exact number of children enrolled in school. The judgement of this ESA is that the CWIQ household data provide the best foundation for measuring school attendance, and this has been backed up by diligent attempts to collect confirmed data from SUBEB (for all the LGAs) and from TSC (for every JSS and SSS school). Nonetheless, it remains the case that there are considerable discrepancies between CWIQ and known public enrolments and these discrepancies can only be reconciled by making assumptions about the size of the private schooling sector. Any conclusions about the imminent achievement of Education for All must therefore be tempered by caution that there is a considerable margin of uncertainly about the exact size of primary and junior secondary enrolments and their distribution between the public and private sectors. That Kwara is, at the very least, making strong progress towards EFA is not in doubt. One way of judging that progress is to move away from a narrow reliance on problematic enrolment data and examine a wider range of indicators. This can be done by weighing Kwara’s progress against the benchmarks of the Fast Track Initiative (FTI). The FTI is a global partnership aimed at supporting developing countries in their efforts to achieve universal primary schooling. A set of benchmarks has been developed by the FTI to assess a country’s progress towards the goal of EFA. The Fast Track Initiative is described briefly in Box 5. Table 23 shows Kwara’s record against the FTI indicators.

60
Box 5: The Education For All Fast Track Initiative (FTI) The FTI is a partnership of developing and donor countries and agencies to support global EFA goals by focusing on accelerating progress towards the EFA goal of universal primary school completion, for boys and girls alike, by 2015. The FTI aims to contribute to efforts to achieve universal primary school completion by: 1. Improving the efficiency of aid to primary education; 2. sustained increases in aid to primary education; 3. promoting sound education policies; 4. providing adequate and sustainable domestic financing for education within country;
frameworks such as national poverty reduction strategies; 5. Improving accountability for sector results. For developing countries to join the initiative they have to go through a review process which for successful countries leads to endorsement. Endorsement through the FTI review process normally requires the following: 1. An approved national poverty reduction strategy, or a similar national strategy that would
help ensure that education strategies are anchored in country level consultative and budgetary processes;
2. A sector-wide program for education agreed with in-country donors and including a strategy for HIV/AIDS, gender equality, capacity building, monitoring and evaluation;
3. Agreement to monitor benchmark indicators. As of July 2007, 32 countries’ education sector plans had been endorsed by the FTI. In order to assess a country’s distance from achieving universal primary completion and to provide targets for key education and cost parameters the FTI developed a set of benchmark indicators. These indicators have also been used as a way of measuring progress towards universal primary completion. While it is not essential for countries to adopt these benchmarks in their educational plans this has often been the case. Source: Fast Track Initiative (2004; 2006) As Box 5 makes clear, the benchmarks of Table 23 are not intended to prescribe a uniquely correct path towards universal primary education. The policy “space” is rather wide, and each country will differ in the ways and means it chooses of arriving at EFA. This means that Kwara is not necessarily off-track if it is presently only meeting some of the indicators, or if Kwara circumstances require careful interpretation of the benchmarks. For example, Kwara has 21.5% of its primary enrolments in private school against the FTI benchmark of 10% or less. It is not difficult to understand why a private share benchmark makes an appearance in the FTI list: there is strong evidence from right around the world that primary schooling generates wide social benefits as well as those to the individual student. For this reason it is undesirable that some students, typically from poorer or rural backgrounds, should be deterred from enrolling in primary school because public schools are unavailable and the only option is an expensive fee-paying private school. There is no evidence that enrolment in private school in Kwara takes place for any reason other than the free choice of parents, so the variation from the FTI benchmark is of no great significance.

61
Similarly, the FTI benchmark of 100% of the age group completing the primary cycle implies that all children should start and finish primary school at the procedurally correct ages. This is certainly desirable as a long-run objective, but is a tough (not to say unreasonable) criterion to use when the marginal students now coming into the system are likely to be females or ethnic minority children or those from poor, rural or remote districts who may well start (and therefore finish) school at an older age than average. Kwara appears to have had success in bolstering primary enrolments by getting many over- and some under-age children to enrol. This is a genuine success and genuine progress towards EFA, but its importance is understated by the Kwara benchmark of 79%.42 Table 23: Indicative FTI benchmarks and Kwara’s performance
Indicator FTI Benchmark Kwara’s performance Percentage of age-group entering first grade of primary cycle 100 159
Percentage of age-group completing primary cycle 100 79 Percentage of repeaters among primary school pupils 10 or less <1%
Pupil teacher ratio 40:1 28:1 Average annual wage bill per teacher as a multiple of GNI per capita 3.5 2.58
Spending on school inputs other than teachers as a percentage of total recurrent spending on primary education
33 5.8
Annual instructional hours for pupils 850-1000 To be checked Percentage of pupils enrolled in privately financed primary schools 10% or less 21.5%
Cost to construct, furnish and equip a primary classroom (US$) N1.25 million or
US$10,500 Share of primary education in overall education spending 42-64 53.9%
Domestically-generated government revenues as % of GDP 14-18 n.a.
Public recurrent resources for education: As a percentage of domestically generated revenues 20 18.4%
As a percentage of GDP 2.8-3.6 n.a. If the overall picture from Table 23 is that, with due regard to local circumstances, Kwara is doing well when measured against the totality of the FTI benchmarks, it should not be overlooked that also apparent in the Table are the critical policy issues that emerge from this ESA. First in the sequence of the Table and probably also most important in policy importance are the implications of the generous (and therefore expensive!) pupil: teacher ratio in Kwara. It is as well to preface this observation with the comment that there is nothing in 42 This figure is based on the CWIQ net enrolment rate and near-zero repeater and dropout rates.

62
the international evidence to support the idea that smaller classes lead to improved student performance.43 Kwara’s average ratio of 28 students per primary teacher is low by developing country standards. More seriously, this average low rate conceals substantial variation between LGAs. As Table 21 indicated, some of the LGAs have teacher: pupil ratios which can hardly be explained by the particular problems of school provision in remote or rural areas but which are strongly suggestive of misallocation of both teaching and financial resources. LGAs which spend relatively large amounts of money only to have tiny classes of 9 or 10 students are spending money neither efficiently nor equitably. With SUBEB now getting to grips with the accurate measurement of primary enrolments, Kwara urgently needs a school mapping exercise, combined with a review of the system of hiring and allocating teachers to primary schools. Redeploying teachers is never a comfortable or straightforward exercise, but the number of teachers and the pattern of deployment in Kwara is inhibiting expenditure on other essential inputs. This leads to the second critical policy implication from Table 33, the stark finding that Kwara’s spending on non-salary recurrent items is far below the FTI benchmark. While non-salary recurrent covers a wide range of items, the focus of this benchmark is spending on textbooks and other directly instructional materials. As we saw in Chapter 4, there are numerous determinants of improved educational quality, but one of the most important is the adequate provision of books and teachers’ guides. Kwara’s record in the supply of such essential items is very poor. While the FTI benchmarks focus upon appropriately-sized classes and the provision of adequate learning materials, it is vital not to overlook other important aspects of quality. Chart 15 demonstrated that what really matters, as a critical priority, are generously-provided learning and teaching materials, teachers who have sufficient mastery of the curriculum subjects to make good use of those materials, and plenty of time on task. Kwara meets the third of these, since its primary students are in school for an adequate number of hours; it performs very poorly with the first, “generously-provided learning and teaching materials”; and although it has large numbers of teachers, it is very doubtful if those teachers on average “have sufficient mastery of the curriculum subjects to make good use of those materials”. 43 Writing 40 years ago, one commentator noted that “over the years we have had hundreds of experiments testing the effectiveness of teaching in small and large classes. Despite the fact that in the vast majority of instances these tests show either that the advantage (as shown by the tests) lies with the large class or that there is no significant difference, the folklore of the small class persists” (Harris 1962). There have been many more experiments in the years since then. Indeed, the relationship between class size and student performance is probably the most researched topic in education. This more recent work has not produced any reason to modify the conclusions reached by Harris so many years ago. While much of the evidence on class size comes from richer countries, evidence from developing countries supports the argument that learning can be improved, not weakened, by using fewer teachers where classes are small and reallocating the money saved to other items such as textbooks and libraries (Psacharopoulos and Woodhall 1985; World Bank 1995). In a compilation of the evidence for developing countries, Fuller (1987) found that only 5 out of 21 studies supported the idea that smaller class size improves student performance. The balance of opinion today is that student performance is more or less unaffected by class size within the range of 25-50 students.

63
The evidence is mostly anecdotal, but it is widely accepted that the average quality of Kwara’s teachers is low. It is common when assessing the standard of teachers to cite the proportion of teachers who have had adequate pre-service training, but the proportion of qualified teachers is not a serious issue for Kwara. Over half of primary teachers have the National Certificate of Education (more than two-thirds of females) and another 12 percent of primary school teachers are university graduates. Grade II and unqualified teachers now account for only 20 percent of all teachers employed at government primary schools. The percentage of qualified teachers varies considerably from one LGEA to another, but on state average there is nothing in the pattern of teacher qualifications to suggest that a lack of qualified teachers is a major contribution to poor-quality student outcomes. The problem seems to be not so much the standard of pedagogical preparation in the colleges of education but the fact that students enter the colleges with very low levels of subject mastery; the colleges are forced to spend large amounts of time teaching material to aspiring teachers that should have been acquired in school; and in practice this remedial work does not make sufficient improvement because so many students are emerging from the schools with standards of subject knowledge and cognitive outcomes that do not even approach the right building block for tertiary study. The answer is that Kwara will need to consider a substantial shift in the resources it allocates to the colleges of education, and they in turn will need to change their role from being overwhelmingly institutions for pre-service training to being to a considerable extent providers of in-service teacher development. Some of this in-service will no doubt be upgrading of pedagogical skills. But much of it should use a thoroughly basic approach, subject or curriculum focussed, so that with the help of more plentiful teachers’ guides teachers can actually do a better job of delivering a curriculum and teaching subjects which at present they understand scarcely better than the students they teach. Two further policy issues need to be considered. The first of these has to a large extent been overtaken by events. Kwara has a large population of tertiary students, both by Nigerian and by SSA standards. It has recently embarked on a process of establishing a State university and amalgamating various colleges. If the main objective is to achieve a better balance of resources and improved quality by rationalisation and upgrading then the policy is to be welcomed. The problem is that the broad policy has been announced but the operational details are not yet available. The risk is that the new policy will in practice mean substantial expansion of tertiary places, with no meaningful rationalisation or cost-saving reorganisation of the existing colleges. In these circumstances the result can only be to shift the balance of public educational expenditure to the tertiary sector, to the likely detriment of primary and secondary schooling. It is not hard to envisage that desperately needed resources for instructional materials and teacher in-service development for the primary and secondary sectors will instead be diverted to funding a new State university. The longer term consequence is that the increased supply of tertiary places will raise student expectations, primary and secondary quality will not receive the investment it requires, and the educational system will be caught up in a spiral of increasing quantity and declining quality.
64
Finally, and much less problematic, if the enrolment calculations derived in this ESA are even approximately correct, the private sector is much larger than previously thought, but not much else is known about private schooling in Kwara. The work of Tooley and Dixon cited earlier44 makes it clear that in Nigeria as elsewhere private schools are neither the preserve of the rich nor the low-standard diploma factories often alleged. At present existing methods of conducting the annual school census produce results that, bluntly, add little of value to the private school information in EMIS. A modest investment in reformed methods of collecting data would add substantially to the information available for public policy for private schooling in Kwara.
44 Tooley James and Dixon Pauline (2005), Private Education is Good for the Poor, A Study of Private Schooling Serving the Poor in Low-Income Countries, Cato Institute.