Embed Size (px)
Citation preview

KVK PAR POWER PRIVATE LTD.
Par Hydroelectric Project (52 MW)
July 2014
Power Division
161133-40ER-0007-00
DETAILED PROJECT REPORT
VOLUME-I (Part-I)
MAIN REPORT (Chapters 1 to 8)
Par Hydroelectric Project (52 MW) Detailed Project Report
161133-47ER-0007-00
NOTICE
This document contains the expression of the professional opinion of SNC-Lavalin Engineering India Private Limited. (“SLEI”) as to the matters set out herein, using its professional judgment and reasonable care. It is to be read in the context of agreement dated 09th September, 2011 (the “Agreement”) between SLEI and the Client, and the methodology, procedures and techniques used, SLEI’s assumptions, and the circumstances and constrains under which its mandate was performed. This document is written solely for the purpose stated in the Work Order, and for the sole and exclusive benefit of the Client, whose remedies are limited to those set out in the Work Order. This document is meant to be read as a whole, and sections or parts thereof should thus not be read or relied upon out of context. SLEI has, in preparing the cost estimates, followed methodology and procedures, and exercised due care consistent with the intended level of accuracy, using its professional judgment and reasonable care, and is thus of the opinion that there is a high probability that actual costs will fall within the specified error margin. However, no warranty should be implied as to the accuracy of estimates. Unless expressly stated otherwise, assumptions, data and information supplied by, or gathered from other sources (including the Client, other consultants etc.) upon which SLEI’s opinion as set out herein is based has not been verified by SLEI; SLEI makes no representation as to its accuracy and disclaims all liability with respect thereto. SLEI disclaims any liability to the Client and to third parties in respect of the publication, reference, quoting, or distribution of this report or any of its contents to and reliance thereon by any third party.

July 2014
Power Division
161133-40ER-0007-00
KVK PAR POWER PRIVATE LTD.
PAR HYDROELECTRIC PROJECT (52 MW)
DETAILED PROJECT REPORT
EXECUTIVE SUMMARY
VOLUME-I : MAIN REPORT
VOLUME-II : BILL OF QUANTITIES & COST ESTIMATION
VOLUME-III : DRAWINGS
VOLUME-IV : APPENDICES

Par Hydroelectric Project (52 MW) Detailed Project Report
Volume-I (Part-I)Main Report
161133-40ER-0007-00 Page 1 of 1
DPR CONTENTS – VOLUME WISE
Executive Summary
Volume-I : Main Report
Part-I : Chapters 1 to 8
Check List Proforma
Salient Features
Chapter 1 : Introduction
Chapter 2 : Project Area
Chapter 3 : Need for the Project
Chapter 4 : Data Collection and Field Investigation
Chapter 5 : Project Hydrology
Chapter 6 : Project Geology
Chapter 7 : Power Potential Study
Chapter 8 :Design & Description of Civil Engineering Structures
Part-II : Chapters 9 to 17
Chapter 9 : Hydro-mechanical Equipment
Chapter 10 Power Plant Equipment
Chapter 11 : Construction Methodology & Equipment Planning
Chapter 12 : Construction Material
Chapter 13 : Infrastructure Works
Chapter 14 : Project Management Plan
Chapter 15 : Environmental & Ecological Aspects
Chapter 16 : Cost Estimation
Chapter 17 : Economic Evaluation
Volume-II : Bill of Quantities & Cost Estimation
Chapter-1 : Abstract of Cost Estimate
Chapter-2 : Detail Cost of Civil, Hydro-mechanical and Electromechanical Works
Chapter-3 : Item Rate Analysis of Major Civil Works
Chapter-4 : Analysis of Hourly Use Rate of Major Equipments
Volume-III : Drawings
(Project Geology, Civil, Hydro-Mechanical and Electromechanical Equipments)
Volume-IV : Appendices
Appendix-A : Hydro-meteorological, G&D Data
Appendix-B : Report on Laboratory Tests
Appendix-C : Geological Data

Par Hydroelectric Project (52 MW) Detailed Project Report
Volume-I (Part-I)Main Report
161133-40ER-0007-00
CHECK LIST PERFORMA

Par Hydroelectric Project (52 MW) Detailed Project Report Check List
161133-40ER-0007-00 Page 1 of 5
CHECK LIST
1. NAME OF THE PROJECT Par Hydroelectric Project
(52 MW)
2. LOCATION
State Arunachal Pradesh
District Papum Pare
Nearest Village Sagalee village
3. CATEGORY OF THE PROJECT Run-of-the-river,
Small Hydroelectric Project
4. PLANNING
Have the alternative proposals been studied
and their merits and demerits discussed?
Yes
Have the detailed topographical survey been
carried out for the following items and
drawings prepared as per prescribed scale?
o Stream surveys Yes
o Head works surveys (Weir or diversion
structure)
Yes
o Plant site and campsite Yes
o Water conductor system Yes
o Powerhouse, switchyard, tailrace Yes
o Penstock, Surge shaft Yes
o Communication etc. Yes

Par Hydroelectric Project (52 MW) Detailed Project Report Check List
161133-40ER-0007-00 Page 2 of 5
5. GEOLOGY
Have the geological surveys for head works,
powerhouse, tailrace etc. been carried out
and report on general geology of the area and
on geology of the sites of principal structures
appended?
Yes
6. FOUNDATION INVESTIGATION
Have the foundation investigation for the
major civil structures and of the schemes etc.
been carried out
Yes
7. MATERIAL SURVEYS
Have the survey and laboratory test for the
Construction material like pervious &
impervious soil, sand, aggregates etc. carried
out?
Yes
8. HYDROLOGICAL & METEOROLOGICAL
INVESTIGATIONS
Have the hydrological and meteorological
investigations been carried out and status of
data discussed in report?
o Rainfall in the catchment Yes
o Gauge and discharge data of the Stream Yes
9. HYDROLOGY
Have hydrological survey been carried out to
establish the availability of water for the
benefits envisaged and what is the
dependability of the potential?
Yes

Par Hydroelectric Project (52 MW) Detailed Project Report Check List
161133-40ER-0007-00 Page 3 of 5
10. LAND ACQUISITION & RE-SETTLEMENT
(Wherever applicable)
Have the provisions for the land acquisition
been considered?
Yes
Have the socio-economic problems involved
in re-settlement been investigated and
discussed?
Re-settlement not involved
11. DESIGN
Has the layout of the project area viz. location
of diversion structure, water conductor
system, powerhouse and tailrace been
finalized?
Yes
Have the preliminary designs been prepared
for the following components?
o Diversion structure Yes
o Penstock & Water conductor system Yes
o Powerhouse & switch yard Yes
o Powerhouse equipment, LT Ht switching
equipment and control and protection
equipment
Yes
o Steel of various sizes and type of
reinforcement
Yes
o Other materials – cement, electricity
explosives etc.
Yes
12. POWER BENEFITS
Have the following points discussed?
o Total energy production and installed
capacity of the grid system
Yes
o How does the scheme fit into overall
development of power of the region?
Yes

Par Hydroelectric Project (52 MW) Detailed Project Report Check List
161133-40ER-0007-00 Page 4 of 5
o Energy generated from the project, firm
power, seasonal power and total power
Yes
o Proposal for transmission and or
connecting the existing system
Yes
o Cost of generation per kW installed
capacity as per kWh generated as
compared to the various small/mini/
micro-hydel projects and various
services in the region to justify the
economic variability of scheme
Yes
13. CONSTRUCTION PROGRAM
Are the major components of work projects to
be done departmentally or through
contractor?
Have the year/month-wise quantities of the
following items been worked out for various
components of the project (Total quantity)
o Excavation – soft and hard strata Yes
o Earth work in filling Yes
o Stone for masonry Yes
o Coarse aggregate for concrete Yes
o Steel of various size and type of
Reinforcement
Yes
o Cement Yes
o Other material – POL electricity,
explosive etc.
Yes
14. ESTIMATES
Is the estimate prepared Yes

Par Hydroelectric Project (52 MW) Detailed Project Report Check List
161133-40ER-0007-00 Page 5 of 5
Have the analysis of rates for various major
items and the components of the project been
furnished with analysis and the price index at
which estimate is based?
Yes
15. ECOLOGICAL & ENVIRONMENTAL ASPECTS
Is the area likely to have any environmental
and ecological problems due to alternate
surface water pattern and preventive
/corrective measures discussed? (Whichever
applicable)
No environmental and
ecological degradation is
expected.
16. CAMPS AND BUILDINGS
Have the provisions for camps/ buildings
made Expenses
Yes, in the establishment
17. SOIL CONSERVATION
Is the need for soil conservation measures in
the project discussed?
Not applicable

Par Hydroelectric Project (52 MW) Detailed Project Report
Volume-I (Part-I)Main Report
161133-40ER-0007-00
SALIENT FEATURES

Par Hydroelectric Project (52 MW) Detailed Project Report Salient Features
161133-40ER-0007-00 S-1
SALIENT FEATURES
Project Location
o State : Arunachal Pradesh
o District : Papum Pare
o River : Pare
o Vicinity : Sagalee village
Hydrology
o Catchment area : 420 km2
o Max Discharge -10-Daily : 133.23 cumec
o Min discharge -10-Daily : 3.96 cumec
o Standard Project Flood (SPF) : 3060 cumec
o 100 Year Flood : 2759 cumec
Reservoir
o Full Reservoir Level (F.R.L) : El 848.0m
o Minimum Draw-down Level (M.D.D.L) : El 845.0m
o Gross Storage at FRL : 1.17 MCM
o Live storage : 0.35 MCM
o Length of submergence : 2000m
o Area under submergence at FRL : 14.44 Ha
River Diversion (During Construction)
o Diversion Arrangement : Diversion channel through one
half of river
o Diversion Discharge : 424 cumec
Spillway
o Latitude : 27° 14’ 33” N
o Longitude : 93° 30’ 43” E
o Top of Barrage : El 850.0m

Par Hydroelectric Project (52 MW) Detailed Project Report Salient Features
161133-40ER-0007-00 S-2
o Crest Level of Spillway : El 823.50m
o Spillway Foundation Level (Lowest) : El 811.0m
o Spillway Height from crest Level : 26.5m
o Gate Type and Size (WxH) : 4 nos. Radial Gates; 6.5m x
10.6m
o Hoist Type and Capacity : Twin Hydraulic Hoist (2 x 65 MT)
o Stop log Type and Size (WxH) : Vertical lift slide type, 6.5m x
12.8m
o Hoist Type and Capacity : Gantry Crane, 20 MT
Intake
o Design Discharge (Including flushing
discharge)
: 34.19 cumec
o No. of Trash rack bays & height : 2 nos (3.5m x 12m)
o Sill level of Trash rack : El 838.0m
o Trash rack panel size : 3.78m (W) x 2.031m (H)
o Total number of panels : 2 x 6
o Intake Gate : Stop log, Vertical lift wheel type
o Bottom elevation of intake Gate : El 840.00m
o Intake Gate Size (WxH) : 1 no. (3.5m x 9.76m) each bay
o Hoist Type and Capacity : Rope drum hoist, 16 MT
o Number of Feeder Channels : 2 nos.
o Size of Feeder channels (WxH) : 3.5m x 10.00m
Desilting Basins
o Desilting Basin Size (LxWxH) : 2 nos. (100m x 8.50m x 13.0m)
o Size of Particle to be Removed : >0.2mm
o Design Discharge for each Basin : 17.09 cumec
o Flushing Discharge for each Basin : 2.85 cumec
o Flushing Duct Size (WxH) : 0.7m (W) x 1.2m (H) depth
variable

Par Hydroelectric Project (52 MW) Detailed Project Report Salient Features
161133-40ER-0007-00 S-3
o No. of Trash rack bays at end of
Desilting
: 4 Nos.
o Size of Trash rack (W x H) : 3.75m x 10.00m
o Bottom level of Trash rack : El 840.00m
o Desilting Chambers outlet Gate : Vertical lift Slide type
o Gate Size (WxH) : 1 no. (5.0m x 9.76m)
o Hoist Type and Capacity : Mono rail hoist, 18 T
o Nos. of Flushing Ducts : 2 Nos
o Flushing Duct Gate : Vertical lift slide type
o Flushing Channel Gate Size (WxH) : 2 nos. in each duct (0.7m x
1.2m)
Headrace Tunnel
o Type : Concrete lined & steel lined in
low cover zone
o Concrete Lined
- Shape of HRT : Modified D shaped
- Diameter of the Tunnel : 3.5m (W) x 4.25m (H)
- Concrete lining thickness : 250mm
o Steel lined
- Shape of HRT : Circular shaped
- Diameter of the Tunnel : 3.6m
- Total Length of HRT : 8636m
- Design Discharge : 28.49 cumec
Adit
o Intermediate Adit to HRT : 5m (W) x 6m (H), 394m long
Surge Shaft
o Type : Open to the surface Restricted
Orifice type, Vertical Shaft
o Diameter : 7.5m

Par Hydroelectric Project (52 MW) Detailed Project Report Salient Features
161133-40ER-0007-00 S-4
o Orifice : 1500mm dia circular orifice
o Total Height : 81.0m
o Top elevation : El. 876.5m
o Bottom elevation : El. 795.50m
Pressure Shaft
o Number and Diameter : One / 2.5m
o Thickness of Liner : 12-22mm
o Type of Steel : ASTM A537 Class II
o Total Length of Main Pressure Shaft : 481m
o Design Discharge through Pressure
Shaft
: 28.49 cumec
Unit Penstocks (After Bifurcation)
o Number and Diameter : 2 nos., 1.8m
o Thickness of Liner : 22mm
o Type of Steel : ASTM A537 Class II
o Length of unit penstock : 27m
o Design Discharge through each
Penstock
: 14.25 cumec
Main Inlet Valve
o Type : Spherical valve
o Number : 2 nos.
o Axis Elevation : 626.25m a.s.l.
o Diameter : 1.4m
Surface Powerhouse
o Latitude : 27° 13’ 11”N
o Longitude : 93° 34’ 55”E
o Dimensions (L X W X H) : 48.5m x 17.0m x 30.35m

Par Hydroelectric Project (52 MW) Detailed Project Report Salient Features
161133-40ER-0007-00 S-5
o Turbine Type : Francis
o Number of Units : 2 nos.
o Elevation of Turbine Center Line : El 626.25m
o Rated Discharge per Unit : 14.25 cumec
o Turbine Speed : 500 rpm
o Net Head : 202.0
o Installed Capacity : 2 x 26 MW
o EOT Crane capacity (Power House) : 1 No. 80/ 20 MT
Draft Tube Gates
o Type of Gate : Vertical Lift Slide Type
o Gate Size (WxH) : 2 nos., 4.5m x 2.22m
o Hoist Type and Capacity : Gantry Crane, 10 MT
Generator
o Type : Suspended type
o Number : 2 nos.
o Rated Capacity : 28.89 MVA
o Generator Voltage / Frequency : 11 kV / 50Hz
o Power Load Factor (CosØ) : 0.9
Step Up Transformer
o Voltage Ratio : 11kV/ 132kV
o Rating : 3Ф, 32 MVA
Tailrace Channel
o Length : 32.86m
o Width : 20m
o Slope : 1V : 4H
o Outlet Sill Elevation : 630.0m. a.s.l

Par Hydroelectric Project (52 MW) Detailed Project Report Salient Features
161133-40ER-0007-00 S-6
Switch Yard
o Type : Out door
o Area (L x W) : 40m x 50m
Estimated Cost
o Civil Works including HM works : 273.70 Crores
o E&M Works : 72.20 Crores
o Total Basic Cost : 345.90 Crores
o Escalation Cost : 80.96 Crores
o IDC and Financing Charges : 65.84 Crores
o Total Project Cost : 492.70 Crores
o Cost per MW : 9.48 Crores
o Cost per MU : 2.59 Crores
Power Benefits
o 90% dep. Energy : 190.25 MU
o 50% dep. Energy : 295.01 MU
Financial Aspects (at Powerhouse bus bar) - 35 Years Operation
o Levellised Tariff / kWh (with free power
to the State), /kWh
: 5.72
o 1st Year Tariff (with free power to the
State), /kWh
: 6.61
o Levellised Tariff / kWh (without free
power to the State), /kWh
: 5.03
Construction Period
o Construction Period : 4 Years 6 Months after 1 year
of pre-construction period

Par Hydroelectric Project (52 MW) Detailed Project Report
Volume-I (Part-I)Main Report
161133-40ER-0007-00
CHAPTER - 1 Introduction

Par Hydroelectric Project (52 MW) Detailed Project Report
Volume-I (Part-I)Main Report
161133-40ER-0007-00 i
TABLE OF CONTENTS
PAGE NO.
1 INTRODUCTION ...................................................................................................... 1-1
1.1 General ......................................................................................................... 1-1
1.2 River System ................................................................................................ 1-2
1.3 Location ........................................................................................................ 1-2
1.4 The Par Project ............................................................................................ 1-3
1.5 Organization of the Report ........................................................................... 1-3
1.6 The Consultant ............................................................................................. 1-5
1.7 Acknowledgement ........................................................................................ 1-5
Par Hydroelectric Project (52 MW) Detailed Project Report
Volume-I (Part-I)Main Report
161133-40ER-0007-00 i
LIST OF FIGURES
PAGE NO.
Figure 1-1: Project Location ................................................................................................. 1-1
Figure 1-2: Google Earth Image of the Project Area ............................................................ 1-3
Par Hydroelectric Project (52 MW) Detailed Project Report
Volume-I (Part-I)Main Report
161133-40ER-0007-00 1-1
1 INTRODUCTION
1.1 General
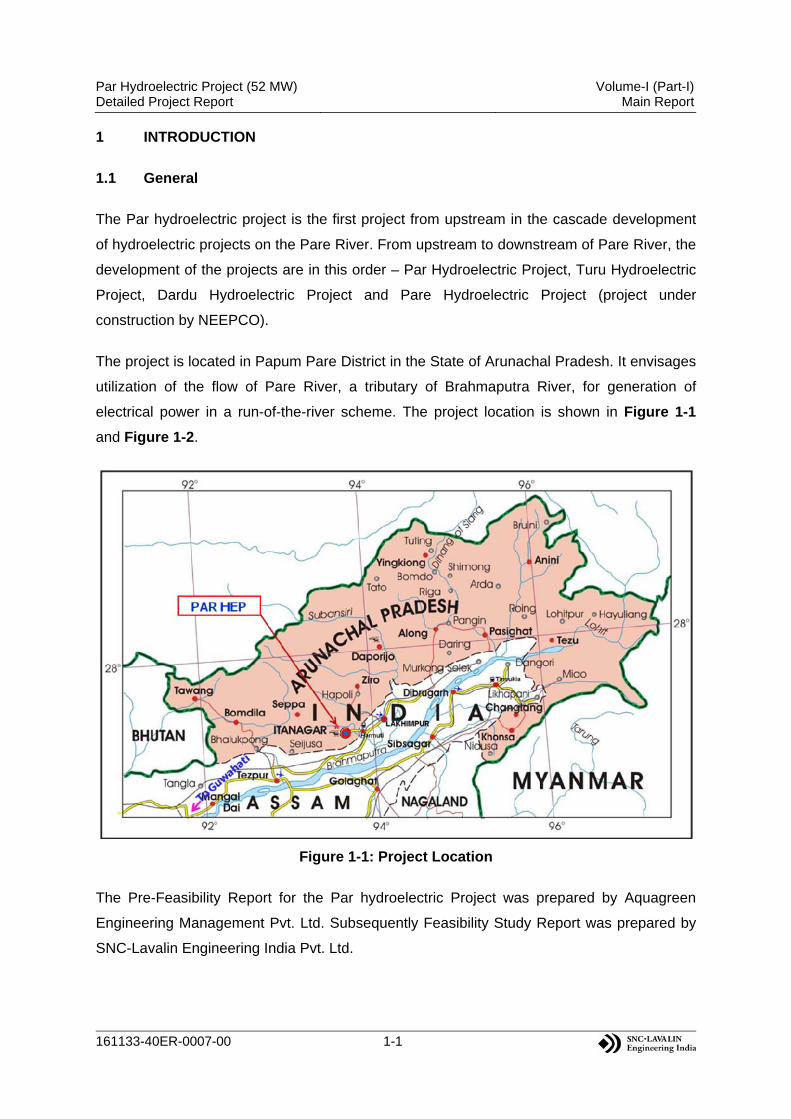
The Par hydroelectric project is the first project from upstream in the cascade development
of hydroelectric projects on the Pare River. From upstream to downstream of Pare River, the
development of the projects are in this order – Par Hydroelectric Project, Turu Hydroelectric
Project, Dardu Hydroelectric Project and Pare Hydroelectric Project (project under
construction by NEEPCO).
The project is located in Papum Pare District in the State of Arunachal Pradesh. It envisages
utilization of the flow of Pare River, a tributary of Brahmaputra River, for generation of
electrical power in a run-of-the-river scheme. The project location is shown in Figure 1-1
and Figure 1-2.
Figure 1-1: Project Location
The Pre-Feasibility Report for the Par hydroelectric Project was prepared by Aquagreen
Engineering Management Pvt. Ltd. Subsequently Feasibility Study Report was prepared by
SNC-Lavalin Engineering India Pvt. Ltd.

Par Hydroelectric Project (52 MW) Detailed Project Report
Volume-I (Part-I)Main Report
161133-40ER-0007-00 1-2
1.2 River System
The Pare, Panior and Dikrong are the main rivers of the Papum Pare district. A short
description of river system is discussed in subsequent paras.
Panior: The Panior river rises from a high mountain called Khoren Putu lying to the
northwest of Sagalee. A tributary called Pareing also feeds the river formed by two
streams-Nirpung and Nirke. The Panior known in the plains of Assam as Ranga-Nadi falls
into Brahmaputra. The Ranga-Nadi hydroelectric project is built on this river.
Pare: The River Pare originates at elevation of about 2850m as Pare nadi in the Lower
Subansiri district. After flowing or about 24km from North to South, the Pare takes an
eastward turn and flows for about 43km upto Sekhi. On the way, it passes through Sagalee.
After the confluence of Kheel nallah from right Bank and Shu nallah from left bank the river is
called Dikrong. The river (Pare/ Dikrong) then flows for about 18kms upto the Pare
hydroelectric project dam site near Jampa. The river ultimately discharges into the
Brahmaputra.
Dikrong: Dikrong drains the southern part of the district. The Par, Nirochi and Pachin rivers
form it. It flows from the west to the southeast, and passing through Itanagar region and
merges with Brahmaputra in the Lakhimpur district of Assam.
1.3 Location
The proposed Par hydroelectric project is located on Pare River downstream of Sagalee
village. The Latitude and Longitude of the Diversion Barrage and the Powerhouse sites are
as given below:
Barrage Powerhouse
Latitude: 27°14’33” N 27°13’11” N
Longitude: 93°30’43” E 93°34’55” E
The satellite image of the project area can be viewed in Figure 1-2.

Par Hydroelectric Project (52 MW) Detailed Project Report
Volume-I (Part-I)Main Report
161133-40ER-0007-00 1-3
Figure 1-2: Google Earth Image of the Project Area
1.4 The Par Project
The Par Hydroelectric Project envisages utilization of water of river Pare by constructing a
diversion structure near Sagalee village. The project site is approachable from Itanagar/
Naharlagun. The diversion site is approachable by road from Kheel village. The diversion
site and powerhouse site is about 77km and 64km away from the Naharlagun, respectively.
The water conductor system is envisaged on the left bank of Par River. The intake is located
on the left bank and it leads to a surface desilting basins. Two desilting basins are proposed
considering the amount of water diverted into the system. A modified D-shaped
Headrace Tunnel (some part steel conduit) ending in a open to sky surge shaft with restrict
orifice type then a pressure shaft off takes from the surge shaft leading to a surface
powerhouse proposed to be located on a river terrace on its left bank.
Detailed layout and design aspects of the project are described in subsequent sections of
this report.
1.5 Organization of the Report
This Detailed Project Report (DPR) describes the techno economical aspects of
Par Hydroelectric Project. The report is organized in four volumes. Detailed structure of
project report is described below:

Par Hydroelectric Project (52 MW) Detailed Project Report
Volume-I (Part-I)Main Report
161133-40ER-0007-00 1-4
Executive Summary
Volume-I : Main Report
o Part-I
- Salient Features
- Chapter-1 : Introduction
- Chapter-2 : Project Area
- Chapter-3 : Need for the Project
- Chapter-4 : Data Collection and Field Investigation
- Chapter-5 : Project Hydrology
- Chapter-6 : Project Geology
- Chapter-7 : Power Potential Study
- Chapter-8 : Design & Description of Civil Engineering Structures
o Part-II
- Chapter-9 : Hydro-mechanical Equipment
- Chapter-10 : Power Plant Equipment
- Chapter-11 : Construction Methodology & Equipment Planning
- Chapter-12 : Construction Material
- Chapter-13 : Infrastructure Works
- Chapter-14 : Project Management Plan
- Chapter-15 : Environmental & Ecological Aspects
- Chapter-16 : Cost Estimation
- Chapter-17 : Economic Evaluation
Volume-II : Bill of Quantities & Cost Estimation
Volume-III : Drawings (Civil, Geology, Hydro-mechanical & Electromechanical)
Volume-IV : Appendices
o Appendix-A Hydro-meteorological, G&D Data
o Appendix-B Report on Laboratory Tests
o Appendix-C Geological Data

Par Hydroelectric Project (52 MW) Detailed Project Report
Volume-I (Part-I)Main Report
161133-40ER-0007-00 1-5
1.6 The Consultant
KVK Par Power Pvt. Ltd. has appointed SNC-Lavalin Engineering India Pvt. Ltd. (SLEI) as
its consultant for the preparation of the DPR. At this stage of the project, Detailed Project
Report has been prepared to facilitate the Owner to submit the same to the Govt. of
Arunachal Pradesh to obtain necessary statutory clearances. SLEI is a wholly owned
subsidiary of SNC-Lavalin Inc. (SLI) of Montreal, Canada and its office in Delhi is an
extension of Hydro Division of SLI.
SNC-Lavalin’s Hydro Division, based in Montreal, Canada, has participated in the
development of hydroelectric projects operating under heads ranging from 5 m to over
800 m, with a total cumulative installed capacity of more than 250000 MW. It has designed
and managed construction of underground and surface powerhouses; concrete arch,
concrete gravity, earthfill, rockfill, masonry and roller-compacted concrete dams.
The Division has designed and managed the driving of power tunnels in geological
conditions as diverse as the granite of the Canadian Shield and the metamorphic-volcanic
rocks of the Himalayas. With its wide experience at home and abroad, the Division has
become the leading exporter of Canadian hydroelectric technology. The Division has been
involved in design and engineering of several important hydroelectric projects around the
world, including several in India.
SNC-Lavalin’s Hydro Division has established a design and engineering office in Delhi
where it employs around 125 full-time personnel including technical and administrative staff.
In addition, it has a pool of several specialist local consultants whose services are availed on
specific tasks, as required. The Indian office has access to, and regularly uses, the expertise
of Canadian hydro specialists of SNC-Lavalin.
1.7 Acknowledgement
SLEI sincerely acknowledges the support provided by the Owner during the preparation of
this report. Cooperation extended by the Owner in providing all the pertinent information
required for completion of this report is also gratefully acknowledged.

Par Hydroelectric Project (52 MW) Detailed Project Report
Volume-I (Part-I)Main Report
161133-40ER-0007-00
CHAPTER - 2 Project area

Par Hydroelectric Project (52 MW) Detailed Project Report
Volume-I (Part-I)Main Report
161133-40ER-0007-00 i
TABLE OF CONTENTS
PAGE NO.
2 PROJECT AREA ..................................................................................................... 2-1
2.1 Geographic Features .................................................................................... 2-1
2.2 Topographic Features .................................................................................. 2-1
2.3 Climate ......................................................................................................... 2-1
2.4 Socio-Economic Aspects .............................................................................. 2-2
2.4.1 Demographic Features ..................................................................... 2-2
2.4.2 Ethnographic Details and Religion .................................................... 2-2
2.4.3 Health and Education ....................................................................... 2-3
2.4.4 Trade & Industry ............................................................................... 2-3
2.4.5 Natural Resources ............................................................................ 2-4
2.5 Papum Pare District ..................................................................................... 2-4
2.6 Hydropower Potential ................................................................................... 2-5

Par Hydroelectric Project (52 MW) Detailed Project Report
Volume-I (Part-I)Main Report
161133-40ER-0007-00 2-1
2 PROJECT AREA
2.1 Geographic Features
Arunachal Pradesh is the easternmost state of India. Arunachal Pradesh shares its border
with the states of Assam to the south and Nagaland to the southeast. Burma/Myanmar lies
towards the east, Bhutan towards the west, and Tibet to the north. This region acquired an
independent political status in January 20, 1972, when it was declared as Union Territory
under the name of Arunachal Pradesh. The State of Arunachal Pradesh Bill was passed by
the Parliament in 1986 and with effect from February 20, 1987 Arunachal Pradesh became
the 24th state of Indian Union. Itanagar is the capital of the state.
Arunachal Pradesh is divided into sixteen districts. The state is mostly mountainous with the
Himalayan range along the northern borders criss-crossed with ranges running north-south.
These divide the state into five river valleys: the Kameng, the Subansiri, the Siang, the Lohit
and the Tirap. All these are fed by snow from the Himalayas and countless rivers and
rivulets.
2.2 Topographic Features
Arunachal Pradesh, one of the most sparsely populated states of India, covers an area of
83,743 sq.km. Arunachal is the largest state area-wise in the north-east region. Itanagar, the
capital is about 530m above mean sea level. Arunachal Pradesh has a long international
border with Bhutan to the west (160km), China to the north and north-east (1,080km) and
Myanmar to the east (440km). It stretches from snow-capped mountains in the north to the
plains of Brahmaputra valley in the south. The Himalayan ranges that extend up to the
eastern Arunachal separate it from China. The ranges extend toward Nagaland, and form a
boundary between India and Burma in Changlang and Tirap district, acting as a natural
barrier called Patkai Bum Hills. They are low mountains compared to the Greater Himalayas.
2.3 Climate
The weather and the climate of Arunachal Pradesh are quite unique from the rest of India.
The climate of Arunachal is governed by the Himalayan system and the altitudinal
differences. The climate here is highly hot and humid at the lower altitudes and in the valleys
wrapped by marshy thick forest particularly in the eastern region, while it becomes too cold
in the higher altitudes. Average temperature during the winter months range from
15 to 21 degree celsius and 22 to 30 degree celsius during monsoon. Between June and

Par Hydroelectric Project (52 MW) Detailed Project Report
Volume-I (Part-I)Main Report
161133-40ER-0007-00 2-2
August the temperature sometimes go up to 40 to 42 degree celsius. The rainfall of
Arunachal Pradesh is amongst the heaviest in the country. Arunachal Pradesh receives
about 80 to 160 inches (2,000 to 4,000mm) annually, most of it between May and
September.
2.4 Socio-Economic Aspects
2.4.1 Demographic Features
The population of Arunachal Pradesh is 1.1 million according to 2001 census and is
scattered over 16 towns and 4065 villages. The State has the lowest density of
13 persons per sq.km. As against decadal growth rate of 21.54% at the national level, the
population of the State has grown by 27% over the period 1991-2001. The sex ratio of
Arunachal Pradesh at 893 females to 1000 males is lower than the national average of 933.
Total literacy of the State rose to 44.24% from 41.59% in 1991. There are 20 major tribes
and a number of sub-tribes inhabiting the area. Most of these communities are ethnically
similar, having derived from and original common stock but their geographical isolation from
each other has brought amongst them certain distinctive characteristics in language, dress
and customs.
2.4.2 Ethnographic Details and Religion
Broadly the people may be divided into three cultural groups on the basis of their
socio-religious affinities.
The Monpas and Sherdukpens of Tawang and West Kameng districts follow the lamaistic
tradition of Mahayana Buddhism. Noted for their religious fervor, the villages of these
communities have richly decorated Buddhist temples, locally called 'Gompas'.
Though largely agriculturists practicing terrace cultivation, many of these people are also
pastoral and breed herds of yak and mountain sheep. Culturally similar to them are Membas
and Khambas who live in the high mountains along the northern borders. Khamptis and
Singphos inhabiting the eastern part of the State are Buddhists of Hinayana sect.
They are said to have migrated from Thailand and Burma long ago and still using ancient
scripts derived from their original homeland.
The second groups of the people are Adis, Akas, Apatanis, Bangnis, Nishis, Mishmis, Mijis,
Thongsas etc., who worship Sun and Moon God namely, Donyi-Polo and Abo-Tani,
the original ancestors for most of these tribes. Their religious rituals largely coincide with

Par Hydroelectric Project (52 MW) Detailed Project Report
Volume-I (Part-I)Main Report
161133-40ER-0007-00 2-3
phases of agricultural cycles. They invoke nature deities and make animal scarifices.
They traditionally practice jhumming or shifting cultivation. Adis and Apatanis extensively
practice wet rice cultivation and have a considerable agricultural economy. Apatanis are also
famous for their paddy-cum-pisciculture. They are specialised over centuries in harvesting
two crops of fish along with each crop of the paddy.
The third group comprises Noctes and Wanchos, adjoining Nagaland in the Tirap District.
These are hardy people known for their strictly structured village society in which hereditary
village chief still plays a vital role. The Noctes also practice elementary form of Vaishnavism.
2.4.3 Health and Education
In addition to the few general hospitals spread among the larger towns of Arunachal
Pradesh, nearly every district has its own hospital. In more remote areas, health services are
provided by 31 community health centres and 379 subcentres. Tuberculosis remains a major
concern in the state, with hospital facilities specifically designated as tuberculosis treatment
centres. The Total Fertility Rate of the State is 3.0. The Infant Mortality Rate is 37 and
Maternal Mortality Ratio is NA (SRS 2001-03). The Sex Ratio in the State is
893 (as compared to 933 for the country). Arunachal Pradesh has 299 Pre-nursery schools,
1251 Primary schools, 301 Middle schools, 87 High schools and 67 Higher secondary
schools. There are 3 Industrial Training Institutions and an Engineering college.
2.4.4 Trade & Industry
The state’s manufacturing sector consists primarily of medium and small-scale industries.
Basketry, weaving, and carpets are the main handicraft manufactures. Smaller-scale
industries include rice and oil milling, fruit processing, manufacture of forest-based products,
and steel fabrication. Sericulture (raw silk production) also is important, and the state
produces many varieties of silk yarns. Industrial expansion has been encouraged by the
state’s economic development policies, and industrial estates have been established at
Itanagar, Naharlagun (formerly Old Itanagar), Pasighat, and Deomali.
Arunachal Pradesh has significant, though largely unutilized, resource potential. Among its
resources for generating energy are rivers, coal, and petroleum; most of the state’s power is
provided by hydroelectric plants. In addition to hydrocarbons, other mineral resources of
Arunachal Pradesh include dolomite, quartzite, limestone, and marble.
Par Hydroelectric Project (52 MW) Detailed Project Report
Volume-I (Part-I)Main Report
161133-40ER-0007-00 2-4
For conservation and explorations of vast minerals, the Arunachal Pradesh Mineral
Development and Trading Corporation Limited (APMDTCL) were set up in 1991.
Namchik-Namphuk coal fields are taken up by APMDTCL. To provide training to craftsmen
in different trades, there are two Industrial Training Institutes at Roing and Daporijo.
2.4.5 Natural Resources
Bio-geographically, Arunachal is situated in the Eastern Himalayan province, the richest
biogeographical province of the Himalayan zone. The entire territory forms a complex hill
system with varying elevations ranging from 50m in the foot-hills and gradually ascending to
about 7000m, traversed throughout by a number of rivers and rivulets. Rainfall varies from
1000mm in higher reaches to 5,750mm in the foot-hill areas, spread over 8-9 months
excepting the drier days in winter. This diversity of topographical and climatic conditions has
favoured the growth of luxuriant forests which are home to myriad plant and animal forms
adding beauty to the landscape. Nature has been exceedingly kind and has endowed this
beautiful State of Arunachal Pradesh with diverse forests and magnificent wildlife.
The richness of life forms i.e. the flora & fauna that occur in these forests presents a
panorama of biological diversity with over 5000 plants, about 85 terrestrial mammals, over
500 birds and a large number of butterflies, insects and reptiles. Such an unparalleled
occurrence of life forms can be attributed to the peculiar location of the State which is at the
junction of the Paleoarctic, indo-Chinese, and Indo-Malayan bio-geographic regions, Biotic
elements from all these regions occur in this state making it very rich in floral & faunal
resources. The vegetation of Arunachal Pradesh falls under four broad climatic categories
and can be classified in five broad forest types with a sixth type of secondary forests.
These are tropical forests, sub tropical forests, pine forests, temperate forests and alpine
forests. In the degraded forests, bamboos and other grasses are of common occurrence.
2.5 Papum Pare District
The Papum Pare District, the capital district of Arunachal Pradesh is situated in the
North-Eastern part of India. The entire Papum Pare district is mountainous forming a part of
the Eastern Himalayas. The area comprises of a cross–section of the foothill region
adjoining the border of Assam, the lower hills and the lofty mountain extending northwards.
It is located in between latitude 26°55’ N and 28°40’ and longitude between 92°40’ and
94°21’. The district headquarter is located at Yupia, which is situated about 20km from
Itanagar.

Par Hydroelectric Project (52 MW) Detailed Project Report
Volume-I (Part-I)Main Report
161133-40ER-0007-00 2-5
It is a land of lush green forests, deep river valleys and beautiful plateau. The land is mostly
mountainous with Himalayan ranges. Trees of great size, plentiful of climbers, hundreds of
variety of orchids, cane and bamboos are found in the district.
The district occupies an area of approximately 2,875 sq.km inhabited by a population of
1,21,750. There are 274 villages and 2 towns in the district. Itanagar, the capital of the state
is situated in this district. The district is divided into two administrative subdivisions Sagalee
Sub-Division and Itanagar Capital Complex Sub-division. There are nine administrative
circles Sagalee, Mengio, Toru, Laiporiang, Kimin, Balijan, Doimukh, Itanagar and
Naharlagun.
Itanagar, the capital of Arunachal Pradesh, is about 394 kms from Guwahati and connected
by road and Pawan Hans helicopter service.
2.6 Hydropower Potential
Arunachal Pradesh, with more than 55000 MW hydropower potential, will be known as the
Power House of the country in few years time. In fact the experts say that the identified
potential of 5,5000 MW is a conservative estimate and the actual potential may run into
70,000 MW. Since past few years the State has taken up concerted efforts to harness
this potential by inviting the central public sector undertakings as well as private players to
participate in the process. The State has its own Hydro Power Policy which guides the
Government in the process of harnessing the power potential. It is worth mentioning
that though the State is a late starter as far as harnessing the megapotential, but for micro
hydel the process started way back in 1972.

Par Hydroelectric Project (52 MW) Detailed Project Report
Volume-I (Part-I)Main Report
161133-40ER-0007-00
CHAPTER - 3 Need for the project

Par Hydroelectric Project (52 MW) Detailed Project Report
Volume-I (Part-I)Main Report
161133-40ER-0007-00 i
TABLE OF CONTENTS
PAGE NO.
3 NEED FOR THE PROJECT ....................................................................................... 3-1
3.1 General ............................................................................................................... 3-1
3.2 The Par Hydroelectric Project ............................................................................ 3-2
3.3 Hydro Potential and Its Development ................................................................. 3-2
3.4 Power Demand and Supply Scenario in the Country ......................................... 3-3
3.5 Hydro Power Potential of North-Eastern Region ................................................ 3-4
3.6 Power Scenario of North-Eastern Region .......................................................... 3-6
3.7 Hydropower Potential of Arunachal Pradesh ..................................................... 3-8
3.8 Power Situation in Arunachal Pradesh ............................................................... 3-8
3.9 Development of Hydropower Demand ............................................................... 3-8
3.9.1 Present Status ....................................................................................... 3-8
3.9.2 Forecast ................................................................................................ 3-9
3.9.3 Long Term Plan ................................................................................... 3-10
3.10 Necessity and Justification for Implementing the Project ................................. 3-10

Par Hydroelectric Project (52 MW) Detailed Project Report
Volume-I (Part-I)Main Report
161133-40ER-0007-00 ii
LIST OF TABLES
PAGE NO.
Table 3-1: Sector-wise Installed Capacity of Power Utilities ................................................ 3-2
Table 3-2: Region-wise Installed Capacity of Power Utilities ............................................... 3-2
Table 3-3: Actual Power Supply Position of India ................................................................ 3-3
Table 3-4: Status of Projects commissioned during 11th Plan .............................................. 3-4
Table 3-5: Capacity addition target during the 12th Plan (in MW) ........................................ 3-4
Table 3-6: State-wise estimated hydroelectric potential of North-Eastern Region ............... 3-5
Table 3-7: State-wise Installed Capacity of North-Eastern Region ...................................... 3-6
Table 3-8: Sector-wise Installed Capacity of North-Eastern Region .................................... 3-6
Table 3-9: Actual Power Supply Position in North-Eastern Region ..................................... 3-7
Table 3-10: Likely capacity addition during 12th Plan (2012-17) in North-Eastern Region ... 3-7
Table 3-11: Likely capacity addition (Hydro) during 12th Plan (2012-17) in Arunachal Pradesh ............................................................................................. 3-8
Table 3-12: Plan-wise Growth of Hydropower ..................................................................... 3-9

Par Hydroelectric Project (52 MW) Detailed Project Report
Volume-I (Part-I)Main Report
161133-40ER-0007-00 3-1
3 NEED FOR THE PROJECT
3.1 General
Hydro power is the richest renewable and environmentally benign source of energy.
Hydroelectric stations have the inherent ability of instantaneous starting, stopping and
managing load variations, which helps in improving reliability of the power system.
Hydroelectric stations are the natural choice for meeting peak demand. The generation cost
is inflation free and, in fact, reduces over time. A hydroelectric project has a useful life
extending to well over 35 years and helps in conserving scarce fossil fuels.
Development of hydro power projects also provides the added advantage of opening up
avenues for development of remote and backward areas of the state. Despite being
recognised as a renewable source of energy, the share of hydro power in the overall
generating capacity in the country has been steadily declining since 1963. The share of
hydro power has declined from 44% in 1970 to about 16.5% today.
Several constraints have affected the pace of hydro power development, including
non-availability of long term financing and viability of tariff. Many hydro projects have been
adversely affected by geological surprises, especially during underground excavation.
Other problems arising out of the inaccessible and remote location of the site, delays in land
acquisitions and in resettlement of families affected by the projects have also slowed the
pace of hydro power development in the country.
Government of India has now accorded high priority to the development of hydro potential
and has taken a number of policy initiatives to address the issues impeding hydro power
development. In accordance with the latest hydro power policy (2008), the Government of
India is encouraging substantial private investment in hydro power development.
In order to hasten the progress of hydroelectric generation, a large number of projects have
been identified and their viability has been confirmed through pre-feasibility studies. Many of
these projects have been awarded to private developers who are actively engaged in their
implementation.

Par Hydroelectric Project (52 MW) Detailed Project Report
Volume-I (Part-I)Main Report
161133-40ER-0007-00 3-2
3.2 The Par Hydroelectric Project
Par Hydroelectric Project has been conceived as a run of the river scheme for exploitation of
power potential in a stretch of about 12km on Par river. This project will be supplementing
power generation in the North-Eastern region (structured on geographical congruity) which
comprises the states of Arunachal Pradesh, Assam, Manipur, Nagaland, Meghalaya, Tripura
and Mizoram. Power system in the region is mainly controlled by various central
government/state government utilities.
3.3 Hydro Potential and Its Development
The total installed capacity in the country, as on May 31, 2014, is 248,510 MW of which
hydroelectric schemes contribute 40,661 MW (~16.5%). All India and Region-wise installed
capacity of power utilities are given below in Table 3-1 and Table 3-2.
Table 3-1: Sector-wise Installed Capacity of Power Utilities
(Figures in MW)
Sector Hydro Thermal
Nuclear R.E.S Total Coal Gas Diesel Total
State 27482.00 54428.00 6974.42 602.61 62005.03 0.00 3803.67 93290.70
Private 2694.00 47215.38 8568.00 597.14 56380.52 0.00 27888.47 86962.99
Central 10485.41 45925.01 7065.53 0.00 52990.54 4780.00 0.00 68255.95
Total 40661.41 147568.39 22607.95 1199.75 171376.09 4780.00 31692.14 248509.64
Source: CEA Website
Table 3-2: Region-wise Installed Capacity of Power Utilities
(Figures in MW)
Sector Hydro Thermal
Nuclear R.E.S Total Coal Gas Diesel Total
Northern 16460.76 35883.50 5331.26 12.99 41227.75 1620.00 5935.77 65244.28
Western 7447.50 59114.51 10915.41 17.48 70047.40 1840.00 11271.07 90605.97
Southern 11398.03 26582.50 4962.78 939.32 32484.60 1320.00 13784.67 58987.30
Eastern 4113.12 25927.88 190.00 17.20 26135.08 0.00 432.86 30681.06
N Eastern 1242.00 60.00 1208.50 142.74 1411.24 0.00 256.67 2909.91
Islands 0.00 0.00 0.00 70.02 70.02 0.00 11.10 81.12
All India 40661.41 147568.39 22607.95 1199.75 171376.09 4780.00 31692.14 248509.64
Source: CEA website

Par Hydroelectric Project (52 MW) Detailed Project Report
Volume-I (Part-I)Main Report
161133-40ER-0007-00 3-3
Re-assessment Studies of hydroelectric potential of the country, completed by
Central Electricity Authority in 1987, have assessed the economically exploitable hydro
power potential in terms of installed capacity as 148,701 MW, of which 145,320 MW is from
schemes having capacity above 25 MW. Only about 24.6% of the hydro potential has been
harnessed so far while another 8.97% is under various stages of development.
3.4 Power Demand and Supply Scenario in the Country
The country has been facing growing shortages of power over the past five years. During the
11th Plan (2007 - 2012), the average energy shortage in the country was about
400 Billion kWh (10%).
Details of peak and energy shortages in the country from 7th Plan onwards are given in
Table 3-3 below:
Table 3-3: Actual Power Supply Position of India
Peak Demand
Peak availability
Surplus/Deficit Energy
RequirementEnergy
Availability Surplus/ Deficit
(MW) (MW) (MW) (%) (MU) (MU) (MU) (%)
At the end of 7th Plan (1989-90)
40385 33658 -6727 -16.7 247762 228151 -19611 -7.9
At the end of 8th Plan (1996-97)
63853 52376 -11477 -18.0 413490 365900 -47590 -11.5
At the end of 9th Plan (2001-02)
78441 69189 -9252 -11.8 522537 483350 -39187 -7.5
At the end of 10th Plan (2006-07)
100715 86818 -13897 -13.8 690587 624495 -66092 -9.6
11th Plan
2007-08 108866 90793 -18073 -16.6 705724 628016 -77708 -11.0
2008-09 109809 96685 -13124 -12.0 774324 689021 -85303 -11.0
2009-10 119166 104009 -15157 -13.8 830594 746644 -83950 -10.1
2010-11 122287 110256 -12031 -9.8 861591 788355 -73236 -8.5
2011-12 130006 116191 -13815 -10.6 937199 857886 -79313 -8.5
12th Plan
2012-13 135453 123294 -12159 -9.0 998114 991,209 -89905 -8.7
2013 –14 135918 129815 -6103 -4.5 1002257 959829 -42428 -4.2
Apr 2014 – May 2014
141886 134972 -6914 -4.9 179867 172448 -7419 -4.1
Source: CEA Website
Par Hydroelectric Project (52 MW) Detailed Project Report
Volume-I (Part-I)Main Report
161133-40ER-0007-00 3-4
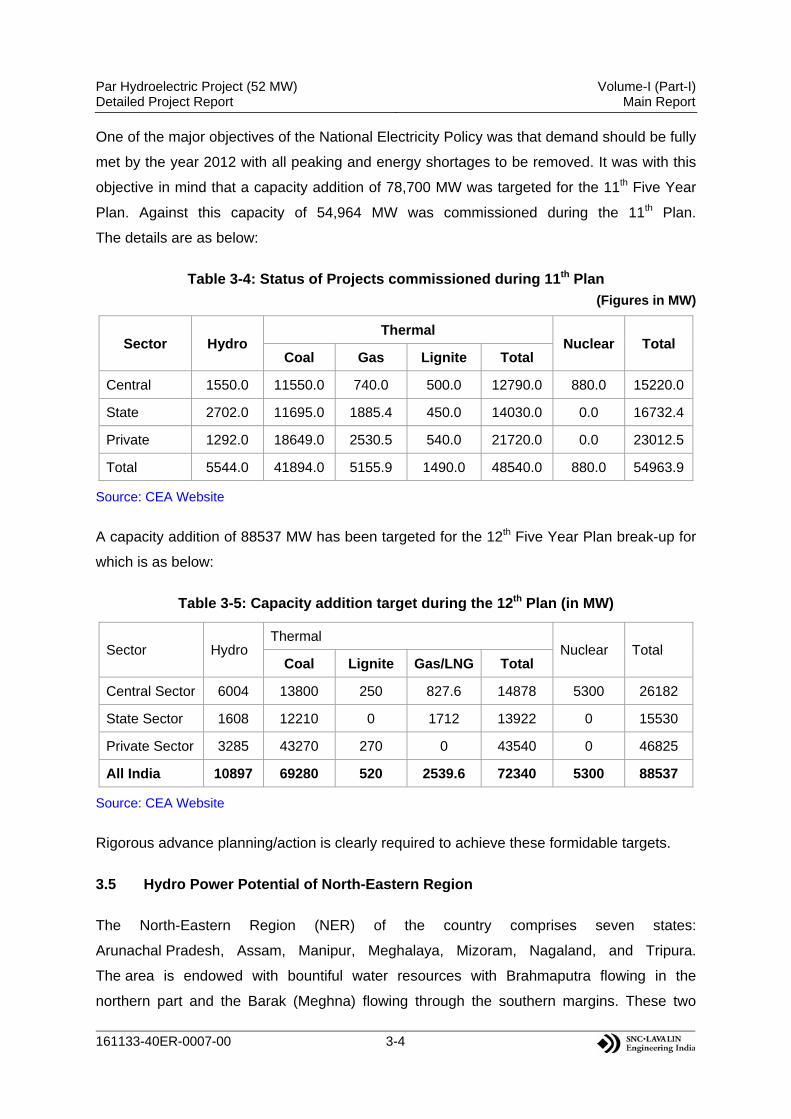
One of the major objectives of the National Electricity Policy was that demand should be fully
met by the year 2012 with all peaking and energy shortages to be removed. It was with this
objective in mind that a capacity addition of 78,700 MW was targeted for the 11th Five Year
Plan. Against this capacity of 54,964 MW was commissioned during the 11th Plan.
The details are as below:
Table 3-4: Status of Projects commissioned during 11th Plan
(Figures in MW)
Sector Hydro Thermal
Nuclear Total Coal Gas Lignite Total
Central 1550.0 11550.0 740.0 500.0 12790.0 880.0 15220.0
State 2702.0 11695.0 1885.4 450.0 14030.0 0.0 16732.4
Private 1292.0 18649.0 2530.5 540.0 21720.0 0.0 23012.5
Total 5544.0 41894.0 5155.9 1490.0 48540.0 880.0 54963.9
Source: CEA Website
A capacity addition of 88537 MW has been targeted for the 12th Five Year Plan break-up for
which is as below:
Table 3-5: Capacity addition target during the 12th Plan (in MW)
Sector Hydro Thermal
Nuclear Total Coal Lignite Gas/LNG Total
Central Sector 6004 13800 250 827.6 14878 5300 26182
State Sector 1608 12210 0 1712 13922 0 15530
Private Sector 3285 43270 270 0 43540 0 46825
All India 10897 69280 520 2539.6 72340 5300 88537
Source: CEA Website
Rigorous advance planning/action is clearly required to achieve these formidable targets.
3.5 Hydro Power Potential of North-Eastern Region
The North-Eastern Region (NER) of the country comprises seven states:
Arunachal Pradesh, Assam, Manipur, Meghalaya, Mizoram, Nagaland, and Tripura.
The area is endowed with bountiful water resources with Brahmaputra flowing in the
northern part and the Barak (Meghna) flowing through the southern margins. These two

Par Hydroelectric Project (52 MW) Detailed Project Report
Volume-I (Part-I)Main Report
161133-40ER-0007-00 3-5
rivers, along with their numerous tributaries, have created a very dynamic and powerful
hydrologic regime in the region.
The Brahmaputra in the northern part and the Barak (Meghna) flowing through the southern
margins along with their numerous tributaries are the two main river systems that have
created a very dynamic and powerful hydrologic regime in the region.
As per Re-assessment Studies carried out by CEA, hydro potential of the north-eastern
region in terms of installed capacity has been estimated as 58,971 MW (58,356 MW of
schemes above 25 MW capacity) i.e. almost 40% of the country's total hydro potential.
Out of the above, 1242 MW (schemes above 25 MW capacity) have been harnessed,
while projects amounting to 2810 MW are under construction, as on May 31, 2014.
The state-wise estimated hydroelectric potential of the north-eastern region and its status of
development, as on May 31, 2014, is given below:
Table 3-6: State-wise estimated hydroelectric potential of North-Eastern Region
State Identified Potential as
per Re-assessment Study (MW)
Capacity Developed (schemes above
25 MW capacity) (MW)
Capacity Under Construction
(schemes above 25 MW capacity) (MW)
Arunachal Pradesh 50328 405 2710
Assam 680 375 0
Manipur 1784 105 0
Meghalaya 2394 282 40
Mizoram 2196 0 60
Nagaland 1574 75 0
Tripura 15 0 0
Total 58971 1242 2810
Source: CEA Website
Additionally, the Region also has abundant resource of coal, oil and gas for thermal power
generation. In spite of such huge potential the region ranks lowest in the country in terms of
per capita energy consumption. This has been mainly due to inhospitable climatic conditions,
remote location and inaccessibility of geographical locations
However with continual improvement of infrastructure and communication facilities, the North
East region stands to become the power house of India by utilizing its surplus power
potential especially in the hydro power sector.

Par Hydroelectric Project (52 MW) Detailed Project Report
Volume-I (Part-I)Main Report
161133-40ER-0007-00 3-6
Thus, generating power from the utilizable water resources of the north-east to augment
development efforts in the country as well as the region is a legitimate pursuit.
3.6 Power Scenario of North-Eastern Region
With respect to the total available power potential of the region, the actual installed capacity
and power supply position, as on May 31, 2014 are given below in Table 3-7 to Table 3-9.
Table 3-7: State-wise Installed Capacity of North-Eastern Region
(Figures in MW)
State Hydro Thermal
Nuclear RES Total Coal Gas Diesel Total
Arunachal Pradesh
97.57 0.00 32.05 15.88 47.93 0.00 103.93 249.43
Assam 429.72 60.00 598.52 20.69 679.21 0.00 34.11 1143.04
Manipur 80.98 0.00 46.96 45.41 92.37 0.00 5.45 178.80
Meghalaya 356.58 0.00 65.61 2.05 67.66 0.00 31.03 455.27
Mizoram 34.31 0.00 27.28 51.86 79.14 0.00 36.47 149.92
Nagaland 53.32 0.00 32.84 2.00 34.84 0.00 29.67 117.83
Tripura 62.37 0.00 349.84 4.85 354.69 0.00 16.01 433.07
Central 127.15 0.00 55.40 0.00 55.40 0.00 0.00 182.55
TOTAL 1242.00 60.00 1208.50 142.74 1411.24 0.00 256.67 2909.91
Source: CEA website
Table 3-8: Sector-wise Installed Capacity of North-Eastern Region
(Figures in MW)
State Hydro Thermal
Nuclear RES Total Coal Gas Diesel Total
State 382.00 60.00 445.70 142.74 648.44 0.00 256.64 1287.08
Private 0.00 0.00 24.50 0.00 24.50 0.00 0.03 24.53
Central 860.00 0.00 738.30 0.00 738.30 0.00 0.00 1598.30
Total 1242.00 60.00 1208.50 142.74 1411.24 0.00 256.67 2909.91
Source: CEA website

Par Hydroelectric Project (52 MW) Detailed Project Report
Volume-I (Part-I)Main Report
161133-40ER-0007-00 3-7
Table 3-9: Actual Power Supply Position in North-Eastern Region
Period
Peak Demand
(MW)
Peak Met
(MW)
Peak Deficit/ Surplus
(MW)
Peak Deficit/ Surplus
(%)
Energy Require-
ment (MU)
Energy Availa- bility (MU)
Energy Deficit/ Surplus
(MU)
Energy Deficit/
Surplus(%)
9th Plan end 1148 1403 -105 -9.1 5935 5855 -80 -1.3
2002-03 1209 1135 -74 -6.1 6350 6195 -155 -2.4
2003-04 1259 1071 -188 -14.9 6640 6288 -352 -5.3
2004-05 1272 1128 -144 -11.3 7119 6674 -445 -6.3
2005-06 1385 1192 -193 -13.9 7534 6888 -646 -8.6
2006-07 1477 1166 -311 -21.1 7782 7012 -770 -9.9
2007-08 1742 1347 -395 -22.7 8799 7713 -1086 -12.3
2008-09 1820 1358 -462 -25.4 9407 8134 -1273 -13.5
2009-10 1760 1445 -315 -17.9 9332 8296 -1036 -11.1
2010-11 1913 1560 -353 -18.5 9861 8992 -869 -8.8
2011-12 1920 1782 -138 -7.2 11011 9964 -1047 -9.5
2012-13 1998 1864 -134 -6.7 11566 10718 -848 -7.3
2013-14 2164 2048 -116 -5.4 12687 11866 -821 -6.5
April 2014 – May 2014
2197 2045 -152 -6.9 11660 10914 -746 -6.4
Source: CEA Website
Likely addition of power from different resources in the region is as follows:
Table 3-10: Likely capacity addition during 12th Plan (2012-17) in North-Eastern Region
(Figures in MW)
State Hydro (MW) Thermal (MW) Total
(MW) Coal Gas Total Nuclear
Ar. Pradesh 2710 0 0 0 0 2710
Assam 0 250 100 350 0 350
Manipur 0 0 0 0 0 0
Meghalaya 40 0 0 0 0 40
Mizoram 60 0 0 0 0 60
Tripura 0 0 826 826 0 826
Sikkim 1367 0 0 0 0 1367
Total (NER) 2810 250 926 1176 0 3986
Source: Report of “The Working Group on Power for Twelfth Plan (2012-17)”, Ministry of Power, GoI
Par Hydroelectric Project (52 MW) Detailed Project Report
Volume-I (Part-I)Main Report
161133-40ER-0007-00 3-8
3.7 Hydropower Potential of Arunachal Pradesh
The topography of the state provides very ideal conditions for developing hydroelectric
projects. There are five major river basins in the state, namely Kameng, Subansiri, Siang,
Dibang and Lohit. There are also many smaller river systems in the state which offer very
attractive sites for hydroelectric projects. Almost all the major river systems flow in the
north-south direction and ultimately drain into the Brahmaputra. Apart from the major rivers,
the state has many small perennial rivulets providing ideal conditions for developing
micro/mini and small hydroelectric projects.
As per the preliminary ranking study done by the Central Electricity Authority (CEA), the total
power potential from hydro projects in the north-eastern region is estimated to be about
58,971 MW, of which 50328 MW is in Arunachal Pradesh
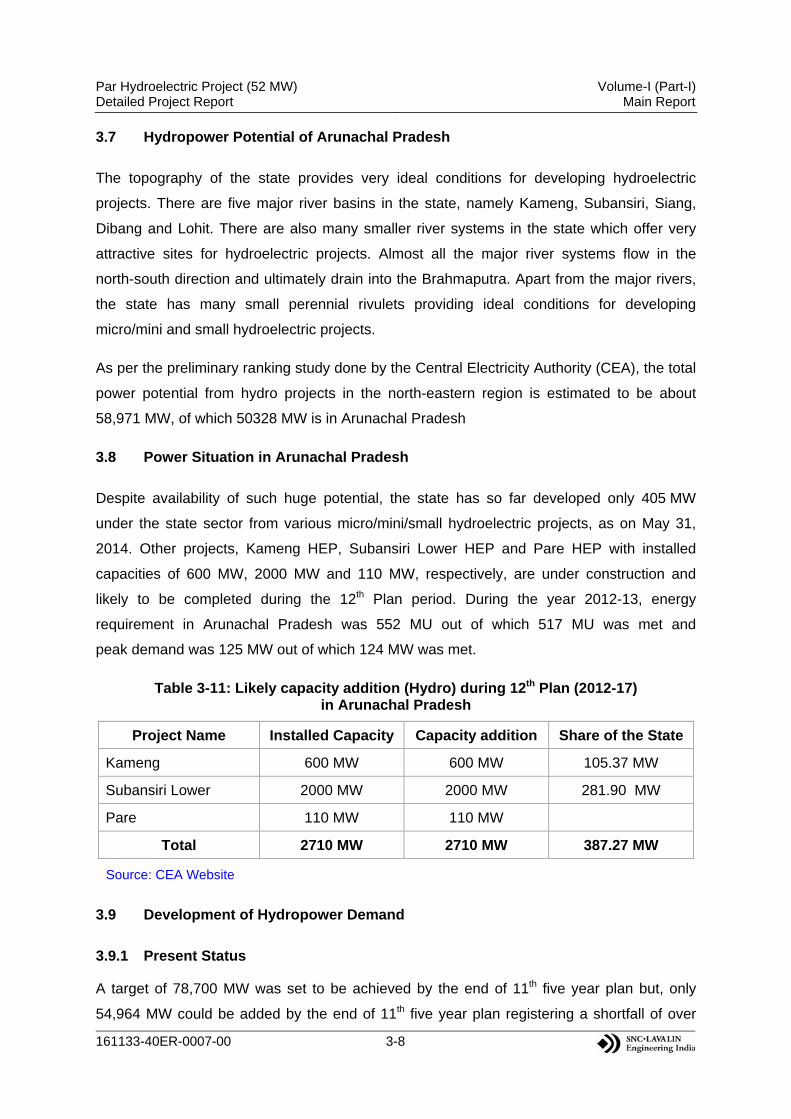
3.8 Power Situation in Arunachal Pradesh
Despite availability of such huge potential, the state has so far developed only 405 MW
under the state sector from various micro/mini/small hydroelectric projects, as on May 31,
2014. Other projects, Kameng HEP, Subansiri Lower HEP and Pare HEP with installed
capacities of 600 MW, 2000 MW and 110 MW, respectively, are under construction and
likely to be completed during the 12th Plan period. During the year 2012-13, energy
requirement in Arunachal Pradesh was 552 MU out of which 517 MU was met and
peak demand was 125 MW out of which 124 MW was met.
Table 3-11: Likely capacity addition (Hydro) during 12th Plan (2012-17) in Arunachal Pradesh
Project Name Installed Capacity Capacity addition Share of the State
Kameng 600 MW 600 MW 105.37 MW
Subansiri Lower 2000 MW 2000 MW 281.90 MW
Pare 110 MW 110 MW
Total 2710 MW 2710 MW 387.27 MW
Source: CEA Website
3.9 Development of Hydropower Demand
3.9.1 Present Status
A target of 78,700 MW was set to be achieved by the end of 11th five year plan but, only
54,964 MW could be added by the end of 11th five year plan registering a shortfall of over

Par Hydroelectric Project (52 MW) Detailed Project Report
Volume-I (Part-I)Main Report
161133-40ER-0007-00 3-9
30%. In hydro segment, only 67% of the target could be achieved but, that is predominantly
on account of clearing the backlog arising due to projects slipping from 10th five year plan or
even before. The present hydropower installed capacity as on May 31, 2014 is
approximately 40,661.41 MW which is about 16.5% of total electricity generation in India.
The plan-wise growth of hydropower in India is given below in Table 3-12.
Table 3-12: Plan-wise Growth of Hydropower
Plan Period Hydro Capacity Addition during the Plan (MW)
Installed Capacity* at the end of Plan (MW)
Hydropower share as % of Total Installed
Capacity Hydro Total including
other R.E.S.
1st Plan (1951-56) 380.19 1061.44 2886.14 36.78
2nd Plan (1956-61) 977.18 1916.66 4653.05 41.19
3rd Plan (1961-66) 2207.08 4123.74 9027.02 45.68
3 Annual Plan (1966-69) 1783.17 5906.91 12957.27 45.58
4th Plan (1969-74) 1058.39 6965.30 16663.56 41.80
5th Plan (1974-79) 3867.77 10833.07 26680.06 40.60
Annual Plan (1979-80) 550.90 11383.97 28447.83 40.01
6th Plan (1980-85) 3076.05 14460.02 42584.72 33.93
7th Plan (1985-90) 3828.41 18307.63 63636.34 28.77
2 Annual Plans (1991-92) 881.50 19194.62 69065.39 27.79
8th Plan (1992-97) 2427.65 21644.80 85019.31 25.46
9th Plan (1997-02) 4538.25 26261.23 103410.04 24.40
10th Plan (2002-07) 7886.00 34653.77 132329.21 26.19
11th Plan (2007-12) 5544.00 38990.40 199877.03 19.51
12th Plan (2012-17) (as on May 31, 2014)
1671.01 40661.41 248509.63 16.36
* Does not include hydro projects having capacity upto 25MW
Source: CEA Website
3.9.2 Forecast
The 18th Electric Power Survey (EPS) of India undertaken by Central Electricity Authority has
assessed the demand of power by the end of 12th Five Year Plan, that is, 2016-17 as
1354.8 Billion Units (BU) of electric energy and Annual Peak Electric Load of 199,540 MW.
To meet this demand, a total capacity addition target of 88,537 MW has been fixed

Par Hydroelectric Project (52 MW) Detailed Project Report
Volume-I (Part-I)Main Report
161133-40ER-0007-00 3-10
from conventional sources for the 12th Plan comprising of Hydro - 10,897 MW,
Thermal - 72,340 MW and Nuclear - 5,300 MW. In addition, the capacity addition target from
Renewable Energy Sources (RES) is 30,000 MW.
Considering the fact that the Compounded Annual Growth Rate (CAGR) of generation
during the 11th Plan period was around 8.5%, the power sector has to gear up for long term
capacity addition and steps need to be taken to exploit the identified potential at an
accelerated pace commensurate with the growing demand.
3.9.3 Long Term Plan
As per the re-assessment of the hydro electric potential carried out by CEA, the hydro
potential of the country has been estimated about 150,000 MW. The hydro installed capacity
at the end of 11th plan (2007-12) was 38990.40 MW. Anticipated hydro capacity addition
during 12th plan and 13th plan is projected below:
12th plan (2012-17) 10,897 MW
13th plan (2017-22) 12,000 MW
3.10 Necessity and Justification for Implementing the Project
The state plans to harness its enormous natural resource of hydro power and exploit its
mineral wealth to usher in an era of economic development and raise the per capita
electricity consumption.
Comparing the projected growth of peak power demand, energy requirement anticipated and
increase in the generating capacity on the basis of new projects proposed and/or under
construction/consideration during 12th Five Year Plan, it is evident that there is a dire need to
provide additional power to the National Grid. New schemes have to be taken up
immediately and implemented to derive timely benefits. The most important source of power
development in the north-eastern region is Arunachal Pradesh and other sister states.
The power from hydro projects in the north-eastern region would be in excess of the demand
in the region and would have to be exported for utilization in other regions of the country.
Presently there is no problem in the availability of transmission systems beyond the
north-eastern power region for distribution of power as the five power regions of the country
are in the process of greater integration within a national grid.

Par Hydroelectric Project (52 MW) Detailed Project Report
Volume-I (Part-I)Main Report
161133-40ER-0007-00 3-11
Considering the growth of peak demand and anticipated addition of generating capacity in
the state, the region and the country, and also from the current status of development of
hydro power potential of Arunachal Pradesh, it is pragmatic that earnest efforts are made for
developing the hydro power sector of the state. Thus implementing Par Hydroelectric Project
of 52 MW capacity will not only support the Power requirement of Northeast but also can
export excess power to other states and earn additional revenue for the state.

Par Hydroelectric Project (52 MW) Detailed Project Report
Volume-I (Part-I)Main Report
161133-40ER-0007-00
CHAPTER - 4 Data Collection and Field Investigation
Par Hydroelectric Project (52 MW) Detailed Project Report
Volume-I (Part-I)Main Report
161133-40ER-0007-00 i
TABLE OF CONTENTS
PAGE NO.
4 DATA COLLECTION AND FIELD INVESTIGATION .............................................. 4-1
4.1 General ......................................................................................................... 4-1
4.2 Data Collection ............................................................................................. 4-1
4.3 Field Investigations ....................................................................................... 4-2
4.4 Topographic Surveys ................................................................................... 4-2
4.4.1 Available Data ................................................................................... 4-2
4.5 Reconnaissance and Alternative Studies ..................................................... 4-3
4.6 Equipments Used ......................................................................................... 4-3
4.7 Detailed Survey and Methodology ............................................................... 4-3
4.8 General Layout Survey ................................................................................. 4-3
4.8.1 Headworks Area ............................................................................... 4-3
4.8.2 Water Conductor System .................................................................. 4-4
4.8.3 Powerhouse Site ............................................................................... 4-4
4.9 Geological and Geotechnical Investigations................................................. 4-5
4.9.1 Surface Geological Mapping ............................................................. 4-5
4.9.2 Sub-Surface Geological Explorations ............................................... 4-6
4.10 Laboratory Test of Rock Core Samples ....................................................... 4-8
4.11 Construction Material Survey ..................................................................... 4-12
4.12 Archaeological, Historical and Cultural Sites .............................................. 4-13
4.13 Presence of Economic Minerals ................................................................. 4-13

Par Hydroelectric Project (52 MW) Detailed Project Report
Volume-I (Part-I)Main Report
161133-40ER-0007-00 ii
LIST OF TABLES
PAGE NO.
Table 4-1: Survey Details ..................................................................................................... 4-4
Table 4-2: Details of Geological Mapping ............................................................................ 4-6
Table 4-3: List of Exploratory Drill holes .............................................................................. 4-6
Table 4-4: Laboratory Test Results of Core Samples .......................................................... 4-9

Par Hydroelectric Project (52 MW) Detailed Project Report
Volume-I (Part-I)Main Report
161133-40ER-0007-00 4-1
4 DATA COLLECTION AND FIELD INVESTIGATION
4.1 General
Data collection and field investigations constitute an important activity in the planning and
design of a hydropower project. It starts from the initial conception stage of the project and
continues during the project implementation.
Data collection usually comprises collection and compilation of:
Historical data pertaining to river discharge, rainfall, temperature, sediment content in
the river flow.
Historical data of past earthquakes in the region
Large scale topographical maps (usually from government agencies)
Satellite imagery of the project area, etc.
Field investigations normally comprise of:
Topographical surveys connected to GTS benchmark
Surface geological mapping
Sub-surface geological and geotechnical investigations through exploratory drilling
and drifting
Hydro-meteorological observations – measurement of rainfall, river discharge, etc.
Construction material survey, etc.
In addition, laboratory testing of materials also forms an important part of investigation work
related to planning of a project.
Status of the above activities at Pare project is discussed in the following sections.
4.2 Data Collection
As mentioned above, data collection is a continuous activity and starts with the initial
conception stage of the project.

Par Hydroelectric Project (52 MW) Detailed Project Report
Volume-I (Part-I)Main Report
161133-40ER-0007-00 4-2
At Par project, the historical data pertaining to river discharges and rainfall in the project
catchment and surrounding areas has been collected and compiled. Additional data
pertaining to hydrology are being collected and used in the assessment of hydrology of the
project.
A summary of collected data is presented in the chapter on hydrological assessment.
The data has been used to assess the water availability for power generation as well as to
obtain the magnitude of project’s design flood.
4.3 Field Investigations
Field survey and investigations were carried out with the objective of preparing grid maps,
establishing ground control points, fixing alignments and obtaining the river’s L-section,
cross sections etc.
Detailed topographical survey covering the head works area and the powerhouse complex
area was carried out for designing the project components. The river profile was mapped at
key points for assessing the power potential of the river.
Geological investigations comprising subsurface investigations, surface geological mapping
and traverse along HRT alignment were carried out after preliminary surveys. Subsurface
investigations included study of rock properties using exploratory drill holes.
All topographic survey and field investigation works have been carried out under the scope
of work of Preparation Phase of the project by SLEI.
4.4 Topographic Surveys
4.4.1 Available Data
The following topographical maps of Survey of India covering the entire project area are
available:
83 E 7 to12, Scale 1:50 000
On the basis of topographical maps, reconnaissance of the project area was done and
requirement of large scale mappings was worked out.
Par Hydroelectric Project (52 MW) Detailed Project Report
Volume-I (Part-I)Main Report
161133-40ER-0007-00 4-3
4.5 Reconnaissance and Alternative Studies
Before conducting survey for the project, a detailed reconnaissance of the area was carried
out, which was also utilized for search of known control stations viz. BMs and logistic
approach, if any. Reconnaissance was also carried out for the selection of diversion site,
intake, Desilting Basin, HRT, Surge Shaft, Pressure Shaft and Powerhouse on Left side of
river.
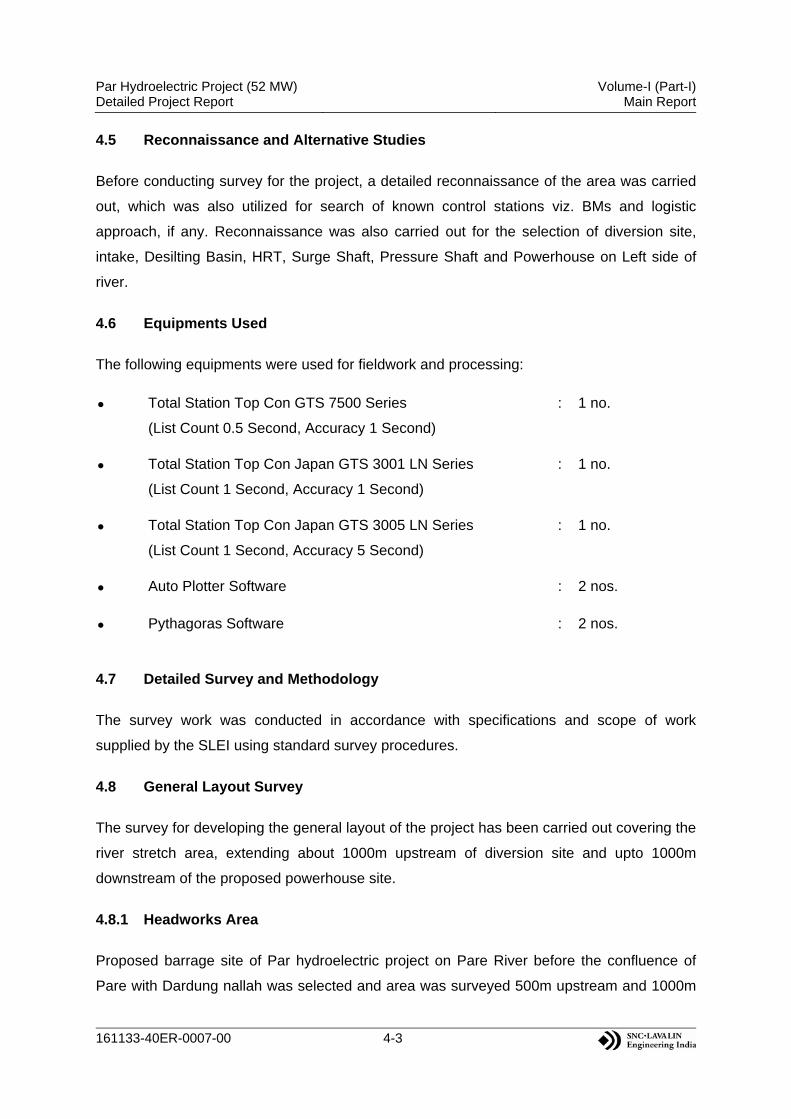
4.6 Equipments Used
The following equipments were used for fieldwork and processing:
Total Station Top Con GTS 7500 Series
(List Count 0.5 Second, Accuracy 1 Second)
: 1 no.
Total Station Top Con Japan GTS 3001 LN Series
(List Count 1 Second, Accuracy 1 Second)
: 1 no.
Total Station Top Con Japan GTS 3005 LN Series
(List Count 1 Second, Accuracy 5 Second)
: 1 no.
Auto Plotter Software : 2 nos.
Pythagoras Software : 2 nos.
4.7 Detailed Survey and Methodology
The survey work was conducted in accordance with specifications and scope of work
supplied by the SLEI using standard survey procedures.
4.8 General Layout Survey
The survey for developing the general layout of the project has been carried out covering the
river stretch area, extending about 1000m upstream of diversion site and upto 1000m
downstream of the proposed powerhouse site.
4.8.1 Headworks Area
Proposed barrage site of Par hydroelectric project on Pare River before the confluence of
Pare with Dardung nallah was selected and area was surveyed 500m upstream and 1000m

Par Hydroelectric Project (52 MW) Detailed Project Report
Volume-I (Part-I)Main Report
161133-40ER-0007-00 4-4
downstream of barrage axis on scale 1:1000 with contour interval of 2m on the basis of
established traverse stations BM by using total station.
4.8.2 Water Conductor System
Water conductor system includes a headrace tunnel of about 8.636km length proposed on
left bank of river, Desilting Basin, surge shaft and pressure shafts, which finally terminates to
Powerhouse. Survey for these was carried out based on known stations on scale as given in
Table 4-1.
4.8.3 Powerhouse Site
The proposed surface powerhouse has been planned on the left bank of the Pare river
terrace deposit around El 635m to 645m. Survey has done up to 200m upstream & 500m
downstream of proposed powerhouse site. The topographical maps of these areas will be
prepared to a scale of 1:1000 with a contour interval of 2m.
Table 4-1: Survey Details
Description Scale Contour interval
Detailed topographical survey of the project area (Barrage and Powerhouse area)
1:1000 2m
Detailed topographical survey of the reservoir area 1: 2000 2m
River cross sections @50m c/c from 1km upstream to 1km downstream of barrage axis
1:2000 H 1:100 V
River cross sections @50m c/c from 500m upstream and 200m downstream of tailrace outfall axis
1:2000 H 1:100 V
Longitudinal section of the river 1km upstream of barrage axis to 1km downstream of barrage axis
1:10000 H 1:100 V
Quarry / borrow areas, project roads and muck disposal area (Provisional)
1:1000 2m
Construction plant areas, labour colony 1:2000 2m
The reduced levels and co-ordinates will be transferred from the permanent trigonometric
points which are established by the Survey Department of India. All the permanent control
points will be established by either constructing concrete pillars or marking the information
on the stable boulders. Sufficient numbers of permanent survey stations will be established
near the main components of the project such as the head works, the adit portals, the surge
shaft, and the tailrace outfall.

Par Hydroelectric Project (52 MW) Detailed Project Report
Volume-I (Part-I)Main Report
161133-40ER-0007-00 4-5
Detailed topographic survey maps are being prepared and will include details pertaining to
physical and manmade features e.g. roads, footpaths, houses, large boulders, river/streams
etc. Some special landslide signs such as cracks; scarp areas etc. will also be surveyed.
In general, the details, which are being picked up from the field are grouped as follows:
Land topography such as peaks, depressions, saddles, spurs, big boulders etc.
Hydrographic features such as: rivers, streams, drainage patterns, ponds,
waterfalls etc.
Man-made features like houses, temples, roads, footpaths, bridges, culverts,
causeways etc.
Prominent public places
Land use patterns, such as cultivated land, forest land, open space etc.
4.9 Geological and Geotechnical Investigations
Adequate geological and geotechnical investigations have been carried out to ensure that
the project components are properly located and oriented. In addition, several tests have
been planned to carry out to obtain parameters for use in design.
4.9.1 Surface Geological Mapping
The surface geological mapping undertaken on the project site consisted of identification and
description of outcrops encountered in the project area and collection of all relevant
geological data. As far as possible all lithological contacts, geological features such as faults,
folds, shear zones etc. were noted. The surface geological mapping has been carried out in
the sites of different project appurtenants like headwork’s and powerhouse areas on
1:1000 scale. Reservoir area and HRT alignment were mapped on 1:4000 and
1:10000 scales respectively.
The project area has been located between villages Sagalee and village Ballapu. In general,
the topography around the project area is rugged and most of the area is vegetated. Project
has been conceptualized on the main river Pare, which flows from west-east direction
through a V-shaped valley in the area. Bedrock exposures are seen along the edges of river
and nallah courses at headworks area and most of the slope area is covered by slope wash
deposits that support moderate to thick vegetation. Due to rugged topography, geological
mapping along HRT route was taken up by taking traverses along the existing road and
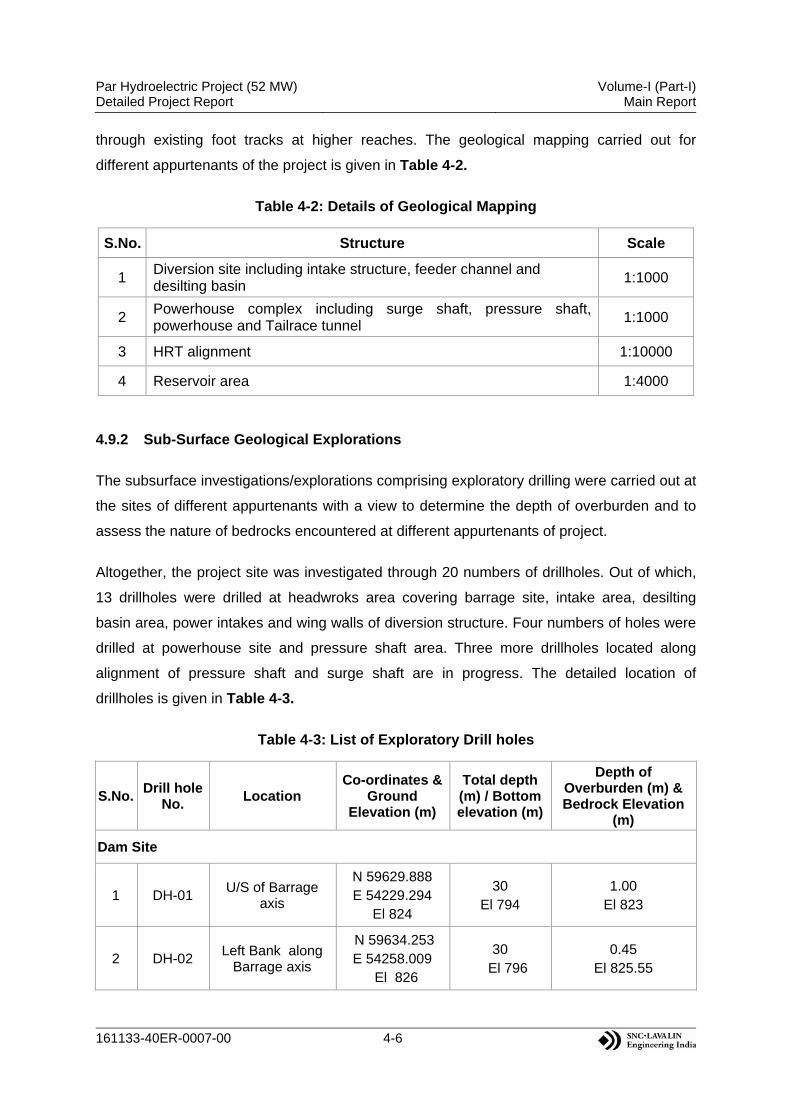
Par Hydroelectric Project (52 MW) Detailed Project Report
Volume-I (Part-I)Main Report
161133-40ER-0007-00 4-6
through existing foot tracks at higher reaches. The geological mapping carried out for
different appurtenants of the project is given in Table 4-2.
Table 4-2: Details of Geological Mapping
S.No. Structure Scale
1 Diversion site including intake structure, feeder channel and desilting basin
1:1000
2 Powerhouse complex including surge shaft, pressure shaft, powerhouse and Tailrace tunnel
1:1000
3 HRT alignment 1:10000
4 Reservoir area 1:4000
4.9.2 Sub-Surface Geological Explorations
The subsurface investigations/explorations comprising exploratory drilling were carried out at
the sites of different appurtenants with a view to determine the depth of overburden and to
assess the nature of bedrocks encountered at different appurtenants of project.
Altogether, the project site was investigated through 20 numbers of drillholes. Out of which,
13 drillholes were drilled at headwroks area covering barrage site, intake area, desilting
basin area, power intakes and wing walls of diversion structure. Four numbers of holes were
drilled at powerhouse site and pressure shaft area. Three more drillholes located along
alignment of pressure shaft and surge shaft are in progress. The detailed location of
drillholes is given in Table 4-3.
Table 4-3: List of Exploratory Drill holes
S.No. Drill hole
No. Location
Co-ordinates & Ground
Elevation (m)
Total depth (m) / Bottom elevation (m)
Depth of Overburden (m) & Bedrock Elevation
(m)
Dam Site
1 DH-01 U/S of Barrage
axis
N 59629.888 E 54229.294
El 824
30 El 794
1.00 El 823
2 DH-02 Left Bank along
Barrage axis
N 59634.253 E 54258.009
El 826
30 El 796
0.45 El 825.55

Par Hydroelectric Project (52 MW) Detailed Project Report
Volume-I (Part-I)Main Report
161133-40ER-0007-00 4-7
S.No. Drill hole
No. Location
Co-ordinates & Ground
Elevation (m)
Total depth (m) / Bottom elevation (m)
Depth of Overburden (m) & Bedrock Elevation
(m)
3 DH-03 Riverbed, along
Barrage axis
N 59616.598 E 54249.262
El 823.8
20 El 803.8
3.00 El 820.8
4 DH-04 Right bank, along
Barrage axis
N 59591.204 E 54235.282
El 825
25 El 800
1.50 El 823.5
5 DH-05 D/s of Barrage axisN 59576.932 E 54302.201
El 822
30 El 792
0.00 El 822
6 DH-06 Intake N 59641.856 E 54242.325
El 826.5
30 El 806.5
3.50 El 823
7 DH-07 Desilting Basin N 59661.670 E 54321.632
El 838
30.5 El 807.5
15.00 El 823
8 DH-08 Desilting Basin N 59637.865 E 54411.638
El 841
35.5 El 805.5
15.00 El 826
9 DH-09 HRT N 59622.100 E 54455.289
El 849.6
31 El 818.6
12.00 El 837.6
10 DH-10 Desilting Basin N 59633.234 E 54281.744
El 829
30 El 799
8.00 El 821
11 DH-11 Desilting Basin N 59632.402 E 54380.715
El 835
35 El 800
12.50 El 822.5
12 DH-13 Right Bank (Wing
Wall)
N 59590.682 E 54168.615
El 838
20 El 818
8.00 El 830
13 DH-14 Left Bank (Wing
Wall)
N 59675.727 E 54216.791
El 836
30 El 806
4.00 El 832
Powerhouse Site
1 PDH-01 Surge Shaft N 57264.236 E 61158.986 El 879.389
89 El 790.389
23.50 El 855.889
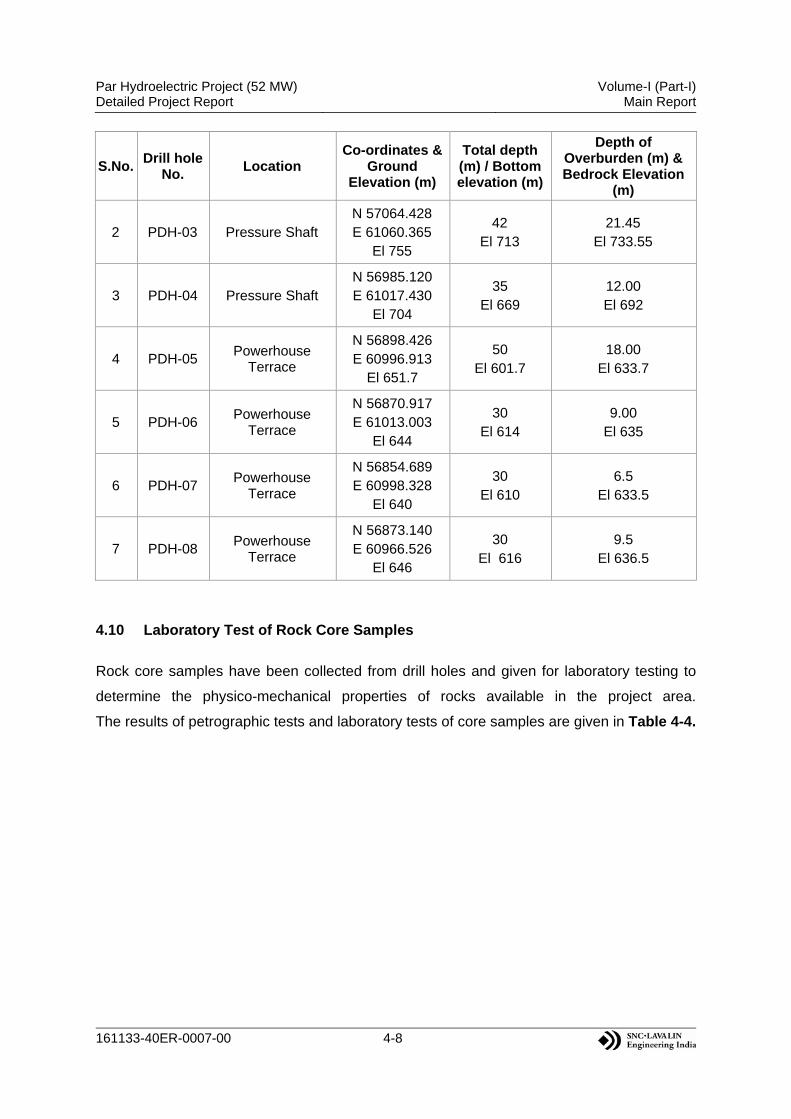
Par Hydroelectric Project (52 MW) Detailed Project Report
Volume-I (Part-I)Main Report
161133-40ER-0007-00 4-8
S.No. Drill hole
No. Location
Co-ordinates & Ground
Elevation (m)
Total depth (m) / Bottom elevation (m)
Depth of Overburden (m) & Bedrock Elevation
(m)
2 PDH-03 Pressure Shaft N 57064.428 E 61060.365
El 755
42 El 713
21.45 El 733.55
3 PDH-04 Pressure Shaft N 56985.120 E 61017.430
El 704
35 El 669
12.00 El 692
4 PDH-05 Powerhouse
Terrace
N 56898.426 E 60996.913
El 651.7
50 El 601.7
18.00 El 633.7
5 PDH-06 Powerhouse
Terrace
N 56870.917 E 61013.003
El 644
30 El 614
9.00 El 635
6 PDH-07 Powerhouse
Terrace
N 56854.689 E 60998.328
El 640
30 El 610
6.5 El 633.5
7 PDH-08 Powerhouse
Terrace
N 56873.140 E 60966.526
El 646
30 El 616
9.5 El 636.5
4.10 Laboratory Test of Rock Core Samples
Rock core samples have been collected from drill holes and given for laboratory testing to
determine the physico-mechanical properties of rocks available in the project area.
The results of petrographic tests and laboratory tests of core samples are given in Table 4-4.

Par Hydroelectric Project (52 MW) Detailed Project Report
Volume-I (Part-I)Main Report
161133-40ER-0007-00 4-9
Table 4-4: Laboratory Test Results of Core Samples
Drill Hole No.
Location Depth of sampling
Rock Type UCS (Mpa) Modulus of
Elasticity (Dry) (Gpa)
Poisson's Ratio (Dry)
Porosity (%)
Water Absorption
(%)
Dry Density
(gm/cm3)
Specific Gravity Dry Saturated
DH -01 Barrage
1.0 – 2.5 Granitic Gneiss 48.783 40.77 0.24 1.31 0.51 2.739 2.62
1.5 -3.5 Granitic Gneiss 64.063 1.32 0.51 2.713 2.64
6.5- 8.0 Granitic Gneiss 103.058 0.74 0.28 2.719 2.63
8.0-9.5 Granitic Gneiss 53.602 45.81 0.23 1 0.38 2.695 2.68
11.0 – 12.5 Granitic Gneiss 42.681 1 0.38 2.541 2.64
18.5 – 20.0 Granitic Gneiss 101.783 0.91 0.34 2.659 2.68
DH -03 Barrage 9.0 – 10.5 Granitic Gneiss 38.559 36.02 0.24 1.52 0.6 2.625 2.56
18.0 – 19.5 Granitic Gneiss 64.952 55.71 0.22 1.3 0.5 2.765 2.64
DH - 04 Barrage 2.0 – 3.5 Granitic Gneiss 65.929 54.36 0.22 0.66 0.25 2.615 2.63
9.5 – 11.0 Granitic Gneiss 46.492 44.17 0.23 1.68 0.67 2.768 2.56
DH - 05 Barrage
12.5 -14.0 Granitic Gneiss 30.906 1.29 0.5 2.572 2.63
15.5 – 17.0 Granitic Gneiss 17.34 1.87 0.71 2.61 2.68
24.5 – 26.0 Granitic Gneiss 94.93 1.41 0.54 2.616 2.66
29.0 – 30.0 Granitic Gneiss 41.602 1.32 0.5 2.646 2.67
DH - 06 Barrage
9.5 – 11.0 Granitic Gneiss 48.905 1.04 0.4 2.575 2.63
14.0 – 15.5 Granitic Gneiss 64.587 0.66 0.25 2.608 2.62
14.0 - 15.5 Granitic Gneiss 76.183 1.11 0.43 2.594 2.6
17.0 – 18.5 Granitic Gneiss 114.959 1.02 0.39 2.621 2.65
18.5 – 20.0 Granitic Gneiss 79.061 1.27 0.49 2.601 2.62
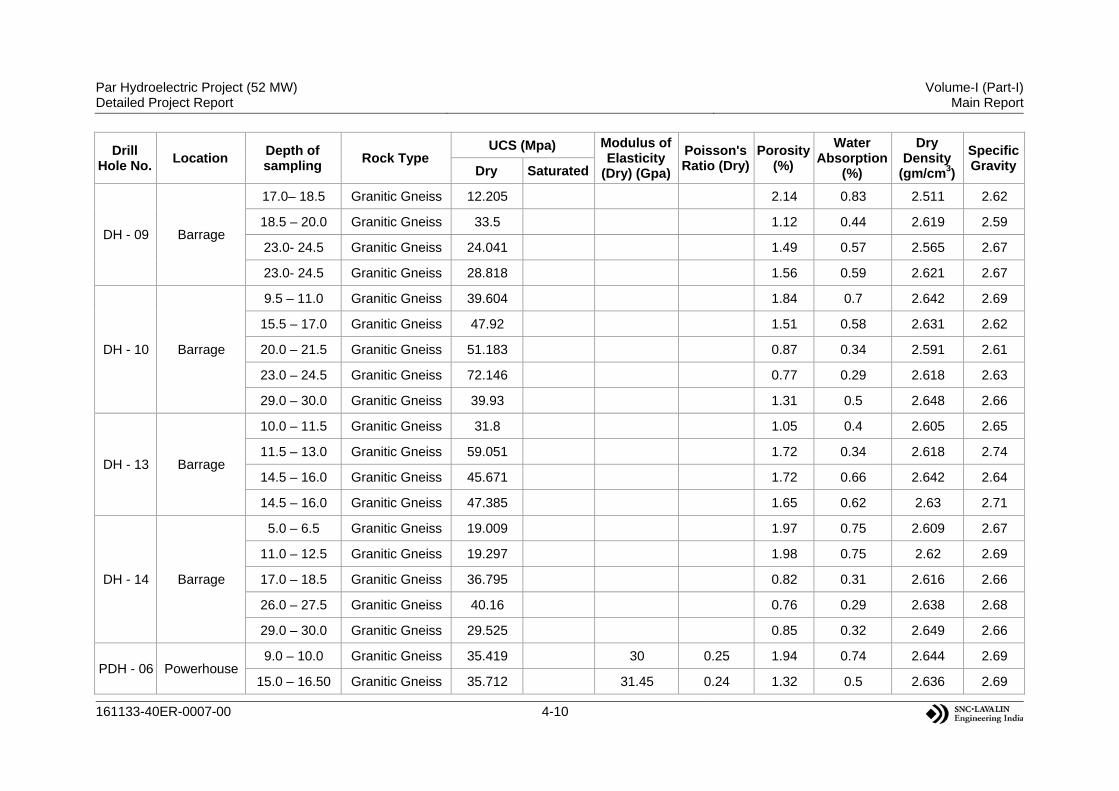
Par Hydroelectric Project (52 MW) Detailed Project Report
Volume-I (Part-I)Main Report
161133-40ER-0007-00 4-10
Drill Hole No.
Location Depth of sampling
Rock Type UCS (Mpa) Modulus of
Elasticity (Dry) (Gpa)
Poisson's Ratio (Dry)
Porosity (%)
Water Absorption
(%)
Dry Density
(gm/cm3)
Specific Gravity Dry Saturated
DH - 09 Barrage
17.0– 18.5 Granitic Gneiss 12.205 2.14 0.83 2.511 2.62
18.5 – 20.0 Granitic Gneiss 33.5 1.12 0.44 2.619 2.59
23.0- 24.5 Granitic Gneiss 24.041 1.49 0.57 2.565 2.67
23.0- 24.5 Granitic Gneiss 28.818 1.56 0.59 2.621 2.67
DH - 10 Barrage
9.5 – 11.0 Granitic Gneiss 39.604 1.84 0.7 2.642 2.69
15.5 – 17.0 Granitic Gneiss 47.92 1.51 0.58 2.631 2.62
20.0 – 21.5 Granitic Gneiss 51.183 0.87 0.34 2.591 2.61
23.0 – 24.5 Granitic Gneiss 72.146 0.77 0.29 2.618 2.63
29.0 – 30.0 Granitic Gneiss 39.93 1.31 0.5 2.648 2.66
DH - 13 Barrage
10.0 – 11.5 Granitic Gneiss 31.8 1.05 0.4 2.605 2.65
11.5 – 13.0 Granitic Gneiss 59.051 1.72 0.34 2.618 2.74
14.5 – 16.0 Granitic Gneiss 45.671 1.72 0.66 2.642 2.64
14.5 – 16.0 Granitic Gneiss 47.385 1.65 0.62 2.63 2.71
DH - 14 Barrage
5.0 – 6.5 Granitic Gneiss 19.009 1.97 0.75 2.609 2.67
11.0 – 12.5 Granitic Gneiss 19.297 1.98 0.75 2.62 2.69
17.0 – 18.5 Granitic Gneiss 36.795 0.82 0.31 2.616 2.66
26.0 – 27.5 Granitic Gneiss 40.16 0.76 0.29 2.638 2.68
29.0 – 30.0 Granitic Gneiss 29.525 0.85 0.32 2.649 2.66
PDH - 06 Powerhouse 9.0 – 10.0 Granitic Gneiss 35.419 30 0.25 1.94 0.74 2.644 2.69
15.0 – 16.50 Granitic Gneiss 35.712 31.45 0.24 1.32 0.5 2.636 2.69

Par Hydroelectric Project (52 MW) Detailed Project Report
Volume-I (Part-I)Main Report
161133-40ER-0007-00 4-11
Drill Hole No.
Location Depth of sampling
Rock Type UCS (Mpa) Modulus of
Elasticity (Dry) (Gpa)
Poisson's Ratio (Dry)
Porosity (%)
Water Absorption
(%)
Dry Density
(gm/cm3)
Specific Gravity Dry Saturated
PDH - 07 Powerhouse
9.5 – 11.0 Granitic Gneiss 18.453 1.35 0.5 2.619 2.72
12.5 – 14.0 Granitic Gneiss 31.9 0.62 0.24 2.638 2.65
15.5 – 17.0 Granitic Gneiss 40.511 1.17 0.45 2.636 2.66
18.5 – 20.0 Granitic Gneiss 43.353 0.89 0.34 2.659 2.65
21.5 – 23.0 Granitic Gneiss 49.249 1.05 0.4 2.64 2.65
Par Hydroelectric Project (52 MW) Detailed Project Report
Volume-I (Part-I)Main Report
161133-40ER-0007-00 4-12
4.11 Construction Material Survey
Large quantities of material would be required for the construction of the project while most
of the material such as cement, steel, and explosives will be procured from the open market.
Coarse and fine aggregates required for making concrete will have to be sourced from the
project area preferably from sites close to the work areas. The excavated materials from
proposed project components such as diversion structures, tunnel and powerhouse area can
be used. To this end, a detailed field survey has been carried out.
Different alternative sites identified on both the banks of Pare River as well as some RBM
sites located within riverbed are described below:
Site 1: A wide Shoal deposit located around diversion site has been selected for
coarse aggregate. This quarry site is about 350m extended along the river on both
upstream and downstream of proposed diversion axis. From diversion axis upstream,
the site is extended upto about 150m and towards downstream it is extended about
200m. The average width of the shoal varies between 30 and 35m. RBM here
consists of quartzite gneiss, granite gneiss and quartzite. The size of boulders varies
between 0.25m3 to 2.5m3 but mostly <1m3.
Site 2: It is a Rock Quarry located on left bank of Pare river near diversion area.
The steep cliff of rock along river edge exists from 86m upstream of proposed
diversion axis up to Rach nallah confluence. The exposed rockmass is observed
between El 820m and El ± 840m.
Site 3: it is identified on the left bank of Pare river just at the confluence of Dardung
nallah. The extent of this rock quarry is about 110m with quartzitic gneiss rocks along
left bank of Dardung nallah. In this reach, Rock exposed from El 820m to El 840m
along the river and along the nallah from El 230m to El 240m.
Site 4: This is a Rock Quarry located on Right bank just opposite to Site 3. In this
reach, rock exposed all along the river between El 820m and El 840m.
Site 5: This is a RBM quarry located in Pare riverbed near proposed powerhouse.
This RBM deposits form an isolated hump within river, which is 157m long with
average width of 25m.

Par Hydroelectric Project (52 MW) Detailed Project Report
Volume-I (Part-I)Main Report
161133-40ER-0007-00 4-13
Site 6: This is a Rock Quarry located on Left bank of Pare river about 660m
upstream of powerhouse complex site. Rockmass is exposed at steep slope from El
645m to El 670m.
Site 7: This Rock Quarry is located on right bank along river Pare just opposite to
proposed powerhouse location. The exposed rock mass between El 630m and El
660m comprises quartzitic gneiss.
The total potential of these sites are more than the required quantity.
However, among these potential sites, representative samples from each site was collected
and tested in laboratory to determine its suitability as coarse and fine aggregate for
construction. The detail report of test results is appended in Appendix-B. Maps shown of
quarry area are given in Plate 13-1 to Plate 13-5 of Chapter-13 in Volume-I (Part-II)
of the DPR.
4.12 Archaeological, Historical and Cultural Sites
No sites of archeological, historical or cultural importance exist at or near the project
location.
4.13 Presence of Economic Minerals
No minerals of economic importance have been reported to be present in the project area as
per reports of GSI and any other agency.
Par Hydroelectric Project (52 MW) Detailed Project Report
Volume-I (Part-I)Main Report
161133-40ER-0007-00
CHAPTER - 5 Project Hydrology

Par Hydroelectric Project (52 MW) Detailed Project Report
Volume-I (Part-I)Main Report
161133-40ER-0007-00 i
TABLE OF CONTENTS
PAGE NO.
5 PROJECT HYDROLOGY ........................................................................................ 5-1
5.1 Introduction ................................................................................................... 5-1
5.1.1 Adopted Conventions ....................................................................... 5-1
5.2 Basin Characteristics .................................................................................... 5-2
5.2.1 River System and Basin Characteristics ........................................... 5-2
5.2.2 The Catchment ................................................................................. 5-2
5.2.3 Hypsometric Detail............................................................................ 5-2
5.2.4 Climatology ....................................................................................... 5-4
5.3 Water Availability Studies ............................................................................. 5-5
5.3.1 Data .................................................................................................. 5-5
5.3.2 Topography....................................................................................... 5-5
5.3.3 Precipitation ...................................................................................... 5-5
5.3.4 Consistency Checks of Rainfall Data ................................................ 5-6
5.3.5 Flow Series Assessment ................................................................ 5-13
5.3.6 Flow Duration Curves and Annual Dependabilities ........................ 5-20
5.4 Design Flood and Rating Curves ............................................................... 5-24
5.4.1 General ........................................................................................... 5-24
5.4.2 Approaches for Estimation of Design Flood ................................... 5-24
5.4.3 Flood Estimation by Probabilistic Approach ................................... 5-25
5.4.4 Flood Estimation by Hydro-meteorological Approach ..................... 5-30
5.4.5 Design Flood for River Diversion Works ......................................... 5-42
5.4.6 Tail Rating Curves .......................................................................... 5-47
5.5 Sedimentation Study .................................................................................. 5-52
5.5.1 Reservoir Elevation-Area-Capacity ................................................. 5-52
5.6 References ................................................................................................. 5-54
Par Hydroelectric Project (52 MW) Detailed Project Report
Volume-I (Part-I)Main Report
161133-40ER-0007-00 ii
LIST OF ANNEXURES AND PLATES
ANNEXURES:
Annexure 5-1: Rainfall Data
Annexure 5-2: Discharge Data of Pare Dam Site, Hoz G&D Site and Par G&D Site
Annexure 5-3: Letter of Design Storm value for Par, Turu and Dardu Hydroelectric Projects
Annexure 5-4: Convolution of unit Hydrograph with Rainfall
PLATES:
Plate 5-1: Catchment Area Map
Plate 5-2: Location Map of Hydro-meteorological Stations

Par Hydroelectric Project (52 MW) Detailed Project Report
Volume-I (Part-I)Main Report
161133-40ER-0007-00 iii
LIST OF TABLES
PAGE NO.
Table 5-1: Hypsometric Detail of the Catchment ................................................................. 5-2
Table 5-2: Available Maps Used for the Catchment Area Delineation ................................. 5-5
Table 5-3: Meteorological Stations ...................................................................................... 5-6
Table 5-4: Available Discharge Data ................................................................................. 5-13
Table 5-5: T-test for Homogeneity of Flow Series at Par ................................................... 5-16
Table 5-6: Flow Series at Par Project Site ......................................................................... 5-17
Table 5-7: Computation of Dependabilities of Annual Inflow ............................................. 5-21
Table 5-8: Details of Annual Peak flow at Par ................................................................... 5-26
Table 5-9: Detailed Statistics for Instantaneous Peak Flow Data ...................................... 5-27
Table 5-10: Outlier Test for Annual Peak Flow .................................................................. 5-28
Table 5-11: Return Period Flood ........................................................................................ 5-29
Table 5-12: Computation of Equivalent Slope ................................................................... 5-32
Table 5-13: Unit Hydrograph Parameters .......................................................................... 5-34
Table 5-14: Temporal Distribution of 24-hour Design Storm ............................................. 5-35
Table 5-15: Distribution of 24-hour Design Storm .............................................................. 5-36
Table 5-16: Rainfall Excesses for 50-Year Return Period ................................................. 5-37
Table 5-17: Rainfall Excesses for 100-Year Return Period ............................................... 5-37
Table 5-18: Rainfall Excesses for SPF .............................................................................. 5-38
Table 5-19: Critical Sequencing of Rainfall Excess ........................................................... 5-38
Table 5-20: 50 and 100-Year Return Period flood and SPF Hydrograph Values .............. 5-41
Table 5-21: Summary of Project Design Flood .................................................................. 5-42
Table 5-22: Details of Non-Monsoon Flood Peaks at Par .................................................. 5-43
Table 5-23: Detailed Statistics ........................................................................................... 5-44
Table 5-24: Outlier Test for Annual Peak Flow .................................................................. 5-45
Table 5-25: 25 Year Non-Monsoon Return Period Flood at Hoz ....................................... 5-46
Table 5-26: Stage Discharge Computation at 50m Downstream of Barrage Axis ............. 5-48
Table 5-27: Stage Discharge Computation at 100m Downstream of Barrage Axis ........... 5-49
Table 5-28: Stage Discharge Computation at Tailrace Location ....................................... 5-51
Table 5-29: Area-Capacity Value ....................................................................................... 5-53

Par Hydroelectric Project (52 MW) Detailed Project Report
Volume-I (Part-I)Main Report
161133-40ER-0007-00 iv
LIST OF FIGURES
PAGE NO.
Figure 5-1: Hypsometric Curve of the Project Catchment ................................................... 5-3
Figure 5-2: Mass Curves of Rainfall data ............................................................................. 5-7
Figure 5-3: Double Mass Curves of Rainfall data between Leporiang and Sagalee............ 5-8
Figure 5-4: Double Mass Curves of Rainfall data between Leporiang and Loplop .............. 5-8
Figure 5-5: Double Mass Curves of Rainfall data between Loplop and Sagalee ................. 5-9
Figure 5-6: Double Mass Curves of Rainfall data between Jampa and Leporiang .............. 5-9
Figure 5-7: Double Mass Curves of Rainfall data between Jampa and Loplop ................. 5-10
Figure 5-8: Double Mass Curves of Rainfall data between Jampa and Sagalee ............... 5-10
Figure 5-9: Plot of Monthly Rainfall at Raingauge Stations ............................................... 5-11
Figure 5-10: Average Annual Rainfall Pattern at Raingauge Stations ............................... 5-12
Figure 5-11: Average Annual Rainfall Pattern at Raingauge Stations ............................... 5-12
Figure 5-12: Mass Curve of Observed Discharge at Par ................................................... 5-14
Figure 5-13: Flow Duration Curve at Par Diversion Site for All 30 years series ................. 5-22
Figure 5-14: Flow Duration Curve of 90% Dependable Year ............................................. 5-22
Figure 5-15: Flow Duration Curve of 75% Dependable Year ............................................. 5-23
Figure 5-16: Flow Duration Curve of 50% Dependable Year ............................................. 5-23
Figure 5-17: Flow Duration Curve of Observed Data at Par G & D Site ............................ 5-24
Figure 5-18: Plot of Flood Frequency Analysis .................................................................. 5-30
Figure 5-19: L-Section of Par Catchment .......................................................................... 5-31
Figure 5-20: Parameters of SUH ....................................................................................... 5-33
Figure 5-21: SUH of Par Catchment .................................................................................. 5-34
Figure 5-22: 50-Year Return Period Flood Hydrograph ..................................................... 5-39
Figure 5-23: 100-Year Return Period Flood Hydrograph ................................................... 5-40
Figure 5-24: Standard Project Flood Hydrograph .............................................................. 5-40
Figure 5-25: Plot of Non-Monsoon Flood Frequency Analysis .......................................... 5-47
Figure 5-26: Stage Discharge Curve at 50m Downstream of Barrage Axis ....................... 5-49
Figure 5-27: Stage Discharge Curve at 100m Downstream of Barrage Axis ..................... 5-50
Figure 5-28: Stage Discharge Curve at Tailrace Channel Location ................................... 5-51
Figure 5-29: Elevation-Area-Capacity Curve ..................................................................... 5-53

Par Hydroelectric Project (52 MW) Detailed Project Report
Volume-I (Part-I)Main Report
161133-40ER-0007-00 5-1
5 PROJECT HYDROLOGY
5.1 Introduction
Hydrological inputs play a vital role in planning, execution and operation of any water
resources development project. Hydrological studies are carried out at all stages of project
development starting from the pre-feasibility stage and are continued even during the
operation of the project. Hydrological studies for a river valley projects are carried out with a
view to:
Assess quantity of available water in the river for power generation and its variation
with time.
Estimate design flood and diversion flood required for hydraulic design of spillway
and temporary diversion structure as well as for safety of the structure.
Sedimentation studies also usually form a part of hydrological studies in a hydro project.
However, as discussed subsequently, their relevance at the project is insignificant given that
it is being developed as a run-of-the-river scheme with Barrage as diversion structure.
Par Hydroelectric project is located on Pare River in Papum Pare District of Arunachal
Pradesh. The catchment area map of the project is shown in Plate 5-1.
As per the project planning based on detailed reconnaissance of site and assessment of
topographic and geological features, the project envisages construction of a 26.5m high
diversion structure from riverbed.
5.1.1 Adopted Conventions
The following conventions have been adopted for the hydrological calculations carried out:
The hydrological year runs from June to May of the following calendar year;
The monsoon season is defined from June to September;
The non-monsoon season is defined from October to May of the following calendar year.

Par Hydroelectric Project (52 MW) Detailed Project Report
Volume-I (Part-I)Main Report
161133-40ER-0007-00 5-2
5.2 Basin Characteristics
5.2.1 River System and Basin Characteristics
Pare River originates at elevation of about 2860m as Pare Nadi in the Lower Subansiri
District. After flowing for about 25km from north to south, the pare takes an eastward turn
and flows for about 43km upto Sekhi. On the way, it passes through Sagali. The main
tributaries of the Pare river are Pang and Nimte coming down from the nearby hillock.
After Confluence of Kheel Wadi with Pare on the right bank, the river assumes the name of
Dikrong/Pare. The Par, Nirochi and Pachin rivers form the Dikrong river. It flows from the
west to the southeast, and passing through Itanagar region and merges with Brahmaputra in
the Lakhimpur district of Assam.
5.2.2 The Catchment
The catchment area at the proposed diversion site of the project is 420km2. A plan of the
catchment area map is shown in Plate 5-1. The length of the Pare river up to the proposed
diversion structure is estimated as around 45.98km. All the catchment area of the project lies
below the elevation of 3000m and hence it is expected that there is no snowbound area in
the region.
5.2.3 Hypsometric Detail
A hypsometric curve is an empirical cumulative distribution function of elevations in a
catchment. It is shown as a continuous function and graphically displayed as an x-y plot, with
elevation on the vertical or y-axis and area above the corresponding elevation on the
horizontal or x-axis. For the present project the catchment areas vis-à-vis elevation has been
worked out which is given in Table 5-1 below:
Table 5-1: Hypsometric Detail of the Catchment
Elevation (m)
Area below (km2)
Area above (km2)
Area above (Percentage)
800 0 420.0 100.00%
900 1.555 418.4 99.63%
1000 9.53 410.5 97.73%
1100 24.03 396.0 94.28%
1200 45.94 374.1 89.06%
1300 74.29 345.7 82.31%

Par Hydroelectric Project (52 MW) Detailed Project Report
Volume-I (Part-I)Main Report
161133-40ER-0007-00 5-3
Elevation (m)
Area below (km2)
Area above (km2)
Area above (Percentage)
1400 115.78 304.2 72.43%
1500 161.85 258.2 61.46%
1600 203.9 216.1 51.45%
1700 241.13 178.9 42.59%
1800 275.94 144.1 34.30%
1900 313.44 106.6 25.37%
2000 347.86 72.1 17.18%
2100 369.77 50.2 11.96%
2200 394.04 26.0 6.18%
2300 400.65 19.4 4.61%
2400 407.81 12.2 2.90%
2500 412.34 7.7 1.82%
2600 416.99 3.0 0.72%
2700 418.41 1.6 0.38%
2860 420 0.0 0.00%
The hypsometric curve is given in the Figure 5-1 below:
HYPSOMETRIC CURVE OF PAR
500
750
1000
1250
1500
1750
2000
2250
2500
2750
3000
0 50 100 150 200 250 300 350 400 450Area above Elevation (km2)
Ele
vati
on
(m
)
Figure 5-1: Hypsometric Curve of the Project Catchment

Par Hydroelectric Project (52 MW) Detailed Project Report
Volume-I (Part-I)Main Report
161133-40ER-0007-00 5-4
From hypsometric detail, it can be seen that the catchment originates at an elevation of
about 2860m. The mean and median elevation of the catchment is around 1800m.
5.2.4 Climatology
The climate of the River Basin may be described as tropical monsoon climate.
The southwest monsoon normally enters Northeastern India around the end of May.
It establishes firmly over the entire region by the end of June and withdraws in the second
week of October.
During the monsoon months, different low-pressure systems like depressions, cyclonic
storms, etc. originate in the Bay of Bengal. After they cross the Indian coast, several of those
systems move in an easterly to north-easterly direction causing heavy rainfall over the Basin.
Over the year four different seasons can be defined:
Pre-monsoon (March-May);
Monsoon (June-September);
Post-monsoon (October-November);
Winter season (December-February).
Pre-monsoon
In the region of the East-Himalaya the first pre-monsoon precipitation sets in at the end of
March, mostly in form of thunderstorms. The months of April and May are characterized with
thundershowers.
Monsoon
The onset of the monsoon in northeast India happens normally between the 30th of May and
the 5th of June. This happens when the southern trade winds cross the equator and move
towards the extreme low-pressure region in Northern India.
Post-monsoon
In September the influence of the monsoon begins to decrease. In northern India a
withdrawal of the monsoon-troughs sets in suddenly and the weather becomes clearer.
During the post-monsoon season the temperature and the precipitation decline noticeably.
This time of the year is generally the most pleasant season due to the stable weather

Par Hydroelectric Project (52 MW) Detailed Project Report
Volume-I (Part-I)Main Report
161133-40ER-0007-00 5-5
condition and the warm climate. In the morning the valleys are filled with dense fog, but in
higher reaches the sky is clear.
Winter season
In the northeast Indian mountain range the winter is severe and characterized by low
temperature, but without significant snowfall. Precipitation only occurs in conjunction with
western disturbances (flat low-pressure areas). Starting February the temperature begins to
rise slowly again.
5.3 Water Availability Studies
5.3.1 Data
Data relevant to the project and their analysis has been provided in the subsequent
paragraphs below.
5.3.2 Topography
A detailed set of maps relevant to the project site has been made available by the project
authority which has been used for the delineation of catchment area. The parameters of the
supplied maps have been given in Table 5-2.
Table 5-2: Available Maps Used for the Catchment Area Delineation
Origin Reference Number
Longitude Latitude Scale Contour
lines
SOI 83 E/03 93°00’ – 93°15’ 27°15’ – 27°30’ 1:50,000 40m
SOI 83 E/04 93°00’ – 93°15’ 27°00’ – 27°15’ 1:50,000 40m
SOI 83 E/07 93°15’ – 93°30’ 27°15’ – 27°30’ 1:50,000 40m
SOI 83 E/08 93°15’ – 93°30’ 27°00’ – 27°15’ 1:50,000 40m
SOI 83 E/11 93°30’ – 93°45’ 27°15’ – 27°30’ 1:50,000 40m
SOI 83 E/12 93°30’ – 93°45’ 27°00’ – 27°15’ 1:50,000 40m
5.3.3 Precipitation
Available meteorological data relevant to hydrological assessment of the project are shown
in Table 5-3.

Par Hydroelectric Project (52 MW) Detailed Project Report
Volume-I (Part-I)Main Report
161133-40ER-0007-00 5-6
Table 5-3: Meteorological Stations
S.No. Station Type of Data Period of Availability Name of the River Basin/Catchment
1 Leporiang Daily Aug 2001-Mar 2005 Pare
2 Loplop Daily Aug 2001-Sep 2004 Pare
3 Sagalee Daily Aug 2001-Mar 2005 Pare
4 Jampa Daily Nov 2001-Feb 2005 Pare
The rainfall data has been given in Annexure 5-1. There are also availability of rainfall data
for Doimukh and Itanagar raingauge stations. However, these data (Doimukh and Itanagar)
are not in the vicinity of the project catchment and hence the data of these stations are not
analyzed further. The location of hydro-meteorological stations has been shown in Plate 5-2.
5.3.4 Consistency Checks of Rainfall Data
The calculations on water availability and flood magnitude will lead to selecting the design
features of the project (installed capacity, turbine flow, spillway capacity, etc.).
These features will directly reflect on the project cost and on the quantity and value of
energy produced. It is therefore necessary to confirm the validity of the basic data used in
the calculations. The consistency Checks of the rainfall data has been carried as follows.
A. Mass Curve of Rainfall Data
Mass curves representing the cumulated values of a hydrologic parameter like discharge or
rainfall, plotted against time, are important tools in identifying any unexplained trends in the
variable. However, since hydrologic variables show a considerable year to year variation,
this method is useful only where data for a considerable length, say exceeding 5 years, is
available. Attempt has been made to check the consistency with the available data.
In the present study, mass curves have been prepared for rainfall data available at
Leporiang, Loplop, Sagalee and Jampa.
These mass curves are shown below:

Par Hydroelectric Project (52 MW) Detailed Project Report
Volume-I (Part-I)Main Report
161133-40ER-0007-00 5-7
Mass Curves of Rainfall Data
0
2000
4000
6000
8000
10000
12000
J F M A M J J A S O N D J F M A M J J A S O N D J F M A M J J A S O N D J F M A M J J A S O N D J F M
2001 2002 2003 2004 2005
Cu
mu
lati
ve
of
Ra
infa
ll (
mm
)
Leporiang
Loplop
Sagalee
Jampa
Figure 5-2: Mass Curves of Rainfall data
It is seen from the mass curve as developed in the above Figure 5-2 that the month of Jun
to Sep yields a comparatively more rainfall than that of the other months in all of the stations.
This suggests that the months of from Jun to Sep are monsoon months. Apart from the mass
curve based on monthly rainfall, mass curves are also plotted based on the annual data.
B. Double Mass Curve of Rainfall Data
Double mass curve is a simple technique to examine the consistency of hydrology related
series of two different sites. For the common period, preferably around 10 years or more, the
cumulated variable (such as the rain, the flow volume) at one station is plotted against that of
the other. If the plot follows a near straight line, it indicates a consistency; if the plot has
kinks or shifts, it indicates likely inconsistencies. However, it does not indicate which data
series is inconsistent.
If data is available at a number of different stations, the inconsistent data can be located by
plotting the double mass curve in different pairs. The inconsistent data can be: a) wholly
rejected, b) rejected only for the inconsistent part, or, c) the inconsistent part may be
corrected to make it consistent, and accepted.
For the present project, the double mass curves for the raingauge stations where concurrent
data is available are plotted. To carry out a meaningful comparison with the double mass
curve technique based on the available data, the following assumptions were made:
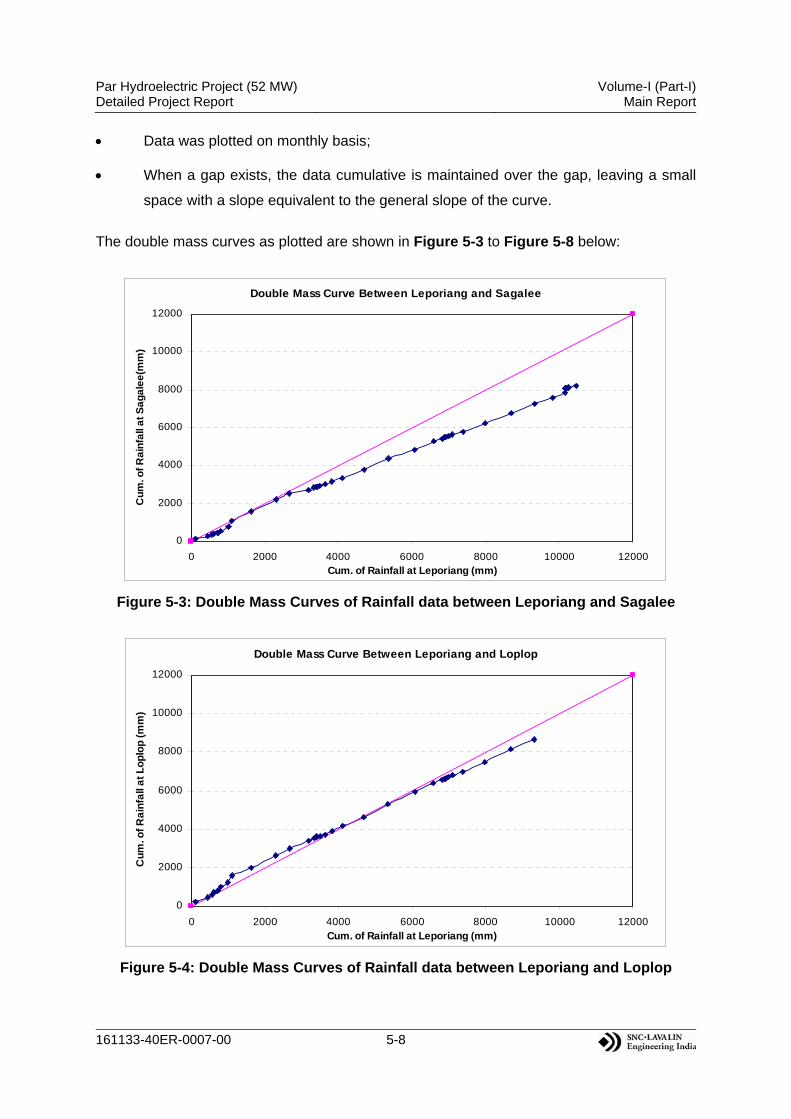
Par Hydroelectric Project (52 MW) Detailed Project Report
Volume-I (Part-I)Main Report
161133-40ER-0007-00 5-8
Data was plotted on monthly basis;
When a gap exists, the data cumulative is maintained over the gap, leaving a small
space with a slope equivalent to the general slope of the curve.
The double mass curves as plotted are shown in Figure 5-3 to Figure 5-8 below:
Double Mass Curve Between Leporiang and Sagalee
0
2000
4000
6000
8000
10000
12000
0 2000 4000 6000 8000 10000 12000Cum. of Rainfall at Leporiang (mm)
Cu
m. o
f R
ain
fall
at
Sa
ga
lee
(mm
)
Figure 5-3: Double Mass Curves of Rainfall data between Leporiang and Sagalee
Double Mass Curve Between Leporiang and Loplop
0
2000
4000
6000
8000
10000
12000
0 2000 4000 6000 8000 10000 12000Cum. of Rainfall at Leporiang (mm)
Cu
m. o
f R
ain
fall
at
Lo
plo
p (
mm
)
Figure 5-4: Double Mass Curves of Rainfall data between Leporiang and Loplop

Par Hydroelectric Project (52 MW) Detailed Project Report
Volume-I (Part-I)Main Report
161133-40ER-0007-00 5-9
Double Mass Curve Between Loplop and Sagalee
0
2000
4000
6000
8000
10000
12000
0 2000 4000 6000 8000 10000 12000Cum. of Rainfall at Loplop (mm)
Cu
m. o
f R
ain
fall
at
Sa
ga
lee
(mm
)
Figure 5-5: Double Mass Curves of Rainfall data between Loplop and Sagalee
Double Mass Curve Between Jampa and Leporiang
0
1000
2000
3000
4000
5000
6000
7000
8000
9000
10000
0 1000 2000 3000 4000 5000 6000 7000 8000 9000 10000Cum. of Rainfall at Jampa (mm)
Cu
m. o
f R
ain
fall
at
Le
po
ria
ng
(m
m)
Figure 5-6: Double Mass Curves of Rainfall data between Jampa and Leporiang

Par Hydroelectric Project (52 MW) Detailed Project Report
Volume-I (Part-I)Main Report
161133-40ER-0007-00 5-10
Double Mass Curve Between Jampa and Loplop
0
1000
2000
3000
4000
5000
6000
7000
8000
9000
10000
0 1000 2000 3000 4000 5000 6000 7000 8000 9000 10000Cum. of Rainfall at Jampa (mm)
Cu
m. o
f R
ain
fall
at
Lo
plo
p (
mm
)
Figure 5-7: Double Mass Curves of Rainfall data between Jampa and Loplop
Double Mass Curve Between Jampa and Sagalee
0
1000
2000
3000
4000
5000
6000
7000
8000
9000
10000
0 1000 2000 3000 4000 5000 6000 7000 8000 9000 10000Cum. of Rainfall at Jampa (mm)
Cu
m. o
f R
ain
fall
at
Sa
ga
lee
(m
m)
Figure 5-8: Double Mass Curves of Rainfall data between Jampa and Sagalee
It is observed from the above double mass curves that there is considerable consistency
among rainfall data of raingauge stations.
C. Monthly Plot of Rainfall Data
The plot of monthly rainfall at the available raingauge stations has been given in Figure 5-9
below.

Par Hydroelectric Project (52 MW) Detailed Project Report
Volume-I (Part-I)Main Report
161133-40ER-0007-00 5-11
Comparison of Monthly Rainfall
0
100
200
300
400
500
600
700
800J F M A M J J A S O N D J F M A M J J A S O N D J F M A M J J A S O N D J F M A M J J A S O N D J F M A M J J A S O N D
2001 2002 2003 2004 2005
Mo
nth
ly R
ain
fall
(mm
)
LEPORIANG
LOPLOP
SAGALEE
JAMPA
Figure 5-9: Plot of Monthly Rainfall at Raingauge Stations
From the above figure, it can be seen that the pattern of rainfall in different months at all the
raingauge stations are almost similar. Therefore, it can be concluded that the behavior of
rainfall throughout the catchment is same.
D. Average Annual Rainfall Pattern of Raingauge Stations
The plot of average monthly rainfall pattern at different raingauge stations has been shown
in Figure 5-10. The figure indicates that the average rainfall patterns at all the raingauge
sites are almost similar. The plot of average annual rainfall at these raingauge sites is also
given in Figure 5-11 which indicates that the station at Sagalee experiences less rainfall
compared to the others.

Par Hydroelectric Project (52 MW) Detailed Project Report
Volume-I (Part-I)Main Report
161133-40ER-0007-00 5-12
Average Annual Rainfall Pattern of Raingauge Stations
0%
5%
10%
15%
20%
25%
Jan Feb Mar Apr May Jun Jul Aug Sep Oct Nov Dec
Per
cen
tag
e o
f A
vera
ge
An
nu
al R
ain
fall
(%
) Leporiang
Loplop
Sagalee
Jampa
Figure 5-10: Average Annual Rainfall Pattern at Raingauge Stations
Average Annual Rainfall of Raingauge Stations
30692870
2439
3074
0
500
1000
1500
2000
2500
3000
3500
Leporiang Loplop Sagalee Jampa
Ave
rag
e A
nn
ual
Rai
nfa
ll (
mm
)
Figure 5-11: Average Annual Rainfall Pattern at Raingauge Stations
Based on the available rainfall data, the average annual rainfall of the catchment has been
estimated to 2863mm.
E. Conclusion of Rainfall Data Analysis
Based on the analysis of available data of 4 raingauge stations in and around the vicinity of
the project, the following conclusions can be drawn:

Par Hydroelectric Project (52 MW) Detailed Project Report
Volume-I (Part-I)Main Report
161133-40ER-0007-00 5-13
The analysis shows that the average annual rainfall of the catchment is of the order
of 2863mm considering the all four raingauge stations. However, considering only the
raingauge stations inside the proposed project catchment, it has been estimated to
about 2655mm.
All four raingauge stations are distributed reasonably from the Pare dam site to the
proposed project at Par as can be seen from Plate 5-2.
Similar rainfall pattern has been observed in all the four raingauge stations as given
in Figure 5-9 and Figure 5-10 indicating similar basin characteristics throughout the
basin from pare dam site to the proposed project site at Par. A comparatively less
rainfall is observed at Sagalee from the other available stations. However, a strong
conclusion whether this raingauge station receives a less rainfall or not can’t be
made because the analysis is based on a very limited period of data of about 3 years
only.
Nonetheless, it can be concluded from the overall analysis that the basin
characteristics along the basin from Pare dam site to the proposed site are similar.
5.3.5 Flow Series Assessment
A. Data Available
Data available to assess the flow series of the project are given in Table 5-4.
Table 5-4: Available Discharge Data
Station Period of
Availability Name of theRiver Basin
Catchment Area (km2)
Remarks
PareDam Site 1978-79 to 2004-05 Pare 824 CWC Approved
10-Daily Average
Hoz G&D Site Apr 2005-Sep 2008 Pare 803.35 Daily
Par Project Site Nov 2011- Oct 2013 Pare 420 Daily
All the available discharge data as listed in the table above has been given in Annexure 5-2.
From the table it can be seen that, site specific observed discharge data at the proposed
project site is available from the period from Nov-2011 to Oct-2013 only, thus completing
only one year of water year data from June-2012 to May-2012.

Par Hydroelectric Project (52 MW) Detailed Project Report
Volume-I (Part-I)Main Report
161133-40ER-0007-00 5-14
A mass curve has been prepared to check the internal consistency of the available data at
Par which is given in Figure 5-12. The figure shows that there is a increase of discharge
from the month of May onwards to the month of September and then it recedes. However a
strong conclusion can’t be made on this as the available data is for a period of one complete
water year only. Further, no external consistency checks of the available data at the project
site could be performed because of lack of concurrent period of discharge or rainfall data.
Hence, it is felt prudent not to use this data at present in the water availability study of the
project. However, it is advisable to continue the observation of the discharge measurement
at the project site to review the water availability when sufficient data becomes available.
Mass Curve of Monthly Average Observed Discharge at Par
0
100
200
300
400
500
600
700
800
JUN
JUL
AU
GS
EP
OC
TN
OV
DE
CJA
NF
EB
MA
RA
PR
MA
YJU
NJU
LA
UG
SE
PO
CT
NO
VD
EC
JAN
FE
BM
AR
AP
RM
AY
JUN
JUL
AU
GS
EP
OC
TN
OV
DE
CJA
NF
EB
MA
RA
PR
MA
Y
2011-12 2012-13 2013-14
Cu
m. o
f M
on
thly
Ave
rag
e F
low
(m
3/s
)
Figure 5-12: Mass Curve of Observed Discharge at Par
B. Flow Series Computation
From the available discharge data, it is seen that long-term discharge data is available only
at the pare dam site which is downstream of the proposed project of Par for the period from
1978-79 to 2004-05. Hence, it has been proposed to use this data for the formulation of flow
series at the proposed project site of Par hydroelectric project. Rainfall analysis presented
previously shows that there is no variation in the basin behaviour along the basin from Pare
dam site to the Par project site. Hence, it has been proposed to transpose the flow series of
Pare dam site to the Par hydroelectric project by catchment area proportion. The formula for
deriving the flow series at Par from Pare is as follows:

Par Hydroelectric Project (52 MW) Detailed Project Report
Volume-I (Part-I)Main Report
161133-40ER-0007-00 5-15
Pare
ParParePar CA
CAQQ *
= ParePare QQ *51.0*824
420
Again observed discharge data at Hoz G&D site (CA = 803.35km2) is available from Apr
2005 to Sep 2008 completing 3 hydrological water year from 2005-06 to 2007-08. Hence,
this data is also transferred to the proposed project site by catchment area proportion
forming a complete series of 1978-79 to 2007-08. The formula for deriving the flow series at
Par from Hoz G&D site is as follows:
Hoz
ParHozPar CA
CAQQ *
= HozHoz QQ *52.0*35.803
420
However, the suitability of extending the flow series (i.e., homogeneity of the series derived
from two different sites) from 2005-06 to 2007-08 has been tested through t-test statistics as
follows:

Par Hydroelectric Project (52 MW) Detailed Project Report
Volume-I (Part-I)Main Report
161133-40ER-0007-00 5-16
Table 5-5: T-test for Homogeneity of Flow Series at Par
PeriodInflow (MCM)
1978-79 to2004-05
2005-06 to2007-08
1978-79 671 786.39504 627.6461
1979-80 686 32569.467 16292.172
1980-81 505 27 3
1981-82 456 0
1982-83 529 3
1983-84 605 1.9486099
1984-85 673 0.0732363
1985-86 941 2.3533634
1986-87 1076 0.1464727
1987-88 1282 3.1824463
1988-89 891
1989-90 830
1990-91 779
1991-92 779
1992-93 647
1993-94 783
1994-95 777
1995-96 943
1996-97 902
1997-98 871
1998-99 920
1999-00 875
2000-01 669
2001-02 896
2002-03 904
2003-04 675
2004-05 665
2005-06 649
2006-07 491
2007-08 743
t Critical one-tail
P(T<=t) two-tail
t Critical two-tail
Result: From the analysis it can be seen that the criticalvalue of “t” is greater than the calculated “t”. Hence, it isconcluded that the series derived from two sources arehomogeneous to each other.
De
riv
ed
Fro
m P
are
Da
m S
ite
De
riv
ed
Fro
m
Ho
z G
&D
Parameter
Mean
Variance
Observations
Hypothesized Mean Difference
df
t Stat
P(T<=t) one-tail
Thus the complete 10-daily average flow series for 30 years (1978-79 to 2007-08) as derived
for Par hydroelectric project has been given in Table 5-6. The average annual inflow and
average annual runoff depth of the flow series has been computed to 770.5 MCM and
1835mm respectively.

Par Hydroelectric Project (52 MW) Detailed Project Report
Volume-I (Part-I)Main Report
161133-40ER-0007-00 5-17
Table 5-6: Flow Series at Par Project Site
1978-79 1979-80 1980-81 1981-82 1982-83 1983-84 1984-85 1985-86
I 28.06 7.17 21.22 11.00 18.52 19.51 12.80 40.32II 43.36 26.13 43.17 11.77 49.43 34.31 33.60 34.24III 89.30 26.95 32.22 19.18 69.51 28.33 27.66 27.22I 52.47 103.30 28.39 27.20 20.59 44.61 36.41 127.41II 41.69 38.36 48.29 46.08 18.94 18.55 27.76 38.94III 36.81 39.87 19.77 23.70 31.25 25.90 43.39 60.14I 33.94 22.56 26.13 22.26 15.32 14.95 18.80 28.89II 36.71 22.17 31.54 27.73 12.73 14.25 19.39 19.35III 26.06 37.32 20.23 24.79 14.35 24.04 33.03 33.53I 28.57 52.66 13.94 18.52 11.66 24.75 39.75 33.48II 45.81 38.58 13.48 19.79 37.87 62.24 123.49 19.33III 36.35 18.74 18.80 15.37 28.04 30.29 28.60 25.89I 28.43 39.52 10.61 15.35 12.43 15.58 18.33 17.78II 21.61 21.56 8.89 10.88 10.54 35.97 20.92 36.58III 15.15 13.89 11.00 10.88 12.31 17.48 18.01 32.85I 17.36 11.29 16.17 9.90 9.57 12.34 11.82 26.80II 14.57 11.48 14.74 9.18 9.30 11.25 10.95 23.63III 17.90 12.97 10.01 8.77 8.79 10.08 9.98 21.51I 10.01 13.26 9.69 8.55 8.67 9.55 9.63 20.26II 8.31 10.68 9.44 11.41 8.94 9.08 10.00 19.76III 8.45 11.46 10.12 9.39 9.57 10.62 10.05 21.35I 7.09 10.15 9.64 8.50 8.21 8.81 9.19 18.97II 6.68 9.98 8.91 8.55 8.01 9.15 8.94 18.32III 7.53 11.56 9.96 9.18 9.18 10.08 9.55 19.56I 7.48 10.03 8.89 8.43 7.87 8.63 8.86 18.64II 6.51 10.18 8.77 9.81 7.70 8.49 8.93 18.06III 5.15 9.37 7.36 6.73 6.44 7.50 9.26 14.20I 6.27 13.28 8.69 8.98 7.70 9.41 13.14 17.37II 6.22 10.90 10.64 8.72 8.84 13.90 7.87 21.33III 6.85 10.81 11.24 10.42 9.66 11.63 11.31 18.38I 7.79 10.81 12.41 13.84 8.91 16.28 12.06 17.52II 7.28 11.31 12.14 14.35 9.88 13.19 14.72 31.83III 8.64 27.68 10.15 14.91 15.35 11.01 13.26 35.56I 15.64 19.47 11.10 15.20 34.86 12.20 21.34 42.05II 18.67 20.39 12.55 12.02 25.15 41.28 13.87 36.56III 8.43 15.76 16.00 8.60 17.38 33.65 37.75 32.19
671.4 685.8 505.1 456.5 529.2 605.4 672.9 940.71598 1633 1203 1087 1260 1442 1602 2240
Mar
Apr
May
Runoff Depth (mm)
PERIOD
Jun
Jul
Aug
Sep
Oct
Nov
Dec
Annual (MCM)
Jan
Feb

Par Hydroelectric Project (52 MW) Detailed Project Report
Volume-I (Part-I)Main Report
161133-40ER-0007-00 5-18
Table 5-6 (Contd..): Flow Series at Par Project Site
1986-87 1987-88 1988-89 1989-90 1990-91 1991-92 1992-93 1993-94
I 27.33 56.79 73.03 30.06 45.94 38.84 16.61 48.64II 40.48 48.37 72.40 63.94 26.26 45.26 17.09 53.73III 67.95 59.03 78.46 22.41 60.60 50.02 50.19 70.64I 19.45 86.08 100.48 28.25 35.54 52.57 30.12 46.42II 35.61 63.38 85.99 47.47 45.27 45.31 54.91 31.70III 46.86 83.12 114.67 67.30 45.64 31.78 57.00 28.75I 61.70 63.16 18.22 28.47 29.17 39.85 44.50 30.13II 37.72 86.12 23.02 30.01 28.92 43.39 30.70 35.88III 54.22 96.12 60.22 46.59 35.95 37.83 38.18 33.98I 36.75 85.35 29.14 27.26 26.73 43.08 21.28 37.93II 69.00 77.90 23.41 47.84 38.22 35.49 22.42 32.13III 41.58 112.71 25.74 39.52 53.75 34.74 21.73 35.78I 38.71 80.14 23.35 34.84 50.01 23.43 16.81 33.45II 37.70 41.14 15.15 37.37 40.15 32.68 30.54 28.98III 42.87 18.33 28.17 25.36 24.96 20.59 17.15 29.77I 27.14 13.96 12.19 23.75 18.00 15.93 11.70 16.41II 22.47 11.96 10.79 21.23 15.30 13.59 10.88 13.10III 19.03 11.07 11.37 15.06 12.76 11.88 9.92 12.66I 17.89 10.14 10.30 10.96 9.46 10.93 10.16 12.52II 17.76 10.29 9.67 9.56 10.27 9.77 7.97 12.78III 18.30 10.45 10.31 12.44 10.56 11.93 7.88 12.60I 15.90 9.28 8.94 9.50 9.46 8.84 10.17 12.00II 15.35 9.21 9.27 9.30 8.23 8.72 10.97 12.38III 16.03 9.94 10.02 11.90 8.33 8.85 8.95 11.84I 18.91 9.33 8.97 13.98 7.42 8.61 7.64 11.73II 18.74 9.39 10.95 13.22 10.49 9.33 18.34 11.81III 18.11 9.05 9.26 14.60 7.88 8.10 7.38 11.84I 21.69 10.77 10.23 15.20 8.11 35.34 7.52 13.70II 32.84 15.39 12.36 15.31 10.49 14.24 11.64 15.79III 32.96 12.62 14.62 19.76 9.59 21.66 12.29 24.96I 44.90 12.63 17.70 17.58 23.37 13.93 8.34 25.86II 35.97 16.92 11.64 26.58 10.29 23.94 15.67 12.34III 48.03 14.67 10.63 35.54 11.07 13.98 11.15 23.82I 40.48 19.74 13.64 21.95 44.96 17.24 34.96 14.27II 38.26 56.61 8.33 26.66 32.19 26.88 24.40 15.03III 44.97 110.40 15.42 22.72 22.36 19.23 16.98 17.64
1076.2 1282.0 891.3 830.5 779.2 778.8 646.7 783.32562 3052 2122 1977 1855 1854 1540 1865
Mar
Apr
May
Runoff Depth (mm)
PERIOD
Jun
Jul
Aug
Sep
Oct
Nov
Dec
Annual (MCM)
Jan
Feb
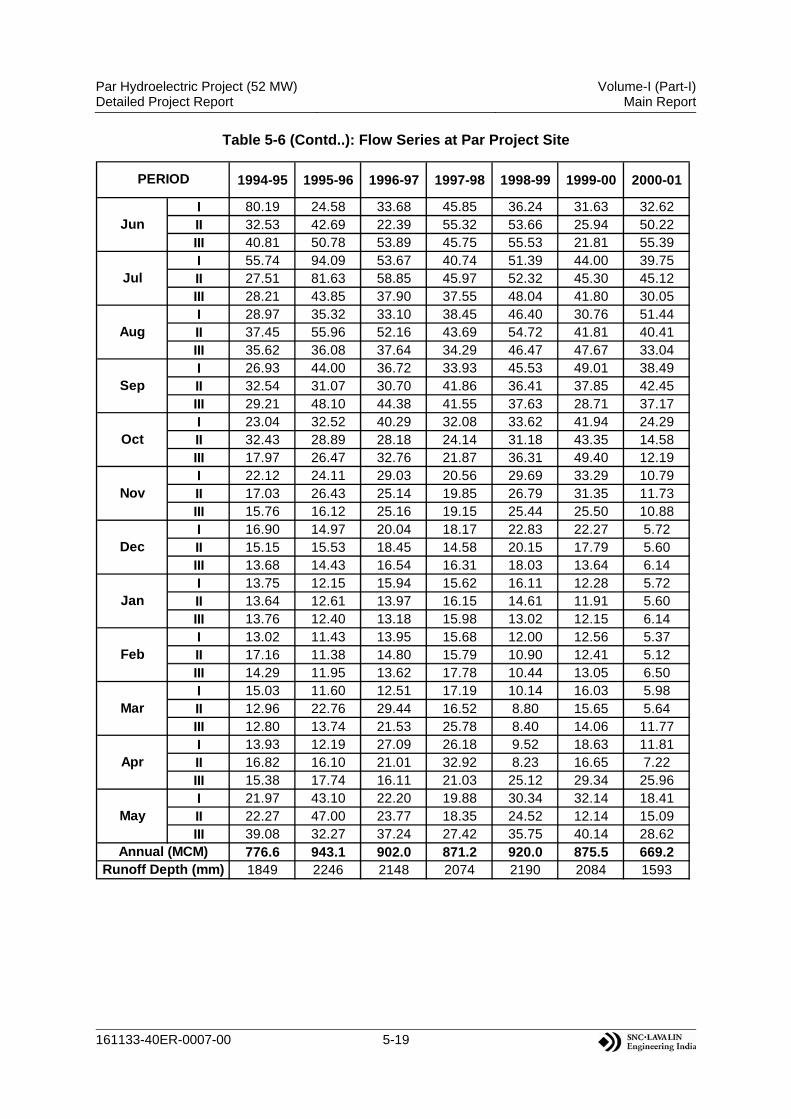
Par Hydroelectric Project (52 MW) Detailed Project Report
Volume-I (Part-I)Main Report
161133-40ER-0007-00 5-19
Table 5-6 (Contd..): Flow Series at Par Project Site
1994-95 1995-96 1996-97 1997-98 1998-99 1999-00 2000-01
I 80.19 24.58 33.68 45.85 36.24 31.63 32.62II 32.53 42.69 22.39 55.32 53.66 25.94 50.22III 40.81 50.78 53.89 45.75 55.53 21.81 55.39I 55.74 94.09 53.67 40.74 51.39 44.00 39.75II 27.51 81.63 58.85 45.97 52.32 45.30 45.12III 28.21 43.85 37.90 37.55 48.04 41.80 30.05I 28.97 35.32 33.10 38.45 46.40 30.76 51.44II 37.45 55.96 52.16 43.69 54.72 41.81 40.41III 35.62 36.08 37.64 34.29 46.47 47.67 33.04I 26.93 44.00 36.72 33.93 45.53 49.01 38.49II 32.54 31.07 30.70 41.86 36.41 37.85 42.45III 29.21 48.10 44.38 41.55 37.63 28.71 37.17I 23.04 32.52 40.29 32.08 33.62 41.94 24.29II 32.43 28.89 28.18 24.14 31.18 43.35 14.58III 17.97 26.47 32.76 21.87 36.31 49.40 12.19I 22.12 24.11 29.03 20.56 29.69 33.29 10.79II 17.03 26.43 25.14 19.85 26.79 31.35 11.73III 15.76 16.12 25.16 19.15 25.44 25.50 10.88I 16.90 14.97 20.04 18.17 22.83 22.27 5.72II 15.15 15.53 18.45 14.58 20.15 17.79 5.60III 13.68 14.43 16.54 16.31 18.03 13.64 6.14I 13.75 12.15 15.94 15.62 16.11 12.28 5.72II 13.64 12.61 13.97 16.15 14.61 11.91 5.60III 13.76 12.40 13.18 15.98 13.02 12.15 6.14I 13.02 11.43 13.95 15.68 12.00 12.56 5.37II 17.16 11.38 14.80 15.79 10.90 12.41 5.12III 14.29 11.95 13.62 17.78 10.44 13.05 6.50I 15.03 11.60 12.51 17.19 10.14 16.03 5.98II 12.96 22.76 29.44 16.52 8.80 15.65 5.64III 12.80 13.74 21.53 25.78 8.40 14.06 11.77I 13.93 12.19 27.09 26.18 9.52 18.63 11.81II 16.82 16.10 21.01 32.92 8.23 16.65 7.22III 15.38 17.74 16.11 21.03 25.12 29.34 25.96I 21.97 43.10 22.20 19.88 30.34 32.14 18.41II 22.27 47.00 23.77 18.35 24.52 12.14 15.09III 39.08 32.27 37.24 27.42 35.75 40.14 28.62
776.6 943.1 902.0 871.2 920.0 875.5 669.21849 2246 2148 2074 2190 2084 1593
Mar
Apr
May
Runoff Depth (mm)
PERIOD
Jun
Jul
Aug
Sep
Oct
Nov
Dec
Annual (MCM)
Jan
Feb
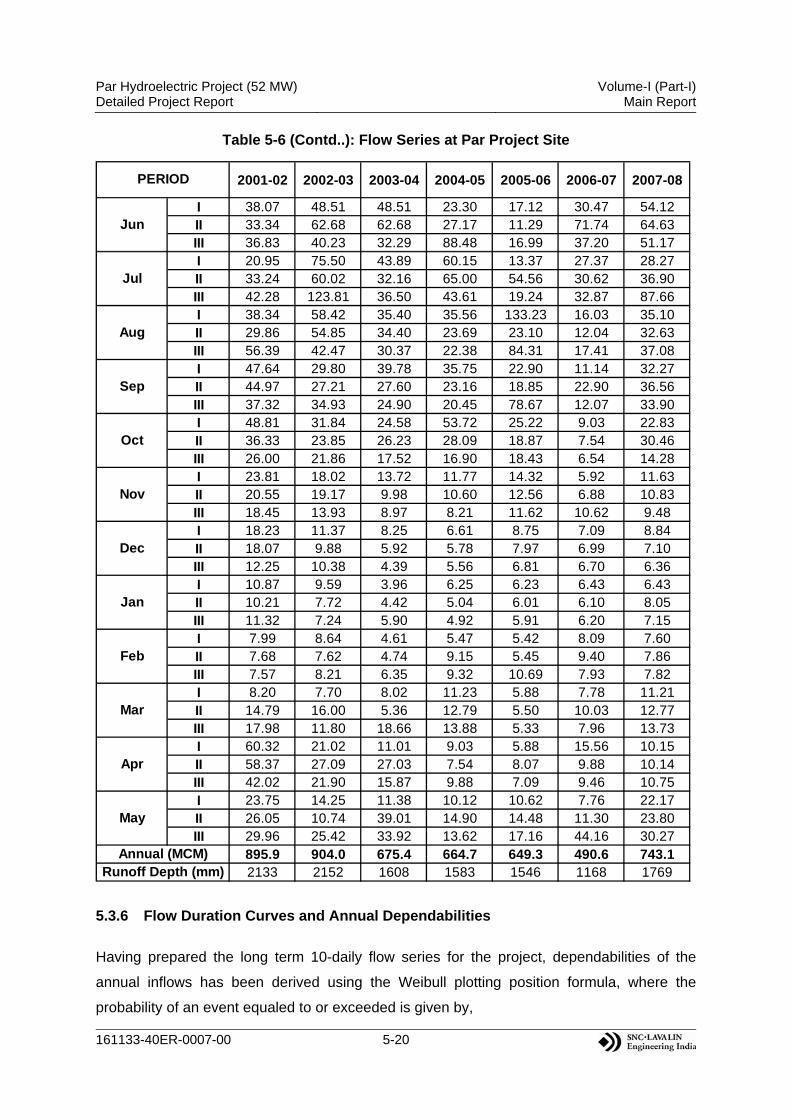
Par Hydroelectric Project (52 MW) Detailed Project Report
Volume-I (Part-I)Main Report
161133-40ER-0007-00 5-20
Table 5-6 (Contd..): Flow Series at Par Project Site
2001-02 2002-03 2003-04 2004-05 2005-06 2006-07 2007-08
I 38.07 48.51 48.51 23.30 17.12 30.47 54.12II 33.34 62.68 62.68 27.17 11.29 71.74 64.63III 36.83 40.23 32.29 88.48 16.99 37.20 51.17I 20.95 75.50 43.89 60.15 13.37 27.37 28.27II 33.24 60.02 32.16 65.00 54.56 30.62 36.90III 42.28 123.81 36.50 43.61 19.24 32.87 87.66I 38.34 58.42 35.40 35.56 133.23 16.03 35.10II 29.86 54.85 34.40 23.69 23.10 12.04 32.63III 56.39 42.47 30.37 22.38 84.31 17.41 37.08I 47.64 29.80 39.78 35.75 22.90 11.14 32.27II 44.97 27.21 27.60 23.16 18.85 22.90 36.56III 37.32 34.93 24.90 20.45 78.67 12.07 33.90I 48.81 31.84 24.58 53.72 25.22 9.03 22.83II 36.33 23.85 26.23 28.09 18.87 7.54 30.46III 26.00 21.86 17.52 16.90 18.43 6.54 14.28I 23.81 18.02 13.72 11.77 14.32 5.92 11.63II 20.55 19.17 9.98 10.60 12.56 6.88 10.83III 18.45 13.93 8.97 8.21 11.62 10.62 9.48I 18.23 11.37 8.25 6.61 8.75 7.09 8.84II 18.07 9.88 5.92 5.78 7.97 6.99 7.10III 12.25 10.38 4.39 5.56 6.81 6.70 6.36I 10.87 9.59 3.96 6.25 6.23 6.43 6.43II 10.21 7.72 4.42 5.04 6.01 6.10 8.05III 11.32 7.24 5.90 4.92 5.91 6.20 7.15I 7.99 8.64 4.61 5.47 5.42 8.09 7.60II 7.68 7.62 4.74 9.15 5.45 9.40 7.86III 7.57 8.21 6.35 9.32 10.69 7.93 7.82I 8.20 7.70 8.02 11.23 5.88 7.78 11.21II 14.79 16.00 5.36 12.79 5.50 10.03 12.77III 17.98 11.80 18.66 13.88 5.33 7.96 13.73I 60.32 21.02 11.01 9.03 5.88 15.56 10.15II 58.37 27.09 27.03 7.54 8.07 9.88 10.14III 42.02 21.90 15.87 9.88 7.09 9.46 10.75I 23.75 14.25 11.38 10.12 10.62 7.76 22.17II 26.05 10.74 39.01 14.90 14.48 11.30 23.80III 29.96 25.42 33.92 13.62 17.16 44.16 30.27
895.9 904.0 675.4 664.7 649.3 490.6 743.12133 2152 1608 1583 1546 1168 1769
Mar
Apr
May
Runoff Depth (mm)
PERIOD
Jun
Jul
Aug
Sep
Oct
Nov
Dec
Annual (MCM)
Jan
Feb
5.3.6 Flow Duration Curves and Annual Dependabilities
Having prepared the long term 10-daily flow series for the project, dependabilities of the
annual inflows has been derived using the Weibull plotting position formula, where the
probability of an event equaled to or exceeded is given by,

Par Hydroelectric Project (52 MW) Detailed Project Report
Volume-I (Part-I)Main Report
161133-40ER-0007-00 5-21
1
N
mP
where:
m = Annual Runoff order in Descending Order
N = Total no of years of Record
The computation has been tabulated in Table 5-7.
Table 5-7: Computation of Dependabilities of Annual Inflow
(Right Side Period is rearranged in Descending Order of Annual Runoff)
S.No. Period Runoff (MCM)
Period Runoff (MCM) in
descending orderm/(n+1)
1 1978-79 671 1987-88 1282 0.03
2 1979-80 686 1986-87 1076 0.06
3 1980-81 505 1995-96 943 0.10
4 1981-82 456 1985-86 941 0.13
5 1982-83 529 1998-99 920 0.16
6 1983-84 605 2002-03 904 0.19
7 1984-85 673 1996-97 902 0.23
8 1985-86 941 2001-02 896 0.26
9 1986-87 1076 1988-89 891 0.29
10 1987-88 1282 1999-00 875 0.32
11 1988-89 891 1997-98 871 0.35
12 1989-90 830 1989-90 830 0.39
13 1990-91 779 1993-94 783 0.42
14 1991-92 779 1990-91 779 0.45
15 1992-93 647 1991-92 779 0.48
16 1993-94 783 1994-95 777 0.52 50% dependable
17 1994-95 777 2007-08 743 0.55
18 1995-96 943 1979-80 686 0.58
19 1996-97 902 2003-04 675 0.61
20 1997-98 871 1984-85 673 0.65
21 1998-99 920 1978-79 671 0.68
22 1999-00 875 2000-01 669 0.71
23 2000-01 669 2004-05 665 0.74
24 2001-02 896 2005-06 649 0.77 75% dependable
25 2002-03 904 1992-93 647 0.81
26 2003-04 675 1983-84 605 0.84
27 2004-05 665 1982-83 529 0.87
28 2005-06 649 1980-81 505 0.90 90% dependable
29 2006-07 491 2006-07 491 0.94
30 2007-08 743 1981-82 456 0.97

Par Hydroelectric Project (52 MW) Detailed Project Report
Volume-I (Part-I)Main Report
161133-40ER-0007-00 5-22
The flow duration curves for all available years, 90%, 75%, 50% dependable years and also
the flow duration curve of the available observed data at Par project site has been given in
the Figure 5-13 to Figure 5-17 respectively.
Flow Duration Curve-All Year
0
50
100
150
0 10 20 30 40 50 60 70 80 90 100
Percentage of Exceedence
Dis
char
ge
(cu
mec
)
Figure 5-13: Flow Duration Curve at Par Diversion Site for All 30 years series
Flow Duration Curve-90% Dependable Year
0
10
20
30
40
50
0 10 20 30 40 50 60 70 80 90 100
Percentage of Exceedence
Dis
char
ge
(cu
mec
)
Figure 5-14: Flow Duration Curve of 90% Dependable Year
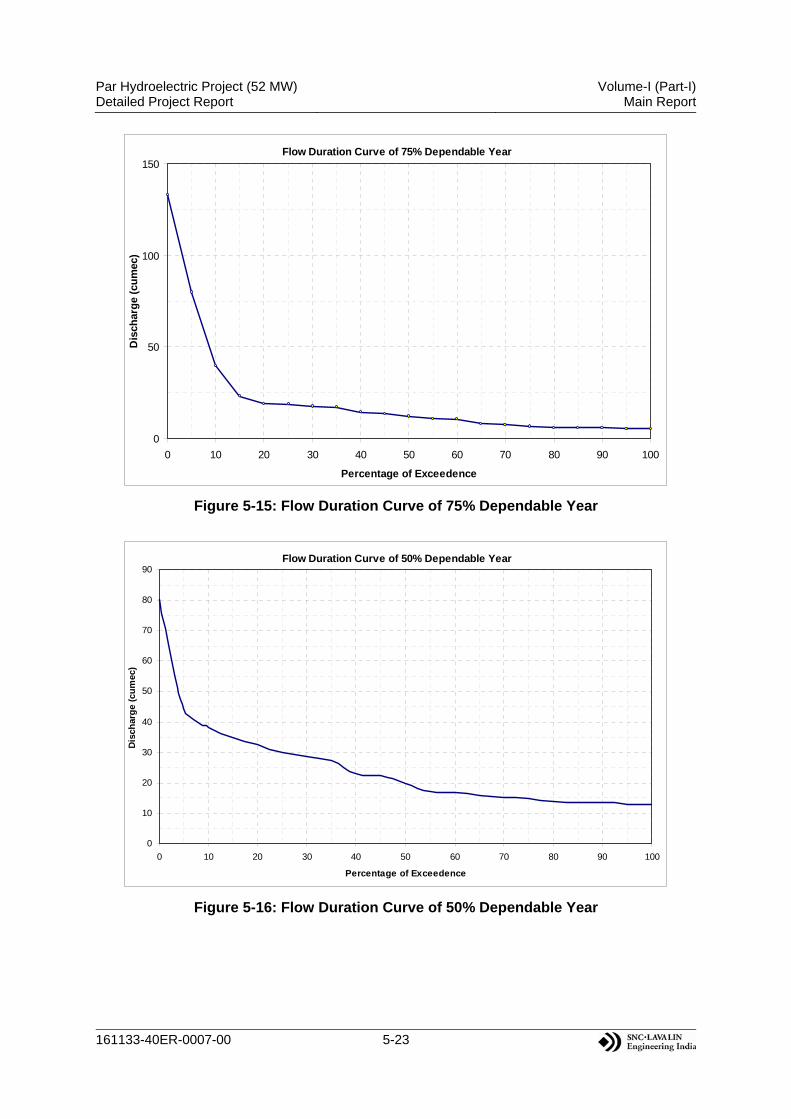
Par Hydroelectric Project (52 MW) Detailed Project Report
Volume-I (Part-I)Main Report
161133-40ER-0007-00 5-23
Flow Duration Curve of 75% Dependable Year
0
50
100
150
0 10 20 30 40 50 60 70 80 90 100
Percentage of Exceedence
Dis
char
ge
(cu
mec
)
Figure 5-15: Flow Duration Curve of 75% Dependable Year
Flow Duration Curve of 50% Dependable Year
0
10
20
30
40
50
60
70
80
90
0 10 20 30 40 50 60 70 80 90 100
Percentage of Exceedence
Dis
char
ge
(cu
mec
)
Figure 5-16: Flow Duration Curve of 50% Dependable Year

Par Hydroelectric Project (52 MW) Detailed Project Report
Volume-I (Part-I)Main Report
161133-40ER-0007-00 5-24
Flow Duration Curve of Observed Data at Par Project Site
0
50
100
150
200
0 10 20 30 40 50 60 70 80 90 100
Percentage of Exceedence
Dis
char
ge
(cu
mec
)
Figure 5-17: Flow Duration Curve of Observed Data at Par G & D Site
5.4 Design Flood and Rating Curves
5.4.1 General
Estimation of design flood is a significant component of hydrological studies. Proper
selection of design flood value is important as an over-estimated value results in increase in
the cost of hydraulic structures, while an under-estimated value will place the structure and
population at risk.
5.4.2 Approaches for Estimation of Design Flood
The following two approaches are commonly used for estimation of design flood:
a. Probabilistic Approach (Flood frequency analysis)
The Probabilistic approach is a common procedure for analysis of flood data at a gauged
location. This approach can also be applied to any type of hydro-meteorological data, but it
is widely used with flood data. Therefore, it is sometimes designated as flood frequency
analysis.

Par Hydroelectric Project (52 MW) Detailed Project Report
Volume-I (Part-I)Main Report
161133-40ER-0007-00 5-25
b. Hydro-meteorological Approach.
The concepts of the Standard Project Flood as also the Probable Maximum Flood are based
on estimating the Standard Project Storm or the Probable Maximum Precipitation, as the
case may be, and then estimating the resulting flood under the assumption that the
catchment conditions are favorable to large runoff.
The Hydro-meteorological approach requires short term rainfall-runoff records along with
physiographic characteristics at the project site and in the upper catchment. This approach is
considered the most rational method for flood estimation. This method, preferably based on
site specific information, is recommended for estimating design flood for intermediate and
large dams, especially when storage has a significant effect on modifying the design flood
hydrograph as it flows through the reservoir. The main advantage of this approach as
compared to the Probabilistic approach is that it gives a complete flood hydrograph and thus
allows making a realistic determination of its moderating effect while passing through a
reservoir or a river reach.
5.4.3 Flood Estimation by Probabilistic Approach
Data Available
Annual Instantaneous flood peaks at the project site is required for determination of different
return period/frequency of floods at the project site. At present there is only one complete
water year (2012-13) data at the Par project site is available. However, long-term annual
flood peaks are available at Hoz G&D site (CA=803.35km2) which is downstream of the
proposed site of Par. Hence, it has been proposed to transpose the flood peaks of Hoz G&D
site to the proposed project site by Dicken’s formula and enhanced it by enhanced by 15%
for instantaneous peak factor. The peaks thus obtained has been subjected to frequency
analysis to derive the different return period floods at the Project site. The formula thus used
for deriving the final flood peaks at Par project site is as follows:
QPar = 1.15* (APar / AHoz G&D) 0.75 * Q Hoz G&D
where,
QPar = Final peak flow at Par
Q Hoz G&D = Observed flood peak at Hoz G&D
APar = Catchment area of Par (=420km2)
A Hoz G&D = Catchment area at Hoz G&D Site

Par Hydroelectric Project (52 MW) Detailed Project Report
Volume-I (Part-I)Main Report
161133-40ER-0007-00 5-26
The details of annual peak flows thus arrived at project site have been given in Table 5-8
below:
Table 5-8: Details of Annual Peak flow at Par
Year Peak Flood at Hoz G&D Site
(cumec)
Peak Flood at Par Site (cumec)
Hoz G&D Site peak transposed to Par (cumec)
Final Inst. Peak at diversion site
(cumec)
1986-87 340.00 - 209.04 240.40
1987-88 341.00 - 209.66 241.11
1988-89 340.00 - 209.04 240.40
1989-90 308.00 - 189.37 217.77
1990-91 555.00 - 341.23 392.42
1991-92 425.00 - 261.30 300.50
1992-93 485.00 - 298.19 342.92
1993-94 761.00 - 467.89 538.07
1994-95 500.00 - 307.42 353.53
1995-96 312.00 - 191.83 220.60
1996-97 592.00 - 363.98 418.58
2005-06 620.76 - 381.66 438.91
2006-07 286.38 - 176.07 202.49
2007-08 226.75 - 139.41 160.32
2012-13 - 269.15 - 309.52
Statistical Parameters
The detail of important statistical parameters for the annual instantaneous flood peaks at the
project site is given in Table 5-9 below.

Par Hydroelectric Project (52 MW) Detailed Project Report
Volume-I (Part-I)Main Report
161133-40ER-0007-00 5-27
Table 5-9: Detailed Statistics for Instantaneous Peak Flow Data
S.No. Parameter Value Log Transformed
Value
1 Mean 307.84 5.68
2 Variance 11079.4 0.114
3 Standard Deviation 105.259 0.337
4 Skewness 0.69779 0.10378
5 Kurtosis -0.10409 -0.72789
Outlier and Randomness Check
A. Outlier Check
Outliers are data points which depart significantly from the trend of the remaining data of the
sample. The high outlier and low outlier tests for the data series has been carried out as
follows:
High outlier threshold: Qh = exp (Xh)
Low outlier threshold: QL = exp (XL)
Where,
X h= High outlier threshold in log units
X L= Low outlier threshold in log units
X m= Mean of the log transformed series
Sx = Standard deviation of the log transformed series
Kn = Outliers test K values for 10 % significance level for a Normal distribution.
The data series will have no outlier if,
Qh > Maximum of Observed Series
Ql < Minimum of Observed Series
Using the above equations, the high outlier and low outlier tests have been carried out, the
details of which are given in the following Table 5-10.
xnmh SKXX
xnmL SKXX

Par Hydroelectric Project (52 MW) Detailed Project Report
Volume-I (Part-I)Main Report
161133-40ER-0007-00 5-28
Table 5-10: Outlier Test for Annual Peak Flow
Parameters Value
Mean(Xm) 5.68
SD (Sx) 0.337
Variance 0.114
Skewness 0.10378
Kurtosis -0.72789
No. of Data 15
Kn 2.247
High outlier threshold Xh 622.96
Low outlier threshold Xl 136.75
Maximum Value 538.07
Minimum Value 160.32
Check on High Outlier OK
Check on Low Outlier OK
From the above table it is seen that there is no outlier in the flood peak values.
B. Randomness Check
The sequence and chance of a variable occurring in a probabilistic process is assumed to
follow a definite probability distribution in which the variables are considered to be purely
random. In a random process, the value of the variate does not depend on the previous or
the next value i.e., all the values occur purely by chance.
For the present project, the randomness has been checked based on the number of peaks
and troughs in the data series.
The randomness check has been performed as follows:
þ =
If, þ < 1.96, the series is random at 5% significance level.
where,
P = number of turning points i.e., total number of peaks and troughs in the series = 9
)var(
)(
p
pEP

Par Hydroelectric Project (52 MW) Detailed Project Report
Volume-I (Part-I)Main Report
161133-40ER-0007-00 5-29
E (p) = 2/3(N-2) =8.67
Var(p) = (16N-29)/90 = 2.34
N= no. of data points = 15
Hence, þ = 0.22
The þ value is less than 1.96 and hence it can be inferred that the data series are
independent of one another and the variables does not depend on previous or next value.
Flood Frequency Analysis
The flood frequency analysis has been carried out in order to estimate the flood of the
different return periods by method of moments (MOM) adopting following distributions:
(i) Gumbel Distribution
(ii) Log Normal Distribution
(iii) Log Pearson Type III Distribution
The flood peak values for different return periods as arrived by using the above distribution is
given in Table 5-11 below:
Table 5-11: Return Period Flood
S.No. Return Period
(Years)
Flood Peak (cumec)
Log-Normal Log-Pearson III Gumbel
1 25 527 533 585
2 50 584 595 657
3 100 640 656 729
4 500 771 804 896
The result of the flood frequency analysis has been shown graphically in Figure 5-18 below:

Par Hydroelectric Project (52 MW) Detailed Project Report
Volume-I (Part-I)Main Report
161133-40ER-0007-00 5-30
0
200
400
600
800
1000
1200
0.0010.0100.1001.000
Probability
Flo
w (
m3 /s
)
1 10 100 1000
Return Period
Observed Data Points
Log Normal
Log Pearson Type-III
Gumbel Prob. Distribution
Lower Confidence Limit
Upper Confidence Limit
Figure 5-18: Plot of Flood Frequency Analysis
5.4.4 Flood Estimation by Hydro-meteorological Approach
The hydro-meteorological approach has been found to be a useful tool in the design flood
studies. This method is based on site specific information. The concepts of the design flood
are based on estimating the design storm, and then estimating the resulting flood under the
assumption that the catchment conditions are favorable to large runoff.
In the absence of site specific short interval rainfall-runoff records, the procedure for
estimation of unit hydrograph given in “Flood Estimation Report for North Brahmaputra,
subzone 2(a), Central Water Commission, 1991” is adopted.
Physiographic Parameters of the Catchment
A. Catchment Area (A)
The project catchment area is 420km2, derived by delineating the relevant toposheets.
B. Parameters of the Main Stream (L & Lc)
River length (L) implies the longest length of the main river from the farthest watershed
boundary of rain-fed catchment to the downstream boundary point, whereas Lc is defined as
the length of the longest main stream from a point opposite to centroid of the catchment area
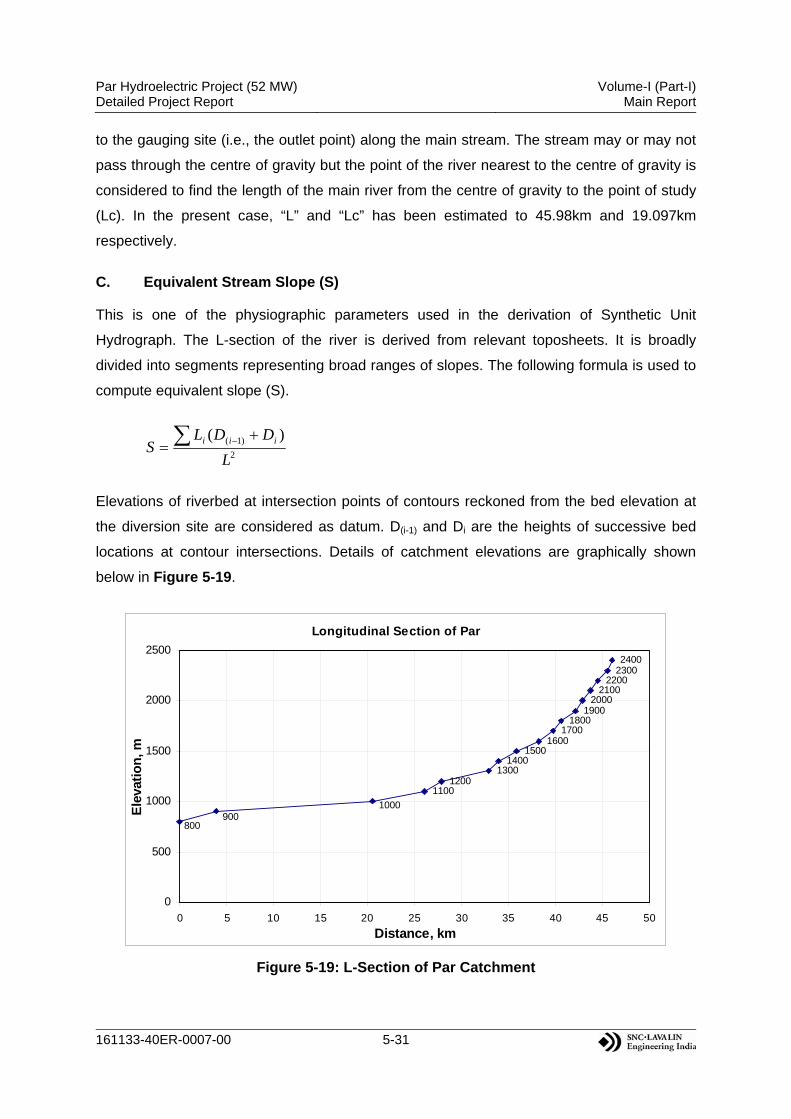
Par Hydroelectric Project (52 MW) Detailed Project Report
Volume-I (Part-I)Main Report
161133-40ER-0007-00 5-31
to the gauging site (i.e., the outlet point) along the main stream. The stream may or may not
pass through the centre of gravity but the point of the river nearest to the centre of gravity is
considered to find the length of the main river from the centre of gravity to the point of study
(Lc). In the present case, “L” and “Lc” has been estimated to 45.98km and 19.097km
respectively.
C. Equivalent Stream Slope (S)
This is one of the physiographic parameters used in the derivation of Synthetic Unit
Hydrograph. The L-section of the river is derived from relevant toposheets. It is broadly
divided into segments representing broad ranges of slopes. The following formula is used to
compute equivalent slope (S).
2
)1( )(
L
DDLS iii
Elevations of riverbed at intersection points of contours reckoned from the bed elevation at
the diversion site are considered as datum. D(i-1) and Di are the heights of successive bed
locations at contour intersections. Details of catchment elevations are graphically shown
below in Figure 5-19.
Longitudinal Section of Par
11001200
13001400
15001600
17001800
19002000
21002200
23002400
1000
800900
0
500
1000
1500
2000
2500
0 5 10 15 20 25 30 35 40 45 50
Distance, km
Ele
vati
on
, m
Figure 5-19: L-Section of Par Catchment

Par Hydroelectric Project (52 MW) Detailed Project Report
Volume-I (Part-I)Main Report
161133-40ER-0007-00 5-32
The computation of equivalent slope is given in Table 5-12. The equivalent slope as
computed for the catchment is 27.09m/km.
Table 5-12: Computation of Equivalent Slope
Distance from Outlet(km)
Elevation (m)
Distance between twoconsequtive points (L), km
Elevation from site (Di), m
Di+Di-1 L*( Di+Di-1)
0.00 800 0.00 200 200 0.003.92 900.00 3.92 300 500 1960.50
20.49 1000.00 16.57 400 700 11599.0026.01 1100.00 5.52 500 900 4968.0027.84 1200.00 1.83 600 1100 2013.0032.88 1300.00 5.04 700 1300 6546.8033.89 1400.00 1.01 800 1500 1521.0035.88 1500.00 1.99 900 1700 3379.6038.20 1600.00 2.32 1000 1900 4413.7039.72 1700.00 1.52 1100 2100 3185.7040.62 1800.00 0.91 1200 2300 2081.5042.13 1900.00 1.51 1300 2500 3770.0042.87 2000.00 0.74 1400 2700 1987.2043.73 2100.00 0.87 1500 2900 2508.5044.53 2200.00 0.79 1600 3100 2458.3045.53 2300.00 1.00 1700 3300 3300.0045.98 2400.00 0.45 1800 3500 1585.50
57278.30Equivalent slope = 27.09m/km
Derivation of Unit Hydrograph
The Central Water Commission (CWC) in association with India Meteorological Department
(IMD), Ministry of Railway and Ministry of Surface Transport has prepared flood estimation
reports for small & medium rainfed catchments for efficient hydro-meteorological
homogenous sub-zones. These reports illustrate the procedure for derivation of synthetic
unit hydrograph based on physiographic parameters. The unit hydrograph for the rainfed
catchment area of the project have been derived as per procedure and guidelines given in
the regional flood report of sub zone 2a.
The detail parameters of a synthetic unit hydrograph (SUH) are described in Figure 5-20
below for understanding the important inputs of design flood computations.
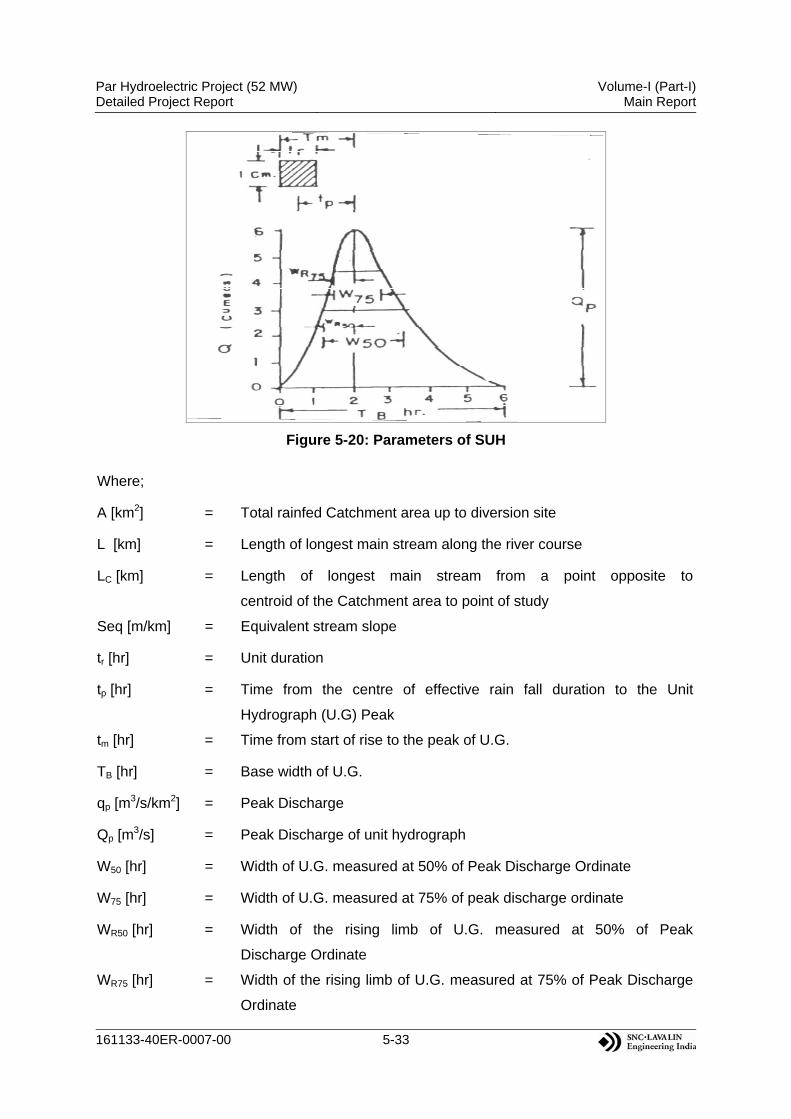
Par Hydroelectric Project (52 MW) Detailed Project Report
Volume-I (Part-I)Main Report
161133-40ER-0007-00 5-33
Figure 5-20: Parameters of SUH
Where;
A [km2] = Total rainfed Catchment area up to diversion site
L [km] = Length of longest main stream along the river course
LC [km] = Length of longest main stream from a point opposite to
centroid of the Catchment area to point of study
Seq [m/km] = Equivalent stream slope
tr [hr] = Unit duration
tp [hr] = Time from the centre of effective rain fall duration to the Unit
Hydrograph (U.G) Peak
tm [hr] = Time from start of rise to the peak of U.G.
TB [hr] = Base width of U.G.
qp [m3/s/km2] = Peak Discharge
Qp [m3/s] = Peak Discharge of unit hydrograph
W50 [hr] = Width of U.G. measured at 50% of Peak Discharge Ordinate
W75 [hr] = Width of U.G. measured at 75% of peak discharge ordinate
WR50 [hr] = Width of the rising limb of U.G. measured at 50% of Peak
Discharge Ordinate
WR75 [hr] = Width of the rising limb of U.G. measured at 75% of Peak Discharge
Ordinate
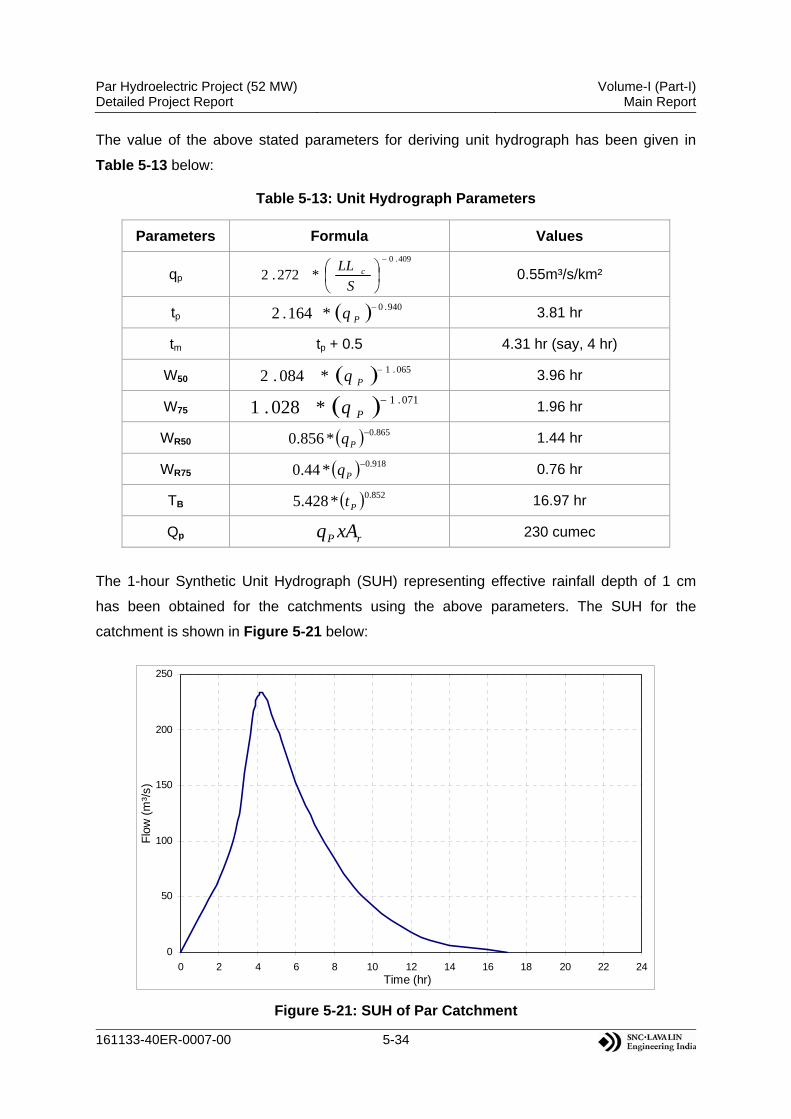
Par Hydroelectric Project (52 MW) Detailed Project Report
Volume-I (Part-I)Main Report
161133-40ER-0007-00 5-34
The value of the above stated parameters for deriving unit hydrograph has been given in
Table 5-13 below:
Table 5-13: Unit Hydrograph Parameters
Parameters Formula Values
qp 409.0
*272.2
S
LL c 0.55m³/s/km²
tp 940.0*164.2 Pq 3.81 hr
tm tp + 0.5 4.31 hr (say, 4 hr)
W50 065.1*084.2 Pq 3.96 hr
W75 071.1*028.1 Pq 1.96 hr
WR50 865.0*856.0 Pq 1.44 hr
WR75 918.0*44.0 Pq 0.76 hr
TB 852.0*428.5 Pt 16.97 hr
Qp rP xAq 230 cumec
The 1-hour Synthetic Unit Hydrograph (SUH) representing effective rainfall depth of 1 cm
has been obtained for the catchments using the above parameters. The SUH for the
catchment is shown in Figure 5-21 below:
0
50
100
150
200
250
0 2 4 6 8 10 12 14 16 18 20 22 24Time (hr)
Flo
w (
m³/
s)
Figure 5-21: SUH of Par Catchment

Par Hydroelectric Project (52 MW) Detailed Project Report
Volume-I (Part-I)Main Report
161133-40ER-0007-00 5-35
The important parameters for deciding critical storm duration are size and shape of the
catchment, travel time/base period of unit hydrograph and the direction of the storm
movement with reference to the direction of river flow. For all practical purposes, the UG
base governs the duration of the storm. As can be seen from the above figures, the base
period of unit hydrograph is 16.97 hours. Therefore, design storm of 1 day has been
proposed to be used for the flood estimation.
Design Storm
Design storm studies for the project have been carried out by the India Meteorological
Department (IMD), New Delhi on the basis of the available rainfall data in the area.
The 1-day Standard Project Storm (SPS) and Probable Maximum Precipitation (PMP) values
of the project as provided by IMD are 26.5 cm and 33.1 cm respectively. The 1-day design
storm values are enhanced by 15% (as recommended by IMD) to convert them into any
24-hour value. The 24-hour SPS and PMP values for the project have been estimated to
30.475cm and 38.065 cm respectively. The temporal distribution of the design storm as
provided by IMD is given Table 5-14. A copy of the values supplied by IMD along with its
temporal distribution in graphical form has also been enclosed as Annexure 5-3.
The design storm values for the 50-year and 100-year return period has been adopted from
the “Atlas of Generalised Isopluvial Maps of Eastern India (Part-II)”, Published by IMD, New
Delhi. Accordingly, the 24-hour 50-year and 100-year return period design storm values has
been taken as 280mm and 320mm respectively. These point storm values has been
converted to areal by applying a correction factor of 0.866 for 420km2 as per report of
subzone-2a. Accordingly, 24-hour 50 and 100-year areal design storm value for the project
has been computed to 24.25 cm and 27.72 cm respectively.
Table 5-14: Temporal Distribution of 24-hour Design Storm
Duration (hrs) 24-hour (%)
0 0
3 41
6 57
9 68
12 78
15 85
18 91
21 96
24 100
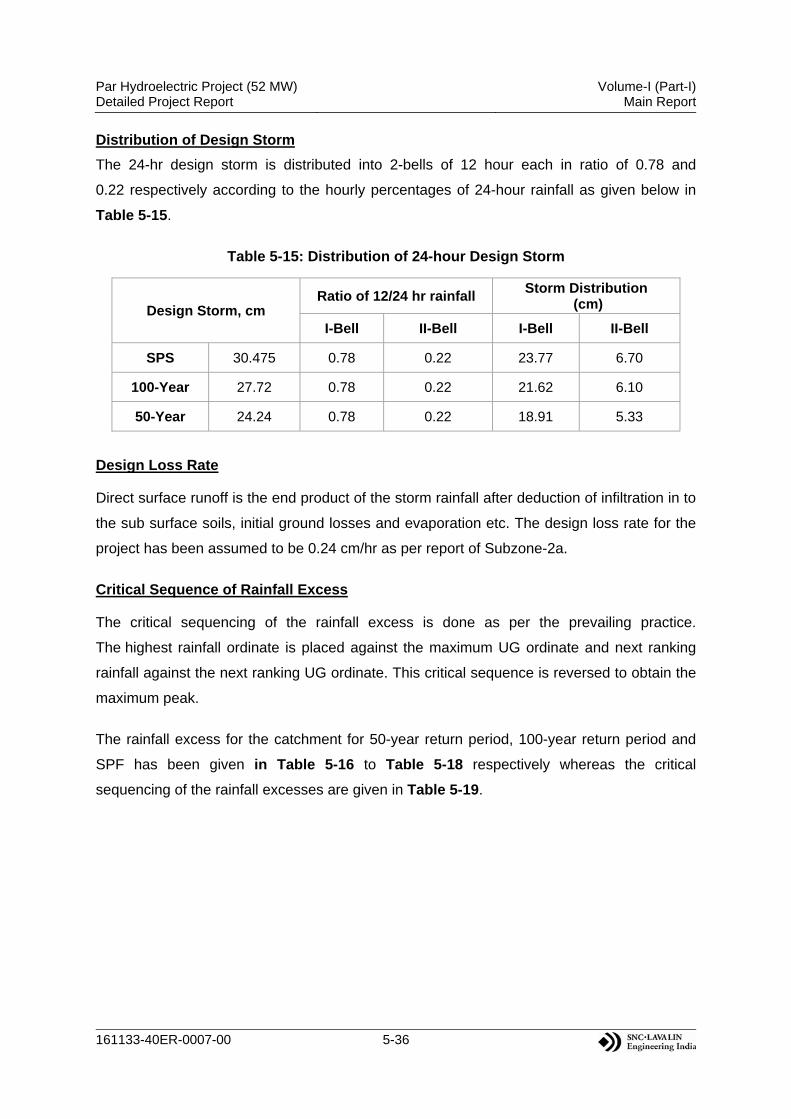
Par Hydroelectric Project (52 MW) Detailed Project Report
Volume-I (Part-I)Main Report
161133-40ER-0007-00 5-36
Distribution of Design Storm
The 24-hr design storm is distributed into 2-bells of 12 hour each in ratio of 0.78 and
0.22 respectively according to the hourly percentages of 24-hour rainfall as given below in
Table 5-15.
Table 5-15: Distribution of 24-hour Design Storm
Design Storm, cm Ratio of 12/24 hr rainfall
Storm Distribution (cm)
I-Bell II-Bell I-Bell II-Bell
SPS 30.475 0.78 0.22 23.77 6.70
100-Year 27.72 0.78 0.22 21.62 6.10
50-Year 24.24 0.78 0.22 18.91 5.33
Design Loss Rate
Direct surface runoff is the end product of the storm rainfall after deduction of infiltration in to
the sub surface soils, initial ground losses and evaporation etc. The design loss rate for the
project has been assumed to be 0.24 cm/hr as per report of Subzone-2a.
Critical Sequence of Rainfall Excess
The critical sequencing of the rainfall excess is done as per the prevailing practice.
The highest rainfall ordinate is placed against the maximum UG ordinate and next ranking
rainfall against the next ranking UG ordinate. This critical sequence is reversed to obtain the
maximum peak.
The rainfall excess for the catchment for 50-year return period, 100-year return period and
SPF has been given in Table 5-16 to Table 5-18 respectively whereas the critical
sequencing of the rainfall excesses are given in Table 5-19.

Par Hydroelectric Project (52 MW) Detailed Project Report
Volume-I (Part-I)Main Report
161133-40ER-0007-00 5-37
Table 5-16: Rainfall Excesses for 50-Year Return Period
Distribution coefficient
Cumulative Rainfall
Rainfall increment
Rainfall excess incremental
Cumulative Rainfall
Rainfall increment
Rainfall excess incremental
(cm) (cm) (cm) (cm) (cm) (cm)1 0.231 4.36 4.36 4.125 1.23 1.23 0.9912 0.397 7.52 3.15 2.912 2.12 0.89 0.6493 0.526 9.94 2.42 2.185 2.80 0.68 0.4444 0.603 11.40 1.45 1.215 3.21 0.41 0.1705 0.667 12.61 1.21 0.972 3.56 0.34 0.1026 0.731 13.82 1.21 0.972 3.90 0.34 0.1027 0.778 14.71 0.89 0.649 4.15 0.25 0.0118 0.825 15.60 0.89 0.649 4.40 0.25 0.0119 0.872 16.49 0.89 0.649 4.65 0.25 0.011
10 0.915 17.30 0.81 0.568 4.88 0.23 0.00011 0.957 18.11 0.81 0.568 5.11 0.23 0.00012 1.000 18.91 0.81 0.568 5.33 0.23 0.000
Time
I-Bell II-Bell
Table 5-17: Rainfall Excesses for 100-Year Return Period
Distribution coefficient
Cumulative Rainfall
Rainfall increment
Rainfall excess incremental
Cumulative Rainfall
Rainfall increment
Rainfall excess incremental
(cm) (cm) (cm) (cm) (cm) (cm)1 0.231 4.99 4.99 4.748 1.407 1.407 1.1672 0.397 8.59 3.60 3.363 2.423 1.016 0.7763 0.526 11.36 2.77 2.531 3.205 0.782 0.5424 0.603 13.02 1.66 1.423 3.674 0.469 0.2295 0.667 14.41 1.39 1.146 4.064 0.391 0.1516 0.731 15.80 1.39 1.146 4.455 0.391 0.1517 0.778 16.81 1.02 0.776 4.742 0.287 0.0478 0.825 17.83 1.02 0.776 5.028 0.287 0.0479 0.872 18.84 1.02 0.776 5.315 0.287 0.047
10 0.915 19.77 0.92 0.684 5.576 0.261 0.02111 0.957 20.69 0.92 0.684 5.836 0.261 0.02112 1.000 21.62 0.92 0.684 6.097 0.261 0.021
Time
I-Bell II-Bell
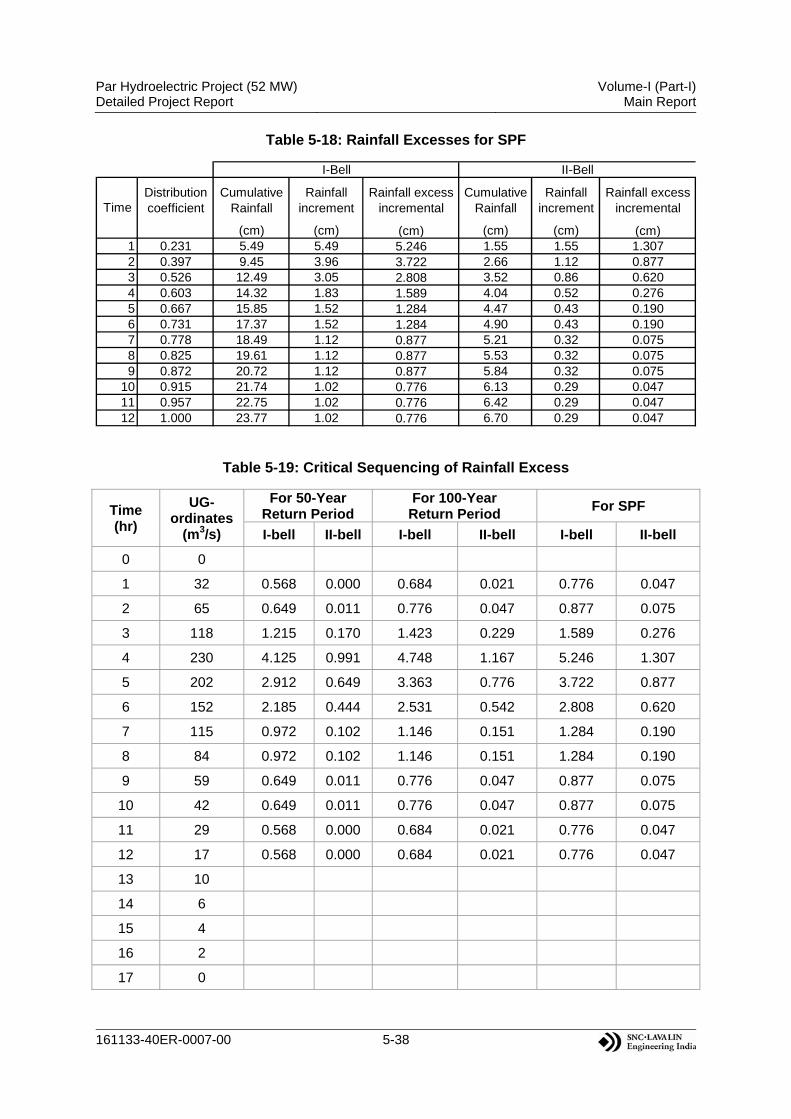
Par Hydroelectric Project (52 MW) Detailed Project Report
Volume-I (Part-I)Main Report
161133-40ER-0007-00 5-38
Table 5-18: Rainfall Excesses for SPF
Distribution coefficient
Cumulative Rainfall
Rainfall increment
Rainfall excess incremental
Cumulative Rainfall
Rainfall increment
Rainfall excess incremental
(cm) (cm) (cm) (cm) (cm) (cm)1 0.231 5.49 5.49 5.246 1.55 1.55 1.3072 0.397 9.45 3.96 3.722 2.66 1.12 0.8773 0.526 12.49 3.05 2.808 3.52 0.86 0.6204 0.603 14.32 1.83 1.589 4.04 0.52 0.2765 0.667 15.85 1.52 1.284 4.47 0.43 0.1906 0.731 17.37 1.52 1.284 4.90 0.43 0.1907 0.778 18.49 1.12 0.877 5.21 0.32 0.0758 0.825 19.61 1.12 0.877 5.53 0.32 0.0759 0.872 20.72 1.12 0.877 5.84 0.32 0.075
10 0.915 21.74 1.02 0.776 6.13 0.29 0.04711 0.957 22.75 1.02 0.776 6.42 0.29 0.04712 1.000 23.77 1.02 0.776 6.70 0.29 0.047
Time
I-Bell II-Bell
Table 5-19: Critical Sequencing of Rainfall Excess
Time (hr)
UG-ordinates
(m3/s)
For 50-Year Return Period
For 100-Year Return Period
For SPF
I-bell II-bell I-bell II-bell I-bell II-bell
0 0
1 32 0.568 0.000 0.684 0.021 0.776 0.047
2 65 0.649 0.011 0.776 0.047 0.877 0.075
3 118 1.215 0.170 1.423 0.229 1.589 0.276
4 230 4.125 0.991 4.748 1.167 5.246 1.307
5 202 2.912 0.649 3.363 0.776 3.722 0.877
6 152 2.185 0.444 2.531 0.542 2.808 0.620
7 115 0.972 0.102 1.146 0.151 1.284 0.190
8 84 0.972 0.102 1.146 0.151 1.284 0.190
9 59 0.649 0.011 0.776 0.047 0.877 0.075
10 42 0.649 0.011 0.776 0.047 0.877 0.075
11 29 0.568 0.000 0.684 0.021 0.776 0.047
12 17 0.568 0.000 0.684 0.021 0.776 0.047
13 10
14 6
15 4
16 2
17 0

Par Hydroelectric Project (52 MW) Detailed Project Report
Volume-I (Part-I)Main Report
161133-40ER-0007-00 5-39
Base flow
The base flow value chosen should be characteristics of the storm season and should
preferably be based on observed flood hydrograph. The base flow for the study has been
assumed @ 0.05 cumec/km2 as specified in the report of subzone-2a. The base flow for the
catchment has been estimated to 21 cumec.
Surface Flow Hydrograph
The Surface Flow Hydrograph has been computed by convoluting 1-hour rainfall excess
increments with the ordinates of the 1-hr Unit Hydrograph. For this purpose, the rainfall
excess increments have been arranged in a critical sequence. Each of the individual
incremental hydrographs has been lagged 1-hour from the previous one in the assumed
critical sequence and added to obtain the surface flow hydrograph.
Flood Hydrograph
The Flood Hydrograph has been obtained by adding a uniform base flow, including
snowmelt, to the ordinates of the surface flow hydrograph. The flood hydrograph for 50-year
return period, 100-year return period and SPF thus obtained has been given in Figure 5-22
to Figure 5-24 respectively. The 50-year return period, 100-year return period flood and
Standard Project flood at the project site has been estimated to be 2382m3/s, 2759m3/s and
3060m3/s respectively.
50 Year Return Period Hydrograph
0
500
1000
1500
2000
2500
0 5 10 15 20 25 30 35 40 45 50
Time (hr)
Dis
char
ge (
cum
ec)
Figure 5-22: 50-Year Return Period Flood Hydrograph

Par Hydroelectric Project (52 MW) Detailed Project Report
Volume-I (Part-I)Main Report
161133-40ER-0007-00 5-40
100 Year Return Period Hydrograph
0
500
1000
1500
2000
2500
3000
0 5 10 15 20 25 30 35 40 45 50
Time (hr)
Dis
char
ge (
cum
ec)
Figure 5-23: 100-Year Return Period Flood Hydrograph
SPF Hydrograph
0
500
1000
1500
2000
2500
3000
3500
0 5 10 15 20 25 30 35 40 45 50
Time (hr)
Dis
char
ge (
cum
ec)
Figure 5-24: Standard Project Flood Hydrograph
The tabulation of 50-year return period, 100-year return period and Standard Project Flood
hydrograph has been given in Table 5-20 below:

Par Hydroelectric Project (52 MW) Detailed Project Report
Volume-I (Part-I)Main Report
161133-40ER-0007-00 5-41
Table 5-20: 50 and 100-Year Return Period flood and SPF Hydrograph Values
Hours
50-Year RP Flood Values (m3/s)
100-Year RP Flood
Values (m3/s)
SP Flood Values (m3/s)
Hours
50-Year RP Flood
Values (m3/s)
100-Year RP Flood
Values (m3/s)
SP Flood Values (m3/s)
0 21 21 21 26 1765 2051 2279
1 21 22 22 27 1408 1638 1822
2 21 23 26 28 1043 1213 1350
3 21 26 32 29 747 869 965
4 22 33 44 30 527 612 679
5 26 43 61 31 360 417 463
6 35 59 82 32 235 272 301
7 59 92 120 33 154 176 195
8 110 154 191 34 101 115 126
9 194 253 302 35 67 75 81
10 308 385 448 36 44 48 51
11 417 511 587 37 29 31 32
12 490 595 679 38 25 25 26
13 445 544 624 39 22 22 23
14 386 477 550 40 21 21 21
15 376 463 535 41 21 21 21
16 448 546 626
17 533 645 735
18 623 747 848
19 754 898 1013
20 969 1144 1284
21 1294 1515 1692
22 1716 1998 2223
23 2118 2457 2728
24 2382 2759 3060
25 2142 2484 2756
The convolution of unit hydrograph with rainfall excesses has been given in Annexure 5-4.

Par Hydroelectric Project (52 MW) Detailed Project Report
Volume-I (Part-I)Main Report
161133-40ER-0007-00 5-42
Summary of Project Flood Values
The summary of design flood values as obtained by both hydro-meteorological approach
and Probabilistic approach (adopting Gumbel’s frequency analysis) is shown in Table 5-21
below:
Table 5-21: Summary of Project Design Flood
S.No. Flood Type Flood Value (cumec) Computation Approach
1 25-Year Return Period 585 Probabilistic
2 50-Year Return Period 2382 Hydro-meteorological
657 Probabilistic
3 100-Year Return Period 2759 Hydro-meteorological
729 Probabilistic
4 500-Year Return Period 896 Probabilistic
5 Standard Project Flood 3060 Hydro-meteorological
From the above table it can be seen that there are differences in the flood magnitudes
derived by both approaches. Generally, flood value worked out by hydro-meteorological
approach is preferred over the flood values obtained by frequency approach. Hence, based
on the type and height of the hydraulic structure along with the gross capacity of the
reservoir and the criteria provided in the related IS Code for selecting design flood, the
respective flood value obtained by hydro-meteorological approach may be used for the
design of hydraulic structure.
5.4.5 Design Flood for River Diversion Works
As per IS 14815:2000, the diversion capacity for concrete dam and barrage must be the
higher of the following criteria:
Maximum non-monsoon flow observed at the dam site;
25 years non-monsoon flow, calculated on the basis of non-monsoon yearly peaks.
The non monsoon season for this project has been taken as October to May which can be
used for construction activities at project site. At present there is only one complete water
year (2012-13) data at the Par project site is available. However, non-monsoon flood peaks
are available at Hoz-Dam site (CA = 803.35km2) which is downstream of the proposed site at
Par. Hence, it has been proposed to transpose the flood peaks of Hoz G&D site to the

Par Hydroelectric Project (52 MW) Detailed Project Report
Volume-I (Part-I)Main Report
161133-40ER-0007-00 5-43
proposed project site by Dicken’s formula and enhanced it by enhanced by 15% for
instantaneous peak factor. The peaks thus obtained have been subjected to frequency
analysis to derive the different return period floods at the Project site. The formula thus used
for deriving the final flood peaks at Par project site is as follows:
QPar = 1.15* (APar / AHoz G&D) 0.75 * Q Hoz G&D
where,
QPar = Final peak flow at Par
Q Hoz G&D = Observed flood peak at Hoz G&D
APar = Catchment area of Par (=420km2)
A Hoz G&D = Catchment area at Hoz G&D Site
The details of non-monsoon peak flows thus arrived at project site have been given in Table
5-22 below:
Table 5-22: Details of Non-Monsoon Flood Peaks at Par
Year Peak Flood at Hoz G&D Site
(cumec)
Peak Flood at Par Site (cumec)
Hoz G&D Site peak transposed to Par
(cumec)
Final Inst. Peak at diversion site
(cumec)
1986-87 132.00 - 81.16 93.33
1987-88 198.00 - 121.74 140.00
1988-89 249.00 - 153.09 176.06
1989-90 218.00 - 134.03 154.14
1990-91 485.00 - 298.19 342.92
1991-92 235.00 - 144.49 166.16
1992-93 205.00 - 126.04 144.95
1993-94 600.00 - 368.90 424.24
1994-95 287.00 - 176.46 202.93
1995-96 228.00 - 140.18 161.21
1996-97 228.50 - 140.49 161.56
2005-06 83.77 - 51.51 59.23
2006-07 192.76 - 118.51 136.29
2007-08 149.26 - 91.77 105.53
2012-13 - 113.28 - 130.27

Par Hydroelectric Project (52 MW) Detailed Project Report
Volume-I (Part-I)Main Report
161133-40ER-0007-00 5-44
Statistical Parameters
The detail of important statistical parameters for the annual instantaneous flood peaks at the
project site is given in Table 5-23 below:
Table 5-23: Detailed Statistics
S.No. Parameter Value Log Transformed
Value
1. Mean 173.25 5.04
2. Variance 8747.2 0.224
3. Standard Deviation 93.526 0.473
4. Skewness 1.83520 0.34746
5. Kurtosis 3.46301 1.43995
Outlier and Randomness Check
A. Outlier Check
Outliers are data points which depart significantly from the trend of the remaining data of the
sample. The high outlier and low outlier tests for the data series has been carried out as
follows:
High outlier threshold: Qh = exp (Xh)
Low outlier threshold: QL = exp (XL)
where,
X h= High outlier threshold in log units
X L= Low outlier threshold in log units
X m= Mean of the log transformed series
Sx = Standard deviation of the log transformed series
Kn = Outliers test K values for 10 % significance level for a Normal distribution.
The data series will have no outlier if,
Qh > Maximum of Observed Series
Ql < Minimum of Observed Series
xnmh SKXX
xnmL SKXX

Par Hydroelectric Project (52 MW) Detailed Project Report
Volume-I (Part-I)Main Report
161133-40ER-0007-00 5-45
Using the above equations, the high outlier and low outlier tests have been carried out, the
details of which are given in the Table 5-24 below:
Table 5-24: Outlier Test for Annual Peak Flow
Parameters Value
Mean(Xm) 5.04
SD (Sx) 0.473
Variance 0.224
Skewness 0.34746
Kurtosis 1.43995
No. of Data 15
Kn 2.247
High outlier threshold Xh 449.26
Low outlier threshold Xl 53.60
Maximum Value 424.24
Minimum Value 59.23
Check on High Outlier OK
Check on Low Outlier OK
From the above table it is seen that there is no outlier in the flood peak values.
B. Randomness Check
The sequence and chance of a variable occurring in a probabilistic process is assumed to
follow a definite probability distribution in which the variables are considered to be purely
random. In a random process, the value of the variate does not depend on the previous or
the next value i.e., all the values occur purely by chance.
For the present project, the randomness has been checked based on the number of peaks
and troughs in the data series.
The randomness check has been performed as follows:
þ =
If, þ < 1.96, the series is random at 5% significance level.
)var(
)(
p
pEP

Par Hydroelectric Project (52 MW) Detailed Project Report
Volume-I (Part-I)Main Report
161133-40ER-0007-00 5-46
where,
P = number of turning points i.e., total number of peaks and troughs in the series = 11
E (p) = 2/3(N-2) = 8.67
Var(p) = (16N-29)/90 = 2.34
N= no. of data points = 15
Hence, þ = 1.52
The þ value is less than 1.96 and hence it can be inferred that the data series are
independent of one another and the variables does not depend on previous or next value.
Flood Frequency Analysis
The flood frequency analysis has been carried out in order to estimate the flood of the
different return periods by method of moments (MOM) adopting following distributions:
(i) Gumbel Distribution
(ii) Log Normal Distribution
(iii) Log Pearson Type III Distribution
The results of the analysis is shown in Table 5-25 and subsequent Figure 5-25 below:
Table 5-25: 25 Year Non-Monsoon Return Period Flood at Hoz
S.No. Distribution Estimated Observed
1 Log Pearson Type-III 375
424.24 2 Log-Normal 355
3 Gumbel 419
The result of the flood frequency analysis has been shown graphically in the figure below:
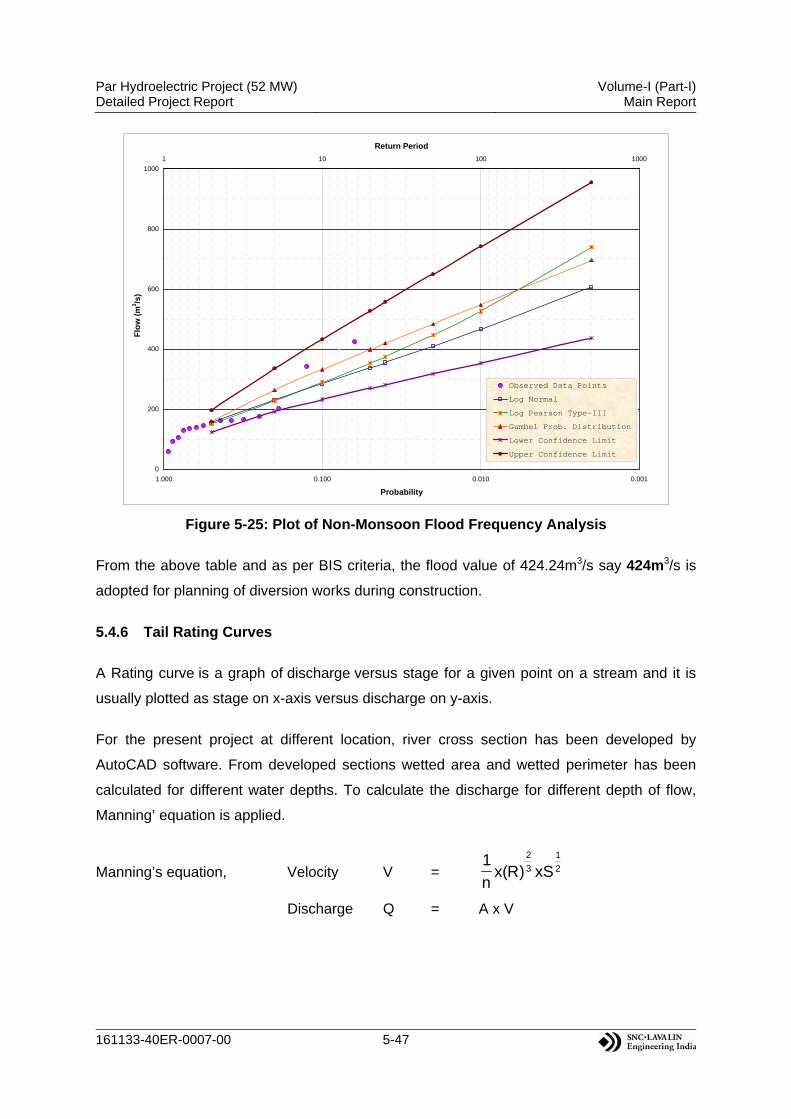
Par Hydroelectric Project (52 MW) Detailed Project Report
Volume-I (Part-I)Main Report
161133-40ER-0007-00 5-47
0
200
400
600
800
1000
0.0010.0100.1001.000
Probability
Flo
w (
m3 /s
)
1 10 100 1000
Return Period
Observed Data Points
Log Normal
Log Pearson Type-III
Gumbel Prob. Distribution
Lower Confidence Limit
Upper Confidence Limit
Figure 5-25: Plot of Non-Monsoon Flood Frequency Analysis
From the above table and as per BIS criteria, the flood value of 424.24m3/s say 424m3/s is
adopted for planning of diversion works during construction.
5.4.6 Tail Rating Curves
A Rating curve is a graph of discharge versus stage for a given point on a stream and it is
usually plotted as stage on x-axis versus discharge on y-axis.
For the present project at different location, river cross section has been developed by
AutoCAD software. From developed sections wetted area and wetted perimeter has been
calculated for different water depths. To calculate the discharge for different depth of flow,
Manning’ equation is applied.
Manning’s equation, Velocity V = 2
1
3
2
xS)R(xn
1
Discharge Q = A x V

Par Hydroelectric Project (52 MW) Detailed Project Report
Volume-I (Part-I)Main Report
161133-40ER-0007-00 5-48
Tail Rating Curve at Spillway Location
Average river slope at barrage location = 1 in 56
Manning’s roughness coefficient (By Golubtsov Equation)
n = 0.222 x (So)0.33
n = 0.222 x (1/56)0.33
n = 0.058
Considering the actual river condition at project site, it is proposed to consider the Manning’s
roughness coefficient as 0.05.
A. Stage Discharge Curve at 50m Downstream of Barrage Axis
Table 5-26: Stage Discharge Computation at 50m Downstream of Barrage Axis
Elevation Area (A) Perimeter
(P) Depth of flow (h)
Hydraulic Radius (R)
Velocity (V)
Discharge (Q)
m m2 m m m m/sec m3/sec
823.35 0.00 0.00 0.00 0.000 0.00 0
823.50 0.21 2.80 0.15 0.076 0.48 0.10
824.00 8.90 35.31 0.65 0.252 1.07 9
824.50 27.47 39.36 1.15 0.698 2.10 58
825.00 47.99 43.39 1.65 1.106 2.86 137
825.50 70.45 47.39 2.15 1.487 3.48 245
826.00 94.82 51.38 2.65 1.846 4.02 381
826.50 120.85 54.48 3.15 2.218 4.55 549
827.00 148.28 57.71 3.65 2.569 5.01 743
827.50 177.27 61.23 4.15 2.895 5.43 962
828.00 207.87 64.75 4.65 3.210 5.82 1209
828.50 239.84 67.30 5.15 3.564 6.24 1495
829.00 272.96 70.18 5.65 3.889 6.61 1804
829.50 307.44 73.25 6.15 4.197 6.95 2138
830.00 343.28 76.33 6.65 4.497 7.28 2500
830.50 380.40 79.00 7.15 4.815 7.62 2899
831.00 418.69 81.67 7.65 5.127 7.95 3327
831.50 458.15 84.49 8.15 5.423 8.25 3779
832.00 498.92 87.46 8.65 5.705 8.53 4257
832.50 540.97 90.35 9.15 5.988 8.81 4767

Par Hydroelectric Project (52 MW) Detailed Project Report
Volume-I (Part-I)Main Report
161133-40ER-0007-00 5-49
Stage Discharge Curve (50m D/s of Barrage)
822.00
824.00
826.00
828.00
830.00
832.00
834.00
0 1000 2000 3000 4000 5000 6000
Discharge (cumec)
Ele
vati
on
(m
)
Figure 5-26: Stage Discharge Curve at 50m Downstream of Barrage Axis
B. Stage Discharge Curve at 100m Downstream of Barrage Axis
Table 5-27: Stage Discharge Computation at 100m Downstream of Barrage Axis
Elevation Area (A)
Perimeter (P)
Depth of flow (h)
Hydraulic Radius (R)
Velocity (V) Discharge
(Q) m m2 m m m m/sec m3/sec
822.50 4.78 20.20 1.00 0.00 0 0 823.00 15.97 25.27 1.50 0.632 1.968 31 823.50 29.38 29.01 2.00 1.013 2.695 79 824.00 44.51 32.29 2.50 1.378 3.310 147 824.50 60.70 34.06 3.00 1.782 3.929 238 825.00 77.59 35.82 3.50 2.166 4.474 347 825.50 95.18 37.59 4.00 2.532 4.965 473 826.00 113.46 39.35 4.50 2.884 5.415 614 826.50 134.02 47.22 5.00 2.838 5.357 718 827.00 158.41 54.87 5.50 2.887 5.419 858 827.50 186.50 62.35 6.00 2.991 5.548 1035 828.00 218.47 73.40 6.50 2.976 5.530 1208 828.50 255.51 80.16 7.00 3.188 5.789 1479 829.00 295.77 86.52 7.50 3.419 6.065 1794 829.50 339.02 92.65 8.00 3.659 6.346 2151 830.00 385.24 98.79 8.50 3.900 6.622 2551 830.50 433.92 102.86 9.00 4.218 6.978 3028 831.00 484.45 106.48 9.50 4.550 7.338 3555 831.50 536.64 109.98 10.00 4.879 7.689 4126 832.00 590.43 113.47 10.50 5.204 8.025 4738 832.50 645.56 115.68 11.00 5.580 8.408 5428

Par Hydroelectric Project (52 MW) Detailed Project Report
Volume-I (Part-I)Main Report
161133-40ER-0007-00 5-50
Stage Discharge Curve (100m D/s of Barrage)
822.00
824.00
826.00
828.00
830.00
832.00
834.00
0 1000 2000 3000 4000 5000 6000
Discharge (cumec)
Ele
vati
on
(m
)
Figure 5-27: Stage Discharge Curve at 100m Downstream of Barrage Axis
Tail Rating Curve at Tailrace Location
Average river slope at barrage location = 1 in 50
Manning’s roughness coefficient (By Golubtsov Equation)
n = 0.222 x (So)0.33
n = 0.222 x (1/50)0.33
n = 0.060
Considering the actual river condition at project site, it is proposed to consider the Manning’s
roughness coefficient as 0.05.
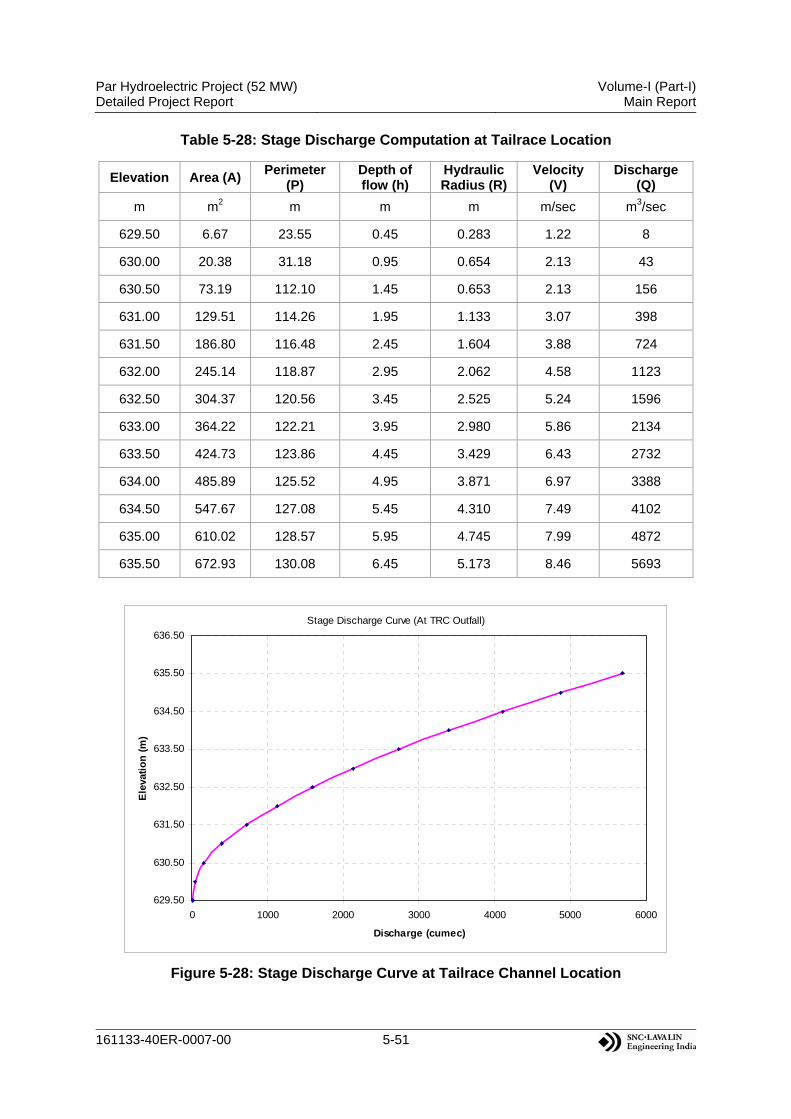
Par Hydroelectric Project (52 MW) Detailed Project Report
Volume-I (Part-I)Main Report
161133-40ER-0007-00 5-51
Table 5-28: Stage Discharge Computation at Tailrace Location
Elevation Area (A) Perimeter
(P) Depth of flow (h)
Hydraulic Radius (R)
Velocity (V)
Discharge (Q)
m m2 m m m m/sec m3/sec
629.50 6.67 23.55 0.45 0.283 1.22 8
630.00 20.38 31.18 0.95 0.654 2.13 43
630.50 73.19 112.10 1.45 0.653 2.13 156
631.00 129.51 114.26 1.95 1.133 3.07 398
631.50 186.80 116.48 2.45 1.604 3.88 724
632.00 245.14 118.87 2.95 2.062 4.58 1123
632.50 304.37 120.56 3.45 2.525 5.24 1596
633.00 364.22 122.21 3.95 2.980 5.86 2134
633.50 424.73 123.86 4.45 3.429 6.43 2732
634.00 485.89 125.52 4.95 3.871 6.97 3388
634.50 547.67 127.08 5.45 4.310 7.49 4102
635.00 610.02 128.57 5.95 4.745 7.99 4872
635.50 672.93 130.08 6.45 5.173 8.46 5693
Stage Discharge Curve (At TRC Outfall)
629.50
630.50
631.50
632.50
633.50
634.50
635.50
636.50
0 1000 2000 3000 4000 5000 6000
Discharge (cumec)
Ele
vati
on
(m
)
Figure 5-28: Stage Discharge Curve at Tailrace Channel Location

Par Hydroelectric Project (52 MW) Detailed Project Report
Volume-I (Part-I)Main Report
161133-40ER-0007-00 5-52
5.5 Sedimentation Study
The sedimentation studies for “run-of–the-river” scheme is generally not warranted as no
large storage is planned behind the structure i.e., the ratio of storage vs. mean annual inflow
at the site is negligible. The gross storage at FRL is about 1.17 MCM (refer section
Reservoir Elevation-Area-Capacity) and the mean annual inflow is 770.5 MCM. Thus the
ratio is only 0.0015.
Further, the spillway crest level is kept at riverbed and accumulated sediment infront of
intake will be flushed out by gate opening. The intake crest is kept sufficiently above the
riverbed to withdraw relatively clear water from reservoir. To remove the particles of 0.2mm
and above, desilting basins are provided. Suspended particles entered through intake will be
settled down in surface desilting basin. Hence, sedimentation study is not required for
Par hydroelectric project.
5.5.1 Reservoir Elevation-Area-Capacity
The reservoir elevation-area-capacity curves have been prepared from the contour map of
the reservoirs. The area enclosed within the contours has been evaluated using AutoCAD.
The volume between any two elevations is calculated using the cone formula:
2121*3 AAAAHV
Where,
V = Volume between two contours
H = Contour interval
A1 = Area at level of first contour
A2 = Area at level of second contour

Par Hydroelectric Project (52 MW) Detailed Project Report
Volume-I (Part-I)Main Report
161133-40ER-0007-00 5-53
Table 5-29: Area-Capacity Value
Elevation (m)
Area (Sqm)
Area (Hect.)
Volume (m3)
Cumulative Volume (m3)
Cumulative Volume (MCM)
824 0.00 0.00 0 0 0.00
826 6488.68 0.65 4326 4326 0.00
828 12611.98 1.26 18765 23090 0.02
830 17807.96 1.78 30271 53361 0.05
832 25280.54 2.53 42871 96232 0.10
834 34216.91 3.42 59272 155505 0.16
836 42620.05 4.26 76683 232188 0.23
838 53167.52 5.32 95593 327781 0.33
840 62676.41 6.27 115714 443495 0.44
842 71557.53 7.16 134136 577631 0.58
844 85589.04 8.56 156937 734568 0.73
845 94439.47 9.44 89978 824546 0.82
846 103289.91 10.33 98832 923378 0.92
848 144353.02 14.44 246500 1169878 1.17
850 196840.12 19.68 339839 1509717 1.51
Figure 5-29: Elevation-Area-Capacity Curve
Par Hydroelectric Project (52 MW) Detailed Project Report
Volume-I (Part-I)Main Report
161133-40ER-0007-00 5-54
5.6 References
1. Bureau of Indian Standards, Indian Standard No. IS 11223-1985, “Guidelines for
Fixing Spillway Capacity”.
2. Bureau of Indian Standards, Indian Standard No. IS 14815-2000, “Design Flood for
River Diversion Works – Guidelines”.
3. Flood Estimation Report for North Brahmaputra Basin-Subzone 2(a), Hydrology
Directorate, CWC, New Delhi, 1991.
4. Manual on Estimation of Design Flood, CWC, New Delhi, March-2001.
5. Guide to Hydrological Practices, “WMO No-168”, 5th Edition, 1994.
6. Pre Feasibility Report-Par Hydroelectric Project, KVK Energy and Infrastructure Pvt.
Ltd.

Par Hydroelectric Project (52 MW) Detailed Project Report
Volume-I (Part-I)Main Report
161133-40ER-0007-00
Annexure 5-1 Rainfall Data

Par Hydroelectric Project (52 MW)Detailed Project Report
Volume-I (Part-I)Main Report
Annexure 5-1
Date Aug sept oct Nov Dec Jan Feb Mar Apr May June July Aug sept oct Nov Dec Jan Feb Mar Apr May June July Aug sept oct Nov Dec Jan Feb Mar Apr May June July Aug sept oct Nov Dec Jan Feb Mar
1 0.00 5.21 3.81 0.00 0.00 0.00 0.00 0.00 4.57 7.37 0.00 28.96 0.00 0.00 32.00 0.00 0.00 3.81 0.00 0.00 34.54 0.00 1.27 17.53 22.86 9.91 22.35 0.00 0.00 0.00 0.00 7.37 5.59 0.00 60.71 10.67 5.84 33.27 0.00 0.00 0.00 0.00 2.54 9.65
2 3.81 12.83 15.75 0.00 0.00 0.00 0.00 0.00 5.08 22.61 0.00 18.80 43.18 0.00 36.83 0.00 0.00 3.05 0.00 0.00 17.02 2.29 7.11 15.24 19.56 28.96 30.48 0.00 0.00 0.00 0.00 0.00 0.00 0.00 15.75 3.30 1.78 32.00 0.00 0.00 0.00 0.00 2.29 17.27
3 0.00 19.05 9.40 0.00 0.00 3.81 0.00 0.00 3.81 5.33 7.62 9.14 0.00 0.00 5.84 0.00 0.00 1.27 0.00 3.05 6.60 5.84 0.00 11.68 8.89 7.11 16.00 0.00 0.00 0.00 3.05 0.00 3.81 2.79 29.46 1.52 0.51 74.42 0.00 0.00 0.00 0.00 0.00 16.51
4 0.00 9.53 22.10 3.81 0.00 0.00 0.00 9.91 3.30 0.00 3.05 6.86 0.00 0.00 0.00 0.00 0.00 0.00 0.00 6.35 4.06 4.57 2.79 34.29 0.00 36.83 3.05 0.00 0.00 0.00 0.00 0.00 0.00 0.00 44.45 0.00 8.89 18.29 0.00 0.00 0.00 0.00 0.00 8.38
5 0.00 13.21 14.73 17.02 0.00 0.00 0.00 1.52 6.10 0.00 54.61 28.96 0.00 0.00 0.00 0.00 0.00 0.00 0.00 1.52 0.00 0.00 26.16 10.16 0.00 5.59 10.16 1.78 0.00 0.00 0.00 2.54 0.00 0.00 10.16 28.45 81.53 21.59 0.00 0.00 0.00 0.00 0.00 9.40
6 0.00 1.40 10.92 0.00 0.00 0.00 0.00 0.00 4.83 0.00 0.00 3.05 0.00 0.00 0.00 0.00 0.00 0.00 27.43 4.06 0.00 0.00 33.78 58.17 4.57 42.67 23.88 10.69 0.00 0.00 1.27 3.30 0.00 0.00 9.40 48.01 35.31 0.00 0.00 0.00 0.00 0.00 0.00 13.97
7 0.00 0.00 9.91 0.00 0.00 0.00 0.00 0.00 0.00 0.00 0.00 7.37 0.00 0.00 0.00 0.00 0.00 0.00 6.60 0.00 0.00 0.00 24.89 26.67 3.81 2.29 7.11 7.37 0.00 0.00 4.06 4.06 1.02 16.25 3.81 19.56 70.36 4.57 0.00 0.00 0.00 0.00 3.56 12.70
8 9.14 17.78 7.24 0.00 0.00 0.00 0.00 0.00 0.00 0.00 43.18 22.10 45.47 0.00 0.00 0.00 0.00 0.00 8.12 0.00 15.75 12.45 17.02 30.99 6.86 15.24 0.00 3.81 0.00 0.00 0.00 0.00 8.13 23.60 30.99 31.50 4.83 7.37 0.00 0.00 0.00 0.00 0.00 6.10
9 0.00 16.64 12.70 0.00 16.51 0.00 0.00 0.00 3.81 0.00 4.57 29.97 11.18 0.00 0.00 0.00 0.00 0.00 0.00 0.00 0.00 0.00 30.48 24.64 2.29 28.70 15.49 0.00 1.27 0.00 0.00 0.00 4.57 4.06 0.00 49.53 0.00 13.97 0.00 0.00 0.00 0.00 0.00 Nil
10 0.00 19.05 0.00 0.00 0.00 0.00 0.00 18.54 5.33 0.00 2.29 19.30 77.47 0.00 0.00 0.00 0.00 0.00 0.00 0.00 0.00 0.00 10.67 28.96 44.70 26.67 48.01 0.00 3.56 0.00 0.00 2.29 8.89 73.15 8.89 27.43 7.11 2.54 0.00 0.00 0.00 0.00 0.00 Nil
11 0.00 15.75 6.99 0.00 0.00 16.51 0.00 9.65 4.06 24.13 15.75 17.78 53.34 0.00 0.00 0.00 0.00 0.00 1.27 8.12 0.00 0.00 7.62 3.81 11.43 0.00 43.18 0.00 0.00 0.00 0.00 2.79 0.00 17.78 5.84 61.47 7.87 2.03 0.00 0.00 0.00 7.87 0.00 Nil
12 0.00 6.86 9.78 0.00 0.00 11.43 0.00 0.00 16.76 0.00 9.14 29.46 0.00 5.08 0.00 17.27 0.00 0.00 5.59 3.81 0.00 0.00 45.46 33.53 0.00 0.00 6.35 0.00 0.00 0.00 0.00 0.00 2.29 61.21 5.08 2.79 0.00 0.00 0.00 0.00 0.00 10.16 0.00 Nil
13 0.00 0.00 0.00 0.00 0.00 9.40 0.00 0.00 0.00 0.00 9.65 6.86 0.00 0.00 4.32 19.05 0.00 0.00 0.00 9.91 2.29 0.00 19.05 15.75 33.58 0.00 0.00 0.00 0.00 4.32 0.00 0.00 17.27 26.67 0.00 17.53 0.00 6.10 0.00 0.00 0.00 0.00 8.89 Nil
14 11.43 15.75 0.00 0.00 0.00 7.11 0.00 0.00 5.33 0.00 83.31 36.83 0.00 0.00 7.37 0.00 0.00 0.00 0.00 23.62 14.48 4.06 10.41 9.65 43.18 6.10 0.00 0.00 0.00 2.29 0.00 0.00 41.15 32.25 11.18 0.00 2.29 0.00 0.00 0.00 0.00 0.00 5.59 Nil
15 10.41 14.99 7.62 8.89 0.00 19.05 0.00 0.00 0.00 0.00 21.59 0.00 0.00 35.56 1.27 0.00 0.00 0.00 0.00 2.79 0.00 14.22 8.13 16.00 50.29 6.35 0.00 0.00 0.00 0.00 0.00 0.00 27.43 43.18 7.11 87.88 15.49 0.00 0.00 0.00 0.00 0.00 5.08 Nil
16 4.06 15.49 0.00 0.00 0.00 4.57 0.00 0.00 7.37 0.00 19.56 0.00 0.00 21.84 0.00 0.00 0.00 0.00 0.00 2.29 0.00 40.39 0.00 34.29 32.77 8.13 0.00 1.27 0.00 0.00 0.00 0.00 5.08 53.34 2.54 56.13 3.81 0.00 0.00 0.00 0.00 0.00 8.38 Nil
17 3.56 9.40 0.00 0.00 0.00 0.00 0.00 0.00 9.65 0.00 4.57 0.00 0.00 33.02 0.00 0.00 0.00 0.00 0.00 5.08 0.00 7.37 54.86 31.50 37.59 30.23 0.00 0.00 0.00 0.00 0.00 0.00 3.05 20.57 0.00 9.65 0.00 0.00 0.00 0.00 0.00 0.00 0.00 15.75
18 11.68 9.53 0.00 0.00 0.00 0.00 0.00 0.00 17.02 0.00 30.73 0.00 22.86 0.00 2.54 0.00 9.91 0.00 0.00 0.00 2.79 18.29 9.91 24.64 39.37 46.99 0.00 0.00 0.00 4.83 0.00 0.00 6.35 14.22 13.97 10.67 0.00 0.00 0.00 0.00 0.00 0.00 0.00 9.14
19 3.18 6.86 0.00 0.00 0.00 0.00 0.00 0.00 9.91 17.53 19.56 19.56 54.61 0.00 28.70 9.14 3.05 0.00 0.00 16.26 12.19 0.00 0.00 4.57 19.05 16.76 0.00 2.79 0.00 0.00 0.76 0.00 46.23 41.65 22.61 67.06 0.00 7.87 0.00 0.00 0.00 0.00 0.00 5.08
20 3.94 11.81 0.00 0.00 0.00 0.00 0.00 0.00 23.37 7.37 88.39 83.57 36.83 0.00 18.03 7.37 1.27 0.00 0.00 21.84 16.51 3.30 24.13 6.35 9.40 55.88 0.00 4.06 0.00 0.00 7.87 20.83 22.86 0.00 44.70 2.03 6.60 1.78 0.00 0.00 0.00 0.00 0.00 3.56
21 2.29 12.83 0.00 0.00 0.00 8.89 0.00 0.00 8.89 0.00 4.06 94.49 0.00 0.00 6.60 14.22 0.00 0.00 0.00 6.35 19.81 15.24 6.60 0.00 18.29 28.19 0.00 18.29 0.00 0.00 1.78 6.35 0.00 9.65 69.09 5.08 8.13 5.08 0.00 0.00 18.54 0.00 0.00 8.89
22 2.54 16.51 0.00 0.00 0.00 0.00 0.00 12.45 4.83 9.65 7.11 40.64 0.00 16.51 0.00 0.00 1.78 0.00 0.00 3.56 5.59 31.50 13.97 0.00 34.04 2.03 0.00 0.00 0.00 0.00 0.00 14.75 35.81 29.21 83.82 0.00 0.00 17.78 0.00 0.00 3.05 0.00 0.00 19.56
23 12.95 0.00 0.00 0.00 0.00 0.00 0.00 0.00 16.51 0.00 0.00 34.29 0.00 62.23 0.00 0.00 0.00 0.00 0.00 1.52 13.97 3.30 11.43 0.00 45.72 0.76 0.00 0.00 0.00 0.00 0.00 4.06 32.26 33.78 40.13 0.00 0.00 28.70 0.00 0.00 0.00 0.00 0.00 2.29
24 13.97 12.83 0.00 0.00 0.00 0.00 0.00 0.00 0.00 0.00 0.00 48.77 14.22 91.44 0.00 0.00 0.00 0.00 0.00 0.00 0.00 0.00 30.48 7.37 29.97 12.19 0.00 0.00 0.00 2.76 0.00 5.33 2.54 24.64 32.77 0.00 31.50 9.65 0.00 0.00 0.00 8.89 0.00 13.46
25 4.83 19.56 0.00 0.00 0.00 0.00 16.51 4.06 0.00 0.00 42.67 28.70 0.00 69.85 0.00 0.00 0.00 0.00 0.00 0.00 0.00 1.52 2.29 8.38 3.81 5.84 0.00 0.00 4.32 5.59 0.00 38.61 10.16 32.00 21.08 12.19 51.56 11.43 0.00 0.00 0.00 3.81 1.52 Nil
26 3.30 16.51 0.00 0.00 0.00 0.00 0.00 0.00 8.89 4.57 0.00 2.54 8.89 54.61 0.00 0.00 0.00 0.00 9.65 0.00 21.59 30.48 7.11 12.45 1.27 7.62 6.86 0.00 0.00 0.00 0.00 1.27 0.00 15.75 27.94 6.35 45.47 14.99 0.00 0.00 0.00 0.00 12.70 Nil
27 13.21 9.65 0.00 0.00 0.00 0.00 0.00 0.00 19.56 7.11 17.27 17.78 0.00 9.65 0.00 0.00 0.00 0.00 17.02 0.00 9.10 2.29 21.59 35.56 34.54 10.92 4.06 3.81 0.00 0.00 8.13 1.52 0.00 1.52 8.89 0.00 48.77 2.54 0.00 0.00 0.00 0.00 0.00 8.13
28 7.87 8.13 0.00 0.00 0.00 0.00 0.00 4.06 10.41 0.00 8.13 16.00 0.00 10.16 0.00 0.00 0.00 0.00 0.00 0.00 0.00 57.66 43.69 43.94 32.51 21.59 7.62 6.86 0.00 0.00 11.94 0.00 9.40 2.54 16.26 35.56 4.06 11.94 0.00 0.00 0.00 0.00 0.00 3.81
29 3.94 0.00 0.00 0.00 0.00 0.00 5.59 0.00 0.00 3.56 9.14 0.00 52.04 0.00 0.00 0.00 0.00 0.00 0.00 27.69 46.74 36.07 28.96 4.32 0.00 0.76 9.65 0.00 16.51 0.00 0.00 0.00 47.50 43.94 0.00 4.57 0.00 0.00 0.00 0.00 3.05
30 0.00 0.00 0.00 0.00 0.00 4.06 7.11 5.33 0.00 19.56 0.00 6.34 45.72 0.00 0.00 0.00 0.00 20.57 0.00 0.00 55.12 43.18 44.45 36.58 0.00 0.00 1.52 0.00 0.00 0.00 0.00 33.53 1.78 21.08 0.00 0.00 0.00 0.00 0.00 Nil
31 0.00 0.00 0.00 5.08 0.00 0.00 12.19 0.00 0.00 0.00 0.00 3.81 0.00 34.54 59.18 0.00 0.00 0.00 0.00 17.02 0.00 29.97 0.00 0.00 0.00 10.16
Total 126.11 317.16 130.95 29.72 16.51 89.91 16.51 72.89 204.72 105.67 519.93 673.11 374.39 507.71 143.50 67.05 16.01 8.13 75.68 144.51 196.29 282.46 572.76 659.91 722.94 504.45 244.60 61.49 20.32 19.79 55.37 115.07 293.89 596.83 707.66 640.08 492.76 332.48 0.00 0.00 21.59 30.73 50.55 196.86
2002-03 2003-04
ONE DAY RAINFALL DATA IN (mm) OF LEPORIANG SITE ON THE DIKRONG (AUG 2001-FEB2005)
2004-052001-02
161133-40ER-0007-00 Page 1 of 4

Par Hydroelectric Project (52 MW)Detailed Project Report
Volume-I (Part-I)Main Report
Annexure 5-1
Date Aug sept oct Nov Dec Jan Feb Mar Apr May June July Aug sept oct Nov Dec Jan Feb Mar Apr May June July Aug sept oct Nov Dec Jan Feb Mar Apr May June July Aug sept Mar
1 0.00 49.59 3.81 41.91 0.00 0.00 0.00 0.00 8.89 15.24 0.00 35.56 0.00 0.00 58.42 0.00 0.00 0.00 0.00 0.00 16.76 0.00 14.48 29.94 16.51 6.60 20.07 0.00 0.00 0.00 0.00 6.60 0.00 0.00 61.46 8.38 4.06 23.37 10.16
2 3.81 10.16 33.02 34.29 0.00 0.00 0.00 0.00 17.78 6.35 0.00 17.78 39.37 0.00 16.51 0.00 0.00 0.00 0.00 0.00 11.43 16.51 2.54 18.54 5.84 17.27 33.78 0.00 0.00 0.00 0.00 0.00 1.78 0.00 41.91 2.29 2.79 26.67 14.22
3 0.00 0.00 40.64 5.08 0.00 0.00 0.00 29.21 2.54 0.00 0.00 8.89 0.00 0.00 0.00 0.00 0.00 0.00 0.00 0.00 3.30 7.62 5.84 10.16 0.00 7.62 11.94 0.00 0.00 0.00 3.56 0.00 4.57 0.00 27.18 0.00 0.00 58.17 13.46
4 0.00 0.00 22.86 0.00 0.00 0.00 0.00 20.32 0.00 0.00 45.72 6.35 0.00 0.00 0.00 0.00 0.00 0.00 0.00 4.32 5.08 29.46 46.99 40.64 0.00 16.26 2.54 0.00 0.00 0.00 0.00 0.00 0.00 0.00 22.35 0.00 6.86 33.78 Nil
5 0.00 5.08 16.51 0.00 0.00 0.00 0.00 0.00 8.89 0.00 11.43 27.94 0.00 0.00 0.00 0.00 0.00 0.00 0.00 0.00 0.00 1.27 23.88 5.08 0.00 8.13 9.14 0.00 0.00 0.00 0.00 0.76 0.00 0.00 9.14 25.15 51.82 15.49 6.86
6 0.00 10.16 1.27 0.00 0.00 0.00 0.00 0.00 16.51 2.54 5.08 3.81 0.00 0.00 0.00 0.00 0.00 0.00 2.54 2.29 0.00 7.62 3.30 54.86 0.00 17.53 18.03 9.14 0.00 0.00 2.29 6.68 0.00 0.76 18.29 40.13 22.61 3.81 15.24
7 0.00 0.00 0.00 0.00 0.00 0.00 0.00 0.00 0.00 0.00 54.61 5.08 0.00 0.00 0.00 0.00 0.00 0.00 0.00 0.00 0.00 7.62 0.00 19.81 0.00 4.32 3.30 8.13 1.78 0.00 5.33 0.00 0.00 33.53 7.62 16.25 49.53 3.05 9.14
8 2.54 44.45 0.00 0.00 3.81 0.00 0.00 0.00 2.54 0.00 0.00 22.86 43.18 0.00 0.00 0.00 1.53 1.27 0.00 0.00 9.91 0.00 0.00 20.07 3.81 26.67 10.67 2.03 0.76 0.00 0.00 0.00 5.08 20.07 15.49 30.00 3.56 9.14 Nil
9 0.00 4.57 6.35 0.00 1.27 0.00 15.24 7.62 7.62 0.00 0.00 31.75 7.62 0.00 0.00 0.00 0.00 0.00 0.00 0.00 3.56 0.00 0.00 27.43 0.00 17.27 35.56 0.00 0.00 0.00 0.00 0.00 3.05 1.52 10.92 35.81 0.00 16.26 Nil
10 0.00 0.00 2.54 0.00 0.00 10.16 3.81 0.00 1.27 3.81 0.00 7.62 69.85 0.00 0.00 0.00 0.00 0.00 0.00 0.00 10.41 21.08 0.00 24.64 29.97 23.11 35.06 0.00 0.00 0.00 0.00 0.51 6.60 53.34 6.35 22.61 10.16 5.08 Nil
11 0.00 0.00 0.00 0.00 0.00 11.43 1.27 29.21 29.21 45.72 0.00 10.16 48.26 0.00 0.00 0.00 0.00 0.00 0.00 2.54 0.00 0.00 0.00 0.00 6.35 0.00 8.13 0.00 0.00 0.00 0.00 4.83 0.00 24.64 72.64 6.60 6.35 Nil
12 0.00 0.00 4.57 0.00 0.00 3.81 0.00 1.27 10.16 5.08 5.08 29.21 0.00 0.00 0.00 0.00 0.00 0.00 0.00 4.06 20.07 0.00 29.21 33.02 0.00 0.00 0.00 0.00 0.00 0.00 0.00 0.00 0.00 31.24 7.37 0.00 0.00 4.06 Nil
13 0.00 16.51 1.27 0.00 0.00 0.00 0.00 20.32 0.00 10.16 80.01 7.62 0.00 0.00 0.00 21.34 0.00 0.00 6.10 11.68 0.00 0.00 35.56 4.57 41.91 1.78 0.00 0.00 0.00 6.07 0.00 0.76 11.68 29.21 10.16 9.40 0.00 1.78 Nil
14 1.78 0.00 0.00 0.00 0.00 0.00 0.00 15.24 0.00 0.00 83.82 34.29 0.00 0.00 35.31 0.00 0.00 0.00 0.00 6.10 0.00 0.00 17.27 20.83 45.21 4.32 0.00 0.00 0.00 3.30 0.00 0.00 33.53 14.73 6.86 0.00 0.00 0.00 Nil
15 3.30 7.62 0.00 0.00 0.00 0.00 0.00 0.00 2.54 0.00 10.16 0.00 0.00 29.21 15.24 0.00 0.00 0.00 0.00 0.00 7.87 0.00 45.72 3.81 62.23 8.89 0.00 0.00 0.00 0.00 0.00 0.00 28.19 18.29 8.38 64.52 18.29 0.00 Nil
16 0.00 0.00 0.00 0.00 0.00 0.00 0.00 0.00 22.86 0.00 3.81 0.00 0.00 19.05 0.00 0.00 0.00 0.00 0.00 2.79 3.81 0.00 29.97 43.94 40.64 11.94 0.00 0.00 0.00 0.00 0.00 0.00 2.29 59.69 0.00 32.77 14.48 0.00 Nil
17 16.51 0.00 0.00 0.00 0.00 0.00 0.00 0.00 3.81 29.21 3.81 0.00 0.00 30.48 0.00 0.00 0.00 0.00 0.00 3.81 6.60 0.00 8.89 22.86 35.56 43.69 0.00 0.00 0.00 1.27 0.00 0.00 2.54 23.88 0.00 5.59 3.05 0.00 13.97
18 1.27 20.32 0.00 0.00 0.00 0.00 0.00 0.00 1.27 1.27 0.00 0.00 16.51 0.00 0.00 0.00 0.00 0.00 0.00 1.27 0.00 0.00 5.84 16.51 32.26 27.94 0.00 0.00 0.00 1.78 0.00 0.00 0.00 0.00 22.35 8.38 0.00 2.29 10.16
19 4.57 13.97 0.00 0.00 0.00 0.00 0.00 0.00 0.00 22.86 0.00 26.67 55.88 0.00 0.00 0.00 0.00 0.00 0.00 21.84 10.67 36.83 0.00 26.67 0.00 17.53 0.00 3.30 0.00 0.00 0.00 0.00 24.13 14.22 18.03 38.61 0.00 16.51 Nil
20 0.00 15.24 0.00 0.00 0.00 0.00 0.00 0.00 43.18 3.81 0.00 78.74 34.29 0.00 0.00 7.37 0.00 0.00 7.62 10.16 7.87 21.08 2.54 0.00 0.00 47.75 0.00 5.08 0.00 0.00 6.60 9.40 17.78 15.24 62.48 4.32 0.00 4.83 8.13
21 0.00 0.00 0.00 0.00 0.00 0.00 0.00 6.35 2.29 0.00 0.00 95.25 0.00 0.00 4.06 4.32 0.00 0.00 0.00 3.05 21.59 23.37 61.72 0.00 21.59 24.13 0.00 17.27 0.00 0.00 2.79 10.41 0.00 1.78 45.21 1.52 11.18 2.03 5.08
22 53.34 0.00 0.00 0.00 0.00 0.00 0.00 2.54 16.51 0.00 0.00 36.83 0.00 13.97 0.00 11.43 0.00 0.00 0.00 2.29 3.56 7.62 21.08 0.00 44.96 3.81 0.00 0.00 0.00 0.00 0.00 7.62 9.91 44.45 93.73 0.76 0.00 11.68 12.70
23 18.54 0.00 0.00 0.00 0.00 3.81 0.00 0.00 10.16 13.97 3.81 40.64 0.00 58.42 0.00 0.00 0.00 0.00 0.00 0.00 0.00 27.94 0.00 0.00 54.61 5.84 0.00 0.00 0.00 1.27 0.00 24.89 24.89 18.03 31.50 0.00 0.00 21.34 6.10
24 29.21 0.00 0.00 0.00 0.00 11.43 0.00 13.97 0.00 10.16 5.08 45.72 1.27 86.36 0.00 0.00 0.00 0.00 0.00 0.00 6.89 3.30 0.00 0.00 15.24 14.48 0.00 0.00 0.00 4.57 0.00 1.27 2.03 7.62 36.83 0.00 19.56 7.11 16.51
25 46.99 3.81 0.00 0.00 27.94 7.62 0.00 11.43 0.00 67.31 40.64 30.48 0.00 67.31 0.00 0.00 0.00 0.00 4.32 0.00 7.62 0.00 43.18 0.00 8.38 0.00 0.00 4.83 6.35 0.00 40.39 3.81 41.91 17.78 10.41 42.93 13.72 Nil
26 21.59 2.54 0.00 0.00 34.29 0.00 0.00 2.54 13.97 33.02 60.96 7.62 5.08 45.72 0.00 0.00 0.00 0.00 13.72 0.00 0.00 3.81 3.81 29.21 0.00 7.37 3.56 0.00 0.00 1.02 0.00 1.02 0.00 9.14 0.00 0.00 24.89 11.94 9.91
27 0.00 0.00 0.00 0.00 5.08 0.00 0.00 13.97 0.00 12.70 3.81 16.51 0.00 3.81 0.00 0.00 0.00 0.00 0.00 0.00 0.00 0.00 4.32 24.89 45.72 5.08 5.08 2.54 0.00 0.00 0.00 0.00 0.00 6.10 9.14 0.00 43.43 4.32 2.54
28 41.91 0.00 0.00 0.00 0.00 0.00 0.00 5.08 2.54 41.91 0.00 17.78 0.00 5.08 0.00 0.00 3.81 0.00 0.00 0.00 3.81 0.00 46.23 21.08 36.83 16.51 5.84 6.10 0.00 0.00 4.06 0.00 0.00 4.57 22.10 39.37 20.07 7.62 10.16
29 0.00 0.00 0.00 3.81 0.00 0.00 8.89 0.00 0.00 0.00 6.35 0.00 21.59 0.00 0.00 13.97 16.51 0.00 0.00 7.11 29.21 29.97 29.21 16.76 0.00 0.00 3.81 0.00 5.08 0.00 0.00 0.00 16.76 27.69 0.00 0.00 2.79
30 0.00 2.54 0.00 0.00 0.00 0.00 1.27 8.89 0.00 0.00 0.00 0.00 43.18 0.00 0.00 0.00 1.52 14.48 0.00 27.94 43.94 40.64 43.94 22.61 0.00 0.00 0.00 0.00 0.00 0.00 0.00 46.23 1.27 29.21 0.00 Nil
31 0.00 0.00 0.00 0.00 6.35 0.00 11.43 0.00 0.00 0.00 0.00 5.08 7.62 32.77 37.59 0.00 0.00 0.00 0.00 0.00 2.03 34.54 7.37
Total 245.36 206.56 132.84 85.09 72.39 48.26 20.32 195.58 233.43 325.12 417.83 662.94 321.31 424.18 129.54 44.46 19.31 19.30 34.30 95.76 160.81 257.80 482.34 645.12 649.98 433.59 202.70 53.59 11.18 25.63 29.71 115.14 181.86 473.96 675.62 499.90 419.62 310.40 174.50
ONE DAY RAINFALL DATA IN (mm) OF LOPTOP SITE ON THE DIKRONG (AUG 2001-SEPT2004)
2001-02 2002-03 2003-04 2004-05
161133-40ER-0007-00 Page 2 of 4

Par Hydroelectric Project (52 MW)Detailed Project Report
Volume-I (Part-I)Main Report
Annexure 5-1
Date Aug sept oct Nov Dec Jan Feb Mar Apr May June July Aug sept oct Nov Dec Jan Feb Mar Apr May June July Aug sept oct Nov Dec Jan Feb Mar Apr May June July Aug sept oct Nov Dec Jan Feb Mar
1 0.00 5.08 0.00 0.00 0.00 0.00 0.00 0.00 8.89 15.24 0.00 43.18 0.00 0.00 25.40 0.00 0.00 0.00 0.00 0.00 14.48 0.00 5.33 18.54 21.59 16.76 7.62 0.00 0.00 0.00 0.00 8.38 0.00 0.00 17.27 9.91 0.00 27.94 0.00 0.00 0.00 0.00 0.76 Nil
2 13.97 13.46 13.97 0.00 0.00 0.00 0.00 0.00 15.24 5.08 0.00 15.24 13.97 0.00 33.02 0.00 0.00 1.27 0.00 0.00 15.24 3.81 10.16 12.19 4.57 18.29 16.51 0.00 0.00 0.00 0.00 0.00 11.18 0.00 9.65 6.86 2.79 45.72 0.00 0.00 0.00 0.00 0.00 6.86
3 2.54 13.21 26.67 0.00 0.00 0.00 0.00 7.62 2.54 0.00 5.08 10.16 5.08 0.00 0.00 0.00 0.00 0.00 0.00 0.00 4.06 2.54 0.00 10.16 0.00 11.94 19.05 0.00 0.00 0.00 0.00 0.00 6.35 4.06 19.05 0.00 0.00 56.39 5.59 0.00 0.00 0.00 0.00 9.91
4 0.00 8.89 0.00 7.62 0.00 0.00 0.00 12.70 0.00 0.00 2.03 5.08 28.45 0.00 0.00 0.00 0.00 0.00 0.00 5.08 2.54 3.81 0.00 19.30 0.00 33.27 0.00 0.00 0.00 0.00 0.00 0.00 0.00 0.00 28.96 0.00 4.31 3.81 22.10 0.00 0.00 0.00 0.00 11.94
5 0.00 4.57 16.51 8.89 0.00 0.00 0.00 0.00 8.89 0.00 55.88 16.51 0.00 0.00 0.00 0.00 0.00 0.00 0.00 0.00 3.05 1.27 8.38 20.83 0.00 1.52 0.00 0.00 0.00 0.00 0.00 0.00 0.00 0.00 12.19 46.23 35.05 18.28 16.76 0.00 0.00 0.00 0.00 0.76
6 0.00 8.13 13.21 0.00 0.00 0.00 0.00 0.00 16.51 2.29 5.08 5.08 0.00 0.00 0.00 0.00 0.00 0.00 23.37 14.73 0.00 0.00 3.81 19.05 0.00 28.19 13.46 15.24 0.00 0.00 0.00 1.02 0.00 2.03 17.78 42.93 26.67 1.78 24.89 0.00 0.00 0.00 0.00 Nil
7 0.00 0.00 0.00 0.00 0.00 0.00 0.00 0.00 0.00 0.00 0.00 2.54 0.00 0.00 0.00 0.00 0.00 0.00 0.00 0.00 0.00 0.00 23.62 36.32 1.52 0.00 2.54 9.91 0.00 0.00 2.03 0.00 0.00 13.46 0.00 26.92 40.64 2.79 30.23 0.00 0.00 0.00 0.00 Nil
8 0.00 13.21 0.00 0.00 15.24 0.00 0.00 0.00 0.00 0.00 40.04 27.94 0.00 0.00 0.00 0.00 0.00 0.00 5.08 0.00 16.26 0.00 13.97 34.29 0.00 16.51 0.00 2.54 0.00 0.00 0.00 0.00 13.21 0.00 20.83 35.81 13.97 3.81 20.83 0.00 0.00 0.00 0.00 Nil
9 0.00 0.00 10.16 0.00 13.97 0.00 0.00 0.00 15.24 0.00 0.00 34.29 0.00 0.00 0.00 0.00 0.00 0.00 0.00 0.00 0.00 15.24 15.24 27.94 43.69 19.30 5.59 0.00 0.00 0.00 0.00 0.00 11.68 13.97 0.00 24.13 0.00 5.08 48.26 0.00 0.00 0.00 0.00 Nil
10 0.00 10.16 0.00 0.00 0.00 0.00 0.00 0.00 10.16 5.08 0.00 0.00 33.02 2.54 0.00 0.00 0.00 0.00 0.00 0.00 0.00 3.81 18.03 37.08 22.86 35.31 29.46 0.00 2.54 0.00 0.00 0.00 17.78 60.96 9.14 43.69 4.06 0.76 8.13 0.00 0.00 0.00 0.00 0.76
11 0.00 1.27 0.00 0.00 0.00 0.00 0.00 0.00 2.54 22.86 33.02 7.62 86.87 0.00 0.00 0.00 0.00 0.00 0.00 3.56 0.00 0.00 5.08 19.05 21.59 0.00 24.13 0.00 0.00 0.00 0.00 4.32 0.00 52.32 3.81 39.88 0.00 0.00 0.00 0.00 0.00 0.00 0.00 0.51
12 0.00 0.00 0.00 0.00 0.00 0.00 0.00 12.70 16.51 25.40 13.97 29.21 17.53 0.00 0.00 0.00 0.00 0.00 3.05 0.00 0.00 0.00 19.30 23.11 14.99 0.00 4.06 0.00 0.00 0.00 0.00 0.00 4.32 26.67 10.92 7.37 0.00 2.03 0.00 0.00 0.00 0.00 2.03 Nil
13 0.00 0.00 0.00 0.00 0.00 0.00 0.00 0.00 0.00 10.16 7.62 10.16 10.16 0.00 0.00 17.78 0.00 0.00 0.00 9.40 0.00 0.00 35.56 9.65 0.00 0.00 0.00 0.00 0.00 0.00 0.00 0.00 0.00 23.37 0.00 10.92 0.00 0.76 0.00 0.00 0.00 0.00 2.03 Nil
14 0.00 13.97 0.00 0.00 0.00 0.00 0.00 2.54 5.08 0.00 81.28 33.02 8.13 0.00 0.00 12.45 0.00 0.00 0.00 5.08 7.62 0.00 36.07 5.59 30.23 6.10 0.00 0.00 0.00 3.30 0.00 0.00 24.13 25.90 2.29 0.00 4.83 0.00 8.89 0.00 0.00 0.00 0.76 Nil
15 0.00 3.81 7.62 0.00 0.00 0.00 0.00 0.00 0.00 2.54 33.02 0.00 0.00 29.46 0.00 0.00 0.00 0.00 0.00 0.00 6.60 0.00 14.48 11.93 30.23 2.54 0.00 0.00 0.00 0.00 0.00 0.00 0.00 27.94 9.40 37.08 0.00 0.00 52.83 0.00 0.00 0.00 0.76 Nil
16 0.00 0.00 0.00 0.00 0.00 0.00 0.00 0.00 21.59 0.00 2.54 0.00 0.00 22.86 0.00 0.00 0.00 0.00 0.00 1.27 0.00 38.35 2.54 0.00 24.89 4.06 0.00 0.00 0.00 0.00 0.76 0.00 18.29 19.30 5.08 40.39 0.00 0.00 2.79 0.00 0.00 0.00 0.00 Nil
17 15.75 13.21 0.00 0.00 0.00 2.54 0.00 2.54 5.08 10.16 3.81 0.00 8.38 20.32 7.62 0.00 0.00 0.00 0.00 7.11 0.00 7.62 5.59 0.00 17.78 46.23 0.00 0.00 0.00 0.00 0.00 0.00 0.00 0.00 0.51 15.75 0.00 0.00 0.00 0.00 0.00 0.00 0.00 Nil
18 2.54 22.10 0.00 0.00 0.00 2.54 0.00 0.00 2.54 0.00 35.56 0.00 16.00 0.00 1.27 0.00 0.00 0.00 0.00 0.00 0.00 22.06 20.57 28.45 42.16 41.15 0.00 0.00 0.00 3.05 0.00 0.00 0.00 0.00 17.53 4.32 0.00 0.00 0.00 0.00 0.00 0.00 0.00 10.92
19 3.30 12.70 0.00 0.00 0.00 3.81 0.00 0.00 7.62 20.32 2.54 29.21 53.34 0.00 17.78 0.00 1.27 0.00 0.00 11.43 13.97 0.00 0.00 1.78 24.13 10.92 0.00 0.00 0.00 0.00 0.00 0.00 2.54 19.30 22.61 28.70 0.00 5.33 0.00 0.00 0.00 0.00 0.00 Nil
20 2.54 10.16 0.00 0.00 0.00 0.00 0.00 0.00 48.26 48.26 67.31 68.58 17.02 0.00 17.78 5.84 0.00 0.00 0.00 9.65 5.08 0.00 42.67 8.13 33.53 71.12 0.00 4.57 0.00 0.00 3.30 12.19 0.00 0.00 34.54 20.83 9.14 0.00 0.00 0.00 0.00 0.00 0.00 13.46
21 3.81 0.00 0.00 0.00 0.00 2.29 0.00 0.00 7.62 3.81 2.54 96.52 1.78 0.00 0.00 11.68 2.03 0.00 0.00 15.75 14.99 10.92 0.00 8.89 19.05 13.97 0.00 12.19 0.00 0.00 0.00 1.02 0.00 34.29 57.91 7.37 2.54 6.86 0.00 0.00 0.00 0.00 0.00 1.78
22 20.83 0.00 0.00 0.00 0.00 0.00 7.62 0.00 15.24 5.59 6.35 35.56 0.00 0.00 0.00 0.00 0.00 0.00 0.00 10.67 0.00 22.86 0.00 0.00 1.27 7.11 0.00 0.00 0.00 0.00 0.00 6.60 14.22 14.22 67.56 0.00 0.00 13.97 0.00 0.00 9.65 0.00 0.00 8.13
23 16.51 3.81 0.00 0.00 0.00 0.00 0.00 12.70 10.16 2.54 0.00 40.64 0.00 28.70 0.00 0.00 0.00 0.00 0.00 0.00 0.00 7.62 3.81 0.00 6.86 0.00 0.00 0.00 0.00 0.00 0.76 16.00 15.24 19.05 35.81 0.00 0.00 12.70 0.00 0.00 0.00 0.00 0.00 2.29
24 10.16 0.00 0.00 0.00 0.00 4.57 0.00 0.00 0.00 0.00 0.00 43.18 0.00 17.53 0.00 0.00 0.00 0.00 0.00 0.00 15.75 0.00 47.24 0.00 36.83 10.16 0.00 0.00 0.00 1.52 0.00 13.46 0.00 16.51 40.13 0.00 20.82 13.97 0.00 0.00 0.00 0.00 0.00 14.22
25 10.67 0.00 0.00 0.00 0.00 0.00 0.00 0.00 0.00 53.34 43.18 33.02 0.00 30.99 0.00 0.00 0.00 0.00 0.00 0.00 0.00 0.00 2.79 3.05 2.79 6.35 1.27 0.00 0.76 3.05 0.00 36.32 0.00 27.94 16.00 8.38 27.94 9.40 0.00 0.00 0.00 0.00 0.00 1.27
26 9.91 0.00 0.00 0.00 0.00 0.00 12.70 7.62 10.16 35.05 0.00 12.70 4.32 4.32 0.00 0.00 0.00 0.00 2.54 0.00 0.00 25.91 7.11 0.00 0.00 1.78 0.00 0.00 0.51 0.00 0.00 1.52 0.00 14.22 12.45 4.57 55.88 11.43 0.00 0.00 0.00 0.00 1.52 5.33
27 2.54 0.00 0.00 0.00 0.00 0.00 0.00 2.54 0.00 7.62 15.24 15.24 0.00 7.62 0.00 0.00 0.00 0.00 10.16 0.00 0.00 7.62 11.43 60.45 9.14 17.27 3.81 2.54 0.00 0.00 0.00 0.00 0.00 0.00 13.46 0.00 13.72 0.00 1.52 0.00 0.00 0.00 2.03 3.81
28 9.65 0.00 0.00 0.00 0.00 0.00 0.00 2.54 2.54 41.91 5.08 17.78 0.00 9.65 0.00 0.00 0.00 0.00 0.00 0.00 7.37 15.24 15.24 6.60 5.08 35.31 6.60 9.14 0.00 0.00 5.59 0.00 0.00 0.00 15.49 0.00 29.97 9.91 1.27 0.00 0.00 0.00 0.00 2.03
29 0.00 0.00 0.00 0.00 0.00 0.00 5.08 0.00 0.00 27.94 5.08 0.00 2.54 0.00 0.00 0.00 0.00 0.00 0.00 0.00 19.30 33.02 6.35 14.22 0.00 0.00 5.84 0.00 14.73 0.00 0.00 35.46 21.59 29.21 1.27 1.78 0.00 0.00 0.00 0.00 0.51
30 0.00 0.00 0.00 0.00 0.00 0.00 2.54 7.62 0.00 10.16 0.00 0.00 10.16 0.00 0.00 0.00 2.54 17.27 0.00 0.00 41.15 74.17 16.26 15.24 0.00 0.00 0.00 0.00 0.00 1.78 0.00 33.02 0.00 19.81 0.00 0.00 0.00 0.00 0.00 Nil
31 0.00 0.00 0.00 0.00 0.00 0.00 15.24 0.00 0.00 0.00 0.00 5.59 0.00 39.37 15.24 0.00 0.00 0.00 0.00 0.00 4.06 2.54 0.00 0.00 0.00 0.76
Total 124.72 157.74 88.14 16.51 29.21 15.75 20.32 71.12 240.03 317.25 499.27 652.78 304.05 186.69 102.87 47.75 3.30 3.81 44.20 116.59 127.01 188.69 428.47 568.94 452.63 484.62 134.10 56.13 9.65 10.92 27.17 100.83 140.72 450.97 554.98 495.31 315.95 254.50 244.09 0.00 9.65 0.00 9.89 95.25
2001-02 2002-03 2003-04 2004-05
ONE DAY RAINFALL DATA IN (mm) OF SANGALEE SITE ON THE DIKRONG (AUG 2001-FEB2005)
161133-40ER-0007-00 Page 3 of 4

Par Hydroelectric Project (52 MW)Detailed Project Report
Volume-I (Part-I)Main Report
Annexure 5-1
Date Nov Dec Jan Feb Mar Apr May June July Aug sept oct Nov Dec Jan Feb Mar Apr May June July Aug sept oct Nov Dec Jan Feb Mar Apr May June July Aug sept oct Nov Dec Jan Feb
1 0.00 0.00 0.00 0.00 0.00 0.00 0.00 9.14 19.05 7.11 0.00 16.51 0.00 0.00 0.00 0.00 0.00 13.97 0.00 1.78 19.30 0.00 5.84 25.15 0.00 0.00 0.00 0.00 9.65 7.87 0.00 42.83 7.62 4.83 71.88 0.00 0.00 0.00 0.00 0.00
2 0.00 0.00 0.00 0.00 0.00 10.16 1.02 0.00 15.75 15.75 0.00 5.33 0.00 0.00 1.02 0.00 0.00 5.59 11.68 4.06 45.97 0.00 21.34 12.19 0.00 0.00 0.00 0.00 0.00 0.00 21.84 20.83 0.00 0.51 54.61 0.00 0.00 0.00 0.00 0.00
3 0.00 0.00 0.00 0.00 0.00 2.03 0.00 4.83 31.24 19.05 0.00 2.03 0.00 0.00 0.00 0.00 0.00 0.00 0.00 5.59 2.54 0.00 25.40 13.97 0.00 0.00 0.00 0.76 0.00 3.05 0.00 33.02 0.00 0.00 16.00 0.00 0.00 0.00 0.00 0.00
4 0.00 0.00 0.00 0.00 18.03 3.30 6.10 6.86 9.65 44.05 0.00 0.00 0.00 0.00 0.00 0.00 3.56 4.06 4.06 29.21 57.91 0.00 55.63 0.00 0.00 0.00 0.00 0.00 0.00 0.00 4.06 32.00 0.00 6.35 4.06 24.13 0.00 0.00 0.00 0.00
5 18.20 14.73 0.00 0.00 2.79 0.00 0.00 79.28 15.75 40.64 0.00 0.00 0.00 0.00 0.00 0.00 0.00 0.00 4.57 17.78 7.87 0.00 0.00 17.78 0.00 0.00 0.00 0.00 0.00 0.00 0.00 4.06 20.32 71.12 8.89 5.08 0.00 0.00 0.00 0.00
6 0.00 18.54 0.00 0.00 0.00 0.00 2.29 2.29 2.03 0.00 0.00 0.00 0.00 0.00 0.00 9.65 0.00 0.00 0.00 1.27 3.05 0.00 47.50 23.88 13.72 0.00 0.00 0.00 4.32 0.00 32.51 14.99 36.07 44.70 3.81 35.56 0.00 0.00 0.00 6.86
7 0.00 0.00 0.00 0.00 0.00 0.00 0.00 0.00 5.84 0.00 0.00 0.00 0.00 0.00 0.00 8.64 0.00 0.00 0.00 28.19 38.86 0.00 0.00 0.00 11.18 0.00 0.00 4.06 0.00 0.00 0.00 2.03 25.91 77.72 31.50 49.53 0.00 0.00 0.00 0.00
8 0.00 0.00 0.00 0.00 0.00 0.00 0.00 50.04 25.91 0.00 0.00 0.00 0.00 0.00 0.00 0.00 1.27 5.84 10.16 9.40 20.32 0.00 6.86 0.00 9.40 0.00 0.00 0.00 0.00 6.35 0.00 27.94 23.88 0.00 11.43 26.92 0.00 0.00 0.00 0.00
9 0.00 0.00 0.00 0.00 0.00 52.32 0.00 1.52 48.77 1.27 0.00 0.00 0.00 0.00 0.00 0.00 0.00 0.00 5.84 0.00 61.21 14.99 15.75 12.70 0.00 0.00 0.00 0.00 0.00 2.79 31.75 1.02 26.42 0.00 0.00 41.66 0.00 0.00 0.00 0.00
10 0.00 0.00 0.00 0.00 0.00 11.43 0.00 0.76 2.79 3.81 0.00 0.00 0.00 0.00 0.00 0.00 0.00 0.00 0.00 0.00 33.27 1.52 9.65 58.40 0.00 0.00 0.00 0.00 0.00 10.16 81.28 11.94 25.40 3.05 0.00 0.00 0.00 0.00 0.00 0.00
11 0.00 0.00 0.00 0.00 0.76 10.67 40.89 15.24 28.45 135.89 0.00 0.00 0.00 0.00 0.00 0.00 1.52 0.00 0.00 0.00 10.16 3.56 0.00 30.48 0.00 0.00 0.00 0.00 0.00 0.00 77.47 5.08 61.72 2.54 0.00 0.00 0.00 0.00 0.00 0.00
12 0.00 0.00 0.00 0.00 3.05 7.62 32.00 18.29 26.92 23.37 48.77 0.00 0.00 0.00 0.00 5.08 2.54 8.13 0.00 28.49 40.13 19.81 0.00 0.00 0.00 0.00 0.00 0.00 0.00 0.76 21.08 16.00 6.35 0.00 0.00 0.00 0.00 0.00 0.00 0.00
13 0.00 0.00 0.00 0.00 0.00 0.25 0.00 0.00 8.38 13.97 0.00 0.00 11.94 0.00 0.00 2.54 13.72 7.37 0.00 29.21 7.11 12.70 0.00 0.00 0.00 0.00 0.00 0.00 0.00 20.32 64.00 0.00 6.60 0.00 0.00 0.00 0.00 0.00 0.00 30.23
14 0.00 0.00 0.00 0.00 2.29 0.00 0.00 106.17 10.16 6.60 0.00 0.00 17.78 0.00 0.00 0.00 3.56 3.05 0.00 25.15 34.29 0.00 6.86 0.00 0.00 0.00 13.46 0.00 0.00 45.72 49.78 0.00 0.00 0.00 0.00 10.16 0.00 0.00 0.00 7.37
15 0.00 0.00 0.00 0.00 0.00 0.00 3.81 25.91 0.76 7.62 40.39 0.00 0.00 0.00 0.00 0.00 0.00 0.00 0.00 8.13 27.94 105.16 0.00 0.00 0.00 3.81 6.10 0.00 0.00 18.54 41.15 8.13 62.74 8.13 0.00 57.15 0.00 0.00 0.00 8.13
16 0.00 0.00 1.27 0.00 0.00 4.57 0.00 20.57 0.00 0.76 54.10 0.00 0.00 0.00 0.00 0.00 0.00 0.00 0.00 2.79 20.32 56.64 2.54 0.00 0.00 0.00 0.00 0.00 0.00 5.08 26.16 11.43 68.83 0.00 0.00 2.29 0.00 0.00 0.00 12.70
17 0.00 0.00 0.00 0.00 0.00 3.56 0.00 6.35 0.00 65.02 34.04 0.00 0.00 0.00 0.00 0.00 1.78 6.35 2.79 1.52 23.37 65.02 61.98 0.00 0.00 0.00 0.00 0.00 0.00 2.29 0.00 0.00 2.29 0.00 0.00 0.00 0.00 0.00 0.00 0.00
18 0.00 0.00 0.00 0.00 0.00 38.10 0.00 44.45 0.00 33.02 0.00 4.06 0.00 0.00 0.00 0.00 6.64 0.51 0.00 12.70 13.97 32.51 41.91 0.00 0.00 0.00 0.00 0.00 0.00 8.13 0.00 19.30 3.05 0.00 0.00 0.00 0.00 0.00 0.00 0.00
19 0.00 0.00 19.81 0.00 0.00 17.78 5.59 31.75 14.22 43.94 0.00 13.46 0.00 0.00 0.00 0.00 16.26 0.00 0.00 0.00 25.40 6.60 2.03 0.00 9.14 0.00 16.51 0.00 0.00 1.52 36.07 29.21 43.18 0.00 1.27 0.00 0.00 0.00 0.00 0.00
20 0.00 0.00 0.00 0.00 0.00 23.37 23.62 89.41 12.19 23.62 0.00 0.00 9.40 0.00 0.00 0.51 8.89 6.35 0.00 56.90 17.78 75.69 41.66 0.00 6.86 0.00 0.00 6.35 14.47 0.00 1.27 47.75 54.10 2.79 0.00 0.00 0.00 0.00 6.86 0.00
21 0.00 0.00 0.00 4.06 0.00 1.78 22.86 6.35 32.00 0.00 0.00 0.00 0.00 0.00 0.00 0.00 1.02 12.45 12.45 5.33 4.83 56.64 4.57 0.00 16.76 0.00 0.00 0.00 20.57 0.00 16.51 73.66 13.97 4.32 0.00 0.00 0.00 0.00 6.86 0.00
22 0.00 0.00 0.00 6.35 0.00 17.02 7.37 4.83 67.56 0.00 0.00 0.00 0.00 0.00 0.00 0.00 0.00 14.48 14.99 0.00 0.00 0.00 8.13 0.00 2.54 0.00 0.00 0.00 9.14 31.75 12.19 88.39 0.00 0.00 0.00 0.00 0.00 0.00 0.00 0.00
23 19.05 0.00 0.00 0.00 0.00 0.00 0.00 0.00 95.25 0.00 45.72 0.00 0.00 0.00 0.00 0.00 0.00 6.35 5.84 6.35 5.84 30.48 0.00 0.00 0.00 0.00 0.00 0.00 13.72 26.67 26.16 33.02 0.00 0.00 17.78 0.00 0.00 0.00 0.00 0.00
24 0.00 0.00 0.00 0.00 0.00 1.02 1.78 0.00 78.49 0.00 41.91 0.00 0.00 0.00 0.00 0.00 0.00 0.00 26.67 44.96 0.00 0.00 0.00 0.00 0.00 0.00 2.54 0.00 15.49 0.00 2.03 29.72 0.00 3.05 0.00 0.00 0.00 0.00 0.00 0.00
25 0.00 0.00 14.22 0.00 1.27 0.00 0.00 59.69 21.08 3.05 29.46 0.00 0.00 0.00 0.00 0.00 0.00 0.00 0.00 7.87 0.00 12.19 7.87 0.00 0.00 0.00 0.00 0.00 32.00 0.00 29.21 14.22 6.86 38.86 23.88 0.00 0.00 0.00 0.00 0.00
26 0.00 0.00 13.46 4.57 4.83 1.27 30.73 0.00 0.00 24.64 0.00 0.00 0.00 0.00 0.00 2.79 0.00 3.81 93.98 20.32 0.00 0.00 15.24 1.27 0.00 0.00 0.00 0.00 0.00 0.00 11.18 17.27 0.00 57.66 7.87 0.00 0.00 0.00 0.00 0.00
27 0.00 0.00 2.28 0.00 18.54 17.53 47.75 26.16 7.62 0.00 0.00 0.00 0.00 0.00 0.00 0.00 0.00 0.00 27.94 71.63 19.81 40.13 19.56 0.00 7.11 0.00 0.00 0.00 1.27 0.00 0.00 6.35 0.00 45.72 6.86 0.00 0.00 0.00 0.00 0.00
28 0.00 0.00 0.00 4.83 1.53 8.64 49.53 4.06 15.24 0.00 13.97 0.00 0.00 0.00 0.00 2.29 0.00 2.29 32.77 13.97 2.29 2.79 36.83 4.32 19.05 0.00 0.00 13.46 0.00 0.00 0.00 17.78 58.17 0.00 0.00 0.76 0.00 0.00 0.00 0.00
29 0.00 0.00 0.00 11.93 1.52 0.00 18.03 0.00 0.00 25.15 0.00 0.00 0.00 0.00 0.00 0.00 1.02 39.11 23.11 0.00 9.91 0.00 0.00 0.00 0.00 20.83 0.00 0.00 28.96 30.73 34.54 0.00 27.94 0.00 0.00 0.00 0.00
30 0.00 0.00 0.00 2.29 13.72 31.75 21.84 0.00 0.00 18.03 0.00 0.00 11.21 0.00 12.45 8.38 0.00 24.13 58.42 16.76 33.27 0.00 0.00 0.00 0.00 0.00 0.00 0.00 48.77 35.56 29.46 3.81 0.00 0.00 0.00 0.00
31 0.00 0.00 0.00 0.00 0.00 0.00 0.00 0.00 0.00 4.57 0.00 34.04 48.51 0.00 0.00 0.00 0.00 0.00 3.05 16.00 0.00 0.00 0.00
Total 37.25 33.27 51.04 19.81 67.31 247.66 307.09 653.82 595.10 513.18 351.54 41.39 39.12 11.21 1.02 31.50 77.78 108.98 254.76 495.84 659.11 601.70 480.33 200.14 95.76 3.81 38.61 45.46 120.63 191.00 614.66 687.47 626.63 416.81 291.59 253.24 0.00 0.00 13.72 65.29
2002-2003 2004-052001-02 2003-04
ONE DAY RAINFALL DATA IN (mm) OF JAMPA SITE ON THE DIKRONG (NOV 2001-FEB2005)
161133-40ER-0007-00 Page 4 of 4
Par Hydroelectric Project (52 MW) Detailed Project Report
Volume-I (Part-I)Main Report
161133-40ER-0007-00
Annexure 5-2 Discharge Data of Pare Dam Site,
Hoz G&D Site and Par G&D Site
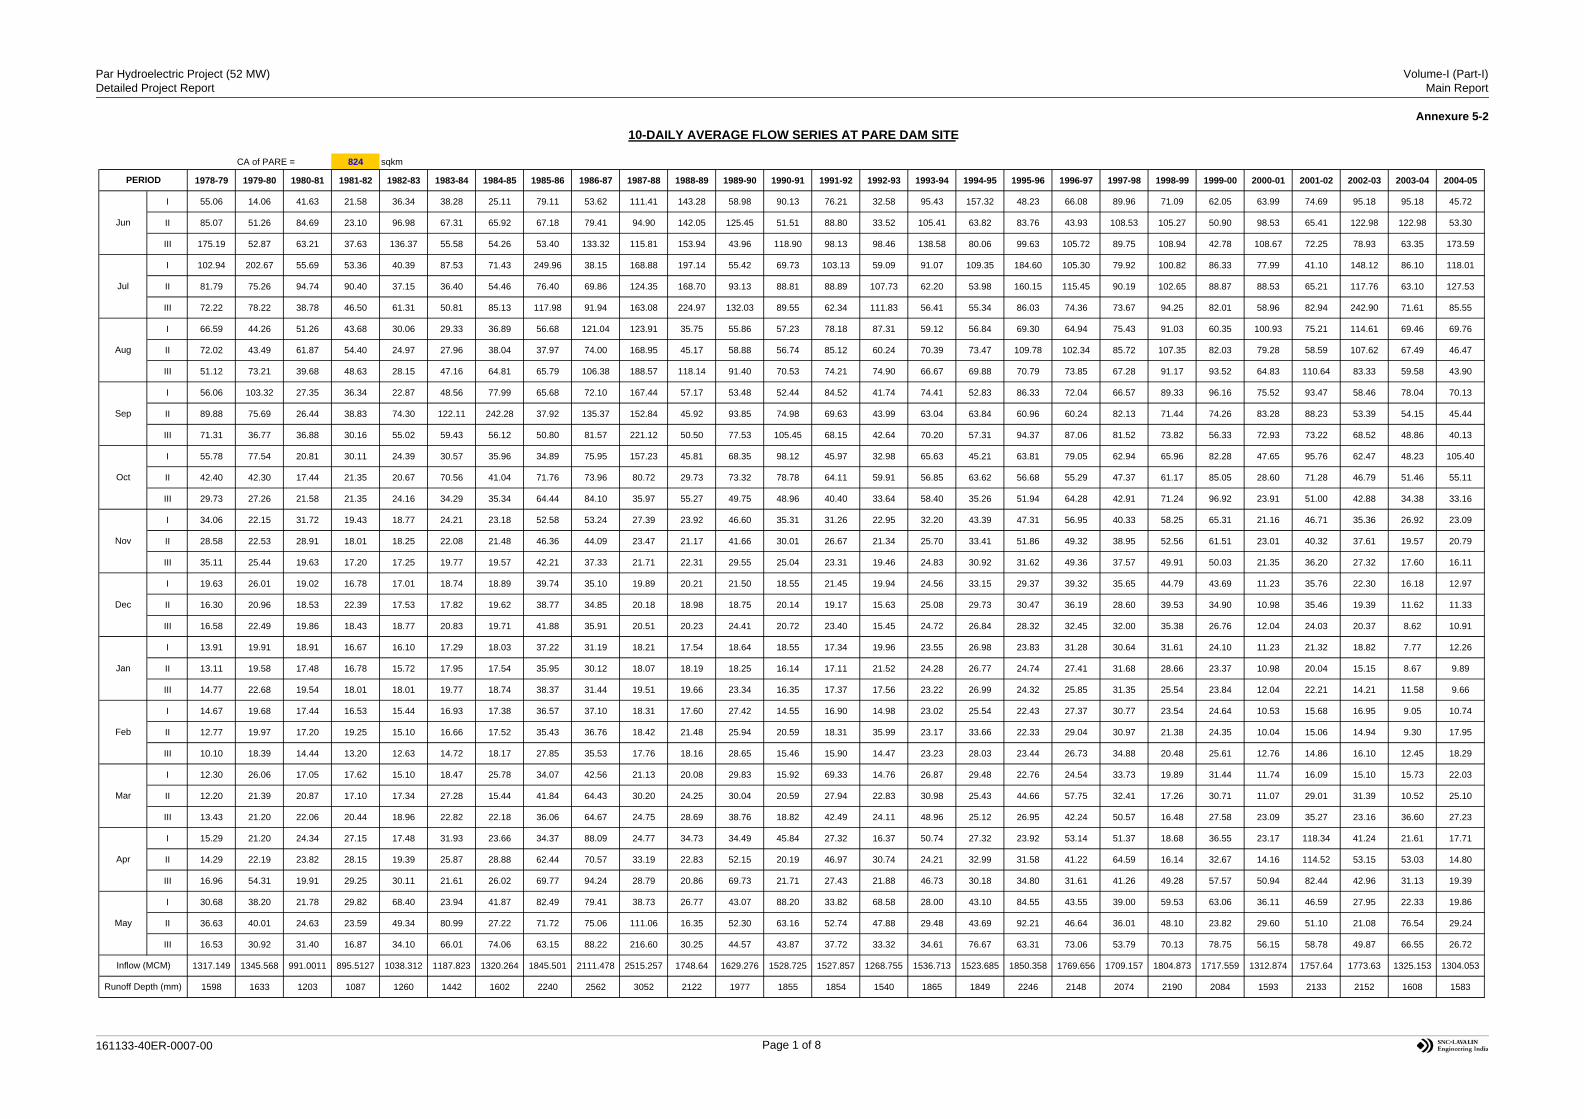
Par Hydroelectric Project (52 MW)Detailed Project Report
Volume-I (Part-I)Main Report
Annexure 5-2
CA of PARE = 824 sqkm
1978-79 1979-80 1980-81 1981-82 1982-83 1983-84 1984-85 1985-86 1986-87 1987-88 1988-89 1989-90 1990-91 1991-92 1992-93 1993-94 1994-95 1995-96 1996-97 1997-98 1998-99 1999-00 2000-01 2001-02 2002-03 2003-04 2004-05
I 55.06 14.06 41.63 21.58 36.34 38.28 25.11 79.11 53.62 111.41 143.28 58.98 90.13 76.21 32.58 95.43 157.32 48.23 66.08 89.96 71.09 62.05 63.99 74.69 95.18 95.18 45.72
II 85.07 51.26 84.69 23.10 96.98 67.31 65.92 67.18 79.41 94.90 142.05 125.45 51.51 88.80 33.52 105.41 63.82 83.76 43.93 108.53 105.27 50.90 98.53 65.41 122.98 122.98 53.30
III 175.19 52.87 63.21 37.63 136.37 55.58 54.26 53.40 133.32 115.81 153.94 43.96 118.90 98.13 98.46 138.58 80.06 99.63 105.72 89.75 108.94 42.78 108.67 72.25 78.93 63.35 173.59
I 102.94 202.67 55.69 53.36 40.39 87.53 71.43 249.96 38.15 168.88 197.14 55.42 69.73 103.13 59.09 91.07 109.35 184.60 105.30 79.92 100.82 86.33 77.99 41.10 148.12 86.10 118.01
II 81.79 75.26 94.74 90.40 37.15 36.40 54.46 76.40 69.86 124.35 168.70 93.13 88.81 88.89 107.73 62.20 53.98 160.15 115.45 90.19 102.65 88.87 88.53 65.21 117.76 63.10 127.53
III 72.22 78.22 38.78 46.50 61.31 50.81 85.13 117.98 91.94 163.08 224.97 132.03 89.55 62.34 111.83 56.41 55.34 86.03 74.36 73.67 94.25 82.01 58.96 82.94 242.90 71.61 85.55
I 66.59 44.26 51.26 43.68 30.06 29.33 36.89 56.68 121.04 123.91 35.75 55.86 57.23 78.18 87.31 59.12 56.84 69.30 64.94 75.43 91.03 60.35 100.93 75.21 114.61 69.46 69.76
II 72.02 43.49 61.87 54.40 24.97 27.96 38.04 37.97 74.00 168.95 45.17 58.88 56.74 85.12 60.24 70.39 73.47 109.78 102.34 85.72 107.35 82.03 79.28 58.59 107.62 67.49 46.47
III 51.12 73.21 39.68 48.63 28.15 47.16 64.81 65.79 106.38 188.57 118.14 91.40 70.53 74.21 74.90 66.67 69.88 70.79 73.85 67.28 91.17 93.52 64.83 110.64 83.33 59.58 43.90
I 56.06 103.32 27.35 36.34 22.87 48.56 77.99 65.68 72.10 167.44 57.17 53.48 52.44 84.52 41.74 74.41 52.83 86.33 72.04 66.57 89.33 96.16 75.52 93.47 58.46 78.04 70.13
II 89.88 75.69 26.44 38.83 74.30 122.11 242.28 37.92 135.37 152.84 45.92 93.85 74.98 69.63 43.99 63.04 63.84 60.96 60.24 82.13 71.44 74.26 83.28 88.23 53.39 54.15 45.44
III 71.31 36.77 36.88 30.16 55.02 59.43 56.12 50.80 81.57 221.12 50.50 77.53 105.45 68.15 42.64 70.20 57.31 94.37 87.06 81.52 73.82 56.33 72.93 73.22 68.52 48.86 40.13
I 55.78 77.54 20.81 30.11 24.39 30.57 35.96 34.89 75.95 157.23 45.81 68.35 98.12 45.97 32.98 65.63 45.21 63.81 79.05 62.94 65.96 82.28 47.65 95.76 62.47 48.23 105.40
II 42.40 42.30 17.44 21.35 20.67 70.56 41.04 71.76 73.96 80.72 29.73 73.32 78.78 64.11 59.91 56.85 63.62 56.68 55.29 47.37 61.17 85.05 28.60 71.28 46.79 51.46 55.11
III 29.73 27.26 21.58 21.35 24.16 34.29 35.34 64.44 84.10 35.97 55.27 49.75 48.96 40.40 33.64 58.40 35.26 51.94 64.28 42.91 71.24 96.92 23.91 51.00 42.88 34.38 33.16
I 34.06 22.15 31.72 19.43 18.77 24.21 23.18 52.58 53.24 27.39 23.92 46.60 35.31 31.26 22.95 32.20 43.39 47.31 56.95 40.33 58.25 65.31 21.16 46.71 35.36 26.92 23.09
II 28.58 22.53 28.91 18.01 18.25 22.08 21.48 46.36 44.09 23.47 21.17 41.66 30.01 26.67 21.34 25.70 33.41 51.86 49.32 38.95 52.56 61.51 23.01 40.32 37.61 19.57 20.79
III 35.11 25.44 19.63 17.20 17.25 19.77 19.57 42.21 37.33 21.71 22.31 29.55 25.04 23.31 19.46 24.83 30.92 31.62 49.36 37.57 49.91 50.03 21.35 36.20 27.32 17.60 16.11
I 19.63 26.01 19.02 16.78 17.01 18.74 18.89 39.74 35.10 19.89 20.21 21.50 18.55 21.45 19.94 24.56 33.15 29.37 39.32 35.65 44.79 43.69 11.23 35.76 22.30 16.18 12.97
II 16.30 20.96 18.53 22.39 17.53 17.82 19.62 38.77 34.85 20.18 18.98 18.75 20.14 19.17 15.63 25.08 29.73 30.47 36.19 28.60 39.53 34.90 10.98 35.46 19.39 11.62 11.33
III 16.58 22.49 19.86 18.43 18.77 20.83 19.71 41.88 35.91 20.51 20.23 24.41 20.72 23.40 15.45 24.72 26.84 28.32 32.45 32.00 35.38 26.76 12.04 24.03 20.37 8.62 10.91
I 13.91 19.91 18.91 16.67 16.10 17.29 18.03 37.22 31.19 18.21 17.54 18.64 18.55 17.34 19.96 23.55 26.98 23.83 31.28 30.64 31.61 24.10 11.23 21.32 18.82 7.77 12.26
II 13.11 19.58 17.48 16.78 15.72 17.95 17.54 35.95 30.12 18.07 18.19 18.25 16.14 17.11 21.52 24.28 26.77 24.74 27.41 31.68 28.66 23.37 10.98 20.04 15.15 8.67 9.89
III 14.77 22.68 19.54 18.01 18.01 19.77 18.74 38.37 31.44 19.51 19.66 23.34 16.35 17.37 17.56 23.22 26.99 24.32 25.85 31.35 25.54 23.84 12.04 22.21 14.21 11.58 9.66
I 14.67 19.68 17.44 16.53 15.44 16.93 17.38 36.57 37.10 18.31 17.60 27.42 14.55 16.90 14.98 23.02 25.54 22.43 27.37 30.77 23.54 24.64 10.53 15.68 16.95 9.05 10.74
II 12.77 19.97 17.20 19.25 15.10 16.66 17.52 35.43 36.76 18.42 21.48 25.94 20.59 18.31 35.99 23.17 33.66 22.33 29.04 30.97 21.38 24.35 10.04 15.06 14.94 9.30 17.95
III 10.10 18.39 14.44 13.20 12.63 14.72 18.17 27.85 35.53 17.76 18.16 28.65 15.46 15.90 14.47 23.23 28.03 23.44 26.73 34.88 20.48 25.61 12.76 14.86 16.10 12.45 18.29
I 12.30 26.06 17.05 17.62 15.10 18.47 25.78 34.07 42.56 21.13 20.08 29.83 15.92 69.33 14.76 26.87 29.48 22.76 24.54 33.73 19.89 31.44 11.74 16.09 15.10 15.73 22.03
II 12.20 21.39 20.87 17.10 17.34 27.28 15.44 41.84 64.43 30.20 24.25 30.04 20.59 27.94 22.83 30.98 25.43 44.66 57.75 32.41 17.26 30.71 11.07 29.01 31.39 10.52 25.10
III 13.43 21.20 22.06 20.44 18.96 22.82 22.18 36.06 64.67 24.75 28.69 38.76 18.82 42.49 24.11 48.96 25.12 26.95 42.24 50.57 16.48 27.58 23.09 35.27 23.16 36.60 27.23
I 15.29 21.20 24.34 27.15 17.48 31.93 23.66 34.37 88.09 24.77 34.73 34.49 45.84 27.32 16.37 50.74 27.32 23.92 53.14 51.37 18.68 36.55 23.17 118.34 41.24 21.61 17.71
II 14.29 22.19 23.82 28.15 19.39 25.87 28.88 62.44 70.57 33.19 22.83 52.15 20.19 46.97 30.74 24.21 32.99 31.58 41.22 64.59 16.14 32.67 14.16 114.52 53.15 53.03 14.80
III 16.96 54.31 19.91 29.25 30.11 21.61 26.02 69.77 94.24 28.79 20.86 69.73 21.71 27.43 21.88 46.73 30.18 34.80 31.61 41.26 49.28 57.57 50.94 82.44 42.96 31.13 19.39
I 30.68 38.20 21.78 29.82 68.40 23.94 41.87 82.49 79.41 38.73 26.77 43.07 88.20 33.82 68.58 28.00 43.10 84.55 43.55 39.00 59.53 63.06 36.11 46.59 27.95 22.33 19.86
II 36.63 40.01 24.63 23.59 49.34 80.99 27.22 71.72 75.06 111.06 16.35 52.30 63.16 52.74 47.88 29.48 43.69 92.21 46.64 36.01 48.10 23.82 29.60 51.10 21.08 76.54 29.24
III 16.53 30.92 31.40 16.87 34.10 66.01 74.06 63.15 88.22 216.60 30.25 44.57 43.87 37.72 33.32 34.61 76.67 63.31 73.06 53.79 70.13 78.75 56.15 58.78 49.87 66.55 26.72
1317.149 1345.568 991.0011 895.5127 1038.312 1187.823 1320.264 1845.501 2111.478 2515.257 1748.64 1629.276 1528.725 1527.857 1268.755 1536.713 1523.685 1850.358 1769.656 1709.157 1804.873 1717.559 1312.874 1757.64 1773.63 1325.153 1304.053
1598 1633 1203 1087 1260 1442 1602 2240 2562 3052 2122 1977 1855 1854 1540 1865 1849 2246 2148 2074 2190 2084 1593 2133 2152 1608 1583
PERIOD
Jun
Aug
Mar
Apr
Sep
Oct
Nov
Dec
Jul
Jan
Feb
May
Inflow (MCM)
Runoff Depth (mm)
10-DAILY AVERAGE FLOW SERIES AT PARE DAM SITE
161133-40ER-0007-00 Page 1 of 8

Par Hydroelectric Project (52 MW)Detailed Project Report
Volume-I (Part-I)Main Report
Anneuxre 5-2
Jan Feb Mar Apr May Jun Jul Aug Sep Oct Nov Dec
16.79 19.24 34.44 40.50 117.84 52.07 53.70 30.28 17.53
15.11 18.12 55.91 27.34 114.57 45.24 58.39 29.72 17.24
13.00 16.08 39.33 28.94 111.46 40.02 83.77 28.96 17.20
13.89 18.51 37.36 45.28 190.16 37.95 46.63 27.97 17.24
13.14 19.02 29.15 25.35 144.36 48.19 44.88 27.47 17.05
12.30 27.69 28.14 20.40 446.17 46.29 40.74 27.13 16.57
12.25 21.92 27.48 18.09 521.34 43.53 40.94 26.66 16.44
17.80 18.83 25.12 16.47 522.10 42.87 39.17 25.89 16.38
37.47 17.54 26.41 15.05 218.51 41.44 36.40 25.14 16.06
20.93 16.68 24.16 18.37 161.83 40.44 37.80 24.62 15.68
21.35 25.80 21.46 102.06 89.20 39.23 35.02 24.11 16.66
15.91 19.84 21.24 108.33 56.73 37.36 34.13 23.61 15.69
14.08 31.20 20.71 243.33 46.89 36.56 33.08 23.17 15.50
13.58 18.32 21.42 139.20 40.49 35.69 28.33 22.31 15.36
12.88 33.66 17.65 77.44 38.12 34.10 22.62 22.51 15.26
12.93 21.88 18.18 72.90 40.10 33.86 22.62 22.18 15.18
12.93 20.68 23.72 72.94 32.30 35.07 31.91 24.00 14.94
14.08 34.46 22.47 70.83 30.70 35.23 32.57 25.23 14.77
13.66 21.30 18.59 84.11 28.19 36.03 37.05 29.64 14.74
12.90 57.92 30.56 72.39 39.22 37.42 83.55 23.40 14.42
17.02 36.35 31.09 50.52 148.27 38.20 41.46 22.60 13.27
13.71 28.40 46.48 52.59 190.34 41.02 46.70 21.71 13.04
12.28 20.62 44.17 36.34 230.68 54.27 40.09 22.26 13.31
12.33 20.12 44.01 37.14 135.10 185.05 38.03 20.53 13.52
14.26 19.79 31.52 36.49 276.31 202.59 32.12 20.67 13.43
14.26 20.12 23.36 36.31 216.64 620.76 33.78 23.54 13.24
16.60 19.86 26.93 38.08 212.36 125.56 28.86 28.89 13.34
34.13 26.26 25.88 29.46 166.43 98.34 33.79 25.68 12.69
28.88 29.49 25.95 27.97 79.84 77.17 28.85 18.40 12.53
25.60 20.07 25.57 25.79 64.48 61.72 28.79 18.08 12.45
45.45 34.09 53.46 12.41
17.3 19.4 32.8 25.6 254.8 43.8 48.2 27.4 16.7
14.4 28.5 21.6 104.4 44.2 36.1 36.1 24.0 15.2
18.9 26.0 32.5 36.8 172.0 150.5 35.2 22.2 13.0
16.9 24.7 28.9 55.0 153.7 76.8 39.9 24.5 14.9
Discharge Data of HOZ. G&D Site -Year 2005
Date
1
2
3
4
5
6
7
8
9
10
11
12
13
14
15
16
17
18
19
20
21
22
23
24
25
26
27
28
29
30
31
Ist 10-Daily Avg.
2nd 10-Daily Avg.
3rd 10-Daily Avg.
Monthly Average
161133-40ER-0007-00 Page 2 of 8

Par Hydroelectric Project (52 MW)Detailed Project Report
Volume-I (Part-I)Main Report
Anneuxre 5-2
Jan Feb Mar Apr May Jun Jul Aug Sep Oct Nov Dec
12.53 10.28 15.14 10.09 10.58 112.84 60.51 44.27 21.17 16.78 11.20 14.21
12.32 10.58 12.08 10.10 13.06 81.78 53.79 42.05 20.42 19.20 11.20 14.00
12.228 10.14 11.37 10.56 12.31 68.07 52.03 34.12 18.83 20.22 11.48 13.89
11.973 10.06 11.19 13.40 16.48 49.93 49.61 29.10 18.22 19.02 11.66 13.81
11.912 10.89 10.95 11.90 23.73 38.28 47.21 25.29 17.37 19.04 11.65 13.62
11.9 10.30 10.80 11.84 33.23 30.59 54.71 22.62 17.14 17.50 11.20 13.61
11.84 10.15 10.38 11.63 33.74 45.95 53.81 20.58 20.58 16.67 11.20 13.22
11.466 10.34 10.19 11.06 23.41 34.94 53.16 34.84 28.40 15.39 11.18 13.22
11.664 10.52 10.19 10.69 18.74 49.65 47.73 28.40 20.07 14.65 11.19 13.01
11.242 10.43 10.18 11.18 17.78 70.78 50.91 25.28 30.84 14.32 11.20 13.02
11.412 10.30 10.09 11.34 23.04 286.38 69.45 21.65 27.39 14.08 11.20 12.80
11.395 10.13 10.10 30.59 22.72 180.40 61.68 21.63 47.51 15.03 11.52 14.63
11.326 10.30 10.21 13.51 57.35 139.33 56.01 18.99 83.21 14.69 11.89 15.08
11.331 10.08 10.19 11.42 46.20 105.07 57.78 47.15 62.89 15.15 15.49 14.29
11.84 11.29 10.09 11.02 28.41 133.72 58.10 20.91 46.97 15.22 14.75 13.95
11.707 10.13 10.14 11.24 23.38 173.02 51.91 19.10 40.16 14.68 14.45 13.76
11.514 11.50 12.96 12.16 20.47 105.43 47.71 17.87 40.12 14.35 14.09 12.87
11.592 10.30 10.66 12.66 19.23 89.78 58.60 27.00 37.30 14.02 13.69 12.39
11.425 10.11 10.52 18.34 18.49 79.50 52.47 18.38 28.42 13.55 12.61 12.11
11.43 10.11 10.18 22.07 17.62 79.64 71.97 17.72 23.97 13.51 11.88 11.89
11.175 20.47 10.47 15.33 14.98 69.16 58.47 23.11 22.05 13.88 11.69 11.77
14.012 22.61 10.17 13.62 13.75 62.95 54.79 17.29 28.97 13.42 11.66 11.80
12.743 18.12 10.20 11.37 17.43 50.31 50.68 19.39 30.68 13.21 36.73 11.79
11.383 19.49 10.21 13.53 20.60 67.07 53.02 43.53 25.85 13.14 31.55 11.80
11.088 18.13 10.44 17.36 16.13 83.03 129.10 81.36 20.63 12.61 26.49 11.76
11.008 18.30 10.21 18.57 13.30 101.36 75.55 46.05 19.99 12.30 20.09 11.65
10.775 27.56 10.14 13.28 59.58 75.95 58.30 32.94 26.69 12.03 18.39 11.64
10.718 18.97 10.05 11.41 64.56 67.64 52.81 25.83 19.83 11.96 17.00 14.91
10.718 10.05 10.54 43.93 66.30 49.93 24.84 17.50 12.10 15.22 18.69
10.442 10.06 10.70 63.93 67.72 46.15 26.44 18.62 11.59 14.29 12.37
10.194 10.07 25.55 11.27
11.9 10.4 11.2 11.2 20.3 58.3 52.3 30.7 21.3 17.3 11.3 13.6
11.5 10.4 10.5 15.4 27.7 137.2 58.6 23.0 43.8 14.4 13.2 13.4
11.3 20.5 10.2 13.6 32.8 71.1 62.9 34.1 23.1 12.5 20.3 12.8
11.6 13.3 10.6 13.4 26.9 88.9 57.9 29.1 29.4 14.7 14.9 13.3
Discharge Data of HOZ. G&D Site -Year 2006
Date
1
2
3
4
5
6
7
8
9
10
11
12
13
14
15
16
17
18
19
20
21
22
23
24
25
26
27
28
29
30
31
Ist 10-Daily Avg.
2nd 10-Daily Avg.
3rd 10-Daily Avg.
Monthly Average
161133-40ER-0007-00 Page 3 of 8

Par Hydroelectric Project (52 MW)Detailed Project Report
Volume-I (Part-I)Main Report
Anneuxre 5-2
Jan Feb Mar Apr May Jun Jul Aug Sep Oct Nov Dec
11.89 11.62 17.49 14.88 16.451 62.59 65.135 42.93 23.12 17.87
12.15 12.53 16.75 14.47 15.52 104.37 63.418 42.62 22.40 17.65
12.326 12.23 16.41 53.52 14.678 100.84 57.054 41.81 22.35 17.53
12.342 12.51 14.94 46.18 14.274 71.77 49.449 40.71 22.06 17.45
12.616 15.08 14.21 38.52 14.341 60.37 48.198 39.79 21.73 17.26
12.68 14.22 13.28 32.28 14.296 50.45 46.813 38.58 22.19 16.80
12.392 15.85 12.22 28.05 14.333 76.03 45.157 37.24 22.09 16.86
12.29 16.72 13.37 23.56 14.025 88.87 70.067 42.41 22.41 16.20
12.329 25.12 14.12 24.74 15.433 214.21 48.602 56.60 22.08 15.89
12.01 18.97 15.98 21.38 15.048 205.66 46.803 54.08 22.09 15.60
12.031 19.09 20.33 22.33 14.88 178.54 47.841 54.03 21.83 15.16
11.8 20.76 20.82 19.59 35.312 103.02 51.186 44.19 21.46 14.73
11.789 18.63 20.71 20.71 18.606 80.57 56.568 41.35 21.06 17.21
11.819 18.82 21.56 19.45 17.535 178.94 44.163 37.40 21.62 13.88
11.624 18.67 20.35 17.47 26.081 133.04 42.531 149.26 20.83 13.63
11.621 17.61 19.33 18.54 26.328 108.69 157.915 39.06 21.17 13.18
11.592 17.74 17.85 19.96 20.501 119.50 78.574 35.88 20.90 12.46
11.453 16.93 16.99 18.00 18.036 123.49 79.45 87.07 20.00 11.73
11.459 16.08 16.31 16.62 16.909 112.45 75.027 57.35 19.28 11.80
11.457 15.55 17.59 16.35 22.007 98.07 72.599 36.99 19.07 11.94
11.652 15.13 16.31 15.30 18.223 83.63 109.901 31.23 18.55 12.01
11.6 14.75 16.03 23.73 15.753 95.96 80.35 33.83 18.56 12.12
11.817 14.22 15.13 19.43 74.386 115.46 110.336 18.25 18.25 12.36
12.42 13.88 14.15 19.46 192.755 126.52 225.765 28.97 17.81 12.33
12.286 13.29 14.74 18.59 123.867 116.95 131.702 28.87 18.78 12.07
12.016 13.00 14.74 17.20 119.84 103.94 226.745 29.09 17.76 12.11
11.88 18.43 16.02 16.74 92.976 97.90 200.797 28.55 17.60 12.13
11.786 18.67 15.39 17.20 71.84 99.90 199.773 27.41 18.11 12.06
11.677 14.81 16.17 54.497 79.11 182.698 26.11 18.02 12.26
11.625 15.26 17.12 87.568 59.34 210.69 24.70 17.84 12.25
11.609 14.84 77.395 165.569 23.50 12.12
12.3 15.5 14.9 29.8 14.8 103.5 54.1 43.7 22.2 16.9
11.7 18.0 19.2 18.9 21.6 123.6 70.6 58.3 20.7 13.6
11.9 15.2 15.2 18.1 84.5 97.9 167.7 27.3 18.1 12.2
11.9 16.3 16.4 22.3 41.7 108.3 99.7 42.6 20.4 14.2
Discharge Data of HOZ. G&D Site -Year 2007
Date
1
2
3
4
5
6
7
8
9
10
11
12
13
14
15
16
17
18
19
20
21
22
23
24
25
26
27
28
29
30
31
Ist 10-Daily Avg.
2nd 10-Daily Avg.
3rd 10-Daily Avg.
Monthly Average
161133-40ER-0007-00 Page 4 of 8

Par Hydroelectric Project (52 MW)Detailed Project Report
Volume-I (Part-I)Main Report
Anneuxre 5-2
Jan Feb Mar Apr May Jun Jul Aug Sep Oct Nov Dec
12.416 14.50 20.34 20.451 25.77 156.215 141.387 124.21
12.343 14.70 19.73 28.815 27.37 154.336 140.239 126.35
12.28 14.31 19.40 29.234 26.21 152.277 143.509 135.89
12.285 14.30 19.38 28.95 25.18 154.63 145.242 133.17
12.337 14.33 19.35 23.678 27.50 166.231 143.401 139.30
12.286 14.31 19.21 23.072 26.66 158.406 214.08 138.27
12.262 14.24 19.26 22.006 26.54 153.406 160.663 127.67
12.268 14.38 19.21 21.726 26.93 149.559 162.75 125.18
12.211 15.35 19.14 21.626 25.81 145.254 160.723 126.19
12.268 15.03 19.08 21.6 25.76 142.133 155.772 145.16
14.124 14.77 18.88 21.988 28.52 138.741 225.84 141.14
16.78 14.63 18.74 20.779 36.03 152.692 229.527 138.97
18.016 14.58 20.55 20.216 27.41 185.521 189.656 138.05
16.461 14.77 19.63 19.718 666.94 187.09 168.8 137.61
15.895 15.86 19.40 19.443 364.33 180.788 162.298 132.01
15.28 15.49 19.32 19.219 188.48 159.818 156.441 127.70
14.767 15.43 19.17 19.167 163.90 155.569 153.063 143.51
14.533 14.85 19.55 24.12 147.14 154.988 147.825 140.07
14.232 15.17 19.43 25.113 148.57 160.636 142.103 138.07
13.911 14.74 19.21 22.546 156.28 158.592 136.227 134.84
15.182 14.31 19.30 20.269 146.01 154.63 132.042 129.65
13.997 14.47 19.16 21.359 153.81 152.768 125.602 126.92
13.054 14.56 18.93 25.793 180.18 156.982 119.348 127.99
14.216 14.41 19.62 25.076 155.10 154.727 113.942 124.40
13.167 15.16 19.73 26.647 145.05 155.676 114.74 117.63
13.348 15.93 21.17 22.952 140.33 152.392 110.466 115.25
13.803 15.51 20.60 21.85 135.86 147.282 110.166 113.19
13.243 15.02 23.45 23.996 138.01 145.044 113.727 109.68
12.89 15.17 22.25 55.845 138.56 142.586 117.391 104.85
13.078 21.34 37.895 157.64 143.834 116.03 102.94
14.429 23.456 140.23 111.488
19.4 24.1 26.4 153.2 156.8 132.1
19.4 21.2 192.8 163.4 171.2 137.2
20.6 27.7 149.1 149.7 117.3 117.3
19.8 24.5 122.7 155.3 147.2 128.9
Discharge Data of HOZ. G&D Site -Year 2008
Date
1
2
3
4
5
6
7
8
9
10
11
12
13
14
15
16
17
18
19
20
21
22
23
24
25
26
27
28
29
30
31
Ist 10-Daily Avg.
2nd 10-Daily Avg.
3rd 10-Daily Avg.
Monthly Average
161133-40ER-0007-00 Page 5 of 8

Par Hydroelectric Project (52 MW)Detailed Project Report
Volume-I (Part-I)Main Report
Anneuxre 5-2
Jan Feb Mar Apr May Jun Jul Aug Sep Oct Nov Dec
16.0 13.5
14.9 13.3
14.8 13.4
14.8 13.0
13.7 13.2
14.6 13.6
14.6 13.5
13.6 13.0
13.4 13.5
12.1 13.1
12.3 13.4
12.2 13.4
12.1 13.8
12.1 14.4
12.0 13.9
12.9 13.7
11.9 14.1
13.9 16.3
12.3 16.7
11.5 14.3
12.1 14.4
11.8 13.9
11.8 14.3
13.8 14.6
12.8 14.1
11.1 16.3
11.9 14.0
14.5 13.9
11.7 13.9
11.9 16.3
14.6
14.3 13.3
12.3 14.4
12.3 14.6
13.0 14.1
Discharge Data of Par Barrage Site -Year 2011
Date
1
2
3
4
5
6
7
8
9
10
11
12
13
14
15
16
17
18
19
20
21
22
23
24
25
26
27
28
29
30
31
Ist 10-Daily Avg.
2nd 10-Daily Avg.
3rd 10-Daily Avg.
Monthly Average
161133-40ER-0007-00 Page 6 of 8

Par Hydroelectric Project (52 MW)Detailed Project Report
Volume-I (Part-I)Main Report
Anneuxre 5-2
Jan Feb Mar Apr May Jun Jul Aug Sep Oct Nov Dec
14.2 11.8 7.7 15.2 29.7 27.8 75.1 48.3 43.2 78.3 15.4 12.3
14.2 11.8 7.4 16.0 30.1 25.7 60.9 49.9 42.0 65.1 14.8 11.1
14.4 11.7 7.2 16.8 29.9 42.1 76.8 51.8 38.2 113.3 14.3 12.2
15.6 11.7 7.1 16.6 29.7 23.7 60.4 45.8 37.1 94.2 14.6 10.5
16.2 12.4 7.0 16.7 29.8 25.1 83.5 53.7 30.9 77.6 14.0 11.8
15.7 11.9 7.0 17.3 29.9 40.8 97.4 54.2 27.0 61.0 14.1 13.6
15.6 11.7 7.2 17.2 29.7 30.3 44.9 41.6 27.8 64.8 14.0 13.3
14.1 13.3 7.2 16.9 30.1 23.5 46.4 42.3 26.5 45.6 13.8 10.4
13.8 12.5 7.0 17.3 29.9 21.9 53.8 39.6 27.2 45.0 13.4 13.0
13.7 11.6 7.5 17.4 29.7 15.9 43.4 41.8 26.4 41.6 12.1 10.1
13.2 11.7 7.3 17.1 29.8 21.3 64.2 36.6 27.3 42.8 12.8 11.8
13.0 11.4 7.1 16.9 29.9 29.5 74.3 27.6 24.4 42.7 12.7 15.4
13.5 11.0 7.0 16.9 30.1 46.4 125.8 27.1 33.7 45.9 12.6 13.7
13.1 10.7 7.2 16.9 30.1 54.7 137.9 19.3 137.9 41.8 12.8 14.8
13.0 10.4 7.1 16.9 30.2 113.1 107.8 24.9 109.2 40.8 11.8 11.8
13.8 10.3 7.2 17.1 30.2 62.3 81.9 24.0 130.4 39.5 12.1 12.0
14.2 10.3 7.2 16.9 30.2 43.4 75.0 22.9 130.4 40.6 11.9 13.9
13.4 10.3 7.2 17.1 30.4 22.5 60.0 25.4 219.3 38.9 11.6 19.2
13.2 10.1 7.0 16.9 31.1 28.5 57.6 20.5 217.4 38.1 12.1 19.4
13.2 10.3 7.0 16.7 32.2 26.4 64.9 19.6 224.1 36.9 11.2 14.1
13.8 10.1 7.1 16.7 33.2 38.3 51.9 31.5 222.1 30.1 12.6 18.8
14.2 10.1 7.1 16.5 34.4 49.9 44.8 45.8 220.8 30.4 11.7 13.6
13.7 10.2 7.0 16.5 35.9 34.2 62.3 36.2 243.3 28.9 11.6 17.8
14.3 10.5 7.1 16.1 34.4 61.2 74.3 48.1 245.8 28.2 13.9 16.5
12.8 9.9 7.0 16.2 34.6 130.6 74.6 66.2 224.9 19.2 12.3 13.7
12.8 9.3 7.1 16.0 32.8 222.8 62.2 42.3 225.7 18.5 12.0 19.2
12.4 8.8 8.4 16.3 30.9 269.2 46.5 39.7 142.6 18.3 11.3 13.8
13.7 8.4 9.7 16.5 31.5 198.1 67.3 39.3 132.0 17.9 13.9 13.5
13.0 7.9 12.3 16.6 32.0 84.7 64.9 37.2 118.8 17.5 11.6 13.4
12.8 12.9 16.7 29.6 76.0 51.9 33.4 87.1 16.5 12.0 18.5
13.0 14.7 27.5 47.4 41.2 15.0 14.6
14.8 12.1 7.2 16.8 29.9 27.7 64.3 46.9 32.6 68.6 14.0 11.8
13.4 10.7 7.1 17.0 30.4 44.8 84.9 24.8 125.4 40.8 12.1 14.6
13.3 9.5 9.1 16.4 32.4 116.5 58.9 41.9 186.3 21.9 12.3 15.8
13.8 10.7 7.8 16.7 30.9 63.0 69.4 37.9 114.8 43.8 12.8 14.1
Discharge Data of Par Barrage Site -Year 2012
Date
1
2
3
4
5
6
7
8
9
10
11
12
13
14
15
16
17
18
19
20
21
22
23
24
25
26
27
28
29
30
31
Ist 10-Daily Avg.
2nd 10-Daily Avg.
3rd 10-Daily Avg.
Monthly Average
161133-40ER-0007-00 Page 7 of 8

Par Hydroelectric Project (52 MW)Detailed Project Report
Volume-I (Part-I)Main Report
Anneuxre 5-2
Jan Feb Mar Apr May Jun Jul Aug Sep Oct Nov Dec
15.4 12.3 14.2 17.3 22.0 34.6 93.5 31.9 39.3 28.1
15.5 12.4 13.3 15.9 18.2 36.3 71.5 25.9 65.5 27.1
18.7 11.6 14.3 17.2 20.1 34.5 34.7 22.1 67.8 25.4
14.3 12.1 14.3 16.4 23.9 26.0 28.6 22.3 65.0 34.5
17.6 14.0 13.3 16.8 26.7 25.8 53.4 22.3 104.7 25.7
17.3 11.9 13.3 13.5 25.1 27.1 81.0 30.1 157.5 60.3
17.6 11.9 14.3 14.3 25.2 23.1 68.9 37.6 89.7 50.9
14.5 11.3 14.3 13.9 24.1 23.5 46.5 43.2 87.5 27.4
14.2 11.0 13.0 13.9 24.3 24.5 47.4 56.7 64.7 25.8
14.0 12.0 16.5 13.1 22.5 23.0 65.2 49.2 65.5 29.4
12.0 11.9 15.2 13.7 23.4 19.3 53.4 44.8 56.3 27.2
11.7 10.8 15.8 17.8 30.4 18.9 41.8 33.2 58.1 25.6
13.1 9.7 16.1 22.7 35.4 23.0 41.6 40.0 53.9 25.4
12.4 11.5 14.3 18.3 42.1 16.1 41.0 34.4 56.0 24.7
12.0 9.9 14.3 21.5 36.0 14.8 38.1 29.1 48.2 26.1
14.9 10.6 15.1 20.2 42.0 13.1 34.8 28.4 29.4 22.2
15.4 11.2 14.8 17.1 36.3 12.0 29.5 33.3 28.6 22.5
12.4 11.0 14.7 14.5 37.5 20.0 42.9 31.9 25.0 34.9
12.7 9.8 13.6 18.0 45.4 26.3 38.2 29.4 28.8 22.5
11.8 10.5 13.0 24.1 30.9 39.8 43.4 29.7 29.4 25.1
14.1 9.7 14.3 17.0 26.9 31.2 72.5 29.5 28.0 26.4
14.4 9.9 14.3 15.8 29.0 21.0 60.9 26.1 26.2 25.1
13.1 10.8 17.7 15.6 37.2 27.0 37.0 24.5 30.5 23.4
14.5 11.0 17.9 16.6 44.0 24.3 45.9 22.1 23.0 25.4
11.8 8.4 13.3 17.2 47.1 24.5 34.4 42.1 21.8 25.0
12.2 9.7 13.3 14.7 31.5 29.2 37.0 75.6 21.3 25.8
10.5 10.3 12.6 16.8 26.7 43.3 39.0 54.8 21.0 24.0
14.2 10.8 12.6 17.8 25.2 48.1 60.9 57.3 25.5 28.6
12.2 14.7 18.5 34.3 58.7 38.5 35.0 28.1 29.2
11.9 17.8 21.1 45.0 67.6 33.4 50.6 26.4 28.6
11.9 15.1 44.3 29.0 29.6 0.0 26.1
15.9 12.0 14.1 15.2 23.2 27.8 59.1 34.1 80.7 33.4
12.8 10.7 14.7 18.8 35.9 20.3 40.5 33.4 41.4 25.6
12.8 10.1 14.9 17.1 35.6 37.5 44.4 40.7 22.9 26.2
13.8 10.9 14.5 17.0 31.6 28.5 48.0 36.1 48.3 28.4
Discharge Data of Par Barrage Site -Year 2013
Date
1
2
3
4
5
6
7
8
9
10
11
12
13
14
15
16
17
18
30
19
20
21
22
23
24
31
Ist 10-Daily Avg.
2nd 10-Daily Avg.
3rd 10-Daily Avg.
Monthly Average
25
26
27
28
29
161133-40ER-0007-00 Page 8 of 8

Par Hydroelectric Project (52 MW) Detailed Project Report
Volume-I (Part-I)Main Report
161133-40ER-0007-00
Annexure 5-3 Letter of Design Storm Value for Par, Turu and Dardu HEP

Annexure 5-3
Page 1 of 2
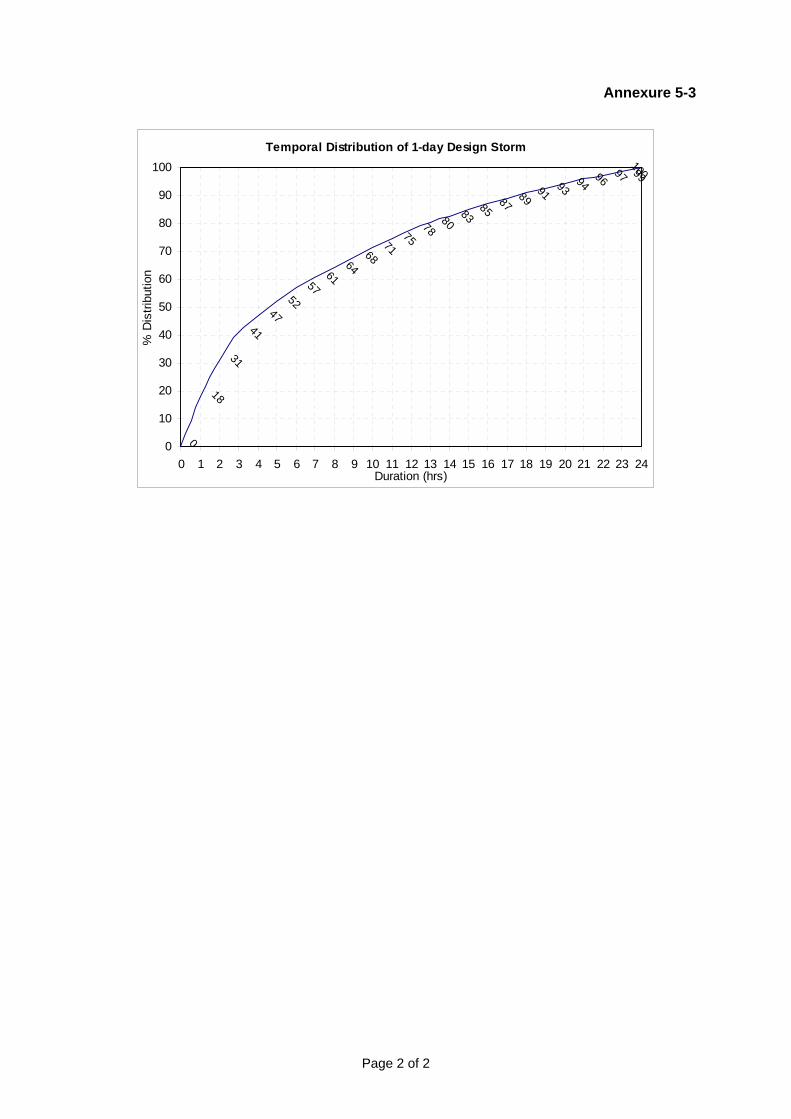
Annexure 5-3
Page 2 of 2
Temporal Distribution of 1-day Design Storm
18
31
41
47
52
5761
6468
7175
7880
8385
8789
9193
9496
97
0
10099
0
10
20
30
40
50
60
70
80
90
100
0 1 2 3 4 5 6 7 8 9 10 11 12 13 14 15 16 17 18 19 20 21 22 23 24Duration (hrs)
% D
istr
ibut
ion
Par Hydroelectric Project (52 MW) Detailed Project Report
Volume-I (Part-I)Main Report
161133-40ER-0007-00
Annexure 5-4 Convolution of Unit
Hydrograph with Rainfall

Par Hydroelectric Project (52 MW)Detailed Project Report
Volume-I (Part-I)Main Report
Annexure 5-4Daily Rainfall = 350.6 mm
Baseflow (Rainfed) = 21.00 cumec
Total Baseflow = 21 cumec
Time (hr)UH
Ordinate (m3/s)
0.00 0.00 0.01 0.01 0.10 0.10 0.44 0.65 0.99 0.17 0.01 0.00 0.57 0.57 0.65 0.65 0.97 0.97 2.18 2.91 4.12 1.21 0.65 0.57DSRO
(m3/sec)
Design Flood
(m3/sec)
0 0 0.00 0.00 211 32 0.00 0.00 0.00 212 65 0.00 0.00 0.00 0.00 213 118 0.00 0.00 0.34 0.00 0.34 214 230 0.00 0.00 0.70 0.34 0.00 1.04 225 202 0.00 0.00 1.27 0.70 3.26 0.00 5.23 266 152 0.00 0.00 2.48 1.27 6.63 3.26 0.00 13.64 357 115 0.00 0.00 2.18 2.48 12.03 6.63 14.21 0.00 37.52 598 84 0.00 0.00 1.64 2.18 23.45 12.03 28.85 20.77 0.00 88.92 1109 59 0.00 0.00 1.24 1.64 20.60 23.45 52.38 42.19 31.71 0.00 173.21 194
10 42 0.00 0.00 0.90 1.24 15.50 20.60 102.10 76.59 64.42 5.45 0.00 286.80 30811 29 0.00 0.00 0.64 0.90 11.73 15.50 89.67 149.29 116.94 11.07 0.34 0.00 396.09 41712 17 0.00 0.00 0.45 0.64 8.56 11.73 67.48 131.12 227.94 20.10 0.70 0.00 0.00 468.71 49013 10 0.00 0.00 0.31 0.45 6.02 8.56 51.05 98.66 200.19 39.18 1.27 0.00 18.18 0.00 423.89 44514 6 0.00 0.00 0.18 0.31 4.28 6.02 37.29 74.65 150.64 34.41 2.48 0.00 36.94 18.18 0.00 365.38 38615 4 0.00 0.00 0.11 0.18 2.96 4.28 26.19 54.52 113.97 25.89 2.18 0.00 67.06 36.94 20.77 0.00 355.05 37616 2 0.00 0.00 0.06 0.11 1.73 2.96 18.64 38.30 83.25 19.59 1.64 0.00 130.70 67.06 42.19 20.77 0.00 427.00 44817 0 0.00 0.00 0.04 0.06 1.02 1.73 12.87 27.26 58.47 14.31 1.24 0.00 114.79 130.70 76.59 42.19 31.12 0.00 512.41 53318 0.00 0.02 0.04 0.61 1.02 7.55 18.82 41.62 10.05 0.90 0.00 86.38 114.79 149.29 76.59 63.21 31.12 0.00 602.02 62319 0.00 0.02 0.41 0.61 4.44 11.03 28.74 7.15 0.64 0.00 65.35 86.38 131.12 149.29 114.74 63.21 69.91 0.00 733.04 75420 0.00 0.20 0.41 2.66 6.49 16.85 4.94 0.45 0.00 47.73 65.35 98.66 131.12 223.65 114.74 142.01 93.19 0.00 948.47 96921 0.00 0.20 1.78 3.89 9.91 2.90 0.31 0.00 33.53 47.73 74.65 98.66 196.42 223.65 257.81 189.30 131.99 0.00 1272.73 129422 0.00 0.89 2.60 5.95 1.70 0.18 0.00 23.87 33.53 54.52 74.65 147.80 196.42 502.50 343.64 268.10 38.88 0.00 1695.24 171623 0.00 1.30 3.96 1.02 0.11 0.00 16.48 23.87 38.30 54.52 111.83 147.80 441.33 669.82 486.71 78.97 20.77 0.00 2096.78 211824 0.00 1.98 0.68 0.06 0.00 9.66 16.48 27.26 38.30 81.68 111.83 332.09 588.27 948.67 143.36 42.19 18.18 2360.70 238225 0.00 0.34 0.04 0.00 5.68 9.66 18.82 27.26 57.37 81.68 251.25 442.66 833.18 279.42 76.59 36.94 2120.91 214226 0.00 0.02 0.00 3.41 5.68 11.03 18.82 40.84 57.37 183.52 334.91 626.95 245.41 149.29 67.06 1744.31 176527 0.00 0.00 2.27 3.41 6.49 11.03 28.20 40.84 128.90 244.63 474.33 184.66 131.12 130.70 1386.59 140828 0.00 1.14 2.27 3.89 6.49 16.53 28.20 91.76 171.82 346.47 139.71 98.66 114.79 1021.74 104329 0.00 1.14 2.60 3.89 9.72 16.53 63.36 122.31 243.35 102.05 74.65 86.38 725.98 74730 0.00 1.30 2.60 5.83 9.72 37.14 84.45 173.23 71.68 54.52 65.35 505.84 52731 0.00 1.30 3.89 5.83 21.85 49.51 119.61 51.02 38.30 47.73 339.05 36032 0.00 1.94 3.89 13.11 29.12 70.12 35.23 27.26 33.53 214.21 23533 0.00 1.94 8.74 17.47 41.25 20.65 18.82 23.87 132.75 15434 0.00 4.37 11.65 24.75 12.15 11.03 16.48 80.43 10135 0.00 5.82 16.50 7.29 6.49 9.66 45.76 6736 0.00 8.25 4.86 3.89 5.68 22.69 4437 0.00 2.43 2.60 3.41 8.44 2938 0.00 1.30 2.27 3.57 2539 0.00 1.14 1.14 2240 0.00 0.00 2141 0.00 21
CONVOLUTION OF UNIT HYDROGRAPH FOR 50-Year Return Period
EFFECTIVE RAINFALL (cm)- II BELL EFFECTIVE RAINFALL (cm)- I BELL
161133-40ER-0007-00 Page 1 of 3
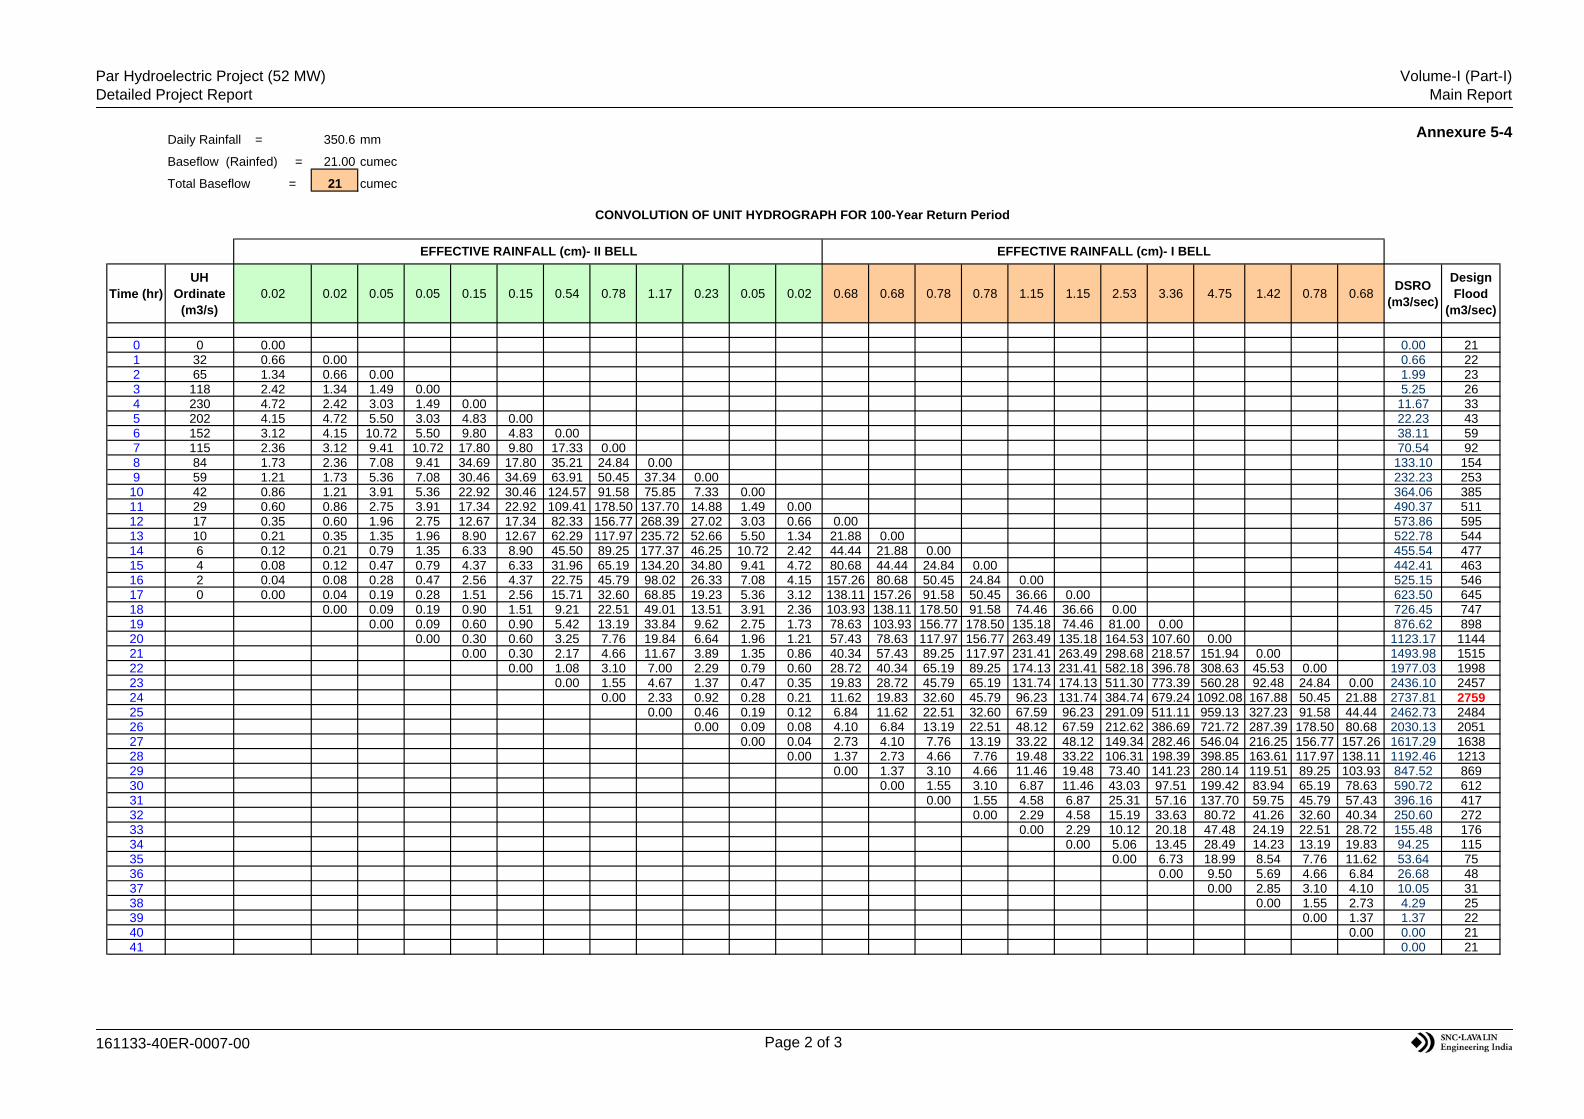
Par Hydroelectric Project (52 MW)Detailed Project Report
Volume-I (Part-I)Main Report
Annexure 5-4Daily Rainfall = 350.6 mm
Baseflow (Rainfed) = 21.00 cumec
Total Baseflow = 21 cumec
Time (hr)UH
Ordinate (m3/s)
0.02 0.02 0.05 0.05 0.15 0.15 0.54 0.78 1.17 0.23 0.05 0.02 0.68 0.68 0.78 0.78 1.15 1.15 2.53 3.36 4.75 1.42 0.78 0.68DSRO
(m3/sec)
Design Flood
(m3/sec)
0 0 0.00 0.00 211 32 0.66 0.00 0.66 222 65 1.34 0.66 0.00 1.99 233 118 2.42 1.34 1.49 0.00 5.25 264 230 4.72 2.42 3.03 1.49 0.00 11.67 335 202 4.15 4.72 5.50 3.03 4.83 0.00 22.23 436 152 3.12 4.15 10.72 5.50 9.80 4.83 0.00 38.11 597 115 2.36 3.12 9.41 10.72 17.80 9.80 17.33 0.00 70.54 928 84 1.73 2.36 7.08 9.41 34.69 17.80 35.21 24.84 0.00 133.10 1549 59 1.21 1.73 5.36 7.08 30.46 34.69 63.91 50.45 37.34 0.00 232.23 253
10 42 0.86 1.21 3.91 5.36 22.92 30.46 124.57 91.58 75.85 7.33 0.00 364.06 38511 29 0.60 0.86 2.75 3.91 17.34 22.92 109.41 178.50 137.70 14.88 1.49 0.00 490.37 51112 17 0.35 0.60 1.96 2.75 12.67 17.34 82.33 156.77 268.39 27.02 3.03 0.66 0.00 573.86 59513 10 0.21 0.35 1.35 1.96 8.90 12.67 62.29 117.97 235.72 52.66 5.50 1.34 21.88 0.00 522.78 54414 6 0.12 0.21 0.79 1.35 6.33 8.90 45.50 89.25 177.37 46.25 10.72 2.42 44.44 21.88 0.00 455.54 47715 4 0.08 0.12 0.47 0.79 4.37 6.33 31.96 65.19 134.20 34.80 9.41 4.72 80.68 44.44 24.84 0.00 442.41 46316 2 0.04 0.08 0.28 0.47 2.56 4.37 22.75 45.79 98.02 26.33 7.08 4.15 157.26 80.68 50.45 24.84 0.00 525.15 54617 0 0.00 0.04 0.19 0.28 1.51 2.56 15.71 32.60 68.85 19.23 5.36 3.12 138.11 157.26 91.58 50.45 36.66 0.00 623.50 64518 0.00 0.09 0.19 0.90 1.51 9.21 22.51 49.01 13.51 3.91 2.36 103.93 138.11 178.50 91.58 74.46 36.66 0.00 726.45 74719 0.00 0.09 0.60 0.90 5.42 13.19 33.84 9.62 2.75 1.73 78.63 103.93 156.77 178.50 135.18 74.46 81.00 0.00 876.62 89820 0.00 0.30 0.60 3.25 7.76 19.84 6.64 1.96 1.21 57.43 78.63 117.97 156.77 263.49 135.18 164.53 107.60 0.00 1123.17 114421 0.00 0.30 2.17 4.66 11.67 3.89 1.35 0.86 40.34 57.43 89.25 117.97 231.41 263.49 298.68 218.57 151.94 0.00 1493.98 151522 0.00 1.08 3.10 7.00 2.29 0.79 0.60 28.72 40.34 65.19 89.25 174.13 231.41 582.18 396.78 308.63 45.53 0.00 1977.03 199823 0.00 1.55 4.67 1.37 0.47 0.35 19.83 28.72 45.79 65.19 131.74 174.13 511.30 773.39 560.28 92.48 24.84 0.00 2436.10 245724 0.00 2.33 0.92 0.28 0.21 11.62 19.83 32.60 45.79 96.23 131.74 384.74 679.24 1092.08 167.88 50.45 21.88 2737.81 275925 0.00 0.46 0.19 0.12 6.84 11.62 22.51 32.60 67.59 96.23 291.09 511.11 959.13 327.23 91.58 44.44 2462.73 248426 0.00 0.09 0.08 4.10 6.84 13.19 22.51 48.12 67.59 212.62 386.69 721.72 287.39 178.50 80.68 2030.13 205127 0.00 0.04 2.73 4.10 7.76 13.19 33.22 48.12 149.34 282.46 546.04 216.25 156.77 157.26 1617.29 163828 0.00 1.37 2.73 4.66 7.76 19.48 33.22 106.31 198.39 398.85 163.61 117.97 138.11 1192.46 121329 0.00 1.37 3.10 4.66 11.46 19.48 73.40 141.23 280.14 119.51 89.25 103.93 847.52 86930 0.00 1.55 3.10 6.87 11.46 43.03 97.51 199.42 83.94 65.19 78.63 590.72 61231 0.00 1.55 4.58 6.87 25.31 57.16 137.70 59.75 45.79 57.43 396.16 41732 0.00 2.29 4.58 15.19 33.63 80.72 41.26 32.60 40.34 250.60 27233 0.00 2.29 10.12 20.18 47.48 24.19 22.51 28.72 155.48 17634 0.00 5.06 13.45 28.49 14.23 13.19 19.83 94.25 11535 0.00 6.73 18.99 8.54 7.76 11.62 53.64 7536 0.00 9.50 5.69 4.66 6.84 26.68 4837 0.00 2.85 3.10 4.10 10.05 3138 0.00 1.55 2.73 4.29 2539 0.00 1.37 1.37 2240 0.00 0.00 2141 0.00 21
CONVOLUTION OF UNIT HYDROGRAPH FOR 100-Year Return Period
EFFECTIVE RAINFALL (cm)- II BELL EFFECTIVE RAINFALL (cm)- I BELL
161133-40ER-0007-00 Page 2 of 3

Par Hydroelectric Project (52 MW)Detailed Project Report
Volume-I (Part-I)Main Report
Annexure 5-4Daily Rainfall = 350.6 mm
Baseflow (Rainfed) = 21.00 cumec
Total Baseflow = 21 cumec
Time (hr)UH
Ordinate (m3/s)
0.05 0.05 0.08 0.08 0.19 0.19 0.62 0.88 1.31 0.28 0.08 0.05 0.78 0.78 0.88 0.88 1.28 1.28 2.81 3.72 5.25 1.59 0.88 0.78DSRO
(m3/sec)
Design Flood
(m3/sec)
0 0 0.00 0.00 211 32 1.49 0.00 1.49 222 65 3.02 1.49 0.00 4.51 263 118 5.49 3.02 2.41 0.00 10.92 324 230 10.70 5.49 4.89 2.41 0.00 23.48 445 202 9.40 10.70 8.87 4.89 6.07 0.00 39.92 616 152 7.07 9.40 17.29 8.87 12.34 6.07 0.00 61.03 827 115 5.35 7.07 15.18 17.29 22.39 12.34 19.83 0.00 99.45 1208 84 3.91 5.35 11.43 15.18 43.65 22.39 40.27 28.08 0.00 170.26 1919 59 2.74 3.91 8.64 11.43 38.33 43.65 73.11 57.03 41.83 0.00 280.67 302
10 42 1.95 2.74 6.31 8.64 28.85 38.33 142.50 103.54 84.97 8.82 0.00 426.66 44811 29 1.35 1.95 4.43 6.31 21.82 28.85 125.15 201.81 154.25 17.92 2.41 0.00 566.25 58712 17 0.79 1.35 3.16 4.43 15.94 21.82 94.17 177.24 300.65 32.54 4.89 1.49 0.00 658.47 67913 10 0.47 0.79 2.18 3.16 11.20 15.94 71.25 133.37 264.05 63.42 8.87 3.02 24.83 0.00 602.54 62414 6 0.28 0.47 1.28 2.18 7.97 11.20 52.04 100.90 198.69 55.70 17.29 5.49 50.43 24.83 0.00 528.74 55015 4 0.19 0.28 0.75 1.28 5.50 7.97 36.55 73.70 150.33 41.91 15.18 10.70 91.55 50.43 28.08 0.00 514.40 53516 2 0.09 0.19 0.45 0.75 3.23 5.50 26.02 51.77 109.80 31.71 11.43 9.40 178.44 91.55 57.03 28.08 0.00 605.43 62617 0 0.00 0.09 0.30 0.45 1.90 3.23 17.97 36.85 77.12 23.16 8.64 7.07 156.72 178.44 103.54 57.03 41.08 0.00 713.60 73518 0.00 0.15 0.30 1.14 1.90 10.53 25.45 54.90 16.27 6.31 5.35 117.93 156.72 201.81 103.54 83.44 41.08 0.00 826.81 84819 0.00 0.15 0.76 1.14 6.20 14.92 37.91 11.58 4.43 3.91 89.22 117.93 177.24 201.81 151.48 83.44 89.84 0.00 991.95 101320 0.00 0.38 0.76 3.72 8.77 22.22 8.00 3.16 2.74 65.17 89.22 133.37 177.24 295.26 151.48 182.49 119.10 0.00 1263.08 128421 0.00 0.38 2.48 5.26 13.07 4.69 2.18 1.95 45.77 65.17 100.90 133.37 259.32 295.26 331.29 241.91 167.86 0.00 1670.86 169222 0.00 1.24 3.51 7.84 2.76 1.28 1.35 32.59 45.77 73.70 100.90 195.13 259.32 645.73 439.17 340.96 50.83 0.00 2202.07 222323 0.00 1.75 5.23 1.65 0.75 0.79 22.50 32.59 51.77 73.70 147.63 195.13 567.12 856.00 618.97 103.25 28.08 0.00 2706.91 272824 0.00 2.61 1.10 0.45 0.47 13.19 22.50 36.85 51.77 107.84 147.63 426.74 751.79 1206.47 187.44 57.03 24.83 3038.71 306025 0.00 0.55 0.30 0.28 7.76 13.19 25.45 36.85 75.74 107.84 322.86 565.71 1059.59 365.36 103.54 50.43 2735.43 275626 0.00 0.15 0.19 4.66 7.76 14.92 25.45 53.92 75.74 235.83 428.00 797.32 320.88 201.81 91.55 2258.15 227927 0.00 0.09 3.10 4.66 8.77 14.92 37.23 53.92 165.64 312.63 603.23 241.45 177.24 178.44 1801.32 182228 0.00 1.55 3.10 5.26 8.77 21.82 37.23 117.92 219.58 440.62 182.68 133.37 156.72 1328.63 135029 0.00 1.55 3.51 5.26 12.84 21.82 81.42 156.31 309.48 133.43 100.90 117.93 944.47 96530 0.00 1.75 3.51 7.70 12.84 47.73 107.93 220.31 93.72 73.70 89.22 658.42 67931 0.00 1.75 5.14 7.70 28.08 63.27 152.12 66.72 51.77 65.17 441.71 46332 0.00 2.57 5.14 16.85 37.22 89.17 46.07 36.85 45.77 279.63 30133 0.00 2.57 11.23 22.33 52.46 27.00 25.45 32.59 173.62 19534 0.00 5.62 14.89 31.47 15.89 14.92 22.50 105.28 12635 0.00 7.44 20.98 9.53 8.77 13.19 59.92 8136 0.00 10.49 6.35 5.26 7.76 29.87 5137 0.00 3.18 3.51 4.66 11.34 3238 0.00 1.75 3.10 4.86 2639 0.00 1.55 1.55 2340 0.00 0.00 2141 0.00 21
CONVOLUTION OF UNIT HYDROGRAPH FOR SPF
EFFECTIVE RAINFALL (cm)- II BELL EFFECTIVE RAINFALL (cm)- I BELL
161133-40ER-0007-00 Page 3 of 3

Par Hydroelectric Project (52 MW) Detailed Project Report
Volume-I (Part-I)Main Report
161133-40ER-0007-00
PLATES

Plate 5-1
MAP

Plate 5-2