Embed Size (px)
Citation preview

Master’s Thesis Final Report
Precast concrete cores in high-rise buildings
Structural behaviour of precast corner connections
K.V. Tolsma January 2010

Precast concrete cores in high-rise buildings
ii
Author K.V. Tolsma [email protected] +31 6 41471172 Graduation committee Prof.dipl.ing. J.N.J.A. Vamberský Delft University of Technology, president Dr. Ir. M.A.N. Hendriks Delft University of Technology Ir. W.J.M. Peperkamp Delft University of Technology Ir. D.C. van Keulen Ingenieursstudio DCK/ Delft University of Technology Ir. M.M.J. Falger BAM Advies en Engineering

Precast concrete cores in high-rise buildings
iii
Preface
This thesis concludes the Master of Science program at the section of Structural and Building Engineering of the Faculty of Civil Engineering and Geosciences at Delft University of Technology. At the same time it contributes to the Ph.D. research of Ir. D.C. van Keulen on the design, behaviour and construction of tall precast concrete structures. I would like to thank my supervisors, Prof.dipl.ing. J.N.J.A. Vamberský, Dr. Ir. M.A.N. Hendriks, Ir. W.J.M. Peperkamp, Ir. D.C. van Keulen and Ir. M.M.J. Falger, for their enthusiasm and guidance during my research. Their contributions guaranteed a good balance between a scientific approach and a usable result for an engineering firm. In addition to this I would like to acknowledge Joop den Uijl and Yuguang Yang for their assistance on the finite element model, Anne van der Sluis for providing the structural drawings of the Rembrandt Tower, Pieter Slappendel for sharing information on the Maastoren and my fellow students at the graduation room for their consultation. Koos Tolsma Delft, January 10

Precast concrete cores in high-rise buildings
iv
Abstract
In this thesis the structural feasibility of a high-rise core composed of precast elements is studied. A core composed of precast elements differs from a cast in situ core in having connections between the precast elements. From preceding research (Falger, 2003) the stiffness reduction due to the horizontal joints and the open vertical joints can be estimated. There is however no literature available on the structural behaviour of precast corner connections. Since corner connections determine the degree in which the flange core walls are activated more research is required on the structural behaviour of precast corner connections. Therefore the focus of this thesis is on the influence of precast corner connections on the lateral deflections of a core. Three types of precast corner connections are considered:
a. Interlocking halfway connection (IHC) b. Interlocking above ceiling connection (IACC) c. Staggered connection (SC)
Figure 0-1: Three examined corner connections, from left to right: IHC, IACC, SC
With the current state of computational capacity it is not possible model a 40 story 3D core with precast elements with a fine mesh. Therefore the model is split into two models. The local 2D model has a fine mesh to determine the discrete connection stiffness of the considered precast corner connections. This stiffness is subsequently imported as a smeared stiffness between the perpendicular core walls of the global 3D model to study the influence of the corner connections on the structural behaviour of the core.

Precast concrete cores in high-rise buildings
v
Local 2D model of corner connection
The mechanical model of the IHC is depicted in Figure 0-2. With the FE program Atena 2D the discrete stiffness of one precast element is obtained. The discrete stiffness of the corner connection is determined by the combined stiffness of two perpendicular precast elements and can be determined by:
1 2
1 1 1
discreteK K K= +
Figure 0-2: Local 2D model of the IHC in Atena 2D
The load displacement diagram of Figure 0-3 shows for all considered connections an important difference in the behaviour before cracks initiate and after. Before Fr when the concrete ruptures, the behaviour is linear elastic and the shear key is compressed vertically. Reinforcement has no influence on the stiffness of the connection. Considering the dynamic behaviour of the wind load, the imposed load should not exceed Fr since the deformations are reversible in the elastic region. After Fr the shear key rotates and the amount of horizontal reinforcement determines the behaviour until failure. However, the stiffness of the connection is considerable lower after Fr.
Figure 0-3: Load displacement diagrams of the three studied corner connections

Precast concrete cores in high-rise buildings
vi
Global 3D model of core
To obtain realistic results the dimensions and loadings were adopted of the reference project the Rembrandt Tower. The global 3D model is composed of simple core walls connected by interface elements in the corners (see Figure 0-4). This interface has the parameters derived from the discrete connection stiffness. The smeared stiffness is obtained by dividing the discrete stiffness by the connection height and wall thickness. Due to the fact that the connection height of the SC is twice as large compared to the IHC and the IACC the smeared stiffness of the SC is almost half of the remaining connections. The discrete and smeared connection stiffness are given in Table 0-1.
F r [kN] Kdiscre te [MN/m] Ksm eare d [MN/m3] IHC 1709 2879 1694
IACC 600 2689 1582 SC 2185 2846 837
Figure 0-4: Schematisation of global 3D model
Table 0-1: Discrete and smeared corner connections stiffness, valid for connection loads below Fr
Since the shear force in the corners of the global 3D model exceeded the allowable load Fr of the IACC, this connection was rejected. Of the remaining two connections, the IHC has the best structural behaviour since the smeared connection stiffness is twice as large compared to the SC. Furthermore the IHC is able to transfer larger shear stresses in the corner connections compared to the SC. The results of the global 3D model show the influence of the precast corner connections on the lateral deflection of the core. Figure 0-5 shows that the IHC results in an increase of lateral deflections of just 3.3 % compared to a monolithic corner connection. The SC results in an increase of 5.9 %. With regard to the influence of precast corner connections on the lateral deflection it can be concluded that a decreased stiffness of just 3.3 % compared to a monolithic connection forms no hindrance to realise a high-rise structure composed of precast elements.
Figure 0-5: Influence of corner connections on lateral deflection

Precast concrete cores in high-rise buildings
vii
Table of contents
Preface ........................................................................................................................... iii Abstract ............................................................................................................................iv Table of contents....................................................................................................................... vii Chapter 1 : Introduction..................................................................................................... 9
1.1. General .............................................................................................................................. 9 1.2. Problem definition .......................................................................................................... 11 1.3. Objective.......................................................................................................................... 11 1.4. Outline of the report....................................................................................................... 11
PART I: Literature Study.................................................................... 12 Chapter 2 : Reference projects........................................................................................ 13
2.1. Prinsenhof Den Haag ..................................................................................................... 13 2.2. Waterstadtoren Rotterdam ............................................................................................ 14 2.3. Strijkijzer Den Haag....................................................................................................... 15
Chapter 3 : Precast concrete technology...................................................................... 16 3.1. Advantages...................................................................................................................... 16 3.2. Considerations ................................................................................................................ 17 3.3. Stability of precast structural systems ......................................................................... 17 3.4. Precast walls ................................................................................................................... 18 3.5. Connections..................................................................................................................... 18
Chapter 4 : Structural behaviour of high rise cores.................................................. 23 4.1. Core structure ................................................................................................................. 23 4.2. Slenderness ..................................................................................................................... 23 4.3. Lateral loading................................................................................................................ 23 4.4. Deflection of cantilevered beams ................................................................................... 24 4.5. Shear stresses in longitudinal direction ....................................................................... 27
PART II: Research report..................................................................... 30 Chapter 5 : Approach modelling..................................................................................... 31
5.1. Stiffness reduction.......................................................................................................... 31 5.2. Approach ......................................................................................................................... 31 5.3. Global 3D model of core.................................................................................................. 33 5.4. Local 2D model of corner connection ............................................................................. 34
Chapter 6 : Corner connection........................................................................................ 36 6.1. Corner connection solutions........................................................................................... 36 6.2. Shear key......................................................................................................................... 37

Precast concrete cores in high-rise buildings
viii
Chapter 7 : Local 2D model of corner connection...................................................... 38 7.1. Input Atena 2D............................................................................................................... 38 7.2. Interlocking halfway connection.................................................................................... 44 7.3. Interlocking above ceiling connection ........................................................................... 47 7.4. Staggered connection...................................................................................................... 49 7.5. Parameter study local 2D model ................................................................................... 51 7.6. Comparison corner connections..................................................................................... 58
Chapter 8 : Rembrandt Tower ........................................................................................ 64 8.1. General............................................................................................................................ 64 8.2. Parameters for modelling............................................................................................... 65 8.3. Simplifications ................................................................................................................ 66 8.4. Conclusions ..................................................................................................................... 67
Chapter 9 : Global 3D model of core.............................................................................. 68 9.1. Input Atena 3D............................................................................................................... 68 9.2. Influence corner connection stiffness on lateral deflection.......................................... 72 9.3. Verification strength of corner connections .................................................................. 74 9.4. Verification horizontal force in corner connection........................................................ 74 9.5. Conclusions ..................................................................................................................... 76
Chapter 10 : Conclusions and recommendations......................................................... 77 10.1. Conclusions.................................................................................................................. 77 10.2. Recommendations ....................................................................................................... 79
Bibliography ........................................................................................................................... 80 Appendix A: Rembrandt Tower .......................................................................................A.1
A.1. Structural drawings...................................................................................................A.1 A.2. Calculations................................................................................................................A.2
Appendix B: Local 2D model with two elements .......................................................A.11 Appendix C: Shear resistance horizontal joint..........................................................A.12 Appendix D: Results local Atena 2D models ...............................................................A.14 Appendix E: Results global Atena 3D model...............................................................A.22 Appendix F: Input data Atena 2D model .....................................................................A.24 Appendix G: Input data Atena 3D model .....................................................................A.30

Precast concrete cores in high-rise buildings
9
Chapter 1: Introduction
1.1. General
Over the last decades one can see a clear increase in the use of precast concrete technology in high-rise buildings. Main advantage is its high speed of construction, which has become an important factor with respect to the rate of interest of the investment. In addition to this the increased degree of industrialisation offers an answer to the growing prices of labour and the current concerns about environment and working conditions. The Netherlands are at the forefront of new developments in precast concrete technology and several projects have proven that precast concrete can successfully replace traditional cast concrete. The boundaries in terms of height are pushed with every project and the speed of construction is astounding. In recent high-rise projects where precast concrete technology is used two developments can be distinguished: Tube structures, where precast elements in the façade provide structural stability. Figure
1-1 shows an example where the residential building grew with a speed of two stories a week to a height of 131 meter. With precast elements in the façade, a perforated façade is realised, which is a rather closed exterior.
A transparent façade can be realised by means of a core structure. An example is depicted
in Figure 1-2, where all columns, floors and façade elements are prefabricated, but the core is still cast in situ. Casting of the core will become the critical path in the planning, preventing a high construction speed with the prefabricated elements. An optimised structural design would avoid casting the core in situ and consist of only prefabricated elements.
Figure 1-1: Strijkijzer, Den Haag. Tube structure composed of precast concrete elements
Figure 1-2: Carlton, Almere. Apart from the core all structural elements are prefabricated

Precast concrete cores in high-rise buildings
10
Wind loads and core dimensions are imported into global model
Results in discrete connection stiffness,which is imported as a smeared stiffness into global model between core walls
(Chapter 10)
- Best precast corner connection- Influence of connection stiffness on lateral deflection
Determine:
Two elements are separated from global model:- Boundary conditions- Assumptions
Discrete connection stiffness is determined in local 2D Atena model (Chapter 7)
Global 3D Atena model of core(Chapter 9)
Three examined precast corner connections(Chapter 6)
Reference project: Rembrandt Tower(Chapter 8)
discretesmeared
KKh d
=⋅
Figure 1-3: Structure of research report

Precast concrete cores in high-rise buildings
11
The current trend for commercial buildings is towards transparent façades with large glass surfaces. Together with the continued development of transparent glass façades have led to a decline in recent years in the classic perforated façade. Often a reduction of the number of façade elements interfering with transparency is a primary aim. Only columns for vertical load removal are allowed on the façade. This means that all the lateral loads must be assumed in the building interior, i.e. by the core. To combine the current trends for an increasing use of precast concrete technology and a transparent façade a structural design for a high-rise building with a stabilising core composed of only precast elements is desired. However, the current state of art lacks knowledge on the structural behaviour of a high-rise core composed of precast concrete elements. Therefore this thesis aims at the structural design of a high-rise building with a stabilising core and with a load bearing structure composed of only precast concrete elements.
1.2. Problem definition
There is no precedent of a high-rise building stabilised by a core composed of precast concrete elements. Insight is needed how to design and verify high-rise buildings with a core composed of precast concrete elements. Furthermore, the structural behaviour of precast corner connections is unknown, which is essential in activating the flange core walls to create a vertical box girder.
1.3. Objective
The goal of this master’s thesis is to study the structural feasibility of precast concrete cores in high-rise buildings. For this purpose it is necessary to examine the structural behaviour of precast corner connections. The result of this thesis should offer a structural engineer a tool to make a well-founded assessment between a core cast in situ or composed of precast concrete elements.
1.4. Outline of the report
The report is divided into two parts, a literature study and a research report. Readers interested in the findings of the research are advised to start with the research report from Chapter 5. Within the research report is referred to the literature study when theory is used. In Chapter 2 preceding high-rise projects with precast concrete elements are discussed. Chapter 3 describes the characteristics of construction with precast concrete elements. Chapter 4 discusses the structural behaviour and mechanics of a high-rise core. The research report begins with describing the approach to model a high-rise core composed of precast elements in Chapter 5. From this emerged a lack of knowledge on precast corner connections. Chapter 6 describes various precast corner connections which are studied in detail in Chapter 7. The precast corner connections are translated into vertical connection stiffnesses, and subsequently imported as springs between the perpendicular core walls into the global 3D model. In Chapter 9 the influence of the vertical connection stiffness on the lateral deflection of the core of the reference project is analysed. This reference project is the Rembrandt Tower and its characteristics for the 3D model are discussed in Chapter 8. The conclusions and recommendations of this research are described in Chapter 10. The structure of the research report is depicted in Figure 1-3.

Precast concrete cores in high-rise buildings
12
PART I: Literature Study

Precast concrete cores in high-rise buildings
13
Chapter 2: Reference projects
In this chapter preceding developments of high-rise buildings are described where the load-bearing structure is composed of precast concrete elements.
2.1. Prinsenhof Den Haag
Completed in 2004 and with a building height of 95 meter, Prinsenhof is the first high-rise building, in which precast elements are build in a staggered pattern without structural filling of the vertical joints (Falger, 2003). The staggered elements form a façade tube to provide stability to lateral loading.
Figure 2-1: Prinsenhof during construction Figure 2-2: Pattern façade elements

Precast concrete cores in high-rise buildings
14
2.2. Waterstadtoren Rotterdam
The “Waterstadtoren” was with its 36 storeys and 110m of height, in the time of its completion in 2004, the tallest fully pre-cast residential building in Europe. The stability is provided by a system of 250mm thick precast concrete shear walls. The precast concrete elements of these shear walls are staggered in a masonry type manner, providing in this way for an excellent and simple vertical shear transfer (dowel action) and increased stiffness of the shear walls (Vamberský, J.N.J.N., 2007).
Figure 2-3: Waterstadtoren Figure 2-4: Floor plan

Precast concrete cores in high-rise buildings
15
2.3. Strijkijzer Den Haag
This residential tower was completed in 2007 and was situated on a very small building site. An earlier design was planned with a fully cast in situ structure. Due to the higher construction speed and logistics was decided to use precast concrete elements from the fourth floor up. In the lower floors steel sections were cast into the concrete columns to guarantee its stiffness under tension. The stability of the building is provided by a façade tube composed of precast concrete elements.
Figure 2-5: Strijkijzer during construction
Figure 2-6: Layout precast concrete elements
To reduce the shear lag and to provide better structural integrity, the longer sides of the tube are connected by webs that are formed by floor bearing precast concrete walls. The shapes of the precast concrete wall and façade elements are interlocking to provide a dowel action for transfer of vertical shear and to prevent labour intensive connections in vertical joints between the precast concrete walls and façade elements. In the design calculation the moment of inertia is reduced with 25 % to take into account the shear lag and 25 % reduction for shear deformation. Afterwards this is checked with finite element software. The model was composed of beams and plate elements (Font Freide et al 2006). With a 6 day working week two floors a week was realised.

Precast concrete cores in high-rise buildings
16
Chapter 3: Precast concrete technology
3.1. Advantages
The increased use of precast concrete technology can be explained by the numerous advantages it offers. Building sites are notorious for the so called ‘3D-syndrom’: dirty, dangerous and difficult. Precast concrete technology counteracts this reputation by reducing the labour on site and bringing it to a better controlled environment. An overview of the advantages and considerations of using precast concrete are given below.
• The main advantage is the speed of construction. Although precast concrete technology requires a relatively long lead-in time, the construction time is reduced substantially, creating a financial advantage with a smaller amount of money spent on interest (see Figure 3-1). Also the nuisance for people living in the neighbourhood is reduced.
Figure 3-1: Financial advantage of prefabrication (Vamberský 2005, p. I-2)
• When working on a small construction site with a lack of storage space, there is an advantage in using precast concrete, since these elements can immediately be assembled upon arrival at the site. In this case there is no space required to store material, formwork, reinforcement, etc.
• Prefabricated concrete is, in general, of a better quality than cast in situ concrete. The density of the concrete is higher and the temperature can be controlled in the factory. Using precast concrete in cores leads to higher strengths and stiffness for the elements. Other benefits are increased durability (density of concrete) and aesthetics (high level of finishing).
• Environmental aspects. Construction with precast concrete takes place with less hindrance to the environment. The precast concrete structures are more or less demountable, for possible re-use or demolition at places other than the building site itself.
• Reduction of risks contractor. By subcontracting the largely fluctuating structural labour to the pre-caster, the main contractor reduces these risks and the pre-caster gains more continuity.

Precast concrete cores in high-rise buildings
17
• Reduces labour on site (3D syndrome), towards a better controlled environment. This also reduces the loss of time due to vertical transport of labour (Pronk, 2002, p.72). This advantage grows with greater heights, see Figure 3-2.
0
2
4
6
8
10
12
14
1 2 3 4 5 6 7 8 9 10 11 12 13 14 15 16 17 18 19 20 21 22 23 24 25 26 27 28
Floor
Hou
rs
Figure 3-2: Loss of man-hour, per week per construction worker, by vertical transport vs. increasing number of stories (Pronk, 2002)
3.2. Considerations
• Vertical transport of the precast elements is a particular point of interest in high-rise buildings. When casting the core in situ, a concrete pump can provide a continuous supply of concrete. When constructing with precast elements there will be considerable ascend and descend losses of time, which will increase with greater heights. Furthermore the construction can be delayed when wind conditions make hoisting impossible. Although there is also a reduction of vertical transport of labour and no transport of reinforcement and formwork, vertical transport of the precast elements can become the critical path in the planning with traditional hoisting techniques (Pronk 2002). Het Strijkijzer demonstrated that with traditional hosting techniques construction of two storeys in one week was possible. As in this thesis the structural system is different and the total height of the building will be higher, vertical transport will play an important role in the success of a project, however this thesis focuses on the structural behaviour of the core and the aspect vertical transport will not be dealt with in this thesis.
• In contradiction with a structure cast in situ, a precast structure lacks structural continuity. Without proper connections a structure build with precast elements can be seen as a house of cards.
3.3. Stability of precast structural systems
For a high speed of erection, simple connections are required. These connections are therefore mostly executed as pinned connections and are not able to transfer moments. For high-rise buildings it is necessary to apply special stabilising structures such as shear walls or cores. If these structures are cast in situ the time needed for reinforcing, placing the formwork, concreting and stripping can be rather long. In this way the assembly of the precast structure will be interrupted several times. It may therefore be advisable to construct the stabilising structures with precast concrete elements as well. The assembly of the core is then part of the whole erection procedure and in the hands of one firm or organisation responsible here for.

Precast concrete cores in high-rise buildings
18
This is the reason why nowadays more and more cores and shear walls are also made of precast concrete. However, for heights mentioned in this thesis, no such precast cores exist.
3.4. Precast walls
The main functions of the prefabricated walls in the core are: • bearing a part of the vertical load • stabilising the total structure • dividing areas/functions • fire protection.
The prefabricated walls resist the horizontal load in its own plane. In that case the prefabricated wall should behave as one structural unit composed of interacting wall elements, see Figure 3-3. This structural interaction within the wall needs to be secured by structural connections that resist the required shear forces, tensile forces and compressive forces.
Figure 3-3: In-plane action of prefabricated wall, a) shear forces, b) tensile and compressive forces
To perform properly, the prefabricated wall elements must be connected in such a way that shear forces can be transmitted. The connections can be dry or wet. The concrete or mortar used in wet connections needs time to harden. This may negatively influence the progress of the assembly process (Vamberský 2005, p. I-13).
3.5. Connections
To ensure good structural behaviour, measures need to be taken to realise proper connections. In contradiction with a structure cast in situ, a precast structure lacks structural continuity. Without proper connections a structure build with precast elements can be seen as a house of cards. This conflicts with the purpose of a core, to provide stability to the building. Also, the greater the height, the larger the normal and shear stresses between the precast elements will be. With these considerations in mind, a high-rise building with a core structure of precast concrete elements requires particular attention on connections. To achieve a high speed of construction it is essential that simple and easy to handle solutions are pursued at all stages of the construction process. This is even more valid when it comes to connections in precast concrete. As this thesis focuses on high rise cores made of precast walls, the connections between the vertical elements are studied. Three connections between precast walls can be distinguished: • Horizontal joints between wall elements • Vertical joints between parallel elements • Vertical joints between perpendicular elements (corner connections)

Precast concrete cores in high-rise buildings
19
Figure 3-4: Connections of precast concrete elements
3.5.1. Horizontal joints between wall elements
To realise good interaction between the precast elements in the horizontal joints normal and shear forces must be transferred in the joint. A well proven connection is the grouted starter bar connection (Figure 3-5). The starter bar is protruding out of the lower element and the upper element is provided with a sleeve that is filled with grout by pouring. This connection has a high reliability, requires no skilled labour, has a relative high fitting tolerance, and can carry over the full steel stress of the starter bar (FIB 2008, p.24). Normal stress The mortar in the horizontal joints between the precast elements cannot transfer tensile forces. The protruding bars can, but since the steel area is small compared to the concrete area, small tensile stresses can lead to high forces in the protruding bars. In this thesis it is assumed that the horizontal joints with grouted starter bar connection cannot transfer tensile forces. Compressive forces on the other hand can be easily transferred from one element to another, through, for instance mortar joints, which are easy and cheap to make. Combined with the appropriate mortar the normal stiffness is comparable to the normal stiffness of the adjoining concrete.
Figure 3-5: Lowering the upper element over the protruding bars (Handboek prefab beton)
Shear stress Determination of the shear resistance of the horizontal joint is more complicated as it is dependent of the normal stress in the joint. Eurocode 2 section 6.2.5 gives a general expression to estimate the design shear resistance of the horizontal joint:

Precast concrete cores in high-rise buildings
20
( sin cos ) 0,5Rdi ctd n yd cdv c f f fμ σ ρ μ α α υ= ⋅ + ⋅ + ⋅ + ≤ ⋅ ⋅ (3.1) where vRdj is the design shear resistance at the interface c and μ are factors which depend on the roughness of the interface (for very smooth
interfaces: c = 0.25 and μ = 0.5) fctd is the design tensile strength σn is the stress per unit area caused by the minimum external normal force
across the interface that can act simultaneously with the shear force, positive for compression, such that σn < 0.6 fcd, and negative for tension. When σn is tensile, c fctd should be taken as 0.
ρ = As / Ai (area of reinforcement crossing the interface / area of the joint) α is the angle between the joint and the reinforcement
υ is a strength reduction factor 0.6 [1 ]250ckfυ = ⋅ −
The first part of expression (3.1) takes the bond between the joint material and precast elements into account. This adhesive bond depends to a large extent on workmanship and cleanness of the joint faces during grouting. If the joint faces are dirty from sand, cement or oil wastes, the adhesive bond can be entirely lost. There is also a risk that even well executed joints crack because of restraint actions in the structure. That means that in practice, it is not possible to rely on adhesive bond for shear transfer, meaning the first part of the expression is zero. This, together with an angle of 90 degrees between the joint and the reinforcement expression (3.1) becomes:
0,5Rdi n yd cdV f fμ σ μ ρ υ= ⋅ + ⋅ ⋅ ≤ ⋅ ⋅ (3.2)
3.5.2. Vertical joints between parallel elements
Traditional joints The horizontal joints between precast elements can be connected in various ways; the most widely used are depicted in Figure 3-6. Joints a and b are concrete filled reinforced vertical joints and form a continuous connection. Joint c and d are welded vertical joints and form a discrete connection. Both connections are labour-intensive, delay the construction. The concrete filled connection can not transfer forces until the concrete has hardened, but when hardened has a high shear capacity. The welded connection can transfer forces as soon as the weld is completed but its shear capacity is low. Indications of the shear stiffness for the mentioned connections are given in Table 3-1. The stiffness K is defined as the resistance to
deformation by an applied force: uu
u
Kτδ
= , where δu, the displacement when the connection
fails, is assumed at 1 mm.
Figure 3-6: Various vertical joint connections between precast elements
Vertical joint Shear stiffness K [MN/m3] a – concrete filled reinforced with plain joint faces 1310 b – concrete filled reinforced with dented joint faces 3600 c – welded cast in steel plates 560 d – welded cast in UNP profile 900
Table 3-1: Indications of shear stiffness for various vertical joints (Falger)

Precast concrete cores in high-rise buildings
21
Open vertical joints The master’s thesis of Falger studies the influence of staggered precast elements with open vertical joints on the structural behaviour of a concrete structural system. The structural system consists of 24 floors with a height of 3.6 meter, which forms a 2D wall with a thickness of 0.3 meter. The perpendicular flange walls were not activated as is the case in this thesis. Four layouts were studied as depicted in Figure 3-7 to understand the influence of the openings. Type A and B are relevant for this thesis.
Figure 3-7: Layouts with variation in openings studied in thesis Falger
To transfer the shear stresses in longitudinal direction six different vertical joints were studied as depicted in Figure 3-8. The first joint is monolithic, joints 2 to 5 are concreted and welded connection according to Figure 3-6 between elements with a width of 3.6 meter. Joint 6 is an open vertical joint where the shear stresses are transferred by a staggered layout of the elements as depicted in Figure 3-8, the width largest element is 5.4 meter. The width of the opening is 1.8 meter and the height is 2.8 meter.
Figure 3-8: Position of the vertical joints of type B in thesis Falger
The four layouts were modelled in a finite element program. The vertical joints were varied and the results of the deformations are depicted in Table 3-2 and Table 3-3.
Monolithic a - plain b - dented c - plate d - UNP Open δtop [mm] 51.5 57.5 55.1 62.7 59.3 54.2 δtop [%] 100.0 111.8 107.0 121.8 115.3 105.3
Table 3-2: Lateral displacement at the top for Type A – closed wall, with different vertical joints (Falger)
Monolithic a - plain b - dented c - plate d - UNP Open δtop [mm] 63.4 76.7 70.0 76.0 73.4 68.5 δtop [%] 100.0 121.0 110.3 119.9 115.7 108.0
Table 3-3: Lateral displacement at the top for Type B – central openings, with different vertical joints (Falger)

Precast concrete cores in high-rise buildings
22
From Table 3-2 and Table 3-3 it can be concluded that with staggered elements with open vertical joints the deformations increase with merely 5.3% in case of a closed wall and 8.0 % in case of a wall with central openings. The staggered configuration with open vertical joints leads to smaller deformations than the traditional connections. With regard to the increase of deformation due to the central openings, for the staggered configuration this increase is 68.5 52.4
52.4 30.7%− = .
3.5.3. Vertical joints between perpendicular elements
To design an efficient lateral stiffening structure it is important to transfer shear forces at corner connections. This activates the flange plates to create a box girder. If this interaction between the walls is accounted for in the stabilising system, the connections along the vertical joints must be able to resist the corresponding shear forces and must be designed and detailed accordingly
Figure 3-9: Preparations for precast corner connection
Besides solutions with welded connections and concrete filled joints, one possibility is also to interlock elements. This provides a connection with shear capacity. Examples of these corner connections are depicted in Figure 3-10 and Figure 3-11. Although this connection method is frequently applied, the exact structural behaviour is unknown (Bennenk, chapter 10 p.77). One of the goals of this thesis is to determine the structural behaviour of these interlocking corner connections.
Figure 3-10: Staggered corner connection at Maastoren Figure 3-11: Interlocking elements with shear key above
ceiling at Strijkijzer

Precast concrete cores in high-rise buildings
23
Chapter 4: Structural behaviour of high rise cores
4.1. Core structure
With precast elements in the façade, a rather closed exterior is achieved, suitable for residential buildings. Office buildings require often open façades, with large glass surfaces. Advances in glass technology and the continued development of transparent glass façades have led to a decline in recent years in the classic perforated façade. Often a reduction of the number of façade elements interfering with transparency is a primary aim. Only columns for vertical load removal are allowed on the façade. This means that all the lateral loads must be assumed in the building interior, i.e. by the core (Eisele 2003, p.86). The elevator shafts, stairwell and respective anterooms necessary for access in a high-rise must be protected by fire walls, as demanded by fire safety regulations. Reinforced concrete walls are normally used. It makes sense to exploit them in improving the building’s rigidity. Because of functionally necessary openings in the core (elevator and stair doorways, shaft outlets, etc.) the individual walls are not connected to one another directly, but are often coupled by means of girders. These coupled shear walls form highly complicated structural systems.
4.2. Slenderness
The smaller the width of the lateral load bearing structure, the smaller the level arm to resist the moment due to wind load. So the more slender the core, the higher are the stresses in the concrete. If there is not enough dead load on the core, tensile stresses will occur. A higher slenderness ratio also leads to larger shear forces the precast elements need to transfer. The slenderness of most high-rises – meaning the ratio of height to width – generally has a value up to eight. With a value of 9.4, problems with tensile stresses in the core can be expected. The width of the building is governed by regulations governing office depth. In Europe, regulations governing office depth mean workstations can be placed to a distance of 7 m from the window, so the maximum usable building depth is limited to around 30-40 m. With a slenderness ration of eight, the maximum possible height is the 240-320m. In America, by comparison, workstations are commonly placed up to 20m from windows resulting in larger building depths of 50-60 m, allowing greater heights to be realized (Eisele 2003, p.82).
4.3. Lateral loading
In areas with low seismic activity, wind loading governs the design the load-bearing structure of a high-rise building. The behaviour of a high-rise structural system under lateral loading is comparable to a cantilever fixed into the subsoil (Figure 4-1).

Precast concrete cores in high-rise buildings
24
Figure 4-1: Core schematised as a cantilever fixed into the subsoil
When assuming a uniform lateral load, the fixed-end moment on the cantilever increases quadratically with the height. In reality the horizontal loads are not constant over the height but increase. Thus the moment towards the base increases more rapidly (see Figure 4-2).
Figure 4-2: Behaviour of high-rise structure under lateral loading (Eisele and Kloft, 2003)
The absorption of the horizontal loads and the ability to transmit the resulting moment into the foundation is a primary task in the structural design of a tall building. Existing stairwell cores with their continuous vertical elements are highly suited for removing the loading. Another option is to treat the entire high-rise building as a clamped tube. The latter is used in projects like “Prinsenhof” and “Strijkijzer”.
4.4. Deflection of cantilevered beams
Mechanics provide differential equations to describe the deflection w (see Figure 4-1) of a cantilevered beam. Without door openings a core structure will behave partly as a bending beam and partly as a shear beam. Determination of the deflection is relatively simple and discussed in section 4.4.1. and 4.4.2. With openings the core is less stiff and will behave like coupled shear beams as described in section 4.4.3. , determination of the displacement is more complicated.
4.4.1. Beam bending
When the shear strains are neglected the core bends due to shortening of the compressed side and elongation of the tensile side, as depicted in Figure 4-3 (b). The governing differential equation reads as (Bouma 2002):
4
4
d wq EIdx
= (4.1)
after integrating the deflection w can be read as: 4 3 2 2( 4 6 )
24qw x x l x lEI
= − + (4.2)

Precast concrete cores in high-rise buildings
25
Figure 4-3: Deflection as a shear beam (a) and with beam bending (b) (Bouma 2002)
4.4.2. Shear beams
When strain is neglected, the core experiences shear deformation as depicted in Figure 4-3 (a). The governing differential equation reads as (Bouma 2002):
2
2
d wq GAdx
= (4.3)
Where GA is the shear rigidity of the core. After integrating the deflection w can be read as: 2(2 )
2qw lx xGA
= − (4.4)
For the core of the reference project the Rembrandt Tower (see Chapter 8) the deflection is calculated as a shear beam and for beam bending, see Figure 4-4. It is clear that the influence of shear deformation for large height is very small (at the top 2 %) compared to the deflection due to beam bending. For frame structures this influence is larger, but concrete cores have such large shear rigidity that beam bending governs the deflection. According to Bouma the combined deformation of shear and bending can be added according to:
4 3 2 2 2( 4 6 ) (2 )24 2q qw x x l x l lx xEI GA
= − + + − (4.5)
0
20
40
60
80
100
120
140
0 10 20 30 40 50
Height [m]
Deflection [mm]
Beam bending
Shear beam
Combined
Figure 4-4: Deflection of reference project calculated as shear beam and for beam bending

Precast concrete cores in high-rise buildings
26
4.4.3. Coupled shear walls
Because of functionally necessary openings in the core the individual walls are not connected to one another directly, but are often coupled by means of girders or lintels. These coupled shear walls form highly complicated structural systems. Due to the horizontal coupling the horizontal deformation between the cores is the same and the stiffness’s can be added. Due to the moment resisting connection between the lintel and the cores, a restoring moment is formed in the coupling support and the deformation is reduced further. Figure 4-5 shows schematically the influence of rigid coupling elements.
Figure 4-5: Schematisation of coupled shear walls (Eisele and Kloft, 2003)
The stiffness of the total core depends to a large extent on the stiffness of the lintel. When the lintel is as stiff as the walls, the moment of Inertia will be 1/12bh3. With no lintel, the total moment of inertia of these two cores will be roughly 2x1/12b(1/2h)3 = 1/48bh3. Four times less stiff. So it is very important to make the lintel as stiff as possible. Continuous medium method One of the methods to analyse coupled wall structures is the continuous medium method (Smith, 1991). The structure is simplified by making the assumption that all horizontal connecting elements are effectively smeared over the height of the building to produce an equivalent continuous connection medium between the vertical elements. In Appendix A.2.4 the lateral deflections of the simplified core of the Rembrandt Tower are calculated with the theory of Smith and Coull (1991) and compared with the beam bending theory. The results are depicted in Figure 4-6. The deflection at the top is 52 mm for the coupled shear walls method and 46 mm for the beam bending method, an increase of 15 %. The shape of the curve is comparable, although a slight S-shape in the curve indicates more shear deformation, so the simple beam bending method provides quick and comparable insight into the deflections of a core if the deflections are enlarged with 15 %.
0
20
40
60
80
100
120
140
0 10 20 30 40 50 60
Height [m
]
Deflection [mm]
Beam bending
Coupled shear beams
Figure 4-6: Comparison lateral deflection of coupled shear walls and beam bending method
Precast concrete cores in high-rise buildings
27
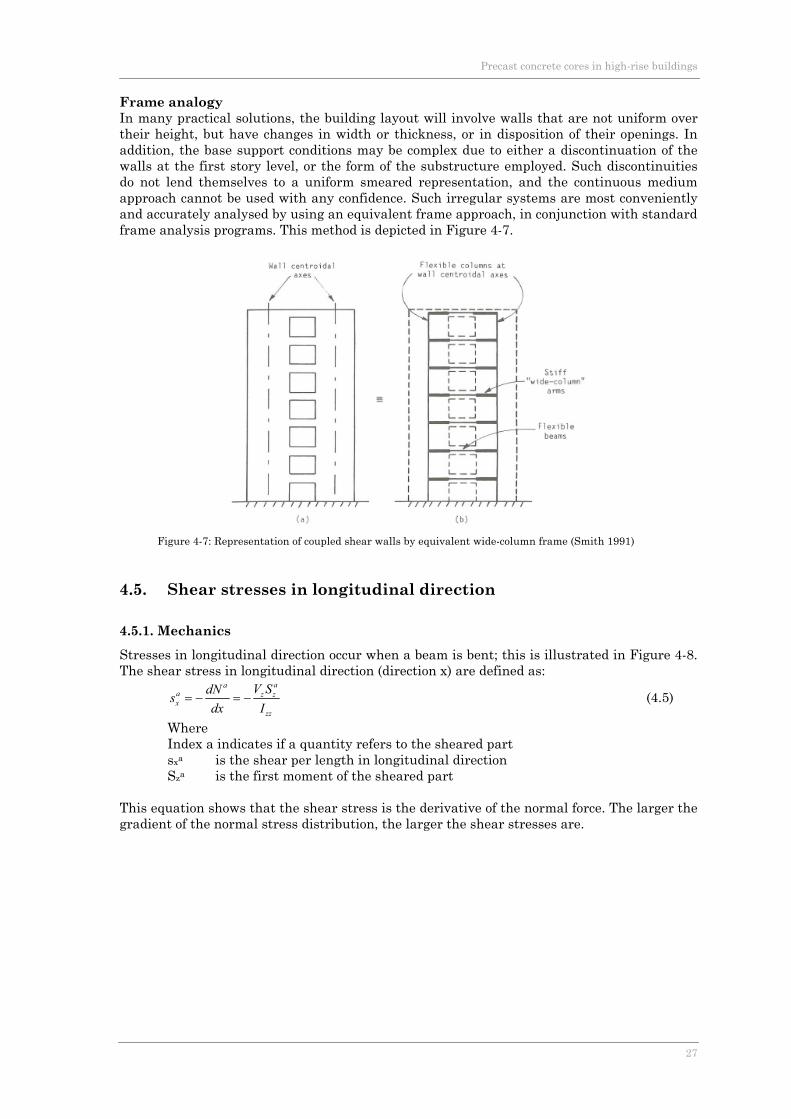
Frame analogy In many practical solutions, the building layout will involve walls that are not uniform over their height, but have changes in width or thickness, or in disposition of their openings. In addition, the base support conditions may be complex due to either a discontinuation of the walls at the first story level, or the form of the substructure employed. Such discontinuities do not lend themselves to a uniform smeared representation, and the continuous medium approach cannot be used with any confidence. Such irregular systems are most conveniently and accurately analysed by using an equivalent frame approach, in conjunction with standard frame analysis programs. This method is depicted in Figure 4-7.
Figure 4-7: Representation of coupled shear walls by equivalent wide-column frame (Smith 1991)
4.5. Shear stresses in longitudinal direction
4.5.1. Mechanics
Stresses in longitudinal direction occur when a beam is bent; this is illustrated in Figure 4-8. The shear stress in longitudinal direction (direction x) are defined as:
aa
a z zx
zz
V SdNsdx I
= − = − (4.5)
Where Index a indicates if a quantity refers to the sheared part
sxa is the shear per length in longitudinal direction Sza is the first moment of the sheared part This equation shows that the shear stress is the derivative of the normal force. The larger the gradient of the normal stress distribution, the larger the shear stresses are.

Precast concrete cores in high-rise buildings
28
Figure 4-8: Left: two beams glued together, right: beams are disconnected and shift mutually
Figure 4-9: Shear stresses in longitudinal direction are necessary to prevent mutual shifting
4.5.2. Shear stresses in vertical joints
A great deal of research is done into vertical joints in parallel walls as depicted in Figure 4-10. Due to the wind load the core deflects. The windward side elongates, and the sheltered side shortens. This results in shear stresses in the vertical joints. These stresses need to be transferred by the connections.
Figure 4-10: Shear stresses in vertical joint due to wind load (Stupré, 1993)
The displacements of the elements on both sides of the vertical joints will not be the same, slip between the elements will occur. The displacement between two elements is determined by the shear stiffness K. The shear stiffness is defined as the ratio between the ultimate shear stiffness capacity τu and the deformation at failure δu (see Figure 4-12):
utt
u
Kτδ
= [N/mm3] (4.6)
Figure 4-11: Deformation of horizontal joint due to shear stress
Figure 4-12: Bi-linear load displacement diagram of a joint

Precast concrete cores in high-rise buildings
29
Two extremes can be extinguished for the K value: • K → ∞, monolithic wall • K = 0, two separate walls
For structural joints between precast elements, the K value will be between these two extremes.
Figure 4-13: Influence of K value on deflection and stress distribution (Stupré, 1993)
Since a design of a high-rise building is governed by requirements for deflections at the top, it is clear the K values are of major importance when building a core structure out of precast elements. The importance of the stiffness of a corner connection is demonstrated in the next section.
4.5.3. Flange activation
To design an efficient lateral stiffening structure it is important to transfer shear forces at corner connections. This activates the flange plates to create a box girder. This increases the moment of inertia of the core. To indicate the influence of the flange activation, the moment of inertia is compared to a core with, and without core connections to transfer shear forces. A rectangular core is taken with a width and depth of ‘l’ and a thickness ‘d’. When no shear forces are transferred in the corners, the core can be seen as two shear walls to resist the lateral load.
No corner connections: 3 31 212 122 { }zzI d l d l= ⋅ ⋅ ⋅ = ⋅ ⋅
Box girder: 3 2 3 3 381 1 1 112 2 12 4 122 { ( ) } 2 { }zzI d l l d l d l d l d l= ⋅ ⋅ ⋅ + ⋅ ⋅ ⋅ = ⋅ ⋅ ⋅ + ⋅ ⋅ = ⋅ ⋅
So the contribution of Steiner increases the resistance with a factor four. With a core made of precast elements there will be a loss of stiffness in the corner connection in contrast to cast in situ cores. The lower the stiffness of these corner connections (K value), the less the flange panels are activated. Since the attribution of the flange panels is large, the importance of a stiff corner connection is clear. The K values of various corner solutions are studied in Chapter 7.
Figure 4-14: Normal stress distribution due to wind load

Precast concrete cores in high-rise buildings
30
PART II: Research report

Precast concrete cores in high-rise buildings
31
Chapter 5: Approach modelling
This Chapter explains the applied approach to model a core composed of precast elements. Basic principle of the approach is the focus on lateral deflection, since for areas with low seismic activities the design of a high-rise building is governed by requirements for deflections at the top. Therefore, a sound design with precast elements strives for a minimal deflection at the top, in other words: a stiff core. In an early design stage a structural designer desires a quick global assessment of the stiffness of a core. For a cast in situ core determination of the stiffness can be made with a hand calculation (section 4.4) in case of a uniform (over the height) core, or with frame analogy (section 4.4.3. ) in case of a non uniform core. The approach for a quick assessment for a core made of precast elements is to reduce the stiffness of the cast in situ core with a certain factor, which will be discussed in the next section.
5.1. Stiffness reduction
A core composed of precast elements differs from a cast in situ core by its connections between the elements. There are various connections, each reducing the stiffness of the core:
a) Horizontal joints between precast elements b) Open vertical joints between parallel elements due to staggered precast elements c) Vertical perpendicular connection between inner core wall and outer core wall d) Vertical precast corner connection
The influence of the first two connections are studied by (Falger, 2003) and discussed in section 3.5.2. With the assistance of this research the stiffness reduction due to the horizontal joints and the open vertical joints can be estimated. The remaining connections are somewhat related since they both concern perpendicular precast connections. For both connections no literature is available on its structural behaviour and its influence on the lateral deflection. Due to its greater distance to the neutral axis of the core the contribution of the outer walls is far greater on the moment of inertia of the core. Therefore this thesis focuses on determining the structural behaviour of precast corner connections and its influence on the overall stiffness of the core.
5.2. Approach
In Figure 5-1 the structure of the research is depicted, where the problem is split into two models, the global 3D model of the core and the local 2D model of the corner connection. It would have been ideal to have only one 3D model with all the staggered or interlocking corner connections. However, to obtain reliable results a fine mesh is required where the stresses are high: around the corner contacts. With the current state of computational capacity it is not possible to solve this extensive 3D model.

Precast concrete cores in high-rise buildings
32
Wind loads and core dimensions are imported into global model
Results in discrete connection stiffness,which is imported as a smeared stiffness into global model between core walls
(Chapter 10)
- Best precast corner connection- Influence of connection stiffness on lateral deflection
Determine:
Two elements are separated from global model:- Boundary conditions- Assumptions
Discrete connection stiffness is determined in local 2D Atena model (Chapter 7)
Global 3D Atena model of core(Chapter 9)
Three examined precast corner connections(Chapter 6)
Reference project: Rembrandt Tower(Chapter 8)
discretesmeared
KKh d
=⋅
Figure 5-1: Structure of research report

Precast concrete cores in high-rise buildings
33
Therefore the problem is split into two models. One global 3D model with simple rectangular elements and one local 2D model of the corner connection. The goal of the local 2D model is to translate the connection into a discrete connection stiffness Kdiscrete, which is subsequently imported as springs between the perpendicular core walls into the global 3D model. Great advantage of the splitting the model into two parts is the possibility to study the structural behaviour of one precast corner connection in detail. The influence of the reinforcement, element variations, etc. can be studied and with the fine mesh the crack pattern can be determined accurately. Splitting of the model created however as well challenges in determining the boundary conditions and the way to apply the loading. To obtain reliable results, the influences of these parameters should be studied in detail.
5.3. Global 3D model of core
As explained in section 5.1 the focus of this research is on the influence of the corner connection on the lateral deflection. The maximum deflection at the top is δtop ≤ h/500 = 136000/500 = 272 mm. Since the influence of the other connections is left aside the following general assumptions apply:
• The core is uniform over the height • No door openings • No vertical joints due to staggering of elements • No horizontal joints • Zero displacement and inclination at the base • Second order effects are neglected
The global model is in contrast with the local model modelled in Atena 3D and extensively described in Chapter 9.
5.3.1. Smeared connection stiffness
Due to the lateral wind load shear stresses develop in the corners of the core of Figure 5-2. This shear stress has to be transferred through the corner connections. In this thesis this is achieved by the precast corner connections of which the stiffness is described in section 5.4.2. This stiffness is a discrete spring stiffness (MN/m). In the global 3D model this corner connection is modelled by applying a smeared stiffness between the perpendicular precast core walls. This smeared stiffness Ksmeared can be derived from the discrete stiffness Kdiscrete by:
discretesmeared
KKh d
=⋅
[MN/m3] (5.1)
Where h is the height of the corner connection and d is the depth of the core walls.
Figure 5-2: Connection stiffness applied on an interface element as a smeared stiffness in global 3D model

Precast concrete cores in high-rise buildings
34
5.4. Local 2D model of corner connection
In the 2D model two interlocking or staggered elements of the global 3D model are isolated. Rotating one element 90 degrees enables modelling in a 2D environment. The corner connection is modelled in Atena 2D and extensively described in Chapter 7. A 2D model has several advantages over a 3D model:
• Only mesh in x- and y-direction, no mesh elements in the z-direction, which results in a substantial reduction in the time of processing.
• The elements can not deform out of plane, this reduces the number of supports and provides better insight into the structural behaviour in plane.
It is assumed that rotation of one precast element has no influence on the structural behaviour of the connection. In reality the contact areas between the elements will deform as can be seen in Figure 7-18. The slope of the contact area in this figure is 200 times magnified and its influence on the structural behaviour is neglected.
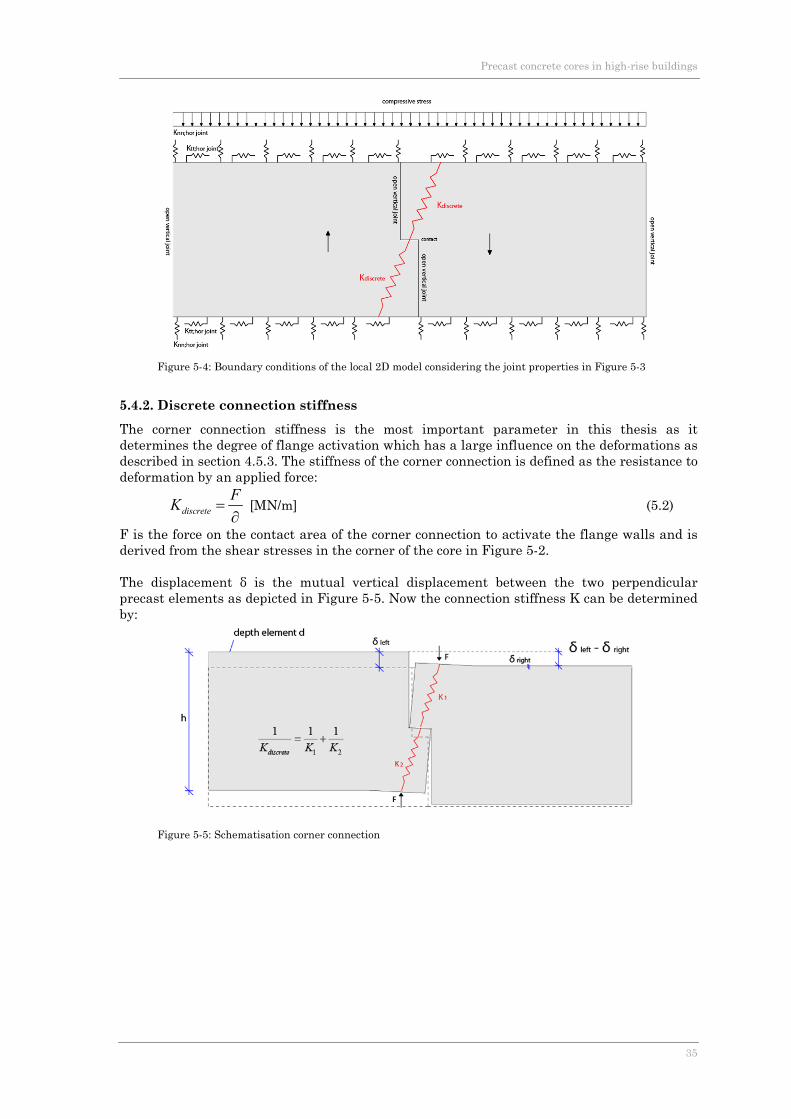
5.4.1. Boundary conditions
Starting point for the local 2D model is to correspond the boundary conditions of the local model to the properties of the joints of the core composed of precast elements. These joints are depicted in Figure 5-3.
Figure 5-3: Various joints of a typical precast element at a corner connection
The horizontal joint properties of Figure 5-3 are translated into springs in the local 2D model with a normal and a tangential spring stiffness. These are depicted respectively with Knn;
hor.joint and Ktt; hor.joint in Figure 5-4. Due to the open vertical joints between the parallel elements this side is not supported in the local 2D model.
Precast concrete cores in high-rise buildings
35
Figure 5-4: Boundary conditions of the local 2D model considering the joint properties in Figure 5-3
5.4.2. Discrete connection stiffness
The corner connection stiffness is the most important parameter in this thesis as it determines the degree of flange activation which has a large influence on the deformations as described in section 4.5.3. The stiffness of the corner connection is defined as the resistance to deformation by an applied force:
discreteFK =∂
[MN/m] (5.2)
F is the force on the contact area of the corner connection to activate the flange walls and is derived from the shear stresses in the corner of the core in Figure 5-2. The displacement δ is the mutual vertical displacement between the two perpendicular precast elements as depicted in Figure 5-5. Now the connection stiffness K can be determined by:
Figure 5-5: Schematisation corner connection

Precast concrete cores in high-rise buildings
36
Chapter 6: Corner connection
Although various corner connections are encountered in practice, no literature can be found on the structural behaviour of these connections or which corner connection the most suitable is to transfer the shear force. The choice for a corner connection seems to be made based on earlier experience with connections at preceding projects.
Figure 6-1: IACC at Strijkijzer Figure 6-2: SC at Maastoren
In preceding projects with precast elements the importance of a stiff corner connection was of less importance since these projects regarded structures where the stability was provided by a façade tube or a combination of a façade tube and a cast in situ core. Since this thesis studies stabilising cores made of precast elements, the increased slenderness requires a large contribution of the flange walls to the effective cross section (see also Section 4.5.3. ). The stiffness of the corner connection becomes more important and more research is required. This chapter describes the corner connections that are examined. In Chapter 7 the various corner connections are studied with a finite element program.
6.1. Corner connection solutions
Three types of corner connections can be distinguished where the vertical contacts fulfil no structural purpose. The three corner solutions that are examined in this thesis are:
a. Interlocking halfway connection (IHC) b. Interlocking above ceiling connection (IACC) c. Staggered connection (SC)
Figure 6-3: Three examined corner connections, from left to right: IHC, IACC, SC

Precast concrete cores in high-rise buildings
37
A corner connection is composed of two perpendicular precast walls. The connection height h is for the IHC and IACC equal to the floor to floor height and for the SC equal to two times the floor to floor height. The IACC and the SC are used in various projects of which some are described in Chapter 2. Main difference between these connections is that the SC spans two floors and the IACC is confined to one floor. The IHC is added, which is expected to have a larger shear capacity compared to the IACC. The advantage of the IACC is that unwanted joints are kept out of sight when no finishing is applied on the precast walls. Disadvantage is a lower shear capacity. Therefore the IHC is also examined to study the influence of the height of the shear key. The advantage of the SC is avoiding more complicated reinforcement in the smaller interlocking shear key. Disadvantage is that there will be more different elements. Another difference is the smaller connection density.
6.2. Shear key
The hatched part of the precast element in Figure 6-4 which transfers the shear force is called the ‘shear key’.
Figure 6-4: Indication of shear key
The length of the shear key for the IACC variant is dependent on the height clearance and the floor to floor height. According to the Dutch building regulation ‘Bouwbesluit 2003’ the minimum height clearance for office buildings in the Netherlands is 2.60 meter. With a floor to floor height of 3.4 meter a key length of 0.8 meter is taken. For the IHC and the SC the length of the shear key is respectively 1.7 and 3.4 meter.

Precast concrete cores in high-rise buildings
38
Chapter 7: Local 2D model of corner connection
In this chapter the precast corner connections discussed in Chapter 6 are modelled in the finite element program Atena 2D. The objective of the local 2D model is to translate the connection into a discrete connection stiffness Kdiscrete, which is subsequently imported as a smeared connection stiffness Ksmeared between the perpendicular core walls into the global 3D model of Chapter 9. Starting point for the local 2D model is to correspond the boundary conditions of the local model to the properties of the joints of the core composed of precast elements.
7.1. Input Atena 2D
7.1.1. Geometry
The dimensions of the IHC are depicted in Figure 7-1. The other two connection types have the same geometry except for the length of the shear key. The thickness and the height of the precast wall are derived from the reference project of the Rembrandt Tower from Chapter 8. Starting point for the width of the element is 5.4 meter, the connection stiffness for other widths are studied in section 7.5.6. The precast element and the steel plate are entered by defining joints and lines and are called macro-elements in Atena 2D. The purpose of the steel plate is to introduce the nodal shear force into the precast element. For FE analysis it is necessary to avoid any unrealistic stress concentration, as this may cause premature failure or cracking in these locations. If the load is applied at a single node, this may induce strong stress concentrations affecting the analysis results. In reality the shear force is introduced as a distributed load over the contact area between the shear keys.
Figure 7-1: Geometry of IHC. For the remaining connections only the height of the shear key varies

Precast concrete cores in high-rise buildings
39
7.1.2. Symmetry
The corner connection consists of two symmetrical perpendicular elements to transfer the shear force. In Appendix B the necessity for a model with just one element is demonstrated. With this model the load can be as a node load instead of a distributed load. This enables a reliable monitoring of the shear force, while still supported along the top surface. The stiffness obtained with this model is the discrete stiffness of just one shear key, K1 in Figure 7-2. The whole corner connection can be modelled as a series system, where the stiffness of the system can be determined by:
1 2
1 1 1
discreteK K K= + (7.1)
Figure 7-2: The connection stiffness Kdiscrete consists of two stiffnesses for each shear key
In case of the IHC and the SC K1 is K2, from which follows: Kdiscrete = ½ K1. In case of the IACC K1 and K2 are different. Therefore both shear keys have to be modelled to obtain K1 and K2, whereupon the total connection stiffness can be obtained from (7.1).
7.1.3. Materials
A concrete quality C55/67 is used for the precast elements. The Atena 2D manual recommends the material type ‘SBETA’ of which the stress-strain law is depicted in Figure 7-3. From Table 3.1: Strength and deformation characteristics for concrete of Eurocode 2, the following values are entered:
Cubic compressive strength fcu = 67 N/mm2 Modulus of elasticity E = 38000 N/mm2 Poisson’s ratio μ = 0.2 Tensile strength ft = 4.2 N/mm2 Compressive strength fc = N/mm2
For the steel plate a plane stress elastic isotropic material (Figure 7-4) is used with an elastic modulus of 210.000 N/mm2 and a Poisson’s ratio μ of 0.3. The macro-elements are composed of CCISOQuad plane elements, of which the geometry is depicted in Figure 7-5.
Figure 7-3: Stress-strain law of SBETAfor concrete
Figure 7-4: Stress strain law for plane stress elastic isotropic material
Figure 7-5: Geometry of CCISOQuad elements
7.1.4. Mesh
Based on element sizes that are defined for each macro-element a finite element mesh is generated automatically. The created mesh size can be controlled by local refinements around geometrical lines and joints. Starting point is a brick shaped mesh size of 200 mm with a

Precast concrete cores in high-rise buildings
40
mesh refinement of 50 mm at the contact area between the shear keys where the largest stresses are. Justification of these values is discussed in section 7.5.2. The mesh for the interlocking IHC is depicted in Figure 7-6.
Figure 7-6: Mesh for IHC, dotted circle indicates radius of the mesh refinement at the location of the loading
7.1.5. Spring supports
To model the boundary conditions of the edges, the macro-elements are supported by springs in two directions, a normal and a tangential spring stiffness.
• The normal spring stiffness is defined by the Young’s modulus of the concrete and the length of the compressed zone. The stress-strain relation of the spring is defined in the material menu (Figure 7-7) with the Young’s modulus of concrete C55/67 for the stiffness. Since the horizontal joint can not transfer tensile forces (section 3.5.1. ) the spring definition of above is only valid if the spring supports are compressed. The normal stress distribution of the global 3D model shows only compressive stresses (see Appendix A.2) and the spring definition is therefore valid. In Figure 7-8 the input for a spring supported line is depicted, where the thickness corresponds to the thickness of the precast wall. Determination of the value for spring length is complicated. An assessment on the height of the compressed surrounding concrete due to the vertical force on the shear key must be made. The Atena manual advises that in case of an expected deformation in order of millimetres, to choose a spring length in the order of meters. Since deformations around a millimetre are expected, a spring length of 1 meter is chosen. In section 7.5.3. the influence of the spring length is analysed.
Figure 7-7: Normal spring material input Figure 7-8: Line spring input

Precast concrete cores in high-rise buildings
41
• In case of a monolithic structure determination of the shear stiffness value would be comparable as in Figure 7-7, but instead of an E of 38000 N/mm2, the shear modulus
would have been entered: 215835 /2(1 )EG N mmv
= =+
However, in a precast structure the shear stiffness is determined by the horizontal joint. Since the shear stiffness of the horizontal joint is determined by influences of bond, friction and dowel action, values for the shear modulus are not available as is the case for Knn. For input in Atena the shear modulus G is required which can be determined with formula (7.2) and Figure 7-9.
u
u
t
Gδ
ττγ
= = (7.2)
Figure 7-9: Deformation of horizontal joint due to shear stress
As is explained in the theory of section 3.5.1. and elaborated in Appendix C the shear resistance τu is dependent on the normal stress and the reinforcement. For an average normal compressive stress of 4.5 N/mm2 and three protruding bars with a diameter of 16 millimetres, the shear resistance τu is 2.3 N/mm2. (According to equation (C.1) of Appendix C). The deformation at failure δu is assumed as 1 mm. From testing (Straman 1988) a linear relation was found between the shear stresses on a joint and the deformations. At failure of the connection the deformations appeared to be around 1 millimetre. In testing of (Wicke and Randl, 2000) τu is obtained at a deformation around 0.2 to 0.5 millimetres. The assumption of 1 millimetre is conservative. The tangential spring stiffness can now be calculated with a thickness of the horizontal joint of 20 mm:
2
2
120
2.3 / 46 /u
uu mm
t mm
N mmG N mmδ
τ= = =
The influence of the tangential spring support stiffness on the corner connection stiffness is studied in section 7.5.4.
Figure 7-10: Shear spring material input Figure 7-11: Line spring input

Precast concrete cores in high-rise buildings
42
Figure 7-12: Spring supports of Atena 2D model
7.1.6. Loading
A prescribed vertical deformation is applied at the centre of the steel plate as is depicted in Figure 7-12. The load is applied in multiple analysis steps. Furthermore the precast element is compressed due to presence of the precast elements lied on top. In Appendix A.2 the normal stress due to gravity loading is calculated as 6 N/mm2. In Atena 2D this is entered as a line force: 2500 6 / 3 /q mm N mm MN m= ⋅ = . At the normal spring supports the loading is increased to take into account the loss of stress due to the springs. Figure 7-14 shows that due to this compressive loading indeed vertical stresses of 6 N/mm2 occur in the precast element, with little variation near the reinforcement.
Figure 7-13: Compressive loading due to presence of precast elements lied on top
Figure 7-14: Resulting vertical stress due to compressive loading
Precast concrete cores in high-rise buildings
43
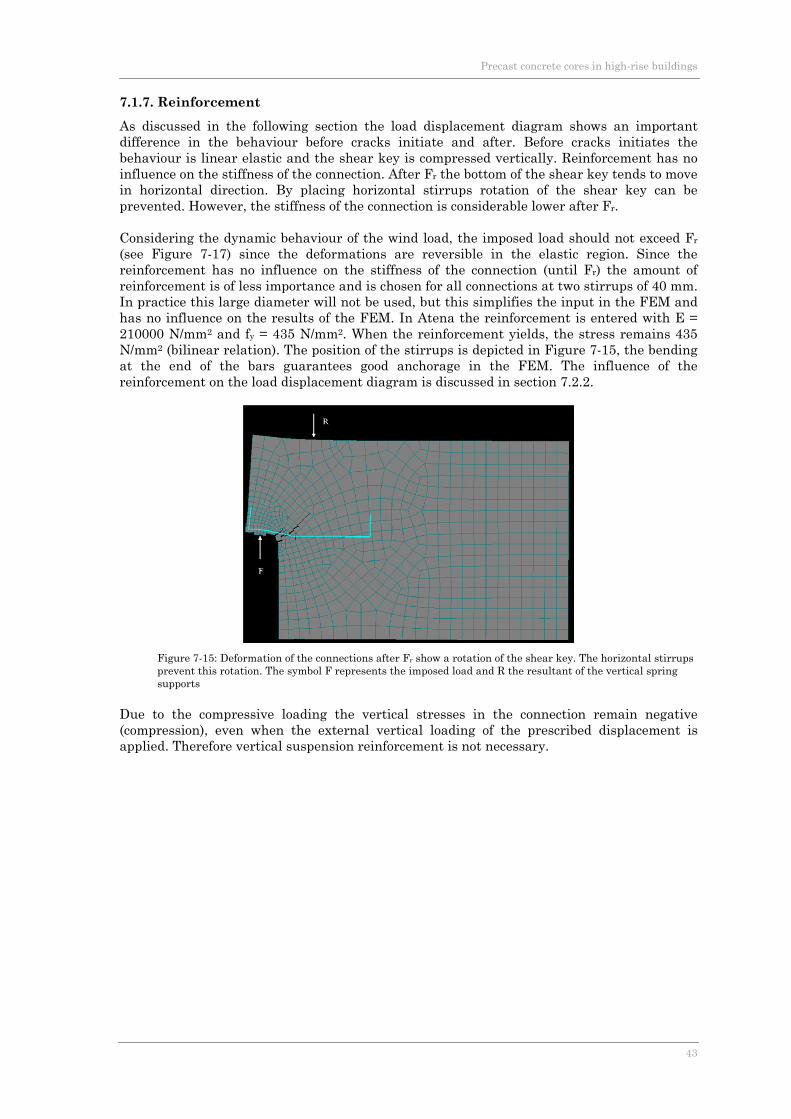
7.1.7. Reinforcement
As discussed in the following section the load displacement diagram shows an important difference in the behaviour before cracks initiate and after. Before cracks initiates the behaviour is linear elastic and the shear key is compressed vertically. Reinforcement has no influence on the stiffness of the connection. After Fr the bottom of the shear key tends to move in horizontal direction. By placing horizontal stirrups rotation of the shear key can be prevented. However, the stiffness of the connection is considerable lower after Fr. Considering the dynamic behaviour of the wind load, the imposed load should not exceed Fr (see Figure 7-17) since the deformations are reversible in the elastic region. Since the reinforcement has no influence on the stiffness of the connection (until Fr) the amount of reinforcement is of less importance and is chosen for all connections at two stirrups of 40 mm. In practice this large diameter will not be used, but this simplifies the input in the FEM and has no influence on the results of the FEM. In Atena the reinforcement is entered with E = 210000 N/mm2 and fy = 435 N/mm2. When the reinforcement yields, the stress remains 435 N/mm2 (bilinear relation). The position of the stirrups is depicted in Figure 7-15, the bending at the end of the bars guarantees good anchorage in the FEM. The influence of the reinforcement on the load displacement diagram is discussed in section 7.2.2.
Figure 7-15: Deformation of the connections after Fr show a rotation of the shear key. The horizontal stirrups prevent this rotation. The symbol F represents the imposed load and R the resultant of the vertical spring supports
Due to the compressive loading the vertical stresses in the connection remain negative (compression), even when the external vertical loading of the prescribed displacement is applied. Therefore vertical suspension reinforcement is not necessary.

Precast concrete cores in high-rise buildings
44
7.2. Interlocking halfway connection
The mechanical model for the IHC is depicted in Figure 7-16 and modelled in Atena 2D. The input parameters are according to the previous section. From section 7.1.5. Knn is 38000 N/mm2 with a spring length of 1 m, and Ktt is 46 N/mm2 with a spring length of 20 mm (thickness horizontal joint). A and B in Figure 7-16 indicate the positions of the monitoring points as discussed in section 7.5.1. to calculate the mutual displacement. The discrete connection stiffness is determined according to equation (5.2).
Figure 7-16: Mechanical model of IHC
7.2.1. Load displacement diagram
With the monitoring point of the vertical displacements located as depicted in Figure 7-16, the load displacement diagram is depicted in Figure 7-17. The finite element program models only one element and the displacements are therefore the response of one shear key. In reality the connection is composed of two precast elements and with equation (7.1) the connection stiffness will be half. Therefore the displacements in Figure 7-17 are two times the displacements of the FEM which model one element and Figure 7-17 therefore represents the stiffness of the whole connection.
Figure 7-17: Load displacement diagram of IHC
Precast concrete cores in high-rise buildings
45
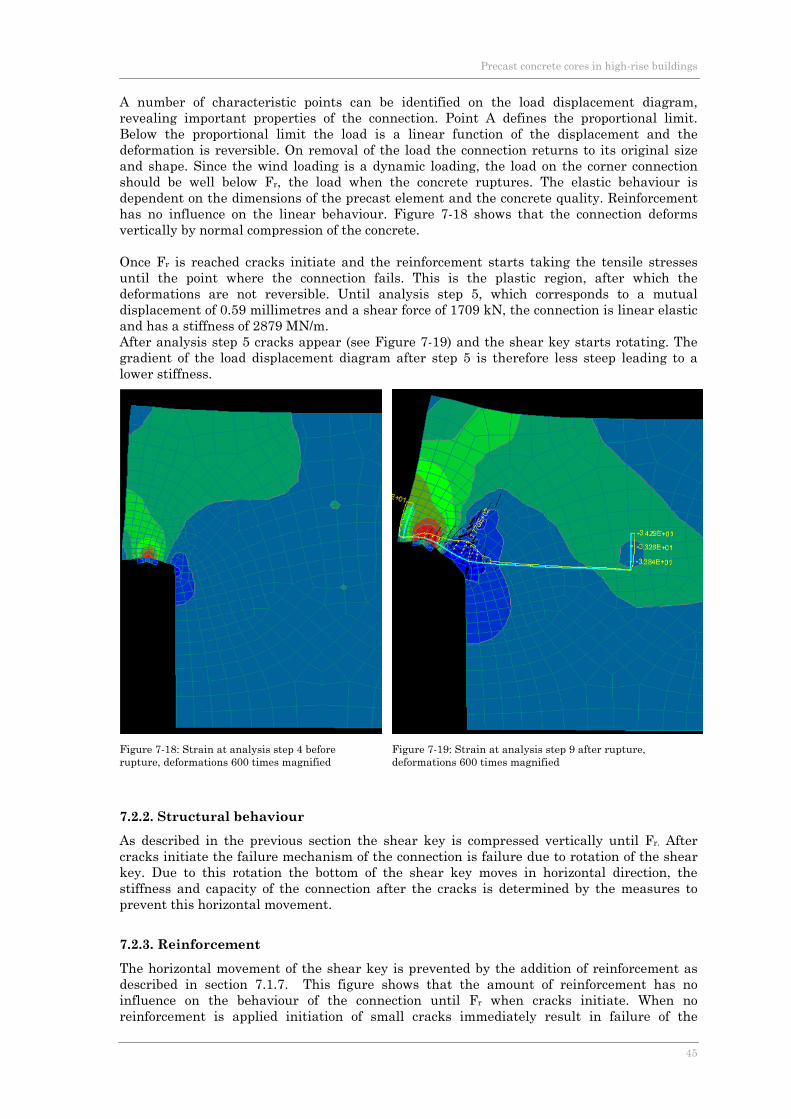
A number of characteristic points can be identified on the load displacement diagram, revealing important properties of the connection. Point A defines the proportional limit. Below the proportional limit the load is a linear function of the displacement and the deformation is reversible. On removal of the load the connection returns to its original size and shape. Since the wind loading is a dynamic loading, the load on the corner connection should be well below Fr, the load when the concrete ruptures. The elastic behaviour is dependent on the dimensions of the precast element and the concrete quality. Reinforcement has no influence on the linear behaviour. Figure 7-18 shows that the connection deforms vertically by normal compression of the concrete. Once Fr is reached cracks initiate and the reinforcement starts taking the tensile stresses until the point where the connection fails. This is the plastic region, after which the deformations are not reversible. Until analysis step 5, which corresponds to a mutual displacement of 0.59 millimetres and a shear force of 1709 kN, the connection is linear elastic and has a stiffness of 2879 MN/m. After analysis step 5 cracks appear (see Figure 7-19) and the shear key starts rotating. The gradient of the load displacement diagram after step 5 is therefore less steep leading to a lower stiffness.
Figure 7-18: Strain at analysis step 4 before rupture, deformations 600 times magnified
Figure 7-19: Strain at analysis step 9 after rupture, deformations 600 times magnified
7.2.2. Structural behaviour
As described in the previous section the shear key is compressed vertically until Fr. After cracks initiate the failure mechanism of the connection is failure due to rotation of the shear key. Due to this rotation the bottom of the shear key moves in horizontal direction, the stiffness and capacity of the connection after the cracks is determined by the measures to prevent this horizontal movement.
7.2.3. Reinforcement
The horizontal movement of the shear key is prevented by the addition of reinforcement as described in section 7.1.7. This figure shows that the amount of reinforcement has no influence on the behaviour of the connection until Fr when cracks initiate. When no reinforcement is applied initiation of small cracks immediately result in failure of the

Precast concrete cores in high-rise buildings
46
connection. The additions of horizontal stirrups lead to plastic behaviour of the connection. Although the connection is less stiff after Fr is reached the stiffness is considerable lower (and remains lower even when unloaded due to the presence of the cracks) but provides extra safety. All FEM in this thesis are modelled with horizontal stirrups 2Ø40mm.
Figure 7-20: Influence of reinforcement on corner connection stiffness
7.2.4. Conclusions
The FEM shows a clear difference in behaviour of the connection before and after cracks initiate. The discrete connection stiffness of the IHC is 2879 MN/m, which is valid until Fr of 1709 kN. At this imposed load the mutual displacement of the precast elements is 0.59 mm. Until this point the behaviour is linear elastic and reinforcement has no influence.

Precast concrete cores in high-rise buildings
47
7.3. Interlocking above ceiling connection
This mechanical model of the IACC is depicted in Figure 7-21 and modelled in Atena 2D. The input parameters are according to the section 7.1, with the same spring supports as the IHC: Knn is 38000 N/mm2 with a spring length of 1 m, and Ktt is 46 N/mm2 with a spring length of 20 mm (thickness horizontal joint). The main difference compared to the previous connection is variation of the length of the shear key, therefore the connection is not symmetrical and the discrete connection is determined with two FE model.
Figure 7-21: Mechanical model of IACC, two subsystems to determine K1 and K2
The connection stiffness is determined by equation (7.3), as explained in section 7.1.2. First K1 is determined with a shear key of 800 mm, than K2 with a shear key of 2600 mm. To match these two stiffnesses a parameter is required that is equal for both shear keys. In (7.3) the only parameter that is constant is the imposed load F. Therefore the prescribed deformation is replaced by a vertical force.
1 21 2
1 1 1 1 1
discreteF FK K K δ δ
= + = + (7.3)
7.3.1. Load displacement diagram
The monitor points on the elements are as depicted in Figure 7-21. The results of the FEM are depicted in Figure 7-22.
0
500
1000
1500
2000
2500
3000
3500
4000
4500
5000
5500
6000
0,00 0,25 0,50 0,75 1,00 1,25 1,50 1,75 2,00 2,25 2,50 2,75 3,00 3,25 3,50 3,75
Load
[kN]
Displacement [mm](for one shear key)
Large key ‐ force
Large key ‐ prescribed def.
Small key ‐ force
Small key ‐ prescribed def.
Figure 7-22: Load displacement diagrams for small and large key

Precast concrete cores in high-rise buildings
48
Figure 7-22 shows the load displacement diagram for the small and the large shear key. It also shows the difference in applying the load, which shows similar results except for the behaviour at failure. Figure 7-22 shows that the connection stiffness is determined by the behaviour of the small key. The stiffness of the whole connection is determined with (7.3) and depicted in Figure 7-23.
Figure 7-23: Load displacement diagram of IACC (small and large key)
7.3.2. Conclusions
The discrete connection stiffness of the IACC is 2689 MN/m, which is valid until Fr of 600 kN. At this imposed load the mutual displacement of the precast elements is 0.22 mm. These lower values are caused by the unfavourable behaviour of the small shear key.
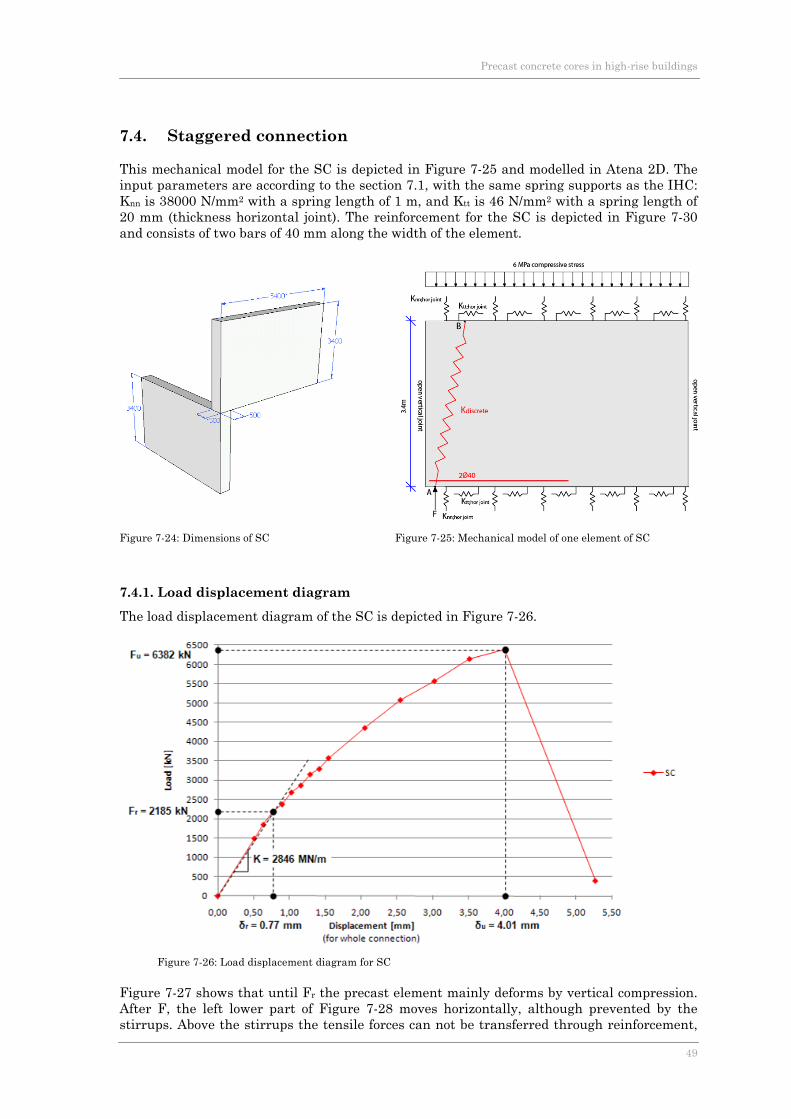
Precast concrete cores in high-rise buildings
49
7.4. Staggered connection
This mechanical model for the SC is depicted in Figure 7-25 and modelled in Atena 2D. The input parameters are according to the section 7.1, with the same spring supports as the IHC: Knn is 38000 N/mm2 with a spring length of 1 m, and Ktt is 46 N/mm2 with a spring length of 20 mm (thickness horizontal joint). The reinforcement for the SC is depicted in Figure 7-30 and consists of two bars of 40 mm along the width of the element.
Figure 7-24: Dimensions of SC Figure 7-25: Mechanical model of one element of SC
7.4.1. Load displacement diagram
The load displacement diagram of the SC is depicted in Figure 7-26.
Figure 7-26: Load displacement diagram for SC
Figure 7-27 shows that until Fr the precast element mainly deforms by vertical compression. After F, the left lower part of Figure 7-28 moves horizontally, although prevented by the stirrups. Above the stirrups the tensile forces can not be transferred through reinforcement,

Precast concrete cores in high-rise buildings
50
the tensile stress of the concrete is exceeded and cracks have occurred. This can be improved by adding more stirrups over the height of the precast element, but this will only improve the behaviour of the connection after Fr and is therefore of no interest for this thesis.
Figure 7-27: Displacements after analysis step 2, 200 times magnified
Figure 7-28: Displacements after analysis step 7, 200 times magnified
The cracks due to horizontal stresses in Figure 7-28 are not just caused by rotation of the shear key. The stress trajectories of the compressive strut of Figure 7-31 diverge into a bottle shape in the middle, causing tensile stresses and cracks.
Figure 7-29: Yellow line depicts tresses in reinforcement, colours horizontal strain, after analysis step 2
Figure 7-30: Yellow line depicts tresses in reinforcement, colours horizontal strain, after analysis step 7
Figure 7-31: Curvature of stress trajectory leads to tensile stresses halfway
7.4.2. Conclusions
The discrete connection stiffness of the SC is 2846 MN/m, which is valid until Fr of 2185 kN. At this imposed load the mutual displacement of the precast elements is 0.77 mm.

Precast concrete cores in high-rise buildings
51
7.5. Parameter study local 2D model
During the modelling of the corner connection in Atena 2D various assumption were made. This section studies the influences of various parameters on the connection stiffness. If the parameters have little influence on the results one can speak of a robust model.
7.5.1. Position of the monitoring points
Since the connection stiffness is defined as the resistance to deformation, the position of the monitoring points is a very important parameter. The connection consists of two perpendicular elements and deformation is their mutual vertical displacement. Since symmetry is used only one element is modelled, therefore one monitoring point should be located at the contact area of the shear keys, which is at point A in Figure 7-32. Point A monitors the vertical displacement of the shear key.
Figure 7-32: Location of monitoring points in Atena 2D Figure 7-33: Modelling of discrete spring stiffness
Since the element is spring supported the element shifts in the direction of the vertical force and also rotates. To acquire reliable results the remaining monitoring point should:
a) be as close to the edge as possible, since the interface material in the global 3D model is also located there. If not, vertical displacement between the edge and the monitoring point will be accounted for both in the 2D as the 3D model.
b) should monitor the average vertical displacement, since the shear stiffness of the interface is a smeared shear stiffness
In this parameter study three methods are studied to obtain the mutual vertical displacement:
i. Remaining monitoring point over the height of B Taking into account the remarks as mentioned above, it makes sense to enter several monitoring points over the height of the element. Figure 7-33 shows the 9 monitoring points along B as entered in Atena 2D. As this monitoring point is located close to the edge, this method should result in the most accurate connection stiffness. Disadvantage of this method is that it is very time consuming to determine the average displacement.
ii. Remaining monitoring point at top of B Considering the imposed load at A and the supports at the top, the shear key will deform due to compressive stress. To model the stiffness of the element it makes sense to model a spring between the imposed load and the resultant of the spring support. This leads to the monitoring points at the start and end of the discrete spring as is depicted in Figure 7-33

Precast concrete cores in high-rise buildings
52
iii. No remaining monitoring point This is the simplest method. Since the vertical displacement of the element is neglected the mutual displacement will be overestimated, this is a conservative approach.
The influence of the position of monitoring points on the load displacement diagram is depicted in Figure 7-34. The lines of method i and ii are lying on top of each other.
Figure 7-34: Influence position of monitoring points on load displacement diagram
Table 7-1: Connection stiffness Kdiscrete (MN/m) for various methods to monitor the vertical displacements
Conclusion The mutual displacement is best determined by the difference in vertical displacement of a monitoring point at A and a monitoring at the top the element since these points mark the beginning and end of the discrete spring. Therefore they monitor the compressive shortening of the precast element. Although method iii with only a monitor point at A is the simplest method, this leads to a decrease in stiffness of 18 percent, therefore this method is neglected. Method i which monitors the vertical displacement of A minus the average vertical displacement of B leads to a comparable stiffness. Since this stiffness is a little higher it is a conservative approach to use method ii. The vertical displacement that are used in the models and diagrams in this thesis all describe the difference in vertical displacement between A and Btop.
7.5.2. Mesh size
This section studies the influence of the mesh size on the stiffness of the connection. A denser mesh could result in a more reliable connection stiffness since it can handle high stresses better, on the other hand it results in a longer time of processing. Besides the mesh refinement of 50 mm in Figure 7-6, the load displacement diagrams are calculated with a
A – B top A – B average Error compared to A – B top A Error compared
to A – B top
Kdiscrete until Fr 2879 3015 +4.7 % 2361 -18.0 %

Precast concrete cores in high-rise buildings
53
mesh refinement of 100 and 10 mm (see Figure 7-35 and Figure 7-36). In all cases the general mesh size is 200 mm.
Figure 7-35: General mesh size of 200 mm with a mesh refinement at the vertical load of 100 mm
Figure 7-36: General mesh size of 200 mm with a mesh refinement at the vertical load of 10 mm
N.B. this parameter study was performed with an earlier FEM without compressive stress and monitoring point B located at 1.3 meter from the bottom of the precast element. The results for final FEM are expected to show comparable results.
0
500
1000
1500
2000
2500
3000
3500
4000
4500
5000
0 0,5 1 1,5 2 2,5 3 3,5 4 4,5 5 5,5 6 6,5 7 7,5
Shear force [kN
]
Vertical displacement [mm](for whole connection)
Mesh size - refinement[mm]
200 ‐ 10
200 ‐ 50
200 ‐ 100
Figure 7-37: Influence of mesh size on corner connection stiffness
Conclusion From Figure 7-37 can be concluded that the line load displacement diagram of the 100 mm mesh refinement differs from the denser meshes and has a longer trajectory. For the mesh refinement of 50 and 10 mm there is no difference between the connection stiffness at Fr (analysis step 4) and at Fu (analysis step 14). The mesh refinement of 50 mm as used in this thesis is therefore justified.
7.5.3. Normal spring support stiffness
In section 7.1.5. the normal spring stiffness was defined by the Young’s modulus of the concrete and the length of the compressed zone. Since the length of the compressive zone was estimated, the influences of various spring lengths are studied on the connection stiffness. The parameter of the compressive length in Figure 7-8 was estimated at 1 meter before. In this section also the results with compressive lengths of 0.5 and 2 meter are calculated, where a longer spring length leads to a smaller spring support stiffness and vice versa. The load displacement diagrams for the various spring lengths are depicted in Figure 7-38.

Precast concrete cores in high-rise buildings
54
N.B. this parameter study was performed with an earlier FEM without compressive stress and monitoring point B located at 1.3 meter from the bottom of the precast element. The results for final FEM are expected to show comparable results.
0
500
1000
1500
2000
2500
3000
3500
4000
4500
0 0,5 1 1,5 2 2,5 3 3,5 4 4,5 5 5,5 6 6,5 7 7,5
Shear force [kN
]
Vertical displacement [mm](for whole connection)
l = 0.5m
l = 1.0m
l = 2.0m
Figure 7-38: Influence of the normal spring support stiffness on the corner connection stiffness
Table 7-2: Connection stiffness Kdiscrete (MN/m) for various normal spring lengths
Conclusion Figure 7-38 and Table 7-2 show that the influence of the parameter for the spring length is very small on the connections stiffness. For the elastic region the influence is almost negligible, this is important since the stiffness is determined for this region. This is very favourable since the value of the parameter is the most uncertain parameter of the 2D model. Since a value of 1 meter was considered as realistic before, calculations with this value is continued.
7.5.4. Tangential spring support stiffness
The tangential spring support stiffness is defined in section 7.1.5. as: 2
2
120
2.3 / 46 /u
uu mm
t mm
N mmG N mmδ
τ= = = . In this case the deformation at failure δu was conservative
assumed at 1mm. Testing of (Wicke and Randl, 2000 showed a deformation at failure δu of 0.5 mm, therefore in this section the model is recalculated with a spring stiffness of 92 N/mm2. The shear resistance τu of 2.3 N/mm2 was calculated for a normal stress of 4.5 N/mm2, as this normal stress varies, the model is also recalculated with a lower spring stiffness of 23 N/mm2. N.B. this parameter study was performed with an earlier FEM without compressive stress and monitoring point B located at 1.3 meter from the bottom of the precast element. The results for final FEM are expected to show comparable results.
Length of 1.0 meter
Length of 0.5 meter
Difference compared to 1 m
Length of 2.0 meter
Difference compared to 1 m
Kdiscrete until Fr 3164 3198 +1.1 % 3007 -4.9 %

Precast concrete cores in high-rise buildings
55
0
500
1000
1500
2000
2500
3000
3500
4000
4500
0 0,5 1 1,5 2 2,5 3 3,5 4 4,5 5 5,5 6 6,5 7 7,5
Shear force [kN
]
Vertical displacement [mm](for whole connection)
G = 23 MPa
G = 46 MPa
G = 92 MPa
Figure 7-39: Influence of the tangential spring support stiffness on the corner connection stiffness
Table 7-3: Connection stiffness Kdiscrete (MN/m) for various tangential spring support stiffness
Conclusion Figure 7-39 demonstrates that the influence of the tangential spring support stiffness on the corner connection stiffness is negligible. The value for the tangential spring support stiffness in this thesis is taken as 46 N/mm2.
7.5.5. Compressive stress due to gravity loading
This section studies the influence of the compressive stress due to gravity loading on the connection stiffness. In Appendix A.2 the normal stress due to gravity loading is calculated as 6 N/mm2. This is entered in Atena 2D as a line force: 2500 6 / 3 /q mm N mm MN m= ⋅ = . In this section three variations were studied: with 0, 1.5, 3 and 4.5 N/mm2 compressive stress.
Figure 7-40: Program display showing the compressive stress on the element
Figure 7-41 shows the load displacement diagrams for the various values of compressive stress on the element.
G = 46 N/mm2 G = 23 N/mm2 Diff. compared
to G = 46 N/mm2 G = 92 N/mm2 Diff. compared
to G = 46 N/mm2
Kdiscrete until Fr 3164 3147 -0.6 % 3041 -3.9 %
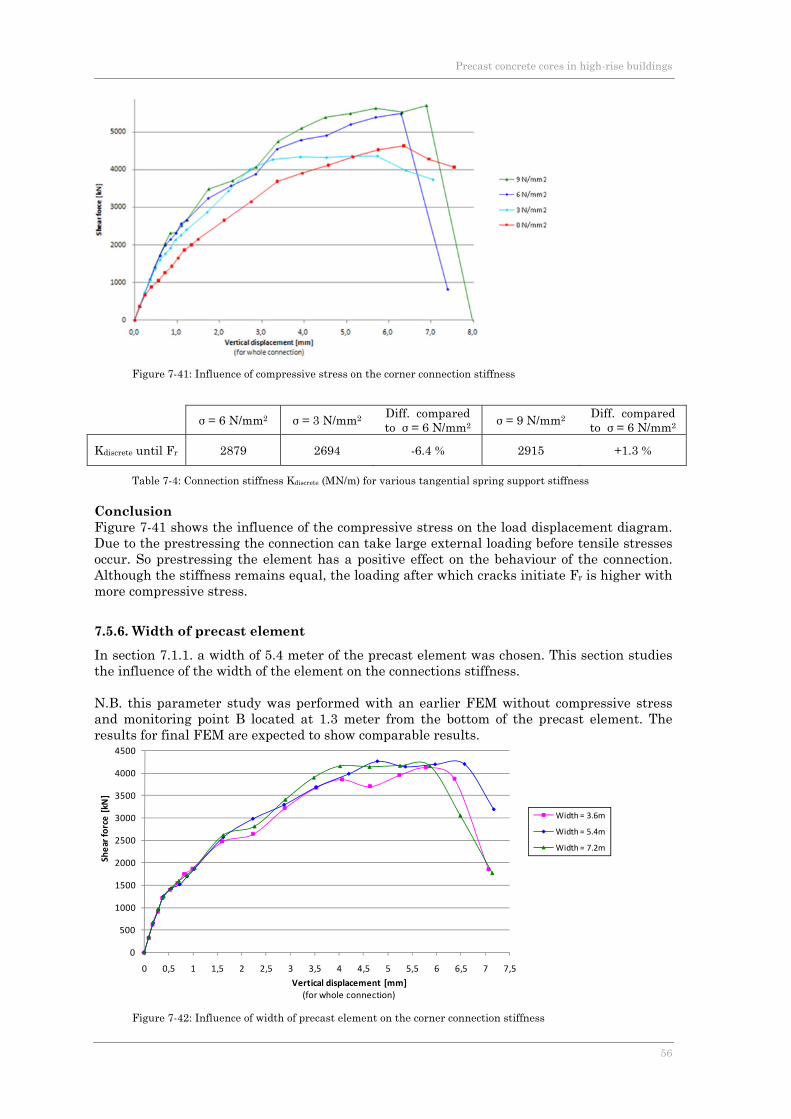
Precast concrete cores in high-rise buildings
56
Figure 7-41: Influence of compressive stress on the corner connection stiffness
Table 7-4: Connection stiffness Kdiscrete (MN/m) for various tangential spring support stiffness
Conclusion Figure 7-41 shows the influence of the compressive stress on the load displacement diagram. Due to the prestressing the connection can take large external loading before tensile stresses occur. So prestressing the element has a positive effect on the behaviour of the connection. Although the stiffness remains equal, the loading after which cracks initiate Fr is higher with more compressive stress.
7.5.6. Width of precast element
In section 7.1.1. a width of 5.4 meter of the precast element was chosen. This section studies the influence of the width of the element on the connections stiffness. N.B. this parameter study was performed with an earlier FEM without compressive stress and monitoring point B located at 1.3 meter from the bottom of the precast element. The results for final FEM are expected to show comparable results.
0
500
1000
1500
2000
2500
3000
3500
4000
4500
0 0,5 1 1,5 2 2,5 3 3,5 4 4,5 5 5,5 6 6,5 7 7,5
Shear force [kN
]
Vertical displacement [mm](for whole connection)
Width = 3.6m
Width = 5.4m
Width = 7.2m
Figure 7-42: Influence of width of precast element on the corner connection stiffness
σ = 6 N/mm2 σ = 3 N/mm2 Diff. compared to σ = 6 N/mm2 σ = 9 N/mm2 Diff. compared
to σ = 6 N/mm2
Kdiscrete until Fr 2879 2694 -6.4 % 2915 +1.3 %

Precast concrete cores in high-rise buildings
57
Conclusion Figure 7-42 shows that until Fr the connection stiffness is equal for the three examined widths. From Fr to Fu the average gradient is comparable except for some dips which can be explained by the appearance of large cracks between the analysis steps.
7.5.7. Thickness of precast element
This section shows the influence of the thickness of the precast element on the stiffness of the corner connection. The thickness of 500 mm of the core walls of the Rembrandt Tower was adopted in the Atena models before; this section also studies thicknesses of 400 and 300 mm. N.B. this parameter study was performed with an earlier FEM without compressive stress and monitoring point B located at 1.3 meter from the bottom of the precast element. The results for final FEM are expected to show comparable results.
0
500
1000
1500
2000
2500
3000
3500
4000
0 0,5 1 1,5 2 2,5 3 3,5 4 4,5 5 5,5 6 6,5 7 7,5
Shear force [kN
]
Vertical displacement [mm](for whole connection)
Thickness = 500 mmThickness = 400 mmThickness = 300 mm
Figure 7-43: Influence of the element thickness on the corner connection stiffness
Table 7-5: Connection stiffness Kdiscrete (MN/m) for various normal spring lengths
Conclusion Since the decrease in thickness from 500 to 400 is 20% and from 500 to 300 is 40% the results in Table 7-2 shows expected results for Kdiscrete until Fr. After cracks initiate the decrease is less than decrease in thickness in terms of percentage. This can be explained as a result of the reinforcement which is equal for all three thicknesses. Since the reinforcement determines the behaviour after cracks initiated comparable behaviour should be expected. This is also obtained in Figure 7-43.
7.5.8. Sensitivity analysis
In a sensitivity analysis the influence of the most uncertain parameters are studied on the connection stiffness. Table 7-6 shows that the model shows relatively small variations of the connection stiffness with large variations of the most uncertain parameters. Therefore it can be concluded that a robust model is obtained. Δ ΔK Normal spring support stiffness +100 % -4.9 % Tangential spring support stiffness +100 % -3.9 % Compressive stress -100 % -6.4 %
Table 7-6: Sensitivity analysis, influence of uncertain parameters on connection stiffness
Thickness of 500 mm
Thickness of 400 mm
Diff. compared to 500 mm
Thickness of 300 mm
Diff. compared to 500 mm
Kdiscrete until Fr 3164 2569 -18.8% 1958 -38.1%

Precast concrete cores in high-rise buildings
58
7.6. Comparison corner connections
The load displacement diagrams of the three corner connections are depicted in Figure 7-44. A comparative assessment with this figure is not possible since the interlocking connections are valid for a floor high connection and the SC is valid for a two-storey high connection. To understand the influence of the connection density distinction is made between the discrete connection stiffness of the local 2D model and the smeared stiffness of the global 3D model is explained.
Figure 7-44: Load displacement diagram displaying the discrete connection stiffness
7.6.1. Discrete connection stiffness
All three connections show a non-linear stress-strain curve, which can be simplified by a bi-linear stress-strain curve with a stiff first segment until at Fr cracks initiate. The values of Table 7-7 are valid until Fr. The connection stiffness is determined according to equation (5.2)
Kdiscrete [MN/m] Fr [kN] IHC 2879 1709
IACC 2689 600 SC 2846 2185
Table 7-7: Discrete corner connection stiffness Kdiscrete which is valid until the proportional limit Fr
7.6.2. Smeared connection stiffness
As explained in section 5.3.1. the corner connection in the global 3D model of the core is modelled by applying a smeared stiffness between the perpendicular precast core walls. Therefore the smeared stiffness Ksmeared can be derived from the discrete stiffness Kdiscrete by:
discretesmeared
KKh d
=⋅
[MN/m3] and rr
Fh d
τ =⋅
Where h is the height of the corner connection and d is the depth of the core walls. The depth of the core walls is for all connections equal namely 500 millimetres. The connection height for the IHC and IACC is equal to the floor to floor height. For the reference project this is 3400 millimetres. The connection of the SC is divided over two floors and therefore the connection height is 6800 millimetres.

Precast concrete cores in high-rise buildings
59
Fr [kN] Ksmeared [MN/m3] IHC 1709 1694
IACC 600 1582 SC 2185 837
Table 7-8: Smeared corner connections stiffnesses
7.6.3. Explanation difference in stiffness between IHC and SC
In advance the IHC and SC were expected to have comparable smeared connection stiffness since they have the same length of shear keys when considered over two floors. The results of Table 7-8 show however that the smeared connection stiffness of the IHC is almost twice as high compared to the SC. This sections aims to explain this discrepancy. Influence of connection density First of all must be stated that since each SC spans two floors and the IHC one floor, the stiffness of the SC must be twice as large compared to the IHC to reach the same smeared stiffness in the global 3D model. This is illustrated with an example of a corner connection that has a mutual vertical displacement of 1 mm when loaded with a shear stress of 1N/mm2.
This means that the smeared stiffness is: 2
3 31 / 1 / 1000 /1smearedN mmK N mm MN mmm
τδ
= = = = .
So for the same smeared connection stiffness of 1N/mm3 the SC transfers a shear force of:
6800 500 1 3400SCV A kNτ= ⋅ = ⋅ ⋅ = and the discrete stiffness: ;3400 3400 /
1discrete SCkNK MN m
mm= =
For the same smeared connection stiffness the IHC transfers a shear force of:
3400 500 1 1700IHCV A kNτ= ⋅ = ⋅ ⋅ = and the discrete stiffness: ;1700 1700 /
1discrete IHCkNK MN m
mm= =
In other words: if the discrete connection stiffness of the SC and IHC are equal, the smeared connection stiffness of the IHC is twice as large.
Figure 7-45: Difference between smeared stiffness and discrete stiffness of SC and IHC
Influence of length shear key Before the FE analysis was performed it was expected that the discrete stiffness of the SC would be twice as large as the IHC since the length of the shear key is twice as large. In Figure 7-46 the load displacement diagrams from the FE analysis are given for various lengths of the shear key of one precast element. This shows that the influence of the length of the shear key on the discrete connection stiffness is very small. Only the shear key with a length of 800 mm is obvious less stiff. Several causes can be excluded to explain this discrepancy between expectation and results:

Precast concrete cores in high-rise buildings
60
• First of all the horizontal reinforcement is equal for all FE models with various lengths of the shear key. Furthermore for small loads when the concrete remains uncracked the reinforcement has only a very small influence on the behaviour.
• Secondly the influence of the boundary conditions can be excluded. In section 0 the influence of the boundary conditions is thoroughly studied. The influence of the normal spring support stiffness on the behaviour was lower than 4.9 % and the influence of the tangential spring support stiffness was lower than 3.9 %. These small percentages can not explain the difference of a factor 2.
Figure 7-46: Influence of the length of the shear key on the discrete stiffness of one precast element
Since the causes above mentioned can be excluded the cause could be found by examining the way the shear key deforms. Two mechanisms can be distinguished:
Figure 7-47: Deformation of the shear key due to shear stress (left) and due to normal stress (right)
The shear deformation can be expressed by: V V
b G G A G l dδ τγ = = = =
⋅ ⋅ ⋅ (7.4)
Where d is the thickness of the precast element b is the breadth of the shear key l is the length of the shear key From (7.4) the displacement can be derived:
V bG l d
δ ⋅=
⋅ ⋅ (7.5)

Precast concrete cores in high-rise buildings
61
This equation shows that a twice as long shear key leads to a twice as small displacement δ. With VK δ= the discrete connection stiffness of the SC is therefore twice as stiff. This explains the expectation that the IHC and the SC would have the same connection stiffness. The deformation due to normal stresses can be expressed by:
N Nl E E A E b dδ σε = = = =
⋅ ⋅ ⋅ (7.6)
From this expression the displacement can be derived: N lE b d
δ ⋅=
⋅ ⋅ (7.7)
This expression shows an opposite relation between the length of the shear key and the displacement. Conclusion In reality the deformation will be a combination of shear and normal deformation. Figure 7-48 and Figure 7-49 show however that normal deformations govern. In addition to this the length of the compressed concrete is comparable. With (7.7) this leads to the same deformation regardless of the height of the precast element. In other words: if a precast element is 20 meters height the whole height will not deform but only a certain length. Figure 7-48 and Figure 7-49 show that these are comparable for the IHC and the SC. Therefore the discrete connection stiffness comparable for the IHC and the SC, but since the connection height of the SC is twice as large compared to the IHC, the smeared connection stiffness is twice as small for the SC.
Figure 7-48: Vertical strain of the SC
Figure 7-49: Vertical strain of the IHC

Precast concrete cores in high-rise buildings
62
7.6.4. Shear stresses in horizontal joints
In section 7.1.5. was explained that the shear resistance of the horizontal joint τu is 2.3 N/mm2. In Appendix D the horizontal stresses are depicted. The values are depicted in Table 7-9. These stresses exceed the shear resistance, but are very local. In practice the stresses will be spread and it is assumed that this will not influence the connection stiffness. Peak shear stresses [N/mm2] IHC IACC
small key large key SC
At Fr 1.8 1.4 0.8 2.2 Upper horizontal joint At Fu 9.0 20.7 7.1 7.0
At Fr 0.4 0.07 0.6 3.8 Lower horizontal joint At Fu 0.7 0.08 1.2 3.2
Table 7-9: Peak shear stresses in horizontal joints
7.6.5. Dynamic loading
The loading on the corner connections is a dynamic loading. Since the wind can blow from various directions the wind load is a cyclic load. A large distinction can be made whether the stress-strain curve is in the elastic or in the plastic region. In the elastic region no significant cracks occur and the deformation is reversible. Once the forces are no longer applied, the connection returns to its original shape and has the same stiffness with the next loading. In the plastic region large cracks appear. With the next loading the connection has a significant lower stiffness. The connection should be designed in such a way that in the ultimate limit state the stress-strain curve remains in the elastic region. In case of an extraordinarily event the plastic region provides extra safety, but afterwards the plastic deformed elements should be replaced if possible. If not, the people inside the building could escape safely but the building should be considered as lost. (Pruijssers, 1998) and (Pieterse, 2006) have studied the influence of cyclic loading on the strength of dowels. From various tests in the research of Pruijssers was determined that at a maximum load of 60 % of the failure load a specimen will not fail. Besides is determined that a specimen loaded at 59 % of the failure load will maintain its strength. This is also confirmed in testing of Pieterse. Pieterse also concluded that Atena could not deliver satisfying results in determining the influence of cyclic loading. Since the dowels in this research have larger dimensions, the influence of cyclic loading should be studied in testing. For this research is assumed that the connections maintain its strength if the maximum load not succeeds 60 % of the failure load. From Table 7-7 can be concluded that the shear capacity that marks the elastic region is below 60 % of the failure load, therefore it is assumed that the connections remain their strength under cyclic loading.
7.6.6. Conclusions
All three connections show a non-linear stress-strain curve, which can be simplified by a bi-linear stress-strain curve. They have an elastic region until significant cracks occur and a plastic region until failure. The structural design should avoid the plastic region, since with a recurrent loading the stiffness is substantially reduced. Therefore the connections are compared based on the connection stiffness at Fr. It is important to realise that the relative large stiffness values of Table 7-7 are only valid until Fr. Therefore the results of the global 3D model must be checked if the limits of the shear stresses in the corner connection are not succeeded. If so, the connection has reached the plastic region and the connection will have a substantially lower stiffness. As expected the IACC performs the worst of the three studied connections. As a result of the small shear key, this connection can only be applied in case of small shear forces in the corner connection.

Precast concrete cores in high-rise buildings
63
The remaining two connections have comparable values of Fr, but the slope of elastic region of the stress-strain curve of the IHC is much steeper. Because of this the connection stiffness of the IHC is almost twice as large compared to the SC. Based on earlier research it is assumed that the connections remain their strength if the imposed load does not succeed 60 % of the failure load. Since the shear capacity that marks the elastic region is below this limit it is assumed that the connections remain their strength under cyclic loading. It is recommended to check this assumption with testing. In a sensitivity analysis the influence of the most uncertain parameters are studied on the connection stiffness. Table 7-6 shows that the model shows relatively small variations of the connection stiffness with large variations of the most uncertain parameters. Therefore it can be concluded that a robust model is obtained. Δ ΔK Normal spring support stiffness +100 % -4.9 % Tangential spring support stiffness +100 % -3.9 % Compressive stress -100 % -6.4 %
Table 7-10: Sensitivity analysis, influence of uncertain parameters on connection stiffness

Precast concrete cores in high-rise buildings
64
Chapter 8: Rembrandt Tower
In Chapter 9 the influence of the corner connection stiffness found in Chapter 7 is studied on the structural behaviour of the global 3D model. For the global 3D model parameters for core width, wall thickness, height, wind load, etc. are required. By adopting these of a reference project the number of variable parameters is reduced and one is ensured that the research structure is representative. For this research an existing high-rise building was needed, where a concrete core provides structural stability. The Rembrandt Tower was elected since this high-rise building has an orderly floor plan with a square core, which provides uncomplicated insight into the structural behaviour. With a square core determination of the normal stress distribution and deflection at the top with hand calculations is relatively straightforward and complications with torsion in case of irregular cores are prevented.
8.1. General
The Rembrandt tower is a multi-storey office building in the centre of Amsterdam completed in 1995. It was the first tower in The Netherlands with a concrete core and a steel frame. With 35 floors, the functional height of the building is 135 meter; the architectural height is 150 meter. The central core is 14,4 x 14,4 m2. The slenderness of the core is 135 / 14,4 = 9,4,
Figure 8-1: Rembrandt Tower Figure 8-2: Typical floor plan Rembrandt Tower

Precast concrete cores in high-rise buildings
65
which makes is a very slender structure. The concrete core stabilises the complete building and has to restrain all horizontal loads, caused by wind load, inclination or eccentricities and second order effects, to the foundation. The core is cast in situ cast, quality C20/25, by using a climbing system. The steel structure has pinned or shear connections. For detailed drawings is referred to Appendix A.2.
8.2. Parameters for modelling
The following parameters are adopted from the reference project and will be used in the modelling stage. The first three floors have in practice larger floor to floor heights than the general height of 3.4 meter. For simplification all floor to floor heights are set at 3.4 meter. Furthermore at the top the core thickness decreases from 0.5 meter to 0.4 meter and the core plan changes, for modelling the dimensions of the typical floor plan of Figure 8-2 with a thickness of 0.5 meter is adopted, obtaining a core that is uniform over the height. The parameters for modelling are enumerated below. The parameters marked with * are simplified to obtain orderly dimensions.
• Concrete quality C55/67 • Dimensions core: 14,4 by 14,4 meter • Thickness core: 0,5 meter • Floor to floor height: 3,4 meter • Lintel height: 0,9 meter • Number of floors: 40 * • Total height 136 meter * • Façade width: 32.4 meter • Floor system: composite floor system, 2
; ; 3 /g floor repp kN m= • Span floors: 9 meter
All other dimensions can be obtained from the simplified floor plan of Figure 8-3. From this the moment of inertia and axial gravity and wind loading are calculated in Appendix A.2.
Figure 8-3: Simplified core plan to calculate moment of inertia

Precast concrete cores in high-rise buildings
66
8.3. Simplifications
As this thesis focuses on the structural behaviour of the corner connection of high-rise cores the core of the Rembrandt Tower is simplified as depicted in Figure 8-4. With this simplification more insight is gained into the influence of the corner connection on the stiffness of the core. Influences of the inner strengthening core walls and openings on the stiffness of the core are left out of consideration. The consequences of these simplifications are discussed in this section.
Figure 8-4: Simplified core for global 3D model
• The inner stiffening walls are not modelled, only the outer core walls. This results in a decrease of the moment of inertia of the core. To obtain comparable shear forces at the corner connections, the wind load at the global model 3D is adjusted in Appendix A.2.3 to obtain the same stress distribution. The relation between the moment of inertia and the normal stress distribution is linear according to equation (8.1); therefore the overturning moment due to the wind force can be decreased with the same ratio as the decrease of the moment of inertia according to equation (8.2). And since the relation between the moment and wind load is also linear the adjusted wind load can be calculated by (8.3).
z
zz
M z NI A
σ = + (8.1)
;; ;
;
zz modelz model z casestudy
zz casestudy
IM M
I= ⋅ (8.2)
;
;
zz modelmodel casestudy
zz casestudy
Iq q
I= ⋅ (8.3)
• The openings in the core are not modelled. This openings would have caused the core to behave like coupled shear walls as described in section 4.4.3. These openings have two consequences: the lateral deflections are 15% higher and the gradient of the normal stress distribution is steeper as depicted in Figure 8-5. As explained in section 4.5.1. , the shear
stress is the derivative of the normal force: a
ax
dNsdx
= − , therefore the shear forces will be
larger in a core with central openings. Since maximum of the shear forces in the corner connections is located at about ¼ of the height of the building, the differences of the gradient of the normal stress distribution are calculated as well at this height. The results are depicted in Figure 8-5. The gradient of
the normal stress distribution of the composite core is ( 6.04) ( 3.06) 0.2114.4
− − −= − , and for the
coupled shear walls ( 3.93) ( 1.93) 0.336
− − −= − . This gradient is 1.6 times steeper, which
results in shear stresses that are 1.6 times larger as well.

Precast concrete cores in high-rise buildings
67
Figure 8-5: Influence of openings in core walls on normal stress distribution on ¼ of the height (34m)
8.4. Conclusions
The global 3D model can be modelled according to plan of the simplified core of Figure 8-4. These simplifications have consequences on shear force on the corner connections. To obtain reliable results the lateral wind loading should be reduced to take into account the reduction of the moment of inertia due to the absence of the inner core walls. Furthermore the shear forces in the corner connections of the global 3D model should be increased to take into account the influence of the central openings.

Precast concrete cores in high-rise buildings
68
Chapter 9: Global 3D model of core
In this chapter the corner connection stiffnesses from Chapter 7 are imported as springs into the 3D model to study the differences between a monolithic core and a core with precast connections.
9.1. Input Atena 3D
9.1.1. Geometry
The geometry of the model is derived from the reference project as described in Chapter 8. Because of the square core, only one symmetric half of the core (see Figure 9-1) can be analysed to reduce the time of processing. To realise this, the horizontal y-displacements along the cut surface should be equal to zero, which has been realised with the supports at ‘a’ in Figure 9-3.
Figure 9-1: Geometry of the floor plan of the global 3D model
9.1.2. Materials
A concrete quality C55/67 is used for the precast elements. The concrete is modelled with the 3D Elastic Isotropic material. From Table 3.1: Strength and deformation characteristics for concrete of Eurocode 2, the following values are entered:
Modulus of elasticity E = 38000 N/mm2 Poisson’s ratio μ = 0.2
9.1.3. Mesh
For the mesh a size of 2 meter is taken. The mesh of one floor is depicted in Figure 9-2 and for the whole core in Appendix E. The small differences between the hand calculation and the Atena 3D model in Table 9-1 show that the mesh size is well chosen.

Precast concrete cores in high-rise buildings
69
Figure 9-2: Mesh of one floor
9.1.4. Supports
Figure 9-3 shows the supports of the first floor. Support ‘a' is applied for symmetry reasons as explained in section 9.1.1. The boundary conditions at the base of the core are indicated with supports ‘b’. Since zero displacement and inclination at the base are assumed the all displacements at the base are restricted. The supports at ‘c’ represent the floors to prevent the precast walls from buckling.
Figure 9-3: Supports at the first floor of the 3D model, in total 40 floors Both a, b and c are uniform supports so they prevent displacement of the whole surface
9.1.5. Contacts
Figure 9-4: Possible corner connections.
Contact planes are automatically generated on border planes between macroelements. In a default case these contacts are rigidly connected. The contacts between the perpendicular elements represent the corner connections and deserve particular attention. Since 2D elements are not available in Atena 3D the ideal corner solution (a) of Figure 9-4 is not possible. Solution (b) causes an eccentricity and solution (c) could also be an option. However, the tangential shear stiffness Ksmeared results in a planar stiffness, i.e. in vertical and horizontal direction. But the horizontal stiffness is dependent of the stiffness of the precast corner connection and with the open vertical joints the only resistance to horizontal
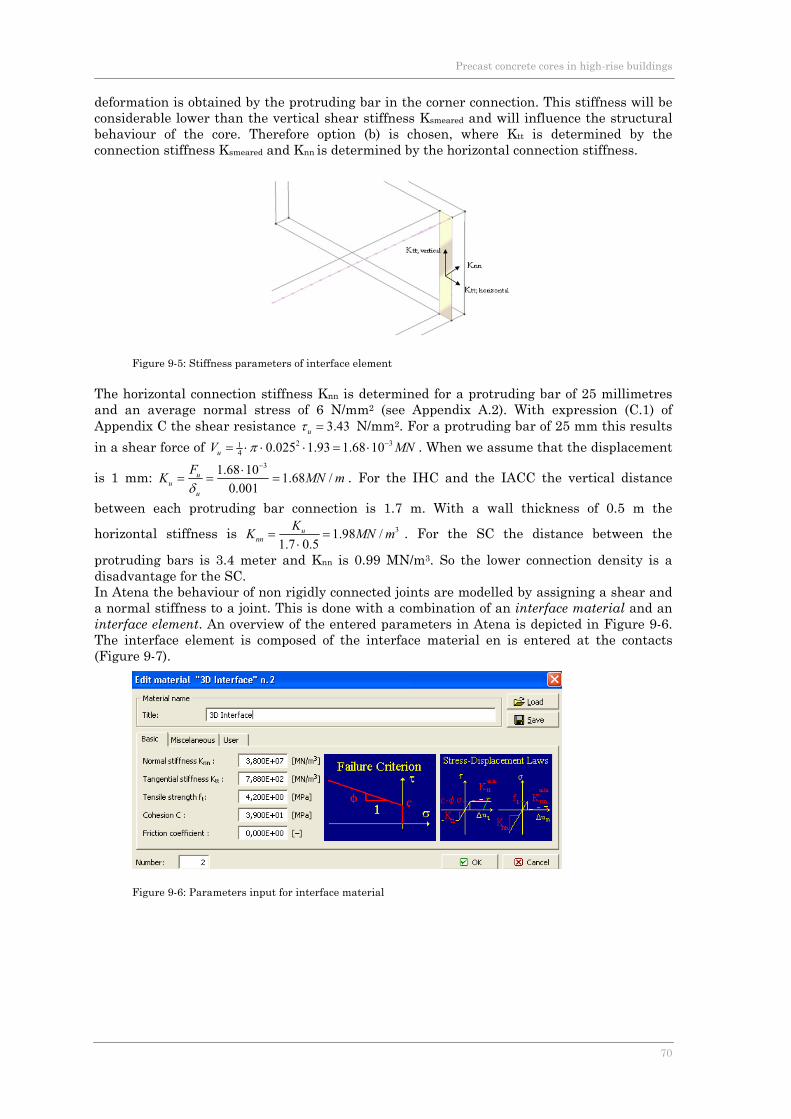
Precast concrete cores in high-rise buildings
70
deformation is obtained by the protruding bar in the corner connection. This stiffness will be considerable lower than the vertical shear stiffness Ksmeared and will influence the structural behaviour of the core. Therefore option (b) is chosen, where Ktt is determined by the connection stiffness Ksmeared and Knn is determined by the horizontal connection stiffness.
Figure 9-5: Stiffness parameters of interface element
The horizontal connection stiffness Knn is determined for a protruding bar of 25 millimetres and an average normal stress of 6 N/mm2 (see Appendix A.2). With expression (C.1) of Appendix C the shear resistance 3.43uτ = N/mm2. For a protruding bar of 25 mm this results in a shear force of 2 31
4 0.025 1.93 1.68 10uV MNπ −= ⋅ ⋅ ⋅ = ⋅ . When we assume that the displacement
is 1 mm: 31.68 10 1.68 /
0.001u
uu
FK MN mδ
−⋅= = = . For the IHC and the IACC the vertical distance
between each protruding bar connection is 1.7 m. With a wall thickness of 0.5 m the
horizontal stiffness is 31.98 /1.7 0.5
unn
KK MN m= =⋅
. For the SC the distance between the
protruding bars is 3.4 meter and Knn is 0.99 MN/m3. So the lower connection density is a disadvantage for the SC. In Atena the behaviour of non rigidly connected joints are modelled by assigning a shear and a normal stiffness to a joint. This is done with a combination of an interface material and an interface element. An overview of the entered parameters in Atena is depicted in Figure 9-6. The interface element is composed of the interface material en is entered at the contacts (Figure 9-7).
Figure 9-6: Parameters input for interface material
Precast concrete cores in high-rise buildings
71
Figure 9-7: Edit contact for interface material
9.1.6. Loads
To study a realistic structural behaviour the loads on the global 3D model are derived from the reference project of the Rembrandt Tower. As the design of a high-rise building is governed by requirements for deflections at the top; a loading combination is used with lateral wind loading and an axial loading by gravity on core walls. Loads derived from reference project (complete calculation can be found in Appendix A.2): • The vertical load on core walls are calculated in Appendix A.2 per floor (height 3.4m) and
converted into a uniform load along the length of the core walls. The vertical load on the core walls consists of three loads: a) Dead load of the outer core walls b) Dead load of the surrounding floors c) Dead load of the core floors In Appendix A.2 the vertical loads are calculated: ; ; 40.8 28.8 6.32 75.9 /g vert repq kN m= + + = This is calculated for the central axis of the core walls, depicted as the line in the middle of the walls in Figure 9-1. In the global 3D model the walls are determined by the outer points and the load is applied on the surface of the wall as depicted in Figure 9-10 . The axial gravity loading per floor for input in the Atena model is:
2 2; ;
75.9 / 152 / 0.152 /0.5g vert repkN mp kN m MN mm
= = =
• With EN 1991-1-4 in combination with the national annex for the Netherlands the wind
force acting on a structure is determined and can be found in Appendix A.2. In reality the wind load increases with the height, for the model this is simplified by converting the wind load into an equivalent wind load as depicted in Figure 9-8. From Appendix A.2
follows: ; 2 2
2 2 519 56.1 /136
repw eq
Mq kN m
l⋅ ⋅
= = = .
In section 8.3 is explained how the core of the Rembrandt model is simplified for modelling and that the wind load should be adjusted to the second moment of inertia to obtain the same normal stress distribution. The second moments of area are calculated in Appendix A.2.3, now the wind load becomes:
;; ;
;
996 56.1 39.6 /1411
zz modelw eq model casestudy
zz casestudy
Iq q kN m
I= ⋅ = ⋅ =
The lateral wind load is acting on the facade walls, which transfer the load to the floors. Horizontal displacement of the floors is prevented by the core. It is assumed that only the core walls parallel to the wind direction take the lateral wind load, as these walls are much stiffer in the wind direction. Therefore the wind load is applied along the core walls parallel to the wind direction at the floor height as depicted in Figure 9-9,
; ; 3; ;
3.4 / 24.84 / 4.84 10 /
13.9w eq model
w eq Atena
q mq kN m MN m
m−⋅
= = = ⋅ per floor

Precast concrete cores in high-rise buildings
72
Figure 9-8: Peak velocity pressure according to Eurocode 2 and equivalent wind load
Figure 9-9: Wind loading along the edge of the wall parallel to the wind direction
Figure 9-10: Axial gravity loading on the surface of the section of one floor
9.2. Influence corner connection stiffness on lateral deflection
In this section the discrete connection stiffness from Chapter 7 is imported into the 3D model by assigning a smeared stiffness to the interface element between the perpendicular core walls. To validate the model, the corner contacts are first entered as monolithic connections, the lateral deflections should match the deflections which can be calculated with the differential equations as described in section 4.4. In the second row of Table 9-1 the results for the monolithic corner connection are depicted. It can be concluded that the lateral deflection at the top in the global 3D model is just higher than the differential equations predict. With the differential equations it is assumed that the planes remain planar, where in Atena planes can deform. This explains the small difference. It can be concluded that the global 3D model is validated with the differential equations. To indicate the upper limit, the lateral deflections are also calculated for the situation where there is no connection between the perpendicular walls. This is depicted in the last row. The next step is to attribute the tangential stiffness Ktt found in Chapter 7 to the interfaces between the perpendicular elements of the 3D model. The normal stiffness Knn describes the horizontal stiffness of the protruding bar connection as described in section 9.1.5. The results for the various corner connections are depicted in Table 9-1 and Figure 9-11.

Precast concrete cores in high-rise buildings
73
Corner connection Method Ktt
[MN/m3] Knn
[MN/m3] δtop
[mm] Comparison
[%] Hand calculation 38000/2.4 38000 45.5 Monolithic
connection Atena 3D 38000/2.4 38000 47.7 100%
IHC 1694 1.98 49.3 103.3% IACC 1582 1.98 49.4 103.5% Precast corner
connection SC 837 0.99 50.5 105.9% Hand calculation 0 0 180.6 378.6%
No connection Atena 3D 0 0 189.7 397.7% *
Table 9-1: Influence of corner connection on deflection of top, without influence of horizontal joint * Four times more than monolithic connection, as predicted in section 4.5.3.
It can be concluded that although the stiffnesses of the three studied corner connections differ substantially, the difference on the lateral deflections are relatively small. The IHC is the stiffest connections and leads to a lateral deflection at the top on only 3.3 % more than with a monolithic connection. When the precast corner connections are compared the lateral deflection of the SC is 2.5 % larger than with IHC, as is depicted in Table 9-2. Corner connection Deflection at top
[mm] Difference
[%] IHC 49.3 100% IACC 49.4 100.2% SC 50.5 102.5%
Table 9-2: Comparison precast corner connections
0
20
40
60
80
100
120
140
0 5 10 15 20 25 30 35 40 45 50 55
Height [m
]
Deflection [mm]
IHC and IACC overlap
Monolithic (Atena)
IHC
IACC
SC
Figure 9-11: Influence of corner connections on lateral deflection

Precast concrete cores in high-rise buildings
74
9.3. Verification strength of corner connections
A monitor point in the global 3D model showed that for all three corner connections the maximum shear stress in the corner connection is 0.22 N/mm2. In section 8.3 was concluded that the shear stresses in the corner connections should be increased with 60 % to take into account the influence of central openings, therefore τ = 0.35 N/mm2. As described in section 7.2.1. the connection stiffness Kdiscrete is only valid until the proportional limit Fr. As described in section 7.6.5. the strength of the connection under cyclic loading is guaranteed if the load remains below 60 % of the proportional limit. So the allowable force Fcyclic on the IHC is for example 1025 kN. To take into account the height of the connection the proportional limit Fr is divided the height and depth of the connection:
0.6 rv
Ff
h d⋅
=⋅
Where fv is the strength of the connection, h is the height of the connection and d the depth of the core wall. A corner connection is approved if:
1vfτ
≤
This results for the IHC in: 0.58vfτ
= , for the IACC in: 1.67vfτ
= and for the SC in 0.90vfτ
=
Therefore the IACC is rejected; due to the unfavourable behaviour of the small key the shear stresses exceed the strength. Furthermore it can be concluded that the IHC is able to transfer larger shear stresses in the corner connections compared to the SC.
Shear stress in core corner Strength of corner connection τ [N/mm2] Fr [kN] Fcyclic [kN] A = h.d [mm2] fv [N/mm2]
IHC 0.35 1709 1025 1.7x10⁶ 0.60 IACC 0.35 600 360 1.7x10⁶ 0.21
SC 0.35 2185 1311 3.4x10⁶ 0.39
Table 9-3: Strength verification of the considered corner connections
9.4. Verification horizontal force in corner connection
This section describes the horizontal interaction between the web and the flange core walls. The wind load is transferred through the floors on the web core walls, which are the core walls parallel to the wind directions. Due to this loading the core walls deflect horizontally. To make the core walls act as a whole, the walls perpendicular to the wind direction, the flange core walls, must follow this horizontal deflection u, for which qcouple is required. Since open vertical joints are applied between the precast elements, the only horizontal connection between the perpendicular core walls is provided by the vertical protruding bars in the corner connections. This sections checks if the shear capacity of the protruding bars is larger than the transferable horizontal force.

Precast concrete cores in high-rise buildings
75
Figure 9-12: Left: Displacement of the core of the reference project due to wind loading Middle: Horizontal force qcouple to couple the flange to the web core wall Right: Due to open vertical joints this horizontal force is centralised at the protruding bars. The symbol a indicates the vertical distance between the protruding bars
9.4.1. Transferable horizontal force
The transferable horizontal force qcouple is equal to the force which is required to deflect the flange core wall to the horizontal displacement of the core u. For the flange core wall the deflection reads as:
4
8coupleq l
uEI⋅
= , from which can be derived: 9 31
124 4
0.048 8 38 10 7.2 0.58 3.2 /136couple
u EIq N ml
⋅ ⋅ ⋅ ⋅ ⋅ ⋅⋅= = =
The horizontal force on each protruding bar is protrudingbar coupleF q a= ⋅ , for the IHC this is 5.4 N and for the SC this is 10.9 N. N.B. It was found impossible to read reliable values of the transferable horizontal forces with help of monitoring points in the global 3D model. Since the model is composed of 3D solid elements, only the stresses on a surface could be monitored. These showed great variety over the depth and height of the element of one floor. Therefore, to obtain reliable results the horizontal force was obtained through the method above.
9.4.2. Shear capacity protruding bar
The shear capacity of the protruding bar in the corner connection can be calculated with expression (C1) of Appendix. For a protruding bar of 25 mm and no external normal stress on
the surface, the shear capacity is 21
242
250.5 0 0.5 435 0.43 /500Rdi n ydV f N mmπμ σ μ ρ ⋅
= ⋅ + ⋅ ⋅ = ⋅ + ⋅ ⋅ =
9.4.3. Conclusion
The requirements of horizontal strength of the corner connection are satisfied if the shear capacity of the protruding bar is larger than the transferable horizontal force:
2 20.43 / (500 ) 10.9 107 10.9Rdi contact protrudingbarV A F N mm mm N kN N⋅ > ⇔ ⋅ > ⇔ > . So for both the IHC and SC the requirements of horizontal strength are satisfied with a large margin.

Precast concrete cores in high-rise buildings
76
9.5. Conclusions
Table 9-1 shows that the IHC leads to an increase in deflection at the top of the core of just 3.3 % compared to the Atena model with monolithic corner connections. The SC results in an increase of 5.9 %. Although the stiffnesses of the three studied corner connections differ substantially, the difference on the lateral deflections are very small. The strength of the IACC is lower than the shear stresses of the global 3D core and is therefore not suitable to be applied in the core of the reference project. The IHC is able to transfer considerable larger shear stresses in the corner connections compared to the SC.

Precast concrete cores in high-rise buildings
77
Chapter 10: Conclusions and recommendations
10.1. Conclusions
Precast corner connections
The load displacement diagram of Figure 10-1 shows for all considered connections an important difference in the behaviour before cracks initiate and after. Before Fr when the concrete ruptures, the behaviour is linear elastic and the shear key is compressed vertically. Reinforcement has no influence on the stiffness of the connection. From Fr to Fu the shear key rotates and the amount of horizontal reinforcement determines the behaviour until failure. However, the stiffness of the connection is considerable lower after Fr. Considering the dynamic behaviour of the wind load, the imposed load should not exceed Fr since the deformations are reversible in the elastic region and the higher stiffness until Fr is guaranteed.
Figure 10-1: Load displacement diagrams of the three studied corner connections. K indicates the discrete connection stiffness. Diagram is valid for precast connections with a thickness of 500 mm
From Figure 10-1 it can be concluded that all considered connections have comparable discrete stiffness until Fr. When the height and depth of the connection are taken into account Table 10-1 shows that the smeared stiffness of the IHC and IACC is twice as large compared to the SC. The strength of the IACC is lower than the shear stresses of the global 3D core and is therefore not suitable to be applied in the core of the reference project. The IHC is able to transfer considerable larger shear stresses in the corner connections compared to the SC.

Precast concrete cores in high-rise buildings
78
Of the three considered precast corner connections the IHC clearly has the best structural behaviour since it has the highest smeared stiffness and the highest strength.
3[ / ]discretesmeared
KK MN m
h d=
⋅ 20.6 [ / ]r
vF
f N mmh d
= ⋅⋅
IHC 1694 0.60 IACC 1582 0.21
SC 837 0.39 Table 10-1: Smeared connection stiffness and connection strength fv, 0.6 is a reduction factor for cyclic loading, h is the height of the connection and d the depth
In a sensitivity analysis the influence of the most uncertain parameters are studied on the connection stiffness. Table 10-2 shows that the model shows relatively small variations of the connection stiffness with large variations of the most uncertain parameters. Therefore it can be concluded that a robust model is obtained.
Δ ΔK Normal spring support stiffness +100 % -4.9 % Tangential spring support stiffness +100 % -3.9 % Compressive stress -100 % -6.4 %
Table 10-2: Sensitivity analysis, influence of uncertain parameters on connection stiffness
Feasibility of precast concrete cores in high-rise buildings
The influence of the stiffness of the precast corner connections is depicted in Figure 10-2. Compared to a monolithic corner connection the IHC show an increase of lateral deflections of just 3.3 %. The SC results in an increase of 5.9 %. With regard to the influence of precast corner connections on the lateral deflection it can be concluded that a decreased stiffness of just 3.3 % compared to a monolithic connection forms no hindrance to realise a high-rise structure composed of precast elements.
Figure 10-2: Influence of corner connections on lateral deflection

Precast concrete cores in high-rise buildings
79
10.2. Recommendations
The reduction factor to take cyclic loading into account should be verified for the precast corner connections. Based on earlier research it is assumed in this thesis that the connections remain their strength if the maximum load does not succeed 60 % of the failure load. Since the shear capacity that marks the elastic region is below this limit it is assumed that the connections remain their strength under cyclic loading. It is recommended to check this assumption with testing, since Pieterse concluded that Atena could not deliver satisfying results with cyclic loading. More research is required on the vertical perpendicular connections between the inner core walls and outer core walls. Since they form T connections the structural behaviour will be different. The connections between inner core walls differ as well since they form cross connections. Whether a high-rise core composed of precast elements is successful is not just determined by the construction method. Factors as costs and practicability are just as important. Vertical transport of the precast elements is a particular point of interest in high-rise buildings. A comparative assessment is required to study all factors that determine whether a traditional cast in situ core or a core composed of precast elements is the best construction method.

Precast concrete cores in high-rise buildings
80
Bibliography
Bennenk, H.W. (2001): Handboek prefab beton, BFBN. Bouma, A.L. (2000): Mechanica van constructies, Elastostatica van slanke structuren, VSSD,
Delft. EB, (2007): Strijkijzer: wonder van efficiëntie, Beton in Beeld 007 – 2007. Eisele, J., Kloft, E. (2003): High-Rise manual: typology and design, construction and
technology, Basel. Eldik, C.H., Rolloos, A. (1996): Overspannend staal, Construeren B, Rotterdam. FIB, Task Group 6.2 (2008): Structural connections for precast concrete buildings, Guide to
good practice, Lausanne. Falger, M.M.J. (2003): Geprefabriceerde betonnen stabiliteitsconstructies met open verticale
voegen in metselwerkverband, master’s thesis, Delft University of Technology. Falger, M.M.J., Sterken, C.A.J. (2004): Invloed van voegen op prefab stabiliteitsconstructies
in hoogbouw, Cement 6, 2004 p. 48-52. Font Freide, J.J.M., Prumpeler, M.W.H.J., Woudenberg, I.A.R. (2006): “Het Strijkijzer; nieuw
landmark voor Den Haag”, Cement 1, 2006 p. 37-41. Hartsuijker, C. (2001): Toegepaste mechanica deel 2, Schoonhoven. Pieterse, E.A. (2006): Deuvelwerking van randbalken in prefabbouw, master’s thesis, Delft
University of Technology. Pruijssers, A.F. (1988): Aggregate interlock and dowel action under monotonic and cyclic
loading, doctoral research, Delft University of Technology, Pronk, J. (2002): Logistiek bij hoogbouw, master’s thesis, Delft University of Technology. Smith, B.S., Coull, A. (1991): Tall building structures: analysis and design, New York. Stupré commissie 53 (1993): Verticale voorspanning van ruimtelijke kernelementen, Stupré
rapport 24, Nieuwegein. Straman, J.P., (1988): Geprefabriceerde stabiliteitsconstructies, de invloed van verticale voegen, Delft University of Technology. Vamberský J.N.J.A. (2005): Reader Designing and understanding precast concrete structures
in buildings. Delft University of Technology. Vamberský J.N.J.A. (2007/1): Precast concrete and residential high-rise in The Netherlands.
In W. Derkowski (Ed.), Prefabrication in Europe. Cracow University.

Precast concrete cores in high-rise buildings
81
Vamberský J.N.J.A. (2007/2): Voorvarende evolutie van woontorens in prefab beton.
Article in b:ton, October 2007 Wicke, M., Randl N. (2000) Schububertragung zwischen alt- und neubeton. Experimentele
untersuchungen theoretischer hintergrund un Bemessungsanatz, Beton- und Stahlbetonbau, nr. 95, heft 8, 2008


Precast concrete cores in high-rise buildings
A.1
Appendix A: Rembrandt Tower
A.1. Structural drawings
Figure A-1: Typical floor plan (8th floor)
Figure A-2: Core wall, section AA’
A
A’
4330
1900

Precast concrete cores in high-rise buildings
A.2
A.2. Calculations
The design of a high-rise building is governed by requirements for deflections at the top; therefore a loading combination is used with lateral wind loading and a vertical load on core walls. As this calculation forms a part of a research all safety factors are taken as 1.0 to gain better insight in the contribution of each load. Furthermore calculations for deflection are calculated in service limit state. A.2.1 Axial loading by gravity All vertical loads are calculated per floor (height 3.4m) and applied as a uniform load along the length of the core walls. The concrete density is assumed as 24 kN/m3. The vertical load on the core walls consists of three loads:
a) Dead load of the outer core walls
2; ; 0.5 3.4 24 / 40.8 /g wall repq m m kN m kN m= ⋅ ⋅ =
b) Dead load of the surrounding floors
The composite floor system is supported by beam that span 9 meter from the façade to the core (Figure A-4). The total dead weight of the floor system per square meter consists of:
- Beam HE 280AA (Figure A-4), c.t.c. 3.6m 2; ;
0.61 / 0.17 /3.6g beam repkN mp kN mm
= =
- Composite floor system 2; ; 3 /g floor repp kN m= (Eldik, 1996, p.478)
- Static loading 2; ; 1.7 /g static repp kN m= (Eldik, 1996, p.478)
The total dead load of the surrounding floor applied as a uniform load along the outer core wall: 2
; . ; 0.17 3 1.7 4.87 /g surr floors repp kN m= + + = Since the floors are hinged connected tot the core and columns half of the vertical load of the floors (4.5 m) is transferred to the core, grey area in Figure A-3. The supported floor area is converted in a line load along the core wall by dividing the vertical load of the area by the length of the outer core walls. This method neglects the increased load at the corners.
2 2. ; . ;
; . ;.
340.2 4.87 / 28.8 /4 14.4
surr floors g surr floors repg surr floors rep
core walls
A p m kN mq kN ml m⋅ ⋅
= = =⋅
c) Dead load of the core floors
The floor inside the core is a 400 mm thick concrete slab, including static load this results in: 3 2 2
; . ; 0.4 24 / 1.7 / 11.3 /g core floor repp m kN m kN m kN m= ⋅ + = This vertical load is also applied as a uniform load along the core wall:
2 2. ; . ;
; . ;.
32.2 11.3 / 6.32 /4 14.4
core floors g core floors repg core floors rep
core walls
A p m kN mq kN ml m⋅ ⋅
= = =⋅
The total vertical load on the core walls per floor is the sum of a, b and c: ; ; 40.8 28.8 6.32 75.9 /g vert repq kN m= + + = The axial gravity stress at the base is:
2; ;
75.9 / 40 6.07 /0.5g vert repkN mp N mmm
= ⋅ =

Precast concrete cores in high-rise buildings
A.3
Figure A-3: The floor areas supported by the outer core walls Figure A-4: Floor system Rembrandt Tower (Overspannend Staal, B)
A.2.2 Lateral wind loading The lateral wind load is acting on the facade walls, which transfer the load to the floors. Horizontal displacement of the floors is prevented by the core. It is assumed that only the core walls parallel to the wind direction transfer the lateral wind load, as these walls are much stiffer in the wind direction. Therefore the wind load is applied along the core walls parallel to the wind direction at the floor height. With EN 1991-1-4 in combination with the national annex for the Netherlands the wind force acting on a structure is determined by:
( )w s d f pq c c c q z b= ⋅ ⋅ ⋅ (A.1) Where cscd is the structural factor, see (A.7), minimum is 0.85 cf is the force coefficient, see (A.6) qp(ze) is the peak velocity pressure at reference height ze, see Figure A-5
b is the width of the building, here 32.4 meter, see Figure A-5
Figure A-5: Symbols used in Eurocode 2 for vertical structures as buildings, zs = 0.6h
In the following sections the parameters were calculated, resulting in a wind load: 0.86 1.43 ( ) 32.4w pq q z= ⋅ ⋅ ⋅ [kN/m]
The peak velocity pressure qp(z) is dependent of the height of the building, the resulting values are given in Table A-1. In this table qp(z) is determined from (A.2)m, qw;rep is calculated according to equation (A.2). Fw;rep calculates the force on each floor ; ;3.4w rep w repF q= ⋅ . The
moment due to the lateral wind load at the base is: 40
;1
519rep w repf
M H F kNm=
= ⋅ =∑
To simplify input of the wind load in the finite element program the equivalent wind load is
determined according to: ; 2 2
2 2 519 56.1 /136
repw eq
Mq kN m
l⋅ ⋅
= = = .
In section 8.3 is explained how the core of the Rembrandt model is simplified for modelling and that the wind load should be adjusted to the second moment of inertia to obtain the same

Precast concrete cores in high-rise buildings
A.4
normal stress distribution. The second moments of area are calculated in Appendix A.2.3,
now the wind load becomes: ;; ;
;
996 56.1 39.6 /1411
zz modelw eq model casestudy
zz casestudy
Iq q kN m
I= ⋅ = ⋅ =
In Atena the wind load is applied along the core walls parallel to the wind direction: ; ;
; ;
3.4 / 24.52 /
14.9w eq model
w eq Atena
q mq kN m
m⋅
= =
Figure A-6: Peak velocity pressure according to Eurocode 2 and equivalent wind load
Floor f
Height [m]
qp(ze) [kN/m2]
qw;rep [kN/m]
Fw;rep [kN]
Mrep;bas
e [kN]
40 136.0 1.56 62.09 211.12 28712 39 132.6 1.55 61.69 209.74 27811 38 129.2 1.54 61.27 208.33 26917 37 125.8 1.53 60.85 206.89 26027 36 122.4 1.52 60.42 205.42 25143 35 119.0 1.51 59.97 203.90 24265 34 115.6 1.49 59.52 202.35 23392 33 112.2 1.48 59.05 200.76 22525 32 108.8 1.47 58.57 199.12 21665 31 105.4 1.46 58.07 197.44 20810 30 102.0 1.44 57.56 195.71 19962 29 98.6 1.43 57.04 193.93 19121 28 95.2 1.42 56.50 192.09 18287 27 91.8 1.40 55.94 190.19 17460 26 88.4 1.39 55.36 188.23 16640 25 85.0 1.37 54.77 186.20 15827 24 81.6 1.36 54.15 184.10 15023 23 78.2 1.34 53.51 181.92 14226 22 74.8 1.33 52.84 179.66 13438 21 71.4 1.31 52.15 177.30 12659 20 68.0 1.29 51.42 174.84 11889 19 64.6 1.27 50.67 172.27 11128 18 61.2 1.25 49.88 169.58 10378 17 57.8 1.23 49.04 166.75 9638 16 54.4 1.21 48.17 163.77 8909 15 51.0 1.19 47.24 160.62 8192 14 47.6 1.16 46.26 157.29 7487 13 44.2 1.13 45.22 153.74 6795 12 40.8 1.11 44.10 149.94 6118 11 37.4 1.08 42.90 145.86 5455 10 34.0 1.04 41.60 141.43 4809 9 30.6 1.01 40.18 136.61 4180 8 27.2 0.97 38.61 131.29 3571 7 23.8 0.93 36.87 125.36 2984 6 20.4 0.88 34.90 118.65 2420 5 17.0 0.82 32.62 110.90 1885 4 13.6 0.75 29.90 101.68 1383 3 10.2 0.67 26.54 90.23 920 2 6.8 0.55 22.04 74.94 510 1 3.4 0.38 15.02 51.07 174 Σ Mbase 518734 kNm
Table A-1: Parameters to determine qw;eq

Precast concrete cores in high-rise buildings
A.5
Peak velocity pressure qp(z) The peak velocity pressure is determined by the following formula:
212( ) (1 7 ( )) ( )p v mq z l z v zρ= + ⋅ ⋅ ⋅ ⋅ (A.2)
Where lv(z) is the turbulence intensity, see (A.3) ρ is the air density, for which 1.25 kg/m2 is given in the national annex vm is the mean wind velocity, see (A.4)
The turbulence intensity is determined by the following formula:
( )00
( )( ) ln
lv z
z
kl z
c z=
⋅ (A.3)
Where kl is the turbulence factor, for which a value of 1.0 is given in the national annex c0(z) is the orography factor, taken as 1.0 z0 is the roughness length, for which a value of 0.5 if given in the national annex The mean wind velocity is determined by the following formula: 0( ) ( ) ( )m r bv z c z c z v= ⋅ ⋅ (A.4) Where cr(z) is the roughness factor:
0 0.5( ) ln( ) 0.22 ln( )z zr r zc z k= ⋅ = ⋅
kr is the terrain factor: 0 0.07 0.070.50.05 0.050.19 ( ) 0.19 ( ) 0.22z
rk = ⋅ = ⋅ = vb is the basic wind velocity, see (A.5) The basic wind velocity is determined by the following formula: ,0 1 1 27 27 /b dir season bv c c v m s= ⋅ ⋅ = ⋅ ⋅ = (A.5) Where cdir is the directional factor, for which a value of 1.0 is given in the national annex cseason is the season factor, for which a value of 1.0 is given in the national annex vb,0 is the fundamental value of basic wind velocity, the national annex gives for
wind area II: vb,0= 27 m/s Force coefficient cf The force coefficient is determined, using the following formula: ,0 2.1 1 0.68 1.43f f rc c λψ ψ= ⋅ ⋅ = ⋅ ⋅ = (A.6) Where cf;0 is the force coefficient, for the Rembrandt Tower this is 2.1 ψr is the reduction factor for square sections, here 1.0 ψλ is the end effect factor, here 0.68 Structural factor cscd The structural factor is calculated by using the following formula:
( ) 2 21 2 1 2 3 0.20 0.44 0.34 0.861 7 ( ) 1 7 0.20p v s
s dv s
k l z B Rc c
l z+ ⋅ ⋅ ⋅ + + ⋅ ⋅ ⋅ +
= = =+ ⋅ + ⋅
(A.7)
Where zs is the reference height for the structural factor: 0.6 0.6 136 81.6sz h m= ⋅ = ⋅ = kp is the peak factor lv is the turbulence intensity B2 is the background factor R2 is the resonance response factor The peak factor kp is the largest value of:
- kp = 3 (largest)

Precast concrete cores in high-rise buildings
A.6
-
0.62 ln(2 ln( ))2 ln( )
0.62 ln(2 ln(0.21 600)) 2.322 ln(0.21 600)
pk v Tv T
= ⋅ ⋅ ⋅ +⋅ ⋅
= ⋅ ⋅ ⋅ + =⋅ ⋅
(A.8)
Where T is the average time for mean wind velocity, T = 600 seconds v is the up-crossing velocity, determined by (A.9):
2 2
1 2 2 2 2
0.34; 0.08 ; 0.34 0.210.44 0.34
Rv n v Hz vB R
= ⋅ ≥ = ⋅ =+ +
(A.9)
Where n1 is the eigenfrequency of the building, for a height
of more than 50 meter: 146 46 0.34
136n
h= = =
The background factor B2 is determined by:
( ) ( ) ( )
( ) ( ) ( )
2
2 2 232 ( ) ( ) ( ) ( )
2 2 23 32.4 136 32.4 1362 169 169 169 169
1
1
1 0.441
s s s s
b h b hL z L z L z L z
B =+ ⋅ + + ⋅
= =+ ⋅ + + ⋅
(A.10)
Where h is the height of the building, here 136 meter L(zs) is the turbulent length scale at reference height zs, determined by: ( ) ( )0.6481.6
200( ) 300 169.0s
t
zs t zL z L
α= ⋅ = = (A.11)
Where zt is the reference height of 200 meter
Lt is the reference length scale of 300 meter 00.67 0.05ln( ) 0.67 0.05ln(0.5) 0.64zα = + = + =
The resonance response factor R2 is given by the formula:
2 2
21 1( , ) ( ) 0.085 0.082 0.34
2 2 0.1L s sR S z n K nπ πδ
= ⋅ ⋅ = ⋅ ⋅ =⋅ ⋅
(A.12)
δ is the total logarithmic decrement of damping, here only structural damping is taken into consideration, for reinforced concrete buildings this is 0.1 SL is the wind power spectral density function, defined as:
5 53 3
11
1
6.8 ( , ) 6.8 1.90( , ) 0.085(1 10.2 ( , )) (1 10.2 1.90)
L sL s
L s
f z nS z n
f z n⋅ ⋅
= = =+ ⋅ + ⋅
(A.13)
Where the non-dimensional frequency fL(zs,n1) can be determined by:
11
( ) 0.34 169( , ) 1.90( ) 30.26
sL s
m s
n L zf z n
v z⋅ ⋅
= = = (A.14)
Where n1 is the natural frequency of the building, n1 = 0.34, see (A.9) L(zs) is the turbulent length scale, L(zs) = 169, see (A.11) vm(zs) is the reference wind velocity at reference height zs = 81.6m, with (A.4): vm(zs) = 30.26 m/s
Ks(n) is the size reduction factor, given by the following formula:
2 2 22
2 2 22
1( )1 ( ) ( ) ( )
1 0.0821 (1/ 2 4.19) (3 /8 17.57) ( 1/ 2 4.19 17.57 3/ 8)
s
y y z z y y z z
K nG G G Gπ
π
ϕ ϕ ϕ ϕ=
+ ⋅ + ⋅ + ⋅ ⋅ ⋅ ⋅
= =+ ⋅ + ⋅ + ⋅ ⋅ ⋅ ⋅
(A.15)
Where

Precast concrete cores in high-rise buildings
A.7
1 11.5 32.4 0.34 4.19( ) 30.26
yy
m s
c b nv z
ϕ⋅ ⋅ ⋅ ⋅
= = =
1 11.5 136 0.34 17.57( ) 30.26
zz
m s
c h nv z
ϕ⋅ ⋅ ⋅ ⋅
= = =
cy = cz = 11.5, Gy = 1/2, Gz = 3/8 A.2.3 Composite core When the influence of the door openings in the core are neglected, calculations can be made with the second moment of inertia of the composite core. When the core structure is considered as coupled shear walls the second moment of inertia of the two individual parts should be determined according to the section A.2.4. Second moment of inertia of Rembrandt Tower From Figure A-1 can be seen that the thickness of the outer core wall is 500 mm and the inner core wall 400 mm. The moments of inertia of the composite core are:
3 31 1; 12 12
3 2 3 2 41 112 12
2 0.5 14.4 2 0.4 14.4
2 { 14.4 0.5 0.5 14.4 7.2 } 2 { 14.4 0.4 0.4 14.4 4.33 } 1411zz casestudyI
m
= ⋅ ⋅ ⋅ + ⋅ ⋅ ⋅
+ ⋅ ⋅ ⋅ + ⋅ ⋅ + ⋅ ⋅ ⋅ + ⋅ ⋅ = (A.16)
3 31 1; 12 12
3 2 3 2 41 112 12
2 0.5 14.4 2 0.4 14.4
2 { 14.4 0.5 0.5 14.4 7.2 } 2 { 14.4 0.4 0.4 14.4 1.9 } 1236yy casestudyI
m
= ⋅ ⋅ ⋅ + ⋅ ⋅ ⋅
+ ⋅ ⋅ ⋅ + ⋅ ⋅ + ⋅ ⋅ ⋅ + ⋅ ⋅ = (A.17)
Second moment of inertia of simplified core for modelling In section 8.3 is explained how the core of the Rembrandt model is simplified for modelling and that the wind load should be adjusted to obtain the same normal stress distribution. The second moment of inertia of the simplified core for modelling is:
3 3 2 41 1; ; 12 122 0.5 14.4 2 { 14.4 0.5 0.5 14.4 7.2 } 996zz model yy modelI I m= = ⋅ ⋅ ⋅ + ⋅ ⋅ ⋅ + ⋅ ⋅ = (A.18)
The adjusted wind load can be calculated according to equation (8.3):
;;
;
996 56.1 39.6 /1411
zz modelw model casestudy
zz casestudy
Iq q kN m
I= ⋅ = ⋅ = (A.19)
Normal stress distribution
The normal stress distribution is calculated with: ;
( ) N M z
zz model
M zNzA I
σ σ σ⋅
= + = +
Nσ can be calculated from Appendix A.2.1: ; ; 75.9 /g vert repq kN m= , which is 0.15 N/mm2 per floor. With 21
;2z w modelM q l= ⋅ ⋅ the normal stress distribution at the base of the composite core is depicted in Figure A-7.
Figure A-7: Normal stress distribution of composite core

Precast concrete cores in high-rise buildings
A.8
A.2.4 Coupled shear walls This calculation takes the influence of the necessary openings into account as mentioned in section 4.4.3. According to Smith and Coull (1991) the structural behaviour of this complex system can be determined with the method below.
Figure A-8: Parameters of simplified core
Step 1. Determine the areas and second moments of area 3 2 3 2 41 1
1 2 12 124
1 22
1 22
1 2
0.5 6 1.64 0.5 6 7.2 0.5 1.36 7.2 0.5 23.8
47.6
0.5 6 0.5 7.2 6.6
13.2
I I m
I I I m
A A m
A A A m
= = ⋅ ⋅ + ⋅ ⋅ + ⋅ ⋅ + ⋅ ⋅ =
= + =
= = ⋅ + ⋅ =
= + =
For the connecting beam, the lintel, assuming that the entire cross section is affective: 3 41
12 0.5 0.9 0.030lintelI m= ⋅ ⋅ = The second moment of area of the lintel Ilintel is reduced to Ic to include shearing deformation.
40.0221lintel
cI
I mr
= =+
Where:
2
120.39lintelEI
rb GA
λ= =
9 29 238 10 / 15.83 10 /
2(1 ) 2(1 0.2)E N mG N mv
⋅= = ⋅
+ +
Taking account of the wall-beam flexibility, effective length = true length + ½ beam depth = 2.85 m. Step 2. Determine the structural parameters k, α, and kαH
22 2
1 2
2 22
3 3
13.2 47.61 1 1.0526.6 6.6 11.67
12 12 0.022 11.67 0.0972.85 3.4 47.6
1.052 0.098 136 13.976
c
A Ik kA A l
I lb h I
k H
α α
α
⋅ ⋅= + ⇔ = + =
⋅ ⋅ ⋅ ⋅
⋅ ⋅ ⋅ ⋅= ⇔ = =
⋅ ⋅ ⋅ ⋅= ⋅ ⋅ =
The value kαH defines the degree of composite action and indicates the mode of resistance to applied moments. If kαH is less than about 1, the beams may be regarded as flexible and the walls tend to act as independent linked cantilevers. If kαH is large, say greater than about 8 (Smith 1991, p.235), the beams are classed as stiff and the structure tends to act like a composite cantilever as is the case with this calculation.

Precast concrete cores in high-rise buildings
A.9
Step 3. Determine the percentage of the wind moment carried by K1 and K2 K1 is the percentage of the wind moment at height z carried by individual cantilever action and K2 is the percentage carried by composite cantilever action. The individual moment acting on each wall will be proportional to its second moment of area. At z = 0:
2 212 22 2
1 2
200 sinh1 sinh ( ) cosh ( ) ( ) (1 ) 87%cosh( ) (1 )
100 13%
zHz
H
k H k HK k H z k H z k Hk Hk H
K K
α α α α ααα−⎡ ⎤= + − − − + − =⎢ ⎥⋅ − ⎣ ⎦
= − =
The total base moment on symmetrical half of core: 21 1;2 2( ) 183total w modelM q H MNm= ⋅ =
Portion of moment due effectively to individual cantilever action: 0.13 183 24individualM MNm= ⋅ = Moment due to individual cantilever action on part 1 (and on part 2):
1; 1 ; 2
23.8 24 1247.6indiviudual part indiviudual part total
IM M M MNm
I= = ⋅ = ⋅ =
Portion of moment due effectively to composite cantilever action: 0.87 183 159compositeM MNm= ⋅ =
Step 4. Calculate Ig of composite cross section, normal stress distribution The effective composite second moment of area of cross section is:
2 2 41 21 2
6.6 6.623.8 23.8 11.67 49713.2g
A AI I I l m
A⋅ ⋅
= + + = + + ⋅ =
With the distances c and d from Figure A-9 the stresses at the extreme fibres of the walls can be calculated:
Figure A-9: Distance c for individual cantilever action and distance d for composite cantilever action
. .
;1; ; 1 2
1
;1; ; 2 2
1
12233 1.36 158645 7.2 3 /23.8 497
12233 4.64 158645 1.2 2 /23.8 497
individual cantilever composite cantilever
comp cant cg Aind cantA
g
comp cant cg Bind cantB
g
C
M dM cN mm
I I
M dM cN mm
I I
σ σ σ
σ
σ
σ
−
−
= +
⋅⋅ ⋅ ⋅= + = + =
⋅⋅ ⋅ − ⋅= − + = + = −
= ;2; ; 3 2
2
;2; ; 4 2
2
12233 4.64 158645 1.2 2 /23.8 497
12233 1.36 158645 7.2 3 /23.8 497
comp cant cg Cind cant
g
comp cant cg Dind cantD
g
M dM cN mm
I I
M dM cN mm
I Iσ
−
−
⋅⋅ ⋅ ⋅ −+ = + =
⋅⋅ ⋅ − ⋅ −= − + = + = −
Now the normal stress distribution of the section at the base can be drawn:
Figure A-10: Normal stress distribution for coupled shear walls without vertical loading (left) and with (right)
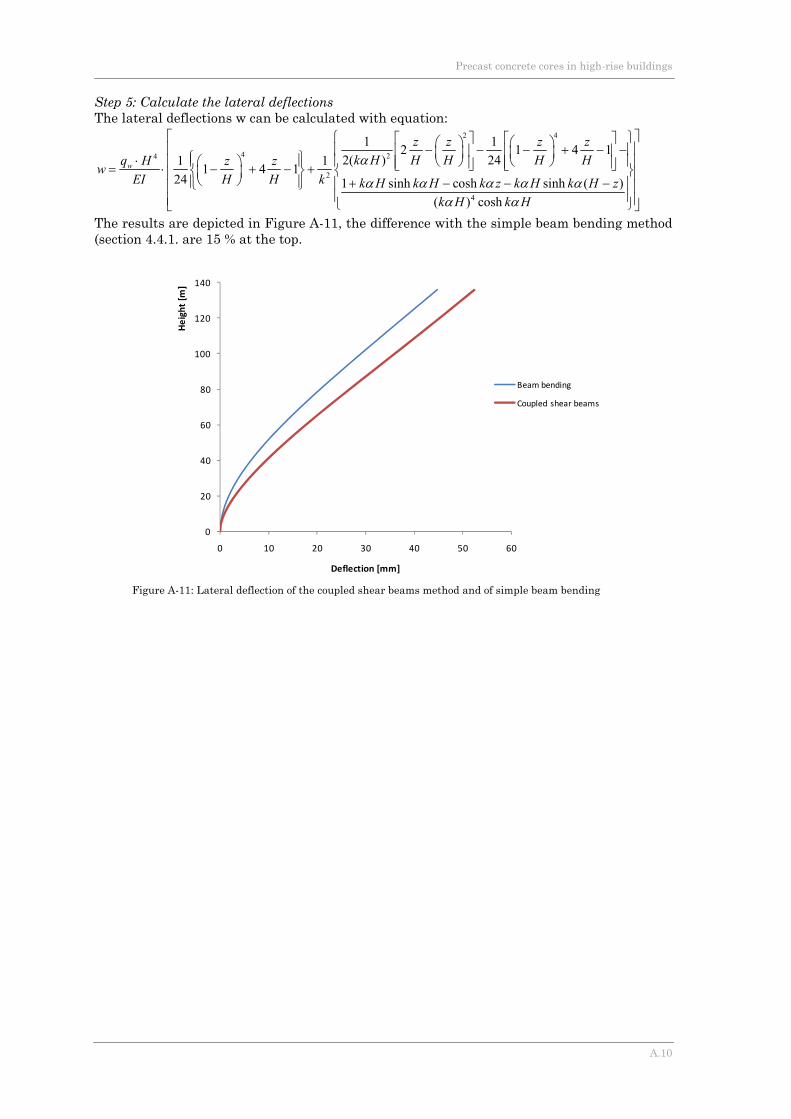
Precast concrete cores in high-rise buildings
A.10
Step 5: Calculate the lateral deflections The lateral deflections w can be calculated with equation:
2 4
4 24
2
4
1 12 1 4 12( ) 241 11 4 1
24 1 sinh cosh sinh ( )( ) cosh
w
z z z zk H H H H Hq H z zw
EI H H k k H k H k z k H k H zk H k H
α
α α α α αα α
⎡ ⎤⎧ ⎫⎡ ⎤ ⎡ ⎤⎛ ⎞ ⎛ ⎞⎢ ⎥− − − + − −⎪ ⎪⎢ ⎥ ⎢ ⎥⎜ ⎟ ⎜ ⎟⎧ ⎫⋅ ⎪ ⎪ ⎪ ⎪⎝ ⎠ ⎝ ⎠⎛ ⎞⎢ ⎥⎢ ⎥ ⎢ ⎥⎣ ⎦ ⎣ ⎦= ⋅ − + − +⎨ ⎬ ⎨ ⎬⎜ ⎟⎢ ⎥⎝ ⎠⎪ ⎪ + − − −⎪ ⎪⎩ ⎭⎢ ⎥⎪ ⎪⎢ ⎥⎩ ⎭⎣ ⎦
The results are depicted in Figure A-11, the difference with the simple beam bending method (section 4.4.1. are 15 % at the top.
0
20
40
60
80
100
120
140
0 10 20 30 40 50 60
Height [m
]
Deflection [mm]
Beam bending
Coupled shear beams
Figure A-11: Lateral deflection of the coupled shear beams method and of simple beam bending

Precast concrete cores in high-rise buildings
A.11
Appendix B: Local 2D model with two elements
This appendix describes a model of the corner connection with two precast elements. In Figure B-1 a uniform distributed load is applied on the model.
Figure B-1: Mechanical model with uniform distributed load Figure B-2: Example of integrating with rectangles
In Figure B-3 the vertical stress diagrams of the vertical supports are depicted. Since the prescribed deformation is applied along a line, it is not possible to obtain the shear force values with help of a monitoring point as in Chapter 7. In the model of Figure B-1 the shear force can be acquired by integrating the stress diagram of the contact between the two elements at ‘m’ along the area of the contact. The stress diagram shows a non linear distribution and besides that this distribution changes with every load step. The shear stress could be determined by integrating the stress distribution as the example of Figure B-2. This is labour-intensive and still a rough method to determine the shear force. Since this parameter is very important to determine the connection stiffness, this model is unfit. A model is required where at least one vertical load on a node is applied.
Figure B-3: Vertical stress diagrams of vertical supports of model 1a (values in N/mm2)
The only option to have one vertical load and still have a uniform distributed supported (as depicted at the top of the right precast element in Figure B-1) the only option is to use symmetry and apply a concentrated load at ‘m’ in Figure B-1.

Precast concrete cores in high-rise buildings
A.12
Appendix C: Shear resistance horizontal joint
General expression This appendix calculates the shear resistance of the horizontal joint used in Chapter 7. Determination of the shear resistance of the horizontal joint is more complicated as it is dependent of the normal stress in the joint. Since the normal stresses vary with the width and the height of the core, the shear resistance varies as well. Section 6.2.5 of Eurocode 2 provides a general expression to estimate the design shear resistance of the horizontal joint, as is elaborated in section 3.5.1. For an angle of 90 degrees between the joint and the reinforcement and no adhesive bond the expression is reduced to:
0,5Rdi n yd cdV f fμ σ μ ρ υ= ⋅ + ⋅ ⋅ ≤ ⋅ ⋅ (C.1) vRdj is the design shear resistance at the interface c and μ are factors which depend on the roughness of the interface (for very smooth
interfaces: c = 0.25 and μ = 0.5) σn is the stress per unit area caused by the minimum external normal force
across the interface that can act simultaneously with the shear force, positive for compression, such that σn < 0.6 fcd, and negative for tension. When σn is tensile, c fctd should be taken as 0.
ρ = As / Ai (area of reinforcement crossing the interface / area of the joint) fyd is the yield stress of the reinforcement, assumed 435 N/mm2
υ is a strength reduction factor 550.6 [1 ] 0.6 [1 ] 0.468250 250ckfυ = ⋅ − = ⋅ − = for C55/67
Shear resistance for the horizontal joint of Chapter 7 The horizontal joint in Chapter 7 has a length of 5 m and a width of 0.5, the area of the joint Ai is therefore 2.5 m2. The design compressive strength of the concrete /cd cc ck cf fα γ= , the coefficient αcc is 1.0 and the partial material factor γc is 1.5 according to the national annex of Eurocode 2. With fck is 55 N/mm2 for concrete quality of the precast element C55/67, fcd becomes 36.7 N/mm2. So the maximum shear resistance is: 20,5 0.5 0.468 36.7 8.58 /cdf N mmυ⋅ ⋅ = ⋅ ⋅ = . The only unknown variables in expression (C.1) are σn and ρ. For ρ the diameter of the protruding bar is required. Table C-1 gives values for the shear resistance of the horizontal joint for various bar diameters and various normal stresses.
Normal stress σn [N/mm2] Diameter bar [mm] 0 2 4 6 8 10 12 14 16 18
12 0.05 1.05 2.05 3.05 4.05 5.05 6.05 7.05 8.05 8.58 25 0.13 1.13 2.13 3.13 4.13 5.13 6.13 7.13 8.13 8.58 32 0.21 1.21 2.21 3.21 4.21 5.21 6.21 7.21 8.21 8.58
Table C-1: Italic values give the shear resistance of the horizontal joint due to 3 protruding bars with a given bar diameter and a given normal stress
In this table the difference influence of the bar diameter is very small, since ρ in expression (C.1) is very small compared to the contribution of nμ σ⋅ , the friction. So the amount of steel is small but sufficient as showed in the next section and the shear resistance is mainly determined by friction due to the high normal stress.

Precast concrete cores in high-rise buildings
A.13
Normal stress distribution In Appendix A.2.1 the normal stress at the base due to gravity loading is determined, resulting in a normal compressive stress along the base of 6.07 N/mm2. When the normal stress is examined for an individual precast element with a width of 5.4 meter, with help of Figure C-1 can be concluded that the normal stresses vary from 0 N/mm2 to 9 N/mm2. The average normal stress on the precast element is 4.5 N/mm2
Verification reinforcement The reinforcement in the horizontal joint needs to be designed to transfer the shear force due to the lateral wind load. With ; ; 39.6 /w eq modelq kN m= (section 0) the shear force at the base is:
; ; 39.6 136 5385w eq modelV q H kN= ⋅ = ⋅ = . It is assumed that only the core walls parallel to the wind direction. The maximum shear stress due to the wind load:
3
2max
3 3 5385 10 0.56 /2 2 2 14400 500V N mmA
τ ⋅ ⋅ ⋅= = =
⋅ ⋅ ⋅ ⋅ (C.2)
In Appendix A.2.1 the normal stress at the base due to gravity loading is determined as 6.07 N/mm2, which is the average normal stress at the base. According to Table C-1 the shear resistance with a normal stress of 6 N/mm2 and three protruding bars of 12 mm is 3.05 N/mm2, which is more than the shear stress of (C.2). In Figure C-1 the normal stress distribution at the base of the reference project is depicted. For a precast element with a width of 5.4 meter located at the windward side, the average stress is approximately 5 N/mm2. From Table C-1 can be concluded that for an individual element the shear resistance is sufficient.
-0,08
-10,07
-2,07
-12,07
-7,2 -5,4 -3,6 -1,8 0,0 1,8 3,6 5,4 7,2
normal stress [N/mm2̂]
z [m]
Figure C-1: Normal stress distribution of appendix A.2.4

Precast concrete cores in high-rise buildings
A.14
Appendix D: Results local Atena 2D models
The vertical and horizontal stresses for the studied corner connections are depicted in this appendix at the determinative analysis steps: just before Fr is reached (analysis step 4) and just before Fu is reached (analysis step 14) D.1. Interlocking halfway connection Vertical stress
Figure D-1: Analysis step 4, deformations 50 times magnified, colours indicate vertical stresses [N/mm2], black line indicates normal spring stress [N/mm2]

Precast concrete cores in high-rise buildings
A.15
Figure D-2: Analysis step 14, deformations 50 times magnified, colours indicate vertical stresses [N/mm2], black line indicates normal spring stress [N/mm2]
Horizontal stress
Figure D-3: Analysis step 4, deformations 50 times magnified, colours indicate horizontal stresses [N/mm2], yellow line indicates horizontal stresses at supports [N/mm2]
Figure D-4: Analysis step 14, deformations 50 times magnified, colours indicate horizontal stresses [N/mm2], yellow line indicates horizontal stresses at supports [N/mm2]

Precast concrete cores in high-rise buildings
A.16
D.2. Interlocking above ceiling connection Small key – vertical stress
Figure D-5: Analysis step 4, deformations 50 times magnified, colours indicate vertical stresses [N/mm2], black line indicates normal spring stress [N/mm2]
Figure D-6: Analysis step 14, deformations 50 times magnified, colours indicate vertical stresses [N/mm2], black line indicates normal spring stress [N/mm2]

Precast concrete cores in high-rise buildings
A.17
Small key - horizontal stress
Figure D-7: Analysis step 4, deformations 50 times magnified, colours indicate horizontal stresses [N/mm2], yellow line indicates horizontal stresses at supports [N/mm2]
Figure D-8: Analysis step 14, deformations 50 times magnified, colours indicate horizontal stresses [N/mm2], yellow line indicates horizontal stresses at supports [N/mm2]

Precast concrete cores in high-rise buildings
A.18
Large key – vertical stress
Figure D-9: Analysis step 6, deformations 50 times magnified, colours indicate vertical stresses [N/mm2], black line indicates normal spring stress [N/mm2]
Figure D-10: Analysis step 14, deformations 50 times magnified, colours indicate vertical stresses [N/mm2], black line indicates normal spring stress [N/mm2]

Precast concrete cores in high-rise buildings
A.19
Large key – horizontal stress
Figure D-11: Analysis step 6, deformations 50 times magnified, colours indicate horizontal stresses [N/mm2], yellow line indicates horizontal stresses at supports [N/mm2]
Figure D-12: Analysis step 14, deformations 50 times magnified, colours indicate horizontal stresses [N/mm2], yellow line indicates horizontal stresses at supports [N/mm2]

Precast concrete cores in high-rise buildings
A.20
D.3. Staggered connection Vertical stresses
Figure D-13: Analysis step 4, deformations 50 times magnified, colours indicate vertical stresses [N/mm2], black line indicates normal spring stress [N/mm2]
Figure D-14: Analysis step 10, deformations 50 times magnified, colours indicate vertical stresses [N/mm2], black line indicates normal spring stress [N/mm2]

Precast concrete cores in high-rise buildings
A.21
Horizontal stress
Figure D-15: Analysis step 4, deformations 50 times magnified, colours indicate horizontal stresses [N/mm2], yellow line indicates horizontal stresses at supports [N/mm2]
Figure D-16: Analysis step 10, deformations 50 times magnified, colours indicate horizontal stresses [N/mm2], yellow line indicates horizontal stresses at supports [N/mm2]

Precast concrete cores in high-rise buildings
A.22
Appendix E: Results global Atena 3D model

Precast concrete cores in high-rise buildings
A.23
Figure E-1: Stresses in z-direction, deformations 500 times magnified
Figure E-2: Zoomed in on the corner of the core shows the mutual vertical displacement due to the corner connection stiffness

Precast concrete cores in high-rise buildings
A.24
Appendix F: Input data Atena 2D model
This appendix is a text printout of the Atena 2D input of the local 2D model of the IHC. The input data for the IACC and SC only differ in joint topology. Input data General data Desc. :Local 2D model of corner connection Note : Num. of smeared reinf. layers :0 Analysis Type: 2D Materials Material n. 3 Name : Steel plates Type: CCPlaneStressElastIsotropic Elastic modulus E = 2.100E+05 [MPa] Poisson''s ratio sm = 0.300 [-] Specific material weight Rho = 2.300E-02 [MN/m3] Coefficient of thermal expansion Alpha = 1.200E-05 [1/K] Material n. 4 Name : SBeta Material Type: CCSBETAMaterial Elastic modulus E = 3.800E+04 [MPa] Poisson''s ratio sm = 0.200 [-] Tensile strength F_t = 4.200E+00 [MPa] Compressive strength F_c = -6.300E+01 [MPa] Type of tension softening : Exponential Specific fracture energy G_f = 9.898E-05 [MN/m] Crack model: Fixed Compressive strain at compressive strength in the uniaxial compressive test Eps_C = -2.805E-03 [-] Reduction of compressive strength due to cracks CompRed = 0.800 [-] Type of compression softening : Crush Band Critical compressive displacement Wd = -5.0000E-04 [m] Shear Retention Factor Variable Tension-compression interaction : Linear Specific material weight Rho = 2.300E-02 [MN/m3] Coefficient of thermal expansion Alpha = 1.200E-05 [1/K] Material n. 5 Name : Normal spring no tension Type: CCSpringMaterial Typ: Non-Linear Function: (-1.0000; -3.800E+04) (0.0000; 0.000E+00) Material n. 6 Name : Shear spring Type: CCSpringMaterial Typ: Elastic Initial stiffness K = 46.000 [MPa] Material n. 7 Name : Reinforcement Type: CCReinforcement Typ: BiLinear

Precast concrete cores in high-rise buildings
A.25
Elastic modulus E = 2.100E+05 [MPa] Sigma Y = 435.000 [MPa] Specific material weight RHO = 7.850E-02 [MN/m3] Coefficient of thermal expansion ALPHA = 1.200E-05 [1/K] Material n. 8 Name : Normal spring Type: CCSpringMaterial Typ: Elastic Initial stiffness K = 38000.000 [MPa] Joints Joint topology ----------------------------- Number Coordinates X [m] Y [m] ----------------------------- 1 5.1500 1.7000 2 5.5000 0.0000 3 5.5000 3.4000 4 5.1500 1.6500 5 5.0000 3.4000 6 10.4000 0.0000 7 10.4000 3.4000 8 5.3500 1.6500 9 5.2500 1.6500 10 5.3500 1.7000 11 5.5000 1.7000 12 5.0000 1.7000 Mesh refinement at joints No joint mesh refinement is specified Joint springs No joint springs are specified Line Line topology ---------------------------------------------------------------------------------- Number Segment Joints Center Radius Orient. Fictiv line Beg. End X [m] Y [m] R [m] [+/-] beg. [°] ---------------------------------------------------------------------------------- 1 Line 5 12 2 Line 12 1 3 Line 1 4 4 Line 1 10 5 Line 4 9 6 Line 9 8 7 Line 10 8 8 Line 5 3 9 Line 2 6 10 Line 6 7 11 Line 3 7 12 Line 10 11 13 Line 11 2 Mesh refinement. at lines ------------------------------------------------------ Number Input method Ext. and length Number line R [m] D [m] div. ------------------------------------------------------ 4 by length and ext. 1.7000 0.0500 Line contacts

Precast concrete cores in high-rise buildings
A.26
-------------------------------------------------------------- Number Connection type Material Thickness Method line [m] analysis -------------------------------------------------------------- 4 fixed Line springs --------------------------------------------------------------------------------------- Number Material Length Width Spring dir. Number Meth. line [m] [m2] Dir. typ X [m] Y [m] mel. anl. --------------------------------------------------------------------------------------- 9 Normal spri 1.0000 0.5000 Glob. Y- nln. 9 Shear sprin 0.0200 0.5000 Glob. X+ nln. 11 Normal spri 1.0000 0.5000 Glob. Y+ nln. 11 Shear sprin 0.0200 0.5000 Glob. X+ nln. Macro-elements Macro-element topology ------------------------------------------------------------------------------------ Number Material Thickness Line list [m] ------------------------------------------------------------------------------------ 1 Steel plates 0.5000 3, 4, 5, 6, 7 2 SBeta Material 0.5000 1, 2, 4, 8, 9, 10, 11, 12, 13 Mesh generation parameters ------------------------------------------------------------------------- Number Mesh type Elem. size Smoothing Quad type Method [m] Mesh elem. analysis ------------------------------------------------------------------------- 1 quadrilaterals 0.0500 yes CCIsoQuad nonlinear 2 quadrilaterals 0.2000 yes CCIsoQuad nonlinear Bar reinforcement Reinforcement top. --------------------------------------------------------------------------------------- Number Topology - segments [m] --------------------------------------------------------------------------------------- 1 Beg. (5.0500, 2.1500), Lin.to(5.0500, 1.7500), Lin.to(7.0500, 1.7500) Lin.to(7.0500, 2.1500) Reinforcement properties --------------------------------------------------------------------------------------- Number Segment Material Area External cable Meth. [m2] Act.anch Coeff.[-] C [MN/m] R [m] anl. --------------------------------------------------------------------------------------- 1 norm. Reinforceme 2.513E-03 nln. Load case 2 Properties Name: Vertical prescribed displacement Coefficient : 1.0000 [-]
Precast concrete cores in high-rise buildings
A.27
Code : Prescribed deformation Joint deformation -------------------------------------------------------------------------------- Join. Support and deformation Direction Axis X rotation numbe X [m] Y [m] X [m] Y [m] -------------------------------------------------------------------------------- 9 free fixed 3.000E-03 Global Line deformation No line deformations are prescribed Load case 3 Properties Name: Compressive prestress Coefficient : 1.0000 [-] Code : Forces Loading force in joint No joint loads are defined Line load -------------------------------------------------------------------------------------- Line Segment Load value Load location Direction Rotation numbe load [MN, MN/m] [MN, MN/m] A [m] D [m] X [m] Y [m] -------------------------------------------------------------------------------------- 11 Cons. -1.622E+01 Gl.proj.Y 8 Cons. -3.000E+00 Gl.proj.Y 2 Cons. 3.000E+00 Gl.proj.Y 12 Cons. 3.000E+00 Gl.proj.Y 5 Cons. 3.000E+00 Gl.proj.Y 6 Cons. 3.000E+00 Gl.proj.Y Analysis steps ------------------------------------------------------------------------------------ Number Parameters Coefficient Load case list [-] ------------------------------------------------------------------------------------ 1 Standart Newton 1.0000 3 2 Standart Newton 0.0250 2 3 Standart Newton 0.0250 2 4 Standart Newton 0.0250 2 5 Standart Newton 0.0250 2 6 Standart Newton 0.0250 2 7 Standart Newton 0.0250 2 8 Standart Newton 0.0250 2 9 Standart Newton 0.0250 2 10 Standart Newton 0.0250 2 11 Standart Newton 0.0250 2 12 Standart Newton 0.1000 2 13 Standart Newton 0.1000 2 14 Standart Newton 0.1000 2 15 Standart Newton 0.1000 2 16 Standart Newton 0.1000 2 17 Standart Newton 0.1000 2 18 Standart Newton 0.1000 2 19 Standart Newton 0.1000 2 20 Standart Newton 0.1000 2 21 Standart Newton 0.1000 2 22 Standart Newton 0.1000 2 23 Standart Newton 0.1000 2

Precast concrete cores in high-rise buildings
A.28
Solution Parameters Solution parametrs n.1 Name : Standart Newton-Raphson Method: Newton-Raphson Iteration Limit: 40 Displacement Error 0.010000 [-] Residual Error 0.010000 [-] Absolute Residual Error 0.010000 [-] Energy Error 0.000100 [-] Immediate Break Displacement Error Multiple 10000.0 [-] Break After Step Displacement Error Multiple 1000.0 [-] Immediate Break Residual Error Multiple 10000.0 [-] Break After Step Residual Error Multiple 1000.0 [-] Immediate Break Absolute Residual Error Multiple 10000.0 [-] Break After Step Absolute Residual Error Multiple 1000.0 [-] Immediate Break Energy Error Multiple 1000000.0 [-] Break After Step Energy Error Multiple 10000.0 [-] Optimize Band-Width: Sloan Line Search: On Line Search Type: Without Iterations Minimum Eta: 0.010 [-] Maximum Eta: 1.000 [-] Update Stiffness: Each Iteration Stiffness Type: Tangent Solution parametrs n.2 Name : Standart Arc Length Method: Arc-Length Arc-Length Method: Consistently Linearised Arc-Length Adjustment Method: Constant Load-Displacement Ratio 0.200 [-] Loading-Displacement Method: Bergan Constant Reference Number Of Iterations: 10 Step Length: Based on Current Load Step Arc-Length Location: All Nodes Iteration Limit: 40 Displacement Error 0.010000 [-] Residual Error 0.010000 [-] Absolute Residual Error 0.010000 [-] Energy Error 0.000100 [-] Immediate Break Displacement Error Multiple 10000.0 [-] Break After Step Displacement Error Multiple 1000.0 [-] Immediate Break Residual Error Multiple 10000.0 [-] Break After Step Residual Error Multiple 1000.0 [-] Immediate Break Absolute Residual Error Multiple 10000.0 [-] Break After Step Absolute Residual Error Multiple 1000.0 [-] Immediate Break Energy Error Multiple 1000000.0 [-] Break After Step Energy Error Multiple 10000.0 [-] Optimize Band-Width: Sloan Line Search: On Line Search Type: Without Iterations Minimum Eta: 0.010 [-] Maximum Eta: 1.000 [-] Update Stiffness: Each Iteration Stiffness Type: Tangent Solution parametrs n.3 Name : Solution Parameters Method: Newton-Raphson Iteration Limit: 40 Displacement Error 0.010000 [-] Residual Error 0.010000 [-] Absolute Residual Error 0.010000 [-] Energy Error 0.000100 [-] Immediate Break Displacement Error Multiple 10000.0 [-] Break After Step Displacement Error Multiple 1000.0 [-] Immediate Break Residual Error Multiple 10000.0 [-] Break After Step Residual Error Multiple 1000.0 [-]

Precast concrete cores in high-rise buildings
A.29
Immediate Break Absolute Residual Error Multiple 10000.0 [-] Break After Step Absolute Residual Error Multiple 1000.0 [-] Immediate Break Energy Error Multiple 1000000.0 [-] Break After Step Energy Error Multiple 10000.0 [-] Optimize Band-Width: Sloan Line Search: On Line Search Type: Without Iterations Minimum Eta: 0.010 [-] Maximum Eta: 1.000 [-] Update Stiffness: Each Iteration Stiffness Type: Tangent
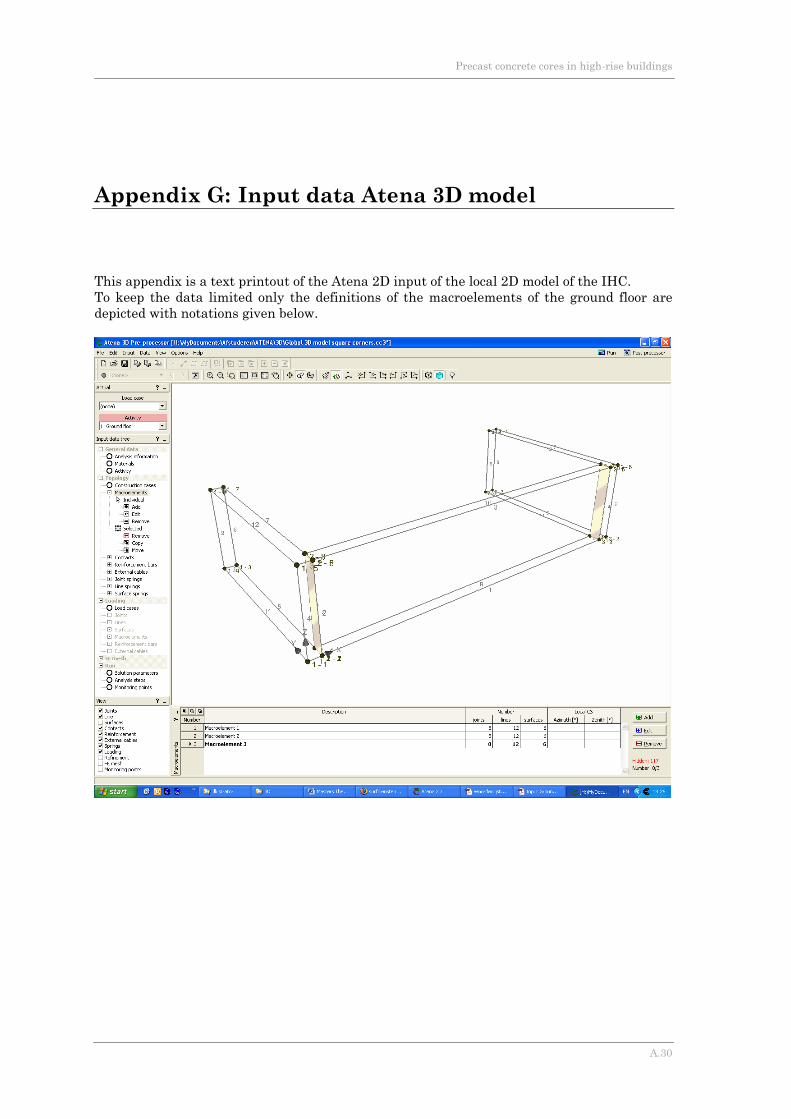
Precast concrete cores in high-rise buildings
A.30
Appendix G: Input data Atena 3D model
This appendix is a text printout of the Atena 2D input of the local 2D model of the IHC. To keep the data limited only the definitions of the macroelements of the ground floor are depicted with notations given below.

��������������
�� ����� ���� ������ �� ������� ������ �����
����� � �� � ����� �������� � �������� �� �� ! " � #�$%���� � %�&'��( ���) � ��������� ���*+
������ �� �������� ����������� ��������������� �� ������,'��� ����-&
�� ���' �.&��� �����
�������������(��������''� '����
���!� ����� � � ! � � � � �
�������� ���/��'�/���0'����� ��&'&� 0 ��1�+1���2� ���� � �3+,����4�� �������' ���(�� � ���!��+%�44����� 4 ������' �5���� � ��!6+
�� 0'����� 7������%%��0'���7�������8)��09�:�8����8:��0����8���0���
� � � ! � � � � "�������� ���
/��'�/�������' ���44��� 6 ���!��+/�(����' ���44��� 6�� ���!��+/���'� ����(�� ;� ��1�+%���� % ��1�+;����� ��44����� �3+������' ���44��� 4� &���&�����68�� ���!��+�����(����' ���44��� 4� &���&�����6��8�� ���!��+
�� 7���4���%%��7���4����8)��09�:�8�)�09�::8���09���8<��09���8���09���8���09��
�8���09��
��#�� $!�!�!�����#��!� !�!� � �
� �# � � ! � ! � ! � � � $ % � � � � ���&�� ' (�) � (�) * (�)
���:�=")
�8�����8�����8�����8�����8�����8�����8�����8����
�8�����8����"8:���"8:����8�����8����"8:���"8:���
�8�����8�����8�����8�����8:����8:����8:����8:���
� �+ � � ! � ! � ! � � � $ � � � ! ���&�� %���� �� �,� &�-. %���� �� �,� ��� ��&�� %���� �� �,� &�-. %���� �� �,� ���
���
��=
�=�
")<
"�:
=:)

��������������
�� ����� ���� ������ �� ������� ������ ����"
����� � �� � ����� �������� � �������� �� �� ! " � #�$%���� � %�&'��( ���) � ��������� ���*+
� �+ � � ! � ! � ! � � � $ � � � ! ���&�� %���� �� �,� &�-. %���� �� �,� ��� ��&�� %���� �� �,� &�-. %���� �� �,� ���
:�=
���
��"
������
):�
"�)
� �+ � � ! � ! � ! � � � $ � / � � � # ! ���&�� ���� �0 &������ �����
���:�=
��:�8��"=8)���:8<8������8�8)8���8"8��8��
� �# � � ! � ! � ! � � � $ � � � � ! � � � ! ����� �0 �� ��������� ��������1 �2���, 3 414451 2����, 3 41445#� /��� ��������� >�� ����� �������� ����� (6) ���� ����
?���� �� 0'����� 7������
��#��!� !�!� � "� �# � � ! � ! � ! � � " $ % � � � � �
��&�� ' (�) � (�) * (�)���:�=")
�8�����:8:����:8:����8�����8����
�:8:����:8:����8����
�8�����8�����8�����8�����8�����8�����8�����8����
�8�����8�����8�����8�����8:����8:����8:����8:���
� �+ � � ! � ! � ! � � " $ � � � ! ���&�� %���� �� �,� &�-. %���� �� �,� ��� ��&�� %���� �� �,� &�-. %���� �� �,� ���
���:�=
��=���
�=���"
")<������
"�:):�
=:)"�)
� �+ � � ! � ! � ! � � " $ � / � � � # ! ���&�� ���� �0 &������ �����
���:�=
��:�8��"=8)���:8<8������8�8)8���8"8��8��

��������������
�� ����� ���� ������ �� ������� ������ �����
����� � �� � ����� �������� � �������� �� �� ! " � #�$%���� � %�&'��( ���) � ��������� ���*+
� �# � � ! � ! � ! � � " $ � � � � ! � � � ! ����� �0 �� ��������� ��������1 �2���, 3 414451 2����, 3 41445#� /��� ��������� >�� ����� �������� ����� (6) ���� ����
?���� �� 0'����� 7������
��#��!� !�!� � �� �# � � ! � ! � ! � � � $ % � � � � �
��&�� ' (�) � (�) * (�)���:�=")
�:8:����:8<����:8<����:8:����:8:����:8<����:8<����:8:���
�8�����8����"8:���"8:����8�����8����"8:���"8:���
�8�����8�����8�����8�����8:����8:����8:����8:���
� �+ � � ! � ! � ! � � � $ � � � ! ���&�� %���� �� �,� &�-. %���� �� �,� ��� ��&�� %���� �� �,� &�-. %���� �� �,� ���
���:�=
��=���
�=���"
")<������
"�:):�
=:)"�)
� �+ � � ! � ! � ! � � � $ � / � � � # ! ���&�� ���� �0 &������ �����
���:�=
��:�8��"=8)���:8<8������8�8)8���8"8��8��
� �# � � ! � ! � ! � � � $ � � � � ! � � � ! ����� �0 �� ��������� ��������1 �2���, 3 414451 2����, 3 41445#� /��� ��������� >�� ����� �������� ����� (6) ���� ����
?���� �� 0'����� 7������
#����#��# � � � � # � � $ � � � � � � 7 �
��&�� �� ��������� � $ ���� �� ��������� " $ ��0� � ���0����� ��������
�!:�!:
�!��!�
�&�������&������
# � � � � # � � $ � � � � ! � � � ! �#� /��� #���� � ��������� >�� ����� �'���� � @�1 �� 7���4���

��������������
�� ����� ���� ������ �� ������� ������ ����8
����� � �� � ����� �������� � �������� �� �� ! " � #�$%���� � %�&'��( ���) � ��������� ���*+
# � � � � # � " $ � � � � ! � � � ! �#� /��� #���� � ��������� >�� ����� �'���� � @�1 �� 7���4���
���� #��!� $ � !� �!9� � � � # � � ! � � � �
��&�� ����� #��� #��00.(:)���
A�� '��,&����� � B% �@������ '��
;����,&�����;����
�8���
�8���
���/� ��� �����!�!��� � � / � � � � � � � �� ! � ! � � �
�������� ���/��'������7������ '��������'������ 0���-����&�' 0����C�'&�� -����&�' 0���0��(� 0���D�����*� C��������B�� ,�����B, /���B, C�'���� ���(� '����B, B�� ������ ������� '����B, ����&� 0��B, ��5��&� 0�� ����� ,��44���,��44��� /���7�������� ����'������ 0��� �&'���'��4��� ,��� ����'������ 0��� �&'���'�7�������� -����&�' 0��� �&'���'��4��� ,��� -����&�' 0��� �&'���'�7�������� �C�'&�� -����&�' 0��� �&'���'��4��� ,��� �C�'&�� -����&�' 0��� �&'���'�7�������� 0��(� 0��� �&'���'��4��� ,��� 0��(� 0��� �&'���'�
,������ �����-���������-���� #'�� ������$:��8�������8�������8�������8������,'�>��A��� ���������8)����8����8���0��� �������/�(�������8�����8������8�����8������8�����8��������8������8�
� � � / � � � � � � � �� ! � ! � � "�������� ���
/��'��������� B�(�� �������B ��E&����� �������B B�������'������ -�����B B�������'������ �������B -�4����� &�C�� 4 ����������B ,����B�(����B B����7������ '��������'������ 0���
,������ ��� B�(����� '�(�� #'�� ������$%������'� '��������%�����8���?��(� �������?���� �&���� '�� �����'' ���:��8������

��������������
�� ����� ���� ������ �� ������� ������ ����;
����� � �� � ����� �������� � �������� �� �� ! " � #�$%���� � %�&'��( ���) � ��������� ���*+
� � � / � � � � � � � �� ! � ! � � "�������� ���
-����&�' 0����C�'&�� -����&�' 0���0��(� 0���D�����*� C��������B�� ,�����B, /���B, C�'���� ���(� '����B, B�� ������ ������� '����B, ����&� 0��B, ��5��&� 0�� ����� ,��44���,��44��� /���7�������� ����'������ 0��� �&'���'��4��� ,��� ����'������ 0��� �&'���'�7�������� -����&�' 0��� �&'���'��4��� ,��� -����&�' 0��� �&'���'�7�������� �C�'&�� -����&�' 0��� �&'���'��4��� ,��� �C�'&�� -����&�' 0��� �&'���'�7�������� 0��(� 0��� �&'���'��4��� ,��� 0��(� 0��� �&'���'�
�8�������8�������8������,'�>��A��� ���������8)����8����8���0��� �������/�(�������8�����8������8�����8������8�����8��������8������8�
������ �� ��!����&�� ���� ���� �,��� ������� ���������� #��00� ���� (:)
� ��� #�$ %���&��� ���� � ,������ �����-���� �8���

��������������
�� ����� ���� ������ �� ������� ������
����� � �� � ����� �������� � �������� �� �� ! " � #�$%���� � %�&'��( ���) � ��������� ���*+
������ �� ���� ���� � � � � � � � �����
� � � � � � � � � ! � � � � ! � � � � � ���"�� �# ���� ��$� �� ����� ��%$%$��
����,'� (�&��,'� �����-���������������'�������
��)������������
� � � & � � � � � � ! � � � � ! � � � � � ����%$�� '��� %��$�%$ �
��'���� ����.'&�� �����/������� ���� ����� ����'�� ������(�0�����*� ������.����'�*� ������%&���� ����1��� �������
.1�12%�0�32�,�4 32�,5.,�4%6 1��-,�15��14271��-,�15/4,�2%104 /��1,52/5,�%65.1,/.30��.1����4� 8�.2%. �0��3 .1�1, ,3,�,�1 .1�1,��
� ! � � � � � � � � ! �� ��� (���)%' ������%���
��� 3�(�� 1������ 3�(�� 8��� .��� 3�(��.��� 3�(�� ��+4�9����� �'��:����� 3�(�� 0���������4�9����� �&�:�� 09 2�������3�� ����'������ 4��� ���!�+3�� ����'������ 4��� 0������������#9��;�;:�$ �9#9��;�;:�$ ��99�����
%42.<2,3��4%53,�-165 .,5/4,=20 .5.1,/53,�-16��)>>�)��4%53,�-165%0�.1��1����30��2�-5�2./3�%,�,�154�1205%0�.1��1�'' ���' �9�
� � � � � � � * � ! � � � � ��%�+ ��,��)�� �
%������ �%������ �%������ �%������ ?
);�?�,���);��",��"�;��),��"@;@�>,��>
� � � � � * � � & � � � � ! � � � � ! � � � � � ��$)��,��� '��� %��$�%$ �
���(���'���A� ����.���������B��:������.�&������ �&���C���.��9����'������(���
���;���,��@�@�����;���,D���